Embed Size (px)
Citation preview
Higher Education, Employment and Economic GrowthExploring the interactions
LMIP REPORT 52014

LMIP REPORT 52014
Higher Education, Employment and Economic GrowthExploring the interactions
Haroon Bhorat, Aalia Cassim and David TsengDevelopment Policy Research Unit, University of Cape Town
Published in 2014 by the Labour Market Intelligence Partnership (LMIP), a research consortium led by the Human Sciences Research Council (HSRC) and funded by the Department of Higher Education and Training
www.lmip.org.za
Designed, typeset and proofread by COMPRESS.dsl
www.compressdsl.com
LMIP Report 5 iii
CONTENTS
List of figures iv
List of tables v
Abbreviations and acronyms vi
Abstract vii
1. Introduction 1
2. Data and methodology 3
3. Education and the labour market: a descriptive overview 5
4. Microproductivity analysis 10
5. The relationship between education and pro-poor growth 17
6. Conclusion 26
References 27
Endnotes 29
iv Higher Education, Employment and Economic Growth
Figure 1: Long-run unemployment rate by education: 1995–2012 6
Figure 2: Employment skills mix (proportion) by occupation: 1995 9
Figure 3: Employment skills mix (proportion) by occupation: 2012Q1 9
Figure 4: Distribution of expenditure by education: 1995 and 2010 20
Figure 5: National GIC for per capita real income and expenditure: 1995–2010 23
Figure 6: Differential in mean percentile growth rate, degree and certificate versus no education: 1995–2010 24
Figure 7: Differential in mean percentile growth rate for Africans, degree and certificate versus no education: 1995–2010 25
Figure 8: Differential in mean percentile growth rate for whites, degree and certificate versus no education: 1995–2010 25
LIST OF FIGURES
LMIP Report 5 v
Table 1: Growth and change of shares in employment by sector: 1995 and 2012 7
Table 2: Simple output skills elasticity: 1995–2012 12
Table 3: Simple two-factor Cobb–Douglas production function model (OLS results): 1995–2012 13
Table 4: OLS with investment: 1995−2012 13
Table 5: Ordinary least square with educational cohort: 1995−2012 14
Table 6: First-stage O & P methodology with educational cohorts 15
Table 7: Poverty profiles in South Africa: upper poverty line 19
Table 8: Poverty reduction effect of degree-holders: 2010 19
Table 9: Growth incidence rates by education level of household head 24
LIST OF TABLES
vi Higher Education, Employment and Economic Growth
ABBREVIATIONS AND ACRONYMS
CPI consumer price index
DPRU Development Policy Research Unit
FET further education and training
GDP gross domestic product
GIC growth incidence curve
HSRC Human Sciences Research Council
IES Income and Expenditure Survey
LFS Labour Force Survey
LMIP Labour Market Intelligence Partnership
NCV National Certificate Vocational
OHS October Household Survey
OLS ordinary least squares
PALMS Post−apartheid Labour Market Series
PIES Post-apartheid Income and Expenditure Survey
QLFA Quarterly Labour Force Survey
SARB South African Reserve Bank
SIC Standard Industrial Classification
StatsSA Statistics South Africa
TFP total factor productivity
LMIP Report 5 vii
ABSTRACT
The purpose of this report is to interrogate the impact and nature of South Africa’s post-apartheid economic growth performance through the lens of human-capital investment with a particular emphasis on higher education. The neoclassical theory of endogenous growth suggests that education has a profound impact on an economy’s growth trajectory that may result in a derived labour-demand appetite for skilled labour. This pattern, in turn, becomes crucial in defining and characterising the returns to households and their members on the basis of their human−capital attributes. Understanding the relationship and impact between education and growth at both levels is thus a vital lesson for making informed policy decisions about growth and welfare distribution.
In this report, we investigate the link between education and economic growth in three ways. Firstly, this report examines the labour market trends, including occupational demand by education
cohort. Secondly, we analyse the extent to which the educational attainments of labour cohorts affect the nature and trajectory of post-apartheid economic growth in South Africa by estimating Olley and Pakes’s two-stage regression on a modified Cobb-Douglas production education function. Thirdly, we attempt to understand the welfare gains by education cohort. We plot growth incidence curves (GICs) by educational cohort to identify the impact of economic growth on households with, and without, education. The results of this analysis show that the degree cohort contributes to economic growth and also shares in economic growth gains with steady employment demand. In contrast, other higher-education institutions, including further education and training (FET) colleges and other institutions, do not productively contribute to economic growth. Further, FET graduates are almost as likely to be employed along with school leavers without higher education. In turn, welfare gains for this cohort, and particularly the poorer among this group, are marginal.

LMIP Report 5 1
1. INTRODUCTION
Education has long been viewed as a determinant of long-term economic growth and well-being. Barro (1991; 1997) and Mankiw, Romer and Weil (1992) compiled a vast literature of cross-country growth regression and found a significant, positive association between the processes of human−capital accumulation and skills development represented by quantitative measures of education, development and economic growth (see also Temple 2001; Krueger & Lindahl 2001; Sianesi & Van Reenen 2003). The best example of the robustness of this positive association between education and economic growth is found in Sala-i-Martin, Doppelhofer and Miller (2004) where they estimated that schooling is the most significant factor impacting on growth in gross domestic product (GDP) per capita.1 Theoretical-growth literature emphasises three channels through which education can impact on economic growth. Firstly, education increases the human capital inherent in the labour force, increasing labour productivity and thereby engendering transitional growth toward a higher equilibrium level of output (Mankiw et al. 1992). Secondly, education adds to the innovative capacity of technology to produce new products and processes, and therefore growth (Lucas 1988; Romer 1990; Aghion & Howitt 1998). In addition, it changes the nature of job skills demanded, and therefore the labour market growth trajectory (Brynjolffson & McAfee 2014). Thirdly, education can facilitate the diffusion and transmission of information needed to understand and process new ideas and to successfully implement new technologies devised by others (Nelson & Phelps 1966; Benhabib & Spiegel 1994).
Since the 1970s, South Africa’s experience has been similar to that of other developing countries with a steady increase in aggregate output, driven by an increasing stock of labour and/or capital and rising productivity levels through technological change, including labour efficiency and skills. Prior to the advent of democracy, the South African economy had entered the process of economic transformation, manifested in part by the intensification of capital use in its production processes By the post-apartheid period, the lifting of economic sanctions and the adoption of liberal trade policies, accompanied by the growing need on the part of occupations and sectors for higher levels of skills, ushered in a new age of growth and development. The post-apartheid South African economy has been characterised perhaps most powerfully by one of its longest growth periods in its economic history, with 69 periods of quarterly real GDP growth, although there were four brief quarterly recessions due to external shocks. The total average annualised quarterly growth rate was 3.2% per annum, and, while employment increased, it was disproportionately in favour of workers who were more educated and more skilled.
The legacy of apartheid has, however, left the South African economy with high levels of poverty, persistent inequality, and unemployment such that the gains from economic growth have been uneven. Although there has been an expansion in aggregate employment, the bulk of this improvement has been reserved for people with higher levels of education, as the labour force consists of a large contingent of less-educated, new labour market entrants with
2 Higher Education, Employment and Economic Growth
minimal levels of skills and experience for work. This classic skills-mismatch problem between labour demand and labour supply, and between education and economic growth, has not only inadvertently determined the demand for, and productivity of, labour in the economy, but has also defined and characterised the returns to households and individuals on the basis of their human−capital attributes. One of the key issues within the economic policy terrain in post-apartheid South Africa has thus been to investigate the impact of economic growth on social-welfare outcomes. Alternatively, the extent of individuals’ educational attainment affects the distribution of people’s welfare gains. In essence, the objectives of this report are, firstly, to examine labour market outcomes by education cohort;, secondly, to consider the contribution of the education cohort to economic growth; and, thirdly, to investigate the welfare gains by education cohort.
This report is structured as follows: Section 2 describes the datasets used in the study. Section 3
presents a descriptive overview of the relationship between education and labour demand. This includes an examination of the link between education and occupational employment growth trends. In Section 4, we consider, through the use of a modified Cobb-Douglas production function and Olley and Pakes’s estimation strategy, the output labour elasticity of each educational cohort in the post-apartheid economy. In essence, we are measuring whether skilled or educated workers have a strong associative relationship with the growth of the South African economy. Section 5 of the report examines the reverse view of this education-growth relationship and considers how the post-apartheid growth dividend has been distributed. Differently put, we utilise the growth incidence curves (GICs)2 commonly used in the pro-poor growth literature to estimate growth in per capita expenditure across the percentile-defined distribution for households according to the education level of the household head. From this, we can measure to what extent growth was inclusive. Finally, Section 6 concludes the study.
LMIP Report 5 3
2. DATA AND METHODOLOGY
South Africa has a wealth of nationally representative surveys available for public research use that date back to the mid-1990s. At the core of this statistical and informational repository are a series of independently sampled, cross-sectional household surveys specifically designed to capture personal information and characteristics, as well as activities and positions in the labour market, of each household member.
The first of these surveys was the annual October Household Survey (OHS), conducted in the 1990s, which has been extensively utilised by local as well as international scholars alike to provide the first glimpse of the South African labour market composition in the post-apartheid era. This later gave way to the Labour Force Surveys (LFSs), carried out biannually between the years 2000 and 2007. In 2008, the frequency of collecting labour market−related data was augmented again to every quarter; hence the Quarterly Labour Force Survey (QLFS) was born to replace the existing LFS. Owing to the design and structural similarities between these surveys and the high rates of usage by researchers in providing crucial labour market information, a combined dataset of these surveys was constructed by DataFirst at the University of Cape Town under the data project umbrella called the Post-apartheid Labour Market Series (PALMS). This dataset, expanding over 17 years (1995–2012), combines most of the similar labour market survey datasets into a single, serial statistical data source. For the convenience of the users, substantial adjustments have been made. For instance: deriving consistent variable definitions across the surveys (Kerr & Lam 2012); and adjusting sampling weights and stable serial population estimates over time
(Branson & Wittenberg 2014). Although these strictly independent surveys still fall far short of a long-running national panel data, together they allow valuable insights into the sampled groups of individuals, their labour market activities, and their personal characteristics.
Alongside these labour market surveys, South Africa also collects detailed information about the income and expenditure patterns of its population by means of household surveys called the Income and Expenditure Surveys (IESs). The purpose of the IESs is to provide/update the weights of the baskets of goods and services used for calculating the consumer price index (CPI). The survey is conducted five times a yearevery five years. Although the IES also contains general information about household characteristics and activities unique to its purpose, it collects profound details on income and expenditure, therefore making it suitable for measuring the consumption and income behaviours of households and their welfare. Recognising the resourcefulness of this survey data, the Development Policy Research Unit (also at the University of Cape Town) has constructed the combined serial dataset called the Post-apartheid Income and Expenditure Survey (PIES). Prudent adjustments have been made to the sampling weights in the PIES to try to create a serially consistent population estimate, ensuring that expenditure item definitions are matched to ensure comparability of both the income and the expenditure items across surveys (DPRU forthcoming). We also imported education variables from the IESs’ labour market counterpart datasets, the OHS 1995 and LFS 2000, to allow for a welfare analysis of the educational cohorts.
4 Higher Education, Employment and Economic Growth
For the purpose of this study, we used both the PALMS and the PIES to explore the linkages between education and economic growth. To examine the labour market outcomes by educational cohort, we use PALMS. This provides a descriptive overview of unemployment and the sectoral-education mix employed in the economy. For the microproductivity analysis of labour inputs, we take advantage of the PALMS’ serial projections on the population sizes of individuals employed in the economy, the labour force, the working age, and the population by education. We also aligned these labour market series with the data for output (or GDP) measured by value added at constant 2005 prices and the financial data of investment and capital stock for Statistics SA (StatsSA) and the South African Reserve Bank (SARB). In total, there were 39 serial observations aligned according to the
times of the surveys between 1995 and 2012 for the microproductivity analysis of effective labour inputs.
To investigate the impact of education on the distribution of the welfare dividend in the post-apartheid era – the third key objective of our study – we used the PIES for analysing the welfare shifts and the distribution of growth in respect of welfare for households by educational attainments of the household heads. We used total expenditure adjusted for price inflation as our proxy measure for real welfare of the households, thereby exploring the general welfare and the impact of distribution of growth on households’ well-being or expenditure. This includes presenting a poverty profile of the households by educational attainment of the household heads to understand education as a determinant of the distribution of growth incidence.
LMIP Report 5 5
3. EDUCATION AND THE LABOUR MARKET: A DESCRIPTIVE OVERVIEW
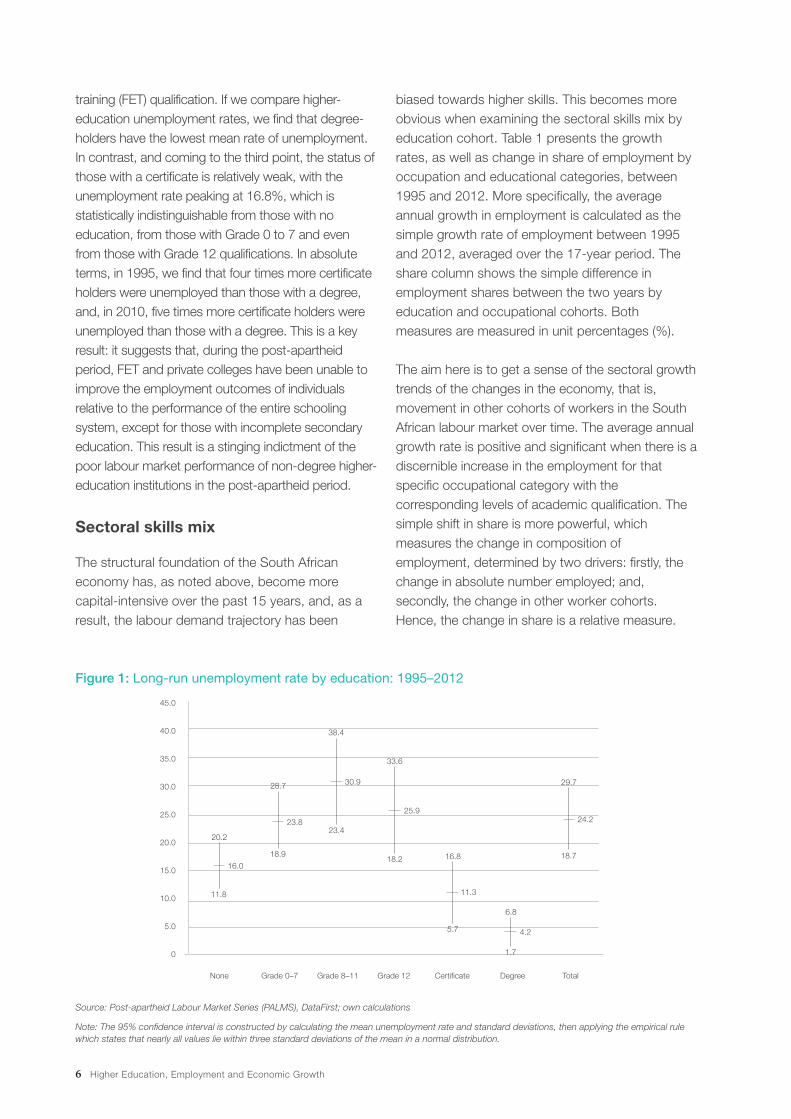
The aim of this section is to provide a descriptive overview of the changes in composition of South Africa’s labour market with respect to education between 1995 and 2012. Essentially, this analysis will provide a nuanced picture of the impact and role that each education cohort plays within the labour market. Importantly, the responsiveness of the labour market to each education cohort will provide an insight into the persistently high levels of unemployment in South Africa over the past 17 years. Figure 1 presents the long-term average unemployment rate with the 95% confidence intervals for the periods between 1995 and 2012 by educational cohort. The national long-term average unemployment rate in South Africa for the period under review is 24.2% (with the 95% confidence interval between 18.7 and 29.7), suggesting a systematic adverse labour market environment for jobseekers in the country. However, the figure shows that imbedded in this aggregate unemployment measure are diverse ranges of long-term unemployment rates strongly associated with the educational attainments of individuals. More specifically, labour demand is greater among those who are highly educated, with the long-term unemployment rate for degree-holders at only 4.2%. This is nearly eight times lower than the mean unemployment rate for individuals with only Grade 8–11 schooling, at 30.9%. Certificate (and diploma) holders3 are at 11.3%, slightly higher than the degree-holders and statistically insignificant in terms of difference from the next group’s unemployment rate: those with no education at the 16.0% mean. Unemployment rates for those that have completed Grade 12 and for Grades 0 to 7 are 25.9% and 23.8% respectively. Clearly, the South African labour
market is systematically oversupplied with those that have relatively low levels of education.
The responsiveness of the labour market to certain education levels poses a number of key issues. Firstly, unemployment with regard to those with only a high-school education is significant, as they make up the bulk of the unemployed population. The long-term mean unemployment rate for the Grade 8 to 11 cohort is 30.9%, while those who have qualified with a matric or Grade 12 also show a significant level of unemployment at a mean of 25.9%. There are two aspects that may explain the high levels of unemployment observed. Firstly, high-school enrolment over the past 20 years has meant that more young people are entering the labour force and that the labour market is unable to absorb the sheer numbers. Secondly, to some extent, the quality of school-leavers’ education has not afforded them vast employment opportunities. In terms of schooling, research shows that poorer children enter school with a ‘cognitive disadvantage’, because they have not had access to the resources and stimulation that well-off children enjoy (Van der Berg, Burger, Burger, De Vos, Du Rand, Gustafsson, Shepherd, Spaull, Taylor, Van Broekhuizen & Von Fintel 2011:7). It is further apparent that schools designed for African learners (i.e. the majority of school learners) have been underperforming. One of the factors, in particular, that has impacted on school outcomes is language, as schooling is not provided in the mother tongue. That could very well be a factor that hampers progress in higher-education institutions too. Secondly, the growth of the labour market has favoured the more qualified workers, and particularly those with tertiary education as opposed to those with a further education and
6 Higher Education, Employment and Economic Growth
Figure 1: Long-run unemployment rate by education: 1995–2012
Source: Post-apartheid Labour Market Series (PALMS), DataFirst; own calculations
Note: The 95% confidence interval is constructed by calculating the mean unemployment rate and standard deviations, then applying the empirical rule which states that nearly all values lie within three standard deviations of the mean in a normal distribution.
45.0
40.0
35.0
30.0
25.0
20.0
15.0
10.0
5.0
0
None TotalDegreeCertificateGrade 12Grade 0–7 Grade 8–11
38.4
20.2
11.8
28.7
18.9
16.0
23.8
4.2
24.2
11.3
25.9
30.9
23.4
33.6
18.2 16.8
5.7
29.7
18.7
6.8
1.7
training (FET) qualification. If we compare higher-education unemployment rates, we find that degree-holders have the lowest mean rate of unemployment. In contrast, and coming to the third point, the status of those with a certificate is relatively weak, with the unemployment rate peaking at 16.8%, which is statistically indistinguishable from those with no education, from those with Grade 0 to 7 and even from those with Grade 12 qualifications. In absolute terms, in 1995, we find that four times more certificate holders were unemployed than those with a degree, and, in 2010, five times more certificate holders were unemployed than those with a degree. This is a key result: it suggests that, during the post-apartheid period, FET and private colleges have been unable to improve the employment outcomes of individuals relative to the performance of the entire schooling system, except for those with incomplete secondary education. This result is a stinging indictment of the poor labour market performance of non-degree higher-education institutions in the post-apartheid period.
Sectoral skills mix
The structural foundation of the South African economy has, as noted above, become more capital-intensive over the past 15 years, and, as a result, the labour demand trajectory has been
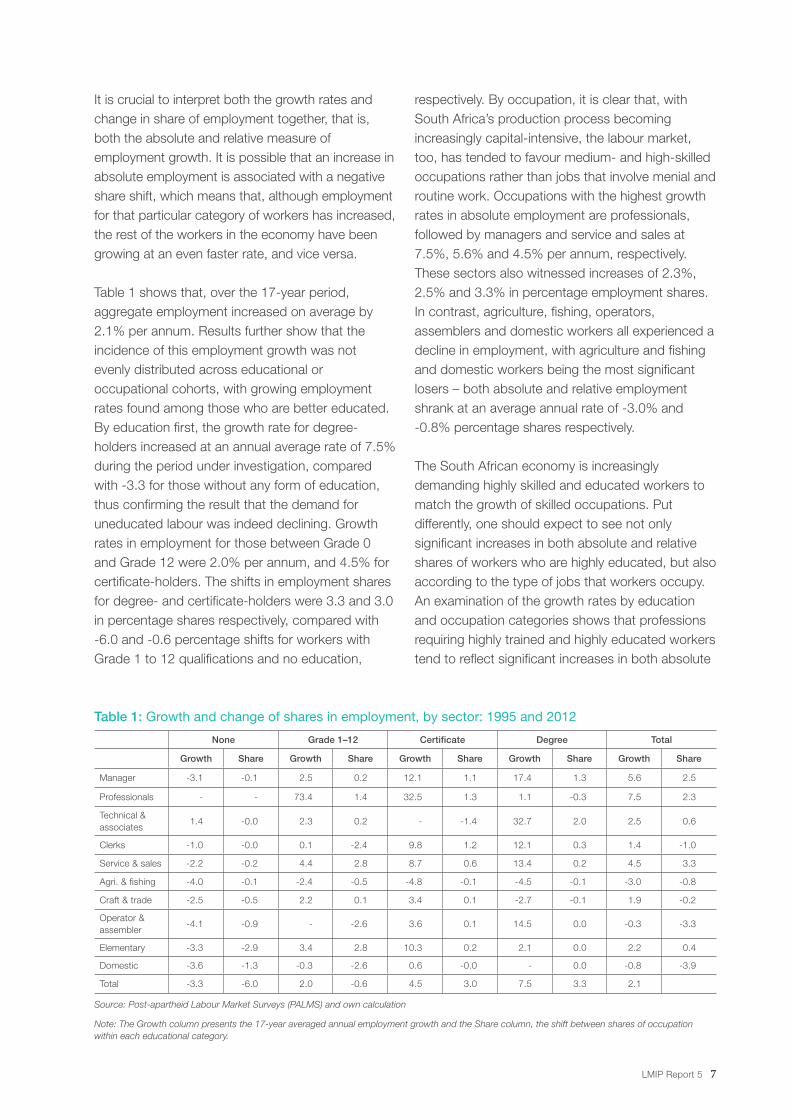
biased towards higher skills. This becomes more obvious when examining the sectoral skills mix by education cohort. Table 1 presents the growth rates, as well as change in share of employment by occupation and educational categories, between 1995 and 2012. More specifically, the average annual growth in employment is calculated as the simple growth rate of employment between 1995 and 2012, averaged over the 17-year period. The share column shows the simple difference in employment shares between the two years by education and occupational cohorts. Both measures are measured in unit percentages (%).
The aim here is to get a sense of the sectoral growth trends of the changes in the economy, that is, movement in other cohorts of workers in the South African labour market over time. The average annual growth rate is positive and significant when there is a discernible increase in the employment for that specific occupational category with the corresponding levels of academic qualification. The simple shift in share is more powerful, which measures the change in composition of employment, determined by two drivers: firstly, the change in absolute number employed; and, secondly, the change in other worker cohorts. Hence, the change in share is a relative measure.
LMIP Report 5 7
It is crucial to interpret both the growth rates and change in share of employment together, that is, both the absolute and relative measure of employment growth. It is possible that an increase in absolute employment is associated with a negative share shift, which means that, although employment for that particular category of workers has increased, the rest of the workers in the economy have been growing at an even faster rate, and vice versa.
Table 1 shows that, over the 17-year period, aggregate employment increased on average by 2.1% per annum. Results further show that the incidence of this employment growth was not evenly distributed across educational or occupational cohorts, with growing employment rates found among those who are better educated. By education first, the growth rate for degree-holders increased at an annual average rate of 7.5% during the period under investigation, compared with -3.3 for those without any form of education, thus confirming the result that the demand for uneducated labour was indeed declining. Growth rates in employment for those between Grade 0 and Grade 12 were 2.0% per annum, and 4.5% for certificate-holders. The shifts in employment shares for degree- and certificate-holders were 3.3 and 3.0 in percentage shares respectively, compared with -6.0 and -0.6 percentage shifts for workers with Grade 1 to 12 qualifications and no education,
respectively. By occupation, it is clear that, with South Africa’s production process becoming increasingly capital-intensive, the labour market, too, has tended to favour medium- and high-skilled occupations rather than jobs that involve menial and routine work. Occupations with the highest growth rates in absolute employment are professionals, followed by managers and service and sales at 7.5%, 5.6% and 4.5% per annum, respectively. These sectors also witnessed increases of 2.3%, 2.5% and 3.3% in percentage employment shares. In contrast, agriculture, fishing, operators, assemblers and domestic workers all experienced a decline in employment, with agriculture and fishing and domestic workers being the most significant losers – both absolute and relative employment shrank at an average annual rate of -3.0% and -0.8% percentage shares respectively.
The South African economy is increasingly demanding highly skilled and educated workers to match the growth of skilled occupations. Put differently, one should expect to see not only significant increases in both absolute and relative shares of workers who are highly educated, but also according to the type of jobs that workers occupy. An examination of the growth rates by education and occupation categories shows that professions requiring highly trained and highly educated workers tend to reflect significant increases in both absolute
Table 1: Growth and change of shares in employment, by sector: 1995 and 2012
None Grade 1–12 Certificate Degree Total
Growth Share Growth Share Growth Share Growth Share Growth Share
Manager -3.1 -0.1 2.5 0.2 12.1 1.1 17.4 1.3 5.6 2.5
Professionals - - 73.4 1.4 32.5 1.3 1.1 -0.3 7.5 2.3
Technical & associates
1.4 -0.0 2.3 0.2 - -1.4 32.7 2.0 2.5 0.6
Clerks -1.0 -0.0 0.1 -2.4 9.8 1.2 12.1 0.3 1.4 -1.0
Service & sales -2.2 -0.2 4.4 2.8 8.7 0.6 13.4 0.2 4.5 3.3
Agri. & fishing -4.0 -0.1 -2.4 -0.5 -4.8 -0.1 -4.5 -0.1 -3.0 -0.8
Craft & trade -2.5 -0.5 2.2 0.1 3.4 0.1 -2.7 -0.1 1.9 -0.2
Operator & assembler
-4.1 -0.9 - -2.6 3.6 0.1 14.5 0.0 -0.3 -3.3
Elementary -3.3 -2.9 3.4 2.8 10.3 0.2 2.1 0.0 2.2 0.4
Domestic -3.6 -1.3 -0.3 -2.6 0.6 -0.0 - 0.0 -0.8 -3.9
Total -3.3 -6.0 2.0 -0.6 4.5 3.0 7.5 3.3 2.1
Source: Post-apartheid Labour Market Surveys (PALMS) and own calculation
Note: The Growth column presents the 17-year averaged annual employment growth and the Share column, the shift between shares of occupation within each educational category.
8 Higher Education, Employment and Economic Growth
number and shares. Table 1 shows that managers, technical and associates, clerks and workers in service and sales, that is, basically jobs that are generally filled by educated workers, tend to reflect significant increases in both number of employed workers as well as in shares in the economy. Among managers and degree-holders in particular, there was a significant gain in employment and in shares compared with those with lower levels of educational attainment, growing at 17.4% per annum and 1.3 percentage change in shares. Certificate-holders grew at a much slower rate at 12.1%, gaining 1.1% of the employment shares, with Grade 1 to 12 at 2.5% and only a 0.2 gain in shares. This signifies that not only does education play an important role in terms of employment (as long-term unemployment rate suggest earlier), but also in gaining employment growth and employment shares in the workplace. Simply put, in some specific occupational categories, those with higher qualifications tend to be favoured relative to workers without education employed for the same jobs.
While we see a defined increase in skilled occupations for degree-holders, the result for certificate-holders is less obvious and is concentrated across medium- and high-skilled occupations. Certificate-holders showed high growth in the professional4 occupational category, with 32.5% annual growth in employment as well as 10.8% growth in the elementary category. The declining share of the technical occupational category for certificate-holders was brought about by a transfer of employment into the manager and professional category, but also for clerks, services and sales, as well as marginal increases in the lower-skilled occupations. In absolute terms, however, the largest employers of certificate-holders are in the technical and associates category, followed by clerks. While growth of the technical category is fairly healthy at 2.5%, the nature of employment demand is such that traditionally ‘technical’ jobs are being done by those who are more qualified. Evidence of this is the stark growth of 32.7% among degree-holders working in technical jobs, while the certificate cohort exhibited no growth in this category, which could suggest that graduates from the FET system are not adequately trained in this area and are being replaced by degree-holders.
There is also some sense that employment growth in the technical category is not fast enough to take up the number of graduates who have come out of these institutions. It should be noted that, despite the 2.5% growth in employment, unemployment among this cohort remains high.
Another piece of evidence that demonstrates the skills bias is the fact that, even for occupations that are generally considered to be low-skilled and that do not necessarily require formal education, we see workers with formal education replacing those with no education. More specifically, craft and trade and elementary jobs are increasingly taken up by workers with at least some formal education and above (even certificate), clearly replacing those who obviously were working in the same occupations with no education. Results show that the employment opportunities for workers with no education are extremely limited and declining. During the period under examination, employment for individuals with no education, working in craft and trade, operator and assembler, elementary and domestic occupations, shrank significantly at averaged annual growth rates of -2.5, -4.1, -3.3 and -3.6 respectively. The employment shares for low-skilled occupations also declined, further lessening the employment opportunities for those with no formal education.
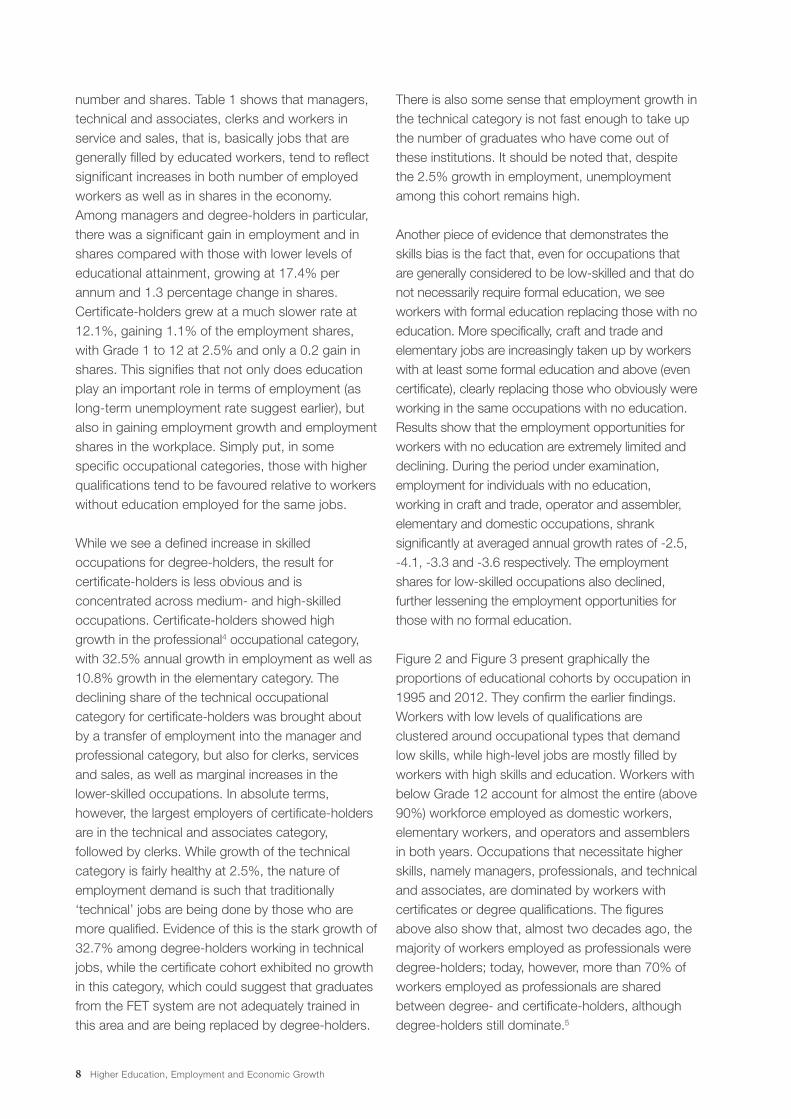
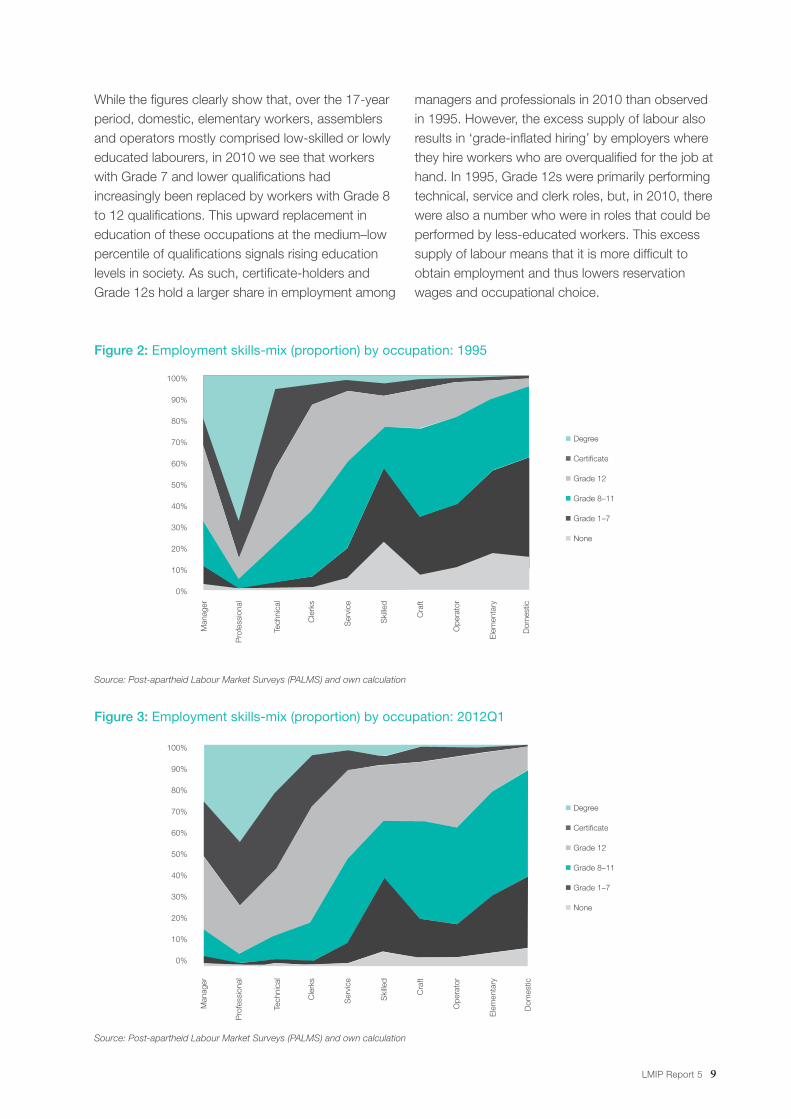
Figure 2 and Figure 3 present graphically the proportions of educational cohorts by occupation in 1995 and 2012. They confirm the earlier findings. Workers with low levels of qualifications are clustered around occupational types that demand low skills, while high-level jobs are mostly filled by workers with high skills and education. Workers with below Grade 12 account for almost the entire (above 90%) workforce employed as domestic workers, elementary workers, and operators and assemblers in both years. Occupations that necessitate higher skills, namely managers, professionals, and technical and associates, are dominated by workers with certificates or degree qualifications. The figures above also show that, almost two decades ago, the majority of workers employed as professionals were degree-holders; today, however, more than 70% of workers employed as professionals are shared between degree- and certificate-holders, although degree-holders still dominate.5
LMIP Report 5 9
Figure 2: Employment skills-mix (proportion) by occupation: 1995
Source: Post-apartheid Labour Market Surveys (PALMS) and own calculation
100%
90%
80%
70%
60%
50%
40%
30%
20%
10%
0%
Man
ager
Pro
fess
iona
l
Tech
nica
l
Dom
estic
Ele
men
tary
Ope
rato
r
Cra
ft
Ski
lled
Ser
vice
Cle
rks
n Degree
n Certificate
n Grade 12
n Grade 8–11
n Grade 1–7
n None
While the figures clearly show that, over the 17-year period, domestic, elementary workers, assemblers and operators mostly comprised low-skilled or lowly educated labourers, in 2010 we see that workers with Grade 7 and lower qualifications had increasingly been replaced by workers with Grade 8 to 12 qualifications. This upward replacement in education of these occupations at the medium–low percentile of qualifications signals rising education levels in society. As such, certificate-holders and Grade 12s hold a larger share in employment among
managers and professionals in 2010 than observed in 1995. However, the excess supply of labour also results in ‘grade-inflated hiring’ by employers where they hire workers who are overqualified for the job at hand. In 1995, Grade 12s were primarily performing technical, service and clerk roles, but, in 2010, there were also a number who were in roles that could be performed by less-educated workers. This excess supply of labour means that it is more difficult to obtain employment and thus lowers reservation wages and occupational choice.
Figure 3: Employment skills-mix (proportion) by occupation: 2012Q1
Source: Post-apartheid Labour Market Surveys (PALMS) and own calculation
100%
90%
80%
70%
60%
50%
40%
30%
20%
10%
0%
Man
ager
Pro
fess
iona
l
Tech
nica
l
Dom
estic
Ele
men
tary
Ope
rato
r
Cra
ft
Ski
lled
Ser
vice
Cle
rks
n Degree
n Certificate
n Grade 12
n Grade 8–11
n Grade 1–7
n None
10 Higher Education, Employment and Economic Growth
The approach adopted thus far in the investigation of the impact of education on growth has largely been descriptive in nature. For this section, we take a different approach by attempting to examine the impact of education through the analysis of labour productivity. Basic labour economics suggests that, in an efficient market, long-term returns on factor inputs should be a function of the factor’s marginal product and its imbedded productivity. The same is true in reverse: the productivity of labour implies something about the returns and therefore the impact of these returns on education. Therefore, it is crucial to attempt to understand the marginal contribution of labour input and its productivity in affecting the growth process as a result of the workers’ educational qualifications. Ultimately, according to theory, the marginal contribution and productivity of labour, assuming efficient markets, should influence the impact of economic growth dividend on workers’ households and their welfare.
Simple elasticity of output in respect of labour
A simple approach to investigating the marginal product and productivity of labour is to measure the responsiveness and sensitivity of growth on the change in labour by educational category. This is achieved by calculating the simple output-employment elasticity. More specifically, it is the percentage change in output (Y) over the percentage change in labour input (L) within an educational category:
A positive ratio suggests that a 1% increase in employment is associated with a positive change in output by the magnitude of the ratio. A greater unit of elasticity is associated with a higher rate of output for each unit of labour, and therefore the more productive the impact of the associated level of education. If the ratio is less than one, then a given percentage change in labour is associated with less than one unit change in output. The term ‘inelastic’ is used to describe the lack of responsiveness in output with the labour provided. This simple measure should give us a sense of how much each educational category of labour is implicitly contributing to growth. In this way, the most productive categories of educated labourers in the economy could be identified. It should also be highlighted that the output labour elasticity measure could also be inversed into labour output elasticity, which measures the responsiveness of employment change over the output change. This measure is often used to investigate the impact of growth on employment and so provide a sense of the rate of economic growth required in order to bring about a targeted growth rate in employment as projections. Indeed, the higher the ratio for productivity elasticity (output growth over labour growth), the lower the ratio for its invert: labour output elasticity.
In Table 2, the median simple output labour elasticities for all four categories of labour, namely employment, labour force, working age and population, over the educational cohorts, are presented. For this analysis, we use four definitions of ‘labour’, given that the actual definition of labour is ambiguous. At the micro-firm level, labour could
4. MICRO-PRODUCTIVITY ANALYSIS
ε=∆Y / Y
∆L / Leducation level
LMIP Report 5 11
be measured by the number of workers employed in the firm, and the interpretation is narrowed to real hours worked as factors of production. At the national level, labour could be measured as the total number of employed workers (the labour force), or as the working-age population being the total population, with each yielding a rather different interpretation of the results. For the employed, the economy is assumed to be production-driven and the interpretation of factor elasticity is close to its ‘true’ labour productivity in a strict but inaccurate sense, since the outputs in the economy are not only used to serve those who worked, but also those who do not work. In other words, it is the responsiveness of growth driven only by those who work and contribute to growth as the true labour productivity. The labour force includes both working individuals as well as workers who are non-contributing labourers and so the interpretation of elasticity is relaxed to take the consumption powers of the unemployed workers into consideration as part of the growth drivers. The working-age population, as a proxy for labour, measures the responsiveness of eligible workers. Therefore, the working-age population elasticity could be seen as the potential productivity of labour. Finally, total population as labour input assumes that the economy is a completely demand- or consumption-driven economy, as it takes into account all dependents in the economy as part of the output labour growth calculation. Our aim here is to extrapolate the first glimpse of the relationship between economic growth and labour growth trajectories of South Africa.
Results for simple aggregate output employment elasticity show that there is a positive growth relationship between economic growth and labour
growth at the aggregate, irrespective of the labour definition used. As expected, the magnitudes of the elasticity measures vary significantly. South Africa’s median output labour elasticity for the period 1995 to 2012 was 0.4 for employment and labour force. Put differently, a one percentage point change in employment or the labour force is associated with a 0.4% change in output growth in the same direction. Hence, the responsiveness is positive, yet inelastic. The median responsiveness for both output working age and output population elasticities for the period under review is also positive but elastic at 2.0 and 3.1. This does not mean that these two definitions of labour have an impact on output compared with employment or labour force growth. Instead, the positive and elastic growth ratios could suggest that the economy is leaning towards consumption-driven growth, as these two categories also include dependents and other non-contributing workers, that is, the unemployed.6
Output labour elasticities for labour with no education suggest that, irrespective of the labour definition used (save for labour using the population definition, which has positive elasticities for all educational categories), there is a negative growth relationship between growth and employment. In contrast, those with secondary schooling and higher all have positive, though inelastic, ratios between gross domestic product (GDP) growth and employment growth. Those with primary education yield mixed output labour elasticity results. In sum, then, the general trend for the simple elasticity results suggests that, over the 17-year post-apartheid period, the South African economy was mostly geared towards a growth model largely dependent on medium- to high-skilled labourers
Table 2: Simple output-skills elasticity: 1995–2012
None Primary Secondary Matric Certificate Degree Total
Employment -0.1 -0.1 0.4 0.5 0.2 0.1 0.4
Labour force -0.1 -0.2 0.3 0.3 0.2 0.1 0.4
Working age -0.4 0.1 0.8 0.3 0.2 0.2 2.0
Population 0.2 0.1 0.3 0.2 0.1 0.2 3.1
Source: Post-apartheid Labour Market Surveys (PALMS); Statistics South Africa (StatsSA); South African Reserve Bank (SARB) database and author’s own calculation
Note: Only the proportions where the absolute change is statistically significant are shown. Annual data for 1995 and 2012 are used in this analysis.
12 Higher Education, Employment and Economic Growth
with educational attainment no less than secondary schooling. This trend, where the relatively more educated contribute more positively to economic growth, will ultimately characterise the nature of returns to production in South Africa’s growth trajectory.
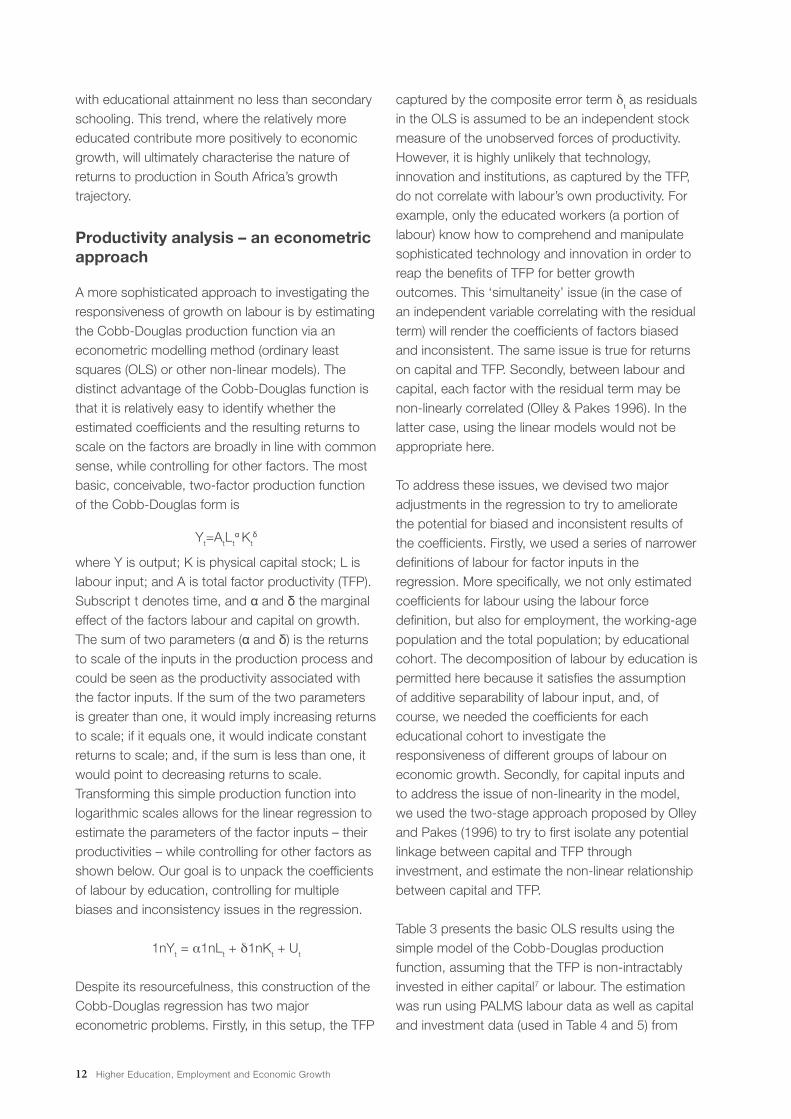
Productivity analysis – an econometric approach
A more sophisticated approach to investigating the responsiveness of growth on labour is by estimating the Cobb-Douglas production function via an econometric modelling method (ordinary least squares (OLS) or other non-linear models). The distinct advantage of the Cobb-Douglas function is that it is relatively easy to identify whether the estimated coefficients and the resulting returns to scale on the factors are broadly in line with common sense, while controlling for other factors. The most basic, conceivable, two-factor production function of the Cobb-Douglas form is
Yt=AtLtα Kt
δ
where Y is output; K is physical capital stock; L is labour input; and A is total factor productivity (TFP). Subscript t denotes time, and α and δ the marginal effect of the factors labour and capital on growth. The sum of two parameters (α and δ) is the returns to scale of the inputs in the production process and could be seen as the productivity associated with the factor inputs. If the sum of the two parameters is greater than one, it would imply increasing returns to scale; if it equals one, it would indicate constant returns to scale; and, if the sum is less than one, it would point to decreasing returns to scale. Transforming this simple production function into logarithmic scales allows for the linear regression to estimate the parameters of the factor inputs – their productivities – while controlling for other factors as shown below. Our goal is to unpack the coefficients of labour by education, controlling for multiple biases and inconsistency issues in the regression.
1nYt = α1nLt + δ1nKt + Ut
Despite its resourcefulness, this construction of the Cobb-Douglas regression has two major econometric problems. Firstly, in this setup, the TFP
captured by the composite error term δt as residuals in the OLS is assumed to be an independent stock measure of the unobserved forces of productivity. However, it is highly unlikely that technology, innovation and institutions, as captured by the TFP, do not correlate with labour’s own productivity. For example, only the educated workers (a portion of labour) know how to comprehend and manipulate sophisticated technology and innovation in order to reap the benefits of TFP for better growth outcomes. This ‘simultaneity’ issue (in the case of an independent variable correlating with the residual term) will render the coefficients of factors biased and inconsistent. The same issue is true for returns on capital and TFP. Secondly, between labour and capital, each factor with the residual term may be non-linearly correlated (Olley & Pakes 1996). In the latter case, using the linear models would not be appropriate here.
To address these issues, we devised two major adjustments in the regression to try to ameliorate the potential for biased and inconsistent results of the coefficients. Firstly, we used a series of narrower definitions of labour for factor inputs in the regression. More specifically, we not only estimated coefficients for labour using the labour force definition, but also for employment, the working-age population and the total population; by educational cohort. The decomposition of labour by education is permitted here because it satisfies the assumption of additive separability of labour input, and, of course, we needed the coefficients for each educational cohort to investigate the responsiveness of different groups of labour on economic growth. Secondly, for capital inputs and to address the issue of non-linearity in the model, we used the two-stage approach proposed by Olley and Pakes (1996) to try to first isolate any potential linkage between capital and TFP through investment, and estimate the non-linear relationship between capital and TFP.
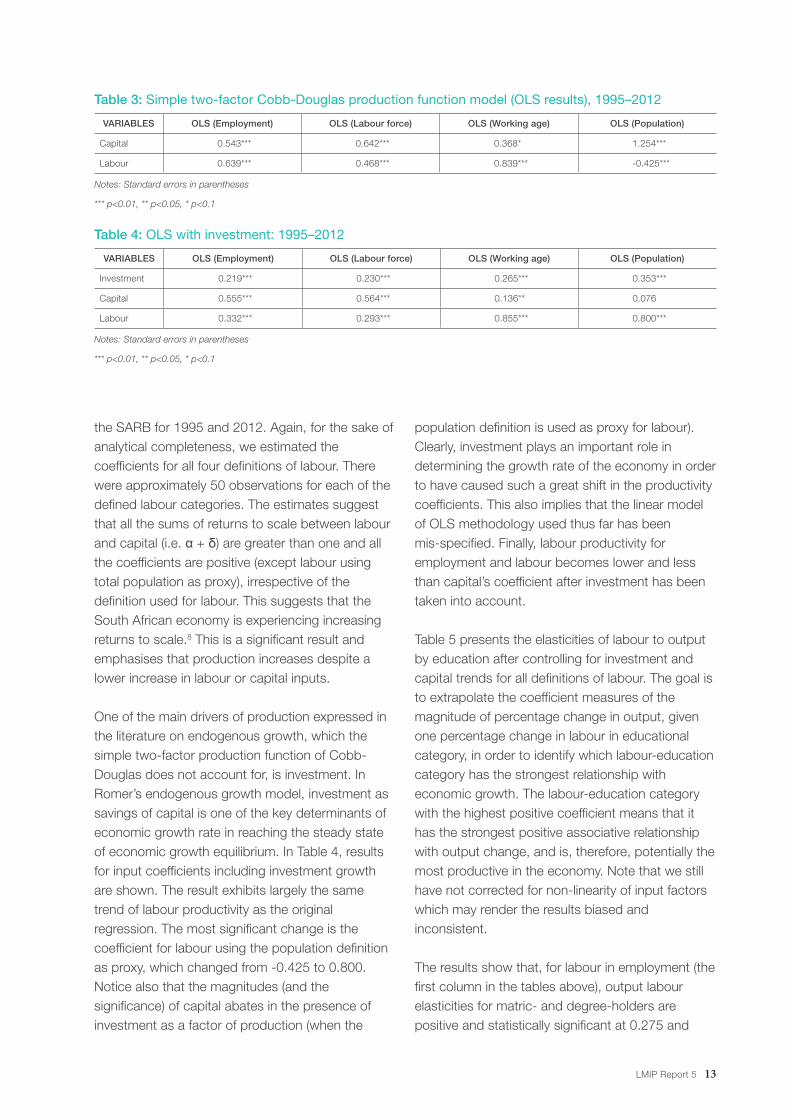
Table 3 presents the basic OLS results using the simple model of the Cobb-Douglas production function, assuming that the TFP is non-intractably invested in either capital7 or labour. The estimation was run using PALMS labour data as well as capital and investment data (used in Table 4 and 5) from
LMIP Report 5 13
Table 3: Simple two-factor Cobb-Douglas production function model (OLS results), 1995–2012
VARIABLES OLS (Employment) OLS (Labour force) OLS (Working age) OLS (Population)
Capital 0.543*** 0.642*** 0.368* 1.254***
Labour 0.639*** 0.468*** 0.839*** -0.425***
Notes: Standard errors in parentheses
*** p<0.01, ** p<0.05, * p<0.1
Table 4: OLS with investment: 1995–2012
VARIABLES OLS (Employment) OLS (Labour force) OLS (Working age) OLS (Population)
Investment 0.219*** 0.230*** 0.265*** 0.353***
Capital 0.555*** 0.564*** 0.136** 0.076
Labour 0.332*** 0.293*** 0.855*** 0.800***
Notes: Standard errors in parentheses
*** p<0.01, ** p<0.05, * p<0.1
the SARB for 1995 and 2012. Again, for the sake of analytical completeness, we estimated the coefficients for all four definitions of labour. There were approximately 50 observations for each of the defined labour categories. The estimates suggest that all the sums of returns to scale between labour and capital (i.e. α + δ) are greater than one and all the coefficients are positive (except labour using total population as proxy), irrespective of the definition used for labour. This suggests that the South African economy is experiencing increasing returns to scale.8 This is a significant result and emphasises that production increases despite a lower increase in labour or capital inputs.
One of the main drivers of production expressed in the literature on endogenous growth, which the simple two-factor production function of Cobb-Douglas does not account for, is investment. In Romer’s endogenous growth model, investment as savings of capital is one of the key determinants of economic growth rate in reaching the steady state of economic growth equilibrium. In Table 4, results for input coefficients including investment growth are shown. The result exhibits largely the same trend of labour productivity as the original regression. The most significant change is the coefficient for labour using the population definition as proxy, which changed from -0.425 to 0.800. Notice also that the magnitudes (and the significance) of capital abates in the presence of investment as a factor of production (when the
population definition is used as proxy for labour). Clearly, investment plays an important role in determining the growth rate of the economy in order to have caused such a great shift in the productivity coefficients. This also implies that the linear model of OLS methodology used thus far has been mis-specified. Finally, labour productivity for employment and labour becomes lower and less than capital’s coefficient after investment has been taken into account.
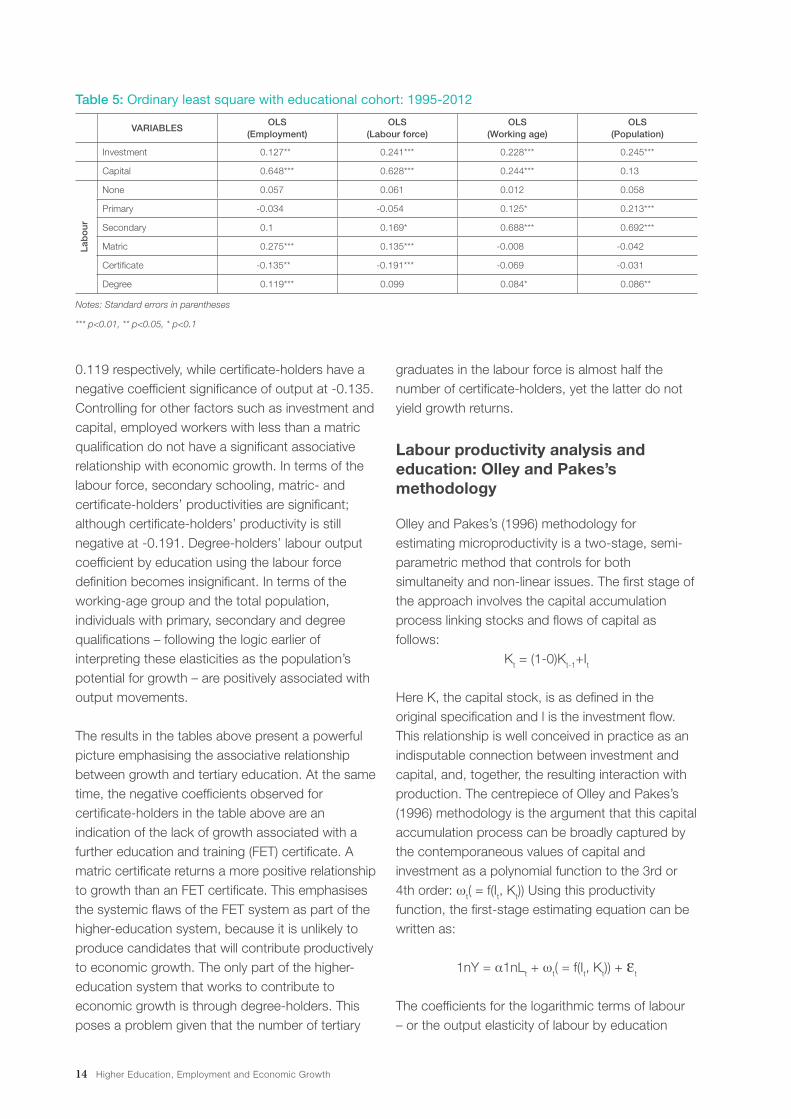
Table 5 presents the elasticities of labour to output by education after controlling for investment and capital trends for all definitions of labour. The goal is to extrapolate the coefficient measures of the magnitude of percentage change in output, given one percentage change in labour in educational category, in order to identify which labour-education category has the strongest relationship with economic growth. The labour-education category with the highest positive coefficient means that it has the strongest positive associative relationship with output change, and is, therefore, potentially the most productive in the economy. Note that we still have not corrected for non-linearity of input factors which may render the results biased and inconsistent.
The results show that, for labour in employment (the first column in the tables above), output labour elasticities for matric- and degree-holders are positive and statistically significant at 0.275 and
14 Higher Education, Employment and Economic Growth
Table 5: Ordinary least square with educational cohort: 1995-2012
VARIABLESOLS
(Employment)OLS
(Labour force)OLS
(Working age)OLS
(Population)
Investment 0.127** 0.241*** 0.228*** 0.245***
Capital 0.648*** 0.628*** 0.244*** 0.13
Lab
our
None 0.057 0.061 0.012 0.058
Primary -0.034 -0.054 0.125* 0.213***
Secondary 0.1 0.169* 0.688*** 0.692***
Matric 0.275*** 0.135*** -0.008 -0.042
Certificate -0.135** -0.191*** -0.069 -0.031
Degree 0.119*** 0.099 0.084* 0.086**
Notes: Standard errors in parentheses
*** p<0.01, ** p<0.05, * p<0.1
0.119 respectively, while certificate-holders have a negative coefficient significance of output at -0.135. Controlling for other factors such as investment and capital, employed workers with less than a matric qualification do not have a significant associative relationship with economic growth. In terms of the labour force, secondary schooling, matric- and certificate-holders’ productivities are significant; although certificate-holders’ productivity is still negative at -0.191. Degree-holders’ labour output coefficient by education using the labour force definition becomes insignificant. In terms of the working-age group and the total population, individuals with primary, secondary and degree qualifications – following the logic earlier of interpreting these elasticities as the population’s potential for growth – are positively associated with output movements.
The results in the tables above present a powerful picture emphasising the associative relationship between growth and tertiary education. At the same time, the negative coefficients observed for certificate-holders in the table above are an indication of the lack of growth associated with a further education and training (FET) certificate. A matric certificate returns a more positive relationship to growth than an FET certificate. This emphasises the systemic flaws of the FET system as part of the higher-education system, because it is unlikely to produce candidates that will contribute productively to economic growth. The only part of the higher-education system that works to contribute to economic growth is through degree-holders. This poses a problem given that the number of tertiary
graduates in the labour force is almost half the number of certificate-holders, yet the latter do not yield growth returns.
Labour productivity analysis and education: Olley and Pakes’s methodology
Olley and Pakes’s (1996) methodology for estimating microproductivity is a two-stage, semi-parametric method that controls for both simultaneity and non-linear issues. The first stage of the approach involves the capital accumulation process linking stocks and flows of capital as follows:
Kt = (1-0)Kt-1+It
Here K, the capital stock, is as defined in the original specification and l is the investment flow. This relationship is well conceived in practice as an indisputable connection between investment and capital, and, together, the resulting interaction with production. The centrepiece of Olley and Pakes’s (1996) methodology is the argument that this capital accumulation process can be broadly captured by the contemporaneous values of capital and investment as a polynomial function to the 3rd or 4th order: ωt( = f(It, Kt)) Using this productivity function, the first-stage estimating equation can be written as:
1nY = α1nLt + ωt( = f(It, Kt)) + εt
The coefficients for the logarithmic terms of labour – or the output elasticity of labour by education
LMIP Report 5 15
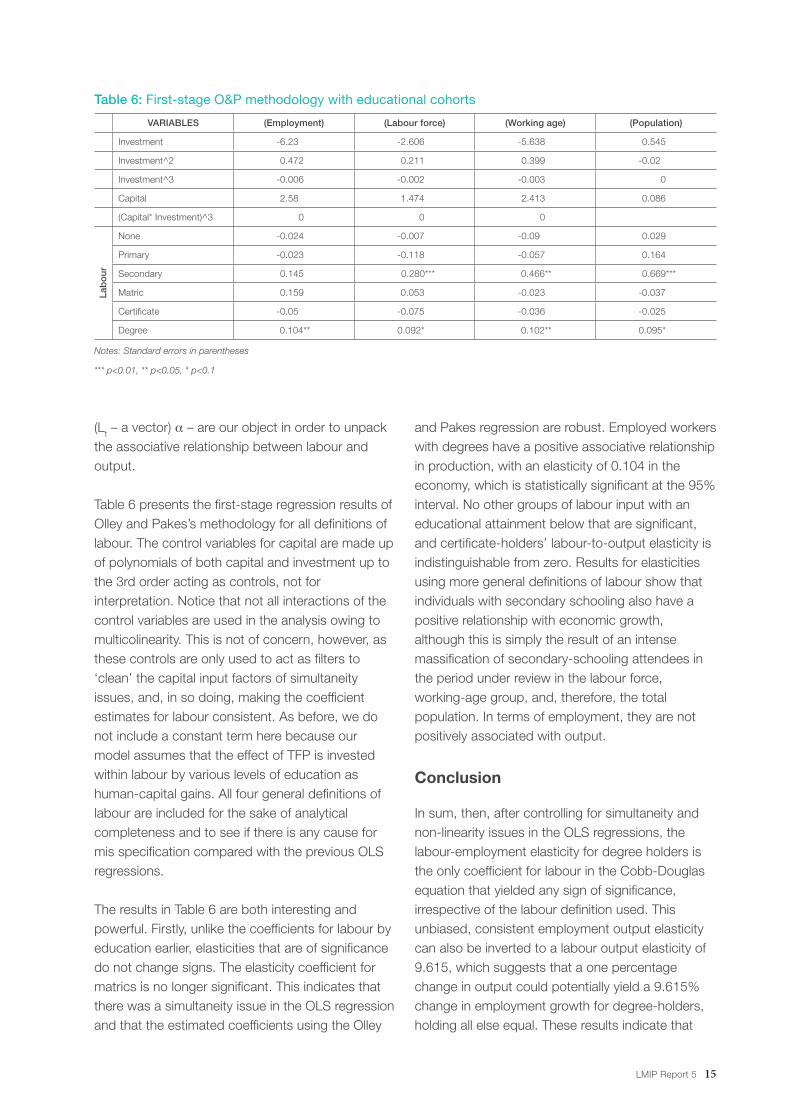
Table 6: First-stage O&P methodology with educational cohorts
VARIABLES (Employment) (Labour force) (Working age) (Population)
Investment -6.23 -2.606 -5.638 0.545
Investment^2 0.472 0.211 0.399 -0.02
Investment^3 -0.006 -0.002 -0.003 0
Capital 2.58 1.474 2.413 0.086
(Capital* Investment)^3 0 0 0
Lab
our
None -0.024 -0.007 -0.09 0.029
Primary -0.023 -0.118 -0.057 0.164
Secondary 0.145 0.280*** 0.466** 0.669***
Matric 0.159 0.053 -0.023 -0.037
Certificate -0.05 -0.075 -0.036 -0.025
Degree 0.104** 0.092* 0.102** 0.095*
Notes: Standard errors in parentheses
*** p<0.01, ** p<0.05, * p<0.1
(Lt – a vector) α – are our object in order to unpack the associative relationship between labour and output.
Table 6 presents the first-stage regression results of Olley and Pakes’s methodology for all definitions of labour. The control variables for capital are made up of polynomials of both capital and investment up to the 3rd order acting as controls, not for interpretation. Notice that not all interactions of the control variables are used in the analysis owing to multicolinearity. This is not of concern, however, as these controls are only used to act as filters to ‘clean’ the capital input factors of simultaneity issues, and, in so doing, making the coefficient estimates for labour consistent. As before, we do not include a constant term here because our model assumes that the effect of TFP is invested within labour by various levels of education as human-capital gains. All four general definitions of labour are included for the sake of analytical completeness and to see if there is any cause for mis specification compared with the previous OLS regressions.
The results in Table 6 are both interesting and powerful. Firstly, unlike the coefficients for labour by education earlier, elasticities that are of significance do not change signs. The elasticity coefficient for matrics is no longer significant. This indicates that there was a simultaneity issue in the OLS regression and that the estimated coefficients using the Olley
and Pakes regression are robust. Employed workers with degrees have a positive associative relationship in production, with an elasticity of 0.104 in the economy, which is statistically significant at the 95% interval. No other groups of labour input with an educational attainment below that are significant, and certificate-holders’ labour-to-output elasticity is indistinguishable from zero. Results for elasticities using more general definitions of labour show that individuals with secondary schooling also have a positive relationship with economic growth, although this is simply the result of an intense massification of secondary-schooling attendees in the period under review in the labour force, working-age group, and, therefore, the total population. In terms of employment, they are not positively associated with output.
Conclusion
In sum, then, after controlling for simultaneity and non-linearity issues in the OLS regressions, the labour-employment elasticity for degree holders is the only coefficient for labour in the Cobb-Douglas equation that yielded any sign of significance, irrespective of the labour definition used. This unbiased, consistent employment output elasticity can also be inverted to a labour output elasticity of 9.615, which suggests that a one percentage change in output could potentially yield a 9.615% change in employment growth for degree-holders, holding all else equal. These results indicate that
16 Higher Education, Employment and Economic Growth
degree-holders who are employed in the labour market are the most closely associated with the movements of economic growth and thus classical theory of an efficient labour market suggests they are the most ‘productive’ factor of labour input employed in the economy. Regression results using other labour definitions (labour force, working-age group, and the total population) showed that individuals with secondary schooling underwent a period of massification alongside economic growth during the period. These individuals are not associated significantly with output growth.
From this analysis, it becomes evident that economic growth returns are only being extracted from the university component of the education system. The FET certificate or diploma provides insignificant returns to growth. The higher level of
unemployment found earlier in the report for those with an FET qualification provides descriptive evidence of the less than optimal contribution to the economy. The FET college system should in theory be a critical part of skills development in South Africa, but the institutional capacity is suggested to be inadequate to address the skills demand as a result of the quality and variation of programmes offered (Mayer, Gordham, Manxeba, Hughes, Foley, Maroc, Lolwana & Nell 2011:26). The schooling system has also been shown not to be a productive element of South Africa’s growth path, which is not surprising given the low quality of the education system. The quality of both the schooling and the FET college system is hampering labour market absorption of those qualified with less than a university degree, as well their contribution to economic growth.
LMIP Report 5 17
5. THE RELATIONSHIP BETWEEN EDUCATION AND PRO-POOR GROWTH
Economists generally agree that high levels of economic growth are essential for poverty reduction. Growth rates measured by increasing per capita income signal improved levels with regard to poverty. However, this is far too simplistic. Economic growth gains are often biased, and the gains at the lower end of income distribution are not always enough to shift households out of poverty. Bhorat, Van der Westhuizen and Yu (2013) suggest that the generalised view that ‘growth is good for the poor’ is misplaced for two important reasons. Firstly, the impact of economic growth on poverty differs significantly across countries. Research from the World Bank indicates that a 2% increase in growth rates will result in a reduction in poverty ranging from 1% to 7%, depending on the country (Ravallion 2001). Secondly, as incomes grow, this is likely to affect the distribution of income. They further point out that, in the light of this, economic growth often brings with it some change in the levels of income inequality. When this occurs, and if the result is an increase in inequality, the gains from growth with regard to the poor may in fact be reduced. The impact of economic growth is therefore diluted, and at times negative, in the case of increasingly unevenly distributed income with little impact on poverty. Given these two caveats to the growth−poverty nexus, then, the critical insight is that economic growth may be necessary, but it is certainly not a sufficient condition for poverty reduction in a society.
A key policy instrument for reducing income inequality and levels of poverty is education. Education is rightfully (and unanimously) considered a key tool in a pro-poor growth strategy. Education is an investment that leads to the formation of
human capital as opposed to physical capital, and the quality of human capital and the skills developed shapes economic growth. There are several ways through which education can result in development outcomes. For example, education can increase economic growth through increasing productivity, creating and (or) adopting new technology, and improving the health of those going into the labour force. In addition, education improves the quality and efficiency of institutions, thus leading to higher rates of growth. Furthermore, low levels of basic education and vocational skills do not necessarily provide the skills for individuals to get a job that can move them out of poverty. The bulk of the literature on education and poverty reduction focuses on primary education and basic skills such as literacy. However, there is evidence that higher education plays a significant role in development through its impact on the social, economic and occupational potential of households. In this section, we therefore consider the role of higher education in poverty reduction and income inequality.
Traditionally, the analysis of human capital has largely focused on the rates of return for the individual in terms of wages. Much of this research draws on the seminal work by Becker (1964), Mincer (1974), and many others. They highlight the links between education, productivity and output levels. Although some have questioned the direction of causality and have argued that education simply acts as a screening device to help employers to identify more able individuals, the general consensus seems to be that education does result in higher individual productivity and earnings. On balance, the results suggest a strong and positive causal link between investment in education and
18 Higher Education, Employment and Economic Growth
earnings. This applies both at the level of the individual and also to the broader social returns on such investments, with the evidence suggesting substantial social as well as private benefits. The implication of this is that what is good for the individual is also good for society at large (Wilson & Briscoe 2005:7). A critique of this approach is that there is undue attention paid to school attainment instead of to the importance of cognitive skills, obtained in higher education, that are important for economic growth (Lopez 2004; Klasen 2004). In South Africa, there is a sense that, even though school attainment has been successful, the quality of education is still a hampering factor in pro-poor growth. Without improving the quality of education, developing countries will find it difficult to improve their long-run economic performance (Hanushek 2013:1). In this section, we assess to what extent broader economic growth gains have been
absorbed by the higher-education cohorts with particular reference to those at the lower end of the income distribution, and whether the level of education attained have had a pro-poor impact. Methodologically, we draw on the work of Ravallion (2004) and Ravallion and Chen (2003), who developed growth incidence curves (GICs) which allow us to determine whether growth in income or expenditure has been pro-poor in nature by plotting the growth rate across each percentile of the distribution.
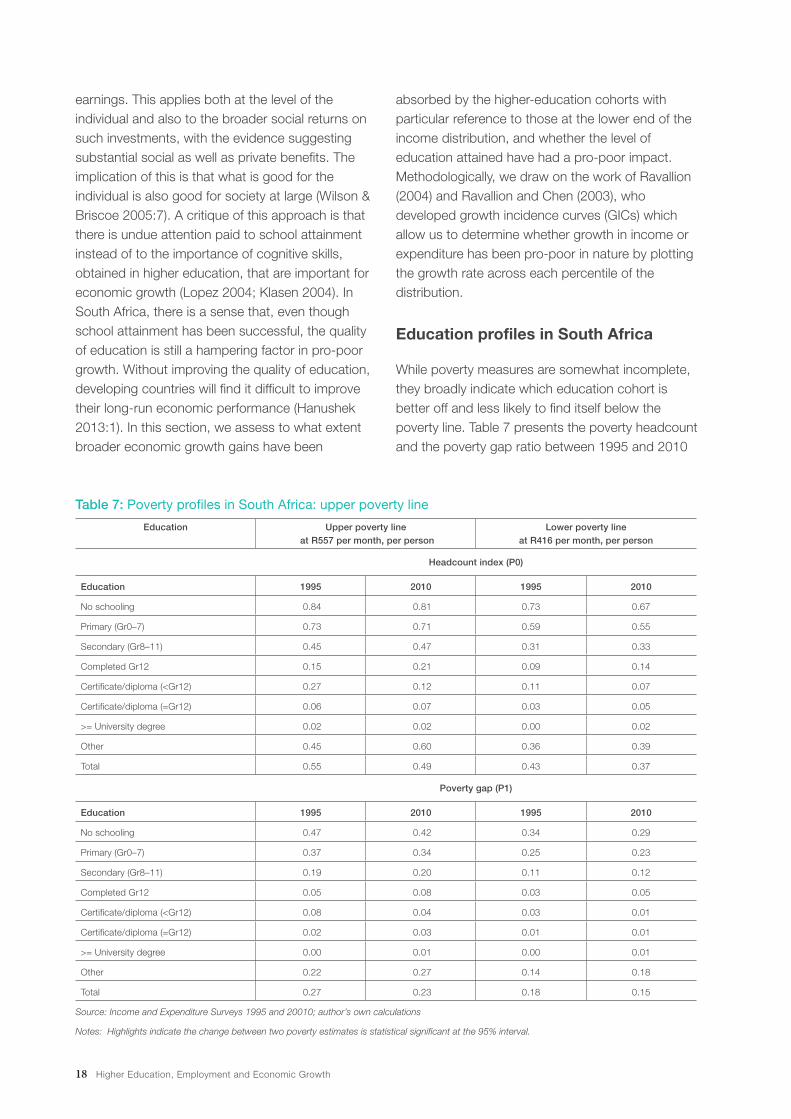
Education profiles in South Africa
While poverty measures are somewhat incomplete, they broadly indicate which education cohort is better off and less likely to find itself below the poverty line. Table 7 presents the poverty headcount and the poverty gap ratio between 1995 and 2010
Table 7: Poverty profiles in South Africa: upper poverty line
Education Upper poverty line at R557 per month, per person
Lower poverty line at R416 per month, per person
Headcount index (P0)
Education 1995 2010 1995 2010
No schooling 0.84 0.81 0.73 0.67
Primary (Gr0–7) 0.73 0.71 0.59 0.55
Secondary (Gr8–11) 0.45 0.47 0.31 0.33
Completed Gr12 0.15 0.21 0.09 0.14
Certificate/diploma (<Gr12) 0.27 0.12 0.11 0.07
Certificate/diploma (=Gr12) 0.06 0.07 0.03 0.05
>= University degree 0.02 0.02 0.00 0.02
Other 0.45 0.60 0.36 0.39
Total 0.55 0.49 0.43 0.37
Poverty gap (P1)
Education 1995 2010 1995 2010
No schooling 0.47 0.42 0.34 0.29
Primary (Gr0–7) 0.37 0.34 0.25 0.23
Secondary (Gr8–11) 0.19 0.20 0.11 0.12
Completed Gr12 0.05 0.08 0.03 0.05
Certificate/diploma (<Gr12) 0.08 0.04 0.03 0.01
Certificate/diploma (=Gr12) 0.02 0.03 0.01 0.01
>= University degree 0.00 0.01 0.00 0.01
Other 0.22 0.27 0.14 0.18
Total 0.27 0.23 0.18 0.15
Source: Income and Expenditure Surveys 1995 and 20010; author’s own calculations
Notes: Highlights indicate the change between two poverty estimates is statistical significant at the 95% interval.
LMIP Report 5 19
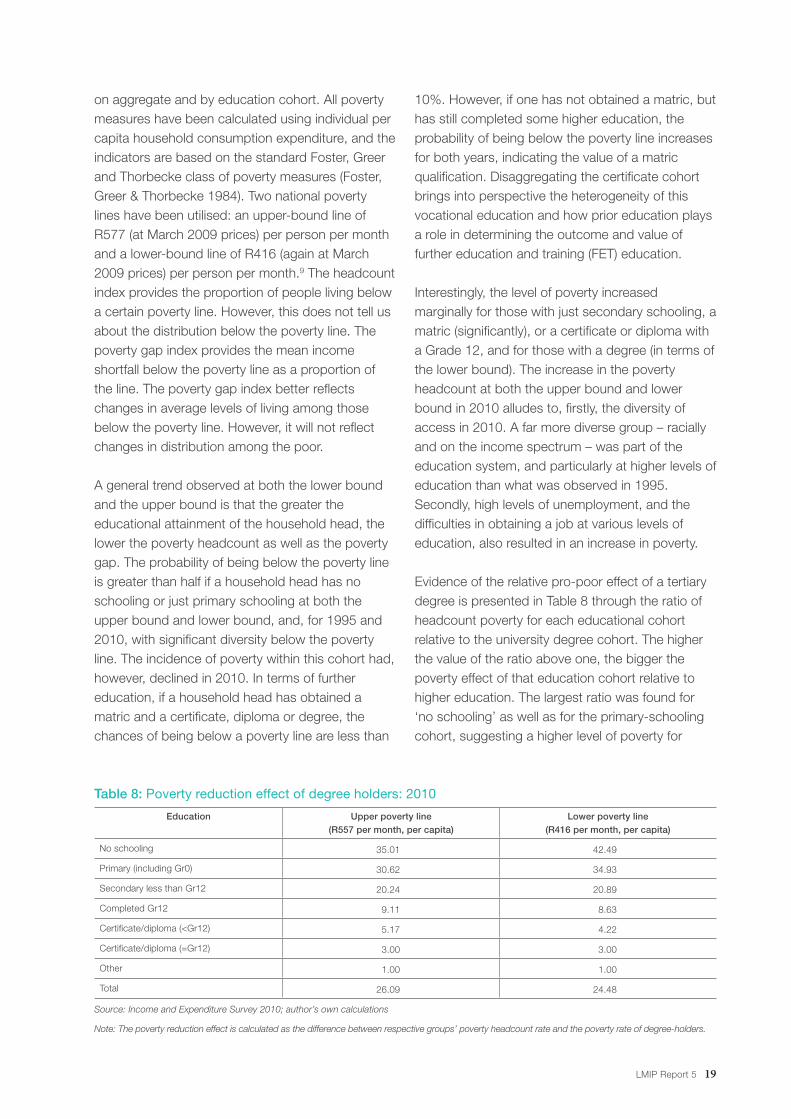
Table 8: Poverty reduction effect of degree holders: 2010
Education Upper poverty line (R557 per month, per capita)
Lower poverty line (R416 per month, per capita)
No schooling 35.01 42.49
Primary (including Gr0) 30.62 34.93
Secondary less than Gr12 20.24 20.89
Completed Gr12 9.11 8.63
Certificate/diploma (<Gr12) 5.17 4.22
Certificate/diploma (=Gr12) 3.00 3.00
Other 1.00 1.00
Total 26.09 24.48
Source: Income and Expenditure Survey 2010; author’s own calculations
Note: The poverty reduction effect is calculated as the difference between respective groups’ poverty headcount rate and the poverty rate of degree-holders.
on aggregate and by education cohort. All poverty measures have been calculated using individual per capita household consumption expenditure, and the indicators are based on the standard Foster, Greer and Thorbecke class of poverty measures (Foster, Greer & Thorbecke 1984). Two national poverty lines have been utilised: an upper-bound line of R577 (at March 2009 prices) per person per month and a lower-bound line of R416 (again at March 2009 prices) per person per month.9 The headcount index provides the proportion of people living below a certain poverty line. However, this does not tell us about the distribution below the poverty line. The poverty gap index provides the mean income shortfall below the poverty line as a proportion of the line. The poverty gap index better reflects changes in average levels of living among those below the poverty line. However, it will not reflect changes in distribution among the poor.
A general trend observed at both the lower bound and the upper bound is that the greater the educational attainment of the household head, the lower the poverty headcount as well as the poverty gap. The probability of being below the poverty line is greater than half if a household head has no schooling or just primary schooling at both the upper bound and lower bound, and, for 1995 and 2010, with significant diversity below the poverty line. The incidence of poverty within this cohort had, however, declined in 2010. In terms of further education, if a household head has obtained a matric and a certificate, diploma or degree, the chances of being below a poverty line are less than
10%. However, if one has not obtained a matric, but has still completed some higher education, the probability of being below the poverty line increases for both years, indicating the value of a matric qualification. Disaggregating the certificate cohort brings into perspective the heterogeneity of this vocational education and how prior education plays a role in determining the outcome and value of further education and training (FET) education.
Interestingly, the level of poverty increased marginally for those with just secondary schooling, a matric (significantly), or a certificate or diploma with a Grade 12, and for those with a degree (in terms of the lower bound). The increase in the poverty headcount at both the upper bound and lower bound in 2010 alludes to, firstly, the diversity of access in 2010. A far more diverse group – racially and on the income spectrum – was part of the education system, and particularly at higher levels of education than what was observed in 1995. Secondly, high levels of unemployment, and the difficulties in obtaining a job at various levels of education, also resulted in an increase in poverty.
Evidence of the relative pro-poor effect of a tertiary degree is presented in Table 8 through the ratio of headcount poverty for each educational cohort relative to the university degree cohort. The higher the value of the ratio above one, the bigger the poverty effect of that education cohort relative to higher education. The largest ratio was found for ‘no schooling’ as well as for the primary-schooling cohort, suggesting a higher level of poverty for
20 Higher Education, Employment and Economic Growth
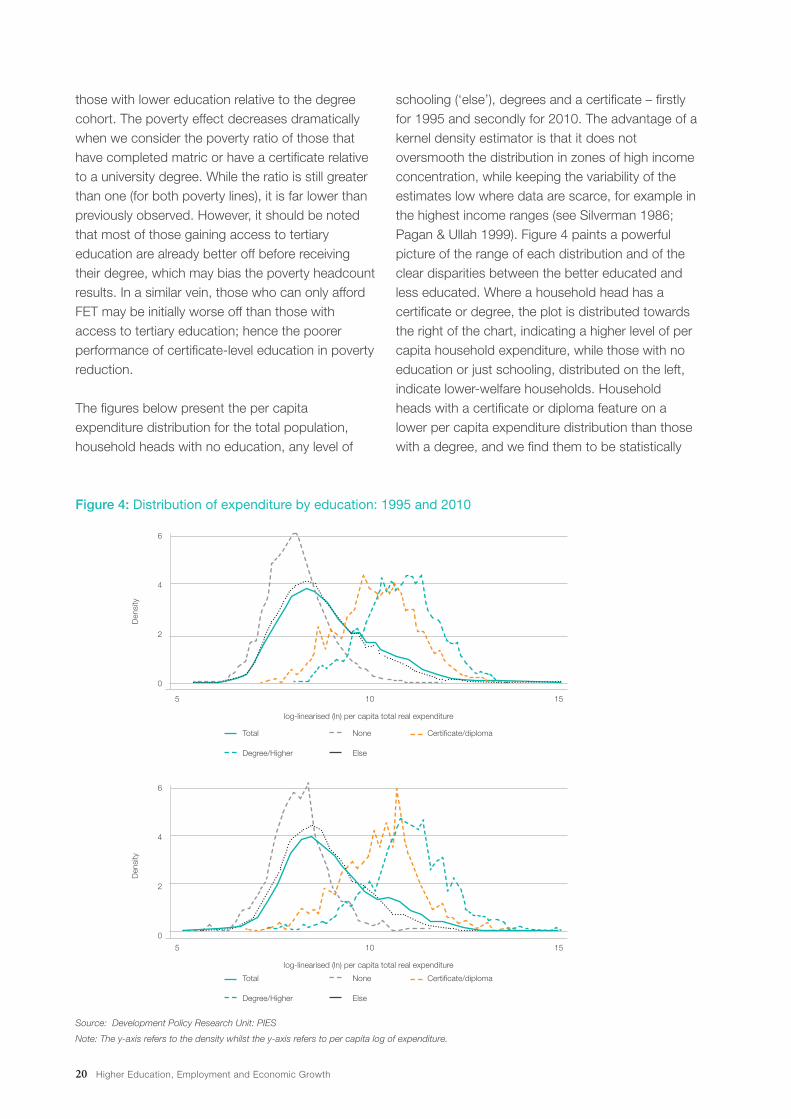
Figure 4: Distribution of expenditure by education: 1995 and 2010
Source: Development Policy Research Unit: PIES
Note: The y-axis refers to the density whilst the y-axis refers to per capita log of expenditure.
6
4
2
0
Total
Degree/Higher
5 1510
log-linearised (ln) per capita total real expenditure
None
Else
Certificate/diploma
6
4
2
0
Total
Degree/Higher
5 1510
log-linearised (ln) per capita total real expenditure
None
Else
Certificate/diploma
those with lower education relative to the degree cohort. The poverty effect decreases dramatically when we consider the poverty ratio of those that have completed matric or have a certificate relative to a university degree. While the ratio is still greater than one (for both poverty lines), it is far lower than previously observed. However, it should be noted that most of those gaining access to tertiary education are already better off before receiving their degree, which may bias the poverty headcount results. In a similar vein, those who can only afford FET may be initially worse off than those with access to tertiary education; hence the poorer performance of certificate-level education in poverty reduction.
The figures below present the per capita expenditure distribution for the total population, household heads with no education, any level of
schooling (‘else’), degrees and a certificate – firstly for 1995 and secondly for 2010. The advantage of a kernel density estimator is that it does not oversmooth the distribution in zones of high income concentration, while keeping the variability of the estimates low where data are scarce, for example in the highest income ranges (see Silverman 1986; Pagan & Ullah 1999). Figure 4 paints a powerful picture of the range of each distribution and of the clear disparities between the better educated and less educated. Where a household head has a certificate or degree, the plot is distributed towards the right of the chart, indicating a higher level of per capita household expenditure, while those with no education or just schooling, distributed on the left, indicate lower-welfare households. Household heads with a certificate or diploma feature on a lower per capita expenditure distribution than those with a degree, and we find them to be statistically
Den
sity
Den
sity
LMIP Report 5 21
different at all levels of significance. Those households that have no higher education but some level of schooling (the ‘else’ cohort) closely follow the trend of the ‘total’ population, indicating that the majority of the population does not have higher education. This also suggests that the earning premium for a certificate-holder is greater than the premium earned for those with just schooling. To an extent, this figure visually presents a picture of income inequality if we compare the distribution of those with no education (‘none’) with those with some schooling and with those with higher education.
Per capita expenditure distributions in 1995 and 201010 are not vastly different, but an equality-of-distribution test tells us that the 1995 per capita expenditure distribution was smaller than the 2010 distribution at all levels of significance11. In line with this, the certificate and degree distributions are each significantly different from their distributions in 1995 and 2010 – we also see that the 2010 distributions are larger, indicating higher real per capita expenditure in 2010. In 1995, the distribution for certificate is bimodal. It is in 2010 as well, but to a lesser extent, although reaching a higher density (in the middle of the distribution), suggesting that expenditure was less equally distributed in 2010. For degree-holders, similarly, the distribution was bimodal in 1995 and still in 2010, but narrower, suggesting that fewer degree-holders earned as well as they would have in 1995. We also find that, as the images portray, the degree-holder group has a significantly larger distribution (higher per capita expenditure) than the certificate cohort at all levels of significance for both 1995 (by 0.26) and 2010 (by 0.42). This alludes to the premium in obtaining a degree as opposed to an FET certificate. However, we also observe that both certificate- and degree-holders have a larger per capita expenditure distribution than those with only a school qualification for both years at all levels of significance. This complements the poverty statistics provided earlier where the proportion of households with higher education below the poverty line was marginal compared with those with just schooling.
To some extent, we can already infer the growth gains of those with a degree, as we see a much lower poverty headcount as well as a higher income distribution. However, the results observed for the certificate cohort have been inconsistent – we see no significant contribution to growth, yet a low poverty headcount and a higher income distribution than those with just schooling. This indicates that those employed with a certificate are better off than those employed with just a schooling qualification. The quality of school education is so poor that it is not surprising that certificate-holders would be deemed ‘skilled’ workers and would therefore experience higher per capita expenditure than those with just schooling. However, the unemployment levels of the schooling cohorts are comparable with the unemployment rate for certificate-holders. Between 1995 and 2010, just under 700 000 tertiary graduates entered the labour force, while around 1 million certificate-holders entered the labour force, suggesting an oversupply of certificate-holders into the labour force. The heterogeneity of this group means that the outcomes achieved differed by a range of factors, including initial wealth, previous education, and probably other demographic characteristics. The poverty headcounts suggest that those that qualified with an FET qualification and a matric were far better off than those without a matric, and this group is likely to bias the welfare effects attained by this group. Further, FET colleges are plagued by institutional challenges, including funding and management with disparities being observed by region. The next section will illustrate and compare the welfare and growth gains of both degree-holders and certificate-holders.
Growth and education: Exploring the interactions
Economic theory suggests that higher education equips a person with skills to perform certain jobs or functions more effectively. Underlining this is that higher education allows for the ability to understand and decode information for performing certain tasks (1996:69). These functions generally contribute to productivity and economic growth. In this section, we estimate the percentage change in expenditure across the percentile-defined distribution for
22 Higher Education, Employment and Economic Growth
households nationally and then the education cohort of the household head.12 This analysis will contribute to understanding the distribution of growth gains and whether they have been higher for more educated households.
We use the GIC to examine aggregate economic growth over a wide range of income distribution. The GIC measures the rate of growth per capita income (or expenditure) between two points in time (between 1995 and 2010) at each percentile of the income (or expenditure) distribution. The rate of pro-poor growth is thus the average growth in consumption over the population up to the headcount index referred to as the ‘mean of growth rates’. The GIC graph allows us to compare the incidence of growth in poorer segments of the population with the better-off segments or with the rate of growth of mean income (or expenditure). From this analysis, we can tell the growth rate in per capita income (or expenditure) between 1995 and 2010 at a certain point of the income distribution. We can then assess whether those at the lower end of the distribution experienced income (or expenditure growth) pro-poor growth, that is, was growth in income (or expenditure) above or below mean income (or expenditure growth)? This is a conceptually useful tool to analyse aggregate economic growth over a wide distribution.
We first provide an overview of national growth in per capita expenditure and income. This data, firstly, is reflective of the nature of overall growth distribution nationally, and, secondly, serves as a comparator for the analysis undertaken thereafter. The figures below provide the national growth incidence curve, firstly, in terms of income per capita, and, secondly, per capita expenditure. While we see that income growth increases for each ascending percentile, income growth is below the mean (1.43%) up until approximately the 60th percentile. After the 60th percentile, income grows at a rate higher than the mean. Growth rates in income per capita for those below the 40th percentile are negative, indicating a lack of pro-poor growth. In terms of expenditure, except for those below the 20th percentile, expenditure generally grew at a rate similar to the mean (1.71%). Those below the 30th percentile experienced negative per
capita income growth. For those above the 80th percentile, expenditure increased at a rate greater than the mean. At the lower end of the income distribution, social grants make up a fairly large proportion of household income and expenditure and it is assumed that the positive growth rate of per capita expenditure was in part due to elements of the welfare system. Although the growth in per capita expenditure does not present an outright pro-poor picture, growth in per capita expenditure from the 20th percentile has tended toward the mean.
To better understand the impact of higher education on household welfare, we use real expenditure instead of income data, restrict the sample to higher-education cohorts, and estimate the GICs accordingly. The growth rates observed provide a sense of the distribution of growth for each education cohort and of the extent to which the poor benefitted from economic growth, if at all. Essentially, we aim to understand whether having a university degree as opposed to a certificate or diploma from an FET college will result in higher relative per capita expenditure growth, and, most importantly, whether attaining a certain qualification will have a pro-poor impact on the household.
Growth rates for the period 1995 to 2010 reported below summarise what has been presented in the GICs thus far. Firstly, there are definitely economic growth gains for the majority of those with a degree, as we see that per capita expenditure growth for degrees (2.53%) is above the national mean (1.71%) and returns positive growth rates at all besides the 10th percentile. Secondly, we find that the certificate cohort experiences far lower per capita expenditure growth (0.90) than the national mean (1.71), and we find negative growth for the two lowest percentiles. Further, the growth rates presented for certificate-holders are less than half that for degree-holders. This alludes to the weak growth returns observed in Section 4 associated with FET college education. For all of the categories, we find that, while the majority of the lower percentiles return positive growth rates, they are still lower relative to mean expenditure growth and therefore do not exhibit pro-poor growth. In particular, households below the 10th percentile with higher education experience
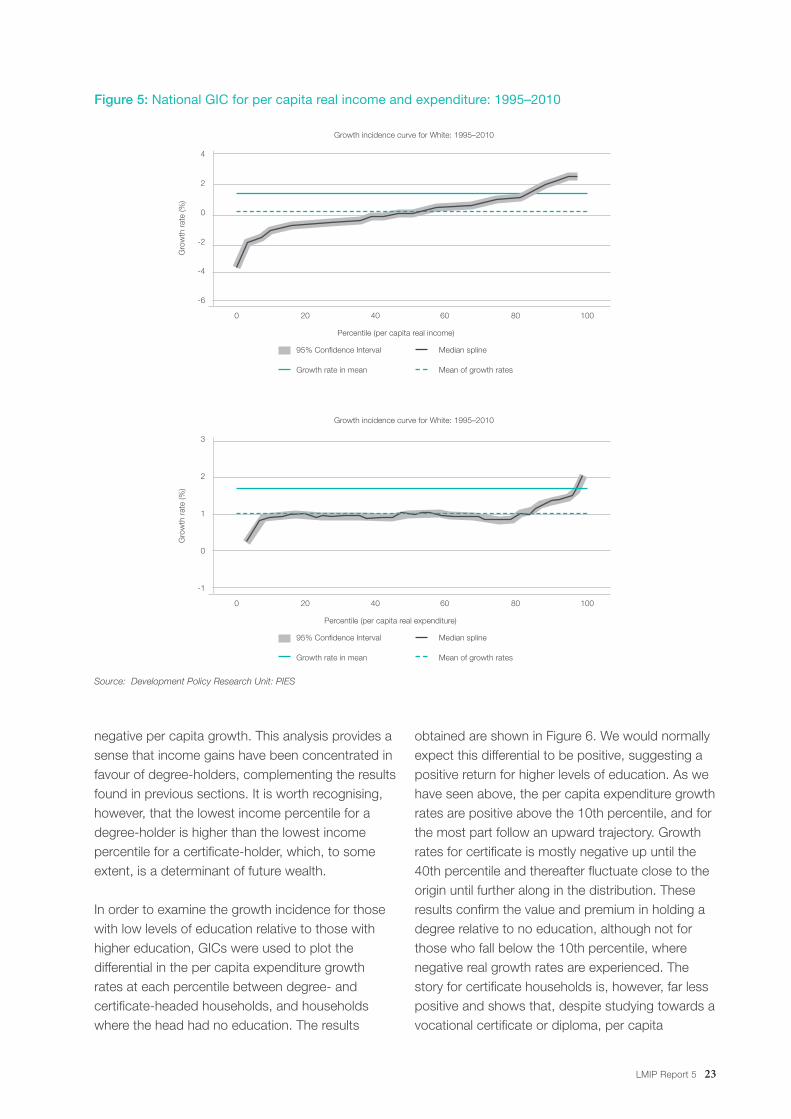
LMIP Report 5 23
Figure 5: National GIC for per capita real income and expenditure: 1995–2010
4
2
0
-2
-4
-6
95% Confidence Interval
Growth rate in mean
0
Percentile (per capita real income)
Median spline
Mean of growth rates
Gro
wth
rat
e (%
)
20 40 60 80 100
3
2
1
0
-1
95% Confidence Interval
Growth rate in mean
0
Percentile (per capita real expenditure)
Median spline
Mean of growth rates
Gro
wth
rat
e (%
)
20 40 60 80 100
negative per capita growth. This analysis provides a sense that income gains have been concentrated in favour of degree-holders, complementing the results found in previous sections. It is worth recognising, however, that the lowest income percentile for a degree-holder is higher than the lowest income percentile for a certificate-holder, which, to some extent, is a determinant of future wealth.
In order to examine the growth incidence for those with low levels of education relative to those with higher education, GICs were used to plot the differential in the per capita expenditure growth rates at each percentile between degree- and certificate-headed households, and households where the head had no education. The results
obtained are shown in Figure 6. We would normally expect this differential to be positive, suggesting a positive return for higher levels of education. As we have seen above, the per capita expenditure growth rates are positive above the 10th percentile, and for the most part follow an upward trajectory. Growth rates for certificate is mostly negative up until the 40th percentile and thereafter fluctuate close to the origin until further along in the distribution. These results confirm the value and premium in holding a degree relative to no education, although not for those who fall below the 10th percentile, where negative real growth rates are experienced. The story for certificate households is, however, far less positive and shows that, despite studying towards a vocational certificate or diploma, per capita
Growth incidence curve for White: 1995–2010
Growth incidence curve for White: 1995–2010
Source: Development Policy Research Unit: PIES
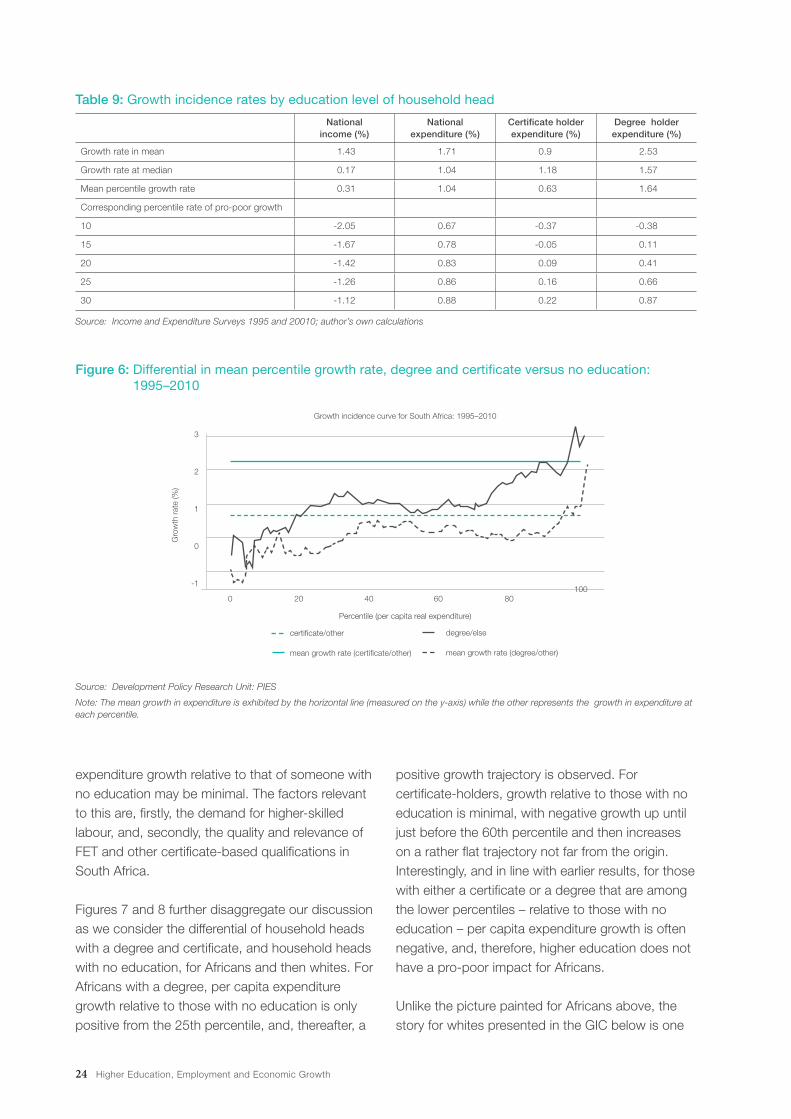
24 Higher Education, Employment and Economic Growth
Table 9: Growth incidence rates by education level of household head
National income (%)
National expenditure (%)
Certificate holder expenditure (%)
Degree holder expenditure (%)
Growth rate in mean 1.43 1.71 0.9 2.53
Growth rate at median 0.17 1.04 1.18 1.57
Mean percentile growth rate 0.31 1.04 0.63 1.64
Corresponding percentile rate of pro-poor growth
10 -2.05 0.67 -0.37 -0.38
15 -1.67 0.78 -0.05 0.11
20 -1.42 0.83 0.09 0.41
25 -1.26 0.86 0.16 0.66
30 -1.12 0.88 0.22 0.87
Source: Income and Expenditure Surveys 1995 and 20010; author’s own calculations
Figure 6: Differential in mean percentile growth rate, degree and certificate versus no education: 1995–2010
Source: Development Policy Research Unit: PIES
Note: The mean growth in expenditure is exhibited by the horizontal line (measured on the y-axis) while the other represents the growth in expenditure at each percentile.
3
2
1
0
-1
certificate/other
mean growth rate (certificate/other)
0
Percentile (per capita real expenditure)
degree/else
mean growth rate (degree/other)
20 40 60 80100
expenditure growth relative to that of someone with no education may be minimal. The factors relevant to this are, firstly, the demand for higher-skilled labour, and, secondly, the quality and relevance of FET and other certificate-based qualifications in South Africa.
Figures 7 and 8 further disaggregate our discussion as we consider the differential of household heads with a degree and certificate, and household heads with no education, for Africans and then whites. For Africans with a degree, per capita expenditure growth relative to those with no education is only positive from the 25th percentile, and, thereafter, a
positive growth trajectory is observed. For certificate-holders, growth relative to those with no education is minimal, with negative growth up until just before the 60th percentile and then increases on a rather flat trajectory not far from the origin. Interestingly, and in line with earlier results, for those with either a certificate or a degree that are among the lower percentiles – relative to those with no education – per capita expenditure growth is often negative, and, therefore, higher education does not have a pro-poor impact for Africans.
Unlike the picture painted for Africans above, the story for whites presented in the GIC below is one
Growth incidence curve for South Africa: 1995–2010
Gro
wth
rat
e (%
)
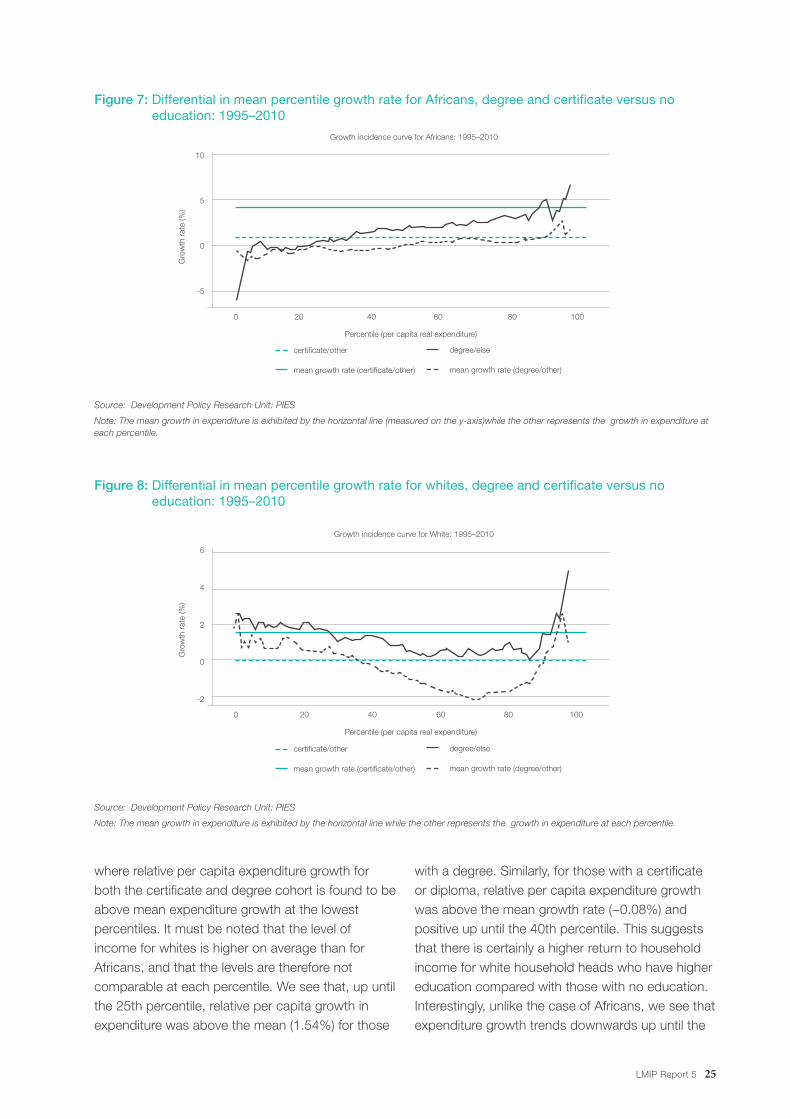
LMIP Report 5 25
Figure 7: Differential in mean percentile growth rate for Africans, degree and certificate versus no education: 1995–2010
Source: Development Policy Research Unit: PIES
Note: The mean growth in expenditure is exhibited by the horizontal line (measured on the y-axis)while the other represents the growth in expenditure at each percentile.
Figure 8: Differential in mean percentile growth rate for whites, degree and certificate versus no education: 1995–2010
Source: Development Policy Research Unit: PIES
Note: The mean growth in expenditure is exhibited by the horizontal line while the other represents the growth in expenditure at each percentile.
10
5
0
-5
0
Percentile (per capita real expenditure)
20 40 60 80 100
6
4
2
0
-2
0
Percentile (per capita real expenditure)
20 40 60 80 100
where relative per capita expenditure growth for both the certificate and degree cohort is found to be above mean expenditure growth at the lowest percentiles. It must be noted that the level of income for whites is higher on average than for Africans, and that the levels are therefore not comparable at each percentile. We see that, up until the 25th percentile, relative per capita growth in expenditure was above the mean (1.54%) for those
with a degree. Similarly, for those with a certificate or diploma, relative per capita expenditure growth was above the mean growth rate (−0.08%) and positive up until the 40th percentile. This suggests that there is certainly a higher return to household income for white household heads who have higher education compared with those with no education. Interestingly, unlike the case of Africans, we see that expenditure growth trends downwards up until the
Growth incidence curve for White: 1995–2010
Growth incidence curve for Africans: 1995–2010
Gro
wth
rat
e (%
)G
row
th r
ate
(%)
certificate/other
mean growth rate (certificate/other)
degree/else
mean growth rate (degree/other)
certificate/other
mean growth rate (certificate/other)
degree/else
mean growth rate (degree/other)
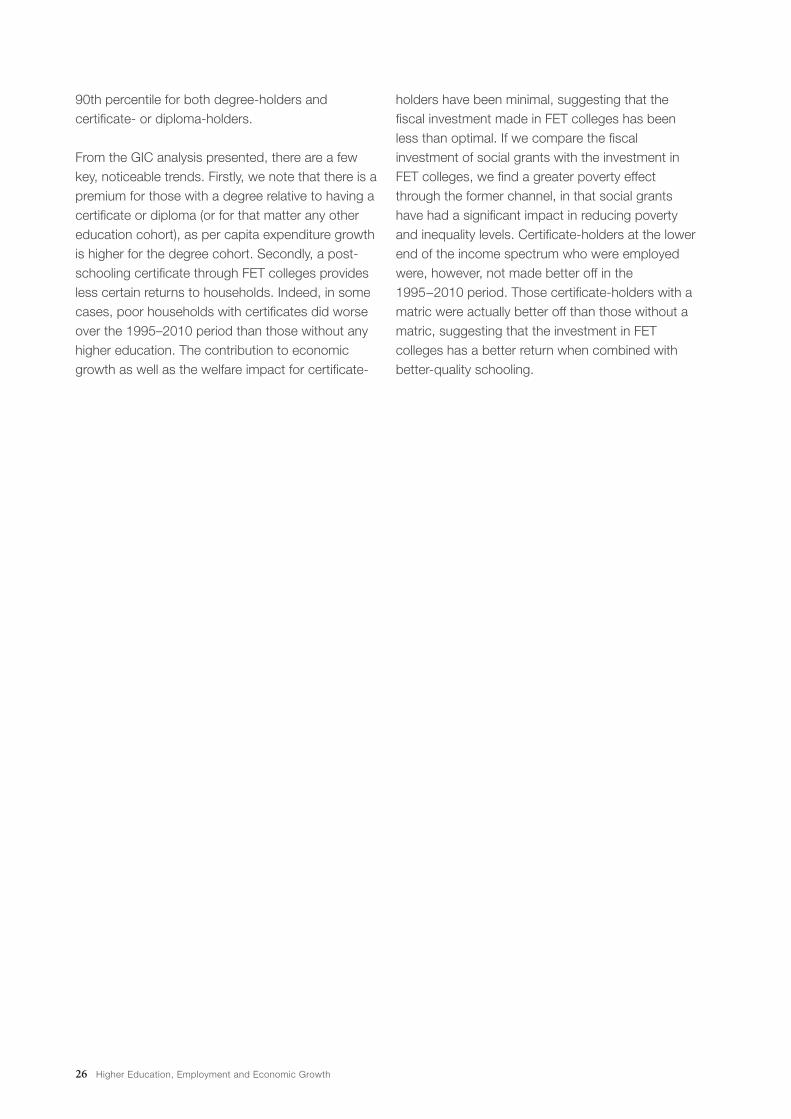
26 Higher Education, Employment and Economic Growth
90th percentile for both degree-holders and certificate- or diploma-holders.
From the GIC analysis presented, there are a few key, noticeable trends. Firstly, we note that there is a premium for those with a degree relative to having a certificate or diploma (or for that matter any other education cohort), as per capita expenditure growth is higher for the degree cohort. Secondly, a post-schooling certificate through FET colleges provides less certain returns to households. Indeed, in some cases, poor households with certificates did worse over the 1995–2010 period than those without any higher education. The contribution to economic growth as well as the welfare impact for certificate-
holders have been minimal, suggesting that the fiscal investment made in FET colleges has been less than optimal. If we compare the fiscal investment of social grants with the investment in FET colleges, we find a greater poverty effect through the former channel, in that social grants have had a significant impact in reducing poverty and inequality levels. Certificate-holders at the lower end of the income spectrum who were employed were, however, not made better off in the 1995−2010 period. Those certificate-holders with a matric were actually better off than those without a matric, suggesting that the investment in FET colleges has a better return when combined with better-quality schooling.
LMIP Report 5 27
6. CONCLUSION
The aim of this report was to investigate, descriptively and econometrically, the dynamics of the relationship between growth and education. Education is a strong predictor of labour market outcomes in terms of employment and earnings and is, in turn, a determinant of economic growth. A striking result of this research is the lack of contribution to economic growth from schooling as well as the certificate cohort. The only cohort that contributed significantly to economic growth as measured by the Olley and Pakes methodology was degree-holders – suggesting that this would be the most productive education cohort. This becomes evident if we consider South Africa’s labour demand trajectory that has systematically excluded lower levels of education, facilitating high rates of unemployment of school leavers. We find that employment grew for degree-holders in terms of high-skilled occupations, whereas the certificate cohort saw employment growth in the high- and medium- skilled cohort. Certificate-holders, however, also saw fairly high levels of unemployment, suggesting that there is an oversupply of this cohort in the market, and the varying occupational absorption at different skill levels is indicative of the wavering quality of the FET system. Those with no education saw declining employment growth. South African society, however, is on the whole more educated than it was in 1995. But, because of the low quality of schooling, we find more people with higher levels of education being employed to do tasks that could have been done by someone with lower education. This preliminary result is due to ‘grade-hiring inflation’, which, in a sense, has devalued certain qualifications.
The GIC analysis considered the relationship between economic growth and education by determining the distribution of growth gains for each higher-education
cohort. Degree-holders enjoy real per capita expenditure above the national growth rate and growth in per capita expenditure for a degree-holder is spread somewhat evenly across the income spectrum (except for those at the lower end of the distribution who show below-average growth rates). The growth gains in per capita expenditure for certificate-holders are far lower than the national average and also show no welfare impact for the poor, which yet again points to the inadequate outcomes of FET education. If we further disaggregate growth gains by race, we find that there are limited gains for Africans living in poverty compared with those for whites. The racial bias in terms of welfare alludes once again to the quality of education received prior to entering a higher-education system, as well a number of other socio-economic factors facing poor Africans related to accessibility of quality education among this group. While poverty levels are far less prevalent among those who have higher education, there remains a proportion of those with higher-education qualifications who live in poverty and who do not derive sufficient benefits from the growth process. Our analysis suggests that this is far more prevalent for individuals with FET certificates and diplomas (without a matric certificate), some of whom have been made worse off given their low levels of employability. The poor contribution to economic growth or personal welfare from FET (and related) graduates suggests, at one level, that the fiscal investment in FET colleges has not generated the desirable outcome. In this respect, it is critical that a more optimal return to this investment is realised for certificate-holders to truly gain from the growth process.
28 Higher Education, Employment and Economic Growth
REFERENCES
Aghion P & Howitt P (1998) Endogenous Growth Theory. Cambridge, MA: MIT Press
Arora A (2005) The emerging offshore software industries and the US economy, Brookings Trade Forum, pp. 399–409
Barro RJ (1991) Economic growth in a cross section of countries, Quarterly Journal of Economics, 56: 407–443
Barro RJ (1997) Determinants of Economic Growth: A Cross-country Empirical Study. Cambridge, MA: MIT Press
Barro RJ (2001) Human capital and growth, American Economic Review, 91(2): 12–17
Becker GS (1993) Human Capital: A Theoretical and Empirical Analysis, with Special Reference to Education. 3rd ed. Chicago: University of Chicago
Benhabib J & Spiegel MM (1994) The role of human capital in economic development: Evidence from aggregate cross-country data, Journal of Monetary Economics, 34(2): 143–173
Bhorat H, Van der Westhuizen C & Yu D (2013) The silent success: Delivery of public assets since democracy, DPRU Working Paper
Branson N & Wittenberg M (2014) Reweighting South African national household survey data to create a consistent series over time: A cross-entropy estimation approach, South African Journal of Economics 82(1): 19–38
Brynjolffson E & McAfee A (2014) The Second Machine Age: Work, Progress and Prosperity in a Time of Brilliant Technologies. WW Norton
Foster J, Greer J & Thorbecke E (1984) A class of decomposable poverty measures, Econometrica 52(3): 761–765
Hanushek EA (2013) Economic growth in developing countries: The role of human capital, Economics of Education Review 37: 204–212
Kerr A & Lam D (2012) Post-apartheid Labour Market Series 1994–2007 (dataset). Version 1.0.9. of the harmonised dataset based on Statistics SA’s OHS and LFS surveys, 1994–2007. Cape Town: DataFirst
Klasen S (2004) In search of the holy grail: How to achieve pro-poor growth? In: Krakowski M & Baden-Baden (eds), Attacking Poverty: What Makes Growth Pro-poor? pp. 63–93
Krueger AB & Lindahl M (2001) Education for growth: Why and for whom? Journal of Economic Literature, American Economic Association 39(4): 1101–1136
Lopez H (2004) Pro-poor-pro-growth: Is there a trade off? The World Bank Policy Brief. Washington DC: World Bank
Lucas R (1988) On the mechanics of economic development, Journal of Monetary Economics 22: 3–42
Mankiw NG, Romer D & Weil D (1992) Contribution to the empirics of economic growth, The Quarterly Journal of Economics 107(2): 407–437
Mayer M, Gordham S, Manxeba R, Hughes C, Foley P, Maroc C, Lolwana P & Nell M (2011) Towards a youth employment strategy for South Africa. Development Planning Division Working Paper Series No. 28. Halfway House, South Africa: Development Bank of Southern Africa, Development Planning Division
Mincer JA (1974) The human capital earnings function, in Schooling, Experience, and Earnings. Columbia University Press, pp. 83–96
Nelson R & Phelps E (1966) Investment in humans, technological diffusion, and economic growth, American Economic Review 56: 69–75
Olley S & Pakes A (1996) The dynamics of productivity in the telecommunications industry, Econometrica 64(6): 1263–1298
Pagan A & Ullah A (1999) Nonparametric Econometrics (Themes in Modern Econometrics). Cambridge University Press
Ravallion M (2001) Growth, inequality and poverty: Looking beyond averages, World Development 29(11): 1803–1815
Ravallion M (2003) Measuring aggregate welfare in developing countries: How well do national accounts and surveys agree? The Review of Economics and Statistics 85(3): 645–652
Ravallion M (2004) Pro-poor growth: A primer. Policy Research Working Paper No. 3378. March 2004
Ravallion M & Chen S (2003) Measuring pro−poor growth, Economics Letters 78(1): 93–99 (http://ideas.repec.org/a/eee/ecolet/v78y2003i1p93−99.html)
Ravallion M & Chen S (2004) How have the world’s poorest fared since the early 1980s? World Bank Research Observer 19(2): 141–170
Romer PM (1990) Human capital and growth: Theory and evidence. Carnegie–Rochester Conference Series on Public Policy 32(1): 251–286
Sala-I-Martin X, Doppelhofer G & Miller RI (2004) Determinants of long-term growth: A Bayesian averaging of classical estimates (BACE) approach, American Economic Review 94(4): 813–835
Sianesi B & Van Reenen J (2003) The returns to education: Macroeconomics, Journal of Economic Surveys 17(2): 157–200
Silverman BW (1986) Density Estimation for Statistics and Data Analysis. Chapman & Hall
Temple T (2001) Growth effects of education and social capital in the OECD countries, OECD Economic Studies 2001(2): 57–101
Van der Berg S, Burger C, Burger R, De Vos M, Du Rand G, Gustafsson M, Shepherd D, Spaull N, Taylor S, Van Broekhuizen H & Von Fintel D (2011) Low quality education

LMIP Report 5 29
as a poverty trap. Stellenbosch: University of Stellenbosch, Department of Economics
Wilson RA & Briscoe G (2005) The impact of human capital on economic growth: A review. In 3rd Report on European VET, Research, CEDEFOP, Luxemburg: Office for Official Publications of the European Communities.
30 Higher Education, Employment and Economic Growth
ENDNOTES
1. This was found for the 1960–1996 period after controlling for an East Asian dummy and 67 explanatory variables on a sample of 88 countries.
2. A growth incidence curve (GIC) plots the growth rate at each quintile of per capita income. If we rank households by per capita income from poorest to richest, we can use the welfare measure for a given quintile at two different points in time to calculate the growth rate for that quintile (Ravallion 2003; Ravallion & Chen 2004).
3. FET colleges offer a National Certificate Vocational (NCV), a National Diploma and a number of other specialised education and training programmes. The NCV programme can take up to three years and is offered in a number of fields, including built environment, tourism, education and development, mechanics, safety in society, and hospitality. The NCV was designed to replace the National Technical Certificate and has a Grade 12 or Grade 11 entry requirement, but may accept Grade 9 or 10 in exceptional cases. The National Diploma can be taken in certain Grade 12 subjects, small business management and financial management, which would often be taken by someone who has not obtained a matric qualification. For ease of reference, we term both certificate and diploma under ‘certificate’ in the analysis.
4. In terms of the Professionals category, we also see a 73.4% growth rate in professionals for the Grade 1 to 12 category, which is due to an approximate 72% growth in professionals for those with a Grade 12 qualification and not representative of those with lower than a Grade 12 qualification.
5. This change in shares may to some extent be the result of some data factors. Firstly, there may have been some sampling issues within data in the older surveys. This is unlikely as the OHS of 1995 has been extensively utilised by both local and international scholars and the authors also examined the distribution of shares for the professional occupation over time and found that the shares for degree-holders gradually diminished over time. Secondly, there may
be some definitional misunderstanding with the categorisation of the occupational code. The Standard Industrial Classification (SIC) of occupation was introduced in 1993 and there were many other definitional issues (e.g. certificate as an educational qualification).
6. This is one of the difficulties in interpreting simple elasticity, as it does not specify the differences between labour that is working and labour that is not working, but only does so generally. The labour force is being utilised as the common measure for labour.
7. Capital is measured by the rand value of tangible goods, including property, plant and equipment, that are expected to be used for more than one time period and are essentially used in the supply of goods.
8. The results estimated by Arora (2005) also find increasing returns to scale using inputs of labour (0.8) and capital (0.7) during the 1980–2003 period.
9. The R577 line refers to the food poverty line (R305 at March 2009 prices), plus the average amount derived from non-food expenditure of households whose total food expenditure was equal to the food poverty line. The lower-bound line of R416 per person per month refers to the food poverty line plus the average amount derived from non-food expenditure of households whose total expenditure was close to the food poverty line (See Statistics South Africa 2008:21,22 and Statistics South Africa 2012:5).
10. In 2010, there were far more outliers than in 1995 given the number of people that reported very low or zero expenditure that have been left out of the distribution for ease of comparison between the distributions.
11. A Kolmogorov–Smirnov (K–S) test was used to examine equality of distribution and it was found that the 1995 and 2010 per capita expenditure distribution differed by at least 0.1433.
12. Education levels of all the individuals in the household were not available; hence we resort to an imperfect measure of human capital accumulation within the household.

LMIP Report 5 31
LMIP – Labour Market Intelligence Partnership
Cutting-edge LMIP research on skills planning, labour markets, the economy, the post-school sector, artisan training and more, may be found on the project website www.lmip.org.za, where a specialised research repository holds all emerging research, including research reports, working papers, presentations and policy briefs as well as ‘grey’ literature on a range of topics relevant to skills planning.
LMIP Reports:
• Report 1: Occupational Shifts and Shortages: Skills challenges facing the South African economy. By Haroon Bhorat, Sumayya Goga and Benjamin Stanwix (2014)
• Report 2: Towards Understanding the Distinctive Nature of Artisan Training: Implications for skills planning in South Africa. By Nhlanhla Mbatha, Angelique Wildschut, Bongiwe Mncwango, Xolani Ngazimbi and Thembinkosi Twalo (2014)
• Report 3: Growth, Employment and Skills: The New Growth Path revisited. By Haroon Bhorat and Nan Tian (2014)
• Report 4: Responding to Shifting Demand for Skills: How do we get firms and post-school education and training organisations to work together? By Glenda Kruss, Il-haam Petersen, Simon McGrath and Michael Gastrow (2014)


W W W. L M I P.O R G . Z A