Embed Size (px)
Citation preview
PWRIPWRI
1st International Symposium on Rockfill Dams1st International Symposium on Rockfill Dams1st International Symposium on Rockfill Dams1st International Symposium on Rockfill Dams
PWRIPWRI
High-Precision Strength Evaluation of Rock Materials and
Stability Analysis for Rockfill Dams
HighHigh--Precision Strength Evaluation of Rock Materials Precision Strength Evaluation of Rock Materials and and
Stability Analysis for Rockfill DamsStability Analysis for Rockfill Dams
HirokiHiroki SAKAMOTOSAKAMOTOResearch EngineerResearch Engineer
Public Works Research Institute, JAPANPublic Works Research Institute, JAPAN
PWRIPWRIPWRIPWRIPWRIPWRI
ContentsContentsContentsIntroductionIntroductionPurposesPurposesLaboratory testsLaboratory tests
MaterialMaterialTest methodTest methodTest resultTest result
Sliding stability analysisSliding stability analysisAnalysis methodAnalysis methodAnalysis resultsAnalysis results
ConclusionsConclusions
PWRIPWRIPWRIPWRIPWRIPWRI
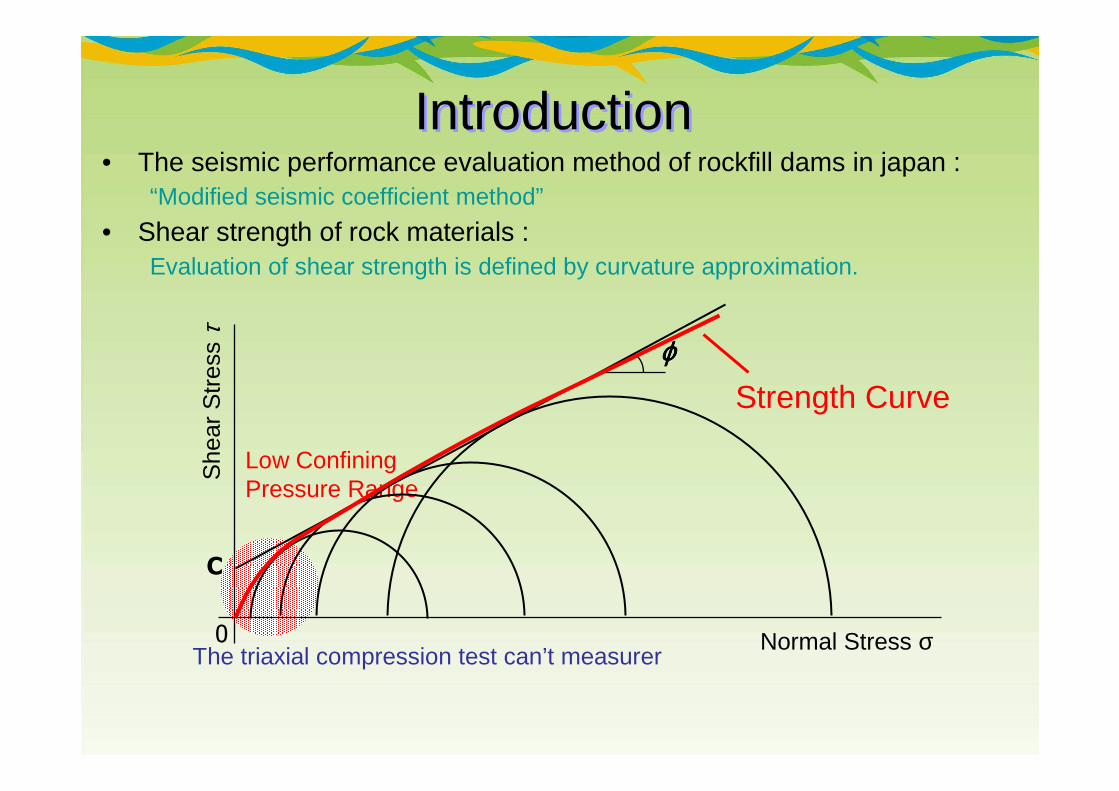
IntroductionIntroduction• The seismic performance evaluation method of rockfill dams in japan :
“Modified seismic coefficient method”
• Shear strength of rock materials :Evaluation of shear strength is defined by curvature approximation.
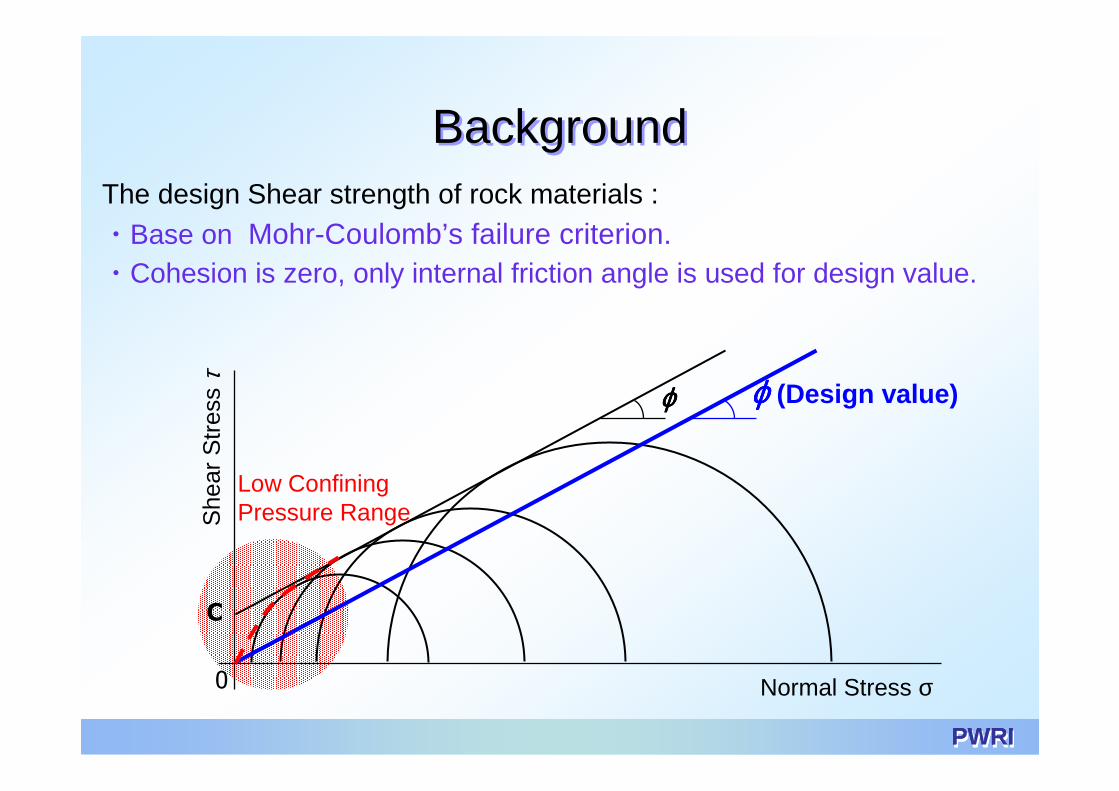
Low Confining Pressure Range
Normal Stress σ
She
ar S
tres
s τ
ϕϕϕϕ
C
0
Strength Curve
The triaxial compression test can’t measurer
PWRIPWRIPWRIPWRIPWRIPWRI
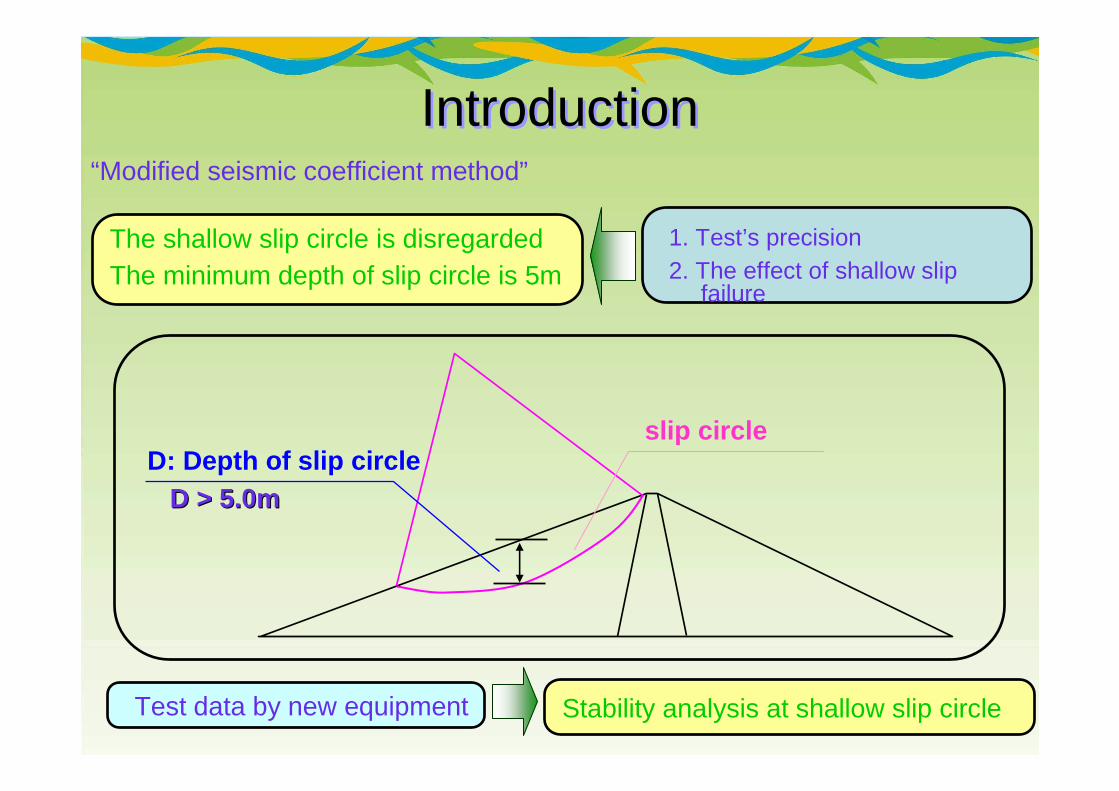
D: Depth of slip circle
“Modified seismic coefficient method”
IntroductionIntroduction
slip circle
D > 5.0mD > 5.0m
1. Test’s precision2. The effect of shallow slip
failure
The shallow slip circle is disregardedThe minimum depth of slip circle is 5m
Test data by new equipment Stability analysis at shallow slip circle
PWRIPWRIPWRIPWRIPWRIPWRI
PurposesPurposes
• Investigation of shear strength under low confining pressure condition;- Large-scale triaxial compression tests - Large-scale box shear tests
• Evaluation of shallow slip stability using above test results, in which the circle depth is less than 5m
PWRIPWRIPWRIPWRIPWRIPWRI
Laboratory testsLaboratory tests
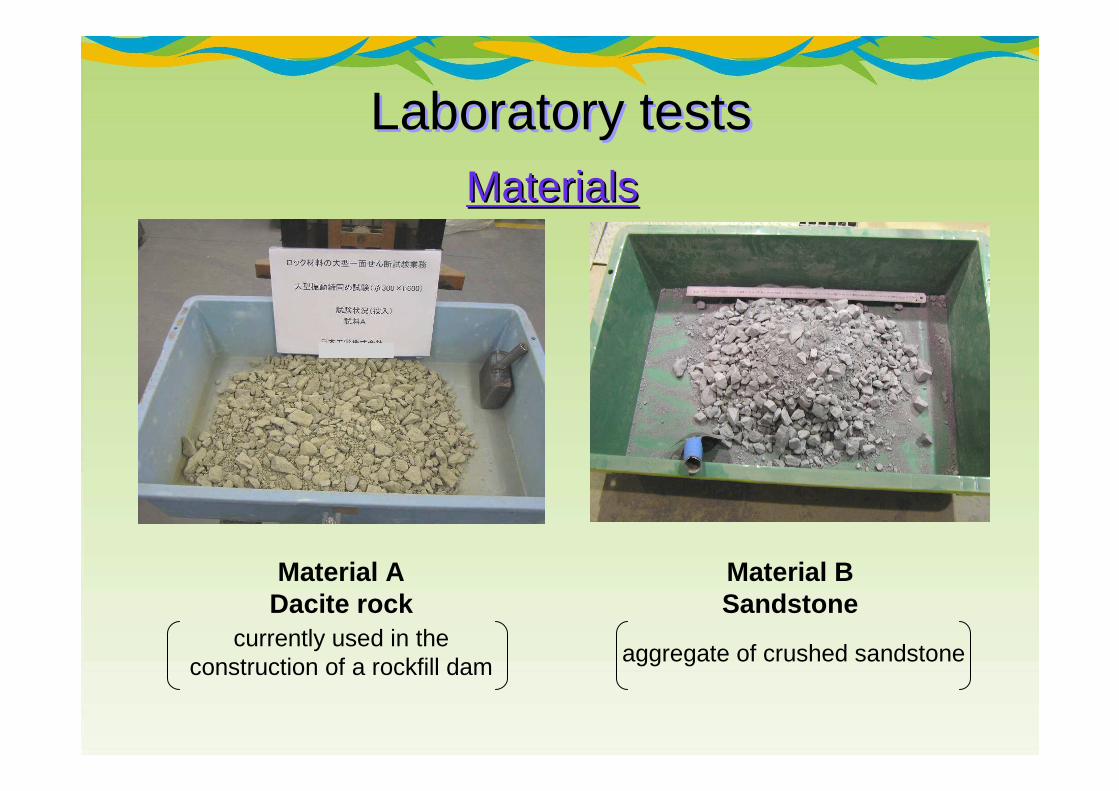
Material ADacite rock
Material BSandstone
currently used in the construction of a rockfill dam aggregate of crushed sandstone
MaterialsMaterials
PWRIPWRIPWRIPWRIPWRIPWRI
Laboratory testsLaboratory tests
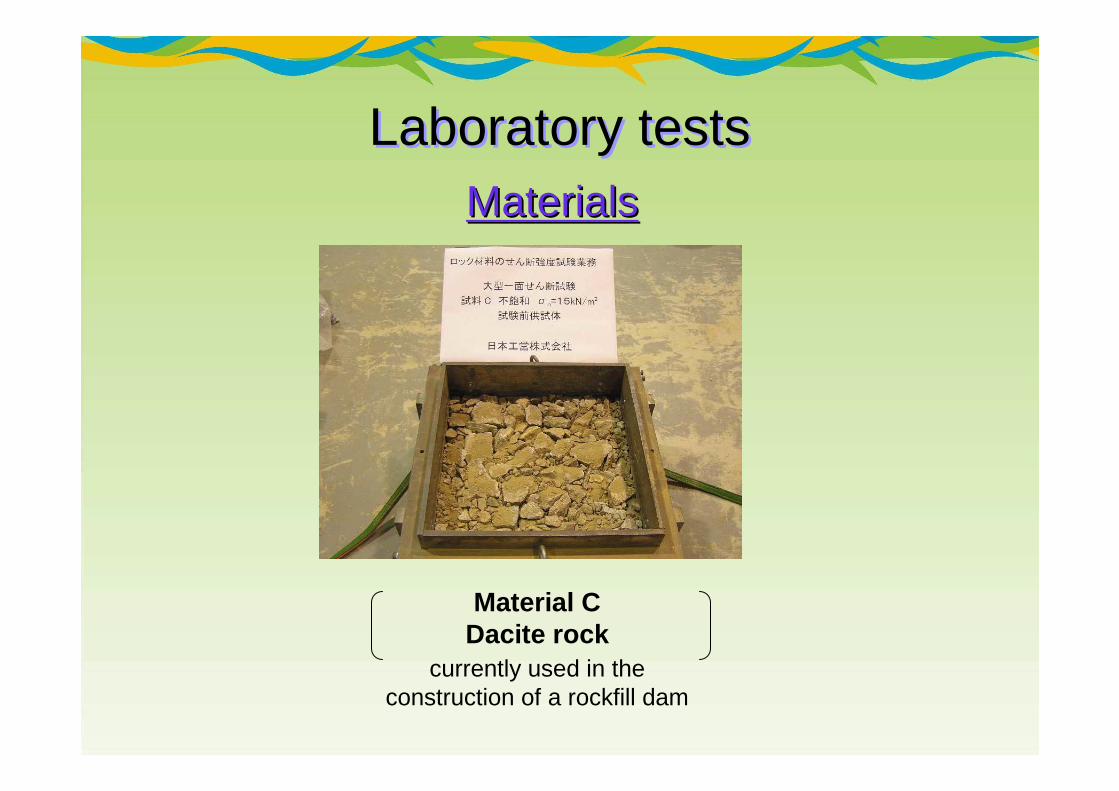
Material CDacite rock
currently used in the construction of a rockfill dam
MaterialsMaterials
PWRIPWRIPWRIPWRIPWRIPWRI
Test methodTest method
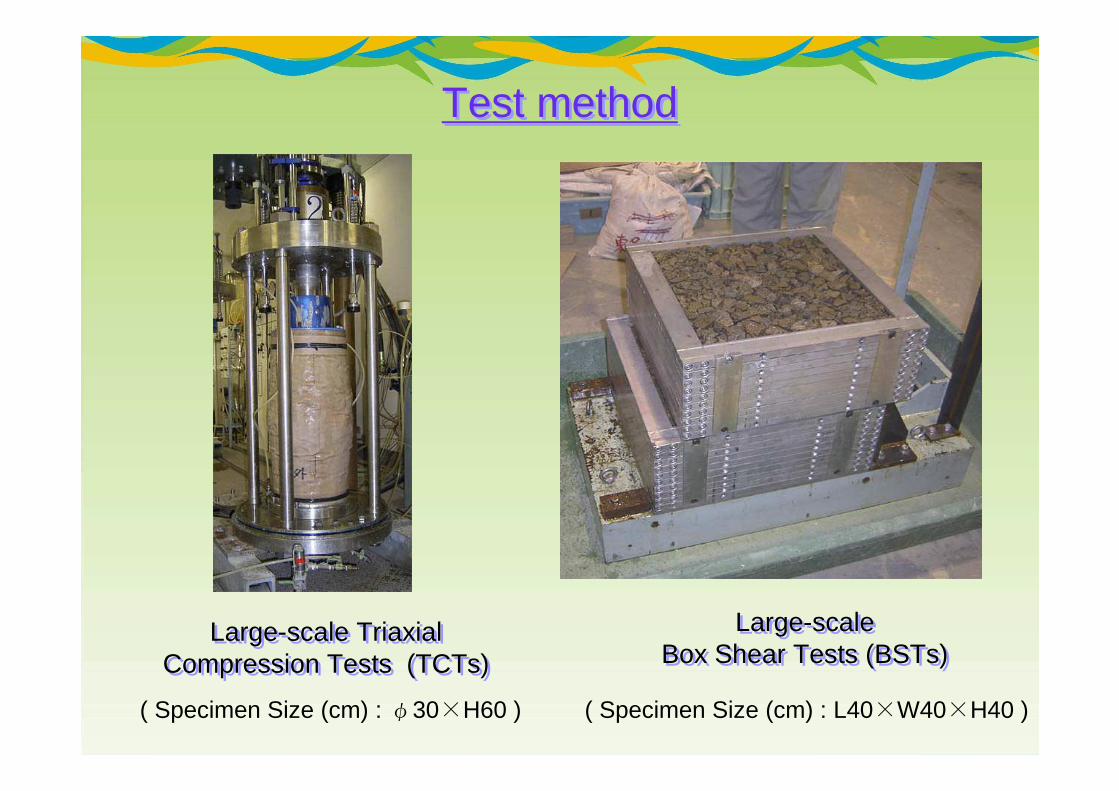
Large-scale TriaxialCompression Tests (TCTs)
Large-scale TriaxialCompression Tests (TCTs)
Large-scale Box Shear Tests (BSTs)
Large-scale Box Shear Tests (BSTs)
( Specimen Size (cm) : L40×W40×H40 )( Specimen Size (cm) : φ30×H60 )

PWRIPWRIPWRIPWRIPWRIPWRI
0
100
200
300
400
500
600
0 100 200 300 400 500 600Normal Stress σn (kPa)
Sh
ea
r S
tre
ss a
t F
ailu
re
τf
(kP
a)
Saturated
τf =3.2462・σn0.813
R2=0.997
Unsaturated
τf =4.968・σn0.759
R2=0.9973
● TCTs (Saturated)
○ BSTs (Saturated)
▲ TCTs (Unsaturated)
△ BSTs (Unsaturated)
・ Results can be plotted on a single power approximation curve.
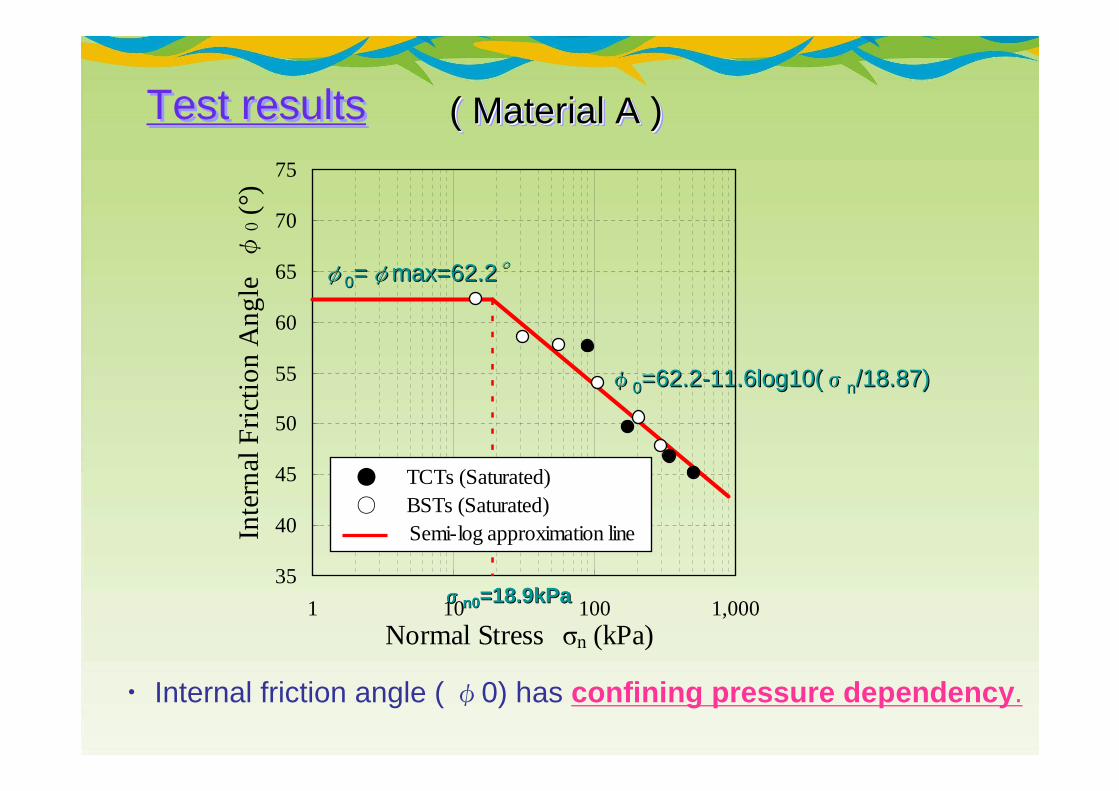
Test resultsTest results ( Material A )( Material A )( Material A )
PWRIPWRIPWRIPWRIPWRIPWRI
( Material A )( Material A )( Material A )
・ Internal friction angle ( φ0) has confining pressure dependency.
Test resultsTest results
φφ00==φφmaxmax=62.2=62.2°°
φφ00=62.2=62.2--11.6log10(11.6log10(σσnn/18.87)/18.87)
σσσσσσσσn0n0=18.9kPa=18.9kPa35
40
45
50
55
60
65
70
75
1 10 100 1,000Normal Stress σn (kPa)
Inte
rnal
Fri
ctio
n A
ng
le φ
0 (
°)
● TCTs (Saturated) ○ BSTs (Saturated) Semi-log approximation line
PWRIPWRIPWRIPWRIPWRIPWRI
Test results Test results
• We confirm that shear strength of rock materials can be approximated by curvature approximation method at low confining pressure range in which box shear test results exist.
• Shear strength of rock materials have confining pressure dependency.
PWRIPWRIPWRIPWRIPWRIPWRI
Sliding stability analysisSliding stability analysis
1: 2.10
1:0.2
1:0.2
1: 2.75
1: 2.10
1:0.2
1:0.2
コア ロック ロック1: 2
.751: 2.10
1:0.2
1:0.2
▽
h=92m
H=100m
6m2m 2m
Rock RockCore
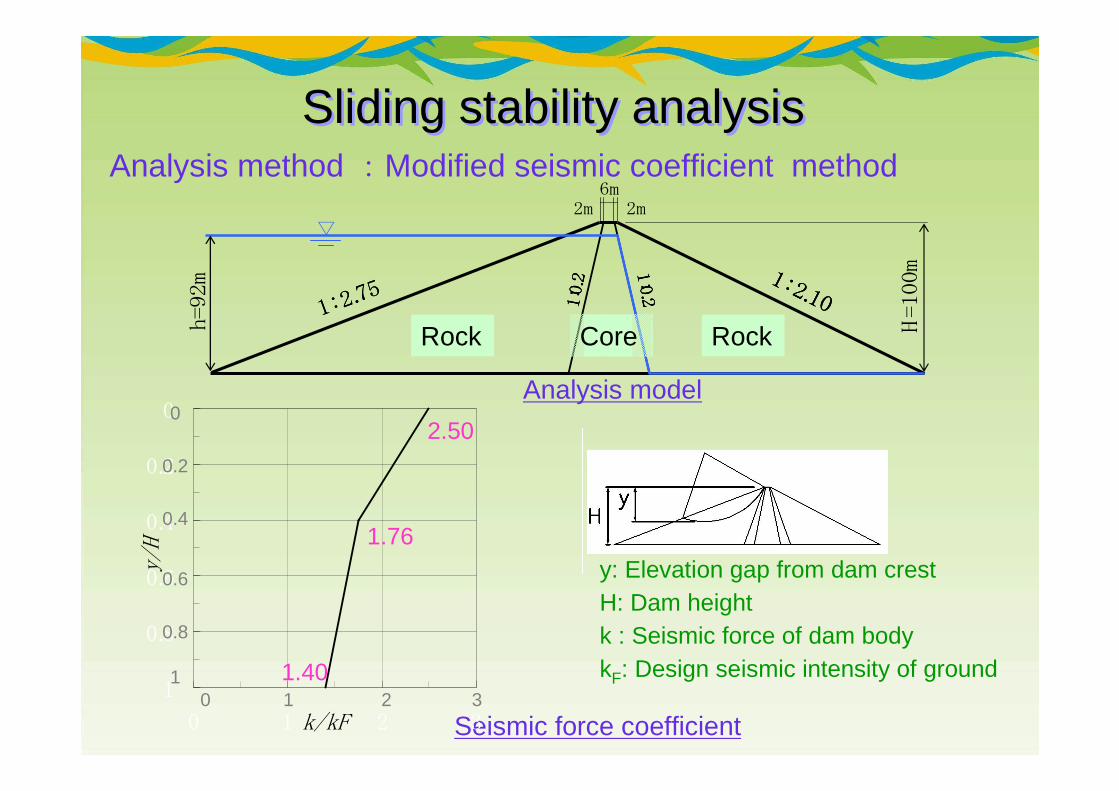
Analysis method :Modified seismic coefficient method
Analysis model
y: Elevation gap from dam crestH: Dam heightk : Seismic force of dam bodykF: Design seismic intensity of ground
Seismic force coefficient
0
0.2
0.4
0.6
0.8
1
0 1 2 3k/kF
y/H
0 1 2 31
0.8
0.6
0.4
0.2
0
1.40
1.76
2.50
PWRIPWRIPWRIPWRIPWRIPWRI
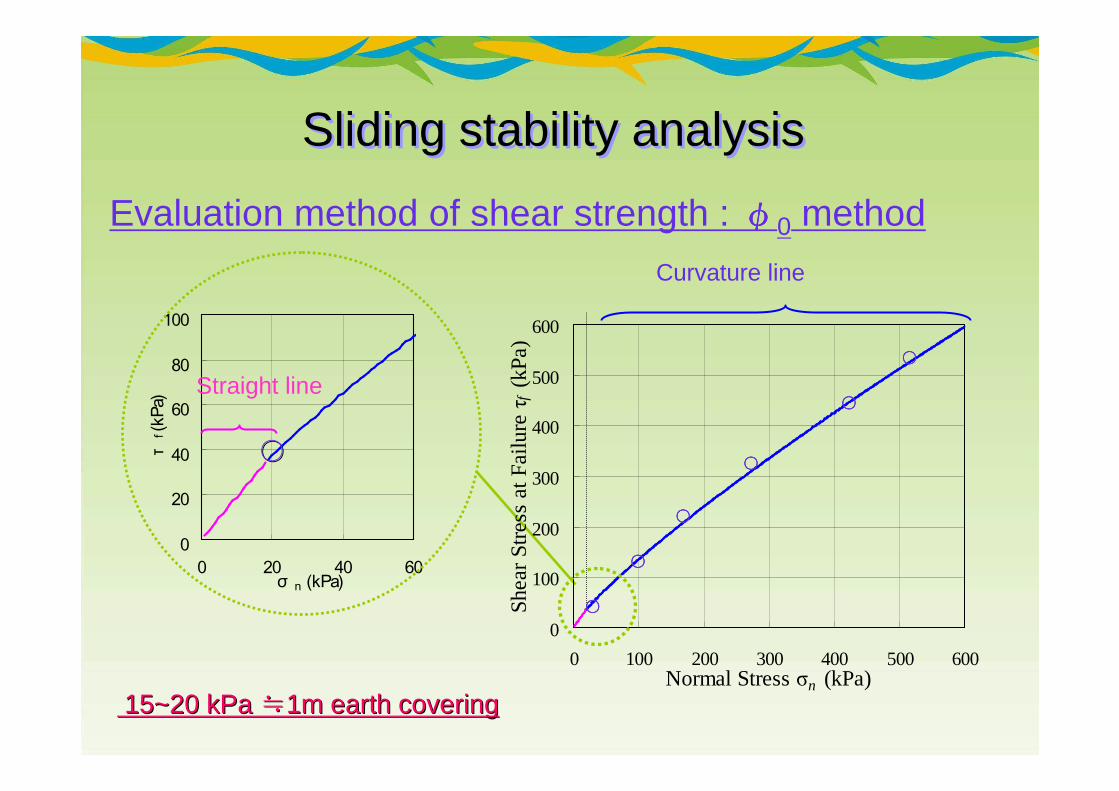
Sliding stability analysisSliding stability analysis
Evaluation method of shear strength : φφφφ0 method
0
20
40
60
80
100
0 20 40 60 σ n (kPa)
τf (k
Pa) Straight line
0
100
200
300
400
500
600
0 100 200 300 400 500 600Normal Stress σn (kPa)
She
ar
Str
ess
at
Fa
ilure
τ
f (k
Pa
)
Curvature line
○○○○
○○○○
○○○○
○○○○
○○○○
○○○○○○
15~20 15~20 kPakPa ≒≒1m earth covering1m earth covering
PWRIPWRIPWRIPWRIPWRIPWRI
Sliding stability analysisSliding stability analysis
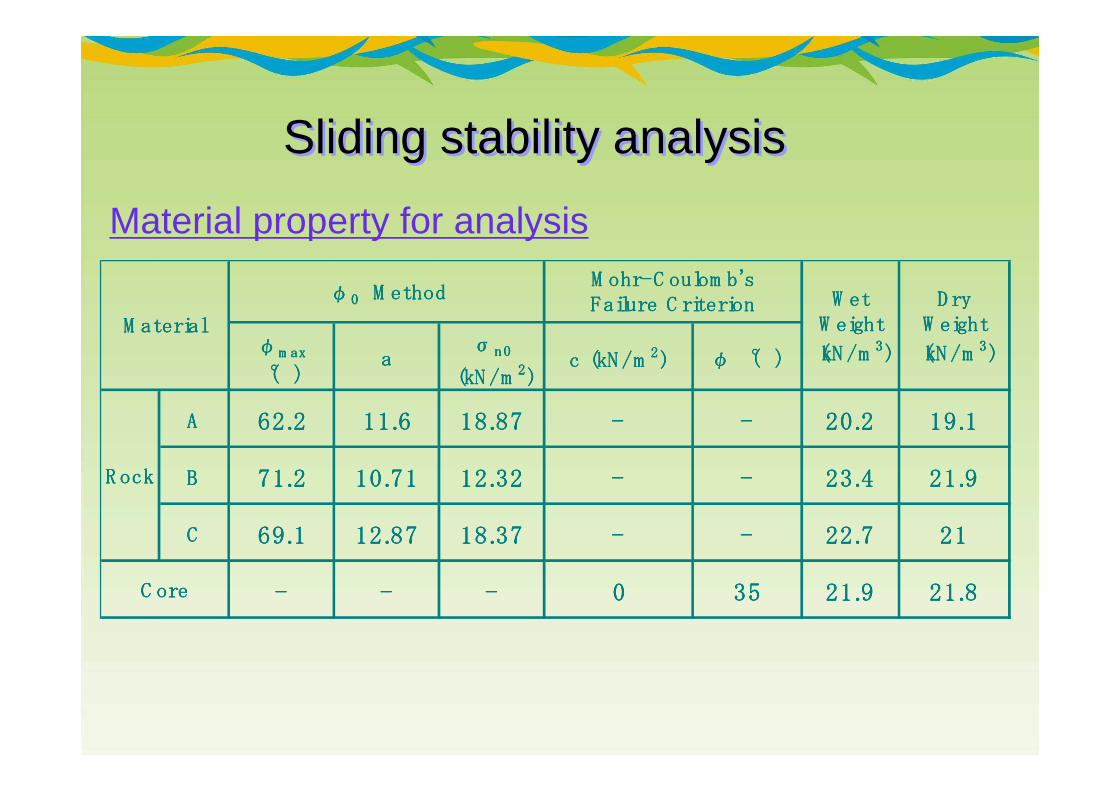
Material property for analysis
φφφφm axm axm axm ax
(°)(°)(°)(°)aaaa
σσσσn0n0n0n0
(kN /m (kN /m (kN /m (kN /m 2222))))c (kN /mc (kN /mc (kN /mc (kN /m 2222)))) φ (°)φ (°)φ (°)φ (°)
AAAA 62.262.262.262.2 11.611.611.611.6 18.8718.8718.8718.87 ---- ---- 20.220.220.220.2 19.119.119.119.1
BBBB 71.271.271.271.2 10.7110.7110.7110.71 12.3212.3212.3212.32 ---- ---- 23.423.423.423.4 21.921.921.921.9
CCCC 69.169.169.169.1 12.8712.8712.8712.87 18.3718.3718.3718.37 ---- ---- 22.722.722.722.7 21212121
---- ---- ---- 0000 35353535 21.921.921.921.9 21.821.821.821.8
W etW etW etW etW eightW eightW eightW eight
(kN /m(kN /m(kN /m(kN /m 3333))))
D ryD ryD ryD ryW eightW eightW eightW eight
(kN /m(kN /m(kN /m(kN /m 3333))))
C oreC oreC oreC ore
M aterialM aterialM aterialM aterial
φφφφ0 0 0 0 M ethod M ethod M ethod M ethodM ohr-C oulom b'sM ohr-C oulom b'sM ohr-C oulom b'sM ohr-C oulom b'sFailure C riterionFailure C riterionFailure C riterionFailure C riterion
R ockR ockR ockR ock

PWRIPWRIPWRIPWRIPWRIPWRI
Sliding stability analysisSliding stability analysisAnalysis results
AAAA BBBB CCCC
upstreamupstreamupstreamupstream 15.615.615.615.6 27.427.427.427.4 33.533.533.533.5
donw streamdonw streamdonw streamdonw stream 30.930.930.930.9 30.530.530.530.5 40.140.140.140.1
upstreamupstreamupstreamupstream 1.1561.1561.1561.156 1.6421.6421.6421.642 1.4641.4641.4641.464
donw streamdonw streamdonw streamdonw stream 1.3931.3931.3931.393 1.8421.8421.8421.842 1.6401.6401.6401.640
M aterialM aterialM aterialM aterial
SF SF SF SFm inm inm inm in
D at SF D at SF D at SF D at SFm inm inm inm in (m ) (m ) (m ) (m )
・ Shallower slip circle than 5m don’t have minimum safety factor.
SFmin: Minimum Safety Factor
slip circleD: Depth of slip circle
PWRIPWRIPWRIPWRIPWRIPWRI
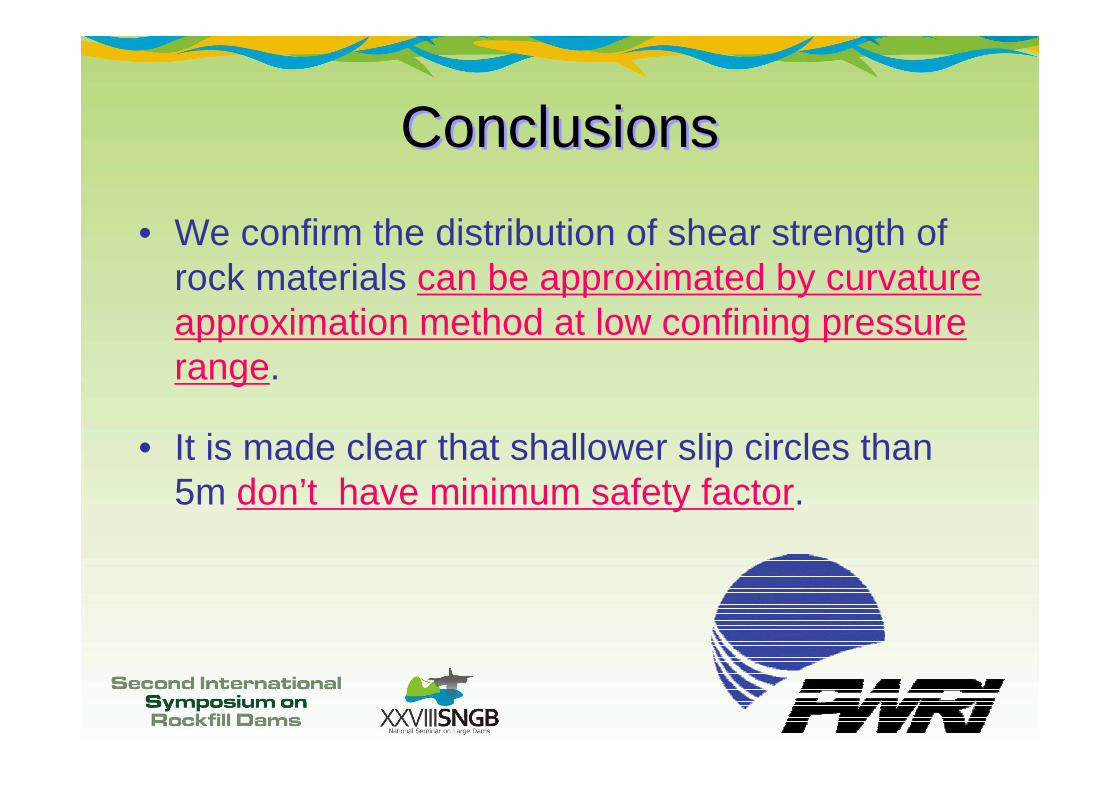
ConclusionsConclusions
• We confirm the distribution of shear strength of rock materials can be approximated by curvature approximation method at low confining pressure range.
• It is made clear that shallower slip circles than 5m don’t have minimum safety factor.
PWRIPWRIPWRIPWRIPWRIPWRI
Thank youfor your kind attention!
Thank youfor your kind attention!
PWRIPWRIPWRIPWRIPWRIPWRI
ReferenceReference
PWRIPWRIPWRIPWRIPWRIPWRI
Low Confining Pressure Range
BackgroundBackgroundThe design Shear strength of rock materials :
・Base on Mohr-Coulomb’s failure criterion.・Cohesion is zero, only internal friction angle is used for design value.
Normal Stress σ
She
ar S
tres
s τ
ϕϕϕϕ
C
0
ϕϕϕϕ (Design value)
PWRIPWRIPWRIPWRIPWRIPWRI
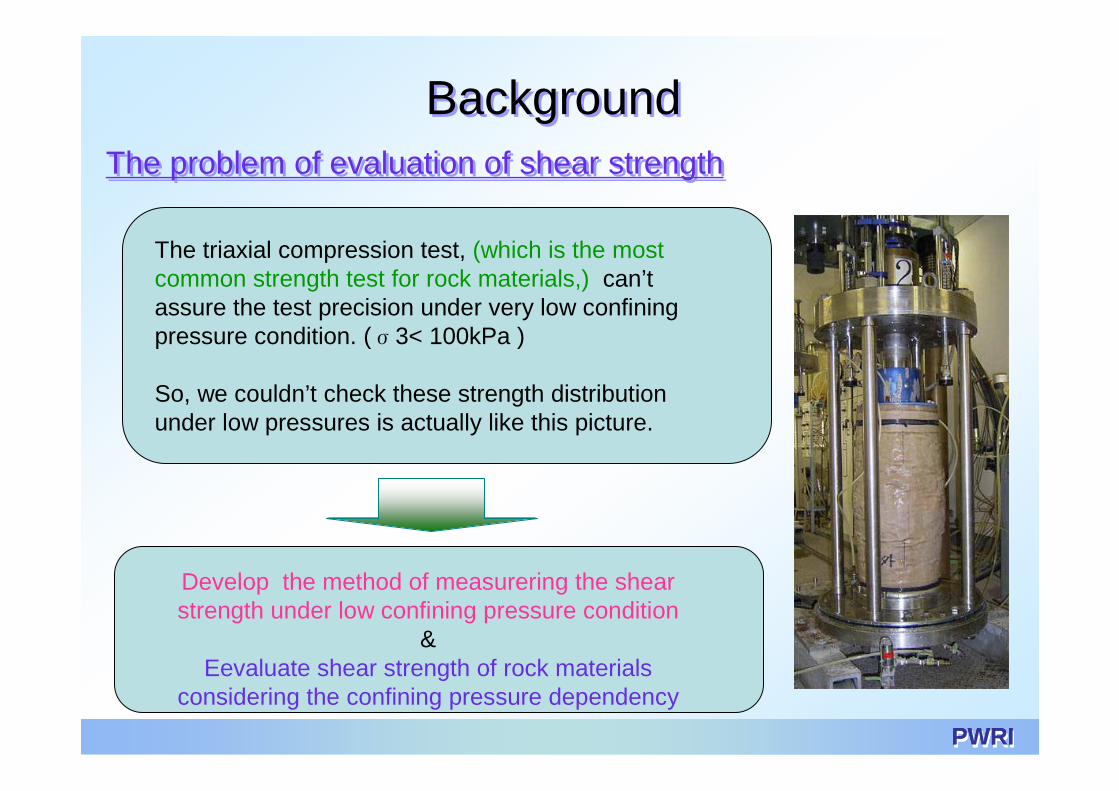
BackgroundBackgroundThe problem of evaluation of shear strengthThe problem of evaluation of shear strength
The triaxial compression test, (which is the most common strength test for rock materials,) can’t assure the test precision under very low confining pressure condition. (σ3< 100kPa )
So, we couldn’t check these strength distribution under low pressures is actually like this picture.
Develop the method of measurering the shear strength under low confining pressure condition
&Eevaluate shear strength of rock materials
considering the confining pressure dependency
PWRIPWRIPWRIPWRIPWRIPWRI
0
20
40
60
80
100
0.01 0.1 1 10 100
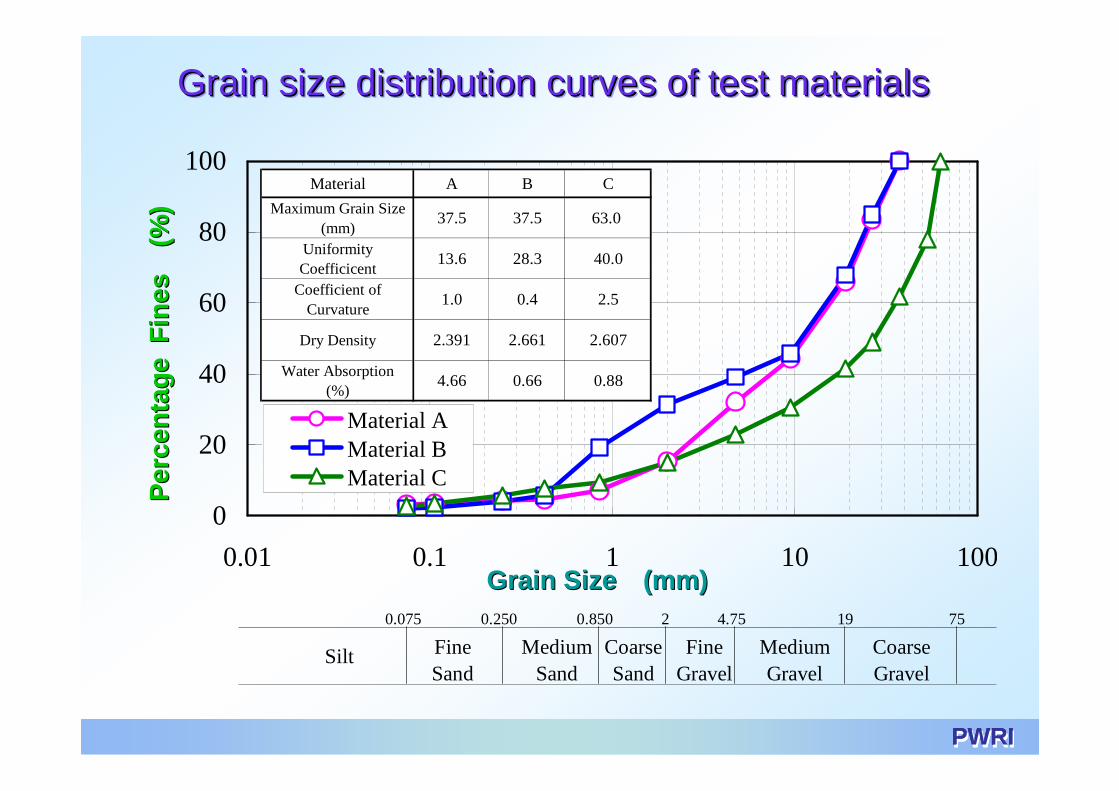
Material AMaterial BMaterial C
Silt FineSand
MediumSand
CoarseSand
FineGravel
CoarseGravel
MediumGravel
0.075 0.250 0.850 4.75 19 752
Material A B C
Maximum Grain Size(mm)
37.5 37.5 63.0
UniformityCoefficicent
13.6 28.3 40.0
Coefficient ofCurvature
1.0 0.4 2.5
Dry Density 2.391 2.661 2.607
Water Absorption(%)
4.66 0.66 0.88
Grain size distribution curves of test materialsGrain size Grain size distribudistribution curves of test materialstion curves of test materials
Grain SizeGrain Size (mm)(mm)
Per
cen
tag
e F
ines
Per
cen
tag
e F
ines
(%)
(%)
PWRIPWRIPWRIPWRIPWRIPWRI
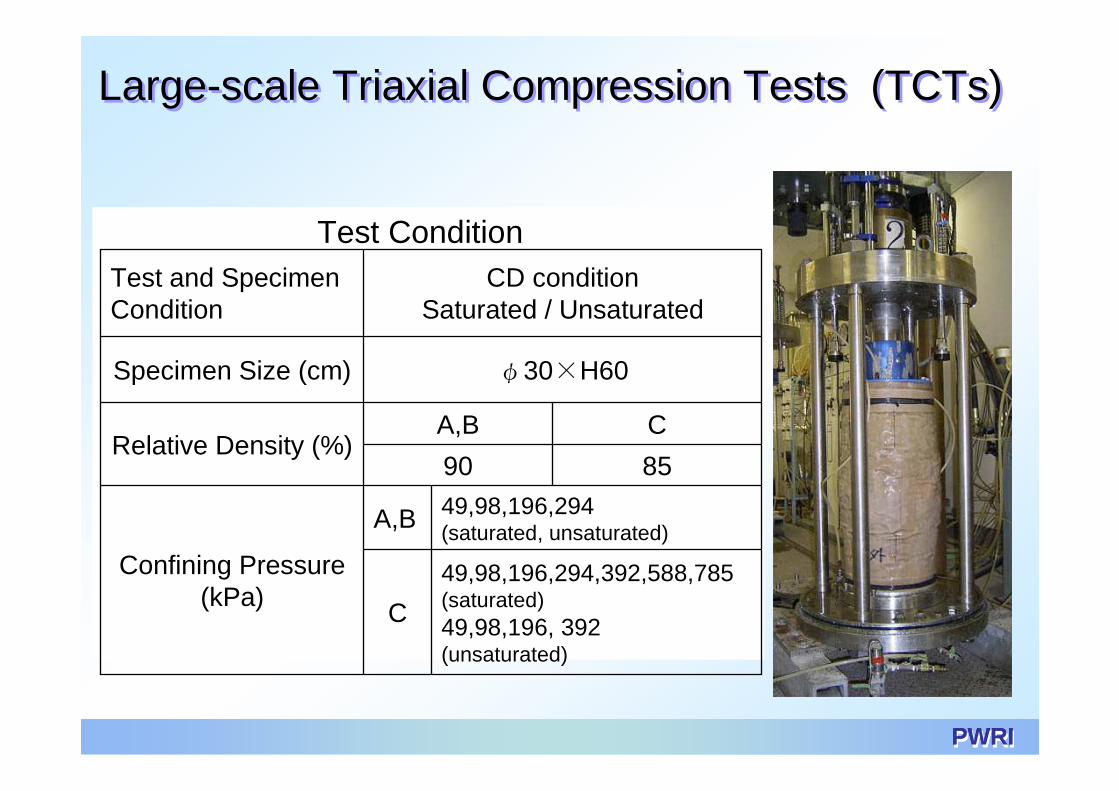
Large-scale Triaxial Compression Tests (TCTs)Large-scale Triaxial Compression Tests (TCTs)
Test Condition
8590
C
49,98,196,294,392,588,785(saturated)49,98,196, 392(unsaturated)
C
49,98,196,294(saturated, unsaturated)
A,B
Confining Pressure(kPa)
A,BRelative Density (%)
φ30×H60Specimen Size (cm)
CD conditionSaturated / Unsaturated
Test and Specimen Condition
PWRIPWRIPWRIPWRIPWRIPWRI
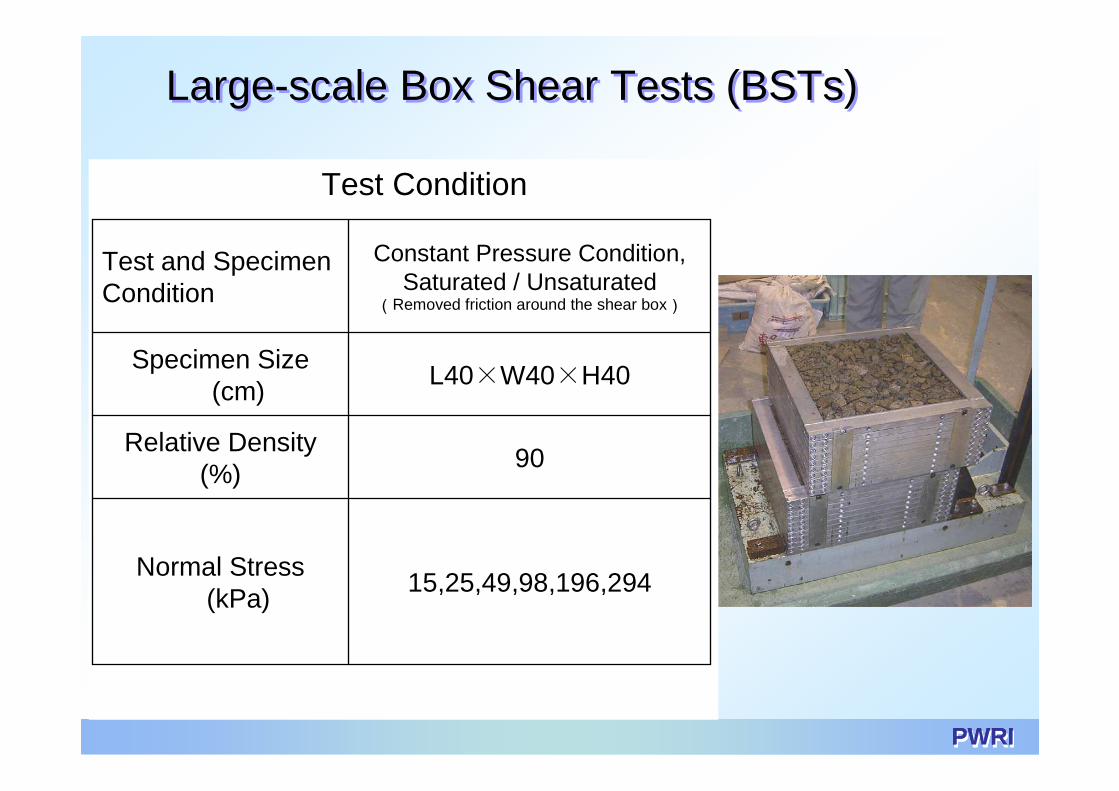
Large-scale Box Shear Tests (BSTs)Large-scale Box Shear Tests (BSTs)
σnVerticalRoller
τ
ReactionPlate
WaterproofSheet
SpecimenWater Tank
WaterproofSheet
Water
Water40cm
40cm
Horizontal Adjustment Bar
Loading Plate
Normal Stress
Shear Stress
HorizontalRoller
Spacer
Test Condition
15,25,49,98,196,294Normal Stress
(kPa)
90Relative Density
(%)
L40×W40×H40Specimen Size
(cm)
Constant Pressure Condition,Saturated / Unsaturated
(Removed friction around the shear box)
Test and SpecimenCondition
PWRIPWRIPWRIPWRIPWRIPWRI
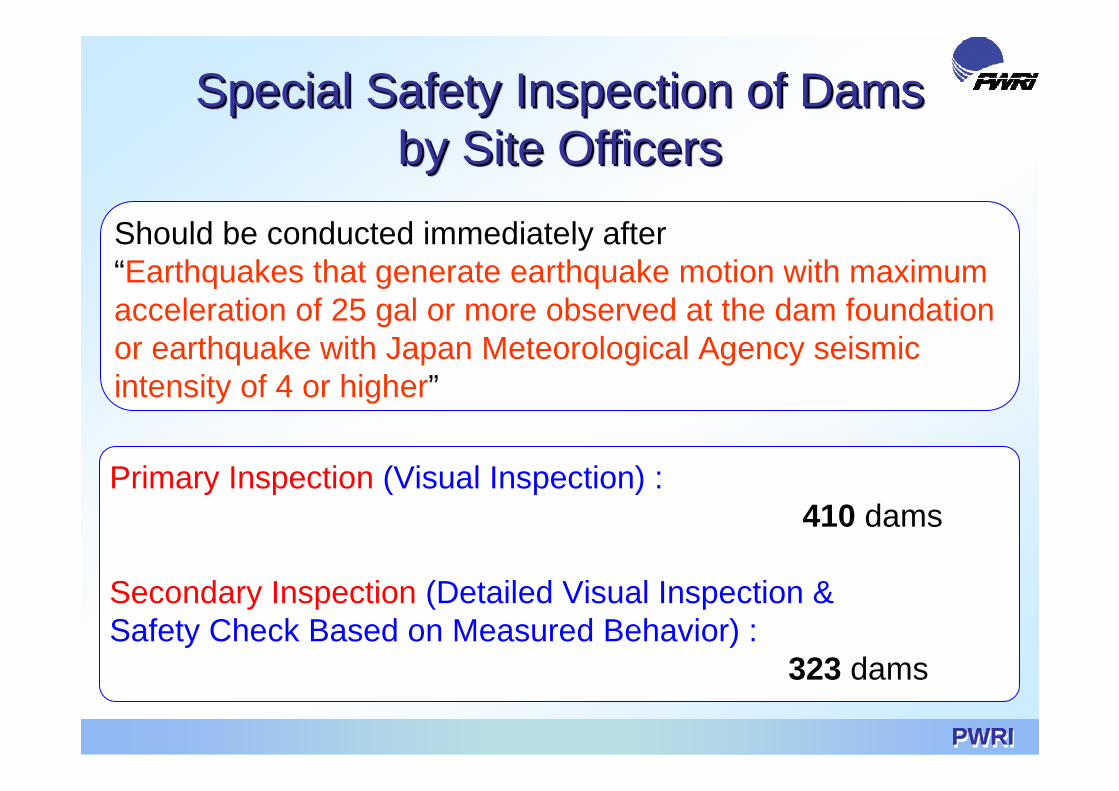
Special Safety Inspection of Damsby Site Officers
Special Safety Inspection of DamsSpecial Safety Inspection of Damsby Site Officersby Site Officers
Primary Inspection (Visual Inspection) :410 dams
Secondary Inspection (Detailed Visual Inspection & Safety Check Based on Measured Behavior) :
323 dams
Should be conducted immediately after“Earthquakes that generate earthquake motion with maximum acceleration of 25 gal or more observed at the dam foundation or earthquake with Japan Meteorological Agency seismic intensity of 4 or higher”
PWRIPWRIPWRIPWRIPWRIPWRI
Results of Special Safety InspectionResults of Special Safety InspectionResults of Special Safety Inspection
• No severe damage which affects the safety of dams was reported.
• Cracks generated at dam crest and/or spillway, and increase in leakage/seepage through dam bodies and/or their foundation were reported at several dams.
• Dam owners continued careful monitoring of dam behavior, and made detailed investigation and repair of their damage.
PWRIPWRIPWRIPWRIPWRIPWRI
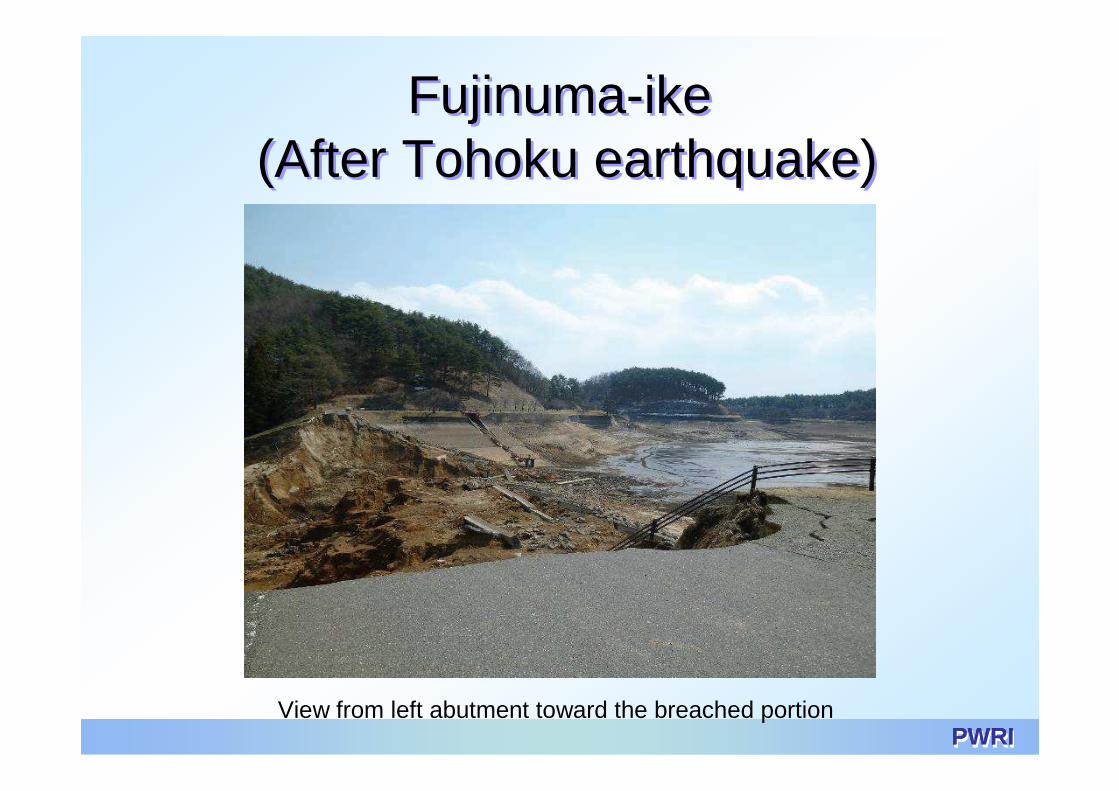
Fujinuma-ike(After Tohoku earthquake)
Fujinuma-ike(After Tohoku earthquake)
View from left abutment toward the breached portion