Embed Size (px)
Citation preview
Highlights from the USAID Joint Behavior Change Communication Survey
Douglas Storey, PhDJHU CCP Director for Communication Science & Research∙
UHMG Annual Event4 June 2013
Kampala, Uganda
Achieving and Documenting Impact at Scale
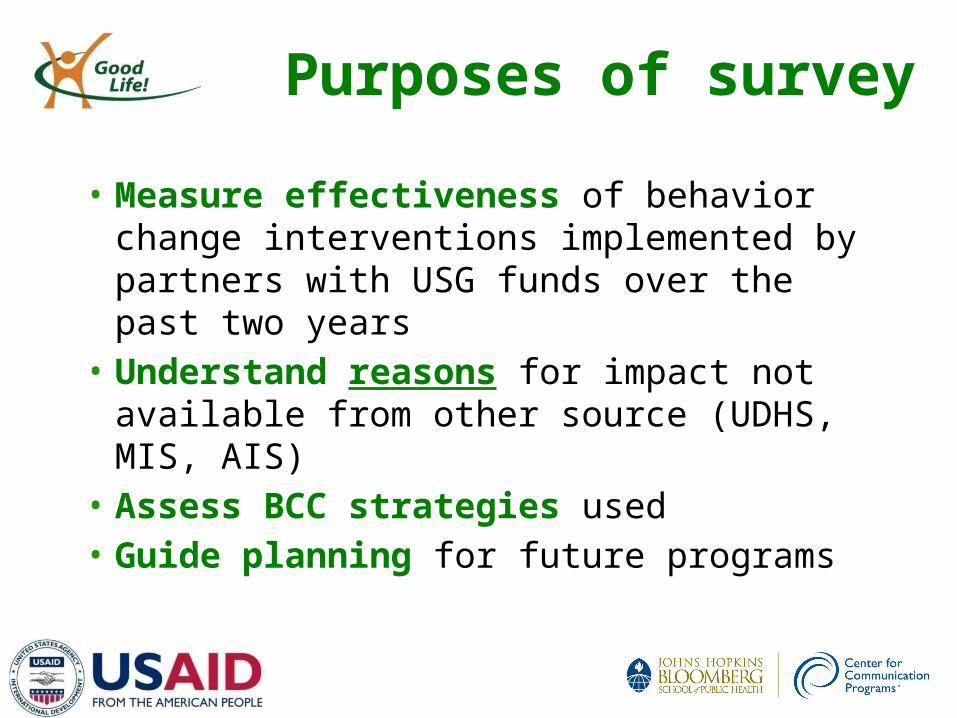
Purposes of survey
• Measure effectiveness of behavior change interventions implemented by partners with USG funds over the past two years
• Understand reasons for impact not available from other source (UDHS, MIS, AIS)
• Assess BCC strategies used• Guide planning for future programs
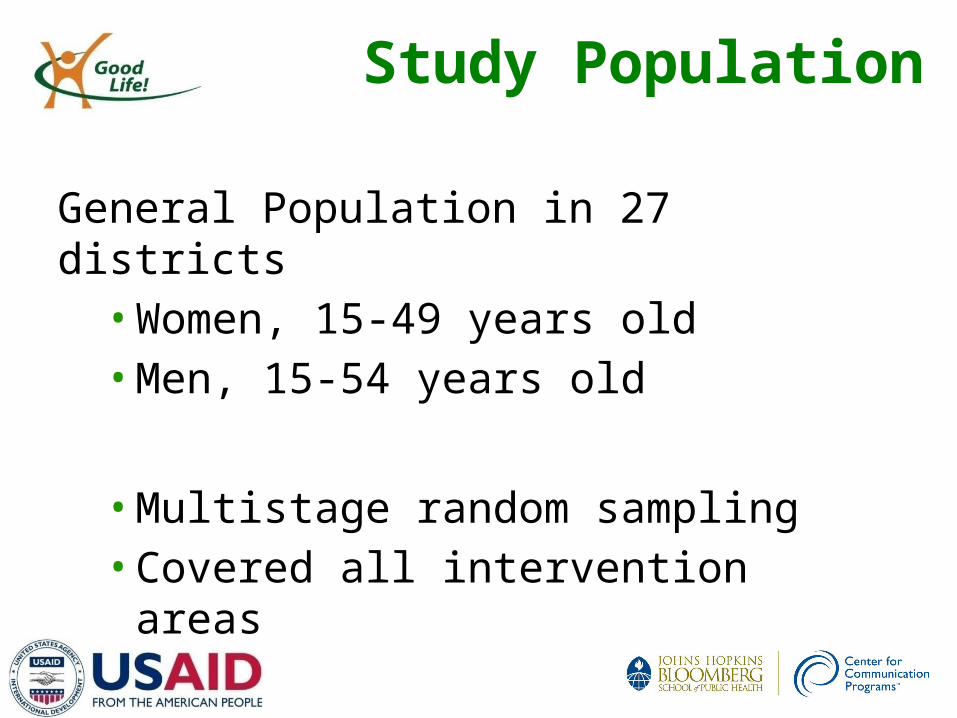
Study Population
General Population in 27 districts• Women, 15-49 years old• Men, 15-54 years old
• Multistage random sampling• Covered all intervention areas
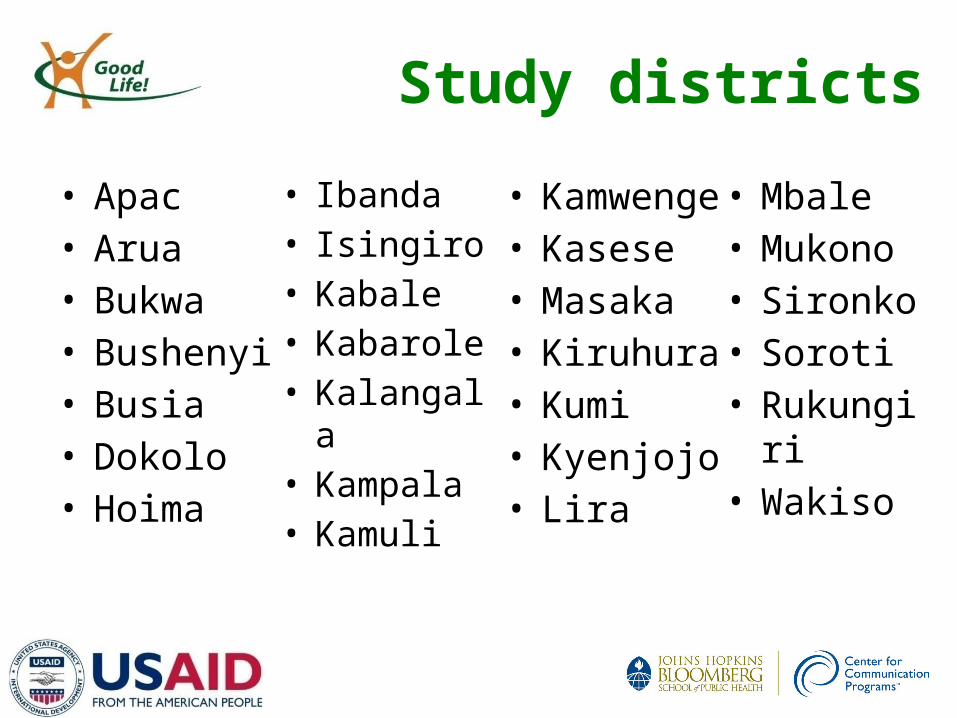
Study districts
• Apac• Arua• Bukwa• Bushenyi• Busia• Dokolo• Hoima
• Ibanda• Isingiro• Kabale• Kabarole• Kalangala• Kampala• Kamuli
• Kamwenge• Kasese• Masaka• Kiruhura• Kumi• Kyenjojo• Lira
• Mbale• Mukono• Sironko• Soroti• Rukungiri• Wakiso
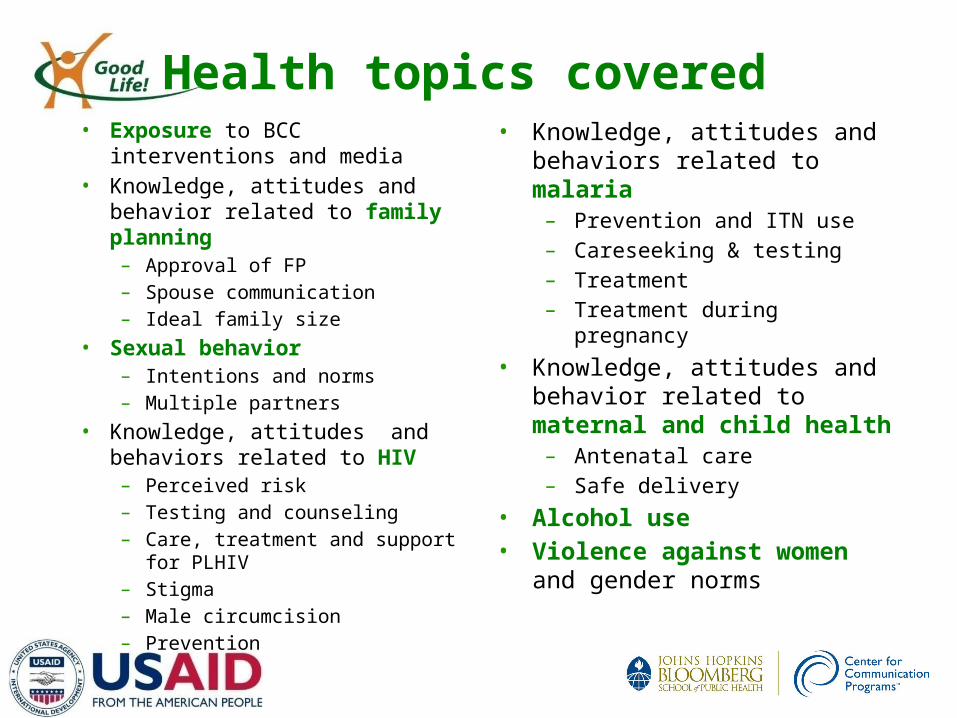
Health topics covered • Exposure to BCC interventions and
media• Knowledge, attitudes and behavior
related to family planning– Approval of FP– Spouse communication– Ideal family size
• Sexual behavior– Intentions and norms– Multiple partners
• Knowledge, attitudes and behaviors related to HIV
– Perceived risk– Testing and counseling– Care, treatment and support for
PLHIV– Stigma– Male circumcision– Prevention
• Knowledge, attitudes and behaviors related to malaria
– Prevention and ITN use– Careseeking & testing– Treatment– Treatment during pregnancy
• Knowledge, attitudes and behavior related to maternal and child health
– Antenatal care– Safe delivery
• Alcohol use• Violence against women and gender
norms
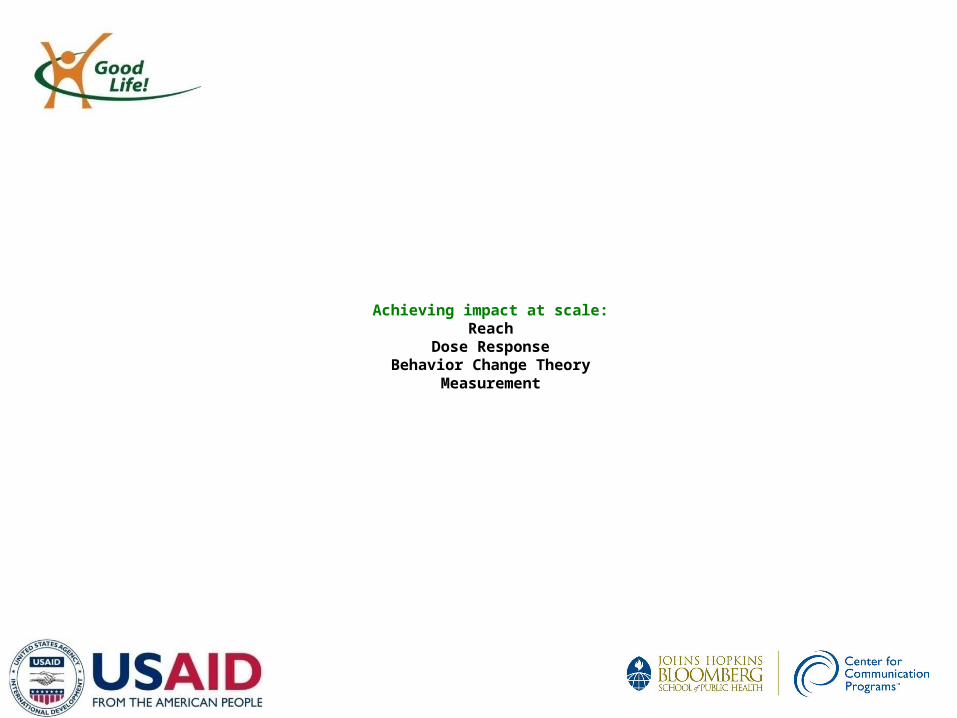
Achieving impact at scale:Reach
Dose ResponseBehavior Change Theory
Measurement
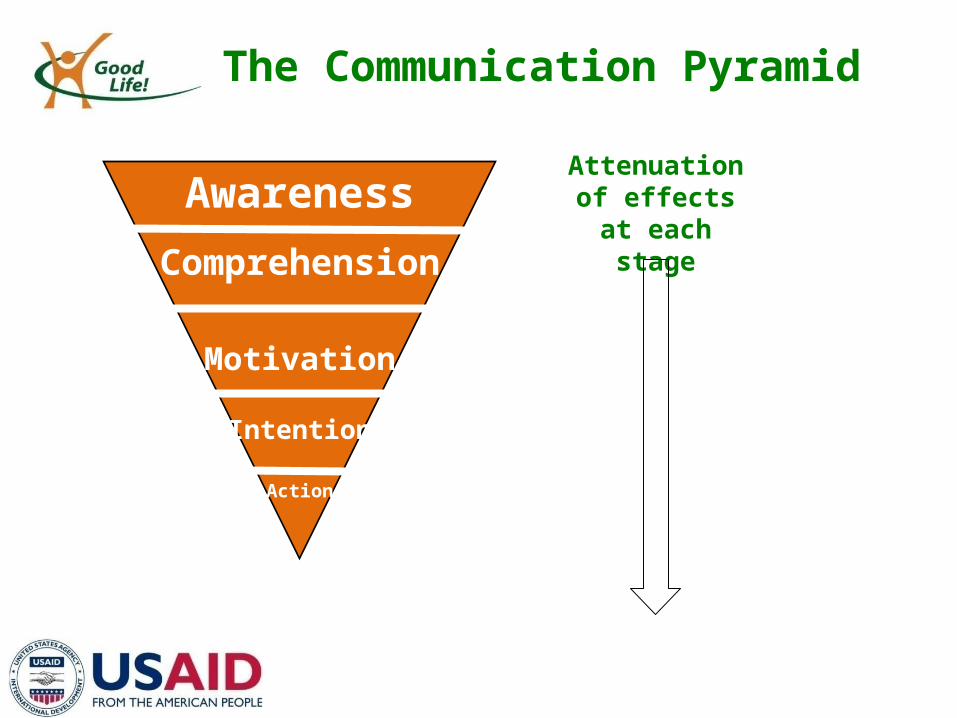
Awareness
Comprehension
Motivation
Intention
Action
The Communication Pyramid
Attenuation of effects at each stage
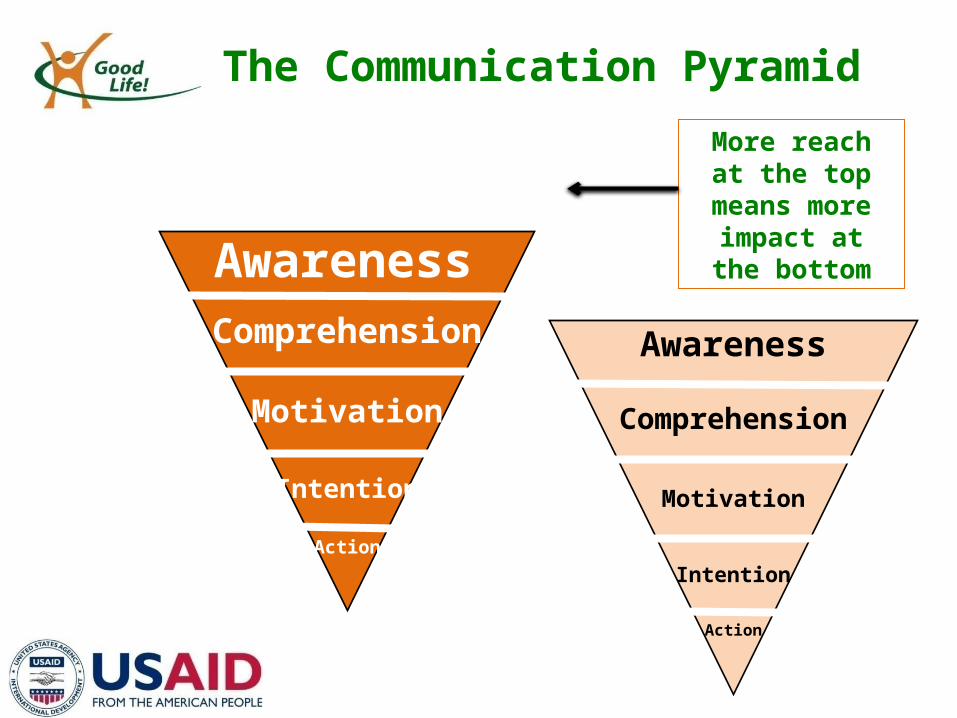
Awareness
Comprehension
Motivation
Intention
Action
The Communication Pyramid
More reach at the top
means more impact at the
bottomAwarenessComprehension
Motivation
Intention
Action
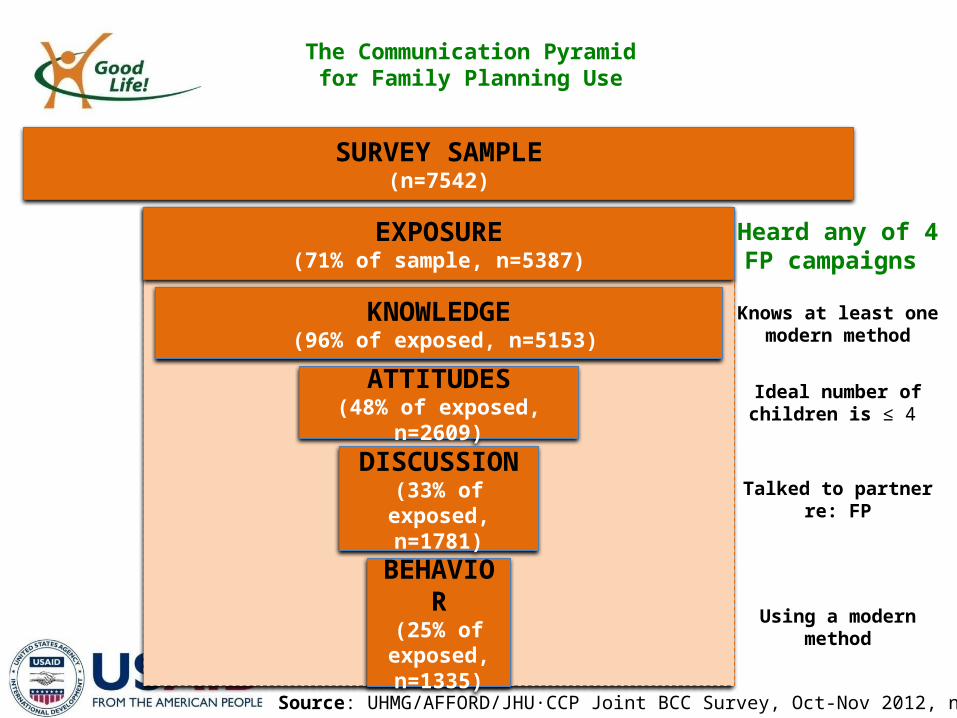
SURVEY SAMPLE(n=7542)
EXPOSURE(71% of sample, n=5387)
ATTITUDES(48% of exposed, n=2609)
KNOWLEDGE (96% of exposed, n=5153)
DISCUSSION(33% of exposed,
n=1781)
BEHAVIOR(25% of
exposed, n=1335)
Heard any of 4FP campaigns
Knows at least onemodern method
Talked to partnerre: FP
Using a modernmethod
The Communication Pyramidfor Family Planning Use
Ideal number ofchildren is ≤ 4
Source: UHMG/AFFORD/JHU CCP Joint BCC Survey, Oct-Nov 2012, n=7542 ∙
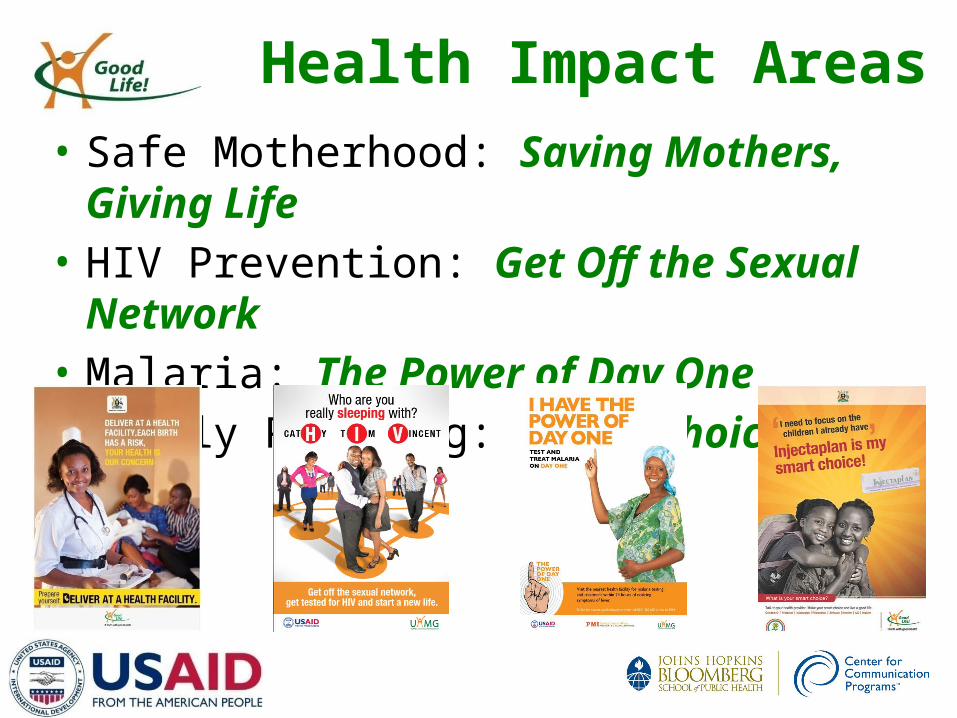
Health Impact Areas• Safe Motherhood: Saving Mothers, Giving Life• HIV Prevention: Get Off the Sexual Network• Malaria: The Power of Day One• Family Planning: Smart Choices
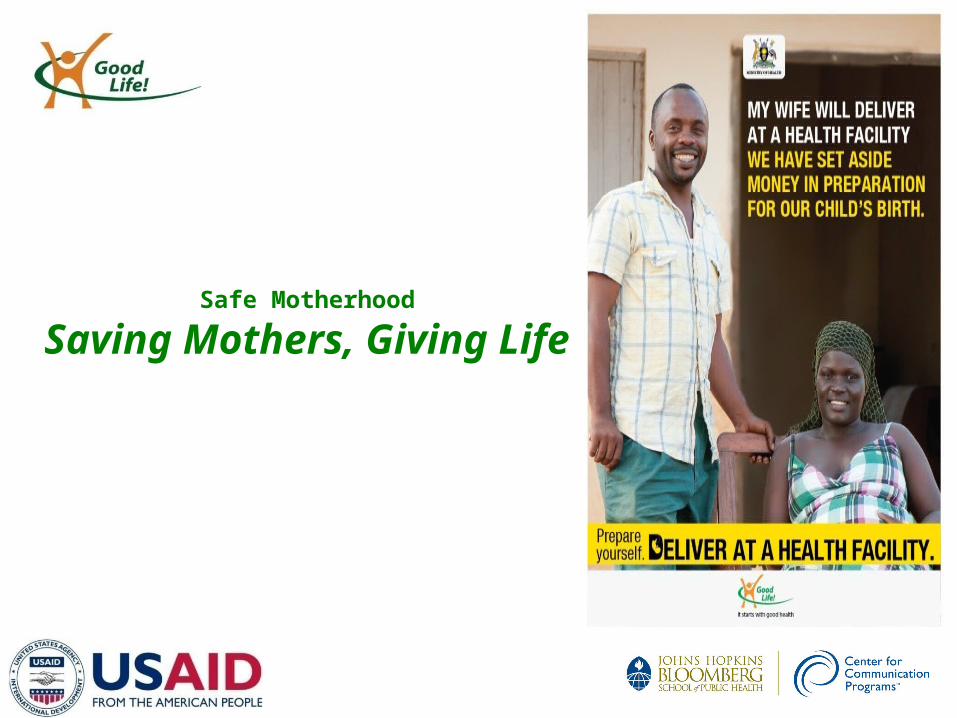
Safe Motherhood
Saving Mothers, Giving Life
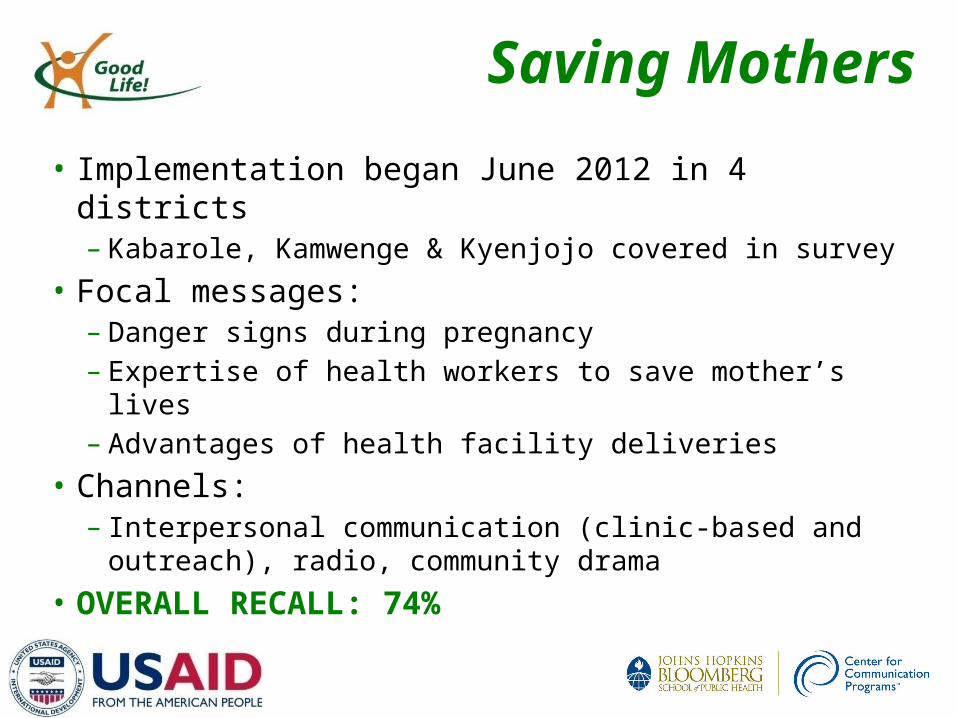
Saving Mothers
• Implementation began June 2012 in 4 districts– Kabarole, Kamwenge & Kyenjojo covered in survey
• Focal messages:– Danger signs during pregnancy– Expertise of health workers to save mother’s lives– Advantages of health facility deliveries
• Channels:– Interpersonal communication (clinic-based and
outreach), radio, community drama• OVERALL RECALL: 74%
Saving Mothers
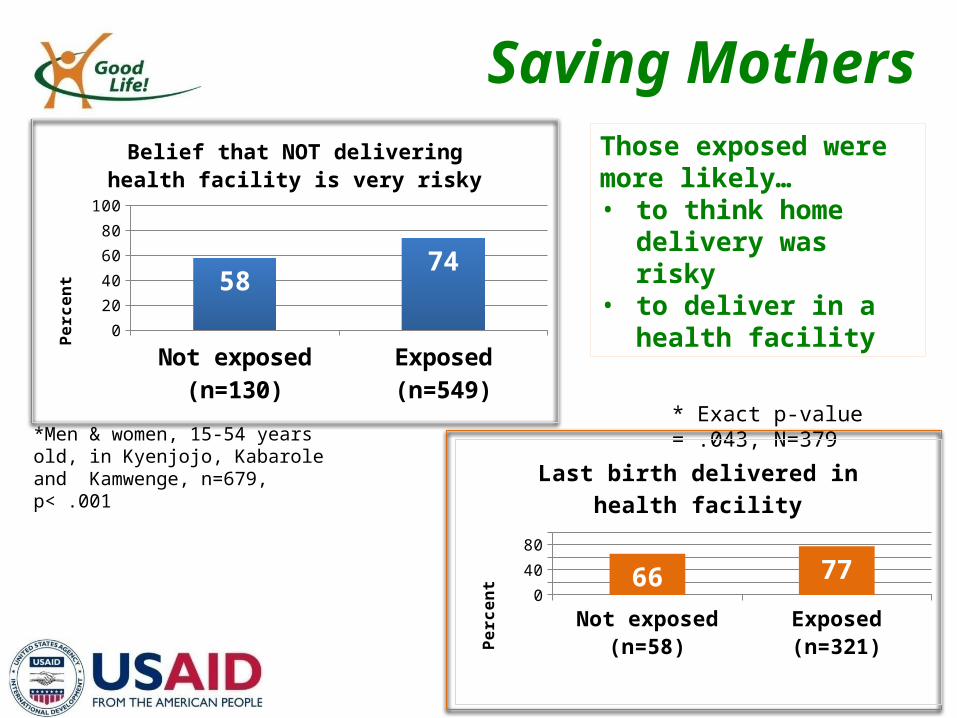
*Men & women, 15-54 years old, in Kyenjojo, Kabarole and Kamwenge, n=679, p< .001
* Exact p-value = .043, N=379
Those exposed were more likely… • to think home delivery
was risky • to deliver in a health
facility
Not exposed (n=58) Exposed (n=321)0
20
40
60
80
100
6677
Last birth delivered in health facilityPe
rcen
t
Not exposed (n=130)
Exposed (n=549)0
20
40
60
80
100
5874
Belief that NOT delivering health facility is very risky
Perc
ent
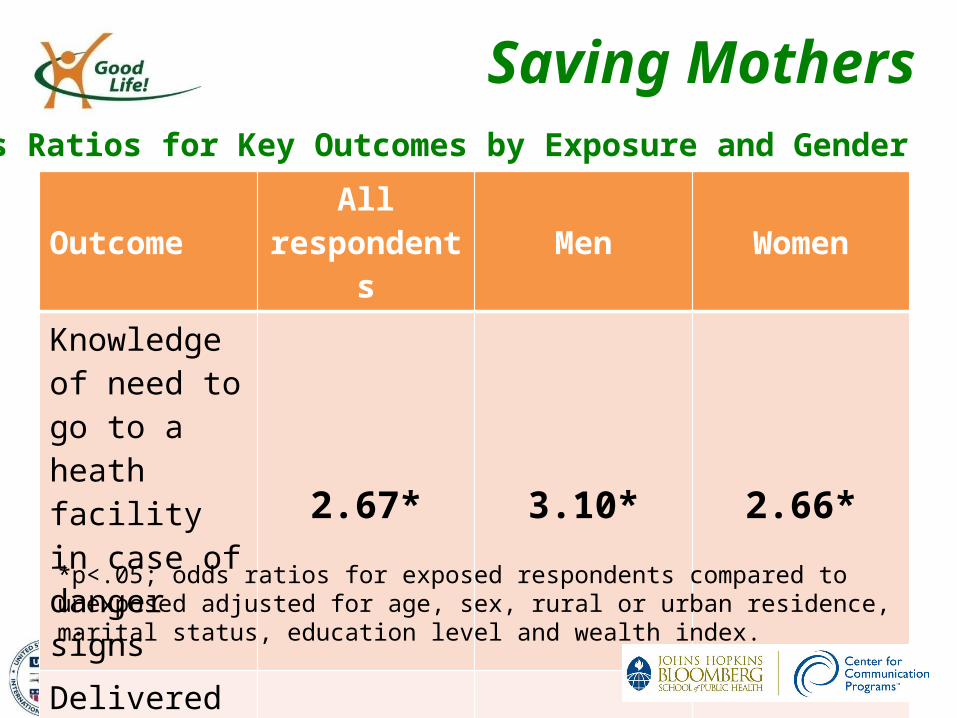
Saving Mothers
OutcomeAll
respondents Men WomenKnowledge of need to go to a heath facility in case of danger signs
2.67* 3.10* 2.66*
Delivered at a health facility - - 2.34*
*p<.05; odds ratios for exposed respondents compared to unexposed adjusted for age, sex, rural or urban residence, marital status, education level and wealth index.
Odds Ratios for Key Outcomes by Exposure and Gender
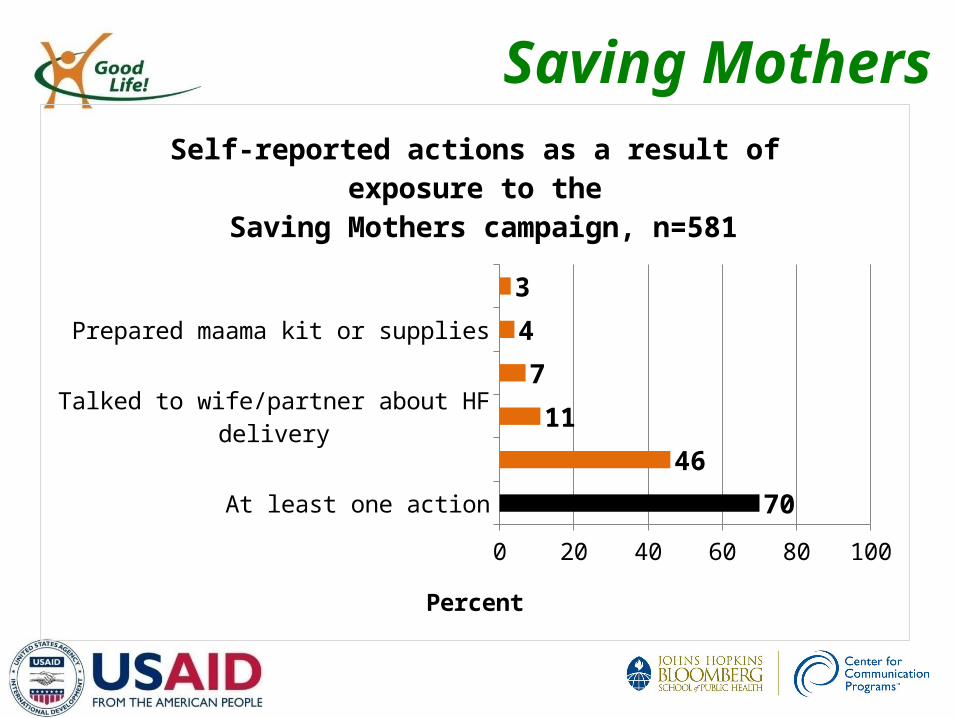
Saving Mothers
At least one action
Planned to deliver at health facility
Talked to wife/partner about HF delivery
Put aside money to use for delivery
Prepared maama kit or supplies
Arranged for transportation
0 10 20 30 40 50 60 70 80 90 100
70
46
11
7
4
3
Self-reported actions as a result of exposure to the Saving Mothers campaign, n=581
Percent
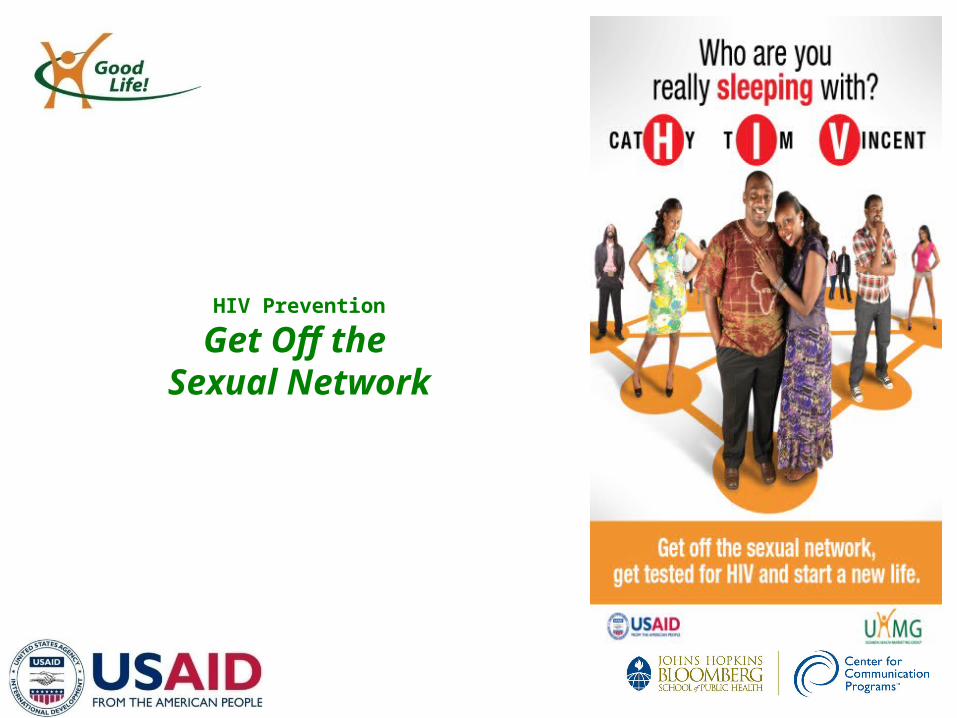
HIV Prevention
Get Off the Sexual Network
Sexual Network
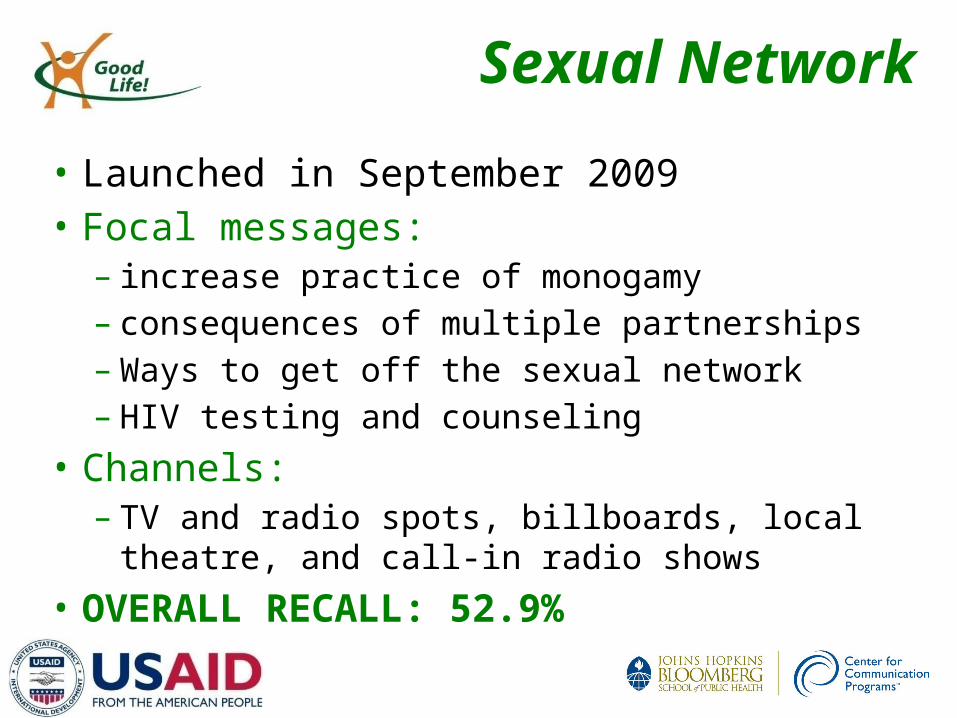
• Launched in September 2009• Focal messages:
– increase practice of monogamy– consequences of multiple partnerships– Ways to get off the sexual network– HIV testing and counseling
• Channels: – TV and radio spots, billboards, local theatre, and call-
in radio shows• OVERALL RECALL: 52.9%
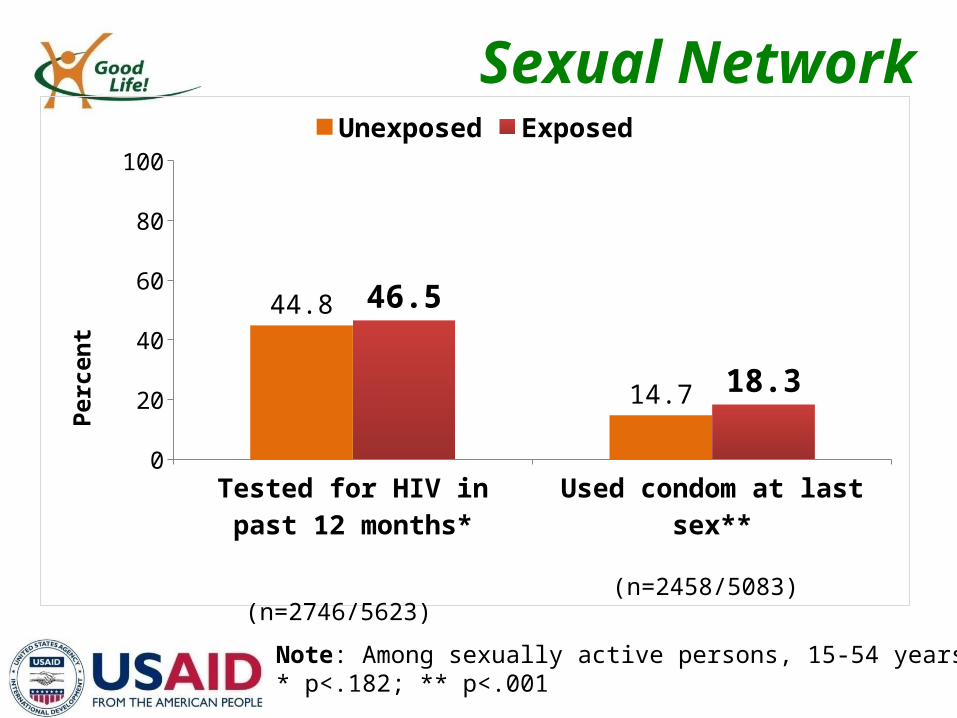
Sexual Network
Tested for HIV in past 12 months*
Used condom at last sex**0
20
40
60
80
100
44.8
14.7
46.5
18.3
Unexposed Exposed
Perc
ent
Note: Among sexually active persons, 15-54 years* p<.182; ** p<.001
(n=2746/5623)(n=2458/5083)
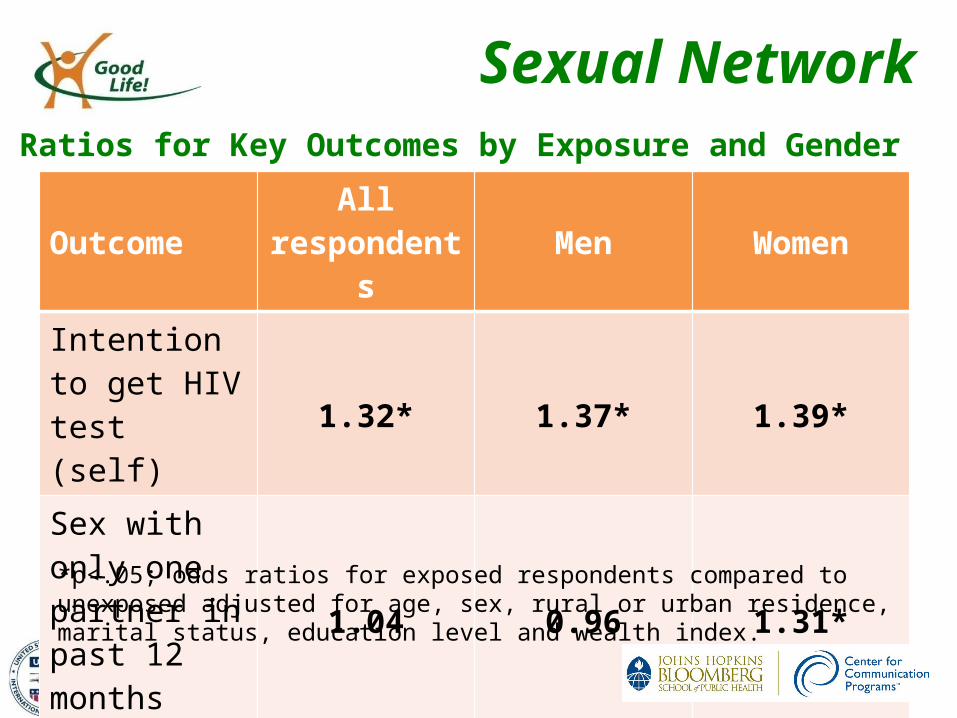
Sexual Network
OutcomeAll
respondents Men WomenIntention to get HIV test (self)
1.32* 1.37* 1.39*
Sex with only one partner in past 12 months
1.04 0.96 1.31*
*p<.05; odds ratios for exposed respondents compared to unexposed adjusted for age, sex, rural or urban residence, marital status, education level and wealth index.
Odds Ratios for Key Outcomes by Exposure and Gender
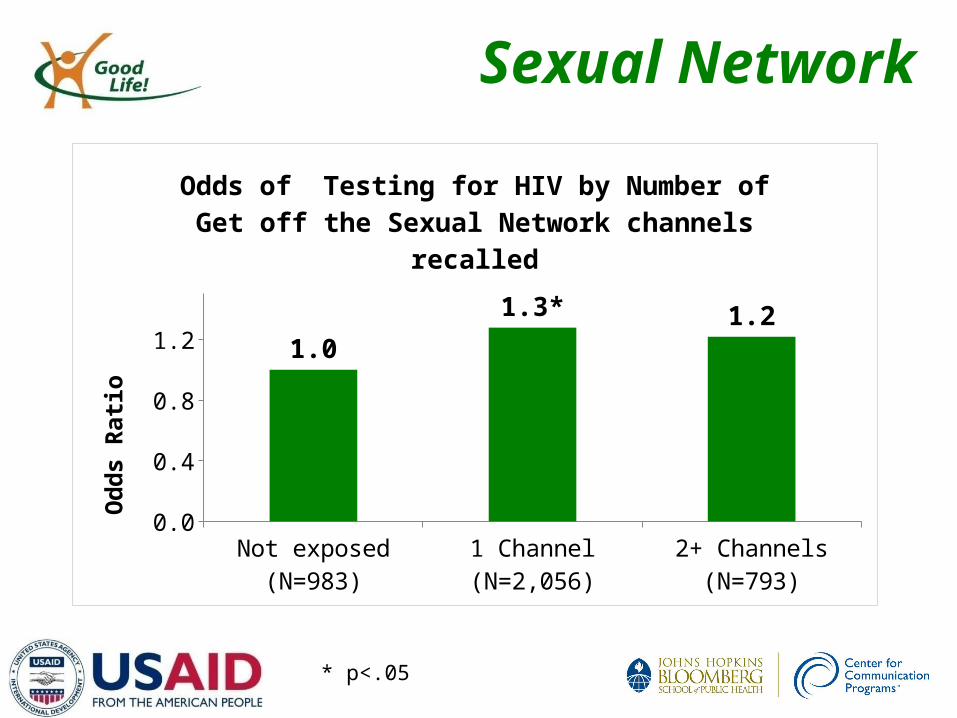
Sexual Network
Not exposed (N=983) 1 Channel (N=2,056) 2+ Channels (N=793)0.0
0.4
0.8
1.21.0
1.3* 1.2
Odds of Testing for HIV by Number of Get off the Sexual Network channels recalled
Odd
s Ra
tio
* p<.05
Sexual Network
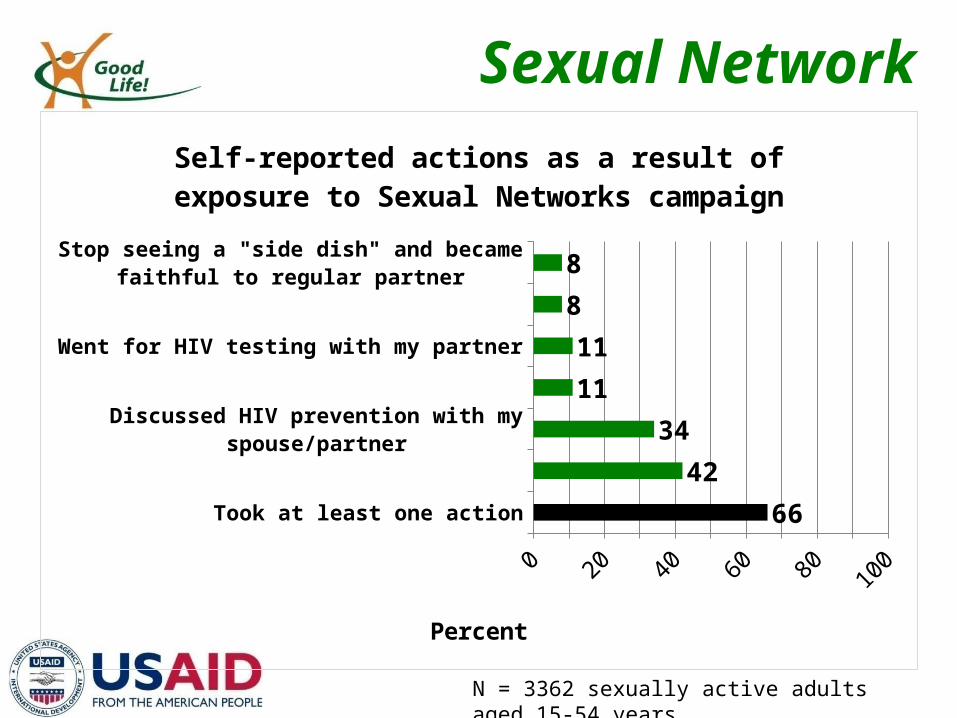
Took at least one action
Reduced the number of sexual partners
Discussed HIV prevention with my spouse/partner
Talked to someone about the Sexual Network
Went for HIV testing with my partner
Started using condoms
Stop seeing a "side dish" and became faithful to regular partner
0 10 20 30 40 50 60 70 80 90 100
66
42
34
11
11
8
8
Self-reported actions as a result of exposure to Sexual Networks campaign
Percent
N = 3362 sexually active adults aged 15-54 years
Malaria
The Power of Day One
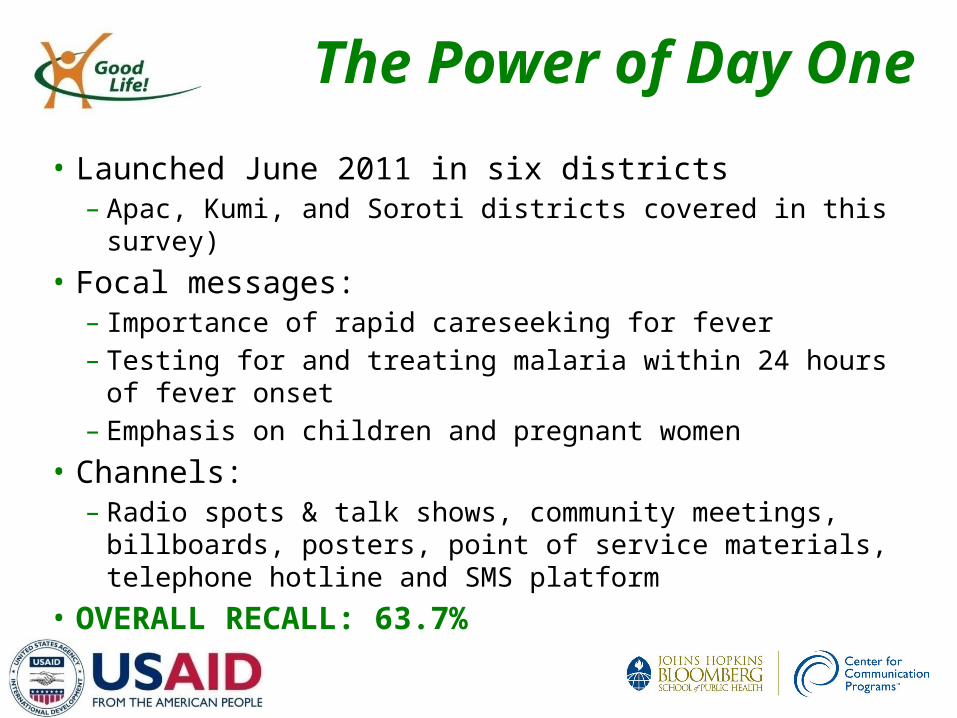
The Power of Day One
• Launched June 2011 in six districts– Apac, Kumi, and Soroti districts covered in this survey)
• Focal messages: – Importance of rapid careseeking for fever– Testing for and treating malaria within 24 hours of fever onset– Emphasis on children and pregnant women
• Channels: – Radio spots & talk shows, community meetings, billboards,
posters, point of service materials, telephone hotline and SMS platform
• OVERALL RECALL: 63.7%
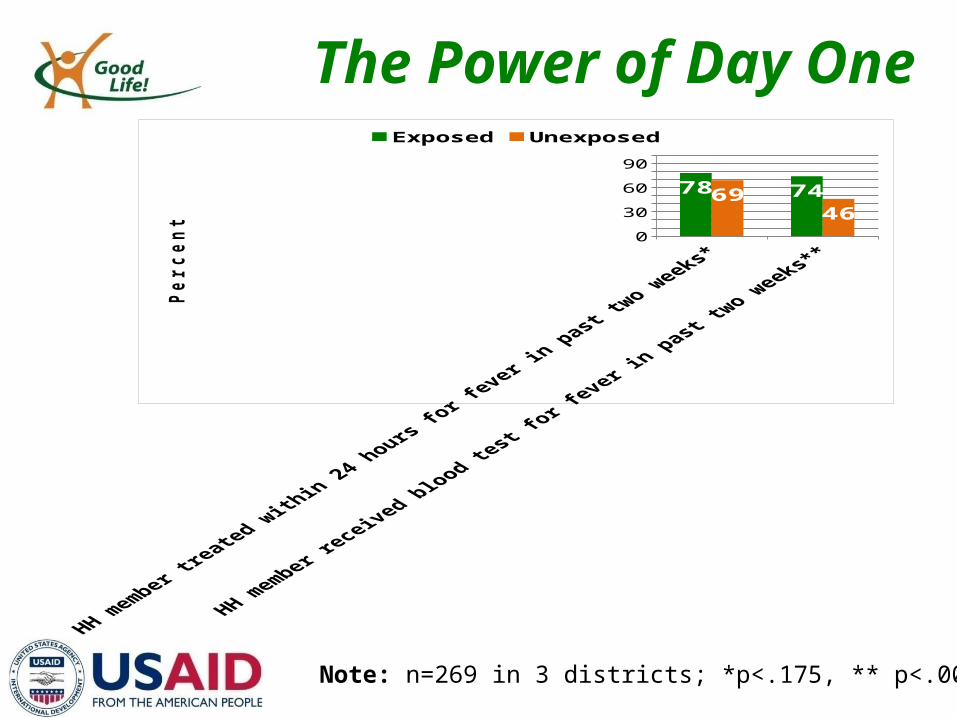
The Power of Day One
Note: n=269 in 3 districts; *p<.175, ** p<.001
020406080
100
78 746946
Exposed Unexposed
Pe
rce
nt
The Power of Day One
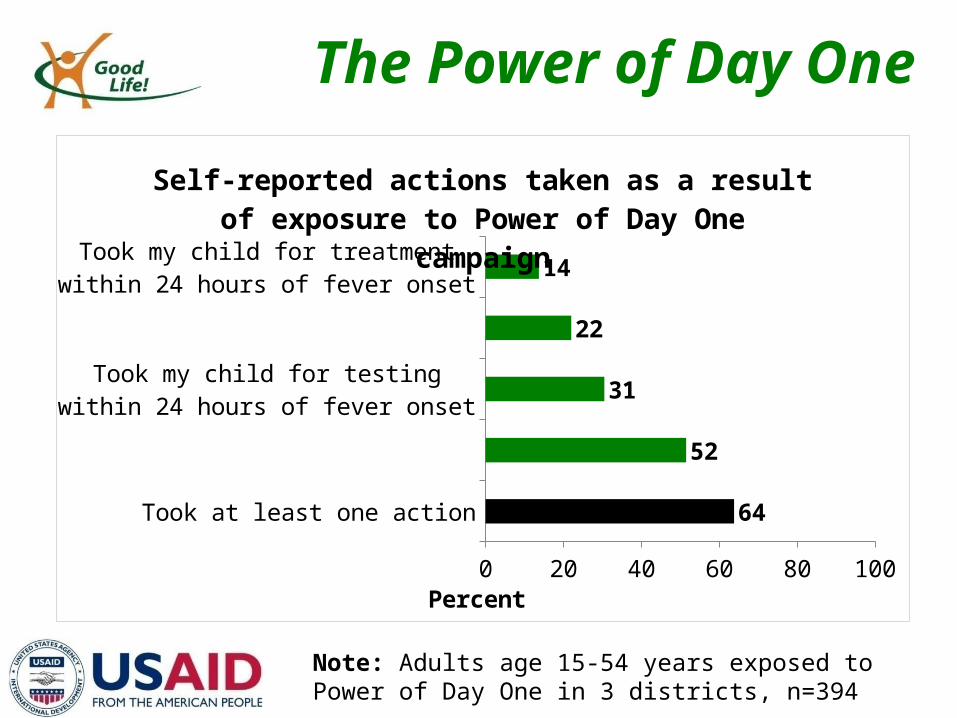
Took at least one action
Tested for malaria within 24 hours of fever onset
Took my child for testing within 24 hours of fever onset
Talked to someone about early testing for malaria
Took my child for treatment within 24 hours of fever onset
0 20 40 60 80 100
64
52
31
22
14
Self-reported actions taken as a result of exposure to Power of Day One campaign
Percent
Note: Adults age 15-54 years exposed to Power of Day One in 3 districts, n=394
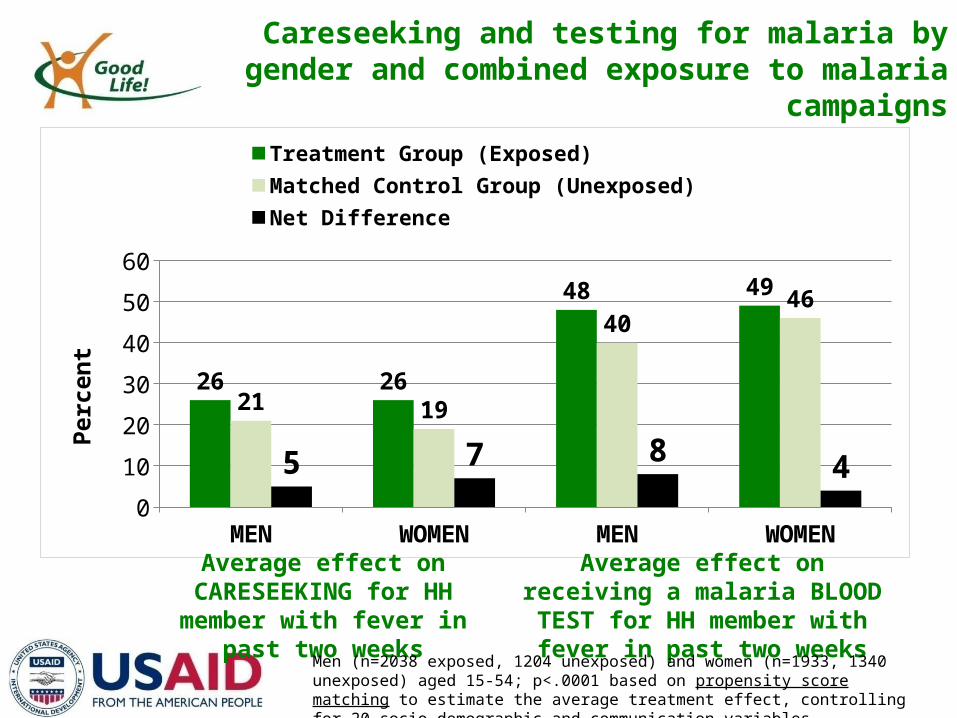
Careseeking and testing for malaria by gender and combined exposure to malaria campaigns
MEN WOMEN MEN WOMEN0
10
20
30
40
50
60
26 26
48 49
21 19
4046
5 7 84
Treatment Group (Exposed) Matched Control Group (Unexposed)Net Difference
Perc
ent
Average effect on CARESEEKING for HH member with fever in
past two weeks
Average effect on receiving a malaria BLOOD TEST for HH member
with fever in past two weeks
Men (n=2038 exposed, 1204 unexposed) and women (n=1933, 1340 unexposed) aged 15-54; p<.0001 based on propensity score matching to estimate the average treatment effect, controlling for 20 socio-demographic and communication variables.
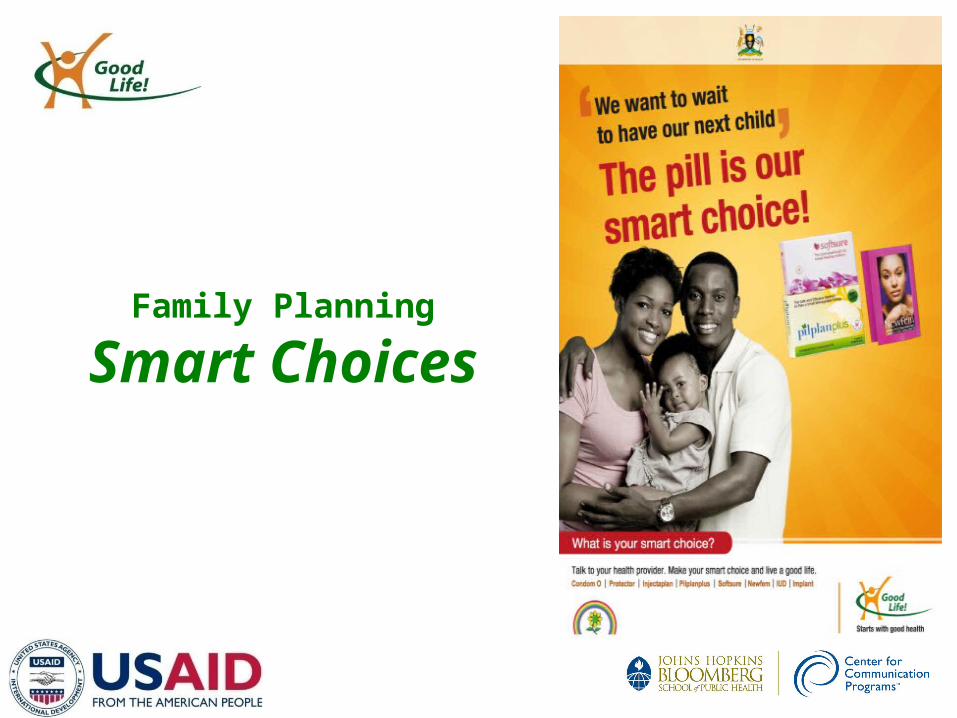
Family Planning
Smart Choices
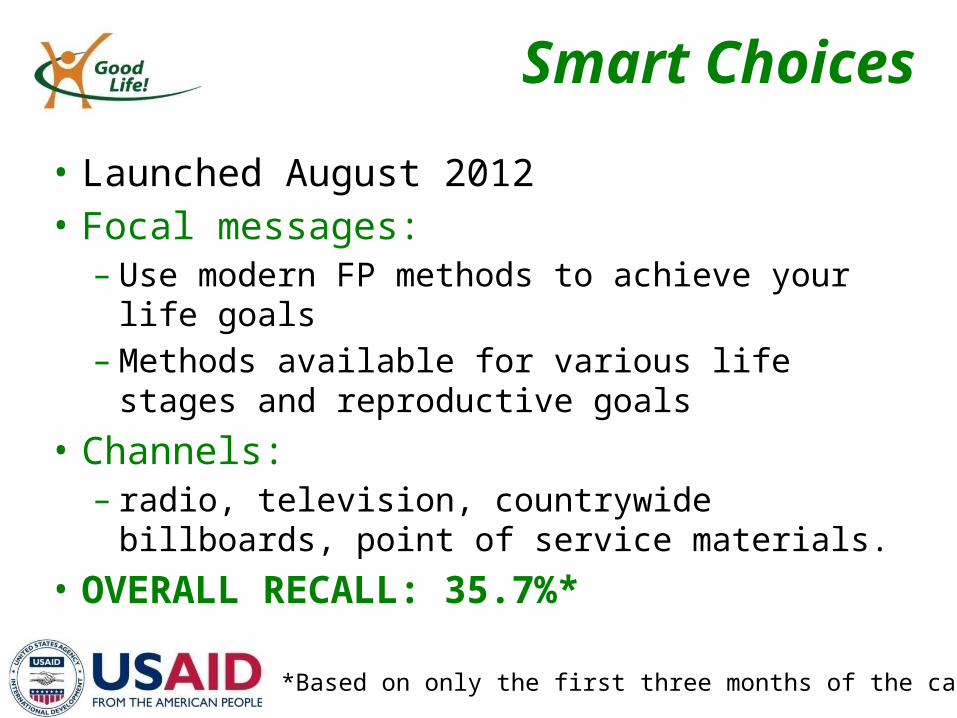
Smart Choices
• Launched August 2012• Focal messages:
– Use modern FP methods to achieve your life goals– Methods available for various life stages and
reproductive goals• Channels:
– radio, television, countrywide billboards, point of service materials.
• OVERALL RECALL: 35.7%*
*Based on only the first three months of the campaign
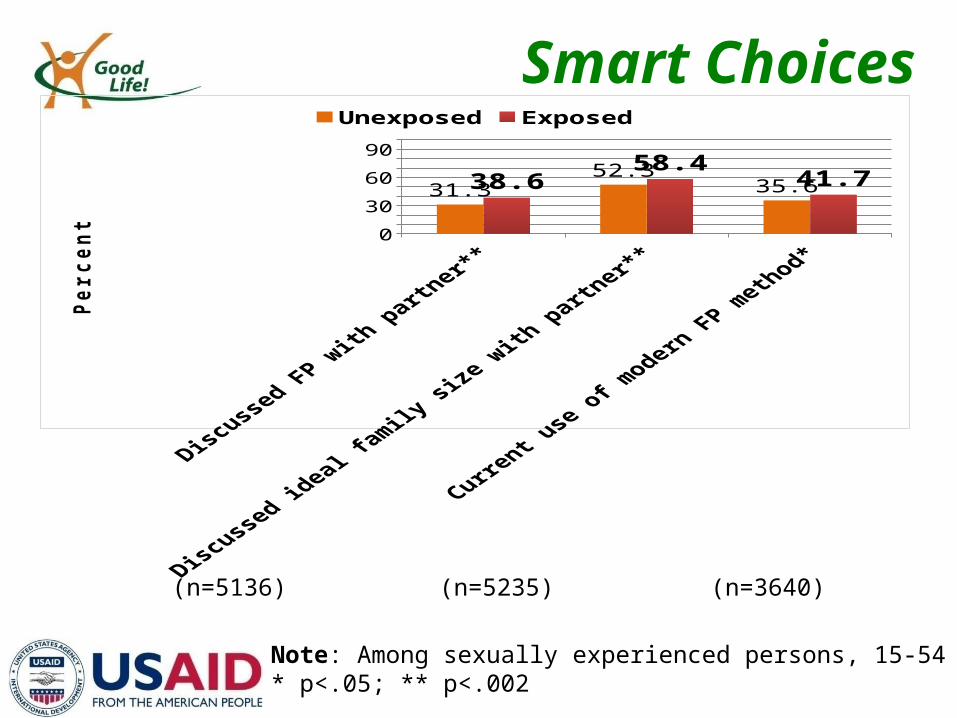
Smart Choices
020406080
100
31.352.3
35.638.658.4
41.7
Unexposed Exposed
Per
cen
t
Note: Among sexually experienced persons, 15-54 years* p<.05; ** p<.002
(n=5136) (n=5235) (n=3640)
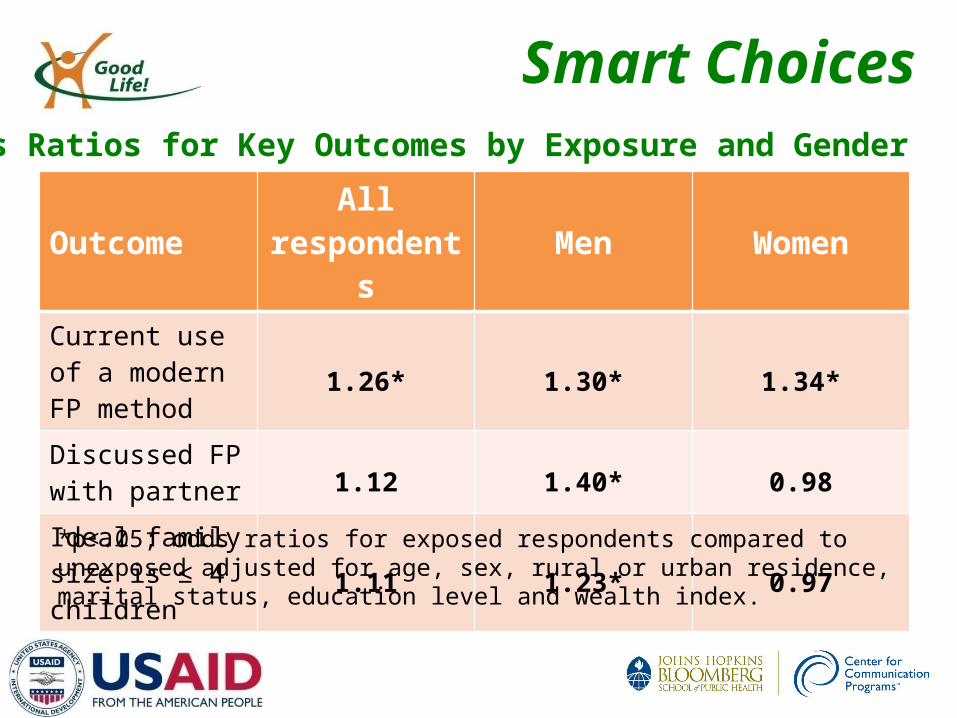
Smart Choices
OutcomeAll
respondents Men WomenCurrent use of a modern FP method
1.26* 1.30* 1.34*
Discussed FP with partner 1.12 1.40* 0.98
Ideal family size is ≤ 4 children 1.11 1.23* 0.97
*p<.05; odds ratios for exposed respondents compared to unexposed adjusted for age, sex, rural or urban residence, marital status, education level and wealth index.
Odds Ratios for Key Outcomes by Exposure and Gender
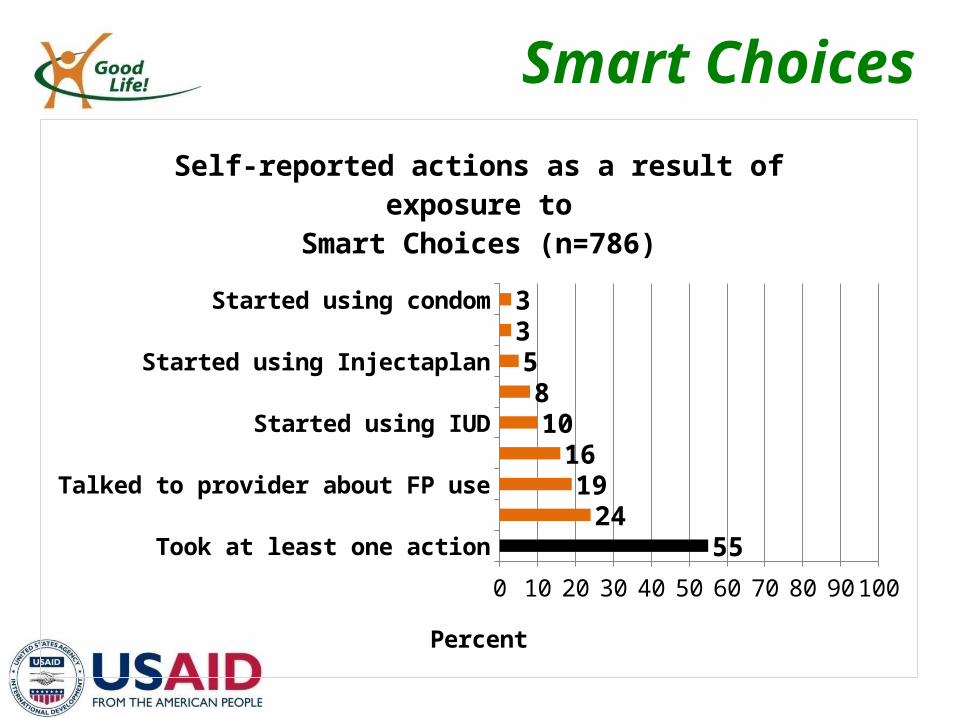
Smart Choices
Took at least one action
Talked to partner about FP use
Talked to provider about FP use
Talked to friend about FP use
Started using IUD
Started using pills
Started using Injectaplan
Started using implant
Started using condom
0 10 20 30 40 50 60 70 80 90 100
5524
1916
108
533
Self-reported actions as a result of exposure toSmart Choices (n=786)
Percent
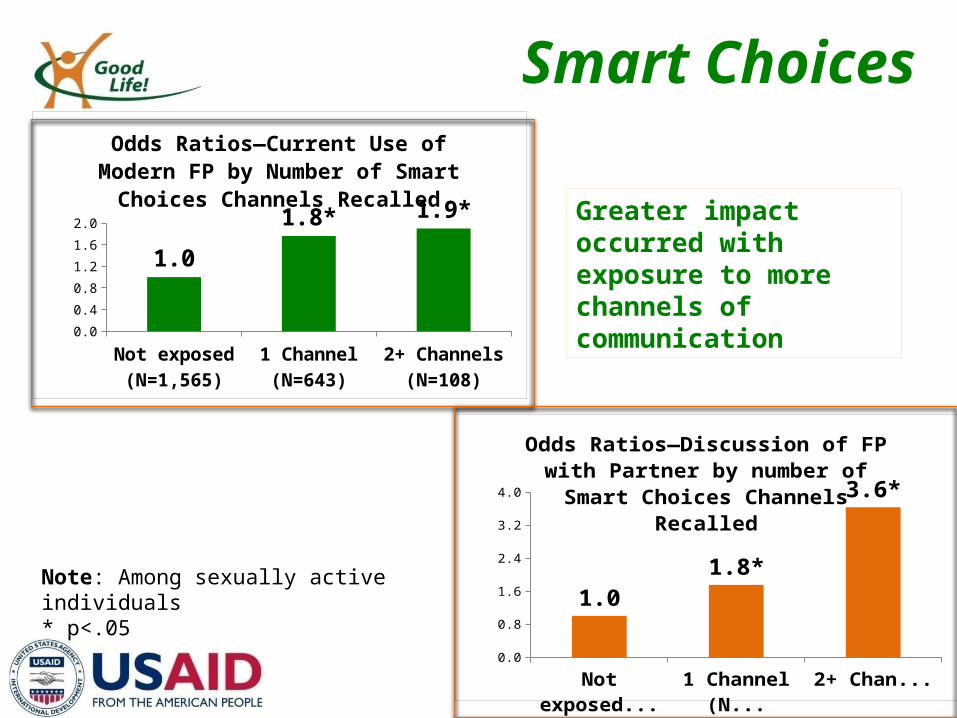
Smart Choices
Not exposed (N=1,565)
1 Channel (N=643)
2+ Channels (N=108)
0.0
0.4
0.8
1.2
1.6
2.0
1.0
1.8* 1.9*
Odds Ratios—Current Use of Modern FP by Number of Smart Choices Channels Recalled
Not exposed (N=1,565)
1 Channel (N=643)
2+ Channels (108)
0.0
0.8
1.6
2.4
3.2
4.0
1.01.8*
3.6*
Odds Ratios—Discussion of FP with Partner by number of Smart Choices Channels Re-
called
Greater impact occurred with exposure to more channels of communication
Note: Among sexually active individuals* p<.05
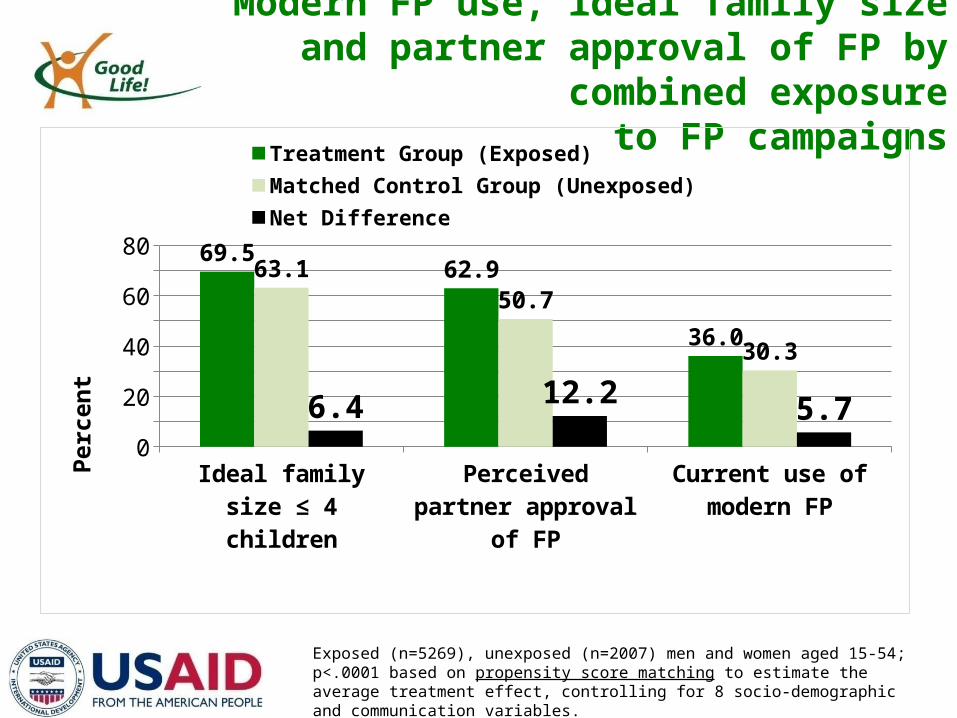
Modern FP use, ideal family size and partner approval of FP by combined exposure
to FP campaigns
Ideal family size ≤ 4 children
Perceived partner approval of FP
Current use of modern FP
0
10
20
30
40
50
60
70
8069.5
62.9
36.0
63.1
50.7
30.3
6.412.2
5.7
Treatment Group (Exposed) Matched Control Group (Unexposed)Net Difference
Perc
ent
Exposed (n=5269), unexposed (n=2007) men and women aged 15-54; p<.0001 based on propensity score matching to estimate the average treatment effect, controlling for 8 socio-demographic and communication variables.
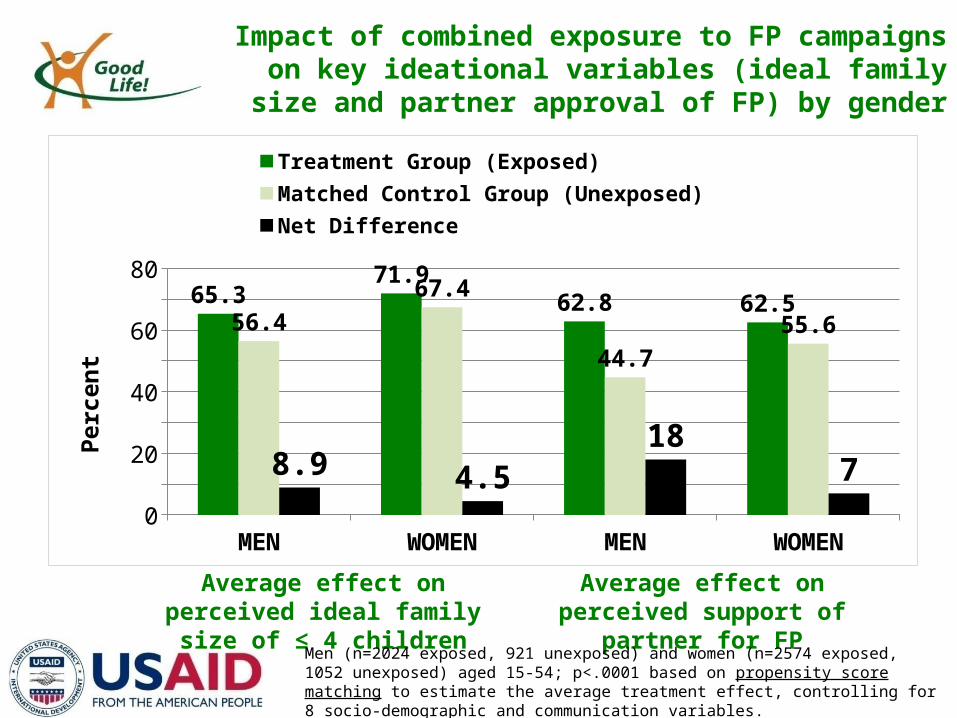
Impact of combined exposure to FP campaigns on key ideational variables (ideal family size and partner
approval of FP) by gender
MEN WOMEN MEN WOMEN0
10
20
30
40
50
60
70
80
65.371.9
62.8 62.556.4
67.4
44.7
55.6
8.9 4.5
187
Treatment Group (Exposed) Matched Control Group (Unexposed)Net Difference
Perc
ent
Average effect on perceived ideal family size of ≤ 4 children
Average effect on perceived support of partner for FP
Men (n=2024 exposed, 921 unexposed) and women (n=2574 exposed, 1052 unexposed) aged 15-54; p<.0001 based on propensity score matching to estimate the average treatment effect, controlling for 8 socio-demographic and communication variables.
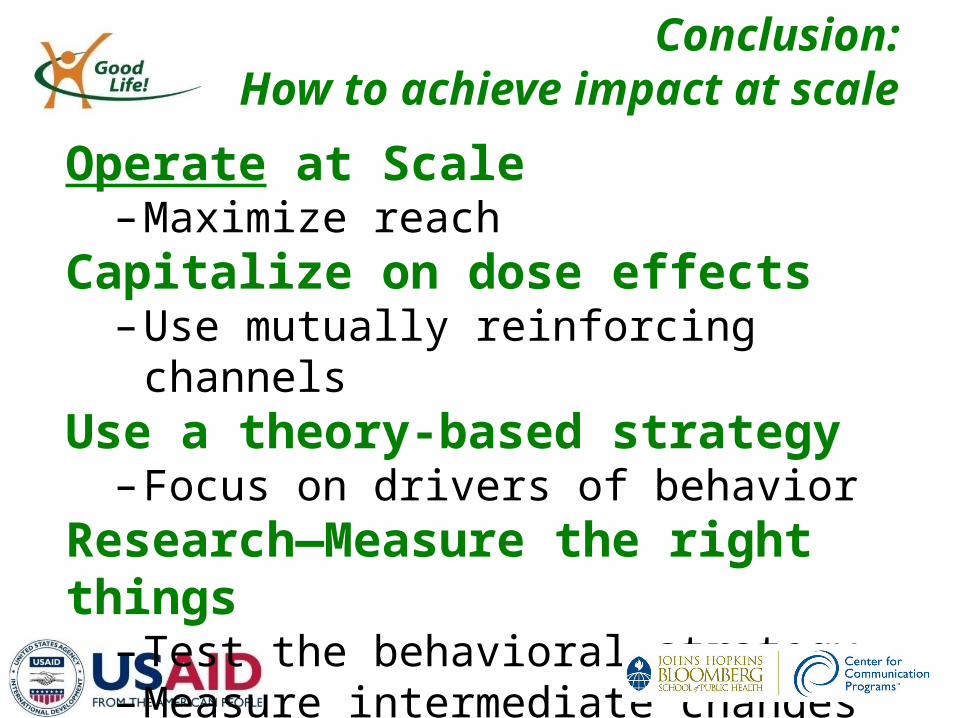
Conclusion:How to achieve impact at scale
Operate at Scale– Maximize reach
Capitalize on dose effects– Use mutually reinforcing channels
Use a theory-based strategy– Focus on drivers of behavior
Research—Measure the right things– Test the behavioral strategy– Measure intermediate changes
Thank you…and have a