Embed Size (px)
Citation preview
Census 2011 Methodology and
highlights of key results
Report No. 03-01-42
Statistics South Africa
Pali LehohlaStatistician-General
ii | P a g e
Census 2011 Methodology and Highlights of key results / Statistics South Africa Published by Statistics South Africa, Private Bag X44, Pretoria 0001 © Statistics South Africa, 2012 Users may apply or process this data, provided Statistics South Africa (Stats SA) is acknowledged as the original source of the data; that it is specified that the application and/or analysis is the result of the user's independent processing of the data; and that neither the basic data nor any reprocessed version or application thereof may be sold or offered for sale in any form whatsoever without prior permission from Stats SA.
Stats SA Library Cataloguing-in-Publication (CIP) Data Census 2011 Methodology and Highlights of key results / Statistics South Africa. Pretoria: Statistics South Africa, 2012 Report no. 03-01-42 29 pp ISBN 978-0-621-41389-2 A complete set of Stats SA publications is available at Stats SA Library and the following libraries:
National Library of South Africa, Pretoria Division National Library of South Africa, Cape Town Division Library of Parliament, Cape Town Bloemfontein Public Library Natal Society Library, Pietermaritzburg Johannesburg Public Library Eastern Cape Library Services, King William’s Town Central Regional Library, Polokwane Central Reference Library, Nelspruit Central Reference Collection, Kimberley Central Reference Library, Mmabatho
This publication is available on the Stats SA website: www.statssa.gov.za For technical enquiries please contact: Calvin Molongoana Tel: 012 310 4754 Fax: 012 310 4865 Email: [email protected] For dissemination enquiries please contact Printing and Distribution, Statistics South Africa Ina du Plessis Email: [email protected]
iii | P a g e
Contents Chapter 1: Methodology.............................................................................................................................................1
1.1 Background...................................................................................................................................................1 1.2 The importance of a population census........................................................................................................1 1.3 How the count was done ..............................................................................................................................1
1.3.1 Planning ................................................................................................................................................1 1.3.2 Pre-enumeration ...................................................................................................................................1 1.3.3 Enumeration..........................................................................................................................................1 1.3.4 Data processing ....................................................................................................................................2 1.3.5 Data editing and validation system.......................................................................................................2 1.3.6 Independent monitoring and evaluation of Census field activities........................................................2 1.3.7 Post-enumeration survey (PES) ...........................................................................................................2 1.3.8 Conclusion ............................................................................................................................................3
Chapter 2: Comparing Census 2011 with previous censuses ...............................................................................4
2.1 Provincial boundary changes from 2001 to 2011 .........................................................................................4 2.2 Local municipal boundary changes, 2001–2011 ..........................................................................................8
Chapter 3: Key results................................................................................................................................................9
Annexure: Terms and definitions............................................................................................................................20
List of tables Table 2.1: Geographical land area changes since 2001 ..............................................................................................4 List of maps Map 2.1: Provincial boundary changes since 2001......................................................................................................5
Map 2.2: Municipal boundary changes since 2001 ......................................................................................................6
iv | P a g e
List of figures Figure 3.1: Population of South Africa by sex ..............................................................................................................9
Figure 3.2: Population distribution by population group ...............................................................................................9
Figure 3.3: Population distribution by population group and sex................................................................................10
Figure 3.4: Total population in five-year age groups and sex ....................................................................................10
Figure 3.5: Percentage distribution of persons aged 20 years and older by level of education.................................11
Figure 3.6: Percentage distribution of disabled population by type and degree of difficulty in performing tasks.......11
Figure 3.7: Percentage distribution of households by type of main dwelling: Census 1996, Census 2001, Community Survey 2007, and Census 2011 ..............................................................................................................12
Figure 3.8: Percentage of households that have access to piped water by province, Census 2011.........................12
Figure 3.9: Percentage distribution of households by type of toilet facility: Census 2001, Community Survey 2007, and Census 2011..............................................................................................................................................13
Figure 3.10: Percentage distribution of households by type of energy used for lighting: Census 1996, Census 2001, Community Survey 2007, and Census 2011....................................................................................................14
Figure 3.11: Percentage of households using electricity for lighting by province: Census 1996, Census 2001, Community Survey 2007, and Census 2011 ..............................................................................................................14
Figure 3.12: Percentage distribution of households by type of energy used for cooking: Census 1996, Census 2001, Community Survey 2007, and Census 2011....................................................................................................15
Figure 3.13: Percentage distribution of households using electricity for cooking by province: Census 1996, Census 2001, Community Survey 2007, and Census 2011.......................................................................................16
Figure 3.14: Percentage distribution of household by type of energy used for heating: Census 1996, Census 2001, Community Survey 2007, and Census 2011....................................................................................................17
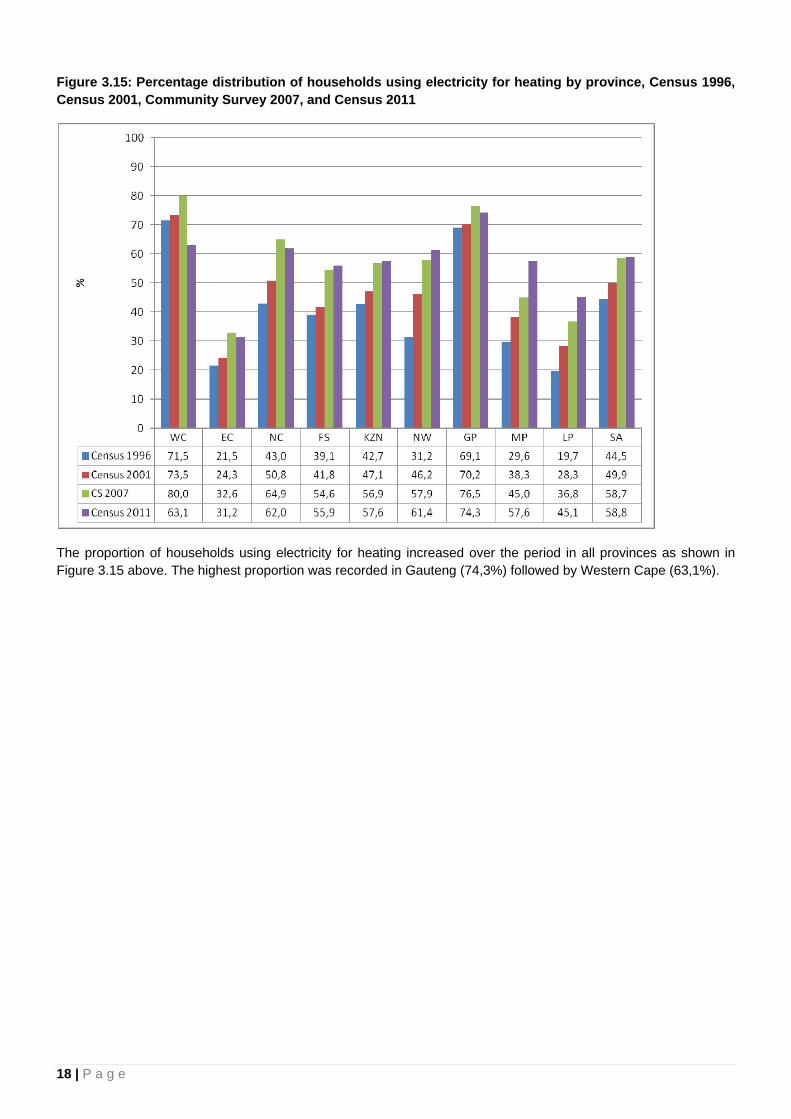
Figure 3.15: Percentage distribution of households using electricity for heating by province, Census 1996, Census 2001, Community Survey 2007, and Census 2011.......................................................................................18
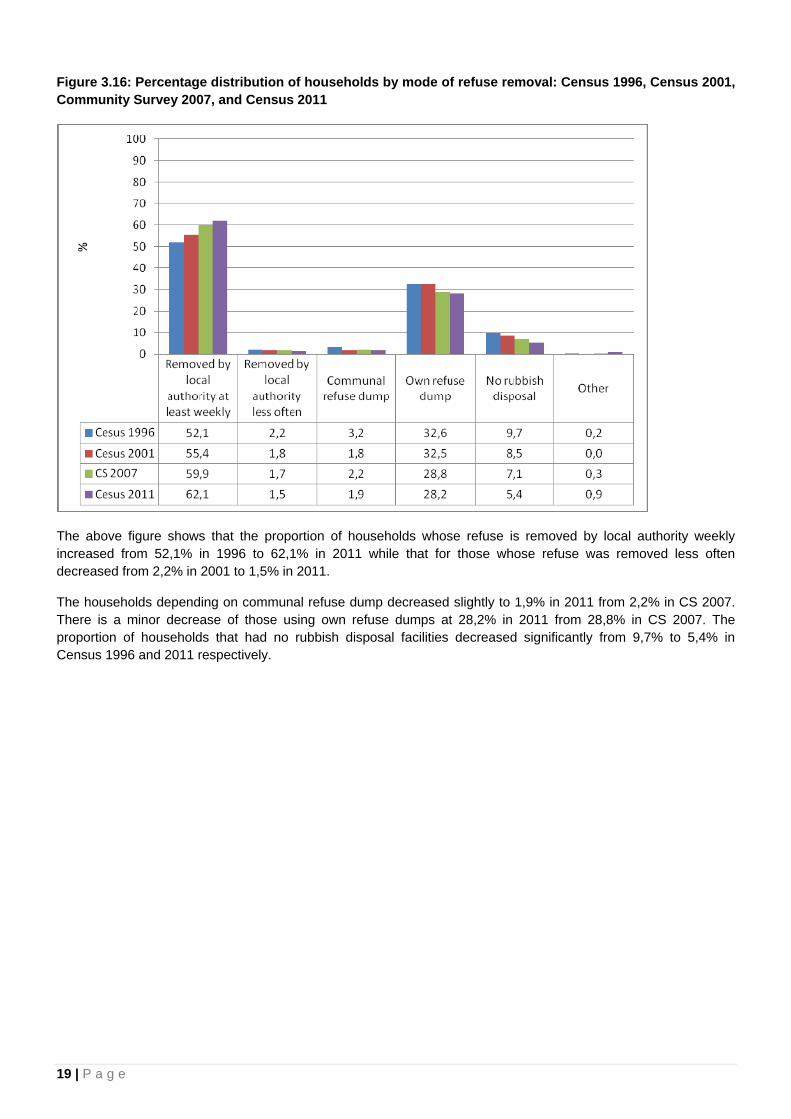
Figure 3.16: Percentage distribution of households by mode of refuse removal: Census 1996, Census 2001, Community Survey 2007, and Census 2011 ..............................................................................................................19
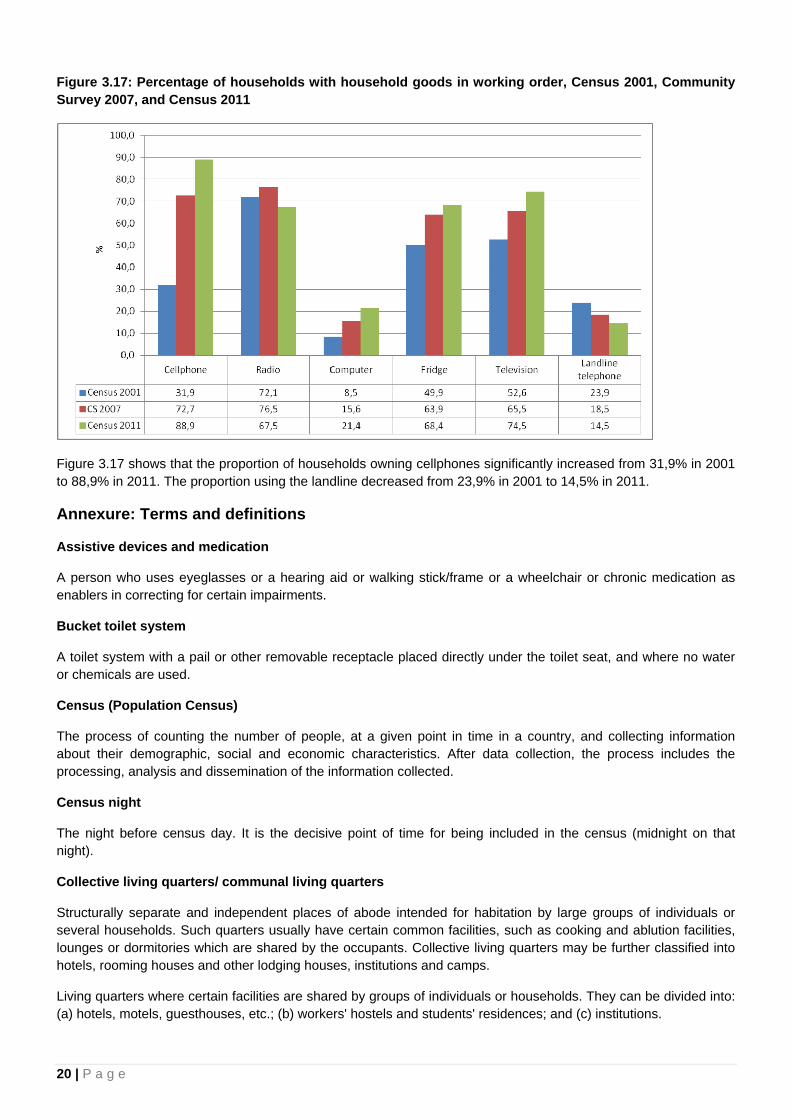
Figure 3.17: Percentage of households with household goods in working order, Census 2001, Community Survey 2007, and Census 2011 .................................................................................................................................20
1 | P a g e
Chapter 1: Methodology
1.1 Background
Censuses are principal means of collecting basic population and housing statistics required for social and economic development, policy interventions, their implementation and evaluation. South Africa has conducted three censuses (1996, 2001 and 2011). The third census was conducted in October 2011 and a number of population and household attributes were measured and a variety of indicators generated from them. This document highlights processes that were undertaken during the execution of Census 2011 and key results generated from the census.
1.2 The importance of a population census
- Census results play an essential role in informing and measuring public policies.
- Census statistics provide sampling frame for sample surveys.
- Census undertaking contributes to generation of statistics on small areas.
- Census statistics are used by the private sector for market analyses.
- The census results are used as a benchmark for research and analysis. Population projections are one of the most important analytical outputs based on census data.
1.3 How the count was done
One of the fundamental principles of official statistics is transparency in methods applied to generate statistics. To facilitate correct interpretation of census data, information on how the count was done is outlined in below.
1.3.1 Planning
This process involved the development of the overall strategy, the structure for the project, component plans and budget. These processes were started in 2003 and were subsequently reviewed in 2008, after the completion of the Community Survey in 2007. Methodologies and procedures were then developed and tested in a form of mini tests and pilot in 2008 and 2009, respectively. The findings from these tests helped to refine the plans and methods for the final test in 2010, called the “Dress rehearsal”. The latter was expected to be a replica of how the actual count was to be conducted in 2011, and therefore the timing had to be the same month as the main census, i.e. October month.
1.3.2 Pre-enumeration
The pre-enumeration phase mainly involved the final preparatory work before the actual count. It started with mass production of census instruments like questionnaires, manuals, field gear etc. This process also involved acquisition of satellite offices required in the districts, recruitment of the 1st level of field management staff (District Census Coordinators - 130 DCCs) and field work coordinators – 6 000 FWCs. These groups of people were then given intense training based on their key performance areas. At the same time the country was being sub-divided into small pockets called enumeration areas (EAs), the underlying principle for this sub-division is that an EA should be within reach of a fieldworker and all households in that EA can be covered within the allocated number of days. This process yielded 103 576 EAs. The other benefit for this sub-division is the timely finalisation of the distribution plan of all materials required in the provinces and districts. It also gives a better estimate of the number of field staff to recruit for the count. The pre-enumeration phase involved over 7 000 staff.
1.3.3 Enumeration
The enumeration phase, started with the training of supervisors as listers. Each person had to list all dwellings within an EA and had a minimum of 4 EAs to cover. These areas were called supervisory units. As they were listing, they were also expected to publicise the activities of the census within their supervisory units. Upon
2 | P a g e
completion of listing, final adjustments of work load was done and the number of enumerators required was finalised. Training of enumerators started in earnest, and it mainly covered how to complete the questionnaire and to read a map. The latter was to aid them to identify the boundaries of their assigned area. An enumerator was also given a few days before the start of the count to update their orientation book with any developments that might have happened since listing, as well as introduce themselves to the communities they were to work with, through posters bearing their photos and special identification cards. On the night of the 9th October the actual count started with the homeless and special institutions given special attention. The enumeration phase was undertaken by an army of field staff in excess of 160 000, inclusive of management.
1.3.4 Data processing
The processing of over 15 million questionnaires commenced in January 2012, immediately after the completion of the reverse logistics in December 2011. Each box and its contents were assigned a store location in the processing centre via a store management system. Each time a box was required for any process it was called through this system. The processing phase was sub-divided into the following processes: primary preparation - where all completed questionnaires were grouped into clusters of 25 and the spine of the questionnaire cut off. Secondary preparation - where questionnaires were finally prepared for scanning, by removing foreign materials in-between pages and ensure that all pages are loose. Scanning - questionnaires were put through a scanner to create an electronic image. Finally, Tilling and completion - where any unrecognised reading/ badly read image by the scanner had to be verified by a data capturer. This process took 8 months. Over 2 000 data processors working 3 shifts per day were employed for this phase to ensure that 225 million single pages are accounted for.
1.3.5 Data editing and validation system
The execution of each phase of census operations introduces some form of errors in census data. Despite quality assurance methodologies embedded in all the phases; data collection, data capturing (both manual and automated), coding, and editing, a number of errors creep in and distort the collected information. To promote consistency and improve on data quality, editing is a paramount phase in identifying and minimising errors such as invalid values, inconsistent entries or unknown/missing values. The editing process for Census 2011 was based on defined rules (specifications). The Census 2011 questionnaire was very complex, characterised by many sections, interlinked questions and skipping instructions. Editing of such complex, interlinked data items required application of a combination of editing techniques. Errors relating to structure were resolved using structural query language (SQL) in Oracle dataset. CSPro software was used to resolve content related errors. The strategy for Census 2011 data editing was implementation of automated error detection and correction with minimal changes based on logical and dynamic imputations.
1.3.6 Independent monitoring and evaluation of Census field activities
Independent monitoring of the Census 2011 field activities was carried out by a team of statisticians from the Monitoring and Evaluation division. These included field training, publicity, listing and enumeration. This was to make sure that the activities were implemented according to the plans and have independent reports on the same. They also conducted Census 2011Post Enumeration Survey (PES) Verification study to identify the out-of-scope cases within the PES sample as reported in the Census 2011 PES listing summary books.
1.3.7 Post-enumeration survey (PES)
A post-enumeration survey is an independent sample survey that is conducted immediately after the completion of census enumeration in order to evaluate the coverage and content errors of the census. The PES for Census 2011 was undertaken shortly after the completion of census enumeration, from November to December 2011, in approximately 600 enumeration areas (EAs) (which later increased to 608 due to subdivision of large EAs). The main goal of the PES was to collect high quality data that would be compared with census data in order to determine how many people were missed in the census and how many were counted more than once.
3 | P a g e
1.3.8 Conclusion
The 2011 census project had its own challenges and successes, like any other massive project. Be that as it may, the following are worth mentioning; the census fieldworkers who traversed the country to collect information from households and those that we lost in the process. The respondents who opened their doors and locked their dogs to aid the field staff to do their work, the processors who worked 24hrs/7days a week to ensure that the data can be released within a year of enumeration. The census management team who met daily for two years to steer the project forward, the Stats SA EXCO for the leadership they provided, the Statistics Council and in particular the sub-committee on population and social statistics for their continued guidance and support, and finally the Minister in the Presidency: responsible for planning for the robust interrogation of the plans and guidance on this project. It is through such concerted efforts that as a country we can and will continuously improve on our endeavours.
4 | P a g e
Chapter 2: Comparing Census 2011 with previous censuses Comparison of Census 2011 with previous censuses (1996 and 2001) required alignment of data for the two censuses to 2011 municipal boundaries. This is because the country’s provincial demarcations underwent changes through a number of changes at provincial and municipal boundaries. The provincial and municipal changes are outlined below.
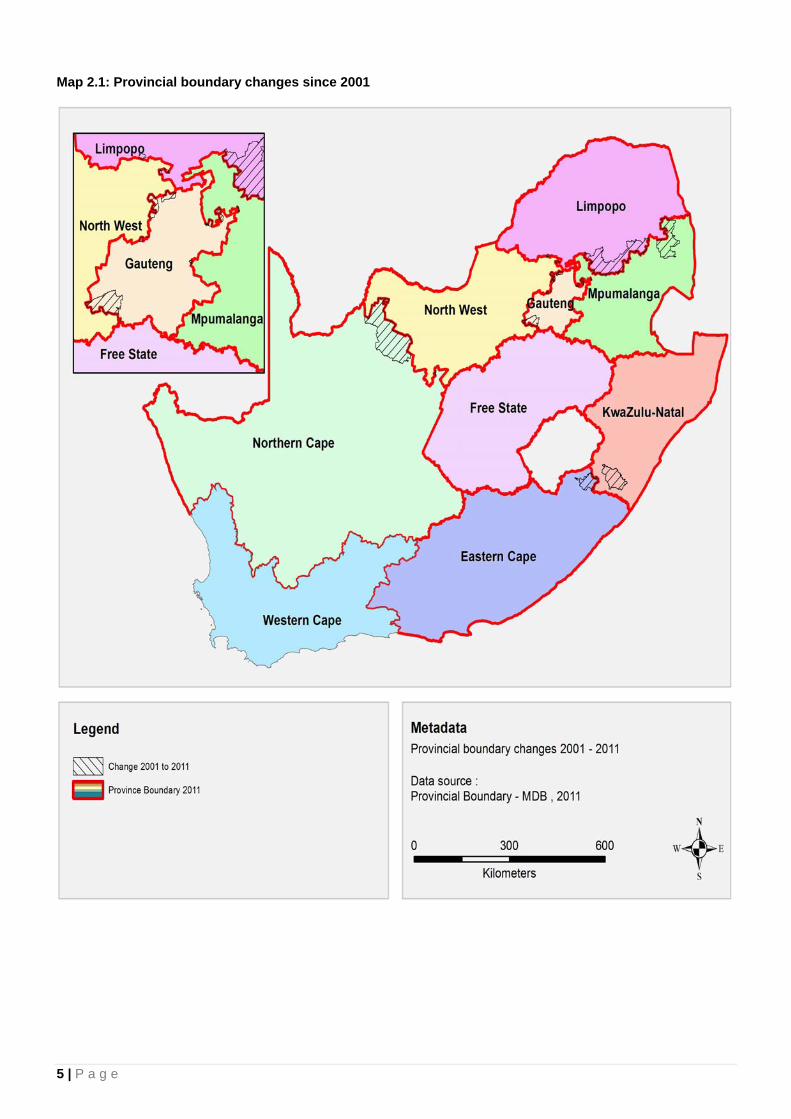
2.1 Provincial boundary changes from 2001 to 2011
Of the nine provinces, only two provinces (Western Cape and Free State) are unaffected by provincial boundary changes. The provincial boundary changes were mostly as a result of eight cross-boundary municipalities which were absorbed in full into respective provinces.
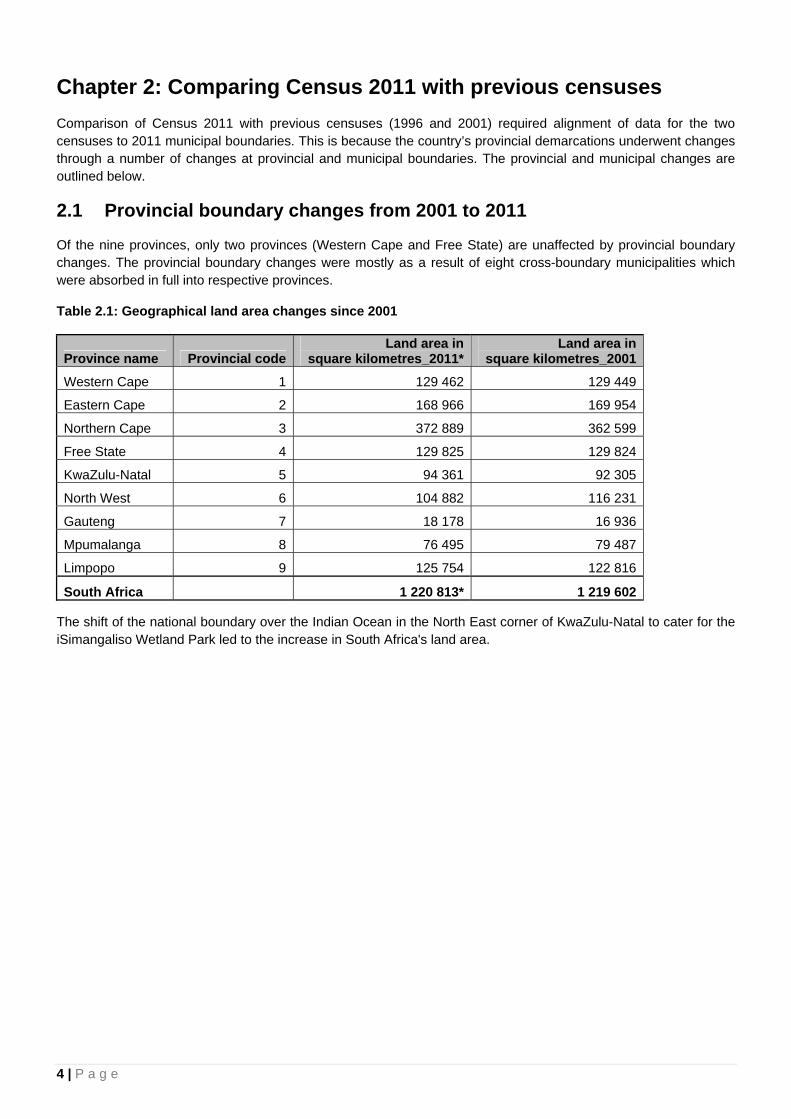
Table 2.1: Geographical land area changes since 2001
Province name Provincial code Land area in
square kilometres_2011*Land area in
square kilometres_2001
Western Cape 1 129 462 129 449
Eastern Cape 2 168 966 169 954
Northern Cape 3 372 889 362 599
Free State 4 129 825 129 824
KwaZulu-Natal 5 94 361 92 305
North West 6 104 882 116 231
Gauteng 7 18 178 16 936
Mpumalanga 8 76 495 79 487
Limpopo 9 125 754 122 816
South Africa 1 220 813* 1 219 602
The shift of the national boundary over the Indian Ocean in the North East corner of KwaZulu-Natal to cater for the iSimangaliso Wetland Park led to the increase in South Africa's land area.
5 | P a g e
Map 2.1: Provincial boundary changes since 2001
6 | P a g e
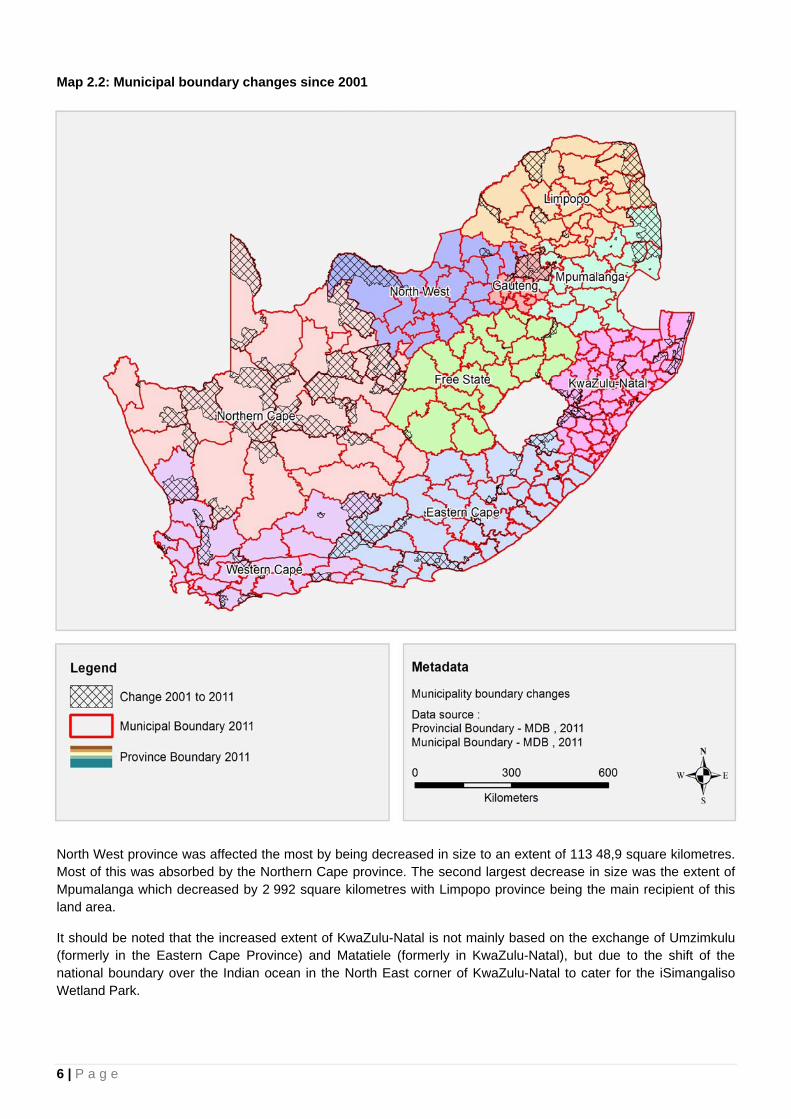
Map 2.2: Municipal boundary changes since 2001
North West province was affected the most by being decreased in size to an extent of 113 48,9 square kilometres. Most of this was absorbed by the Northern Cape province. The second largest decrease in size was the extent of Mpumalanga which decreased by 2 992 square kilometres with Limpopo province being the main recipient of this land area.
It should be noted that the increased extent of KwaZulu-Natal is not mainly based on the exchange of Umzimkulu (formerly in the Eastern Cape Province) and Matatiele (formerly in KwaZulu-Natal), but due to the shift of the national boundary over the Indian ocean in the North East corner of KwaZulu-Natal to cater for the iSimangaliso Wetland Park.
7 | P a g e
Northern Cape and North West:
• Ga Segonyana and Phokwane municipalities were cross boundary municipalities between Northern Cape and North West in 2001 and were allocated to Northern Cape in full – based on the current provincial boundaries.
• Kagisano municipality (2001) was split into Kagisano/ Molopo municipality and Joe Morolong municipality, with the former portion now in North West province and the latter now in Northern Cape province.
• Moshaweng municipality (now part of Joe Morolong municipality) was incorporated in full in Northern Cape Province based on the current provincial boundaries.
North West and Gauteng
• Merafong City municipality (2001) was a cross-boundary local municipality between North West and Gauteng and was allocated to the Gauteng province based on the current provincial boundaries.
• West Rand (DMA) municipality (2001) was not aligned to the then provincial boundary and therefore was absorbed into Mogale City municipality in full based on the current provincial boundaries.
• City of Tshwane Metropolitan Municipality was a cross-boundary municipality between Gauteng and North West Provinces. The portions adjacent to Moretele and Madibeng municipalities were allocated to Gauteng in full – based on the current provincial boundaries.
North West and Limpopo:
• Limpopo lost a portion of the Bela Bela municipality to North West’s Moretele municipality. In turn North West lost a portion of the Moretele Municipality to Limpopo’s Bela Bela Municipality based on the current provincial boundaries.
Gauteng and Mpumalanga:
• A portion of Delmas municipality (2001) now called Victor Kanye was allocated to the City of Tshwane in Gauteng based on the current provincial boundaries.
• Kungwini municipality, now incorporated into the City of Tshwane was a cross boundary municipality and is now fully allocated to Gauteng, based on the current provincial boundaries.
Mpumalanga and Limpopo:
• Greater Groblersdal, now Elias Motsoaledi; Greater Marble Hall now Ephraim Mogale; and Greater Thubatse were cross-boundary municipalities between Mpumalanga and Limpopo and have now been allocated in full to the Limpopo province. Ephraim Mogale municipality absorbed the Schuinsdraai Nature Reserve.
• Bushbuck Ridge municipality was a cross-boundary municipality between Limpopo and Mpumalanga and has now been allocated in full to the Mpumalanga province. (Bushbuck Ridge also absorbed a portion of the Kruger National Park cross boundary District management area.)
KwaZulu-Natal and Eastern Cape:
Umzimkulu, formerly in the Eastern Cape province, and Matatiele, formerly in KwaZulu-Natal were in effect exchanged – with Umzimkulu now being in KwaZulu-Natal and Matatiele now being in Eastern Cape based on the current provincial boundaries.
8 | P a g e
2.2 Local municipal boundary changes, 2001–2011
In 2001, the geographical frame consisted of 262 local municipalities. This total has been reduced to 234 local municipalities in the 2011 geographical frame. The difference of 28 municipalities is explained as follows:
In total 25 District Management Areas (DMAs) were absorbed into the existing provinces.
• The City of Tshwane absorbed a further two municipalities (Nokeng Tsa Taemane and Kungwini).
• A new municipality (Kagisano Molopo – NW379) was established by merging NW391 (Kagisano) and NW395 (Molopo).
For municipalities, 107 municipalities decreased in geographical area while 155 municipalities had an increase in geographical area.
9 | P a g e
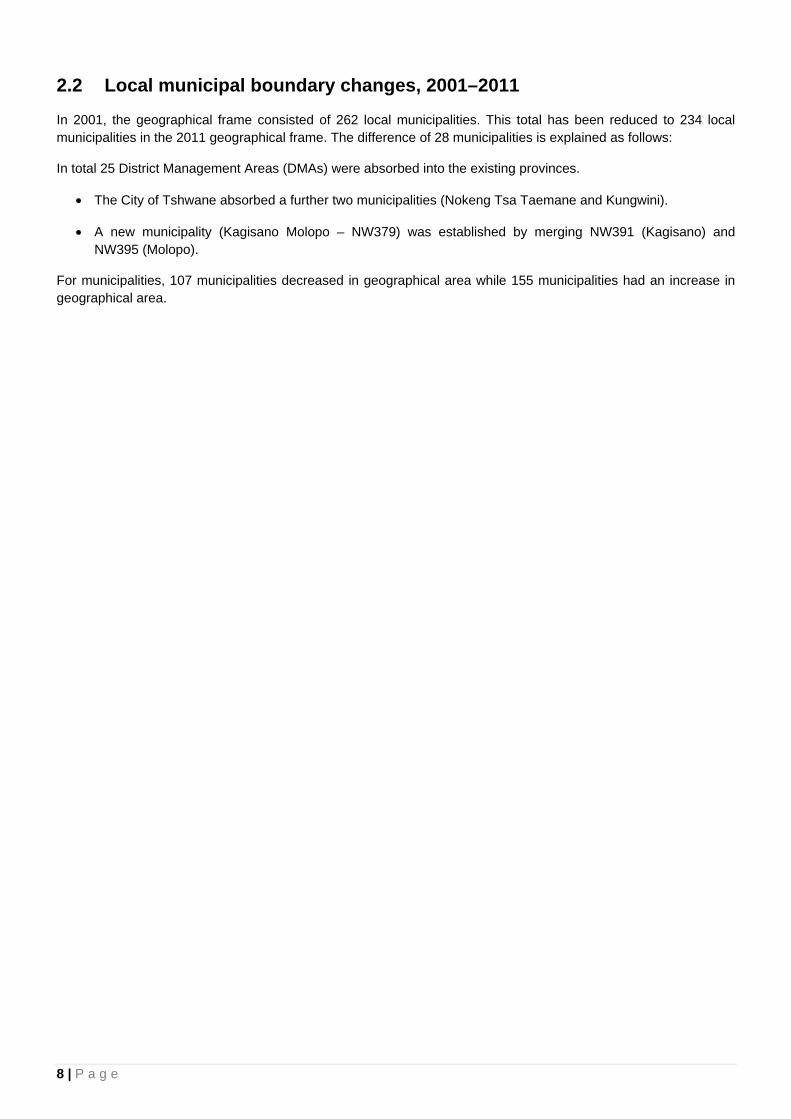
Chapter 3: Key results Figure 3.1: Population of South Africa by sex
The Census results show that the population of South Africa increased by about 4 million from 1996 to 2001. In the ten years since the last census, about 7 million people have been added to the population.
Figure 3.2: Population distribution by population group
Totals for 2011 exclude ‘Other’ category
Overall, more than three quarters of the population is black African. It was 77,4% in 1996 and stayed 79% in 2001. In 2011 the population of Black Africans slightly increased to 79,2% while the share of the Indian/Asian population remained constant. The percentage of the white population has declined slightly from 10,9% in 1996 to 9,6% in 2001 and 8,7% in 2011.
10 | P a g e
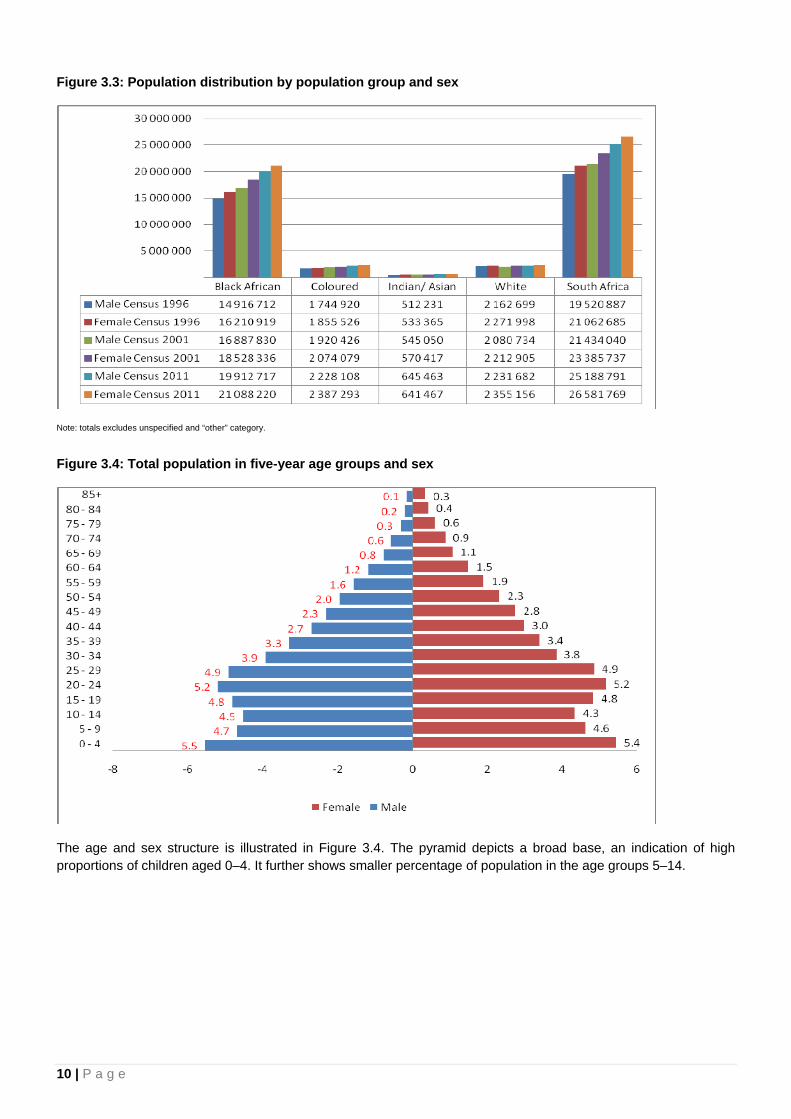
Figure 3.3: Population distribution by population group and sex
Note: totals excludes unspecified and “other” category.
Figure 3.4: Total population in five-year age groups and sex
The age and sex structure is illustrated in Figure 3.4. The pyramid depicts a broad base, an indication of high proportions of children aged 0–4. It further shows smaller percentage of population in the age groups 5–14.
11 | P a g e
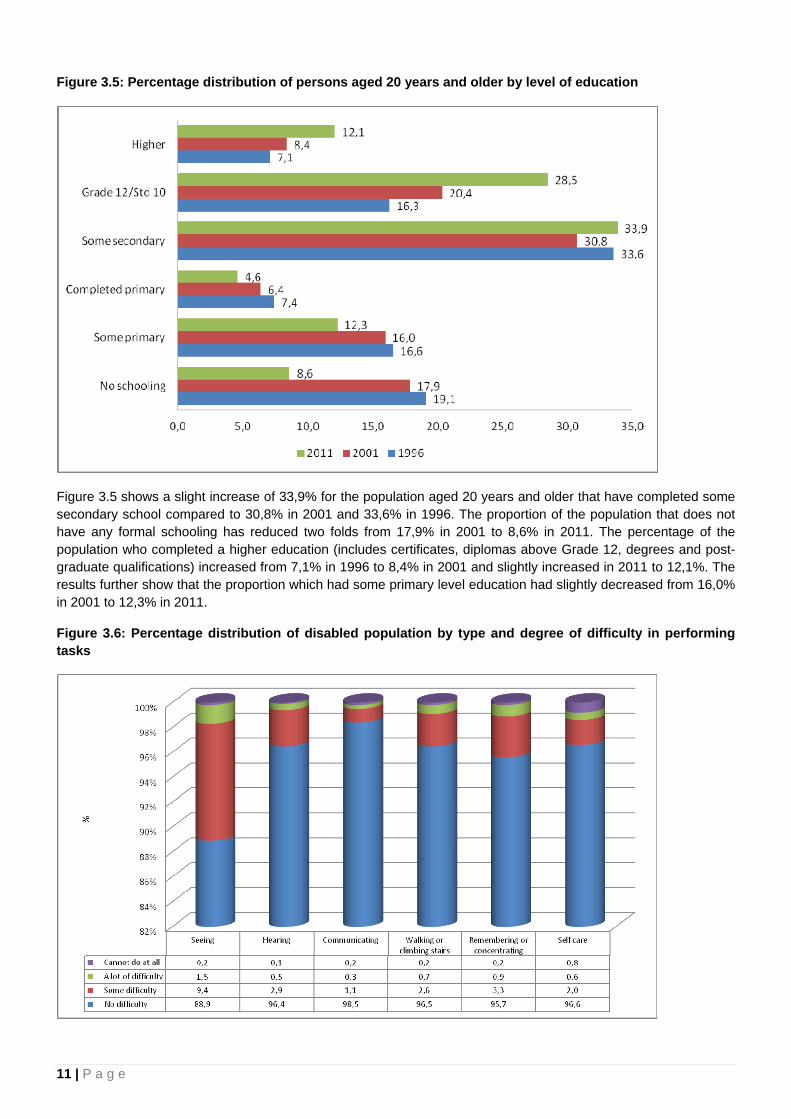
Figure 3.5: Percentage distribution of persons aged 20 years and older by level of education
Figure 3.5 shows a slight increase of 33,9% for the population aged 20 years and older that have completed some secondary school compared to 30,8% in 2001 and 33,6% in 1996. The proportion of the population that does not have any formal schooling has reduced two folds from 17,9% in 2001 to 8,6% in 2011. The percentage of the population who completed a higher education (includes certificates, diplomas above Grade 12, degrees and post-graduate qualifications) increased from 7,1% in 1996 to 8,4% in 2001 and slightly increased in 2011 to 12,1%. The results further show that the proportion which had some primary level education had slightly decreased from 16,0% in 2001 to 12,3% in 2011.
Figure 3.6: Percentage distribution of disabled population by type and degree of difficulty in performing tasks
12 | P a g e
In terms of general health and functioning 9% of the population indicated that they had some difficulty in seeing. However results generally show low proportions of people with severe disabilities. Note that 1996 and 2001 Censuses disability figures cannot be compared with those of Census 2011 because questions on disability changed.
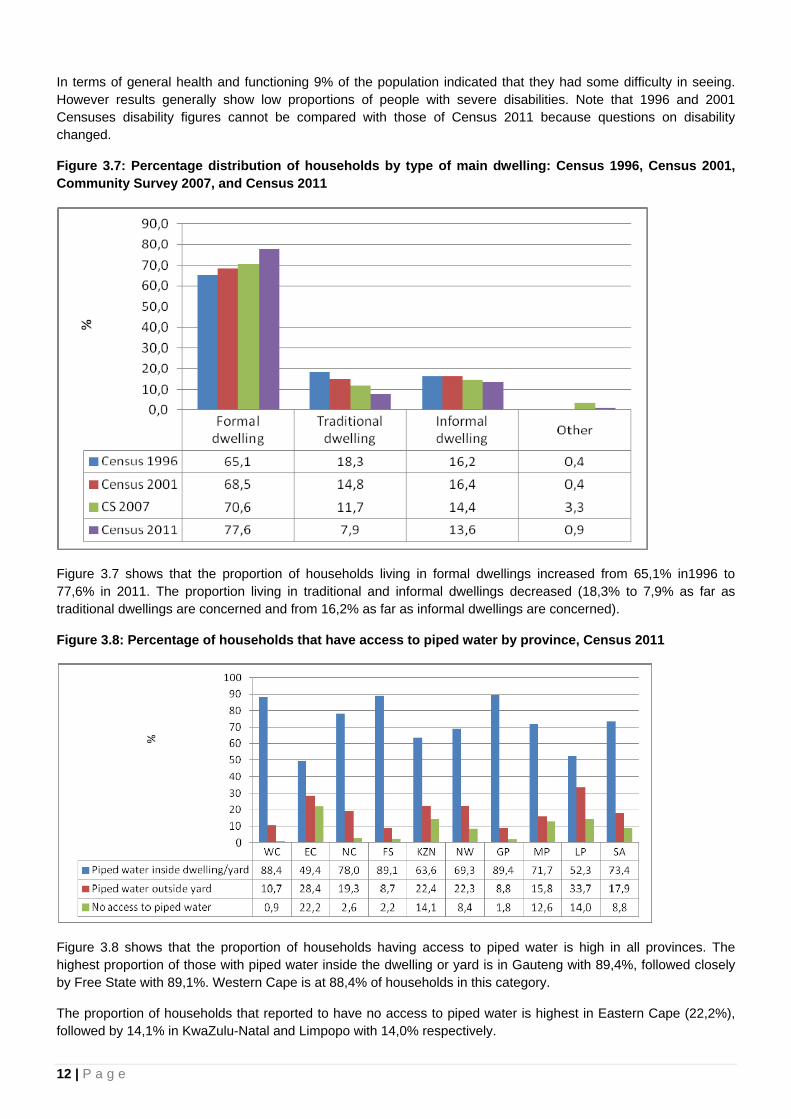
Figure 3.7: Percentage distribution of households by type of main dwelling: Census 1996, Census 2001, Community Survey 2007, and Census 2011
Figure 3.7 shows that the proportion of households living in formal dwellings increased from 65,1% in1996 to 77,6% in 2011. The proportion living in traditional and informal dwellings decreased (18,3% to 7,9% as far as traditional dwellings are concerned and from 16,2% as far as informal dwellings are concerned).
Figure 3.8: Percentage of households that have access to piped water by province, Census 2011
Figure 3.8 shows that the proportion of households having access to piped water is high in all provinces. The highest proportion of those with piped water inside the dwelling or yard is in Gauteng with 89,4%, followed closely by Free State with 89,1%. Western Cape is at 88,4% of households in this category.
The proportion of households that reported to have no access to piped water is highest in Eastern Cape (22,2%), followed by 14,1% in KwaZulu-Natal and Limpopo with 14,0% respectively.
13 | P a g e
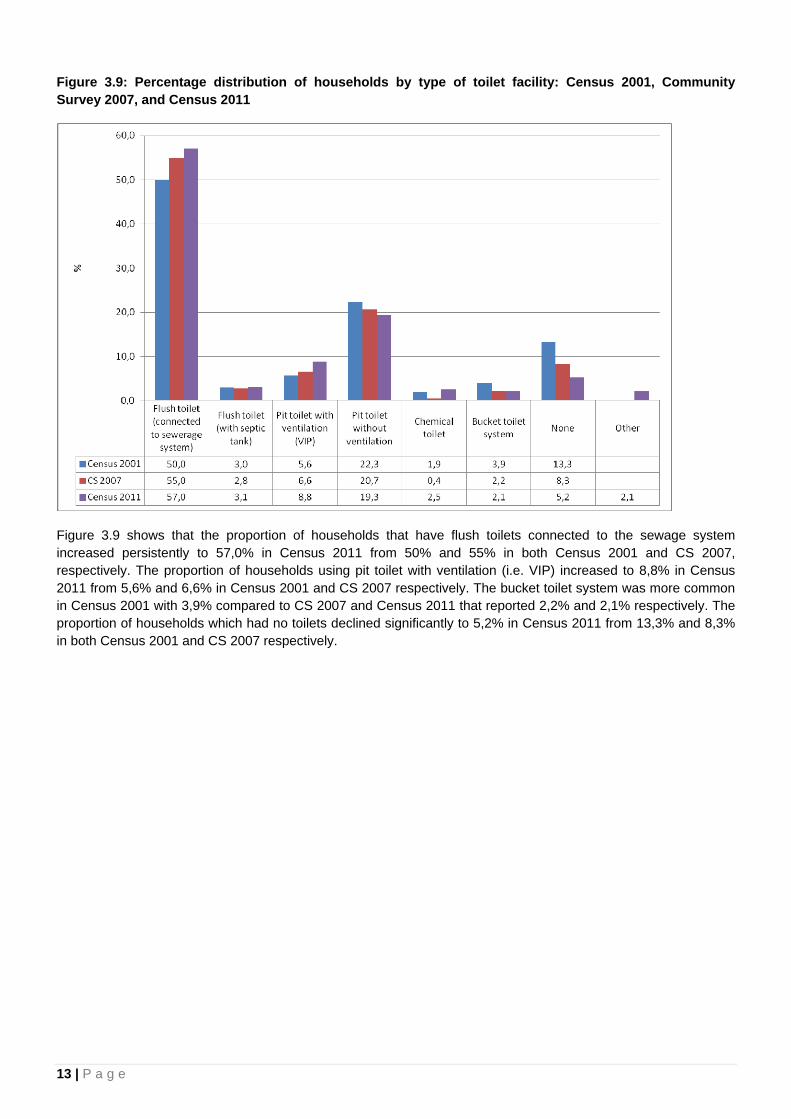
Figure 3.9: Percentage distribution of households by type of toilet facility: Census 2001, Community Survey 2007, and Census 2011
Figure 3.9 shows that the proportion of households that have flush toilets connected to the sewage system increased persistently to 57,0% in Census 2011 from 50% and 55% in both Census 2001 and CS 2007, respectively. The proportion of households using pit toilet with ventilation (i.e. VIP) increased to 8,8% in Census 2011 from 5,6% and 6,6% in Census 2001 and CS 2007 respectively. The bucket toilet system was more common in Census 2001 with 3,9% compared to CS 2007 and Census 2011 that reported 2,2% and 2,1% respectively. The proportion of households which had no toilets declined significantly to 5,2% in Census 2011 from 13,3% and 8,3% in both Census 2001 and CS 2007 respectively.
14 | P a g e
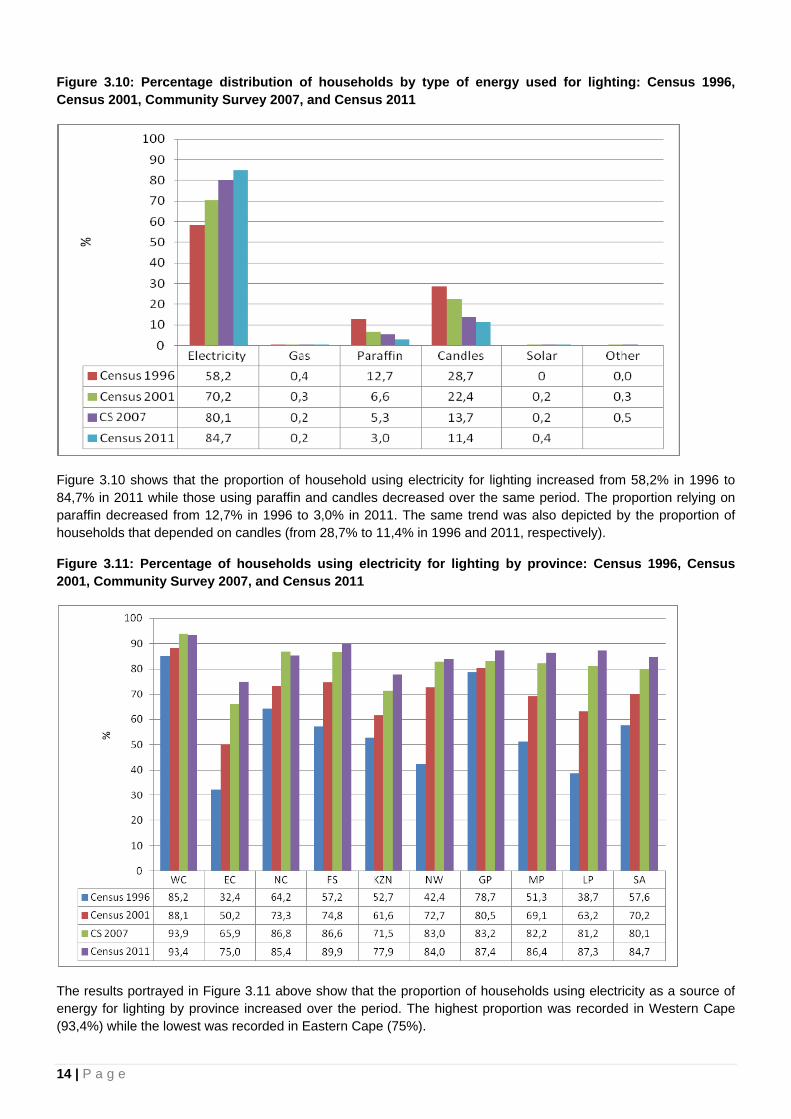
Figure 3.10: Percentage distribution of households by type of energy used for lighting: Census 1996, Census 2001, Community Survey 2007, and Census 2011
Figure 3.10 shows that the proportion of household using electricity for lighting increased from 58,2% in 1996 to 84,7% in 2011 while those using paraffin and candles decreased over the same period. The proportion relying on paraffin decreased from 12,7% in 1996 to 3,0% in 2011. The same trend was also depicted by the proportion of households that depended on candles (from 28,7% to 11,4% in 1996 and 2011, respectively).
Figure 3.11: Percentage of households using electricity for lighting by province: Census 1996, Census 2001, Community Survey 2007, and Census 2011
The results portrayed in Figure 3.11 above show that the proportion of households using electricity as a source of energy for lighting by province increased over the period. The highest proportion was recorded in Western Cape (93,4%) while the lowest was recorded in Eastern Cape (75%).
15 | P a g e
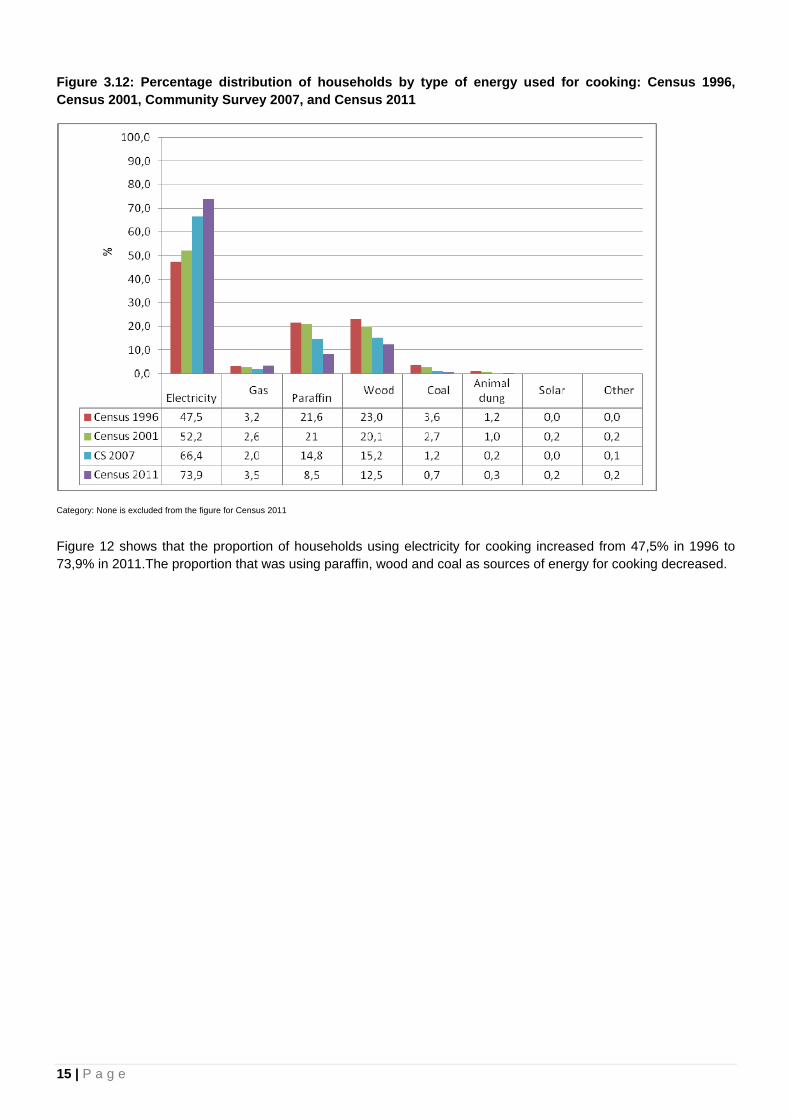
Figure 3.12: Percentage distribution of households by type of energy used for cooking: Census 1996, Census 2001, Community Survey 2007, and Census 2011
Category: None is excluded from the figure for Census 2011
Figure 12 shows that the proportion of households using electricity for cooking increased from 47,5% in 1996 to 73,9% in 2011.The proportion that was using paraffin, wood and coal as sources of energy for cooking decreased.
16 | P a g e
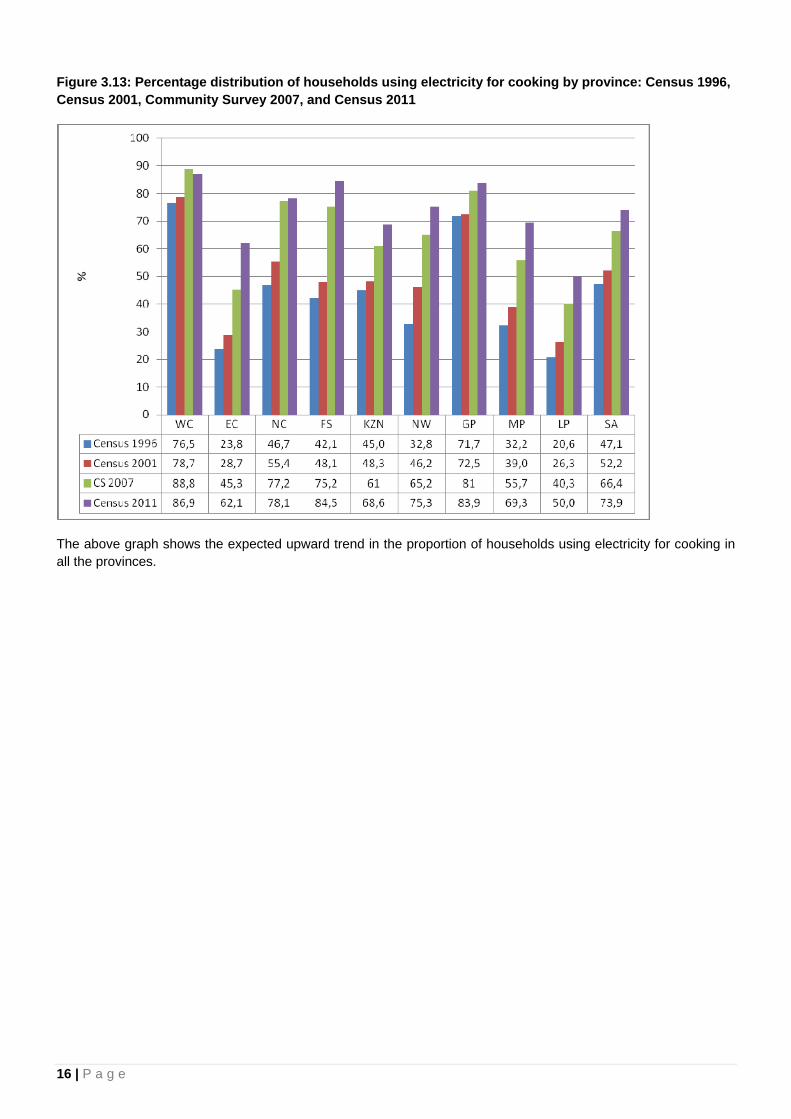
Figure 3.13: Percentage distribution of households using electricity for cooking by province: Census 1996, Census 2001, Community Survey 2007, and Census 2011
The above graph shows the expected upward trend in the proportion of households using electricity for cooking in all the provinces.
17 | P a g e
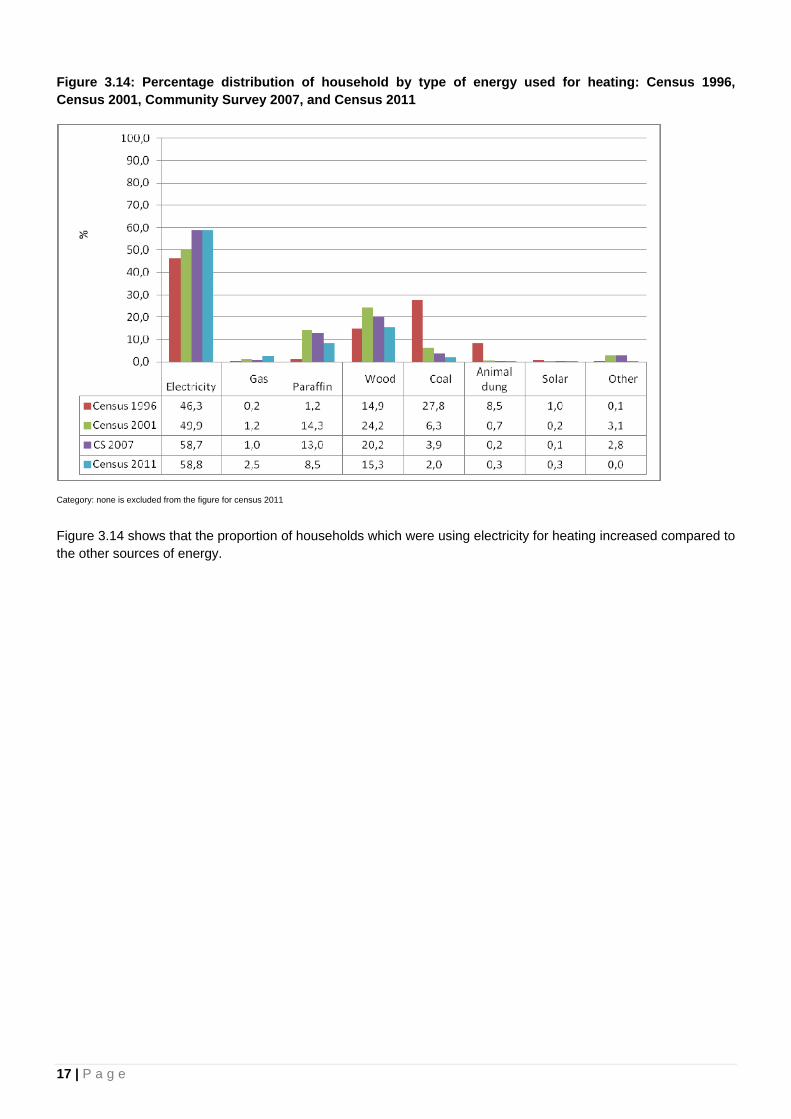
Figure 3.14: Percentage distribution of household by type of energy used for heating: Census 1996, Census 2001, Community Survey 2007, and Census 2011
Category: none is excluded from the figure for census 2011
Figure 3.14 shows that the proportion of households which were using electricity for heating increased compared to the other sources of energy.
18 | P a g e
Figure 3.15: Percentage distribution of households using electricity for heating by province, Census 1996, Census 2001, Community Survey 2007, and Census 2011
The proportion of households using electricity for heating increased over the period in all provinces as shown in Figure 3.15 above. The highest proportion was recorded in Gauteng (74,3%) followed by Western Cape (63,1%).
19 | P a g e
Figure 3.16: Percentage distribution of households by mode of refuse removal: Census 1996, Census 2001, Community Survey 2007, and Census 2011
The above figure shows that the proportion of households whose refuse is removed by local authority weekly increased from 52,1% in 1996 to 62,1% in 2011 while that for those whose refuse was removed less often decreased from 2,2% in 2001 to 1,5% in 2011.
The households depending on communal refuse dump decreased slightly to 1,9% in 2011 from 2,2% in CS 2007. There is a minor decrease of those using own refuse dumps at 28,2% in 2011 from 28,8% in CS 2007. The proportion of households that had no rubbish disposal facilities decreased significantly from 9,7% to 5,4% in Census 1996 and 2011 respectively.
20 | P a g e
Figure 3.17: Percentage of households with household goods in working order, Census 2001, Community Survey 2007, and Census 2011
Figure 3.17 shows that the proportion of households owning cellphones significantly increased from 31,9% in 2001 to 88,9% in 2011. The proportion using the landline decreased from 23,9% in 2001 to 14,5% in 2011.
Annexure: Terms and definitions
Assistive devices and medication
A person who uses eyeglasses or a hearing aid or walking stick/frame or a wheelchair or chronic medication as enablers in correcting for certain impairments.
Bucket toilet system
A toilet system with a pail or other removable receptacle placed directly under the toilet seat, and where no water or chemicals are used.
Census (Population Census)
The process of counting the number of people, at a given point in time in a country, and collecting information about their demographic, social and economic characteristics. After data collection, the process includes the processing, analysis and dissemination of the information collected.
Census night
The night before census day. It is the decisive point of time for being included in the census (midnight on that night).
Collective living quarters/ communal living quarters
Structurally separate and independent places of abode intended for habitation by large groups of individuals or several households. Such quarters usually have certain common facilities, such as cooking and ablution facilities, lounges or dormitories which are shared by the occupants. Collective living quarters may be further classified into hotels, rooming houses and other lodging houses, institutions and camps.
Living quarters where certain facilities are shared by groups of individuals or households. They can be divided into: (a) hotels, motels, guesthouses, etc.; (b) workers' hostels and students' residences; and (c) institutions.
21 | P a g e
Confidentiality
A property of data indicating the extent to which their unauthorised disclosure could be prejudicial or harmful to the interest of the source or other relevant parties.
Converted hostels
Hostels where the accommodation has been converted into self-contained units for households
De facto census
A census in which people are enumerated according to where they were on census night.
De jure census
A census in which people are enumerated according to where they usually live.
Disability
Difficulties encountered in functioning due to body impairments or activity limitation, with or without assistive devices.
Domestic worker
Person employed to work in a household as a cleaner, cook, nanny, gardener, driver, etc. If a domestic worker lives in the same house as the employers, e.g. in a spare bedroom, does not get a form of salary in cash, and shares meals and other resources with the household, then he/she should be treated as part of the main household.
Dwelling unit
Structure or part of a structure or group of structures occupied or meant to be occupied by one or more than one household. Includes structure or part of structure which is vacant and/or under construction, but can be lived in at the time of the survey. Includes units in collective living quarters, unlike housing units. Dwelling units may therefore comprise housing units plus units in collective living quarters when applicable. (Examples of each are a house, a group of huts, and a flat.)
A dwelling unit has a separate entrance from outside or from a common space, as in a block of flats.
Premises not intended for use as living quarters, but used for human habitation at the time of the census, such as a barn, warehouse, etc., are also classified as dwelling units for census purposes.
Enumeration area
An enumeration area (EA) is the smallest geographical unit (piece of land) into which the country is divided for census or survey purposes. EAs typically contain between 100 and 250 households. Each EA is expected to have clearly defined boundaries.
Formal dwelling
A structure built according to approved plans, i.e. house on a separate stand, flat or apartment, townhouse, room in a backyard or rooms or flat-let elsewhere.
Formal sector
Sector of employment made up of all employing businesses that are registered in any way.
Health and functioning
Whether a person has difficulty in seeing, hearing, communicating, walking or climbing stairs, remembering or concentrating, and self-care such as washing all over, dressing or feeding.
22 | P a g e
Household
A household is a group of persons who live together and provide themselves jointly with food or other essentials for living, or a single person who lives alone. Note that a household is not necessarily the same as a family.
Household head
A person recognised as such by household, usually the main decision-maker, or the person who owns or rents the dwelling, or the person who is the main breadwinner. The head can be either male or female. If two people are equal decision-makers, the oldest can be named as the household head.
Household income
All receipts by all members of a household, in cash and in kind, in exchange for employment, or in return for capital investment, or receipts obtained from other sources such as pension.
Informal dwelling
Makeshift structure not approved by a local authority and not intended as a permanent dwelling. Typically built with found materials (corrugated iron, cardboard, plastic, etc.). Contrasted with formal dwelling and traditional dwelling.
Informal sector
A subset of unincorporated enterprises comprising those that produce at least some output for the market; and are less than a specialised size in terms of the number of persons engaged or of employees employed on a continuous basis; and/or not registered under specific forms of national legislation, such as factories, or commercial acts, social security laws, professional groups’ regulatory acts, or similar acts, laws or regulations established by national legislative bodies.
Labour absorption rate
The proportion of the working-age population that is employed.
Labour force
All employed and unemployed persons of working age.
Not economically active population
People who are not available for work such as full-time scholars and students, full-time homemakers, those who are retired and those who are unable or unwilling to work.
Overcount
The number of persons or households inadvertently counted twice in a census.
Post-enumeration survey
A sample survey conducted immediately after a census to evaluate the census. Results are used to make adjustments for the census undercount or overcount.
Proxy
A person who answers on behalf of another person (who is absent or ill, for example). For a census, a proxy is the person that answered on behalf of other members of the household.
Reference period
The period of time (day, week, month, or year) for which information is relevant. The reference period for Census 2011 was 9–10 October 2011.
23 | P a g e
Respondents
The person (or persons) responding in this interview should be a member (members) of the household and be in a position to answer the questions. This will preferably be any responsible adult. For the rest of the questionnaire the respondents should answer these questions for themselves, if possible.
Sex
Biological distinction between males and females.
Traditional dwelling
A dwelling made primarily of clay, mud, reeds or other locally available natural materials. This is a general term that includes huts, rondavels, etc. Such dwellings can be found as single units or in clusters.
Transient
For the purposes of a census, a transient is a person who was travelling on census night (9–10 October), e.g. those at airports, harbours, border posts, people in tourist hotels, camping sites, caravan parks, the homeless and long-distance truck/bus and taxi drivers.
Undercount
The number of people or households that were not counted in a census.
Unspecified
All cases whereby an answer was expected but was left blank during enumeration.
Unoccupied dwelling
A dwelling whose inhabitants are absent at the time of the visit or during the reference period, during a census or survey, e.g. respondents on holiday or migrant workers.
Visitor
By definition of a household, a person visiting or staying with a household who is not a usual member of the household, that is, does not stay in the household four nights a week on average.
Wattle and daub
Traditional construction method whereby walls are built with wooden sticks/poles and covered with mud or a mixture of mud and clay.
Note
For a complete list of concepts, refer to metadata document


![Statistics for Results Facility - World Bankpubdocs.worldbank.org/en/115321572458655979/SRF-Annual... · [4] Highlights This is the tenth annual report on the Statistics for Results](https://img.pdfslide.net/doc/110x75/5f0824717e708231d4208c71/statistics-for-results-facility-world-4-highlights-this-is-the-tenth-annual.jpg)