Embed Size (px)
Citation preview
doi: 10.1098/rsta.2010.0314, 2026-2037369 2011 Phil. Trans. R. Soc. A
N. GedneyC. Huntingford, P. M. Cox, L. M. Mercado, S. Sitch, N. Bellouin, O. Boucher and forcing agents on terrestrial ecosystem servicesHighly contrasting effects of different climate
References
related-urlshttp://rsta.royalsocietypublishing.org/content/369/1943/2026.full.html#
Article cited in: l.html#ref-list-1http://rsta.royalsocietypublishing.org/content/369/1943/2026.ful
This article cites 27 articles, 4 of which can be accessed free
This article is free to access
Rapid response1943/2026http://rsta.royalsocietypublishing.org/letters/submit/roypta;369/
Respond to this article
Subject collections
(98 articles)climatology � (32 articles)biogeochemistry �
(19 articles)meteorology � collectionsArticles on similar topics can be found in the following
Email alerting service herein the box at the top right-hand corner of the article or click Receive free email alerts when new articles cite this article - sign up
http://rsta.royalsocietypublishing.org/subscriptions go to: Phil. Trans. R. Soc. ATo subscribe to
This journal is © 2011 The Royal Society
on April 18, 2011rsta.royalsocietypublishing.orgDownloaded from
Phil. Trans. R. Soc. A (2011) 369, 2026–2037doi:10.1098/rsta.2010.0314
Highly contrasting effects of different climateforcing agents on terrestrial ecosystem services
BY C. HUNTINGFORD1,*, P. M. COX2, L. M. MERCADO1, S. SITCH3,N. BELLOUIN4, O. BOUCHER4 AND N. GEDNEY5
1Centre for Ecology and Hydrology, Wallingford OX10 8BB, UK2College of Engineering, Mathematics and Physical Sciences,
University of Exeter, Exeter EX4 4QF, UK3School of Geography, University of Leeds, Leeds LS2 9JT, UK
4Met Office Hadley Centre, Exeter EX1 3PB, UK5Met Office Hadley Centre, Joint Centre for Hydro-Meteorological Research,
Wallingford OX10 8BB, UK
Many atmospheric constituents besides carbon dioxide (CO2) contribute to globalwarming, and it is common to compare their influence on climate in terms of radiativeforcing, which measures their impact on the planetary energy budget. A number ofrecent studies have shown that many radiatively active constituents also have importantimpacts on the physiological functioning of ecosystems, and thus the ‘ecosystem services’that humankind relies upon. CO2 increases have most probably increased river runoffand had generally positive impacts on plant growth where nutrients are non-limiting,whereas increases in near-surface ozone (O3) are very detrimental to plant productivity.Atmospheric aerosols increase the fraction of surface diffuse light, which is beneficialfor plant growth. To illustrate these differences, we present the impact on net primaryproductivity and runoff of higher CO2, higher near-surface O3, and lower sulphateaerosols, and for equivalent changes in radiative forcing. We compare this with the impactof climate change alone, arising, for example, from a physiologically inactive gas such asmethane (CH4). For equivalent levels of change in radiative forcing, we show that thecombined climate and physiological impacts of these individual agents vary markedlyand in some cases actually differ in sign. This study highlights the need to develop moreinformative metrics of the impact of changing atmospheric constituents that go beyondsimple radiative forcing.
Keywords: global warming; ecosystem services; climate change; methane;carbon dioxide; photosynthesis
1. Atmospheric radiative forcing
A commonly used metric to compare the contributions that different factors maketo climate change is global mean radiative forcing, DQ (W m−2). Radiative forcingcorresponds to the change in net radiation entering the atmosphere [1]. Increases*Author for correspondence ([email protected]).
One contribution of 17 to a Discussion Meeting Issue ‘Greenhouse gases in the Earth system:setting the agenda to 2030’.
This journal is © 2011 The Royal Society2026
on April 18, 2011rsta.royalsocietypublishing.orgDownloaded from
Climate forcing and ecosystem services 2027
in greenhouse gases such as carbon dioxide (CO2) produce a positive radiativeforcing, which warms the planet, whereas increases in reflective sulphate aerosolsresult in a negative value, and therefore a cooling. Humankind is known to bechanging the concentration of greenhouse gases, such as CO2, methane (CH4)and nitrous oxide (N2O). At the same time, anthropogenic activities have alsomodified the atmospheric loading of microscopic ‘aerosol’ particles.
Individual radiative forcings may be combined to give an overall value for DQ,to which the climate system will respond. Global temperature change DT (K)adjusts to this combined radiative forcing, and if DQ is positive then ‘globalwarming’ occurs. Given sufficient time at a fixed forcing change, the Earthsystem will approach a new thermal equilibrium satisfying DQ = lDT . Here,l (W m−2 K−1) determines the change in radiative forcing required to produce1 K of warming. Climate scientists often consider the related inversely linkedequilibrium temperature sensitivity to a doubling of atmospheric CO2, DT2× (K).At present there remains major uncertainty in the value of DT2× (e.g. [2]),although the uncertainty in radiative forcing for greenhouse gases is generallymuch smaller [1].
The additive nature of radiative forcings to give a single, time-varying DQ(t)can provide policymakers with significant manoeuvrability. A particular pathwayin DQ(t) may be recommended to avoid an expected level of dangerous climatechange, but the precise composition of changing greenhouse gas concentrationsis free to be determined. Given the different sources of greenhouse gases, itmay be decided to take a more aggressive stance on reducing CO2 emissionsto allow for larger increases in atmospheric CH4 and N2O—or vice versa.Anthropogenic CO2 emissions are largely due to the burning of fossil fuels anddeforestation, whereas the largest contributions to CH4 and N2O increases areassociated with agriculture. The balance can also take account of changes inlevels of atmospheric ozone (O3) concentrations or aerosols as important cleanair policies are implemented. Reduction in cooling aerosols will actually requiremore aggressive reductions in atmospheric greenhouse gases as sulphate aerosolsare believed to have masked the full extent of current global warming (e.g. [3,4]).
2. Impacts of different atmospheric constituents on ecosystem services
Recent research shows that different radiative forcing agents have markedlycontrasting physiological effects on terrestrial ecosystems. Hence for ecosystemservices, the dimensionality of the climate change problem may not reducesimply to pathways in the single quantity DQ(t). We analyse these differencesthrough changes to four different atmospheric constituents, all of which areexpected to alter markedly through the twenty-first century. First, increases inCO2 will influence vegetation not just through climate change but also by ‘CO2fertilization’ of photosynthesis (e.g. [5]). Second, increases in other atmosphericgreenhouse gases (such as CH4 or N2O) will affect terrestrial ecosystems onlythrough climate change—it is believed that there is no significant physiologicalresponse of vegetation to changes in surface concentrations of these gases. (CH4emissions can have an indirect physiological effect by O3 formation, but thisis small and can be neglected here as tropospheric O3 chemistry is mostlylimited by nitrogen oxide (NOx). N2O is inert in the troposphere and so has no
Phil. Trans. R. Soc. A (2011)
on April 18, 2011rsta.royalsocietypublishing.orgDownloaded from
2028 C. Huntingford et al.
indirect effect.) Third, we consider raised levels of near-surface O3 concentrations,which are known to damage vegetation and reduce the ability to photosynthesize[6–8]. Besides this direct effect, O3 is also a greenhouse gas. Fourth, changedconcentrations of atmospheric aerosols alter levels of surface photosyntheticallyactive radiation (PAR) and its partitioning into direct and diffuse radiation [9].This influences ecosystem net primary productivity (NPP), and in a slightlysurprising way; it has been demonstrated that the increased levels of atmosphericaerosols since pre-industrial periods have actually enhanced photosynthesis,primarily owing to vegetation canopy interactions with higher levels of diffuselight [10]. Increasing aerosol levels also have a climatological influence on theland surface, although in this case through an overall cooling effect.
We characterize physiological and climate responses for these four atmosphericconstituents, in each case for concentration changes that would lead to aradiative forcing of DQ = +1 W m−2. In this idealized experiment, the effectof these prescribed changes on global warming is, therefore, equal accordingto the radiative forcing equivalence paradigm. To place this in context, thepre-industrial to present forcing for CO2 is estimated to be 1.66 W m−2, otherlong-lived greenhouse gases (which include CH4 and N2O) to be 0.98 W m−2,tropospheric O3 to be 0.35 W m−2 and the direct effect of aerosols to be around−0.5 W m−2 [11]. To estimate the ecosystem responses, we use the Joint UK LandEnvironment Simulator (JULES) land surface model, a modelling system suitablefor prediction at large spatial scales. The JULES model has two components.The first calculates heat, water and carbon fluxes [12,13]. This has recently beenextended to include a multi-layer canopy description as needed to capture thePAR responses recently identified [14]. The second component (called TRIFFID—Top-down Representation of Interactive Foliage and Flora Including Dynamics)predicts global vegetation distributions and associated carbon content. Five plantfunctional type (PFT) classes are represented: broadleaf trees, needleleaf trees,shrubs and C3 and C4 grasses. The model determines fractional coverage of eachPFT based on the available resources using Lotka–Volterra equations.
We run the JULES model for all land regions (excluding Antarctica) on a2.5◦ latitude by 3.75◦ longitude grid, and, unless otherwise stated, we use thesame methodology as in the previous published studies [6,10,15]. An initial controlsimulation is forced with gridded mean climatological data representative of theperiod 1980–1999 [16]. Direct and diffuse short-wave fluxes were reconstructedusing aerosol distributions simulated by the Hadley Centre Global EnvironmentModel, HadGEM2-A, and radiative transfer calculations [10]. The effect of themajor volcanic eruptions of El Chichón (Mexico) and Mount Pinatubo (ThePhilippines) are excluded from the means for 1980–1999 (i.e. periods 1982–1984and 1991–1993, respectively). Atmospheric CO2 concentration is set to the 1980–1999 average (354 ppm). Fields of surface O3 are prescribed to be representativeof year 1990. For each land point, gridbox averaged values of NPP (kg C m−2 yr−1)and runoff (R) (m3 m−2 yr−1) are calculated. Global values of these quantities forthis control simulation (in units of Gt C yr−1 and 1012 m3 yr−1, respectively) areplotted in black in figure 1a,b. Global values of soil plus vegetation carbon aregiven as the single number (1613 Gt C) in table 1.
In order to compare the impacts of different radiative forcing agents we makesimulations of the equilibrium state of the vegetation and soil for each of thephysiological or climate drivers outlined above (note this differs from [15], which
Phil. Trans. R. Soc. A (2011)
on April 18, 2011rsta.royalsocietypublishing.orgDownloaded from
Climate forcing and ecosystem services 2029
46(a) (b)
44
42
40
38
36
3440 45 50 55 60 65 70
net primary productivity (Gt C yr–1)
40 45 50 55 60 65 70
net primary productivity (Gt C yr–1)
runo
ff (
1012
m3 y
r–1)
control simulation
CO2 increase
O3 increaseaerosol decrease
climate change
control simulation
CO2 increase
O3 increaseaerosol decrease
CH4, N2O increase
individual physiological or climate impacts overall impact
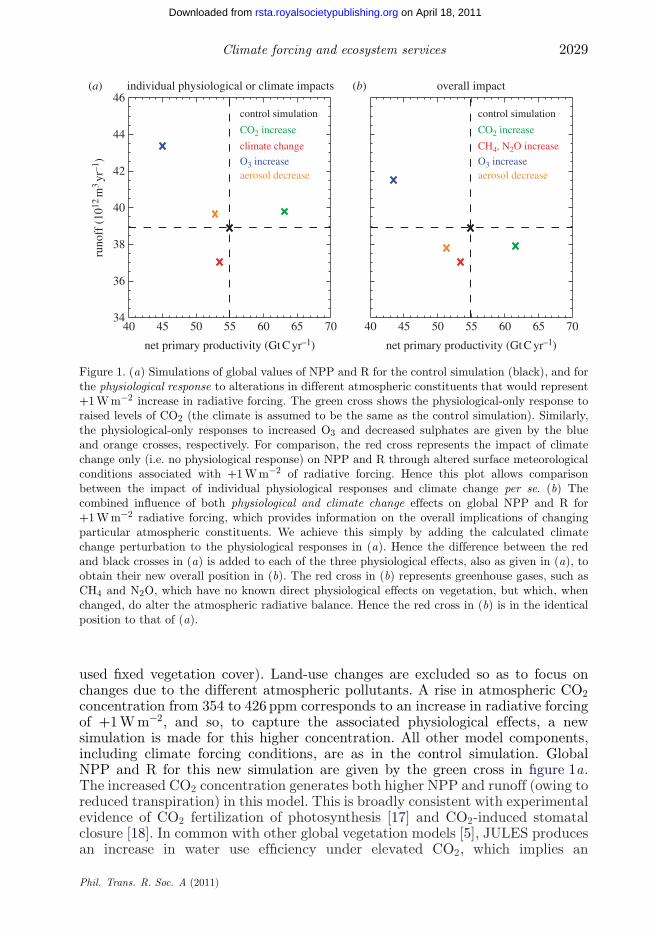
Figure 1. (a) Simulations of global values of NPP and R for the control simulation (black), and forthe physiological response to alterations in different atmospheric constituents that would represent+1 W m−2 increase in radiative forcing. The green cross shows the physiological-only response toraised levels of CO2 (the climate is assumed to be the same as the control simulation). Similarly,the physiological-only responses to increased O3 and decreased sulphates are given by the blueand orange crosses, respectively. For comparison, the red cross represents the impact of climatechange only (i.e. no physiological response) on NPP and R through altered surface meteorologicalconditions associated with +1 W m−2 of radiative forcing. Hence this plot allows comparisonbetween the impact of individual physiological responses and climate change per se. (b) Thecombined influence of both physiological and climate change effects on global NPP and R for+1 W m−2 radiative forcing, which provides information on the overall implications of changingparticular atmospheric constituents. We achieve this simply by adding the calculated climatechange perturbation to the physiological responses in (a). Hence the difference between the redand black crosses in (a) is added to each of the three physiological effects, also as given in (a), toobtain their new overall position in (b). The red cross in (b) represents greenhouse gases, such asCH4 and N2O, which have no known direct physiological effects on vegetation, but which, whenchanged, do alter the atmospheric radiative balance. Hence the red cross in (b) is in the identicalposition to that of (a).
used fixed vegetation cover). Land-use changes are excluded so as to focus onchanges due to the different atmospheric pollutants. A rise in atmospheric CO2concentration from 354 to 426 ppm corresponds to an increase in radiative forcingof +1 W m−2, and so, to capture the associated physiological effects, a newsimulation is made for this higher concentration. All other model components,including climate forcing conditions, are as in the control simulation. GlobalNPP and R for this new simulation are given by the green cross in figure 1a.The increased CO2 concentration generates both higher NPP and runoff (owing toreduced transpiration) in this model. This is broadly consistent with experimentalevidence of CO2 fertilization of photosynthesis [17] and CO2-induced stomatalclosure [18]. In common with other global vegetation models [5], JULES producesan increase in water use efficiency under elevated CO2, which implies an
Phil. Trans. R. Soc. A (2011)
on April 18, 2011rsta.royalsocietypublishing.orgDownloaded from
2030 C. Huntingford et al.
Table 1. Total terrestrial carbon content (vegetation and soil) for each of the five simulationspresented in figure 1a. The percentage differences away from the control simulation are given inthe third column, and the absolute changes in terrestrial carbon content are presented in the lastcolumn. Under the assumption of linearity, terrestrial carbon contents corresponding to figure 1bwould be found by subtracting the difference between control and climate change simulations (i.e.subtract 116 Gt C) away from the other three altered atmospheric constituent simulations.
terrestrial carbon % change change in(vegetation + soil) from control terrestrial
simulation (Gt C) simulation carbon (Gt C)
control 1613increased CO2 1819 +12.8 +206climate change 1497 −7.2 −116increased O3 1365 −15.4 −248decreased aerosol 1548 −4.0 −65
increase in photosynthesis, a reduction in transpiration, or a combination ofboth. Models differ in the balance between these manifestations of increasingwater-use efficiency, in large part because they disagree on the extent to whichincreasing leaf area index offsets the reduced water use by each leaf [19].However, the almost universal agreement that plant water-use efficiency increasesunder elevated CO2—and in most models this is associated with increasedrunoff [5]—implies a high degree of confidence that CO2 fits uniquely into thehigher NPP and higher R quadrant of figure 1a. This is despite the remaininguncertainties in the exact magnitude of CO2 effects on photosynthesis andstomatal conductance.
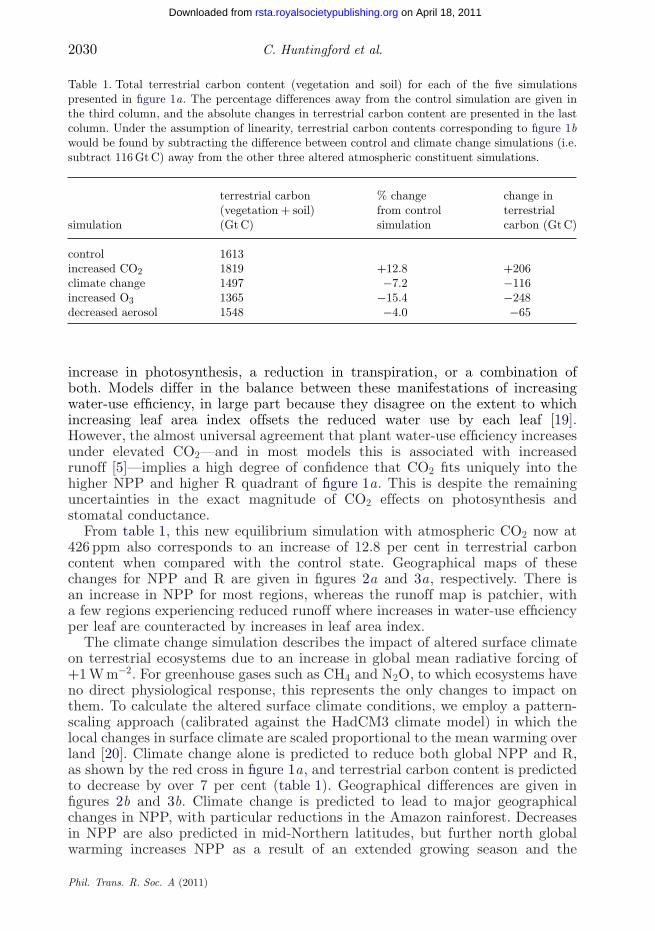
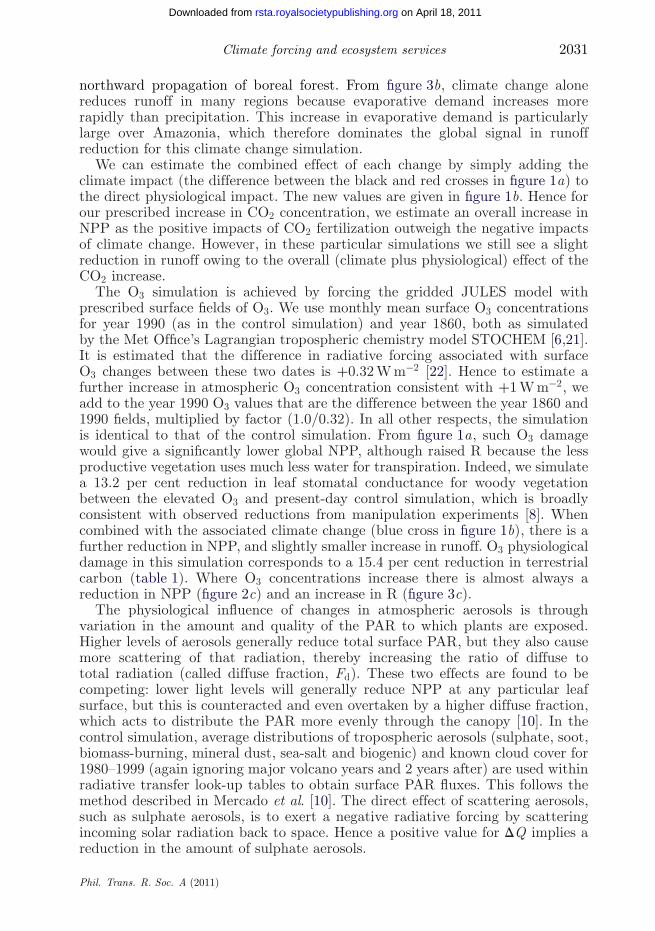
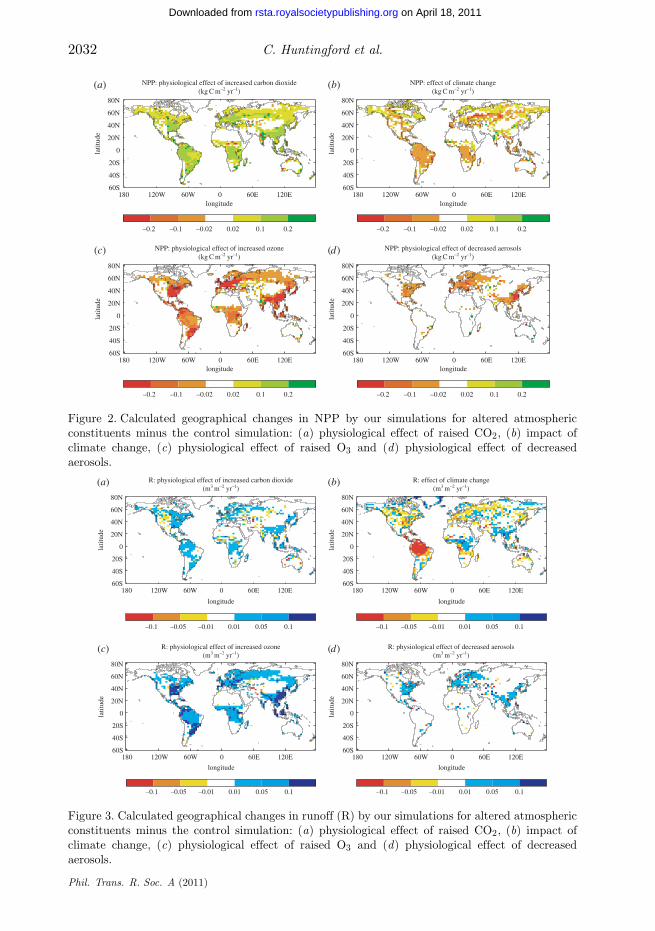
From table 1, this new equilibrium simulation with atmospheric CO2 now at426 ppm also corresponds to an increase of 12.8 per cent in terrestrial carboncontent when compared with the control state. Geographical maps of thesechanges for NPP and R are given in figures 2a and 3a, respectively. There isan increase in NPP for most regions, whereas the runoff map is patchier, witha few regions experiencing reduced runoff where increases in water-use efficiencyper leaf are counteracted by increases in leaf area index.
The climate change simulation describes the impact of altered surface climateon terrestrial ecosystems due to an increase in global mean radiative forcing of+1 W m−2. For greenhouse gases such as CH4 and N2O, to which ecosystems haveno direct physiological response, this represents the only changes to impact onthem. To calculate the altered surface climate conditions, we employ a pattern-scaling approach (calibrated against the HadCM3 climate model) in which thelocal changes in surface climate are scaled proportional to the mean warming overland [20]. Climate change alone is predicted to reduce both global NPP and R,as shown by the red cross in figure 1a, and terrestrial carbon content is predictedto decrease by over 7 per cent (table 1). Geographical differences are given infigures 2b and 3b. Climate change is predicted to lead to major geographicalchanges in NPP, with particular reductions in the Amazon rainforest. Decreasesin NPP are also predicted in mid-Northern latitudes, but further north globalwarming increases NPP as a result of an extended growing season and the
Phil. Trans. R. Soc. A (2011)
on April 18, 2011rsta.royalsocietypublishing.orgDownloaded from
Climate forcing and ecosystem services 2031
northward propagation of boreal forest. From figure 3b, climate change alonereduces runoff in many regions because evaporative demand increases morerapidly than precipitation. This increase in evaporative demand is particularlylarge over Amazonia, which therefore dominates the global signal in runoffreduction for this climate change simulation.
We can estimate the combined effect of each change by simply adding theclimate impact (the difference between the black and red crosses in figure 1a) tothe direct physiological impact. The new values are given in figure 1b. Hence forour prescribed increase in CO2 concentration, we estimate an overall increase inNPP as the positive impacts of CO2 fertilization outweigh the negative impactsof climate change. However, in these particular simulations we still see a slightreduction in runoff owing to the overall (climate plus physiological) effect of theCO2 increase.
The O3 simulation is achieved by forcing the gridded JULES model withprescribed surface fields of O3. We use monthly mean surface O3 concentrationsfor year 1990 (as in the control simulation) and year 1860, both as simulatedby the Met Office’s Lagrangian tropospheric chemistry model STOCHEM [6,21].It is estimated that the difference in radiative forcing associated with surfaceO3 changes between these two dates is +0.32 W m−2 [22]. Hence to estimate afurther increase in atmospheric O3 concentration consistent with +1 W m−2, weadd to the year 1990 O3 values that are the difference between the year 1860 and1990 fields, multiplied by factor (1.0/0.32). In all other respects, the simulationis identical to that of the control simulation. From figure 1a, such O3 damagewould give a significantly lower global NPP, although raised R because the lessproductive vegetation uses much less water for transpiration. Indeed, we simulatea 13.2 per cent reduction in leaf stomatal conductance for woody vegetationbetween the elevated O3 and present-day control simulation, which is broadlyconsistent with observed reductions from manipulation experiments [8]. Whencombined with the associated climate change (blue cross in figure 1b), there is afurther reduction in NPP, and slightly smaller increase in runoff. O3 physiologicaldamage in this simulation corresponds to a 15.4 per cent reduction in terrestrialcarbon (table 1). Where O3 concentrations increase there is almost always areduction in NPP (figure 2c) and an increase in R (figure 3c).
The physiological influence of changes in atmospheric aerosols is throughvariation in the amount and quality of the PAR to which plants are exposed.Higher levels of aerosols generally reduce total surface PAR, but they also causemore scattering of that radiation, thereby increasing the ratio of diffuse tototal radiation (called diffuse fraction, Fd). These two effects are found to becompeting: lower light levels will generally reduce NPP at any particular leafsurface, but this is counteracted and even overtaken by a higher diffuse fraction,which acts to distribute the PAR more evenly through the canopy [10]. In thecontrol simulation, average distributions of tropospheric aerosols (sulphate, soot,biomass-burning, mineral dust, sea-salt and biogenic) and known cloud cover for1980–1999 (again ignoring major volcano years and 2 years after) are used withinradiative transfer look-up tables to obtain surface PAR fluxes. This follows themethod described in Mercado et al. [10]. The direct effect of scattering aerosols,such as sulphate aerosols, is to exert a negative radiative forcing by scatteringincoming solar radiation back to space. Hence a positive value for DQ implies areduction in the amount of sulphate aerosols.
Phil. Trans. R. Soc. A (2011)
on April 18, 2011rsta.royalsocietypublishing.orgDownloaded from
2032 C. Huntingford et al.
80N
NPP: physiological effect of increased carbon dioxide(kg C m–2 yr–1)
NPP: physiological effect of increased ozone(kg C m–2 yr–1)
(c)
(a)
(d)
(b)
NPP: physiological effect of decreased aerosols(kg C m–2 yr–1)
NPP: effect of climate change(kg C m–2 yr–1)
60N
40N
20N
20S
40S
60S180 120W 60W 0 60E 120E
longitude
latit
ude
–0.2 –0.1 –0.02 0.02 0.1 0.2
0
80N
60N
40N
20N
20S
40S
60S180 120W 60W 0 60E 120E
longitude
latit
ude
–0.2 –0.1 –0.02 0.02 0.1 0.2
0
80N
60N
40N
20N
20S
40S
60S180 120W 60W 0 60E 120E
longitude
latit
ude
–0.2 –0.1 –0.02 0.02 0.1 0.2
0
80N
60N
40N
20N
20S
40S
60S180 120W 60W 0 60E 120E
longitude
latit
ude
–0.2 –0.1 –0.02 0.02 0.1 0.2
0
Figure 2. Calculated geographical changes in NPP by our simulations for altered atmosphericconstituents minus the control simulation: (a) physiological effect of raised CO2, (b) impact ofclimate change, (c) physiological effect of raised O3 and (d) physiological effect of decreasedaerosols.
80N
R: physiological effect of increased carbon dioxide(m3
m–2 yr–1)
R: physiological effect of increased ozone(m3
m–2 yr–1)(c)
(a)
(d)
(b)
R: physiological effect of decreased aerosols(m3
m–2 yr–1)
R: effect of climate change(m3
m–2 yr–1)
60N
40N
20N
20S
40S
60S180 120W 60W 0 60E 120E
longitude
latit
ude
–0.1 –0.05 –0.01 0.01 0.05 0.1 –0.1 –0.05 –0.01 0.01 0.05 0.1
–0.1 –0.05 –0.01 0.01 0.05 0.1 –0.1 –0.05 –0.01 0.01 0.05 0.1
0
80N
60N
40N
20N
20S
40S
60S180 120W 60W 0 60E 120E
longitude
latit
ude
0
80N
60N
40N
20N
20S
40S
60S180 120W 60W 0 60E 120E
longitude
latit
ude
0
80N
60N
40N
20N
20S
40S
60S180 120W 60W 0 60E 120E
longitude
latit
ude
0
Figure 3. Calculated geographical changes in runoff (R) by our simulations for altered atmosphericconstituents minus the control simulation: (a) physiological effect of raised CO2, (b) impact ofclimate change, (c) physiological effect of raised O3 and (d) physiological effect of decreasedaerosols.
Phil. Trans. R. Soc. A (2011)
on April 18, 2011rsta.royalsocietypublishing.orgDownloaded from
Climate forcing and ecosystem services 2033
Sulphate aerosol concentrations in particular increased throughout thetwentieth century. Hence to simulate a positive aerosol radiative forcing, wereplace the distribution of sulphate aerosol for the period 1980–1999 (as usedin the control) with those believed to be appropriate for year 1901. This providesa forcing of +0.26 W m−2 at the top of the atmosphere. Surface PAR fluxesare then recomputed with this revised distribution of sulphate aerosol, anda new global equilibrium simulation is undertaken. Differences in ecosystemresponse from the control simulation are then normalized by the forcing of+0.26 W m−2 (i.e. we multiply differences by 1.0/0.26) to allow comparisonwith the other climate agents on the basis of an equivalent radiative forcingof +1 W m−2. However, this may neglect some nonlinearity in the responseof ecosystems to changes in direct and diffuse radiation. Cloud cover andconcentrations of the other tropospheric aerosol species remain unchanged attheir 1980–1999 average. In agreement with the analysis of Mercado et al. [10],a major reduction in atmospheric aerosols yields a significant decrease in NPP(figure 1, orange cross), and from table 1 there is also a 4 per cent decreasein total terrestrial carbon content. Global mean runoff is modelled to increase,as the less productive vegetation uses less water for transpiration. Short-livedaerosols are far less well mixed in the atmosphere than long-lived greenhousegases, and as a result diffuse radiation effects are most obvious near to theindustrial areas that dominate the sulphur emissions (figures 2d and 3d). Whenthe physiological impacts are combined with climate change, the orange cross infigure 1b implies that aerosol reduction will overall cause an actual decrease inboth NPP and R. However, the precise values here should be treated carefully, asthe climate change associated with changes in aerosols will be more regionalizedthan that of our climate change simulation associated with well-mixedgreenhouse gases.
3. Discussion
Climate change caused by changes in atmospheric constituents is usuallyexpressed in terms of radiative forcing. Advice to policymakers working to avoidlevels of unwelcome or even dangerous climate change is often presented in termsof upper limits to such forcing. This is sometimes translated into ‘equivalentCO2 concentrations’, with the implication that there is significant freedom inconstituent changes as long as total radiative forcing stays within prescribedlimits. However, some of the greatest impacts on humankind will occur throughchanges in food and water availability [23] rather than through climate changeper se. NPP and runoff levels are indicators of such availability, and a setof recent research papers have shown that the direct physiological effects ofchanging different atmospheric constituents on these ecosystem services is largeand varied. This implies that consideration should be given to going beyondthe single ‘radiative equivalence’ metric when addressing the overall impacts ofdifferent atmospheric pollutants. For equivalent radiative forcing (of +1 W m−2),we calculate changes in NPP and R for (i) increases in CO2, (ii) increases ingreenhouse gases with no physiological effects and hence only climate impactssuch as CH4 or N2O, (iii) increases in ground-level O3, and (iv) decreases in
Phil. Trans. R. Soc. A (2011)
on April 18, 2011rsta.royalsocietypublishing.orgDownloaded from
2034 C. Huntingford et al.
sulphate aerosols. The global overall effects (physiological plus climate) arepresented in figure 1b for both NPP and R, and most importantly are foundto have different signs.
The fertilization effect of higher CO2 levels, which is not present for othergreenhouse gases, offsets the detrimental influence of imposed climate change.This suggests that a greater emphasis should be placed on also dealing with non-CO2 causes of global warming. On the basis of our calculations, the differencebetween the overall impact of a +1 W m−2 increase in atmospheric CO2 ascompared with a +1 W m−2 increase in the concentration of a physiologicallyinactive atmospheric constituent such as CH4 amounts to about 5 per centhigher values of global runoff and 10 per cent higher values of NPP. Anotherinterpretation of figure 1 is that higher levels of atmospheric sulphates mayactually be beneficial in the context of NPP and R, owing to the higherdiffuse fraction aiding photosynthesis along with an overall cooling effect (i.e.offsetting global warming). This also has implications for the geoengineeringoption being considered, using deliberate aerosol increases to counteract climatechange. However, such gains from raised NPP and R values should be balancedagainst the uncertain but potentially very damaging effects of ocean acidificationassociated with higher CO2 on coral reefs, shell-forming marine organisms [24]and fish populations [25].
While trusting the qualitative features of our analysis, there do remainimportant uncertainties in the size of direct physiological effects of differentatmospheric constituents. This is particularly true of CO2 fertilization [17,26]and this represents a critical limitation for the comparison of different mitigationoptions. The magnitude of this effect may be altered in mid- and high-latitudeecosystems by plant nitrogen availability, and possibly by phosphorus cycling intropical ecosystems [27,28], although these processes are not yet fully understood.The nitrogen cycle is only now beginning to be depicted in general circulationmodelling (GCM) land surface models suitable for global-scale simulations [29].Further studies are required to determine the overall impact of alternative aerosoltypes. We have analysed the response to sulphate aerosols because of their largeconcentrations and ubiquitous nature. However, emerging understanding of howchanged levels of black carbon and biomass-burning affect the atmosphere willallow the implications of these aerosols also to be incorporated in a similarframework. Our study has also only considered equilibrium climate states forchanges to NPP and runoff. In a transient climate, the precise magnitude ofclimate versus physiological effects may differ.
This study argues for metrics to compare different atmospheric pollutantsthat go beyond radiative forcing and global warming. Here, we have consideredimpacts on the vital terrestrial ecosystem services related to the availability offood and water, but we accept that there will be other alternative metrics toradiative forcing that could provide insights into the overall impacts of differentclimate mitigation options. Key among these are metrics related to air quality andhuman health [30], and the impacts of ocean acidification on marine ecosystemservices [25].
Although the largest anthropogenic change to radiative forcing, and thuscontribution to climate change, has been through increases in atmospheric CO2concentration, without such metrics there is the risk that action on climatechange mitigation will become overly concerned with reducing CO2 emissions.
Phil. Trans. R. Soc. A (2011)
on April 18, 2011rsta.royalsocietypublishing.orgDownloaded from
Climate forcing and ecosystem services 2035
This could have potentially counterproductive consequences for human well-beingand also risks missing other co-benefits associated with the abatement of non-CO2greenhouse gases [31]. We have highlighted the differentiated impacts (includingregional variation) that climate forcing agents have on ecosystem services, andargue that they require consideration in both mitigation and adaptation measuresproposed to minimize the effect of climate change on society.
The authors acknowledge funding from the CEH Science budget (C.H. and L.M.M.), the JointDECC and Defra Integrated Climate Programme (N.B., O.B. and N.G.), the NERC QUESTinitiative (C.H., P.M.C. and S.S.) and the NERC CLASSIC project (L.M.M.). C.H. and P.M.C.developed the overall metric structure for comparison between different forcing agents. C.H.undertook the simulations. L.M.M. and S.S. provided validated numerical code to model surfaceresponse down through a canopy to altered levels of PAR. S.S. provided advice on model responseto raised levels of O3, and aided with the overall modelling effort. N.B. and O.B. providedboth PAR fields for present-day conditions and estimates for decreased levels of atmosphericsulphate aerosols. N.G. provided advice on our predictions of changed runoff levels. All authorsdiscussed the results, the format of presentation of our analysis and contributed to the writingof the paper.
References
1 Ramaswamy, V., Boucher, O., Haigh, J., Hauglustaine, D., Haywood, J., Myhre, G., Nakajima,T., Shi, G. Y. & Solomon, S. 2001 Radiative forcing of climate change. In Climate change 2001:the scientific basis. Contribution of Working Group I to the Third Assessment Report of theIntergovernmental Panel on Climate Change (eds J. T. Houghton, Y. Ding, D. J. Griggs, M.Noguer, P. J. van der Linden, X. Dai, K. Maskell & C. A. Johnson). Cambridge, UK: CambridgeUniversity Press.
2 Hegerl, G. C., Zwiers, F. W., Braconnot, P., Gillett, N. P., Luo, Y., Marengo, J. A., Nicholls, N.,Penner, J. E. & Stott, P. A. 2007 Understanding and attributing climate change. In Climatechange 2007: the physical basis. Contribution of Working Group I to the Fourth AssessmentReport of the Intergovernmental Panel on Climate Change (eds S. Solomon, D. Qin, M. Manning,Z. Chen, M. Marquis, K. B. Averyt, M. Tignor & H. L. Miller). Cambridge, UK: CambridgeUniversity Press.
3 Andreae, M. O., Jones, C. D. & Cox, P. M. 2005 Strong present-day aerosol cooling implies ahot future. Nature 435, 1187–1190. (doi:10.1038/nature03671)
4 Stott, P. A., Huntingford, C., Jones, C. D. & Kettleborough, J. A. 2008 Observed climatechange constrains the likelihood of extreme future global warming. Tellus B 60, 76–81.(doi:10.1111/j.1600-0889.2007.00329.x)
5 Cramer, W. et al. 2001 Global response of terrestrial ecosystem structure and function to CO2and climate change: results from six dynamic global vegetation models. Glob. Change Biol. 7,357–374. (doi:10.1046/j.1365-2486.2001.00383.x)
6 Sitch, S., Cox, P. M., Collins, W. J. & Huntingford, C. 2007 Indirect radiative forcing of climatechange through ozone effects on the land-carbon sink. Nature 448, 791–794. (doi:10.1038/nature06059)
7 Ashmore, M. R. 2005 Assessing the future global impacts of ozone on vegetation. Plant, CellEnviron. 28, 949–964. (doi:10.1111/j.1365-3040.2005.01341.x)
8 Wittig, V. E., Ainsworth, E. A. & Long, S. P. 2007 To what extent do current and projectedincreases in surface ozone affect photosynthesis and stomatal conductance of trees? A meta-analytic review of the last three decades of experiments. Plant, Cell Environ. 30, 1150–1162.(doi:10.1111/j.1365-3040.2007.01717.x)
9 Wild, M. 2009 Global dimming and brightening: a review. J. Geophys. Res. 114, D00D16.(doi:10.1029/2008JD011470)
Phil. Trans. R. Soc. A (2011)
on April 18, 2011rsta.royalsocietypublishing.orgDownloaded from
2036 C. Huntingford et al.
10 Mercado, L. M., Bellouin, N., Sitch, S., Boucher, O., Huntingford, C., Wild, M. & Cox,P. M. 2009 Impact of changes in diffuse radiation on the global land carbon sink. Nature458, 1014–1017. (doi:10.1038/nature07949)
11 IPCC. 2007 Summary for policymakers. In Climate change 2007: the physical basis. Contributionof Working Group I to the Fourth Assessment Report of the Intergovernmental Panel on ClimateChange (eds S. Solomon, D. Qin, M. Manning, Z. Chen, M. Marquis, K. B. Averyt, M. Tignor& H. L. Miller). Cambridge, UK: Cambridge University Press.
12 Cox, P. M., Betts, R. A., Bunton, C. B., Essery, R. L. H., Rowntree, P. R. & Smith, J. 1999 Theimpact of new land surface physics on the GCM simulation of climate and climate sensitivity.Clim. Dynam. 15, 183–203. (doi:10.1007/s003820050276)
13 Cox, P. M., Huntingford, C. & Harding, R. J. 1998 A canopy conductance and photosynthesismodel for use in a GCM land surface scheme. J. Hydrol. 213, 79–94. (doi:10.1016/S0022-1694(98)00203-0)
14 Mercado, L. M., Huntingford, C., Gash, J. H. C., Cox, P. M. & Jogireddy, V. 2007 Improvingthe representation of radiation interception and photosynthesis for climate model applications.Tellus B 59, 553–565. (doi:10.1111/j.1600-0889.2007.00256.x)
15 Gedney, N., Cox, P. M., Betts, R. A., Boucher, O., Huntingford, C. & Stott, P. A. 2006Detection of a direct carbon dioxide effect in continental river runoff records. Nature 439,835–838. (doi:10.1038/nature04504)
16 New, M., Hulme, M. & Jones, P. 2000 Representing twentieth-century space-timeclimate variability, Part II: Development of 1901–96 monthly grids of terrestrialsurface climate. J. Climate 12, 2217–2238. (doi:10.1175/1520-0442(2000)013<2217:RTCSTC>2.0.CO;2)
17 Norby, R. J. et al. 2005 Forest response to elevated CO2 is conserved across a broad range ofproductivity. Proc. Natl Acad. Sci. USA 50, 18 052–18 056. (doi:10.1073/pnas.0509478102)
18 Field, C. B., Jackson, R. B. & Mooney, H. A. 1995 Stomatal responses to increasedCO2—implications from the plant to the global scale. Plant, Cell Environ. 18, 1214–1225.(doi:10.1111/j.1365-3040.1995.tb00630.x)
19 Piao, S. L., Friedlingstein, P., Ciais, P., de Noblet-Ducoudre, N., Labat, D. & Zaehle, S.2007 Changes in climate and land use have a larger direct impact than rising CO2 on globalriver runoff trends. Proc. Natl Acad. Sci. USA 104, 15 242–15 247. (doi:10.1073/pnas.0707213104)
20 Huntingford, C. & Cox, P. M. 2000 An analogue model to derive additional climatechange scenarios from existing GCM simulations. Climate Dyn. 16, 575–586. (doi:10.1007/s003820000067)
21 Sanderson, M. G., Jones, C. D., Collins, W. J., Johnson, C. E. & Derwent, R. G. 2003 Effectof climate change on isoprene emissions and surface ozone levels. Geophys. Res. Lett. 30, 1936.(doi:10.1029/2003GL017642)
22 Gauss, M., Myhre, G. & Isaksen, I. S. A. 2006 Radiative forcing since preindustrial times due toozone changes in the troposphere and the lower stratosphere. Atmos. Chem. Phys. 6, 575–599.(doi:10.5194/acp-6-575-2006)
23 Parry, M. et al. 2001 Millions at risk: defining critical climate change threats and targets. GlobalEnviron. Change, Hum. Policy Dimens. 11, 181–183. (doi:10.1016/S0959-3780(01)00011-5)
24 Caldeira, K. & Wickett, M. E. 2003 Anthropogenic carbon and ocean pH. Nature 425, 365–368.(doi:10.1038/425365a)
25 Cooley, S. R., Kite-Powell, H. L. & Doney, S. C. 2009 Ocean acidification’s potential to alterglobal marine ecosystem services. Oceanography 22, 172–181.
26 Korner, C., Asshoff, R., Bignucolo, O., Hattenschwiler, S., Keel, S. G., Pelaez-Riedl, S., Pepin,S., Siegwolf, R. T. W. & Zotz, G. 2005 Carbon flux and growth in mature deciduous foresttrees exposed to elevated CO2. Science 309, 1360–1362. (doi:10.1126/science.1113977)
27 Lloyd, J., Bird, M. I., Veenendaal, E. M. & Kruijt, B. 2001 Should phosphorus availabilitybe constraining moist tropical forest responses to increasing CO2 concentrations? In Globalbiogeochemical cycles in the climate system (eds E. D. Schulze, D. S. Schimel, M. Heimann,S. P. Harrison, E. A. Holland, J. Lloyd & I. C. Prentice). San Diego, CA: Academic Press.
Phil. Trans. R. Soc. A (2011)
on April 18, 2011rsta.royalsocietypublishing.orgDownloaded from

Climate forcing and ecosystem services 2037
28 Vitousek, P. M. & Sanford, R. L. 1986 Nutrient cycling in moist tropical forest. Annu. Rev.Ecol. Syst. 17, 137–167. (doi:10.1146/annurev.es.17.110186.001033)
29 Thornton, P. E., Lamarque, J. F., Rosenbloom, N. A. & Mahowald, N. M. 2007 Influenceof carbon–nitrogen cycle coupling on land model response to CO2 fertilization and climatevariability. Global Biogeochem. Cycles 21, GB4018. (doi:10.1029/2006GB002868)
30 West, J. J., Fiore, A. M., Horowitz, L. W. & Mauzerall, D. L. 2006 Global health benefits ofmitigation ozone pollution with methane controls. Proc. Natl Acad. Sci. USA 103, 3988–3993.(doi:10.1073/pnas.0600201103)
31 Cox, P. M. & Jeffery, H. A. 2010 Methane radiative forcing controls the permissibleCO2 emissions for climate stabilization. Curr. Opin. Environ. Sustainability 2, 404–408.(doi:10.1016/j.cosust.2010.09.007)
Phil. Trans. R. Soc. A (2011)
on April 18, 2011rsta.royalsocietypublishing.orgDownloaded from