Embed Size (px)
Citation preview
Highway Asset Management
Quick Start Guidance Note
Life Cycle Planning

1 Introduction ..................................................................................................................... 1
2 The Life Cycle Process ................................................................................................... 4
3 Objective and Policies .................................................................................................... 5
4 Inventory and Condition Data ........................................................................................ 6
5 Cost of Maintaining Each Group of Assets .................................................................. 7
6 Performance Gaps .......................................................................................................... 8
7 Demands and Risks ........................................................................................................ 9
8 Investment Strategy ...................................................................................................... 10
Appendix A – Carriageway, Leicestershire County Council – December 2007 .................. 11
Appendix B – Structures, Surrey County Council – March 2008 ......................................... 21
Appendix C – Footway, Newcastle City Council – October 2006 ......................................... 61
Appendix D – Traffic Signal & Management Systems, Staffordshire County Council – October 2008 ....................................................................................................... 80
Contributing Authors: Paul Boss Staffordshire County Council Andrew Molyneux Leeds City Council Mark Stephenson Cornwall County Council
Table of Contents

1
Lifecycle Management Plans form a key part of an Authority’s Highways Asset Management
Plan (HAMP).
Lifecycle planning is listed in the DfT’s ‘Start Up’ Guide as an activity under ‘Growing your Asset
Management practices’. Effective lifecycle planning therefore requires several fundamental
asset management activities to have been carried out and considerable asset knowledge to
have been established. Without this knowledge, lifecycle plans will not target the effective
maintenance and renewal of assets, leading to either premature maintenance or deterioration
and possible safety risks to road, and non-road users, and to roadworkers.
Figure 1 (from CSS) provides an overview of the asset management process. This guidance
note focuses on life cycle planning, with additional notes available giving and overview of the
whole process, and further details on boxes 2 and 4.
Figure 1 Overview of Asset Management Processes
1 Introduction
2
Effective lifecycle planning is about making the right investment at the right time to ensure that
the asset delivers the requisite level of service over its full expected life, at the minimum cost.
However, the lack of knowledge should not stop a local authority from starting these plans as
they will, at least, document the ‘status quo’ for the asset type or grouping, and help to identify
the data required for effective decision making i.e. the plans should basically describe in detail
how each asset is currently managed, and how investment decisions are made.
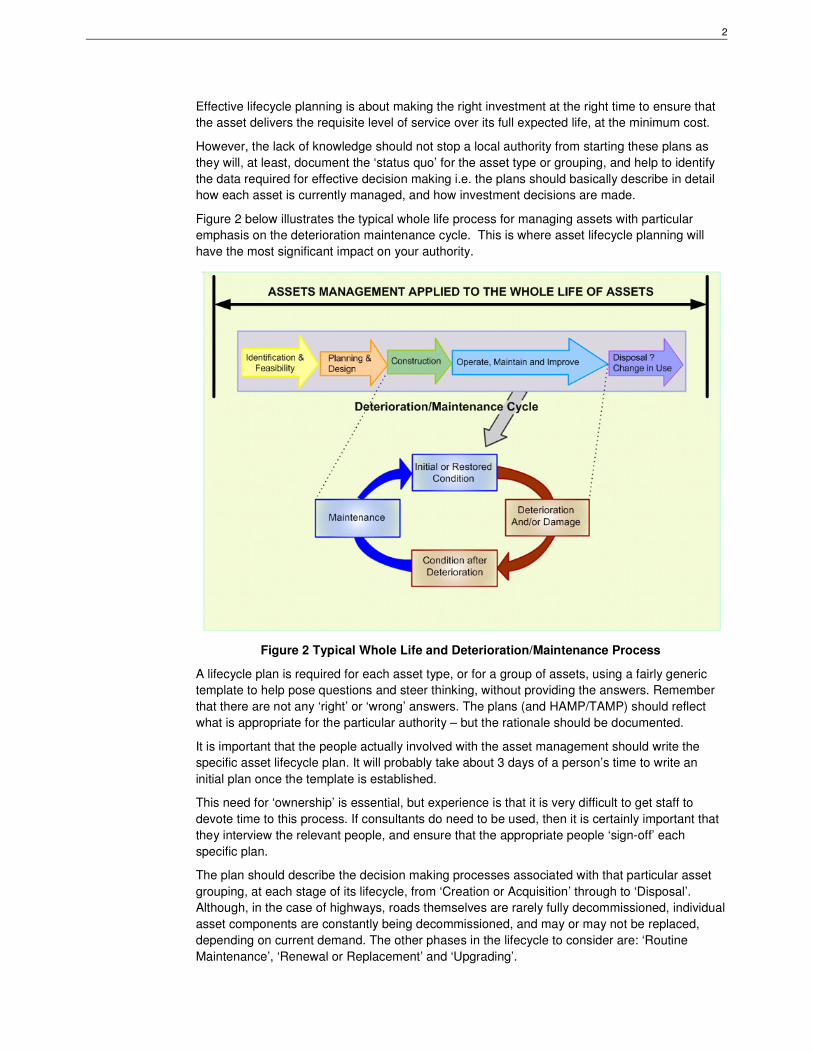
Figure 2 below illustrates the typical whole life process for managing assets with particular
emphasis on the deterioration maintenance cycle. This is where asset lifecycle planning will
have the most significant impact on your authority.
Figure 2 Typical Whole Life and Deterioration/Maintenance Process
A lifecycle plan is required for each asset type, or for a group of assets, using a fairly generic
template to help pose questions and steer thinking, without providing the answers. Remember
that there are not any ‘right’ or ‘wrong’ answers. The plans (and HAMP/TAMP) should reflect
what is appropriate for the particular authority – but the rationale should be documented.
It is important that the people actually involved with the asset management should write the
specific asset lifecycle plan. It will probably take about 3 days of a person’s time to write an
initial plan once the template is established.
This need for ‘ownership’ is essential, but experience is that it is very difficult to get staff to
devote time to this process. If consultants do need to be used, then it is certainly important that
they interview the relevant people, and ensure that the appropriate people ‘sign-off’ each
specific plan.
The plan should describe the decision making processes associated with that particular asset
grouping, at each stage of its lifecycle, from ‘Creation or Acquisition’ through to ‘Disposal’.
Although, in the case of highways, roads themselves are rarely fully decommissioned, individual
asset components are constantly being decommissioned, and may or may not be replaced,
depending on current demand. The other phases in the lifecycle to consider are: ‘Routine
Maintenance’, ‘Renewal or Replacement’ and ‘Upgrading’.

3
The plan should start with a general description of the asset or asset grouping, and then
document the inventory, condition, and performance so as to identify the funding required for
the current and future needs of the asset.
As a starting point, the following groupings are suggested to help cover the major highway
assets although, in many cases, little will be known about some of the individual elements
within these groupings:
� Roads
� Footways & Cycleways
� Bridges & Structures
� Drainage
� Public Rights of Way
� Street Lighting
� Signs & Street Furniture
� Environmental Assets
� CCTV
It is important to remember that you can’t do everything at once, and that the lifecycle plans can
be added to, and expanded over time.
As a service related to highway activities, winter service should be included within the plans,
albeit not specific to the management of an individual asset.
Lifecycle plans need to capture on a robust, consistent basis, all the relevant costs involved in
maintaining the asset over the cycle to the chosen service performance. This information,
when spread appropriately over the duration of the cycle, provides the basis for financial
planning and budgeting, and for measuring asset depreciation. The forthcoming CIPFA Code
of guidance will provide further advice on the development of financial information for these
purposes.
When lifecycle plans have been developed for all asset groups or at least the main asset
groups, objective decisions can be made regarding the proportion of funding that can be
allocated for each group to finance the most efficient and effective use of current and future
funding. The options within each lifecycle plan should ensure that where the optimum
proportion of funding is not available, the next or further best option can be assessed in
competition with the options contained in the plans for other asset groups.
As far as possible, selection of options should attempt to minimise lifecycle costs.

4
Each local authority will have its own established asset and maintenance investment practices
and a view of what processes and activities will make an effective lifecycle plan, tailored to their
own asset hierarchy. This guide sets out the basic activities to establish an initial generic
lifecycle plan following the process in Figure 3. Feedback and improvement loops at all stages
are important but have not been shown for clarity.
Figure 3 Generic Asset Management Lifecycle Process
2 The Life Cycle Process
Produce Investment
Strategy
Collect Inventory &
Condition Data
Set Objectives & Policies
Collect Maintenance
Costs
Assess Performance
Gaps
Assess Demands &
Risks

5
Each local authority will also have their own objectives and policies that determine the priorities
of the authority, and these should be listed in the HAMP and TAMP. These can be included as
part of an introduction to the lifecycle plan and considered when determining the options for
various asset groups. For example, if an authority has a priority of improving the condition of
roads then carriageways could be a priority for funding. However, if an objective is to improve
the safety for pedestrians then footways or pedestrian signal facilities may take a priority.
The underlying statements as to the priorities of the authority will generally include improving
the safety and condition of highways and decisions will therefore be based on the economics
and risk of maintaining each asset group, using proportions of available funding in accordance
with the options contained in the lifecycle plans. Reference to objectives can therefore be a
paragraph or list of priorities at the front end of the lifecycle plan, or as a general statement in
an introduction to a group of plans.
It is also useful for the lifecycle plan to set out the consequences of not achieving the objectives
and highlight the impact of for example lack of investment or ill-informed maintenance
interventions.
3 Objective and Policies

6
It is important to understand the type and quality of asset inventory and condition data required
to measure performance, and decide on investment options to support the HAMP and other
objectives. A data specification should therefore be established at the outset of lifecycle
planning. This should set out the hierarchy, detail and priority of data attributes. If there are
any gaps in what is collected, these should be fed back into the inspection and survey
programme as a business case for future collection.
All local authorities have a record of the highways they manage. For roads this can be found in
the R199b form that is received from DfT each year. Due to the need to report Best Value
Performance Indicators (BVPI’s) to 2007/08 *, all authorities also have easily available condition
data for carriageways and a small proportion of footways that can be used as the basis for initial
lifecycle plans. Due to planned cyclical lamp changes, all authorities should have good
inventory and age related information for their street lighting, illuminated traffic signs and traffic
management systems that is readily available.
The problem areas with regard to inventory are therefore carriageway widths, total footway; and
the lower value assets such as signs, safety fences, trees etc along with the usually unknown
underground highway drainage systems. With the exception of drainage, information from
authorities that have already collected inventory data should be available through regional
highway groups, e.g. The Midland Service Improvement Group (MSIG) and can be used as an
initial estimate for use in an authority’s lifecycle plan, based on the respective lengths of each
authority’s network.
Drainage inventory and condition is more difficult to establish as few, if any authorities have an
accurate record of their highway drainage systems. A business case should be made for
collecting this data against the consequential risk of impact to asset performance and HAMP
objectives.
Where condition data is not available, a coarse assessment should be made using knowledge
within the authority. This can be refined over time.
*BVPI is quoted to 2007/08 as at the time of issue this was the last year there was a requirement for full survey coverage i.e. including unclassified roads. Checks should be made for any more recent updates for current requirements.
4 Inventory and Condition Data

7
A specification for the collection of maintenance costs for the purposes of lifecycle planning
should be established. This will identify the priorities, boundaries and ownership of cost data
specifically for this process. Significant overlap is likely to exist with the cost data collected for
maintenance benchmarking purposes, but may require additional manipulation for use in
lifecycle planning.
The costs of maintaining assets should be based on contract rates for reactive and planned
works and take into account inflation and/or uplifts within contracts to ensure future projections
are as realistic as possible. The life expectancy of various treatments or procedures undertaken
should be based on internal and industry knowledge if possible to determine realistic service
lives in addition to design lives.
The determination of a basket of generic treatments will allow the sustainability of each to be
considered and taken into account within the overall strategy derived from service options
identified. With some asset groups such as carriageways, information will again be available
through regional highway groups.
Recording systems should be put in place to allow the refinement of maintenance cost data
over time and hence the updating of projections on an annual basis. For example, the historical
information that is built up within a pavement management system and the continued
development of deterioration modelling software will then refine and increase the reliance that
can be placed upon investment strategies.
5 Cost of Maintaining Each Group of
Assets

8
Once asset inventory, condition and cost data has been collected the performance of each
asset or asset group should be calculated and compared to the desired or target level. Care
should be taken when relying on historic performance data and appropriate levels of confidence
should be established.
Performance gaps will exist in most if not all of the asset groups, and there will be a number of
gaps between the current performance of the asset and the level of performance that is desired.
These should be documented within the plan and then considered within the context of demand
and risk as below.
Where there is an identified need to change and improve the way that assets are managed,
these changes should also be described in the lifecycle plans and form part of the overall
Improvement Plan, and a business case developed for the changes.
The desired performance levels are defined in national, industry standards, Codes of Practice
and procedures, as well as local standards of the authority. These can also be defined in terms
of business objectives, demands and aspirations.
The current performance is usually established through application of different types of
performance assessment methods. These typically are represented by a formal regime of
inspection and surveys. In reality, although performance is mainly measured according to BVPI
results achieved, prioritisation to improve BVPI’s is not necessarily commensurate with good
asset management practice. A balanced view therefore needs to be taken when formulating an
investment strategy to ensure good long term asset management planning is not sacrificed in
the quest for improved PI results in the short term.
As well as condition monitoring measures, other local performance indicators may be useful to
establish the ‘health’ of the asset groups. These include monitoring the frequency of high
priority condition based defects i.e. those caused by a lack of maintenance; monitoring the
volume of medium priority asset defects, which provides an indication of asset deterioration and
the success of reactive maintenance; and monitoring the % of assets that are renewed
annually, which can be compared to service life predictions.
It is important to capture the lessons learnt from poor performance internally within asset
maintenance practices and for setting revised HAMP and data collection targets.
Performance should, ideally, also include some form of stakeholder satisfaction survey and,
perhaps, a less systematic, ‘ad-hoc’ reporting approach based on feedback from accidents and
incidents of complaints (which link to Demands and Risk).
There are two categories of performance gaps:
� Where the condition of an asset component is below that desired, and
� Where the level of service provided to the users of the highway is below that desired
The Lifecycle Management Plans should set out details of the authority’s current Service
Standards and Performance Assessment Methods, as well as the processes for managing the
assets.
6 Performance Gaps

9
Lifecycle plans will need to identify and reflect the demands placed upon the asset and the risks
involved in not maintaining the asset in the correct manner. Demands will be stated in the
authorities HAMP and TAMP and reflect the priority values to which assets are expected to
perform. These usually relate to safety, capacity, disruption, accessibility, amenity and
environment/sustainability. The start up guide on Risk Management provides an appreciation
of typical asset risks that require consideration.
For example, a carriageway may have the demands of heavy vehicles placed upon it, but the
risk of not maintaining it correctly may be mainly economic i.e. the carriageway may need re-
constructing in a few years time whereas correctly maintained it may require more economic
resurfacing at a much lower long term cost.
The economic cost of not correctly maintaining a footway for example may be relatively small
i.e. reconstructing rather than resurfacing, but the third party liability cost could be very high if
users of the footway were to suffer personal injury.
7 Demands and Risks

10
An investment strategy for each asset group in addition to a strategy for the overall highway
asset will need to be derived from the information within the lifecycle plans. These will typically
be based on maintaining or enhancing the highway asset to achieve a desired standard and
translated into a forward programme of works. The typical stages of asset maintenance and the
financial impact that these have over time is illustrated in Figure 4.
Figure 4 Typical lifecycle maintenance interventions over time
A good starting point for the investment strategy is to consider the total finance available for
highway assets and then apportion this in accordance with service options and their
consequences, identified in each of the lifecycle plans. Although this may not establish the
investment required to meet desired service standards, it will provide a necessary ‘base case’.
In the medium to long term future the use of refined deterioration modelling information can
then be used to prove the investment requirements to achieve defined service standards and
hence match the total finance to those standards or levels of service.
It is important to regularly monitor the impact that an investment strategy has on asset
performance and the support to lifecycle objectives.
Example Lifecycle Plans
Examples of Lifecycle Plans developed by authorities to date are attached as the following
appendices:
Appendix A – Carriageway, Leicestershire County Council – December 2007
Appendix B – Structures, Surrey County Council – March 2008
Appendix C – Footway, Newcastle City Council – October 2006
Appendix D – Traffic Signal & Management Systems, Staffordshire County Council – October
2008
8 Investment Strategy

11
Appendix A – Carriageway,
Leicestershire County Council –
December 2007

12
Introduction
1. The background to lifecycle plans and the format of each are described in Section 5. This
appendix provides the lifecycle plan for carriageways.
2. For management purposes, carriageways have been defined in categories 2 to 4b as
shown in the table below. This is based on the national code of practice “Well Maintained
Highways”. These categories reflect the type and use of different carriageways and so will
form the basis for sound asset management. National funding and financial reporting is
however based on the national classifications (A, B, C and unclassified).
Cat. Hierarchy Type of Road Detailed Description
1 Motorways Motorway N/A
2 Strategic Routes
Trunk and primary A Roads.
Routes between primary destinations.
3a
Main Distributor
Non primary A roads and important or heavily trafficked B roads.
Routes between strategic routes and linking urban centres to the strategic network. Annual average daily traffic: Urban >30,000 (1500 HGV) Rural >12,000 (1000 HGV)
3b
Secondary Distributor
B roads and heavily trafficked C roads.
In rural areas link larger villages to strategic/ main distributor network. In urban areas usually have a 30 mph speed limit and high levels of pedestrian usage. Annual average daily traffic: Urban >20,000 (300 HGV) Rural > 7,000 (150 HGV)
4a
Locally Important Roads
Routes linking into the main/ secondary distributor network, normally C class, with greater local significance in rural areas; plus heavily trafficked unclassified roads.
In rural areas provide inter-village links and connect to distributor network. In urban areas residential or industrial interconnecting roads. Annual average daily traffic: Urban >15,000 (150 HGV) Rural >5000 (100 HGV)
4b
All other metalled Roads
All other C roads and majority of unclassified network.
In rural areas serve smaller villages and provide access to limited number of properties and land. In urban areas predominately residential.
Appendix A – Carriageway Lifecycle Plan
Leicestershire County Council

13
Levels of Service
3. The desirable levels of service for this asset category are set out in the table below (see
section 2 of main document). These levels of service would fully meet all aspirations whilst
minimising whole-life costs. This lifecycle plan, in later sections, shows how different levels
of available funding will influence the extent to which these desirable levels of service can
be achieved.
Attribute Desired Standard Performance measure
Safety Road surface of appropriate skid resistance and profile to minimise risk of loss of control accidents.
Measures to be developed for second edition TAMP
Availability All roads available for use at all times bar periods of essential roadworks
BV100 surveys for traffic sensitive streets
Serviceability Good standard surface without unevenness or potholes affecting vehicle ride quality
CVI surveys
MORI surveys
Condition At a level consistent with achieving minimum whole life cost, that is BV223 between 3 and 5%, 224a and 224b between 10 and 12%.
BVPI surveys
4. It will be noted that the levels of service above take a restricted look at, particularly, safety
and serviceability. Wider attributes, including alignment, safety of junctions and other
aspects currently dealt with under the Council’s improvements programme, will be
considered for inclusion in future editions of the TAMP.
5. Failure to respond adequately to any of these four dimensions of level of service will
produce risk to the authority. The table below, which details the main risks, underlines the
importance of responding properly to each.
Risk type Description example
Physical Accidents caused by asset defects
Business Legal proceedings for failure in duty of care
Financial Reduction in net book value of the asset because of poor maintenance practice; increased compensation payments following legal action;
Corporate image Poor condition roads reflect on the overall image of the County Council
Environmental More premium aggregate, natural resources and energy per kilometre of treated network will be used in reconstruction and shorter life materials as opposed to longer life materials, resurfacing and overlay.
Network More disruption to pedestrians and others because of emergency unplanned maintenance following poor maintenance practice

14
Asset base and characteristics
6. The extent of carriageways in four categories is shown in the table below:
A Road B Road C Road UC Road
km km Km Km
Urban 106 88.3 425.2 1668.1
Rural 313.7 155.1 886 624.9
Asset Condition and Assessment
7. To assess the extent to which the desirable levels of service are met requires
measurements covering the four dimensions of safety, availability, serviceability and
condition. Where measures currently exist for availability and serviceability they are
inadequate and will be considered further in the second edition of the TAMP.
8. The condition of A, B and C roads is assessed annually by SCANNER surveys. A
proportion of the unclassified network is assessed annually by (Coarse Visual Inspection)
CVI survey. CVI surveys are also done on proportions of A, B and C roads to check trends.
Deflectograph surveys are carried out on proportions of A and B roads. Griptester surveys
are done on a proportion of A roads and on a site specific basis on other roads. NRMCS
surveys are also carried out on the numbers of sites required by DfT. This requirement is
likely to be dropped for A, B and C roads from 2008.
A Roads B & C Roads Unclassified
SCANNER 100% (in one
direction) surveyed annually
100% (in one direction) surveyed annually
Not surveyed
Deflectograph 20% surveyed
annually 20% surveyed annually Not surveyed
GRIPTESTER 33% of network
surveyed annually
Site specific surveys only
Not surveyed
CVI 20% surveyed
annually
50% surveyed annually( may reduce
to 20% in future)
25% surveyed annually
NRMCS 50 Sites 110 Sites 90 Sites

15
9. The Council has set its own standards for the frequency of its highway safety inspections.
These take into account national guidelines, issued in the latest Code of Practice for
Maintenance Management “Well Maintained Highways” (July 2005):
Feature Reference Category Frequency of Inspection
Carriageways 2 Strategic Routes 1 month
3(a) Main Distributors 1 month
3(b) Secondary Distributors 1 month
4(a) Locally Important Roads 3 months
4(b) All other metalled Roads 1 year
10. There are national Best Value Performance Indicators (BVPI) for all categories of
carriageway. Best Value Performance Indicators BVPI 223 and BVPI 224 are a direct
application of the Road Condition Index (RCI) from the current UKPMS default rule set. For
unclassified roads the emphasis is on a range of condition indices relevant to rural and
urban roads
• Principal roads ( A roads) – BV223 (BV96)
• Non Principal Classified (B & C roads) – BV224a (BV 97a)
• Unclassified (un-numbered minor roads) – BV224b (BV 97b)
The overall condition of the roads in Leicestershire has shown a gradual improvement,
reflected in Table 4 below which details the BVPI results in recent years: Table 4 BVPI RESULTS (Highlighted cells signify reported figures)
All figures are %’s 01/02 02/03 03/04 04/05 05/06 06/07
BVPI 96
Deflectograph Survey. 18.14 16.80 11.60 11.28 9.32 11.96
BVPI 96
Condition of Principal road network based on CVI Visual Survey.
7.72 10.16 3.42 6.29 1.30 3.01
BVPI 223
Condition of Principal road network based on SCANNER Survey.
N/A N/A N/A 19.65 3.0 3.0
BVPI 97a
Condition of Non-Principal Classified road network by CVI
11.73 23.53 36.44 29.06 11.26 10.52
BVPI 224a
Condition of Non-Principal Classified road network by SCANNER
10 7
BVPI 97b
Condition of (Non-Principal) Unclassified road network based on CVI.
13.13 14.67 37.66 9.6 8.4 16% 4yr
av (10% 1yr)

16
Asset Valuation
11. The initial gross replacement cost for the carriageway asset is £2.5 billion. The
depreciation is approximately £40 million, which means that the net value is approximately
£2.46 billion.
Future Changes in Demand
12. Major new development is planned in the county over the next twenty years as part of the
Regional Spatial Strategy. This expansion will bring substantial lengths of new carriageway
in new housing and employment areas, and will also intensify the use of existing
carriageways. The increase in the extent of the asset will, in the long term, produce a
requirement for additional maintenance expenditure. The likely impact on maintenance
expenditure, and on government funding for this, has not at this stage been quantified.
Treatment options and costs
13. Road surfaces can be renewed, retextured, protected or repaired. Renewal involves
replacing the top layer and will normally require replacement, or patching, of parts of the
underlying layer. Retexturing increases the serviceable life of the surface course and
restores a consistent level of grip. Protection treatments, such as surface dressing, restore
the skid resistance and seal the surface of the road which prevents moisture getting into the
surface and further oxidation of the binder. Repairs are treatments like patching, filling pot-
holes, crack sealing and resetting ironwork.
Treatment Expected
Treatment Life (yrs)
Average treatment cost
Reactive Pothole repair 4 months £120.00 per repair
Reactive Odd kerb / iron work
2 years
£40.00
£90.00
£135.00
Kerb
Gully
Manhole
Reactive Patching 3 years £30 – £40/m²
Preventative Surface dressing
7-10 years £2.25/m²
Planned Haunching 7-10 years £80.00/m
Planned Kerbing 10 + years £20.00/m
Planned Resurfacing 7-30 years £10.00/m²
Planned Overlay 10-30 years £5.00 – £10.00/m²
Planned Renewal 20-35 years £12.00 – £20.00/m²
14. A typical stretch of road might be maintained as follows, following the laying of a new
surface:
• Inspect at required frequencies looking for potential potholes, problems around and concerning ironwork; reset ironwork and fill potholes;

17
• Empty gullies and catch pits; sweep channels and hatched areas; weed spray to channels;
• Patch and seal areas to restore surface, especially in channels and around gullies;
• Consider surface dressing after 12 to 15 years, depending on road category and usage; more highly stressed areas, like junctions will be resurfaced if necessary, rather than dressed;
• Consider more significant roads for resurfacing earlier in their lives; less significant and less heavily trafficked roads may be surface dressed twice or more times before resurfacing.
15. The current levels of capital funding have only been available to the whole of the County network since 2001. The significant improvement in the condition of every category has been achieved using a mixture of resurfacing, surface dressing and revenue-funded patching. The programme has been determined on a worse-first basis, because of the initial poor condition and the available capital and revenue funding, rather than a justified asset management approach.
Management strategy for minimising whole-life costs
16. Whole life costs include not only the direct costs of works, design and supervision and
surveys, but also the indirect costs caused by sub-optimal maintenance regimes, including
inconvenience to users, environmental impacts and third party claims. The main factors
which will affect the whole life cost of an individual carriageway are:
• Type and quality of construction
• Degree and type of damage and degradation
• Type and volume of traffic
• Speed and quality of response to damage and degradation
• Timing of intervention and quality of medium and long term treatments
17. At present the links between these have not been fully quantified. This is an important area
for research and progress nationally will be used to inform future editions of the TAMP. This
will be a significant exercise, involving renewals, preventative work and reactive
maintenance.
18. Historically, the Council’s strategy for maintaining carriageways has been:
• to specify a high standard of initial construction
• to undertake timely reactive maintenance in order to keep carriageways in a safe
condition and prevent short term deterioration,
• to have a programme of preventative maintenance to prevent deterioration of the
surface and lower layers and to extend the life of the carriageway at minimum cost
• to resurface carriageways (using recycling techniques where possible) when reactive
and preventative work is uneconomic
• to renew carriageways which are uneconomic to treat by other means.
19. This strategy is based on good practice but there has been no rigorous financial evaluation
of the approach or testing of alternatives, for example the timing of the various interventions. The strategy is accepted as best practice for this version of the TAMP but further investigation of alternatives will be undertaken for the second version.

18
Options and targets within the management strategy
20. The analysis which follows analyses levels of capital spending against predicted outcomes
for carriageway condition. Similar analysis in future editions of the TAMP will need to
analyse in more detail the impact of revenue spending on condition, and also assess
whether other aspects of conditions of service need similar consideration. It should be
noted that the causal link between capital spend and resulting condition is complicated and
not necessarily fully explained by the headline figures; this is another area for further
investigation in future editions of the TAMP.
LTP proposals
21. The second Local Transport Plan reviewed the correlation between the achievement of
condition targets and proposed overall spending, within the indicative government
allocations. This capital spending on resurfacing and reconstruction was to be supported
by continued revenue spending on reactive maintenance at a level predicted to be
approximately £5m a year in real terms through the five year period. The table below
shows the LTP predicted spending and targets (targets for principal roads are for
deflectograph surveys and non-principal classified and unclassified roads are for CVI
surveys)
£000s 06/07 07/08 08/09 09/10 10/11 5 Year Total
Principal road carriage-ways
1875 1915 2010 2110 2215 10125
Target condition 10.8% 10.6% 10.4% 10.2% 10%
Non-principal classified road c/ways
2925 2985 3135 3290 3455 15795
Target condition 11.3% 11% 10.6% 10.3% 10%
Unclassified road c/ways
1140 1165 1220 1285 1345 6155
Target condition <10% <10% <10% <10% <10%
22. On the basis of further annual results becoming available using SCANNER data, the
2010/11 targets in the 2007/08 Departmental Service Plan are:-
• Principal roads – 4% by SCANNER;
• Non-principal classified roads – 9% by SCANNER;
• Unclassified - <10% by CVI surveys.
23. The SCANNER results are not directly comparable with those for deflectograph, and neither
is directly comparable with those for CVI surveys. The targets for principal and non-
principal roads (SCANNER) are assessed as being close to those which reflect minimum,
perceived whole-life cost. That for unclassified roads (CVI) is still some way off that figure
and there needs to be a consistent further improvement over a number of years, down to a
figure closer to that for non-principal roads.

19
Alternative options
24. The reduced allocations for maintenance announced by the Department for Transport in
late 2006, coupled with uncertainties over the likely outcome of the autumn 2007
government comprehensive spending review, mean that the targets must be reviewed. The
revised spending for 07/08, 08/09 and 09/10, based on the reduced DfT allocations, was
determined as follows: -
£000’s 07/08 08/09 09/10
Principal road carriageways £1,415 £1,410 £1,610
Non-principal classified road c/ways £2,835 £2,535 £3,060
Unclassified road c/ways £1,065 £1,020 £1,085
25. However, these allocations would have resulted in an unacceptable worsening in the
condition of category 3 and 4 footways. An adjustment was therefore made to allocate
more spending for these, achieved by reducing the spending on principal road
carriageways by £250,000 a year from 08/09. The revised table is shown below: -
£000’s 07/08 08/09 09/10
Principal road carriageways £1,415 £1,160 £1,360
Non-principal classified road c/ways £2,835 £2,535 £3,060
Unclassified road c/ways £1,065 £1,020 £1,085
26. The reduced spend will result in some deterioration. This is not significant over the three
year period in the context of experimental error in measurement, but if uncorrected in the
longer term could lead to significant problems. The next edition TAMP will examine this
further.
Roads 2007/08 2008/09 2009/10
Principal roads – BV223 3.3% 3.5% 3.6%
Non-principal classified – CVI 10.4% 10.3% 10.6%
Unclassified roads – BV 224b 9.2% 9.5% 9.8%
27. These options for carriageways are assessed in Section 6 against similar options for other
asset categories, to produce the best overall balance within available funding against
desired levels of service.

20
Lifecycle action plan
28. Most of the actions to deliver this lifecycle plan are, for this first edition of the TAMP,
contained within the wider summary of development contained in Section 9. A separate
action plan is therefore not included here, though it will be in future editions of the TAMP.
Risks
29. The risks involved in implementing the lifecycle action plan have been assessed against the
council’s standard grid of likelihood versus impact and are detailed in the table below, with
an outline of the mitigation to be planned. The ‘red’ risks from each lifecycle plan are listed
in section 7 of the main TAMP document.
Imp
act
of
eff
ects
Severe A
Significant B 1,5,6
Moderate C 2,3,4
Minor D
4 3 2 1
Very Un-Likely
Not Very Likely
Quite Likely Very Likely
Likelihood of causes
Risk Level Mitigation (for red
risks) Responsible
1. Insufficient staff resources for analytical work, particularly given structural change in the department
2B
Ensure prioritised within group local action plan
GM(Network Management)
2. Insufficient staff resources for customer attitude work
2C
3. Insufficient progress nationally and in the region to support changes in practice
2C
4. Materials/ labour/ plant/ staff costs
2C
5. Reduced capital funding
2B
Review allocation between asset categories to minimise overall deterioration
GM(Network Management)
6. Reduced revenue funding 2B Ditto ditto

21
Appendix B – Structures, Surrey
County Council – March 2008

SURREY HIGHWAYS STRUCTURES GROUP
TRANSPORTATION ASSET MANAGEMENT
STRUCTURES ASSET MANAGEMENT PLANNING

Issue No.1 Page 23 of 101 Document No.
2227/17
Project Title: Bridge Management Document Title: Transportation Asset Management Structures Asset Management Planning Client Reference: S/TAA/8 Date: 14 March 2008 Prepared By: Print Hugh Brooman Sign ................................................ Authorised By: Print Graham Cole Sign ................................................
Amendment List
Iss. / Rev. Iss. / Rev Date
Remove Insert
Page Iss. / Rev. Page Iss. / Rev.
Issue 00 July 2004 All pages 00 All pages 01
0201SF10 07/08/02 Filename: S:\GENERAL\AMG\Structures\\lifecycle.doc

Issue No.1 Page 24 of 101 Document No.
2227/17
Contents
1 Introduction
2 Strategic Goals and Objectives.
3 Asset Inventory
4 Current Performance
5 Future Demand
6 Performance Targets and Levels of Service 7 Performance Gaps
8 Lifecycle Plans
9 Value Management and Risk Management
10 Asset Valuation
11 Work Plan and Financial plan
12 Sustainable Development 13 Improvement Plan
14 References

25
__________________________________________________________________________________________________
___________________________________________________________
Issue No.01
Document No. 2227/17
1 INTRODUCTION
The Structures Group of the Surrey Highways Service undertakes the management of the highway
structure asset. Highway structures are defined as any bridge or other structure that impinges in
any way within the footprint of the highway or that materially affects the support of the highway or
land immediately adjacent to it that meets certain dimensional criteria. Highway structures include
bridges, culverts, subways, footbridges and retaining walls. An important Structures Group goal is
to:
“document that the assets for which it is responsible are being preserved at, or above, a series of
key performance indicators originally established for the assets”
We will do this by preparing and working to the Asset Management Planning process that is set out
in this document. This is the second edition of this document – the first was prepared in July 2004.
It is recognised that the preparation of an Asset Management Plan is a continuous improvement
process and it is anticipated that further versions of this Asset Management Planning document will
be issued on an ongoing basis.
‘It is widely recognised that a well managed transport infrastructure is vital to the economic
stability, growth and social well being of a country. Bridges and other highway structures
are fundamental to the transport infrastructure because they form essential links in the
highway network. It is not therefore in the public interest to allow highway structures to
deteriorate in a way that compromises the functionality of the highway network, be it
through restrictions or closures caused by unsafe structures or the disruption of traffic
through poor planning of maintenance work.’ [Ref 1]
This Asset Management Planning document is based on the format recommended by the Code of
Practice for the Management of Highway Structures (the Code) [Ref.1]. This document is part of a
suite of resource management plans that support the corporate objectives of the County Council
and the operational priorities of the Group:
• Surrey Highways Service Business Plan
• Annual Group Management Plan
• Quality Management System (QMS) documentation
The relationship between these various documents is shown in Figure 1. The overall process
involved in the Management of Highway Structures is shown in Figure 2. A comprehensive review
of the work of the Structures Group was carried out in the first quarter of 2008 and some of these
processes will change in the near future.

Issue No. 01 Document No. 2227/17
Fig.1 – Key Documentation
Fig. 2 – The Management of Highway Structures
Start
Local Input(LTD Schemes)
AssessmentResults
Condition Survey ImprovementsDCP and otherurgent safety
issues
Collation into a listof tasks
TechnicalPrioritisation
Cost Options
Rolling
Programme
Bid
BudgetAllocation
AnnualProgramme
Construct
Update
Records
Performance
Monitoring(KPIs)
Funded
Unfunded
Programme
Reporting
Note: Damage to County Property (DCP)

Issue No. 01 Document No. 2227/17
2 STRATEGIC GOALS AND OBJECTIVES
The overall policies and aims of the County Council are currently set out in the Manual of Policies
and Standards (Maps) document. In addition, the Local Transport Plan (LTP) also sets out various
criteria and objectives within the ‘Planning and Maintaining the Highway Network’ chapter.
Successful management of the bridge stock is fundamental to the implementation of the LTP.
There are five main themes within the LTP and the Structures Group contributes to these as
follows:
Economy: the strategy takes account of the business needs of local communities in
prioritising bridge management activities. Where weak bridges are on routes which provide
access to business parks etc. weight restrictions would have a detrimental effect on the
economy, so strengthening schemes receive a high priority rating.
Safety: the strategy principally contributes to this objective by ensuring that minimum levels
of safety are maintained. In maintenance, the repair of safety-related defects and damages
takes priority. In bridge strengthening schemes, highway safety improvements are included
where possible.
Integration: a robust bridge stock is needed to deliver network flexibility requirements and
accommodate bus routes which may be introduced to improve transport integration.
Accessibility: in strengthening and refurbishing, accessibility for vulnerable users is improved
by adding footpaths and increasing width whenever possible. The maintenance of subway
pumps, anti-slip surfacing, handrails and graffiti clearance are important to provide a
pleasant environment, so that pedestrians are encouraged to use subways and footbridges.
The 2002 Audit Commission Best Value inspection of the Transportation Service
commended the Structures Group on the inclusion of parapet enhancement measures in
bridge strengthening schemes.
Environment: environmental considerations, heritage value and conservation are taken into
account in the selection of materials and methods of working for strengthening and
reconstruction projects.
The Highways Service priorities for 2007/08 include to ‘Improve the Highway Network’, ‘Improve
Road Safety and Security’, ‘Enhance the Environment and Quality of Life’ and to ‘Provide Services
to People and Communities in a Way that Meets their Needs’. The work of the Structures Group
contributes to all of these Service wide priorities.
The Highways Act 1980 requires that roads are maintained to allow the passage of all Construction
and Use vehicles i.e. those up to 40/44 tonnes. Therefore, the primary service standard is to
maintain bridges to allow the passage of such vehicles, including smaller vehicles with 11.5 tonnes
axles, unless a permanent weight restriction has been imposed at a particular bridge.
In particular, Section 41 (1) of the Highways Act states:
The Authority who are for the time being the highway authority for a highway maintainable
at the public expense are under a duty, ……, to maintain the highway.
The Act includes provisions for enforcing liability for maintenance (Section 56) that can be
determined by a magistrates court. The Act provides a general power to improve highways
(Section 62) including the provision of subways (Section 69), footbridges (Section 70) and the

Issue No. 01 Document No. 2227/17
construction and reconstruction of bridges (Sections 91 and 92). More detailed sections of the Act
grant the power to construct bridges over navigable water courses (Section 106).
The Act grants the power to remove unauthorised structures (Section 143), to licence the
construction of a bridge over the highway (Section 176) and to control the construction of
scaffolding (Section 169) and cellars (Section 179). The Act also grants powers to control the
construction of retaining walls near streets (Section 167). Furthermore, bridgeworks shall not be
carried out unless approved by the county council (Section 195), a duty delegated to the Technical
Approval Authority.
The serviceability standards for the bridge stock will be maintained by seeking to achieve average
and critical values of between 90 and 94 in accordance with the CSS Bridge Condition Indicator
system [Ref. 2]. This reflects the usual practice of adopting a ‘good’ standard as an optimum level
of service determination [Ref. 3]. Service standards will be further developed as the family of
national performance indicators described below is implemented.
General consultation with the public regarding their interest in highway matters rarely includes
reference to highway structures. Public consultation, which supported the development of the first
edition of the Hertfordshire Asset Management Plan, showed that maintaining the safety of the
bridge stock was a primary public objective and Surrey residents are unlikely to have different
views. Local scheme specific consultations show that the public are rightly concerned about the
way works are carried out and how they are involved in the process. We have local performance
indicators that seek to address this matter.
3 ASSET INVENTORY
This asset grouping comprises bridges (both vehicular and pedestrian), culverts, subways (and
their associated pumps) and retaining walls. Bridges are of various types and spans but their
construction is mainly concrete, steel or masonry / brick. The asset group includes right of way
structures as well as those on main roads. In particular, highway structures are specifically defined
as:
• Bridges, culverts, chambers or subways under or over the highway with a composite span
of 0.9 metres or more.
• Retaining walls, where the height of retained fill measured between lower ground level and
upper ground level is 1.37 metres (4’ 6”) or more.
• Miscellaneous structures:
• Reinforced earth embankments 1.37 metres or more in height and where the angle of
the side slopes is greater than the natural angle of repose of the embankment
material
• High mast lighting columns 20 metres or more in height
• Structural aspects of sign and signal gantries as defined in HA Standard BD63
• Structural aspects of traffic signal mast arm assemblies as described in HA Standard
BD88
We carry out inspections of all SCC owned highway structures. Within the County there are also a
significant number of structures carrying highways and other transport systems that are owned by
other statutory bodies such as the Highways Agency, Network Rail and utility companies. We carry
out superficial inspections of these structures, where appropriate, to safeguard highway users.

Issue No. 01 Document No. 2227/17
Details of the asset are recorded on the Bridge Management System (BMS), supplied by Futuris,
and known as Bridgestation. Much of this data is readily accessible via the County GIS system or
by SAMS. The extent of the current inventory is indicated in Tables 1, 2 and 3. An indication of
construction materials and year of construction are included in Tables 4 and 5.
The Project Manager makes additions and changes to the asset inventory following significant
maintenance work, completion of developer schemes, creation of new assets or ‘discovery’ of an
existing bridge or retaining wall. The inspection process is also used to check the validity of data
held on individual structures. Details of the attributes recorded during the inspection process are
included in section 4.1. The reliability of bridge data is high but there is still a need to improve the
extent of the data regarding retaining walls. Monies had been allocated in 2007/08 to continue
additional survey work for this asset sub-group but have now been withdrawn.
Table 1 – Asset by Type and District (all owners)
Bridge Culvert Footbridge Subway Ret Wall Other Total
Elmbridge 70 11 33 5 4 2 125
Epsom and Ewell 29 7 14 1 11 3 65
Guildford 192 59 133 17 47 15 463
Mole Valley 166 44 220 9 18 7 464
Reigate and Banstead 90 22 44 8 25 5 194
Runnymede 47 17 40 1 2 0 107
Spelthorne 55 20 34 9 1 1 120
Surrey Heath 61 16 49 7 4 9 146
Tandridge 122 56 191 3 21 5 398
Waverley 157 65 181 2 38 1 444
Woking 55 17 43 1 10 1 127
1044 334 982 63 181 49 2653
Source: Bridge Management System (May 2007) Table 2 – Asset by Type and Road Hierarchy (all owners)
Bridge Culvert Footbridge Subway Ret Wall Other Total
Primary 73 28 12 21 27 10 171
Principal 123 55 21 13 45 10 267
Non Principal 223 91 18 6 35 7 380
Unclassified 264 93 11 6 62 15 451
Row 294 63 878 8 12 6 1261
Private 27 2 2 0 31
Other 40 2 40 9 1 92
1044 334 982 63 181 49 2653
Source: Bridge Management System (May 2007)

Issue No. 01 Document No. 2227/17
Table 3 – Asset by Type and Owner
Bridge Culvert Footbridge Subway Ret Wall Other Total
SCC (Structures) 544 296 565 43 153 31 1632
Network Rail 357 2 48 19 10 436
Other 143 36 369 1 28 8 585
1044 334 982 63 181 49 2653
Source: Bridge Management System (May 2007) Table 4 – SCC Asset by Construction Material (approximate)
Prestressed Reinforced Concrete
Metal Troughing
Steel Composite
Lattice Plate and
Steel Girders
Masonry Arches
Timber
46 347 46 24 95 433 457
Source: Adapted from Ref.4
Table 5 – SCC Asset by Year of Construction (approximate)
Pre 1820
1820 - 1840
1840 – 1860
1860 - 1880
1880 - 1900
1900 - 1920
1920 - 1940
1940 - 1960
1960 - 1980
1980 - 2000
100 100 150 200 200 225 150 100 100 123
Source: Adapted from Ref. 4

Issue No. 01 Document No. 2227/17
4 CURRENT PERFORMANCE 4.1 Condition Monitoring Measures
The condition of all structures is monitored through general and principal inspections as shown in
Table 6. A separate programme of special inspections is carried out for those structures that have
been shown to be sub-standard following strength assessments (see below). Ad-hoc special
inspections are also carried out following specific events such as vehicle impact or flooding.
Inspection activities are detailed in Figure 3. Fig. 3 – Bridge Inspection Process Map
Inspection programme
produced by PM and
agreed by TAA
Annually
BMS produces schedule
of bridges to be
inspected and type of
inspection required
Inspection & risk
assessment forms
issued to PEs
Annually
PEs agree programme
with inspectors and
monitors programme
Monthly
Schedule updated and
PM informed of
progress
Monthly
Approved Inspection
data entered in BMS
Completed risk
assessment forms
returned to PM
Completed inspection
report returned to PE
Approved inspection
report (incl Risk
Assessment) placed on
Bridge File
Structure inspected
Source: QMS Process TS14-02

Issue No. 01 Document No. 2227/17
In-house or external bridge inspectors carry out inspections. The annual programme is determined
by the Project Manager and implemented by the Principal Bridge Engineers (East and West). The
Senior Bridge Inspector determines technical aspects of inspections. General inspections have
been carried out every two/three years and principal inspections every six/nine years. Following
the publication of the Code, general inspections are now programmed to be carried out every two
years. A risk assessment approach will be established to determine an appropriate interval for
principal inspections. Safety inspections are carried out on privately owned structures. Inspections
are carried out in accordance with Departmental Standard BD63 – in particular, general inspections
are remote visual inspections whereas principal inspections need to be carried out from within
touching distance. The new national Bridge Inspection Manual was published in June 2007. The
recommendations of this document will be reviewed and incorporated into our procedures, where
necessary, in due course.
Table 6 - Bridge Inspection Details
County Roads (A, B, C & D Roads):
Activity Period Asset Type Covered
Superficial Inspections On all privately owned structures
General Inspections On all structures
Principal Inspections Every 6 to 12 years On all structures – frequency determined by risk assessment
Close Monitor Inspections 1, 3, 6,12 monthly On sub-standard (weak) structures – to monitor potential failure modes on unrestricted bridges
Special inspections As required For specific requirements
Post tensioned inspections Once only On PT bridges – unless condition determines otherwise
Diving inspections Every 2 years A scour assessment on vulnerable bridges
County Rights of Way:
Activity Period Asset Type Covered
General Inspections On all structures
Principal Inspections Every 6 to 12 years On specifically identified structures
Special inspections As required For specific requirements
Diving inspections Every 2 years A scour assessment on vulnerable bridges
The results of inspections are recorded in accordance with the CSS (formerly County Surveyors
Society) Bridge Condition Index procedures. All of the bridge stock has now been inspected using

Issue No. 01 Document No. 2227/17
this system. As the Project Manager receives each new completed inspection form the BMS is
updated and the overall condition of the asset is recalculated.
4.2 Current conditions - inspections
The average condition of the bridge stock (BCSIave) was estimated to be 94 in March 2003 in
accordance with the CSS BCI procedure [Ref.2]. The critical elements of the bridge stock were
estimated to have a rating (BCSIcrit) of 82 at March 2003 in accordance with the CSS BCI
procedure. The interpretation of these values is given in Table 7 [derived from Ref.2]. These
figures suggest that the bridge stock was in fair to good condition. However, these values were
derived from a small sample as the introduction of the new system was being trialled. The current
average condition value is 88.
4.3 Current conditions – strength assessment
A nationally funded bridge assessment programme was introduced to check the capability of
existing bridges to meet the higher 11.5t axle load and 40/44t gross vehicle weights permitted on
UK roads from 1 January 1999. The results of the assessment programme are recorded in the
BMS.
The assessment reports comprise special inspections designed specifically for assessments,
material testing results where appropriate and a mathematical evaluation of the way that a bridge is
assumed to carry traffic loads. The calculation process starts with a comparatively simplistic
approach and continues, where justified, by using more sophisticated analytical techniques. In
total, 301 of the 689 bridges requiring assessment were shown to be not to current standards.
Over 127 of these were either strengthened or reconstructed by the end of 2006. The remainder
are transferred to the Forward Work Programme.
Funding has been secured through the Local Transport Plan to implement a continuous
assessment programme. This will result in the main part of the bridge stock being reassessed
every eighteen years. This will ensure that the safety and reliability of the asset is maintained
whilst providing critical data for performance indicator evaluation.
When an assessment shows a bridge to be sub-standard or provisionally sub-standard then the
risk management procedures contained in Highways Agency Departmental Standard BD79 [Ref. 5]
are followed. This means that interim measures such as a weight restriction, traffic management
restrictions or a regime of monitoring is imposed on the structure. Further guidance is contained in
the Structures Management Manual and QMS Work Instructions. These procedures are in place to
minimise the risk of asset failure.

_____________________________________________________________________________________________________________________________________________________________
Issue No.01 Document No. 2227/17
Table 7 - Interpretation of CSS BCI Values (adapted from Ref. 2)
BSCI Range
Average Stock Condition based on BSCIAve
Critical Stock Condition based on BSCI Crit
Additional Comments
100 to 95
Very Good
The structure stock is in a very good condition. Very few bridges may be in a moderate to severe condition.
Very few critical load bearing elements may be in a moderate to severe condition. Represents very low risk to public safety.
If it is a relatively new stock of structures than an appropriate maintenance funding level needs to be identified through the Asset management Plan and Best Value. If it is a mature stock then continuing with the same level of funding is likely to sustain a high condition score and an effective preventative maintenance regime.
94 to 90
Good
Structure stock is in a good condition. A few bridges may be in a severe condition.
A few critical load bearing elements may be in a severe condition. Represents a low risk to public safety.
Historical maintenance funding levels have been at an appropriate level to maintain a good stock condition. These levels of funding should be continued to ensure condition is maintained and resources are concentrated on preventative maintenance activities
89 to 80
Fair
Structure stock is in a fair condition. Some structures may be in a severe condition.
Wide variability of conditions for critical load bearing elements, some may be in a severe condition. Some bridges may represent a moderate risk to public safety unless mitigation measures are in place.
Historical maintenance work may be underfunded and structures may not be managed in accordance with Best Value principles – implementation of an Asset Management Plan is essential. Potential for rapid decrease in condition if sufficient maintenance funding is not provided. Moderate to significant backlog of maintenance work.
79 to 65
Poor
Structure stock is in a poor condition. A significant number of structures may be in a severe condition.
A significant number of critical load bearing elements may be in a severe condition. Some structures may represent a significant risk to public safety unless mitigation measures are in place.
Historical maintenance work under funded and structures not managed in accordance with Best Value principles and sound asset management. It is essential to implement an Asset Management Plan to ensure work is adequately funded and prioritised and risks assessed and managed. Significant to large backlog of maintenance work, essential work dominates spending.
64 to 40
Very Poor
Structure stock is in a very poor condition. Many structures may be in a severe condition.
Many critical load bearing elements may be unserviceable or close to it and are in a dangerous condition. Some structures may represent a high risk to public safety unless mitigation measures are in place.
Historical maintenance work significantly underfunded and a large to very large maintenance backlog. An Asset Management regime is essential. Re-active approach to maintenance that has been unable to contain deterioration. A significant number of structures likely to be closed, have temporary measures in place or other risk mitigation measures. Essential work dominates spending.
39 to 0
Severe
Structure stock is in a severe condition. Many structures may be unserviceable or close to it.
Majority of critical load bearing elements unserviceable or close to it and are in a dangerous condition. Some structures may represent a very high risk to public safety unless mitigation measures are in place.
Historical maintenance work grossly under funded and a very large maintenance backlog. Re-active approach to maintenance that has been unable to prevent deterioration, only essential maintenance work performed, Asset management is essential. Many structures likely to be closed, have temporary measures in place or other risk mitigation measures. All spend likely to be on essential maintenance.

__________________________________________________________________________________________________
Issue No.01 Document No. 2227/17
5 FUTURE DEMAND
5.1 County Council promoted schemes
The Code [ref. 1] comments as follows:
‘Changes in demand in the future may alter how a structure should be managed, e.g. if a
planned route widening will necessitate a bridge replacement in 10 years time then the
maintenance strategy for the existing bridge should reflect this.’
The Code [ref. 1] goes on to recommend:
‘Predict future demand based on current knowledge of any major construction schemes,
changes to HGV traffic volumes, or policy changes planned for the next five to ten year
period, e.g. route widening, congestion charging, etc.’
A primary objective of the management of highway structures is to provide safe and reliable routes
for all vehicles, particularly public transport and goods vehicles at all times. The County Council
seeks to contain the rate of increase in vehicle use. Therefore, it is not anticipated that there will
be any significant increase in loading that will affect current management practices. However,
should there be any national change in the Construction and Use Regulations (or Authorised
Weight Regulations) then this would have a significant impact.
There is only one major scheme being progressed at the current time i.e. Walton Bridge. This is
being designed by Costain / Atkins and is currently going through the statutory process. Four
existing structures will be affected as shown in Table 8.
5.2 Developer promoted schemes
Developments of housing and industrial areas can create new structures on adopted highways. All
new highway structures are subject to the Technical Approval procedures contained in BD2 [ref. 6].
Adoption is not completed unless a commuted sum to cover future maintenance expenditure is
paid to the County Council. The Department for Transport is currently preparing national guidance
on this subject. There is at least one scheme being promoted at the current time that will replace
three existing bridges as shown in Table 8.

_____________________________________________________________________________________________________________________________________________________________
Issue No.01 Document No. 2227/17
Table 8 – Structures Affected by Future Schemes
Structure Number
Structure Name Promoter Proposal Action
A244/10 Walton Bridge (Callender Hamilton) Surrey County Council Remove as part of Walton Bridge major scheme in 2010
Inspect and safety critical maintenance only
A244/11 Walton Bridge (New Temporary) Surrey County Council Remove as part of Walton Bridge major scheme in 2010
Inspect and safety critical maintenance only. Carriageway surfacing to be replaced in 2008.
A244/4 Cowey Sale Viaduct Surrey County Council To be converted to pedestrian use and modified as part of Walton Bridge major scheme in 2010
Inspect and safety critical maintenance only. Refurbishment of structure to be included in main works contract.
A244/8 Causeway Cantilever Footway Surrey County Council To be removed on completion of Walton Bridge major scheme in 2010
Inspect and safety critical maintenance only
A247/7 Elm Bridge East Woking Borough Council To be replaced by new single span bridge as part of flood relief scheme in 2008
Inspect and safety critical maintenance only
A247/8 Elm Bridge West Woking Borough Council To be replaced by new single span bridge as part of flood relief scheme in 2008
Inspect and safety critical maintenance only
00055695 Willow Way Footbridge Woking Borough Council To be replaced by new bridge as part of flood relief scheme in 2008
Inspect and safety critical maintenance only

__________________________________________________________________________________________________
Issue No.01 Document No. 2227/17
6 PERFORMANCE TARGETS and LEVELS OF SERVICE
6.1 Service Standards
The activities associated with the management of highway structures are generally carried out in
accordance with the standards and advice contained within the Highways Agency Design Manual
for Roads and Bridges [ref. 7]. Materials and procedures associated with the management of
highway structures are generally carried out in accordance with the Highways Agency Specification
for Highway Works [ref. 8]. The contract documents and procedures for all tendered contracts
associated with the management of highway structures are generally prepared in accordance with
the Highways Agency Manual of Contract Documents for Highway Works [ref. 9]. Departures from
the advice contained in the above documents are recorded in Feasibility Reports, Approval in
Principle documentation or Tender Appraisal Reports as appropriate.
6.2 The Code of Practice for the Management of Highway Structures
The first national Code of Practice for the management of highway structures [ref. 1] was published
in September 2005. The Code sets out the basic legal obligation as follows:
‘There is a statutory obligation on highway authorities to maintain the public highway
(Highways Act, 1980). The obligation embraces the two essential functions of Safe for
Use and Fit for Purpose. The two functions are not the same:
1. Safe for Use requires a highway structure to be managed in such a way that it
does not pose an unacceptable risk to public safety.
2. Fit for Purpose requires a highway structure to be managed in such a way that it
remains available for use by traffic permitted for the route’.
The Code then sets out a number of recommendations for the implementation of good
management practice to deliver the basic legal obligations in three milestones:
• One: Safe for Use
• Two: Fitness for Purpose
• Three: Good Management Practice
SCC is seeking to implement the recommendations of the Code of Practice. Current progress,
where 1 is poor and 5 is high, has been reported [ref. 10]. An extract from this report is included
below:
‘The current position in Surrey at July 2007 is summarised in the table below:
Milestone Rating Range Number of Ratings
(2 or less)
Average Rating
One 2 to 5 5 3.55
Two 2 to 5 6 3.37
Three 1 to 5 7 2.94
It is alarming to note that the scores for all three milestones have decreased since January 2007.
The number of ratings scoring 2 or less for Milestone One has increased from zero in October 2005
to five in July 2007.’

SURREY HIGHWAYS STRUCTURES ASSET MANAGEMENT
PLANNING
STRUCTURES GROUP
_______________________________________________________________________________________________________________
Issue No. 01 Document No. 2227/17
The score for Milestone One had decreased from when the first report was written in October 2005
because of the restrictions on training budgets and use of consultants that were imposed during
2006. There has been a further reduction in score due to the current level of vacancies that exist in
the Structures Group. An Action Plan for the implementation of the Code has been agreed with the
Head of Service and will be included in the 2008/09 Group Business Plan.
6.3 Performance Measurement
At the present time there are no national BVPIs that relate to the management of the stock of
highway structures. However, a new national document entitled ‘Guidance Document for
Performance Measurement of Highway Structures’ has recently been published [ref. 11]. The
document was prepared by Atkins on behalf of the Highways Agency and the CSS Bridges Group.
The document proposes the introduction of four performance measures as follows:
• Condition Performance Indicator
• Availability Performance Indicator
• Reliability Performance Indicator
• Structures backlog
It is not known whether or not the Department for Transport will adopt these indicators as national
BVPIs. This is felt to be unlikely as the total number of BVPIs has been reduced. However, SCC
will adopt these four measures as local performance indicators. Reasonable experience has been
obtained with the use of the Condition Performance Indicator but more work is required to adopt
the requirements of the other three indicators.
The CSS Bridges Group also developed the following suggested performance indicators:
1. Bridges not meeting highway authority’s required carrying capacity as a percentage
of total stock
2. Annual maintenance expenditure on bridges as a percentage of stock value
3. Annual maintenance expenditure on retaining walls as a percentage of stock value
The performance indicators included in the current Structures Group Management Plan that relate
specifically to Asset Management are given in Table 9.
6.4 Performance Targets
The Strategic Goals and Objectives were set out in Section 2. The public perception of highway
structures was also discussed in Section 2. A sub-group of the Asset Management Plan Steering
Group is currently considering Levels of Service in more detail. This work will allow the
consideration of the different ‘service options’ that the asset could deliver. These could include
statutory (minimum), existing (what is currently provided), requested (from stakeholder
expectations), and desired / optimum (engineered from lifecycle plans).
The high level targets for the stock of highway structures are as follows:
• Reduce the backlog of maintenance work on highway structures
• Improve the overall condition of the stock of highway structures
• All bridges should be capable of carrying 40 tonne vehicles (unless specifically determined
otherwise by Local Committee)

SURREY HIGHWAYS STRUCTURES ASSET MANAGEMENT
PLANNING
STRUCTURES GROUP
_______________________________________________________________________________________________________________
Issue No. 01 Document No. 2227/17
Specific quantifiable performance targets are as follows:
• Reduce the backlog of maintenance work from £4million to £2million by 2010
• Improve the Condition Performance Indicator score from 88 to 92 by 2010
• Strengthen all SCC owned sub-standard structures by 2012.
A high level target based on the Reliability Performance Indicator will be added in future versions of
this document.
6.5 A Balanced Scorecard Approach
It is considered that the main activities of the Structures Group can be represented by four classifications. Each of these classifications can be further sub-divided into four sub-groups as follows: Operations Customers Condition Feedback Results Availability Committee engagement Reliability Area Group relationships Workbank Constructor engagement Contract Staff Programme (costs) Appraisal performance Fees Staff meetings Works periods Technical engagement Programme (schemes) Training days The relative importance of each of these groups and sub-groups will be determined using a form of multi-criteria decision analysis. It will then be possible to determine an overall performance figure for the work of the Structures Group in any one year.


_____________________________________________________________________________________________________________________________________________________________
___
Issue No.01 Document No. 2227/17
Table 9 - Asset Management Performance Indicators (2007/08)
PI Ref. Performance Indicator Target 2007-08
Accountable Manager
Frequency of data capture
Support actions and key startegies
SG1 Report on condition of the bridge stock using the CSS BCI performance measure
BSCI ave = 89 HB Quarterly Management Plan Review meeting
SG2 Report on assessment capacity of the bridge stock using the Reliability performance measure
Initial score to be reported before setting target
CA Quarterly Management Plan Review meeting
SG3 Report on availability of the bridge stock using the Availability performance measure
Initial score to be reported before setting target
ZC Quarterly Management Plan Review meeting
SG4 Report on the condition of the bridge stock using the Work Bank performance measure
Initial score to be reported before setting target
HB Quarterly Management Plan Review meeting
SG7 Subway enhancement and maintenance painting programme
3 completed schemes per year
HB and CA
Quarterly Management Plan Review meeting
SG8 Facilities for the disabled – improving footbridges and subways
1 scheme per year GC Quarterly Management Plan Review meeting
SG15a Undertake programme of bridge strengthening design and works.
95% of programmed schemes
SAC Quarterly Management Plan Review Meeting
SG15b Undertake programme of inspections including data validation
95% of programmed inspections
HB and CA
Quarterly Management Plan Review Meeting
SG15c Undertake enhanced maintenance programme reducing reliance on reactive work
within 5% of allocation HB and CA Quarterly Management Plan Review Meeting
SG15d Complete planned County Assessment Programme
March 2008 CA Monthly GMT
SG15e Develop programme of parapet upgrades and other enhancement works
Complete agreed programme HB and CA Quarterly Management Plan Review Meeting

__________________________________________________________________________________________________
Issue No.01 Document No. 2227/17
7 PERFORMANCE GAPS
We have prepared a separate report entitled ‘Funding for Bridge Management – An Asset
Management Approach (2007 Update)’ [ref. 12] which reviews in detail the current revenue and
capital allocations for bridge management in Surrey. The report records a level of underfunding
compared with national and regional guidelines. The report also highlights the need to eliminate
the backlog of sub-standard bridges by the end of the Ten Year Transport Plan. Further details are
contained in Section 11.
The performance gaps related to the performance targets are as follows:
• Backlog of maintenance work exceeds target
• Condition Performance Indicator score is below target
• Many SCC owned sub-standard structures still exist on the network
Further work is now required to analyse three possible scenarios as recommended by the Code
[ref. 1] as follows:
1. Enhancement – the work and funding needed to enhance performance to a specified
target
2. Steady State – the level of work and funding needed to sustain the current level of
performance. This information is required for asset valuation purposes (see Section 10)
3. Deterioration – the performance if funding is insufficient to maintain Steady State (if this is
planned it should be referred to as Managed Deterioration)
This analysis will be done by combining the information contained within the Funding Report [ref.
12] and the Performance Targets contained in Section 6.4. It will also be necessary to develop the
individual lifecycle plans discussed in Section 8.
To summarise: the overall key problem areas are as follows:
• Sub standard strength assessment bridges
• Substandard parapets
• Road over rail mitigation measures
• Disability Discrimination Act improvements
• Shift from ‘reactive’ to ‘preventative’ maintenance
• Maintenance backlog
It is an objective to reduce this backlog at a rate that minimises whole life costs.

SURREY HIGHWAYS STRUCTURES ASSET MANAGEMENT PLANNING STRUCTURES GROUP
Issue No. 01 Document No. 2227/17
8 LIFECYCLE PLANS
The purpose of this section is, ultimately, to develop lifecycle plans for each individual bridge and
highway structure within the asset inventory. Asset management practice requires a shift from a
reactive approach to longer term planning. Therefore, it is important that the management of the
asset considers the whole life of the asset and seeks to minimise the whole life cost of ownership.
The initial stages of the preparation of these individual lifecycle plans will be based on asset sub-
groups. Preliminary lifecycle plans will also be developed for the four Thames Bridges because of
their strategic importance and comparatively large deck area per structure. The long term aim of
this section is to be able to identify the optimal investment profile required to deliver a specified
level of service and the cost effectiveness of varied levels of service and thereby allow
economically optimal solutions to be identified.
The Code (Ref. 1) describes a Lifecycle Plan as follows:
‘A Lifecycle Plan describes the long term strategy for managing a group of similar
structures with a view to minimising whole life costs while providing the required levels of
performance. Lifecycle Plans are used to identify maintenance cycles and intervention
thresholds.’
The Code (Ref. 1) goes on to say:
‘The same lifecycle plans should be used to identify needs for individual structures and
elements. The cyclic / intervention rules established in the lifecycle plans are compared
against the current conditions and performance of a structure / element and the specific
characteristics of a structure are assessed to determine of the lifecycle plan activity is
appropriate i.e. the lifecycle plans should be used as general guidance when identifying
specific maintenance needs’.
A significant amount of work is now required to develop lifecycle plans. A typical example of
generic lifecycle plans developed for the Enhancement, Steady-State and Deterioration conditions
is shown in Figure 4. Each lifecycle plan will include a complete acquisition to disposal cycle (see
Figure 5). At the present time the routine maintenance activities and maintenance standards for
highway structures are given in Tables 10 and 11 respectively. We seek to keep bridges in a
serviceable state by carrying out the inspection process and then applying the stated maintenance
standards.

SURREY HIGHWAYS STRUCTURES ASSET MANAGEMENT PLANNING STRUCTURES GROUP
Issue No. 01 Document No. 2227/17
Figure 4 – Examples of Life Cycle Plans (source: fig. 5.2 [ref.1])
Figure 5 – Lifecycle phases of a highway structure (source: fig. 3.8 [ref.1]

SURREY HIGHWAYS STRUCTURES ASSET MANAGEMENT PLANNING STRUCTURES GROUP
Issue No. 01 Document No. 2227/17
Table.10 – Routine Maintenance Activities – Structures
Asset Type Activity Service Standard
Bridges/Structures Bridge Structural maintenance includes:
• Parapet Replacement
• Pedestrian Headwall
• Wingwall and Retaining Wall
• Bridge Waterproofing
• Bridge Expansion Joints
Details of the service
standard are fully
tabulated in the Quality
Management System
Bridge refurbishment may include the above
– but more often includes the more
superficial ‘non-structural’ maintenance i.e.:
• Re-pointing
• Brickwork
• Clearing vegetation
• Painting
• Repairing
Comprises:
• Steady state
maintenance
• Minor fixes and
repairs
Table 11 – Maintenance Activity Standards Activity Comment Expected Life
Brick repairs - minor
- major
4 – 10 years
10 – 15 years
Concrete repairs – minor
- major
1 – 5 years
5 – 10 years
Brick Arch crack repairs
barrel repairs
1 – 5 years
5 – 10 years
Steel painting New epoxy based paints are claimed to last 25 years - but have only been out for about 5 years
12 – 15 years
Waterproofing 12 years
Joint replacement 6 years
Strengthening The strengthened element will last 120 years – however, the parent bridge may deteriorate faster
60 – 120 years
Redecking The strengthened element will last 120 years – however, the parent bridge may deteriorate faster
120 years
Reconstruction, New Bridges 120 years

SURREY HIGHWAYS STRUCTURES ASSET MANAGEMENT PLANNING STRUCTURES GROUP
Issue No. 01 Document No. 2227/17
9 VALUE MANAGEMENT AND RISK ASSESSMENT 9.1 Value Management
Value management is used to prioritise needs. The Code [ref. 1] recommends that:
‘Value Management should be used because it provides a formalised approach for
assessing the benefits of undertaking maintenance and the associated risks of not
undertaking maintenance. The risks and benefits should cover hard issues e.g. condition
and assessed capacity that can be assessed objectively and soft issues such as local
importance and synergies with other work that may need to be assessed subjectively’.
9.2 Risk Assessment
An important part of Value Management is Risk Management. It should be noted that risk analysis
is the calculation of a risk, whereas risk assessment is a judgement on the acceptability of the risk.
At the present time, the value management process is dependent on the draft risk assessment
exercise carried out as part of the first draft TAMP. An extract from this exercise covering
Structures Group activities has been included as Table 12. Risks were calculated based on image,
process, financial and safety scores. Potential consequences of failure have been determined and
mitigation actions detailed. Operational health and safety risks are excluded from this exercise.
Highway structures have a higher level of associated risk compared with other highway assets
largely because of the higher level of consequential effects. The results of the risk management
exercise may lead us eventually to reconsider optimal service levels, option appraisal and budget
optimisation. A series of workshops were held in autumn 2007 to review risks at service and
corporate levels. The Structures part of the Surrey Highways risk register has been extracted and
will be included in the 2008/09 Business Plan.
The current risk management process is supported by the existing value management
prioritisation tools for determining the following programmes:
• parapet upgrade work (Figure 6)
• railway incursion mitigation (Figure 7)
• strengthening (Figure 8)
The risk management of bridges that have failed strength assessments is covered by procedures
set out in BD79 [ref. 5] (refer also to paragraph 4.3). The simplified flow chart adopted by
Structures Group is shown in Figure 9. Each ‘failed’ structure has a data sheet, known as an E1
form, together with a Monitoring Procedure, where appropriate. The Monitoring Procedure
contains details of intervention measures to minimise risks. Each E1 form is reviewed on a bi-
annual basis, or sooner if intermediate special inspections determine otherwise.


_____________________________________________________________________________________________________________________________________________________________
Issue No.01 Document No. 2227/17
Table.12 – Risk Identification and Assessment
No. Risk Impact Image Rating
Financial Rating
Safety Process Rating
Sum Likelihood Rating
Overall Rating
Mitigation
1 Increase in costs of strengthening work reduces effectiveness of programme
Number of sub-standard bridges continue to rise. Greater risk of restrictions and failures.
2 3
3
3 11 3 33
PM and Area seek to engage partners and contractors in value engineering methods that increase the amount of work completed.
2 Increase in costs of maintenance work reduces effectiveness of programme
Condition of bridge stock deteriorates. Reduction in performance indicator. Maintenance backlog increases.
3 3
2
3 11 3 33
PM and Area seek to engage partners in improved methods of working that increase the amount of work completed.
3 Failure of any structure requiring road closure
High risk of injury. Sudden unplanned traffic diversions.
4 4
4
4 16 2 32
Constructors briefed to be able to respond to such incidents.
4 Failure of sub-standard structure requiring road closure
High risk of injury. Planned diversion to be implemented.
4 4
4
4 16 2 32
Inspect and monitor sub-standard structures in accordance with BD79.
5 Failure to complete annual assessment programme
Risk of sub-standard bridges going undetected. Reduction in performance indicator.
2 2
3 2 9 3 27
Performance management techniques. Use of consultants Task specific progress meetings.
6 Failure to complete annual inspection programme
Risk of defects going undetected. Reduction in performance indicator.
2 2
3
2 9 3 27
Performance management techniques. Task specific progress meetings. Bench marking with SEABIG. Use of consultants

SURREY HIGHWAYS STRUCTURES ASSET MANAGEMENT PLANNING STRUCTURES GROUP
Issue No. 01 Document No. 2227/17
There are currently 33 bridges on the network that have failed assessments and are only kept
in unrestricted service as a result of the special inspection programme. This situation cannot
continue indefinitely. Current levels of funding are likely to result in traffic restrictions having to
be imposed to ensure public safety.
The value management process will eventually cover:
• options for routine maintenance and how they are selected and evaluated
• potential planned maintenance schemes and how different treatment options are
identified and evaluated
9.3 Value Engineering
All SCC promoted schemes (strengthening, reconstruction or new works) are subject to a Value
Engineering process that considers load bearing capacity, ground conditions, physical
constraints, traffic management issues, environmental issues, materials and methods of
construction, health and safety issues, maintenance implications, whole life costs and any other
relevant issues. The assessment, design and checking process is subject to the requirements
of the Technical Approval procedures contained in BD2 [ref.6].
10. ASSET VALUATION
Structures Group is a member of the CSS South East Area Bridge Improvement Group
(SEABIG) which seeks to compare bridge management performance across the South East,
thereby supporting continuous improvement.
The CSS reported [Ref. 13] that the average cost of replacing a typical authority bridge was
£215,000 (this approximates to a rate of £2,000 per sg.m.). More recent work by SEABIG
showed that the increased costs of working in the South East were reflected by an average
replacement cost figure of £4,800 per sq.m.
The use of this simplistic asset value figure was used to show that the asset value of the bridge
stock on the Surrey road network was approximately £409m [Ref.14]. From this it was possible
to compare the annual budget figures with recommended levels of investment (see section 11).
The UK Government has introduced new Resource Accounting and Budgeting (RAB)
procedures for all Government Departments from 2001/02. The fundamental objective is to
provide a systematic link between allocation of resources (or budgets) and Departmental
objectives, outputs and outcomes. The accounting procedures require the value of fixed assets
to be shown on balance sheets. It is expected that RAB will be introduced to local authority
transport assets from 2008/09. It can be seen that the effective valuation of the bridge stock
will become even more important in future years. Further work is being carried out nationally to
quantify techniques and to provide advice on deterioration modelling. It will then be necessary
to gather and manipulate data to assist in the valuation of assets.
Further work has now been carried out as part of the initial valuation of the total highway asset
[Ref. 15]. The gross replacement cost has been estimated to be £500,612,000. Consumption
has been estimated at £100,122,000. Therefore, the depreciated replacement cost has been
estimated to be £400,490,000.
The calculation of consumption was based on there being a linear relationship between the
gross replacement value of the asset at a BCI value of 100 and a zero valuation at a BCI value

SURREY HIGHWAYS STRUCTURES ASSET MANAGEMENT PLANNING STRUCTURES GROUP
Issue No. 01 Document No. 2227/17
of 40. This enabled the consumption to be calculated given that the current average BCI value
is 88. Further work has now been carried out by others in order to determine a methodology for
the amount of work required to restore the average condition of the bridge stock to the optimum
figure. This work will be considered in future issues of this document. This approach is likely to
be more realistic than assigning a design life of 120 years to highway structures and assuming
a linear deterioration over time given that most highway structures have an indefinite life.
However, this does not apply to components and further work is required to consider the effect
of component deterioration on the asset value.

SURREY HIGHWAYS STRUCTURES ASSET MANAGEMENT PLANNING STRUCTURES GROUP
Issue No. 01 Document No. 2227/17
Fig. 6 – Parapet prioritisation process

SURREY HIGHWAYS STRUCTURES ASSET MANAGEMENT PLANNING STRUCTURES GROUP
Issue No. 01 Document No. 2227/17
Fig. 7 – Railway incursion prioritisation process

SURREY HIGHWAYS STRUCTURES ASSET MANAGEMENT PLANNING STRUCTURES GROUP
Issue No. 01 Document No. 2227/17
Fig.8 – Strengthening Prioritisation Process

SURREY HIGHWAYS STRUCTURES ASSET MANAGEMENT PLANNING STRUCTURES GROUP
Issue No. 01 Document No. 2227/17
Fig. 9 – Simplified BD79 process
PM produces schedule
of bridges to beassessed
Carryout Level 1
assessment
EndNoSubstandard
Bridge?
Yes
Apply interim measure
Prioritise the structure forstrengthening and include
in strengthening
programme
Carry out higher level
assessment work as
appropriate.
No
Update results in BMS
Is the structure
an immediate
risk structure?
Does the
structure pass?Update results in BMS
No
Complete Form E1
(review every 2 years)
Is monitoring
byinspection
sufficient?
Determine monitoring
procedure and include in
inspection programme
Yes
Update Form E1
Yes
Yes
End
No
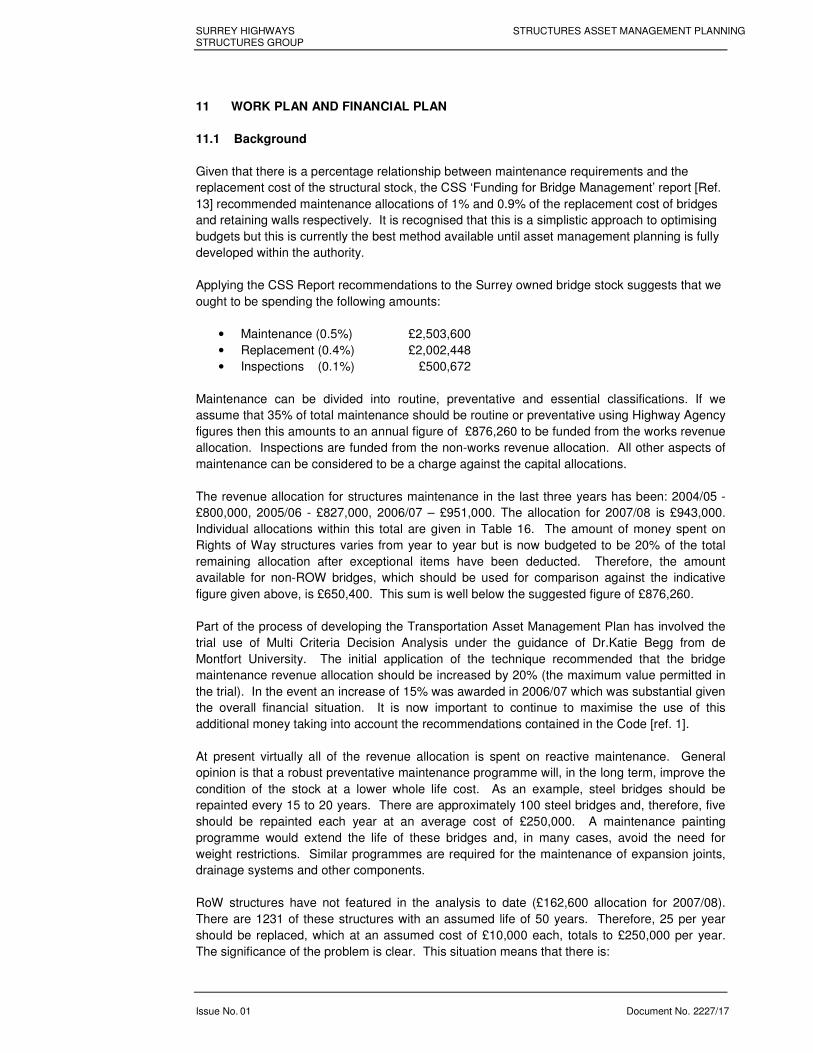
SURREY HIGHWAYS STRUCTURES ASSET MANAGEMENT PLANNING STRUCTURES GROUP
Issue No. 01 Document No. 2227/17
11 WORK PLAN AND FINANCIAL PLAN
11.1 Background
Given that there is a percentage relationship between maintenance requirements and the
replacement cost of the structural stock, the CSS ‘Funding for Bridge Management’ report [Ref.
13] recommended maintenance allocations of 1% and 0.9% of the replacement cost of bridges
and retaining walls respectively. It is recognised that this is a simplistic approach to optimising
budgets but this is currently the best method available until asset management planning is fully
developed within the authority.
Applying the CSS Report recommendations to the Surrey owned bridge stock suggests that we
ought to be spending the following amounts:
• Maintenance (0.5%) £2,503,600
• Replacement (0.4%) £2,002,448
• Inspections (0.1%) £500,672
Maintenance can be divided into routine, preventative and essential classifications. If we
assume that 35% of total maintenance should be routine or preventative using Highway Agency
figures then this amounts to an annual figure of £876,260 to be funded from the works revenue
allocation. Inspections are funded from the non-works revenue allocation. All other aspects of
maintenance can be considered to be a charge against the capital allocations.
The revenue allocation for structures maintenance in the last three years has been: 2004/05 -
£800,000, 2005/06 - £827,000, 2006/07 – £951,000. The allocation for 2007/08 is £943,000.
Individual allocations within this total are given in Table 16. The amount of money spent on
Rights of Way structures varies from year to year but is now budgeted to be 20% of the total
remaining allocation after exceptional items have been deducted. Therefore, the amount
available for non-ROW bridges, which should be used for comparison against the indicative
figure given above, is £650,400. This sum is well below the suggested figure of £876,260.
Part of the process of developing the Transportation Asset Management Plan has involved the
trial use of Multi Criteria Decision Analysis under the guidance of Dr.Katie Begg from de
Montfort University. The initial application of the technique recommended that the bridge
maintenance revenue allocation should be increased by 20% (the maximum value permitted in
the trial). In the event an increase of 15% was awarded in 2006/07 which was substantial given
the overall financial situation. It is now important to continue to maximise the use of this
additional money taking into account the recommendations contained in the Code [ref. 1].
At present virtually all of the revenue allocation is spent on reactive maintenance. General
opinion is that a robust preventative maintenance programme will, in the long term, improve the
condition of the stock at a lower whole life cost. As an example, steel bridges should be
repainted every 15 to 20 years. There are approximately 100 steel bridges and, therefore, five
should be repainted each year at an average cost of £250,000. A maintenance painting
programme would extend the life of these bridges and, in many cases, avoid the need for
weight restrictions. Similar programmes are required for the maintenance of expansion joints,
drainage systems and other components.
RoW structures have not featured in the analysis to date (£162,600 allocation for 2007/08).
There are 1231 of these structures with an assumed life of 50 years. Therefore, 25 per year
should be replaced, which at an assumed cost of £10,000 each, totals to £250,000 per year.
The significance of the problem is clear. This situation means that there is:

SURREY HIGHWAYS STRUCTURES ASSET MANAGEMENT PLANNING STRUCTURES GROUP
Issue No. 01 Document No. 2227/17
• increased risk of injury accidents
• increased risks of claims for injury
• increased numbers of bridge closures
• increased numbers of claims under the Highways Act
The major maintenance of retaining walls and longer footbridges is largely unfunded at present.
This activity would clearly qualify for capital expenditure but there are doubts about our ability to
use the bridge strengthening programme allocation. There are 63 footbridges on the road
network which, given a design life assumption of 50 years, means that we should be replacing
1.26 per year and at an average cost of £200,000 each this equates to £252,000 per year. This
figure ignores the similar size of problem with retaining walls. The outcome of the problem is
likely to be:
• spalling concrete
• poor appearance
• netting
• restricted use
• closure of overbridge
• restriction on main road
11.2 Routine Maintenance Plan
Routine maintenance is the regular ongoing day-to-day work that is necessary to keep assets
operating. Steady State maintenance can be split into Preventative and Essential maintenance.
The former covers work to repair defects, replace components and includes repointing,
repainting, re-waterproofing, minor concrete repairs and cathodic protection etc. The latter
heading covers rehabilitation work undertaken when part (or whole) of a structure is considered
to be (or about to become) structurally inadequate; e.g. major concrete repairs, scour repairs,
masonry repairs, replacing bearings, steelwork repairs etc. The maintenance allocations for
2007/08 are given in Table 13. Table 13 – Revenue Works Allocations
Topic 2007/08
(£)
Subway pump maintenance 30,000
Railway bridge works agreements
65,000
Rights of Way Structures 162,600
Main Highway Structures 650,400
Sub-Total 908,000
Damage to County Property 35,000
TOTAL 943,000
Source: Structures Group Business Plans / SCC Budget Book 2007/08
Maintenance works are ordered from the two Surrey Highways Partnership Constructors, Ringway and Carillion, by way of the integrated works ordering system – CONFIRM. The Constructors carry out this work largely in accordance with Particular Specifications agreed at the time of the contract award. Costs are monitored through the SAP financial system and are reviewed at monthly review meetings. Further progress on the development of asset management procedures is possible within the partnerships. Projects over £500,000 are delivered by individual contracts procured on a Most Economically Advantageous Tender basis.

SURREY HIGHWAYS STRUCTURES ASSET MANAGEMENT PLANNING STRUCTURES GROUP
Issue No. 01 Document No. 2227/17
Routine maintenance activities are detailed in Table 10. Extensive research has been carried out over the last five years as part of study for an Engineering Doctorate and typical intervention periods for various maintenance activities have been determined as shown in Table 11 and these now form the maintenance standard, although this is subject to review. 11.3 Parapet and Bridge Approach Upgrading Plan A programme to upgrade bridge parapets where they do not meet current standards, as part of the contribution to improve the safety of the highway network, is being developed. Following the Great Heck incident of February 2001, there is also a programme to upgrade the approaches to road over rail bridges in partnership with Network Rail – see Table 14. This is a provisional programme that is waiting for final confirmation from Network Rail.
Table 14 - Bridge Approach Upgrading Programme 2007/2008
Bridge Number
Bridge Name District Project Cost (£)
D6864/1579 Blundel Lane Railway Elmbridge 15,000
Smarts Heath Railway Woking 15,000
Portsmouth Road Railway Waverley 50,000
Tunnel Bridge Tandridge 40,000
2008/2009
C42/659 Forest Road Railway Guildford 50,000
C141/1798 St.Johns Road Woking 150,000
11.4 Strengthening Plan
In 1998 the Government published a White Paper entitled ‘Roads 2000: A New Deal for Roads’.
This White Paper required local authorities to:
• arrest deterioration in condition on local roads by 2004
• remove the maintenance backlog by 2010
The Bridge Strengthening programme was first presented in the draft Local Transport Plan for
2000/2001 in order to achieve this objective. It was subsequently re-published in the full Local
Transport Plans for 2001/2002 to 2005/2006. The structures that required strengthening were
identified from the stock that had been assessed as part of the nationally funded bridge
assessment programme. The prioritisation process was included in the first Local Transport
Plan and enabled a five year programme to be produced. Unfortunately, difficulties with
resources and increasing works costs meant that the original programme was not achieved.
The second Local Transport Plan included a further five year programme of works from 2006/07
to 2009/10.
If the currently predicted level of funding is realised then the bridge strengthening/refurbishment
programme, as originally set out in the LTP, is likely to be delivered four years behind the
original planned date. By then, approximately 330 out of 725 bridges (45%) will have had major
capital investment.

SURREY HIGHWAYS STRUCTURES ASSET MANAGEMENT PLANNING STRUCTURES GROUP
Issue No. 01 Document No. 2227/17
In addition, there will still be approximately 400 bridges which have not had the benefit of capital
investment, although it has to be acknowledged that most of the larger and more significant
bridges would have been dealt with.
The 2007/08 bridge strengthening programme is set out elsewhere [Ref. 16]. The longer term 5
year bridge strengthening programme is set out elsewhere [Ref. 17].
.
11.5 Subways and Footbridges Plan
The Bridge Management Strategy of the LTP included a desire to improve the access to
footways and subways where they did not meet current standards. This was part of the overall
strategy to improve accessibility as well as to start to meet the requirements of the Disability
Discrimination Act. Details are given in Table 15.
Table 15 Subway and Footbridge Accessibility Programme
2007/2008
Location District Project Cost (£)
Stones Road Subway Epsom and Ewell 300,000
Debenhams Subway Guildford 250,000
Lightwater Subway South Surrey Heath 300,000
11.6 Disposal Plan
Disposal is any activity that removes a decommissioned asset, including sale, demolition or
relocation.
Disposal of structures assets will generally occur as part of disposal of a larger asset grouping
like roads and footways. However, other drivers may result in development of a disposal
programme as shown in Table 16. Sustainable development objectives also need to be taken
into account.
Table 16 – Structures Disposal Activities and Drivers
Asset Description Disposal Activity Drivers Disposal
Programme
Subway Infill of subway Lack of use Lightwater subways
are under review
General structures Closing of structures Stopping up of roads No current actions
programmed
Footbridges Removal of disused
footbridges
Provision of
alternative high
quality at-grade
facilities
No current actions
programmed

SURREY HIGHWAYS STRUCTURES ASSET MANAGEMENT PLANNING STRUCTURES GROUP
Issue No. 01 Document No. 2227/17
12 SUSTAINABLE DEVELOPMENT
There are many definitions of sustainable development but perhaps the most common is:
‘Sustainable development meets our present needs without compromising the ability of
future generations to meet theirs.’ Brundtand Commission (1987)
Doctoral research work sponsored by SCC at the University of Surrey enabled a method to be
developed which would allow environmental pollution effects of bridge management activities to
be quantified. Recent receipt of additional funding will allow this research to be disseminated in
a practical form. This will then influence future maintenance decisions.
In order to take the longer term view, we will:
• maximise reuse of existing materials when repair and reconstruction is carried out
• ensure that materials incorporated in works will be recyclable at the end of their useful
life
• maximise the use of renewable resources whenever possible
One of the best ways to demonstrate economic stewardship of assets is to quantify the asset
value in monetary terms and monitor how this is changing with time. This will indicate if costs
are being passed to future generations and can provide compelling arguments for investing in
the preservation of the asset base. It is likely that this approach will form the basis of a future
national performance indicator.
Prior to the development of such an indicator a more simplistic approach is to calculate the
amount spent on maintenance as a percentage of the asset valuation – as described above.
13 IMPROVEMENT PLAN
It is recognised that the development of a Lifecycle Plan within the overall Asset Management
Plan is a continuous improvement process. Future versions of this Plan will cover, and be
influenced by, the following topics in greater detail:
• interpretation of data from the CSS Bridge Condition Indicators
• development of a continuous assessment programme
• development of a bridge strengthening and upgrading programme through to
the end of the 10 year Transport Plan
• introduction of national key performance indicators for bridges
• development of deterioration models for bridges
• development of Asset Valuation models
• introduction of an advanced Bridge Management System
• implementation of sustainable development indicators for bridges
A more detailed Improvement Plan that takes into account the new Highways Service Business
Plan and the publication of the Code [ref.1] is now being developed.

SURREY HIGHWAYS STRUCTURES ASSET MANAGEMENT PLANNING STRUCTURES GROUP
Issue No. 01 Document No. 2227/17
REFERENCES
1. A Code of Practice for the Management of Highway Structures The Stationery Office, September 2005. 2. CSS, Bridge Condition Indicators – Volume 3, Guidance Notes on Evaluation of Bridge
Condition Indicators, July 2002 3. Johnston, F., Developing Whole Life Strategies for Highway Networks
Assessment for Roads: Development and Implementation, Aston University, November 2003
4. Palmer J. and Cogswell G Management of the Bridge Stock of a UK County Bridge Management, Elsevier Applied Science, 1990 5. Highways Agency, The Management of Sub-Standard Highway Structures, BD79, 2006 6. Highways Agency, Technical Approval of Highway Structures, BD2, 2005 7. Highways Agency, Design Manual for Roads and Bridges 8. Highways Agency, Specification for Highway Works 9. Highways Agency, Manual of Contract Documents for Highways Works 10. The Code of Practice for the Management of Highway Structures – A Commentary on the
Recommendations (July 2007 Update) Structures Group Report (2227/11), September 2007 11. Guidance Document for Performance Measurement of Highway Structures Atkins Report for Highways Agency and CSS Bridges Group, 2007 12. Funding for Bridge Management – An Asset Management Approach (2006 Update) Structures Group Report (2227/15), January 2007 13. CSS, ‘Funding for Bridge Management’, February 2000 14. Best Value in Structures, SEABIG – An Interim Report Structures Group Report (2227/**), February 2001 15. Asset Valuation – Initial Report, April 2006 16. Executive Report with Programmes 17. LTP2

61
Appendix C – Footway, Newcastle
City Council – October 2006

62
1.1 Goals and Objectives
There are a large number of goals and objectives set down for footways and cycleways in a number of policy documents, the specific goals and objectives that relate to footway maintenance within the Highway Maintenance Strategy are those which have the most relevance to this lifecycle plan, these can be broken down into three main areas, Policies, Practices, and Reporting, they comprise: Policies
• Implement proactive policies to identify defects and carry out resulting safety and routine maintenance repairs;
• Create a safer and more inviting environment for pedestrians and cyclists and provide specific features and facilities within schemes;
• Improve access for disabled people, for example by the inclusion of dropped kerbs at main crossing points;
• Adopt a ‘clear streets’ policy for designated, well used routes;
• Create an attractive well maintained highway environment through the promotion of good maintenance policy, to contribute to urban renewal and to help attract new businesses to industrial and commercial areas;
• Develop a customer focussed highway maintenance service;
• Seek and explore alternative and additional funding for Highway Maintenance;
Practices
• Implement responsive practices to repair pavements when stakeholders raise concerns, including repairing potentially hazardous pavement trips and potholes within 24 hours;
• Implement maintenance designs which are appropriate to the style of the area and which help to promote tourism by the enhancement of the street scene;
• Use appropriate materials to complement the appearance of areas of specific amenity value including conservation areas, the City Centre, and public squares when works are carried out;
• Use maintenance treatments which reduce the long term reliance on quarrying new materials, disposing of existing materials to landfill sites and minimise the use of road transport of construction materials;
• Carry out routine inspections in accordance with the code of practice for maintenance management to identify highway defects, particularly trips in the footway greater than 25mm to meet the requirements of the City’s risk management strategy;
• Carry out additional inspections in response to requests from Members and the public, normally received through the Envirocall system;
• Review design and maintenance standards so that, where appropriate, flagged footways are replaced with bituminous materials;
• Options for the procurement of Highway Maintenance services will be assessed, with a view to forming partnerships;
Appendix C: Footways & Cycleways Life Cycle Plan,
Newcastle City Council

63
• Progress the collection of highway inventory data to improve the effectiveness of highway maintenance management and highway asset management;
• Prioritise the funding for the collection of highway inventory data, preferably as an additional investment from resources outside of existing highway budgets.
Reporting
• Consult widely on maintenance policies and programmes;
• Report progress of both implementation and performance indicators;
• Ensure that national and local performance targets are met or exceeded within the given timescales;
• Benchmark processes and procurement to ensure cost effectiveness and value for money;
• A ten year programme of planned highway maintenance schemes will be reported to the Executive annually to meet the targets for the financial year;
• The annual programme of works will be reported to area committee, with an update provided every 3 months;
• Stakeholders directly affected by works in their street will be notified in writing of the proposed work, a minimum of one month prior to operations commencing;
• A second letter will be sent to stakeholders confirming the start date for operations, and giving a minimum of 1 weeks notice;
• Publish operational standards and work programmes;
• Review Highway Maintenance strategy and performance and report annually; The above objectives meet the Authorities Local Transport Plan objectives detailed below:
• Accessibility - improving access and enhancing opportunities to reach a full range of facilities and activities, especially for those without access to a car and people with particular mobility problems;
• Economy - supporting economic growth, promoting regeneration and improving prosperity;
• Environment - reducing transport related atmospheric pollution, and other adverse environmental impact of traffic to enhance the sustainability of transport;
• Integration - improving the links between public transport networks, closer integration of land-use and transportation planning and better liaison with neighbouring authorities; and
• Safety - improving road safety and reducing the fear of crime associated with transport. In addition the Local Transport Plan identifies the following Transport Strategy Themes, which a
well maintained footway infrastructure would help support:
• Access for All;
• Cycling;
• Public Transport;
• Structural Maintenance;
• Safety and Security;
• Travel and Demand Management;
• Economic Development;

64
1.2 Inventory
Information on the inventory of footway infrastructure has been entered onto the Symology database. This is a recently acquired database, which at present only holds details of:
• Street name (90%)
• Footway classification (Prestige Area, primary / secondary walking route etc.) (90%)
• Location (90%)
• BVPI’s (7%)
• CVI data (50%)
• CES condition assessment (95%)
• Date of last inspection (95%)
• Length (40%)
• Width (20%)
• Surfacing material (90%)
• Kerb type / material (90%)
• Channel type / material (30%)
• Planned maintenance history (95% over the past year)
• Reactive maintenance history (95% over the last 3 years) It is intended that the Symology database will eventually hold full details of:
• Street name
• Footway classification (Prestige Area, primary / secondary walking route etc.)
• Location
• BVPI’s
• CES condition assessment
• Date of last inspection
• Length
• Width
• Surfacing material
• Kerb type / material
• Channel type / material
• Construction date
• Construction materials / thickness
• Planned maintenance history
• Reactive maintenance history
A video survey of 30% of the classified network and 20% of the unclassified network has been completed by DCL, with the roads selected being a representative sample of all of the roads within the network. Following validation of the survey results it is intended that the remaining percentage of the network should be surveyed by video and/or walked inspection within the next 12 months. In addition the highway inspectors and highway control assistants are undertaking an ongoing inventory collection for a number of footway asset elements as part of, and in addition to, their regular work duties.

65
Although at this point a significant amount of the required records are unavailable there is a high level of confidence in the records, which are held. It is estimated that the overall length of footway (including cycleway) managed by Newcastle City Council is 1900Km of which approximately 140Km comprises the class 1, 1a & 2 footways.
1.3 Condition The condition of the asset is assessed by regular inspection and by using a number of assessment techniques. Newcastle City Council has a condition inspection regime, with information recorded in the Symology database. The highway inspectors give a condition rating for each carriageway during the course of their planned inspections using a, 1 to 5 criteria:
• 1 Excellent New or no defects, negligible wear
• 2 Good Small number of minor defects, few safety repairs required
• 3 Fair A small number of minor defects, patching repairs required
• 4 Poor A greater number of minor defects, inspect for possible scheme
• 5 Bad Higher number of defects, inspect for possible maintenance scheme
Table 1.3.1 identifies the percentage ranges for particular defects (for both flexible and rigid surfaces) for footways and kerbs, which are used to help judge the condition rating.
Table 1.3.1 Condition Monitors Used to Establish Condition Rating.
Rating Sub Set
Condition Monitor (Defect) Percentage Range
Footways
(1) (a) All defects Under 5
(2) (a) Good but mixture of materials
(b) Cracked rigid even surface 5 – 50
(c) Minor Flexible 5 - 50
(3) (a) Cracked but even surface 50 – 100
(b) Minor Flexible 50 – 100
(c) Major Flexible/Rigid 5 – 25
(d) Cracked or uneven surface 5 - 30
(4) (a) Major Flexible/Rigid 25 – 50
(b) Cracked Rigid uneven 30 - 50
(5) (a) Major Flexible Uneven 50 - 100
(b) Cracked and Uneven 50 - 100
Kerbing (1) (a) Good
(2) (a) Kerb Height 25mm to 75mm or over 150mm 25 – 50
(3) (a) Kerb Height under 25mm 5 – 25
(b) Kerbs Tilted/Sunken/Spalling 5 – 25
(4) (a) Kerb Height under 25mm 25 – 75
(b) Kerb Disintegrating/Laminated 5 – 25
(c) Kerbs Tilted/Sunken/Spalling 25 – 50
(5) (a) Kerb Height under 25mm 75 - 100
(b) Kerb Disintegrating/Laminated 25 – 100
(c) Kerbs Tilted/Sunken/Spalling 50 - 100
(d) Combination of 4(b) & 4(c) 50 - 75

66
In addition a number of inspections are undertaken to assess the Governments Best Value
Performance Indicators (BVPIs) which are reported annually in the Local Transport Plan (LTP)
update.
BV187a Condition of footways:
This indicator is based on the collection and analysis of Detailed Visual Inspection (DVI)
measurements, using the national Rules and Parameters for UKPMS. It is designed to provide
the percentage length of the footway network with a Footway Condition Index greater than a
defined threshold value (see below). This threshold is indicative of the need for an investigation
to determine whether maintenance is needed to preserve the footway serviceability. These
rules cover different footway types and the defects associated with the type of footway (e.g.
bituminous, flags) on different footway categories (hierarchies).
A 50% survey of category 1, 1a, and 2, footways are covered each year, with those receiving a
Footway Condition Index greater than or equal to a threshold value of 20.0 being reported as a
percentage length of the footways surveyed.
The type and frequency of condition inspection or assessment undertaken for each footway
hierarchy is detailed in table 15.3.2.
Table 15.3.2 Frequency of Condition Inspections/Assessments
Footway Hierarchy Inspection/Assessment Type Frequency
Prestige Area
Category 1
Detailed Visual Inspection (DVI) Biennially
Highway Inspector condition assessment 6 Monthly
Primary Walking Route
Category 1a
DVI Biennially
Highway Inspector condition assessment 6 Monthly
Secondary Walking Route
Category 2
DVI Biennially
Highway Inspector condition assessment 6 Monthly
Link Footway Highway Inspector condition assessment 6 Monthly
Local Access Footway Highway Inspector condition assessment 6 Monthly
In addition to the condition assessments above a number of routine and safety inspections are carried out on the footways and the frequency of inspection against route type are detailed in tables 1.3.3 and 1.3.4 below.
Table 1.3.3 Frequency of Routine Inspections
Footway / Route Type Frequency
Prestige Area Monthly
Primary Walking Route Six Monthly
Secondary Walking Route Six Monthly
Link Footway Six Monthly
Local Access Footway Six monthly

67
Table 1.3.4 Frequency of Safety Inspections
Footway / Route Type Frequency
Prestige Area Monthly
Primary Walking Route Monthly
Secondary Walking Route Monthly
Link Footway Three monthly
Local Access Footway Six monthly
Where reports of defects are received from Members or Stakeholders additional inspections will
be generated, with safety inspections being undertaken within 24 hours, and routine non-safety
inspections being undertaken within 5 working days, the customer will be contacted within 15
working days, and necessary repairs will be undertaken within 30 working days.
Current Condition Table 1.3.5 shows the last 3 years BVPI condition ratings for Newcastle City Council for footway hierarchies 1, 1a & 2.
Table 1.3.5 BVPI Condition Ratings
Footway Hierarchy BVPI Rating
2003/4 2004/05 2005/6
Prestige Area (1) Primary Walking Route (1a) Secondary Walking Route (2)
34.75 16.66 23.00
The BVPI figure for footway condition has been inconsistent in the past. This is partly due to the
subjectivity of the survey methods and the approach to sampling 50% of the network per annum
making it difficult to draw any realistic comparative performance figures year on year. However,
it is considered that the generally the BVPI figure for footway condition is in the region of 20%
+/- 3% and now meeting the targets set.
As there are no national performance indicators for the remaining 93% of the footway network
Newcastle have introduced a local performance indicator based on CVI surveys and
incorporated it in the HAMP to identify investment need and monitor future performance. At
present, 43% of the entire footway network has been surveyed. The data is processed using
UKPMS to produce an overall condition index (CI) figure for either a residential street or a
section not exceeding 250m in length.Backlog is identified by streets or sections considered to
be in need of treatment if the CI exceeds 20 in line with the CI used for DVI surveys and the BV
187a. Life cycle replacement costs have been calculated using a linear deterioration rate.

68
Based on the Newcastle method of assessment the current backlog stands at 35.8% of the
footway network in need of treatment.
Figure 1.3.1 below details the condition backlog and investment requirement determined based
on the Minimum, Existing and Optimum service options over the next 25 years, for all footway
classes; this is an ongoing assessment and will be revised as part of the annual plan update.
Figure 1.3.1 Condition Backlog Footways
1.4 Demands The demands set on a footway or cycleway can be numerous. A number of particular demands identified by Newcastle City are set out below:
• Providing safe and inviting routes for all pedestrians and cyclists
• Sufficient capacity to cater for the number of pedestrians / cyclists using the route to ensure their expeditious movement
• Sufficient build quality to cope with the general wear & tear caused by the passage of pedestrians and cycles
• Providing access routes for the disadvantaged particularly people with disabilities
• To contribute to urban renewal and to help attract new businesses to industrial and commercial areas
• Provide access to and enhance opportunities for employment, education, shopping, recreation and leisure
• Enhancement of the environment
• Creating an amenity value
CONDITION BACKLOG / INVESTMENT REQUIREMENT -
FOOTWAYS (ALL CLASSES)
0
20
40
60
80
100
120
2006 2010 2020 2030 2034
Year
£million
MINIMUM (backlog) -
Budget £1.25m pa
EXISTING (backlog) - Budget £1.5m pa
OPTIMUM (backlog)
OPTIMUM (investmentrequirement)

69
1.5 Performance Gaps
Performance Gaps are a measure of the failures of an asset to meet the demands of its
construction, or the gap between the desired/target condition and the actual condition. Failures
are measured against individual demands. For example where a footway requires constant
maintenance, relaying of slabs or where a number of footways require maintenance but there is
insufficient funding available to carry out the work etc. A number of performance gaps identified
within Newcastle are detailed in table 1.5.1 below.
Table 1.5.1 Performance Gaps associated with the Footway Asset
Item Problem Possible Response
Maintenance of High Amenity Areas
Areas of high amenity which have been highlighted as requiring higher maintenance standards, are not budgeted for. Existing funding generally allows for the making safe of footways, rather than the replacement of like for like materials, which may cost significantly more.
A better understanding of the lifecycle costs of a range of different materials, may lead to different decisions regarding their specification.
Specialist Materials
Some areas also have materials, which are more prone to failure. Particular types of paving materials are unsuitable for carrying anything but light loadings. Where these areas are subjected to vehicular loading they require constant repair and are a major drain on the reactive maintenance budget. E.g. Northumberland Street
A better understanding of the lifecycle costs of a range of different materials, may lead to different decisions regarding their specification.
Improving access for the disabled.
There is insufficient funding to meet the Council’s commitment to provide improved access routes for the disabled, particularly near Public Buildings, Hospitals, Hostels, and Retirement Homes.
A study has been undertaken to cost the improvements required to provide disabled friendly routes to customer service centres and other public buildings. As the existing budget is incapable of meeting these needs outside sources of funding are being actively sought for these improvement works.
Surfacing & construction
There has been some failure of the footway surfacing or construction within the life span expected, it is believed that this is due to a number of factors including; poor workmanship, unacceptable materials & insufficient supervision.
An increase in supervision and material testing would help to alleviate much of this problem.
Increasing size of the asset
The continually increasing size of the asset through creation, acquisition (adoptions), and upgrading is rarely reflected in similar increases in the maintenance budget.
A better understanding of the size and worth of the existing asset and its true maintenance costs can be used to better inform the decision makers who set the annual budgets.

70
Table 1.5.1 Performance Gaps associated with the Footway Asset
Item Problem Possible Response
Knowledge / delineation of extent of highway
In many instances the extent of the adopted highway is not recorded or delineated on site making it difficult to judge where private frontagers are impinging on the highway or where the authority’s responsibility ends.
Obtain a more accurate record of the highway boundaries in a system which is accessible to all, and where necessary delineate the highway boundary on site.
Inordinate and increasing expectation of service standards
Expectations of the many stakeholders involved with the highway have increased to a level where the funding available is unable to meet the requirements.
It would seem that the funding needed to meet customer expectations is unlikely to be made available, which means that realistic levels of service need to be set and communicated to all.
1.6 Option Appraisal
1.6.1 Routine Maintenance
Routine Maintenance is the regular ongoing day-today work that comprises servicing rather
than repair and is necessary to keep assets operating, this also covers the reactive or adhoc
repair or renewal of minor elements or components which have become unserviceable due to
general wear and tear or have deteriorated for other reasons. Routine maintenance activities for
footways are detailed in table 1.6.1.
Table 1.6.1 Routine Maintenance Activities
Maintenance Activity Maintenance Interval Responsibility
Cyclic Maintenance
Footway Gully Cleaning Annually Environmental Services
Footway Sweeping Weekly Environmental Services
Litter Picking Inspected Weekly, litter pick ordered as required.
Environmental Services
Tree & Hedge Trimming Inspected twice per year works instigated as required
Environmental Services
Reactive (Adhoc) Maintenance
Pothole Repair As required Street Management Team
Minor Patching As required Street Management Team
Isolated slab relay As required Street Management Team
Gully Repair As required Street Management Team
Removal of Debris As required Environmental Services
Cleaning of drainage channels, Aco drain etc.
As required Street Management Team
Environmental Services

71
1.6.2 Renewal/Replacement
Renewal/replacement work is major
(programmed) work that does not increase the
asset’s designed capacity, but restores,
rehabilitates, replaces or renews an existing
asset to its original capacity. (Maintaining a
‘Steady State’) Table 1.6.2 details a number of
‘Steady State’ activities their relative merits and
their expected programme intervals.
Table 1.6.2 Steady State Maintenance Activities
Treatment type Comments Anticipated frequency
Slab Relay A large number of slabs or a large area of slabs to be taken up and re-laid in a discrete area, of a flagged footway, with replacement of damaged slabs only.
25 year
Slurry Seal Application of a thin screed surfacing to the existing bituminous footway.
7 years
Overlay Addition of new surfacing materials on top of existing bituminous construction, where possible.
30 years
Resurfacing Removal of existing bituminous footway construction and replacement with new.
25 years
Resurfacing
Red
Removal of existing bituminous footway construction and replacement with new.
15 years
Reconstruction
Bituminous and slab
Removal of existing footway construction, including sub grade, and replacement with new construction. Only undertaken where sub-base layers do not exist at present.
40 years
Creation/Acquisition/Upgrading
Creation/Acquisition/Upgrading is major work that creates a new asset that did not previously
exist, or works that upgrade or improve an asset beyond its existing design capacity. Examples
of Creation, Acquisition & Upgrading activities are detailed in table 1.6.3 with a programme of
possible future works detailed in table 1.6.4.

72
Table 1.6.3 Creation, Acquisition & Upgrading
Activity Explanation
Creation Although it is unusual to have a new footway or cycleway asset created it does occur where a new route is required, or where an existing substandard footway needs replacing.
Acquisition Acquisition of footways and cycleways is normally associated with the taking up of maintenance responsibilities following new developments, this is normally managed by the development control team using Section.38 or 106 legal agreements.
Upgrading A number of upgrading activities, which may take place to improve the existing stock condition, are detailed below.
Footway widening Construction of additional footway or cycleway space adjacent to an existing footway in order to cope with an increased need.
Junction layout improvement
Introduction of roundabouts or traffic lights, with associated kerb and footway realignment.
Vehicle Crossings Changes & additional construction made to an existing footway to allow the passage of motor vehicles into a property.
Pedestrian crossings
Introduction of pedestrian crossings, with associated kerb and footway realignment.
Table 1.6.4 Creation/Acquisition/Upgrading Programme
Scheme Name Reason for work Anticipated date
Newcastle Great park Development
Adoption of private development 2008/9
1.6.4 Disposal
Disposal is any activity that removes a decommissioned asset, including sale, demolition or relocation. Although disposal of footways is unusual there have been a number of instances in recent years and table 1.6.5 details the disposal activities and the drivers behind their use.
Table 1.6.5 Footway Disposal Activities
Disposal Activity Reason for Disposal
Chatton Wynd footpath closure Antisocial behaviour

73
1.7 Optimisation
1.7.1 Reactive (Adhoc) Maintenance
An overall budget based on historic precedent is made available to the Street Management
Team, over the years this budget has been a target for financial cuts and so has decreased
below the sum needed to maintain the highway efficiently and to respond to the rising
expectations of the residents.
The overall footway budget is split up within a number of different budget headings, initially
broken down into Principal, Classified & Unclassified roads. A number of sub-headings are then
used within these groupings, although in some cases the money from one budget heading is
used for works within another heading where funds are insufficient to carry out the necessary
work. Table 1.7.1 details actual spend, which relates to the adhoc works on the footway asset.
Table 1.7.1 Footway Reactive Maintenance Spend (£)
2001/02 2002/03 2003/04 20004/05 2005/06
Principal 1.31M inc 1.54M inc 73K 79K 76K
Classified 174K 188K 192K
Unclassified 927K 1.42M 1.0M
These sums are then allocated against work orders as and when required following inspections
or reports from members of the public highlighting footway defects. The remaining budget
available is updated as each new order / invoice is placed and is checked on a fortnightly basis
to limit any overspend.
1.7.2 Planned Footway Maintenance schemes:
• Scheme Selection: The identification of planned revenue highway maintenance
schemes is undertaken at neighbourhood level using the condition information
gained from the surveys. This information is then passed to the Members in the
form of a plan. Assessment of this information along with recommendations from
the technical staff is used to prioritise the need for work at various locations. Each
potential scheme receives a technical assessment before being included into the
maintenance programme.
• Scheme Validation: A BVPI for footways has been introduced, however, these
indicators cannot be used to prioritise the majority of schemes as only around 7%
of the network is surveyed. The City’s existing highway inspection condition data
has therefore been adopted, together with a risk assessment, which identifies
those streets where compensation claims have been made against the council.
• Provisional Programme of Works: Following the selection and validation procedure
listed above a provisional programme of works for the following year is developed
to include estimated costs for the works. It is proposed to develop a detailed 2-year
programme in future.
• Accessibility: During the course of footway resurfacing works, the opportunity will
be taken to install dropped kerbs for improved pedestrian access at no extra cost.
In addition, motor crossings will be installed where residents indicate they intend to
park their motor vehicles within the confines of their property. There will be no
charge to residents for this service if the additional costs of the works are minimal.

74
• Consultation: Members are invited to endorse or amend, if necessary, the
proposed schemes applicable to their own ward. Following this process, a
timetable for the works is prepared. Residents are notified one month in advance
of the works commencing, where possible, to advise them of the type of works to
be undertaken and determine if they have any special access requirements.
Using the UKPMS reports gained from utilising the CVI data accumulated from a 43% sample
of the City’s footways and footpaths, and using the assumption that the areas surveyed are a
representative sample of the whole of the footway asset. NCC have produced a model for their
footway maintenance need based on a 25 year life cycle assuming that all of the bituminous
and in situ concrete footways in the City will be either resurfaced or reconstructed once during
the 25 year period depending on condition. Flagged and block paved footways will be relayed
on a 70mm or 100mm lean concrete base with 10% of damaged flags/blocks replaced. The
assumption also includes for 50% relaying of existing kerbs and 10% replacement of damaged
kerbs.
Using this model it has been possible to estimate the funding need required to maintain the
asset in its present condition over the next ten years.
1.7.3 Backlog
Newcastle have introduced a local performance indicator for all footways based on CVI surveys
and incorporated it in the HAMP to identify investment need and monitor future performance. At
present, 43% of the entire footway network has been surveyed. The data is processed using
UKPMS to produce an overall condition index (CI) figure for either a residential street or a
section not exceeding 250m in length. .Backlog is identified by streets or sections considered to
be in need of treatment if the CI exceeds 20 in line with the CI used for DVI surveys and the BV
187a. Life cycle replacement costs have been calculated using a linear deterioration rate.
Based on the Newcastle method of assessment the current backlog stands at 35.8% of the
footway network in need of treatment, which equates to a current backlog cost of £54.8 M.
1.7.4 Service Options
A developed asset management approach is intended to facilitate better decision making by
providing enhanced information to support the decision making process. In practical terms this
means the identification and assessment of Service Options.
The following are the service option categories selected for inclusion in the HAMP
• Statutory (Minimum): Meeting statutory or legislative requirements only
• Existing: Is the effect of a continuance of current funding levels
• Requested: The amount of additional funding required based on customer
expectations and political aspirations
• Optimum Service: Assesses constraints as well as desires to identify an
economically optimal Level of Service. This option is determined from the life cycle
planning process.
• Attainable Service: Re-interprets the optimum option in the light of available
resources. (E.g. budget constraints).

75
Table 1.7.2 Footway & Cycleway Service Options
Asset Group
Statutory Minimum Minimum Existing (2005/6 Budget)
Requested Additional Funding
Optimum
General description of each Service Option
Minimum (Reactive) level of service meeting statutory or legislative requirements only.
The effect of reducing funding levels to current RNF and LTP allocations
The current LoS typically as set out in the City’s MP or national. COPs
A LoS that attempts to meet customer expectations and political aspirations
LoS based upon engineering principles & technical judgement
Footways & Cycleways
Approx. £1.2m for one year only Rapid and unsustainable deterioration of footway network, causing an increase in both reactive maintenance costs and backlog and a steep decline in asset value
Approx £2.4 M pa The minimum budget would be sufficient to maintain the network in its present condition over the next ten years, but would steadily deteriorate after that resulting in a greater backlog than would be the case for current funding levels.
Approx. £ 3.7m pa Has been sufficient to decrease the rate of deterioration in the condition of the City’s footways. However the funding is not sufficient to improve the overall condition of the footways (Includes additional budget of £1.0m funded by Prudential Borrowing)
£9.0m of additional funds pa over a 5 year period followed by an additional £2.5m pa thereafter Required to meet the levels of maintenance deemed necessary to improve the current BVPI ratings and improve the condition of all footways to an acceptable standard and clear the backlog.
Estimated at £11.7m pa for 5 years, thereafter £5.2m pa Will enable a demonstrable improvement in condition of all the City’s footways over a 5 year period, and allow for the continued management o the footways at the new condition levels
1.7.5 Levels of service
Levels of Service identified by Newcastle City Council specific to the Footways asset can be found in table 1.11.1 along with their identified performance measures.

76
1.8 Risk Management– Footways and Cycleways
Risk is 'the threat that an event or action can adversely affect an organisation’s ability to achieve its objectives and to successfully execute its strategies’ (Audit Commission). A simpler definition might be ‘the chance of something happening that will have an impact on objectives’. A risk identification exercise has been undertaken and a risk register and matrix scoring system has been developed and is attached to this document as appendix B. The following are examples of the significant risks associated with this asset.
1.8.1 The most common risk with footways is that associated with the trip hazard caused by:
• Uneven or rocking slabs in a flagged footway
• Potholes in a bituminous footway
• Uneven or rocking kerbs
This could result in serious or minor injury, which could lead to a significant financial implication for:
• Compensation claims
• Repairs to footway Consequential costs could be:
• Poor public image of the Council
This risk can be mitigated by regular safety inspections of all footways and cycleways, which
lead to necessary repairs being carried out in a timely fashion, and the carrying out of routine
maintenance to prevent deterioration of the footway. 1.8.2 Secondary risks include a number of partial failures:
• Inadequate drainage leading to flooding of the footway – this could lead to pedestrians being put at risk by having to walk in the carriageway
• Backfall and inadequate drainage leading to flooding of private property This would lead to financial implications for:
• Compensation claims
• Repairs to footway Consequential costs could be:
• Poor public image of the Council

77
This risk can be mitigated by regular condition inspections of all footways, which lead to minor
drainage repairs being carried out in a timely fashion to prevent or reverse further deterioration,
and the carrying out of routine maintenance to prevent initial deterioration of the footway. 1.8.3 An overarching risk is that of: Inadequate maintenance funding leading to a drop in asset condition standards, which could eventually lead to closure of footways or cycleways due to their being unsafe or unfit for purpose. This would lead to financial implications for:
• Provision and maintenance of barriers or other method of closure
• Provision of an alternative route Consequential costs could be:
• Poor public image of the Council
• Failure to meet policy objectives
1.9 Forward Works Programme
A 10-year forward works programme has been put in place for all routine and ‘steady state’
maintenance operations these include: patching, slab relay, slurry sealing, overlay, slab
replacement & reconstruction etc. There is a high level of confidence in this programme
although the costs associated with the work are the best estimate available at this time and may
vary considerably over the 10-year period.
A detailed 2-year programme is being prepared for footways and cycleways funded by revenue
and partly by LTP capital
A forward works programme for creation, acquisition & upgrading is also being developed
although this is based on a forward thinking ‘wish list’ of ideas which may not come to fruition
and so there is less confidence in this programme.
These programmes are ‘live’ documents and it is expected that they will be amended and
updated on a continuing basis. The forward works programmes are attached as appendix D.
1.10 Physical Works
At present works are commissioned through a number of routes although it is envisaged that
this is continuously under review.
Current Situation
i) Generally works for revenue budgeted and minor capital projects are ordered through
an internal agreement with the Newcastle City Council Highways & Traffic Signals
section. In addition a Highway Construction Services framework partnership has been
entered into with Colas (North) Ltd and Cumbrian Industrials Ltd, for a period of two
years with an optional third year, for the undertaking of specialist work and any work
that cannot be sufficiently resourced by H&TS.

78
ii) Major capital maintenance works are generally procured through competitive tender
following the Council’s financial rules and regulations with tenderers being chosen from
a select list of contractors using a formally identified process. E.g. the CME major
maintenance or the repainting of the Tyne Bridge.
iii) Occasionally specialist works will be subject to a competitive tendering or quotation
process, which may involve contactors from outside of the select list. On such
occasions quality and financial checks are undertaken on all companies invited to
quote.
1.11 Performance Management National and local performance indicators are used to measure performance. Biennial condition surveys are undertaken to report back in the Annual Progress Report for the LTP:
• BV187 Condition of footways. See section 3.0 for details. This covers only category 1, 1a, and 2 footways. Additional local performance indicators are detailed in table 1.11.1 below.
Table 1.11.1 Local Performance Indicators relating to the Footway & Cycleway Asset
LEVELS OF SERVICE PERFORMANCE MEASURE
REVIEW FREQUENCY
TARGETS CORE OBJECTIVES
Inspections
Undertake BVPI condition inspections on class 1, 1a & 2 footways as per the recommendations
Percentage of inspections undertaken as per the programme
Six Monthly 100% Serviceability, Sustainability
Undertake service inspections on all prestige footways & cycleways monthly
Percentage of inspections undertaken as per the programme
Six Monthly 100% Serviceability, Sustainability
Undertake routine safety inspections on all prestige, primary walking route & secondary walking route footways and cycleways once every six months
Percentage of inspections undertaken as per the programme
Six Monthly 100% Safety
Undertake routine safety inspections on all link footways and cycleways once every three months
Percentage of inspections undertaken as per the programme
Six Monthly 100% Safety
Undertake routine safety inspections on all local access footways and cycleways once every six months
Percentage of inspections undertaken as per the programme
Six Monthly 100% Safety

79
Table 1.11.1 Local Performance Indicators relating to the Footway & Cycleway Asset
LEVELS OF SERVICE PERFORMANCE MEASURE
REVIEW FREQUENCY
TARGETS CORE OBJECTIVES
Condition
Maintain the condition of all category 1, 1a & 2 footways such that the percentage meeting the BVPI investigatory level remains below 21%
Percentage of category 1, 1a & 2 footways where maintenance should be considered
Annually less than 21%
Serviceability, Sustainability
Maintain the condition of all category 3 and 4 footways such that the percentage with an overall CVI condition index rating below 20 remains below 37%
Percentage of category 3, 4 & 5 footways where maintenance should be considered
Annually less than 37%
Serviceability, Sustainability
Maintenance
Emergency defects shall be attended to with immediate response (not longer than 2 hours)
Percentage of defects attended within the allotted timescale Quarterly 100% Safety
Category 2 (non-emergency) defects shall be rectified or made safe within 24 hours
Percentage of Cat 2 defects attended within the allotted timescale Quarterly 100% Safety
Repairs on Category 3 defects will be carried out within 10 days
Percentage of Cat 3 defects attended within the allotted timescale Quarterly 95% Safety
Repairs on Category 4 defects will be carried out within one month
Percentage of Cat 4 defects attended within the allotted timescale Quarterly 95% Safety
Refer to section 1.3.0 for details of inspections undertaken.
1.12 Improvement Actions
• Complete full inventory survey and maintain
• Collect and maintain condition data for all footways and cycleways
• Review levels of service and undertake a consultation process to determine attainable levels of service
• Review forward work programme following review of levels of service
• Review budget requirements and works programmes
• Further develop risk assessment system
• Review current business processes in light of asset management practice to see where improvements can be made to the service provided

80
Appendix D – Traffic Signal &
Management Systems, Staffordshire
County Council – October 2008

EVALUATION OF TRAFFIC SIGNAL AND ITS RELATED EQUIPMENT
September 2008
September 2008
Update v2

82
CONTENTS
Section Description Page No. 1.0 Development of a Traffic Signal Asset 3 Management Life Cycle Plan 2.0 Traffic Signal Inventory 4 3.0 Asset Valuation 7 4.0 Equipment Condition 9 5.0 Condition Rating - Data Evaluation 12 6.0 Demands 16 7.0 Performance Gaps 17 8.0 Service Options 18 9.0 Options Appraisal 19 10.0 Risks 20 11.0 Performance Measurement 20 12.0 Improvement Actions 21
Appendix 1 - Condition Rating Methodology

83
1.0 Development Of The Traffic Signal Asset Management Lifecycle Plan
This traffic signal Asset Management Lifecycle Plan (AMLP) has been developed to
ensure that traffic signal installations are operated and maintained to an appropriate
standard to enable the safe and efficient movement of people and goods on the County
highway network.
The AMLP is based upon the lifecycle assessment of each individual installation.
Department for Transport specifications state that a design life of 15 years should be
applied to traffic signal equipment. However, for assessment purposes the County
Council has considered an operational life of between 15 to 20 years, as this is
considered a more realistic design life for the majority of the apparatus which constitutes
a complete installation. This criterion has been adopted by Authorities that are members
of the Midlands Service Improvement Group (MSIG).
To develop the AMLP an initial condition assessment of all existing on-street equipment
was undertaken by the current traffic signal term maintenance contractor, as a
requirement of the contract, in collaboration with County Engineers. The condition survey
was completed in March 2006 and provided the base data from which a forward asset
improvement plan has been developed. It is envisaged that a detailed condition survey of
each installation will be required on a five yearly cycle to validate inventory records.
The plan for the management of traffic signal assets includes the following objectives: -
• To work in partnership with the County Council’s Term Contractors to deliver a
high level of service to the people using the highway network.
• To improve maintenance operations and make best use of new technology
appropriate to the Staffordshire highway infrastructure.
• To effectively manage the replacement of traffic signal installations that are
operating in excess of the County Council’s life expectancy.
• Where necessary, to upgrade installations to comply with the disability
standards established by the now expired Best Value Performance Indicator
BVPI 165 (facilities for disabled road users).
A description of the condition assessment methodology applied to the County’s traffic
signal installations is detailed in Appendix 1.
2.0 Traffic Signal Inventory
The asset to be maintained is the traffic signal control equipment installed on
Staffordshire County highway network. Other subsidiary equipment which falls into the
category of Intelligent Transport Systems (ITS) that is currently managed by the
Directorates Lighting & ITS Section will be subject to further assessment to complete an
AMLP for all ITS related equipment. The types of ITS equipment presently managed by
the County Council are as follows: -
• Urban Traffic Control System (UTC)
• Variable Message Signs (VMS)
• Car Park Management System (CPM)
• CCTV Traffic Monitoring System

84
• Vehicle Activated Signs (VAS) - speed warning signs
• Traffic Control Centre – System equipment
• Traffic Signal Remote Monitoring System (RMS)
• Traffic Signal Fault Management System (FMS)
The AMLP for each of the above categories of equipment will be appended to this
document once their individual assessments have been completed. However, costs
associated with the gross replacement cost of these assets will be detailed within the
main body of this document (See Section 3.0).
2.1 On-Street - Traffic Signal Inventory
All traffic signal junction installations have a communications link to the Traffic Control
Room located at the Development Services Directorate, Stafford. With regard to traffic
signal controlled pedestrian crossings, installations are linked to the Traffic Control Room
when an installation falls within a UTC managed region. It is intended to have all traffic
signal controlled pedestrian crossing linked to the Traffic Control Centre; however, at the
time this document was reviewed (September 2008) approximately 28% of signal
controlled pedestrian crossings are linked to the Centre.
Strategically located traffic signal installations operating in Stafford, Burton-Upon-Trent,
Newcastle-Under-Lyme, Cannock and Rugeley are controlled via the County Council’s
UTC system, through the application of either Fixed Time Control or the real time traffic
responsive system known as SCOOT. Traffic signal junctions which are not monitored by
the UTC system are connected to the County Council’s Remote Monitoring System.
The traffic signal installations located on the County highway network as of
September 2008, are detailed in Table 1.0.
Description
Total
Controlled Junctions 156
Single Pelican Crossing 89
Dual Pelican Crossing 15
Single Puffin Crossing 117
Dual Puffin Crossing 12
Single Toucan Crossing 71
Dual Toucan Crossing 13
Fire Service Priority Equipment 1
Bus Priority Equipment 3
Total 477
Table 1.0 – County Traffic Signal Installations
An inventory record is kept of each traffic signal installation which includes a detailed list of
the individual items which constitute a complete installation. Inventory data is stored in a
Microsoft Excel spreadsheet on the County Council’s IT system server(s). The existing

85
inventory spreadsheet is becoming increasingly difficult to maintain and is labour intensive
when extracting data for reporting purposes. It is envisaged that the traffic signal inventory
will migrate onto the Directorates Integrated Highway Management System (IHMS), which
is planned for implementation during 2009. The IHMS will be pivotal to the production of
the Directorates Transport Asset Management Plan (TAMP).
Hard copy files are kept for each installation, which are stored in the Lighting & ITS
Section, Riverway, Stafford. The hard copy files contain the following information:
• Controller MCE / TR specification
• Schematic wiring diagrams
• Correspondence
• Inspection records
• Bulk lamp change records
A high proportion of files are incomplete in terms of as installed drawings and schematic
cabling diagrams; however, records are updated upon the completion of refurbishment
works. This form of paper copy documentation is vulnerable to being lost, misfiled or even
destroyed in the event of catastrophic building damage.
The introduction of the Directorates IHMS will see the progressive migration of all data
records onto an IT based system that will negate the need to store the above information in
hard copy form. Electronic filing structures have been developed to cater for this data
transfer and hence until this process has been completed the two data storage systems will
operate in parallel.
The location of traffic signal installations are shown on a layer of the Directorates GIS
system which contains the site reference number along with details of the type of
installation in operation.
The traffic signal inventory spreadsheet, hard copy filing system and GIS are all updated
when a new installation is added to the asset inventory.
3.0 Asset Valuation – Gross Replacement Cost – (GRC)
The present GRC of on street traffic signal assets owned by the County Council based
upon average replacement values, as detailed in Table 3.1, is £29.750 m.
Based on the CSS Report (1) the recommended annual cost of maintenance should be 5%
of the replacement cost which represents approximately £1.48m. The 2008/09 revenue
allocation for traffic signal and traffic control maintenance, which includes the associated
ITS equipment, presently resides at £948k. A deficit of £532k when compared with the
above recommended percentage allocation for maintenance.

86
Traffic Signal Related
Installation Type
Replacement Costs
(£000)
No.
Estimated
Replacement
Value (£000) Max Min Ave
Large Controlled Junction 187.0 135.0 161.0 33 5313.0
Medium Controlled Junction 135.0 83.0 109.0 108 11772.0
Small Controlled Junction 83.0 62.0 72.5 15 1087.5
Single Pelican Crossing 36.5 29.0 32.8 89 2919.2
Dual Pelican Crossing 52.0 41.5 46.8 15 702.0
Single Puffin Crossing 39.5 31.0 35.3 117 4130.1
Dual Puffin Crossing 54.0 46.7 50.4 12 604.8
Single Toucan Crossing 39.4 31.0 35.2 71 2499.2
Dual Toucan Crossing 54.0 46.7 50.4 13 655.2
Fire Service Priority Equipment 5.2 1 5.2
Bus Priority Equipment 20.7 3 62.1
GRC - Traffic Signal Assets - Total
29,750.3
Table 3.1 – GRC Traffic Signal Assets
The current Traffic Signal & Traffic Control maintenance expenditure can be broken
down into the following defined sub groups indicating the actual percentage allocation of
the total revenue budget: -
• Traffic signal maintenance (46%)
• Traffic signal energy (23%)
• Traffic signal refurbishment (21%)
• ITS - area traffic control (10%)

87
3.1 GRC – ITS Assets
For completeness Table 3.2 contains details of the GRC of ITS assets that are
presently operated in conjunction with the traffic signal assets. Upon completion the
lifecycle assessment of the various ITS assets will be appended to this document, as
they are considered integral components of the Traffic Management Systems group of
assets.
ITS Equipment
Installation Type
Replacement
Cost
(£000)
No.
Estimated
Replacement
Value
(£000)
Urban Traffic Control – Main System
103.7 1 103.7
UTC Communications Infrastructure 155.6 1 155.6
Traffic Signal Remote Monitoring System. 8.3 1 8.3
UTC Graphical Display Facility 15.5 1 15.5
CCTV - Instation Equipment 36.3 1 36.3
CCTV – On-Street Camera Units 12.4 12 148.8
Car Park Management System –
Instation Equipment 36.3 1 36.3
Car Park Management System –
On-Street Equipment 10.4 12 124.8
Car Park Management System –
Display Signs 8.3 5 41.5
Variable Message Signs 15.5 16 248.0
Vehicle Activated Signs (VAS) 5.2 78 405.6
GRC - ITS Assets - Total 1324.4
Table 3.2 – GRC ITS Assets
4.0 Equipment Condition
4.1 Equipment Inspections and Lamp Maintenance
The traffic signal term maintenance contractor is required to undertake a series of
inspections throughout each year in accordance with contractual requirements. These
inspections consist of a detailed Annual Inspection and a less rigorous Periodic
Inspection. Inspection sheets are completed by the contractor to record the results of
each inspection which are subsequently submitted to the County Council for checking
and action. The inspection validates the operating condition of each installation and
identifies items of equipment that may require remedial works to be undertaken. The
completed inspection reports are submitted by the contractor in electronic format for
storage within an electronic folder. From 1st April 2007 the inspection reports have been
stored in an electronic folder which is used to identify each traffic signal installation as a
highway asset.

88
The term maintenance contractor is also responsible for lamp maintenance. A Bulk
Lamp Change (BLC) is carried out at each installation twice a year. The frequency of
the BLC’s has been proven to be the most effective solution to ensure maximum
efficacy of lamp life and minimum risk of lamp failure. Upon completion of each BLC
details are submitted to the County Council in electronic format and stored electronically
in the relevant asset folder.
4.2 Periodic Electrical Testing
The electrical safety of each installation is assessed once every year during the detailed
Annual Inspection and in accordance with the requirements of BS7671 (I.E.E. Wiring
Regulations). The results of the electrical tests are incorporated into each Annual
Inspection report.
4.3 Installation Condition Assessment
Trained and experienced personnel will undertake a comprehensive survey of the
physical condition of each installation every 5 years. Appendix 1 of this report contains
details of the method used to score the condition rating of each installation with Section
5.0 containing evaluation details of a five year assessment commencing April 2008.
Further analysis of the condition rating values generated from the base line data will be
undertaken annually to ascertain a prioritised programme of refurbishment works on a
year by year basis.
A consistent scoring system is used to rank the condition of installations. The system is
based on scoring the following five principle features of a traffic signal installation:
• Controller unit
• Cabling and ducting infrastructure
• Signal heads
• Vehicle and pedestrian detection facilities
• Traffic signal poles
Each of the above features is scored out of 20 points thus giving a total maximum
installation score of 100. The scoring model would award 20 points to equipment in new
condition and 0 points to equipment that has reached the end of its serviceable life. This
method was considered as the most appropriate solution to determine the service life of
each installation due to the considerable lack of information regarding the initial service
date of installations and to align with the finite life expectancy of installations with
recorded initial service dates.
At the start of each financial year the deterioration of equipment is modelled by initially
deducting 1 point from the points allocated to each of the five features (i.e. five points in
total) unless the score is already zero for that feature. However, installations do
deteriorate at different rates and hence the points profile may be modified during their
life. The scores are adjusted to reflect actual condition and are used to prioritise
refurbishment work on the basis of need. Other planned works on the highway network
are also taken into consideration during this process. The Authorities who are part of
the Midlands Service Improvement Group (MSIG), Traffic Signals Task Group, have
adopted the above condition assessment process.

89
4.4 Controller Configuration Assessment
Changes relating to the use of the highway network (e.g. traffic growth, new
developments) are constantly affecting traffic flows on the network and therefore over
time controller configurations can become inefficient in terms of the direct management
of current traffic conditions. Out of date controller settings can lead to unnecessary
vehicle and pedestrian delays with the resultant road safety implications.
The County Council currently has no proactive policy to periodically check the validity of
controller configurations but does react to complaints and issues raised as a
consequence of degraded performance.
4.5 Installation Maintenance
The traffic signal term maintenance contractor carries out all maintenance work on the
installations with County Council staff responsible for the management and supervision
of contractor activities. Works orders for chargeable works are issued via the Corporate
SAP system and fault reports are raised through a Fault Management System (FMS).
The FMS is used to collate information regarding contractor performance in accordance
with contractual requirements.
The specification of the term maintenance contract places a duty upon the contractor to
maintain the equipment in a safe and fully operational condition. The contractor is paid
an annual fee, per installation type, to rectify all faults and to undertake the required
inspection and BLC regimes. Faults which occur as a consequence of third party
damage are charged separately. The value of the maintenance work undertaken
increases annually due to the following pressures:
• New installations
• The increasing age of equipment
• The increasing complexity of installations
• Increased costs associated with unrecoverable third party damage
• Energy
4.6 Safety
Public safety is provided for traffic signal installations through the application of the
following processes:
• Design processes in accordance with local and national guidance and design
regulations.
• Road safety audits in accordance with HA 42/94 and HD 19/94
• Periodic inspections
• Electrical safety testing
• Investigations following increased accident statistics
• Investigation following complaints

90
5.0 Condition Rating – Data Evaluation
The collection of on-site condition data was completed early in 2006 and re-examined in
January 2008 to verify its accuracy. The data was then used to establish the base data
to quantify the numbers of installations which fall into each respective condition rating
category, as defined in section 4.3. This data was then used to develop a five year
profile of assessment, taking into consideration the current level of expenditure of £200k
per annum committed to improvement and refurbishment works.
Maintenance improvement works was applied to the six worst ranked pedestrian
crossing installations and the single worst ranked junction for each year to be assessed.
This strategy was considered the most efficient use of funds to balance the demands for
each respective installation type when considering the most vulnerable users of the
highway network.
5.1 Five Year Results
During this evaluation and to ascertain the short term funding requirements, a period of
assessment of five years was determined as sufficient. The data generated does not
take into consideration new installations installed after the date the assessment was
undertaken. However, due to the five year profile of the assessment this will not affect
the results which determined the requirements for maintenance improvement works to
be undertaken.
Installations evaluated with a condition rating of ‘Very Poor will be ranked in ‘Urgent’
need of renewal. Installations evaluated with a condition rating of ‘Poor’ will be ranked
as ‘High Priority’ for planned renewal. Installations that fall into these categories will
therefore be programmed into the proposed maintenance improvement programme for
the following financial year, subject to budget provisions.
The following graphs detail the results of the condition survey and associated condition
rating for each installation type for the initial five year programme, 2008/09 to 2010/11:
Graph A 2008/09
Cond ition Sur ve y Re s u lts 2008/09
0
2 0
4 0
6 0
8 0
10 0
12 0
14 0
C o nd i t i o n R a t i ng
Junct io n 0 18 6 5 57 2 3
Sing le Ped 0 10 6 7 119 73
D ual Ped 0 0 16 16 7
V Po o r Po o r A ve Go o d V Go o d
Quantity

91
Graph B
2009/10
Condition Survey Results 2009/10
0
20
40
60
80
100
120
140
160
C o nd it io n R at ing
Junct ion 1 29 61 54 18
Single Ped 0 10 83 138 38
Dual Ped 0 1 21 13 4
V Poor Poor Ave Good V Good
Graph C
2010/11
Graph D
2011/12
Condition Survey Results 2011/12
0
50
100
150
C o ndit io n R at ing
Junction 9 50 73 27 4
Single Ped 0 38 117 95 19
Dual Ped 0 10 21 5 3
V Poor Poor Ave Good V Good
Condition Survey Results 2010/11
0
20
40
60
80
100
120
140
Condition Rating
Junction 3 40 80 33 7
Single Ped 0 24 104 117 24
Dual Ped 0 6 22 8 3
V Poor Poor Ave Good V Good

92
Condition Survey Results 2012/13
0
50
100
150
C o ndit io n R at ing
Junction 14 65 57 23 4
Single Ped 0 57 119 73 20
Dual Ped 0 14 16 7 2
V Poor Poor Ave GoodV
Good
Graph E 2012/13
5.2 Financial Requirements
Examination of the output data generated for each year of assessment indicates that
the current rate of revenue expenditure for maintenance improvements of £200k per
annum will be inadequate to maintain the equipment at a steady state condition level
within the timeframe of the assessment. This particularly applies to the refurbishment of
traffic signal junctions which require an average expenditure in the region of £110k for
refurbishment and upgrade works.
The proposed strategy to upgrade the six worst pedestrian crossing installations and
the single worst junction installation will fall into disrepute at the end of the five year
period of assessment. Graph E of section 5.1 indicates that during this particular year,
2012/13, fourteen junctions will require urgent renewal, with a further 65 junctions and
71 pedestrian crossings ranked as condition ‘Poor’ achieving a ‘High Priority’ for
planned asset renewal. With an average junction refurbishment cost of £110k this
equates to an additional budget requirement in the region of £1.54 million just to combat
the installations ranked as ‘Urgent’ priority for asset renewal. This figure does not take
into consideration staff resource requirements, which would be considerable in order to
complete this volume of works over a single financial year.
6.0 Demands
Traffic signal installations are expected to provide the safe and efficient control of
conflicting traffic demands including facilities for pedestrians, cyclists and disabled
people. The County Council operates a number of installations that do not comply with
the requirements for disabled access, which was previously monitored by the Best
Value Performance Indicator BVPI 165. The present situation would require an
estimated £550k to achieve 100% compliancy with the standards established by BVPI
165. However, the County rating upon the demise of this indicator resided in the upper

93
quartile (99.3% - 2007/08) and therefore improvement works at installations that do not
presently achieve the established standards established will only be completed as a
consequence of programmed maintenance refurbishment works.
The Traffic Management Act 2004 places a statutory duty on highway authorities to
manage their networks with the objective of minimising congestion and unnecessary
delays. Well maintained traffic signal installations whose operation is co-ordinated with
other network management activities can assist the County Council to comply with this
legislation.
Safety of operation, for the road user, is the highest priority when considering the
provision of resources. Any unsafe installations will either be repaired or replaced,
subject to the availability of funds. The County Council does not have the option of
leaving installations in a non-operational mode due to its obligation under the Highways
Act 1980.
New installations are provided through:
• The County Council’s capital programme for highway works
• Private developers to provide access to a new development site or to mitigate
the impact of increased demands upon the highway network.
There is no direct link between the Council’s policy on building new traffic signal
installations and the revenue budget for traffic signal maintenance. However,
Developers can be charged commuted sums for installations that are required to
service a development. Commuted sums equate to actual maintenance costs over a
fifteen year period. These monies are then offset against the Lighting & ITS budget as
an income stream, and therefore assist with the management of the Directorate’s
finances.
Over the previous five year period (March 2003 to March 2008) there has been
significant network growth in traffic signal control installation with 139 new sites installed
over the period. This volume of growth represents an average annual growth rate of
6.6%. The level of growth achieved in previous years may reduce as a consequence of
the current financial climate; however, the existing equipment will continue to degrade
at its present rate and will require additional financial support to maintain the assets to a
standard that does not compromise the safety of the highway network.
7.0 Performance Gaps
7.1 Performance Gaps - Condition
• Assessment of cost effectiveness of operations associated with the term
maintenance contract.
• Lack of regular controller configuration reviews.
• Gaps in record system.
• Vulnerability of paper records.
• Non-compliance with the previous BVPI 165 standard for disability access
requirements, at a number of installations.

94
7.2 Performance Gaps - Demands
• Network Management Systems to comply with the Traffic Management Act 2004.
• No direct link between the aspirations for new installations and associated
maintenance and operating costs.
• Investment in new technology to improve network performance in terms of
management and operational activities.
8.0 Service Options
The following service options are available for consideration:
8.1 Do Nothing
The County Council adopts no comprehensive asset management plan
(Base Line = £948k 2008/09 Revenue Budget Allocation)
8.2 Steady State Service Level
Financial and service levels are set with the objective that the asset condition is
maintained at its current condition level.
(Estimated Cost = £350k pa above Base Line)
8.3 Improved Service Level
Financial and service levels are set with the objective that the asset condition is
improved from its current condition level to that recommended by the Department for
Transport to achieve a traffic signal design life of 15 years.
(Estimated Cost = £800k pa above Base Line)
8.4 Reduced Service Level
Financial and service levels are set with the objective that the asset condition will
deteriorate from its current condition level.
(Estimated Saving = £200k pa below Base Line)

95
9.0 Options Appraisal
OPTION
BENEFITS
DISBENEFITS
ESTIMATED
ANNUAL
COSTS /
SAVINGS
BASIS OF ESTIMATE
Do Nothing Continue funding at existing levels
Save cost of developing a HAMP
Does not enable decisions to be taken on service levels and funding of assets
£0 (Base Line)
Base Line (See Section 3.0) 2008/09 revenue allocation = Base Line = £948k
Steady State Increase spending to arrest deteriorating condition of the asset
Overall condition of the assets does not deteriorate
Improvements to operations can only be achieved through efficiency savings Does not take into consideration installations which do not presently adhere with BV165
Costs = £350k (Above Base Line)
Base Line = £948k Maintain Steady State = £350k Total Cost = £1.298m
Improved Service Accelerate refurbishment programme to adhere with DfT design life criteria of 15yrs.
Enables improved operations and facilities to be provided to comply with Traffic Management Act. 100% adherence with BV165 standard
Enhanced facilities require additional funding
Costs = £800k (Above Base Line) Costs can be reduced upon completion of 100% compliancy with BV165
Base Line = £948k Accelerated Refurb = £700k BVPI165 = £100k Total Cost = £1.748m
Reduced Service No refurbishment programme.
Moderate cost savings
Unable to deal with the requirements of the Traffic Management Act. Increased unreliability of equipment. Inability to repair obsolete equipment. Increased level of risk to the travelling Public.
Savings = £200k (Below Base Line)
Base Line = £948k Deduct Refurb Costs = £200k Total Cost = £748k

96
10.0 Risks
Defined Risks
Physical • Electrocution.
• Accident damage.
• Corrosion.
• Installation component failure.
• Installation controller failure.
• Obsolete equipment.
• Cable fault.
• Electrical supply failure.
• Controller configuration fault.
• Collision involving vulnerable road users.
• Collision involving vehicles.
• Damage by other operators on the highway.
Business Risk • Traffic signal operations are high profile and attract public and media
attention immediately.
• Image of the County Council.
Financial Risk • Growing backlog of aging installation.
• A reduced quality of maintenance is more expensive in the long term.
• Building new installations that the County Council cannot afford to
operate.
• Increased accident claims.
Environmental Risk • Poorly maintained traffic signal installations can lead to increased
congestion levels.
• Extremely high pollution levels could lead to network closure.
• Introduction of low energy equipment – high capital costs need to translate
into lower energy charges.
Network Risk • Poorly maintained traffic signal installations can contribute to increased
costs to the local economy.
• Traffic Management Act 2004
• Reliable journey times
• Detrimental effect upon the reliability of public transport

97
11.0 Performance Measurement
Performance measurement statistics for traffic signal equipment are generated through
national and local objectives. Nationally the local government best value performance
indicator BVPI 165 was monitored for compliance until its withdrawal in March 2008.
County traffic signal assets that were required to conform to this requirement achieved a
rating of 99.3% compliancy for the final year of assessment 2007/08.
Key Performance Indicators (KPI’s) are also applied to monitor the performance of the
traffic signal term maintenance contractor. Contractor performance has been aligned with
the Directorates objective to provide a quality level of service. KPI’s have therefore been
developed to monitor the following operations:
• Programmed Works
• Commissioning
• Fault Free Index
• Fault Information
• Repeat Visits
• Planned Maintenance
• Contract Administration
• Marginal / Unsatisfactory Response
A Contractor Performance Review report is produced annually, which details the results of
the KPI assessment criteria along with other operational non KPI assessed requirements.
12.0 Recommended Improvement Actions
• Produce an annual report to the asset manager on asset deterioration, schemes to be
included in the next five years refurbishment programme, maintenance backlog and
term contractor performance.
• Controller configuration reviews to be undertaken on a five year cyclic programme.
• Include a review of road traffic accident sites as part of the prioritisation of
maintenance schemes.
• Address the gaps in record systems and back up paper records in electronic format
wherever possible.
• Develop Network Management Systems to comply with the requirements of the Traffic
Management Act 2004.
• Revenue budgets set to take account of new installations added to the asset
inventory.
• Secure increased investment to address the deteriorating condition of the asset and
rectify the installations that do not comply with disability requirements.

98
APPENDIX 1 Condition Rating Methodology
To develop the asset management plan that will be based upon the anticipated finite life
expectancy of each installation a maintenance rating value will be derived for each
installation for each year of assessment. The data derived from this process will place
each installation into a specific condition category that can then used to identify a
proposed maintenance improvement programme for the following year.
Installations identified by this process will require further examination to validate the
accuracy of the condition rating and to ascertain the estimated cost of refurbishment. If
it is discovered that an installation has been given an inappropriate condition rating then
data re-evaluation for the year of assessment will be necessary. Condition Survey Method The basic convention assigns values to the five main categories of equipment that exist at each traffic signal installation, as follows: -
1) Controller;
2) Cabling;
3) Detection;
4) Street Furniture;
5) Ducting.
As previously stated the method of assessment is based upon an expected installation life of between 15 and 20 years.
Each category has a value of between 0 and 20, and when all values are added
together they will give a ‘Condition Rating’ for each respective installation. A brand new,
fully ducted traffic signal installation, commissioned during the year of the survey will
have a Maintenance Rating of 100.
The Condition Rating value will enable the Authority to accurately quantify the age and
condition of all sites, which will assist in the development of comparisons with other
Authorities. This comparison therefore may be used for Best Value analysis. Scoring Technique:
Generally installations will degrade by one point for each category per year subject to the criteria listed: -
1) Controller:
20 = new controller in the current year;
19 to 1 = ageing microprocessor controller.
2) Cabling: 20 = installation cabled/fully recabled in current year;
19 to 1 = ageing cable;
Other factors: known damage, joint problems & cable of mixed age.

99
3) Detection:
20 = new installation, new AGD’s fitted, total loop replacement;
19 to 5 = degraded system, partial upgrade but fully operational;
5 to 1 = not fully operational, but demand dependant stages ok.
Other factors: individual loop damage should not be categorised as a ‘failing site’
and should always be repaired ASAP, unless the primary weakness is the
associated feeder cables and ducting.
4) Street Furniture:
20 = new installation, total post and head replacement in current year;
19 to 1 = degrading equipment.
Other factors: partial replacements for posts, heads, pushbuttons, brackets and
aspects must not improve score of the whole site unless they form the majority of
the site furniture (i.e. at least 75%).
5) Ducting: 20 = new fully ducted system in current year;
19 to 10 = degrading fully ducted system;
10 to 5 = recent proven existing cross carriageway duct(s) with new linking ducts added to make the whole system ducted;
5 to 1 = proven crossroad duct(s) with otherwise buried cables;
0 = unproven or un-located crossroad duct(s) with buried cables.
Other factors: Ducts with small diameter or low capacity & known or suspect
ground conditions. Summary
The ‘Total Condition Rating’ for each installation shall be based upon the following
ranking system and the outputs from the condition rating hierarchy, in terms of asset
replacement, determine the action level for asset intervention.
Points Score
Condition Rating
Asset Intervention
0 to 20 Very Poor Urgent Priority for Asset Renewal
21 to 40 Poor High Priority for Planned Asset Renewal
41 to 60 Average Standard Priority for Intervention
(Following straight line depreciation of a finite life asset)
61 to 80 Good Planned End of Service Life Replacement
(Following straight line depreciation of finite life asset)
81 to 100 Very Good Planned End of Service Life Replacement
(Following straight line depreciation of finite life asset)