Embed Size (px)
Citation preview
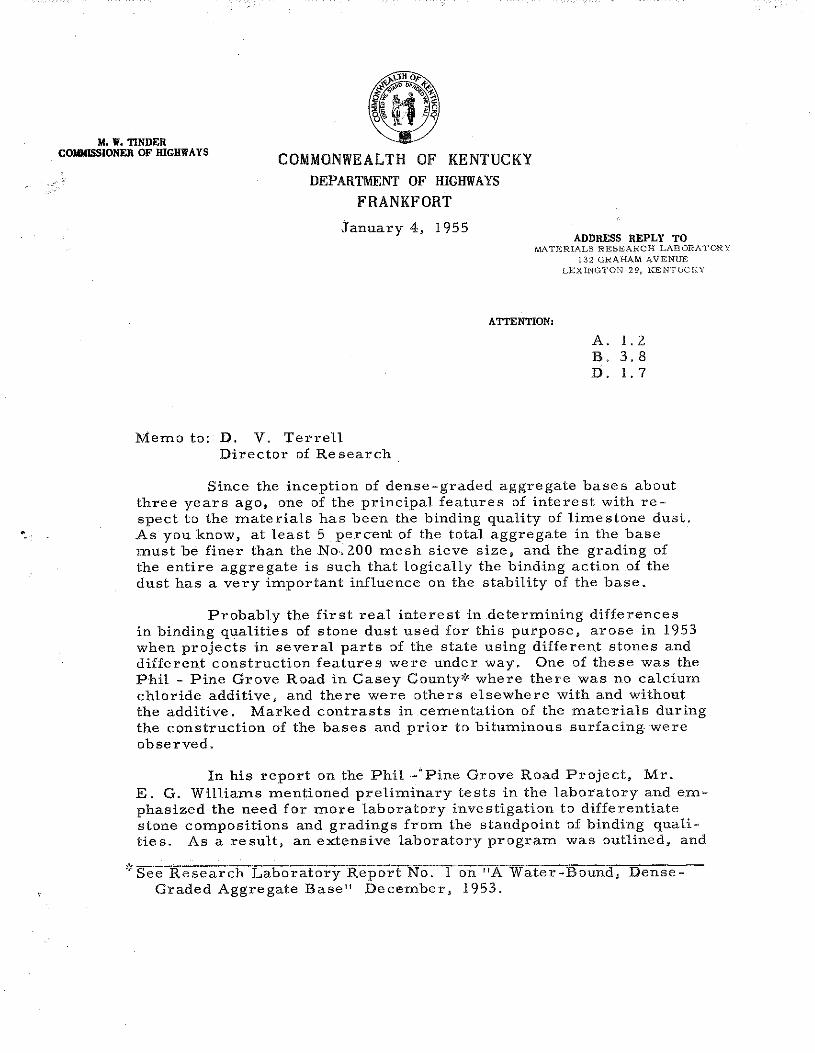
M. 11. TINDER COMMISSIONER OF HIGHWAYS COMMONWEALTH OF KENTUCKY
DEPARTMENT OF HIGHWAYS
FRANKFORT January 4, 1955
ADDRESS REPLY TO MATERIALS RESEARCH LABORATORY
132 GRAHAM AVENUE LEXINGTON 29, KENTUCKY
ATTENTION•
Memo to: D. V. Terrell Director of Research
A. l. 2 B. 3.8 D. I. 7
Since the inception of dense-graded aggregate bases about three years ago, one of the principal features of interest with respect to the materials has been the binding quality of limestone dust. As you know, at least 5 percent of the total aggregate in the base must be finer than the No: 2.00 mesh sieve size, and the grading of the entire aggregate is such that logically the binding action of the dust has a very important influence on the stability of the base.
Probably the first real interest in determining differences in binding qualities of stone dust used for this purpose, arose in 1953 when projects in several parts of the state using different stones and different construction features were under way. One of these was the Phil - Pine Grove Road in Casey County'-' where there was no calcium chloride additive, and there were others elsewhere with and without the additive. Marked contrasts in cementation of the materials during the construction of the bases and prior to bituminous surfacing were observed.
In his report on the Phil -'Pine Grove Road Project, Mr. E. G. Williams mentioned preliminary tests in the laboratory and emphasized the need for more laboratory investigation to differentiate stone compositions and gradings from the standpoint of binding qualities. As a result, an extensive laboratory program was outlined, and
,., ___ ...... 'See Research Laboratory Report No. 1 on "A Water-Bound, Dense
Graded Aggregate Base" December, 1953.
D. V. Terrell - z - January 4, 1955
one part of it was started early in 1954. The study was chosen by
William E. Howard, a member of the first group of graduate scholar
ship employees, as a work project and;acs thesis material for credit.
Most of the laboratory work in the first phase was completed prior to
the transfer of Mr. Howard to the Division of Planning in June, and a
report on results of that work was given orally by both men at the
meeting of the Research Committee on December Zl. The attached
report is a written version of material discussed at that time.
While the results are not regarded as conclusive, several
trends in the data could be highly significant. As a minimum they
point to lines of additional investigation which should be highly pro
fitable. Contrasts in the effects of moisture content and calcium
chloride additive on several physi:cal properties of four widely
different types of stone dust are indicated.
The physical property of greatest interest, of course, is the
so-called intrinsic strength or cohesion since that is the feature of
strength that is solely dependent upon cementation of the specimens
by the stone dust. However, the frictional resistance to shearing
stresses, deformation at failure, and the relative amounts of cement
ation and friction represented in total shearing resistance are impor
tant. With regard to the interpretation of data in this report, a more
significant picture of the relative contributions by cementation and
friction to shearing strength might have been given if the measured
shearing stress at failure in unconfined compression rather than
the theoretical shearing stresses at three normal stresses had been
used.
An extension of this project is now in the formative stages,
and work on the preparation of materials for test should start about
the last of this month. This additional investigation will have a more
restricted scope but will provide much more information about the
cementation characteristics of one particular stone dust. Upon the
completion of that work, still further possibilities for study should be
apparent.
Respectfully submitted,
L. E. Gregg Assistant Director of Research
LEG/jk Copies to: Research Committee Members
Mack Galbreath (3)
Commonwealth of Kentucky Department of Highways
AN INVESTIGATION
OF
THE BINDING PROPER TIES OF LIMESTONE DUST
by
William E. Howard Assistant Manager of Special Study Section Division of Planning
and
Ellis G. Williams Research Engineer
Highway Materials Research Laboratory Lexington, Kentucky
December, 1954

INTRODUCTION
A proper quantity of dust particles .of various sizes has long
been recognized as important in the construction of stone bases and
pavements. , Screenings for water bound macadam bases are required
to contain not less than a specified amount of dust sizes, and dense
graded limestone bases have controlling limits for the dust fraction. It
is g1,0nerally assumed that these particles serve a dual purpose: ( l) in
filling void spaces created by larger particles, thus enhancing the gross
structure of the agg;regate, and {2) in acting as a binder material in the
presence of water. Furthermore, it has been demonstrated that the
addition of small amounts of certain chemicals xnay improve the strength
characteristics of lime stone dusts.
Former studies have been concerned primarily with the overall
strength properties of aggregate mixtures containing clust, rather than
with the properties of the dust itself. However, in cases where binding
properties are of primary concern, a more fundamental approach would
be· to investigate the dust and fine aggregate fractions before studying the
mixture as a whole.
The purpose of this project was to study the binding properties
of several different limestone dusts. The stones selected showed con
sid-erable differences in composition, and undoubtedly the scope o£ these
differences encompassed the majority of limestones in Kentucky. In
addition, an attempt was made to detect variations (if any) in the response
of these stones to the effects induced by admixtures o£ calcium chloride -
directly or indirectly.

- 2
Since water sources throughout Kentucky may vary from. a defi·
nitely acid to a definitely alkaline reaction, information concerning the
effect of changes in the pH of mixing water was of interest. Accordingly,
analyses were run on a single type of stone with three ntixing waters -
one neutral, one acidic, and one alkaline.
The evaluation of materials was based primarily on results obtained
from triaxial compression tests; however, moisture relationships also
contributed information.
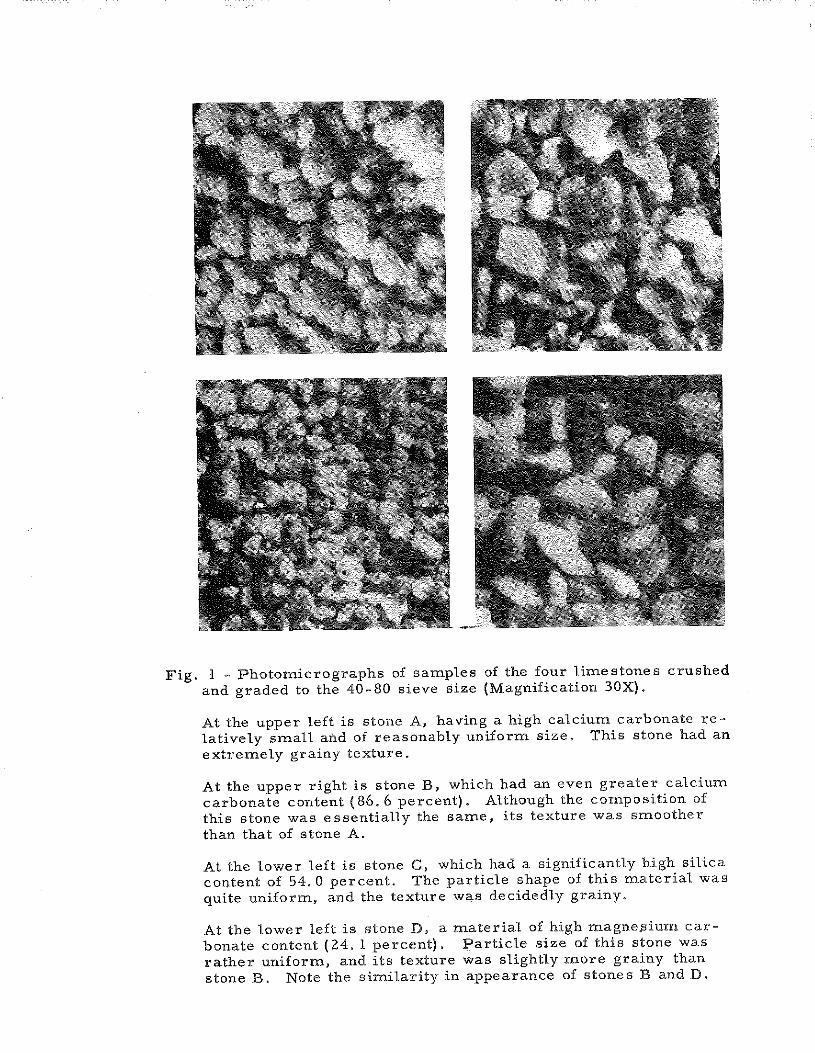
Fig. I - Photomicrographs of samples of the four limestones crushed
and graded to the 40-80 sieve size (Magnification 30X).
At the upper left is stone A, having a high calcium carbonate re
latively small and of reasonably uniform size. This stone had an
extremely grainy texture.
At the upper right is stone B, which had an even greater calcium
carbonate content ( 86. 6 percent). Although the composition of
this stone was essentially the same, its texture was smoother
than that of stone A.
At the lower left is stone C, which had a significantly high silica
content of 54. 0 percent. The particle shape of this material was
quite uniform, and the texture was decidedly grainy.
At the lower left is stone D, a material of high magne.13ium car
bonate content ( 24. l percent). Particle size of this stone was
rather uniform, and its texture was slightly more grainy than
stone B. Note the similarity in appearance of stones Band D.

Fig. 2 - Split mold used in the preparation of specimens by double-plunger compression, All specimens were loaded to 800 psi.
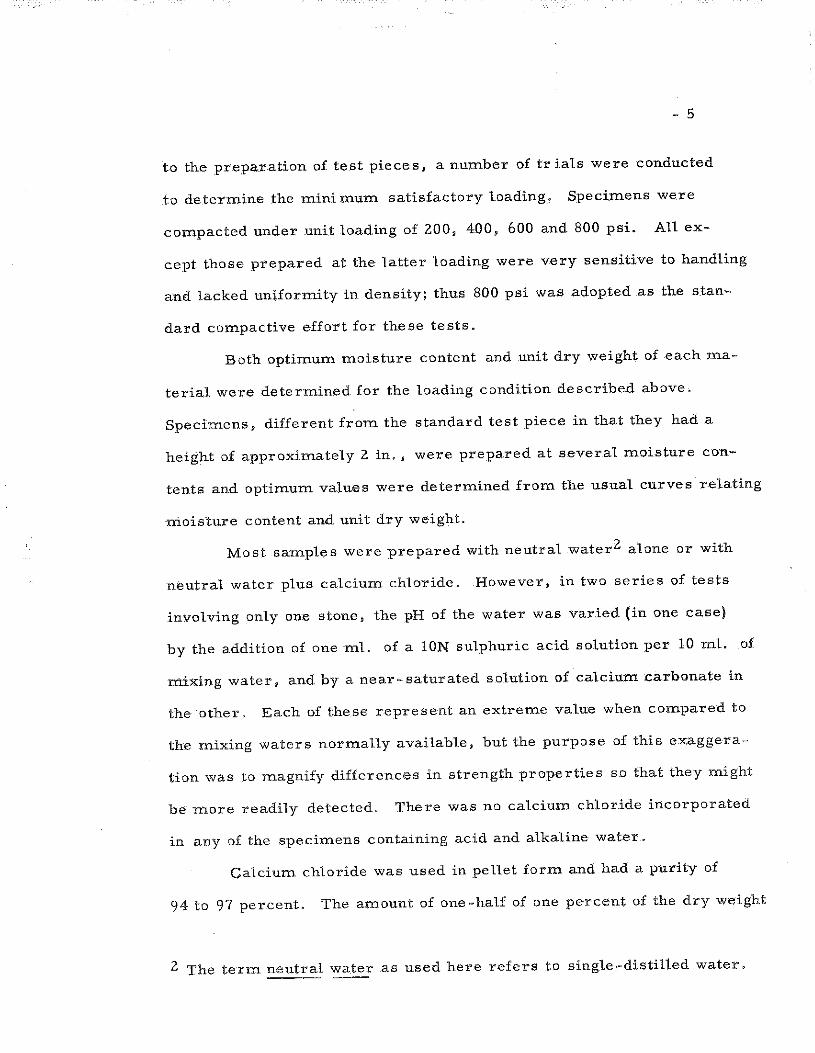
- 5
to the preparation of test pieces, a number of trials were conducted
to determine the mini :mum satisfactory loading, Specimens were
compacted under unit loading of 200, 400, 600 and 800 psi. All ex-
cept those prepared at the latter loading were very sensitive to handling
and lacked uniformity in density; thus 800 psi was adopted as the stan
dard compacti ve effort for these tests.
Both optimum moisture content and unit dry weight of each xna
terial were determined for the loading condition described above.
Specimens, different from the standard test piece in that they had a
height of approximately 2 in., were prepared at several moisture con
tents and optimum values were determined from the usual curves· relating
moisture content and unit dry weight.
Most samples were prepared with neutral water2 alone or with
neutral water plus calcium chloride. However, in two series of tests
involving only one stone, the pH of the water was varied (in one case)
by the addition of one ml. of a lON sulphuric acid solution per 10 ml. of
mixing water, and by a near- saturated solution of calcium carbonate in
the other, Each of these represent an extreme value when compared to
the mixing waters normally available, but the purpose of this exaggera
tion was to magnify differences in strength properties so that they might
be more readily detected. There was no calcium chloride incorporated
in any of the specimens containing acid and alkaline water.
Calcium chloride was used in pellet form and had a purity of
94 to 97 percent. The amount of one -half of one percent of the dry weight
2 The term neutral water as used here refers to single-distilled water.

- 6
of stone dust was added to the n1ixing water of those specimens requir-
ing this additive. It was realized that the ratio of aggregate surface area
to calcium. chloride content was far greater than that normally employed
in dense-graded aggregate mixtures. However, no attempt was made to
relate the surface areas involved or to increase the percentage of calcium.
chloride3. Furthermore, the differences in grading of the four dusts used
would also result in differences in surface area. A fixed percentage of
calcium chloride, somewhat in keeping with quantities normally used for
base construction, was arbitrarily selected for use.
Curing
Compacted specimens were first weighed and then wrapped in
very thin, transparent plastic membranes which sealed the sides of the
cylinders but left the ends open. Curing was accomplished in the labora-
tory at room temperature by allowing the specimens to stand on end on
heavy filter paper over a wire mesh (See Fig. 3). These conditions
simulated (perhaps remotely) a portion of base course resting on the
subgrade, being surrounded by additional base n1aterial, and having one
surface exposed to the atmosphere.
Moisture content data applied to each specimen in its entirity;
thus they represent an average, and do not show any adjustment for
possible differentials within the specimens. However, it was rect»gniz:ed
that during the following the curing period there could be variations in
3 Inasmuch as the an1ount of calcium chloride per unit of aggregate sur
face in these mixes was extremely .small in comparison with the amounts
used for fully graded base mixes, there is no direct comparison between
the two.

Fig. 3 - Appearance of specimens during the curing
period. A plastic membrane surrounds the sides
and both ends are open to the atmosphere. All
specimens remained in this position throughtout
the curing period.

- 7
:moisture content within different parts oi a sample. Such a condition
could affect th'e result of the test, but a sirnilar variation is usually
pres:ent in a normal base course; hence, the results ni this method are
believed to be reasonably dependable.
Seven days was arbitrarily selected as a standard length of
curing period for the con:rpacted samples. One of the materials (Stone B)
was selected for a study of the effect of curing time on triaxial compres
sion test results and on :moisture contents. Specirnens in this series
were cured for three days, seven days, and fourteen days.
Moisture contents were deter:mined when the samples were first
prepared and again when they were tested. The percentage loss oi mois~
ture was taken as a tneasure of the extent of curing. The effect oi curing
was based on any detectable change in strength properties which could
be related to the length of curing period.
:friaxia1:_93~Pr::;ssion Te;:ting
All strength relationships were deterx:nined by the triaxial corn,~
pression test. In this :method the specirnens were failed by an axial
compressive stress while being subjected to a unifortn and constant
lateral stress.
Test samples were encased in a thi,n rubber membrane {0. 001~
in. thickness) and tested in the triaxial pressure cell shown in Fig. 5.
Axial load was applied through and read frorn a proving ring, whil<'
lateral pressure was provided by a compressed air syste1n and Inea"·
sured on a Bourdon type gauge. A rate of defor,mation of 0. 008 in.
per rninute was employed .for all tests.
.... .. p,
u ~~~~----~--~----._------~~
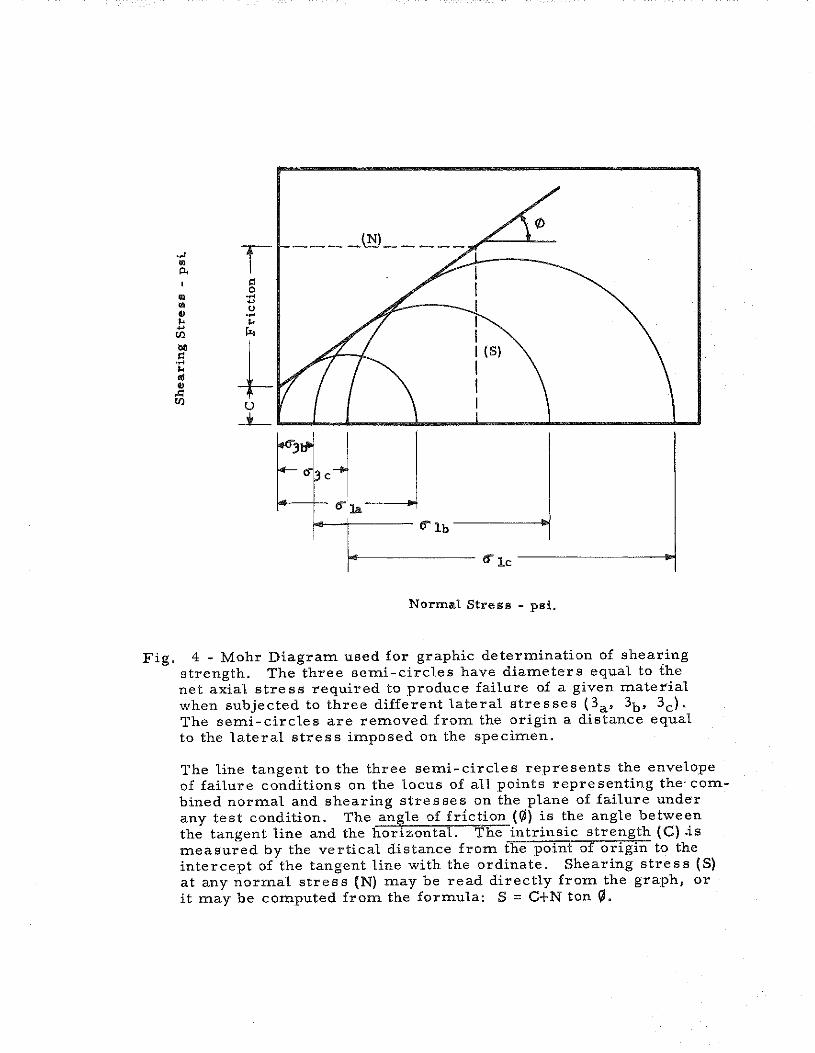
Normal Stress - psi.
Fig. 4 - Mohr Diagram used for graphic determination of shearing strength. The three semi-circles have diameters equal to the net axial stress required to produce failure of a given material when subjected to three different lateral stresses (3a, 3b, 3c). The semi-circles are removed from the origin a distance equal to the lateral stress imposed on the specimen.
The line tangent to the three semi-circles represents the envelope of failure conditions on the locus of all points representing the· combined normal and shearing stresses on the plane of failure unde•r any test condition. The angle of fr:lction (Ql) is the angle between the tangent line and the horizontal. The intrinsic strength (C) .is measured by the vertical distance from the point of origin to the intercept of the tangent line with the ordinate. Shearing stress (S) at any normal stress (N) may be read directly from the graph, or it may be computed from the formula: S = C+N ton \1.
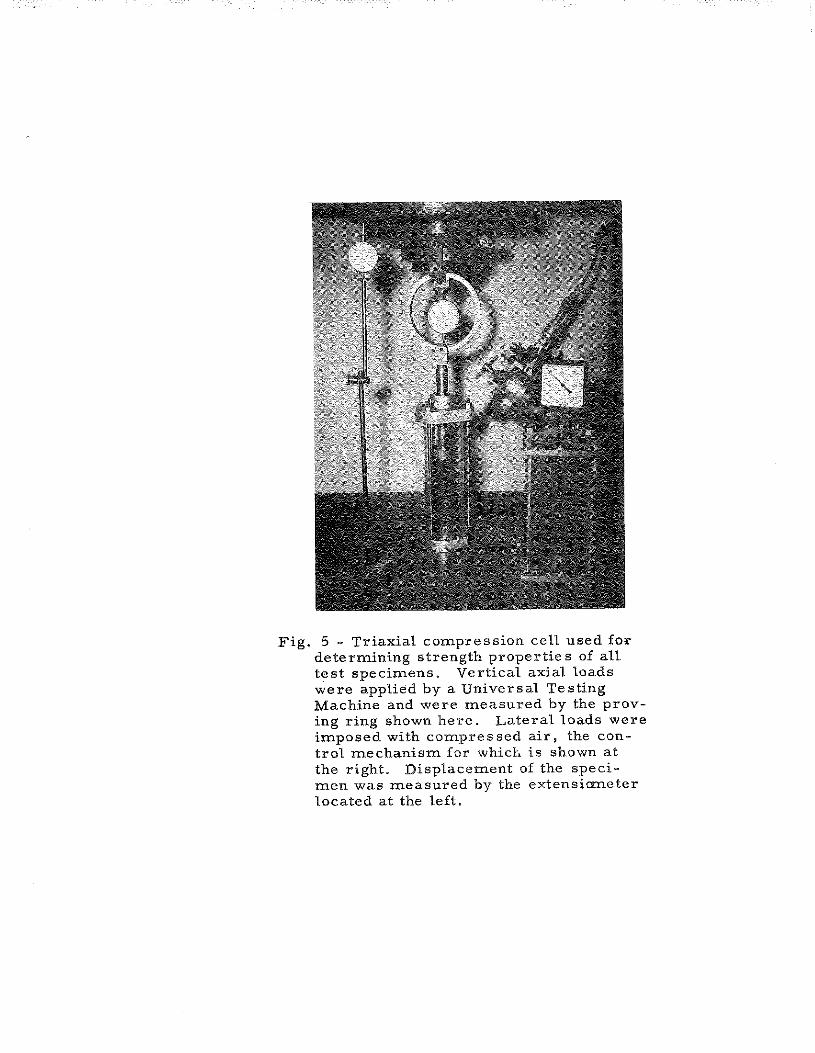
Fig. 5 - Triaxial compression cell used for determining strength properties of all test specimens. Vertical axial loads were applied by a Universal Testing Machine and were measured by the proving ring shown here. Lateral loads were imposed with compressed air, the control mechanism for which is shown at the right. Displacement of the specimen was measured by the extensicrneter located at the left.
~ 8
A complete test consisted of failing one or more samples at
lateral pressures of 0, 10, and 20 psi. As a rule, at least one addi
tional specimen was tested in each series to qualify previous data.
Triaxial compression test results expressed the following; ( 1)
axial stress required to produce failure <o-;:-<J3l, (2) deformation~),
and Pl applied lateral stress ( CJ3). Stress~ strain curves were plotted
to determine maximum axial stress as well as total d:efo17mation at failure
of the specimen subjected to a given lateral stress. These axial and
lateral stress data were then used t.o prepare a Mohr diagra= for graphic
analysis of strength properties (See Fig. 4). Total deformation was used
only to indicate the relative deflection of a specimen when it was stressed
to failure.
Strength analyses were made from a diagram showing normal stress
data versus shearing stress data from tests on a single material at two
or more lateral pre.ssures. As noted in Fig. 4, tbis provides a graphic
solution of the Coulmnb equation:
where
and
Sc"C+NtanfJ
S" Shearing stress,
C "' cohesion, or intrinsic strength,
N co normal stress,
fJ "' angle of internal friction.
For a graphical solution, the vertical axial stress {<T1-(f3) is
plotted as the diameter of a semi-circle whose center lies on the abscissa,
and whose position with respect to the origin is determined by the lateT'al
stress. The distance which. the semi-circle is re=oved from the origin
- 9
is equal to the applied lateral stress ((J 3), or the center of the semi
circles is located a distance from the origin eq11al to (J 3+{0'"'1 -(f3 ) .
When the semi-circles representing stress conditions under difterent
lateral loads have been plotted, a straight line (tangent or nearly tangent
to all circles) is drawn. This line, the Mohr envelope, shows the limiting
condition of all combined normal and shearing stresses which the material
can withstand, and theoretically the line reprel'!ents this relationship for
failure of the material under any set of conditions.
Several fundamental properties of the material {as represented by
the specimens) can be obtained from the Mohr envelope:
(I) The angle of internal friction (Ill) - the angle between
the envelope and the horizontal. The tangent of this angle
is theoretically the coefficient of maximum grain-to-grain
friction within the samples.
(2) The cohesion, or intrinsic strength (c) - the intercept
made by the envelope and the ordinate.
(3) Shearing strength (S) - the shearing stress developed
at failure when the material is subjected to a given normal
stress.
Grouping of Tests
Tests were grouped into five series, but in the use of inforrnation
it was sometimes desirable to apply data to more than one series of rl!l-
sults. When it was necessary to establish comparisons, results were
extracted and duplicated in other groups of data. An appropriate note in
the text will inform the reader of any such transposition.
Series I was conducted to determine the effect of the length of
curing time on strength p.roperties and on moisture content. A single

- 10
stone (B) mixed with neutral water or neutral watel:' plus calcium
chlo:t'ide, was used in this series. Triaxial compression tests were
run on specimens cured for three days, seven days and fourteen days.
Testing of two sets of samples (one set containing 0. 5 percent calcium
chloride) furnished data which showed comparative strength properties,
or, the effect of curing. The extent of curing was determined by a
comparison of the initial and final moisture contents of each sample.
These data were then used to establish the effects of ti.me and the presence
of calcium chloride on the extent of curing.
Series TI was a study of the comparative strength properties of
the four limestones when mixed with neutral water. Stone B had already
been tested under these conditions as a part of Series I and therefore was
noLretested.
With the exception that 0. 5 percent calciurn chloride was added
to each specimen, Series Ill was similar to Series n in that the former
compared the four stones when mixed with a neutral water plus calciun1
chloride. Again, data pertaining to stone B was transposed fror:n Series I.
Series IV contrasted the effect of neutral water with the effect of
acid water on the strength properties of a single stone dust (B). Curing
was maintained at seven days.
Series V compared the strength properti.e s of specin1ens of a
single stone dust (B) when alkaline and neutral :mixing waters wecre ern-
ployed. Again, a seven-day curing period was used.

11 REStJLTS
A total of 74 specinoens of the various compositions were prepared
and tested. Tabular data which foll.ow present information concerningphysi-
cal. p:ruperties and strength characteristics of the compacted specimens.
The first letter and subscript of each sar:nple number in these tabulations
designates the series (S 1 indieates Series I)" In Series I the letter "W" in-
di.ca.tes neut:ral mixing water was used in preparing the sarnple, while "C"
indicates the addition of 0. 5 percent cah:im:n chloride to the J::nixing water.
With hoth these letter designations, the subsc:ript shows the number of days
curing. In Se:ries II through V, the capital letter following series desig-
nation identifies the stone used and corresprJ>nds to stone designations in
Table 1. The letter subscripts i.n Series IV and Vindicate the use of add
and alkaline 1eni:x:ing water :respectively. For example, sa:rnple designation
S W indicates Series I (S1), neutral mixing water (W) and seven days cur
l 7
ing (subscript 7), while S 3A designates Series HI (S3l Stone A(A)o
Moisture
.Moisture data pertaining to aU spechnens are presented in Table
.3, Lateral stress (0.,) at which each speciJnen was tested has been includ
·' ed as a possible cneans of determining the effect of moisture content upon
other test values. Opthnum nwistu.re contents are included since they re-
present the quantity o.f 1nixing water added when spedrnens were prepared.
These values were different .for each of the four stones, but there was a
very slight dliference in the case of Stones A and B. The rnoisture content
of each test specil::nen as deterrnined i.nnnediately after it was prepared,
designated as original nwistu:re content:, and again when it was tested
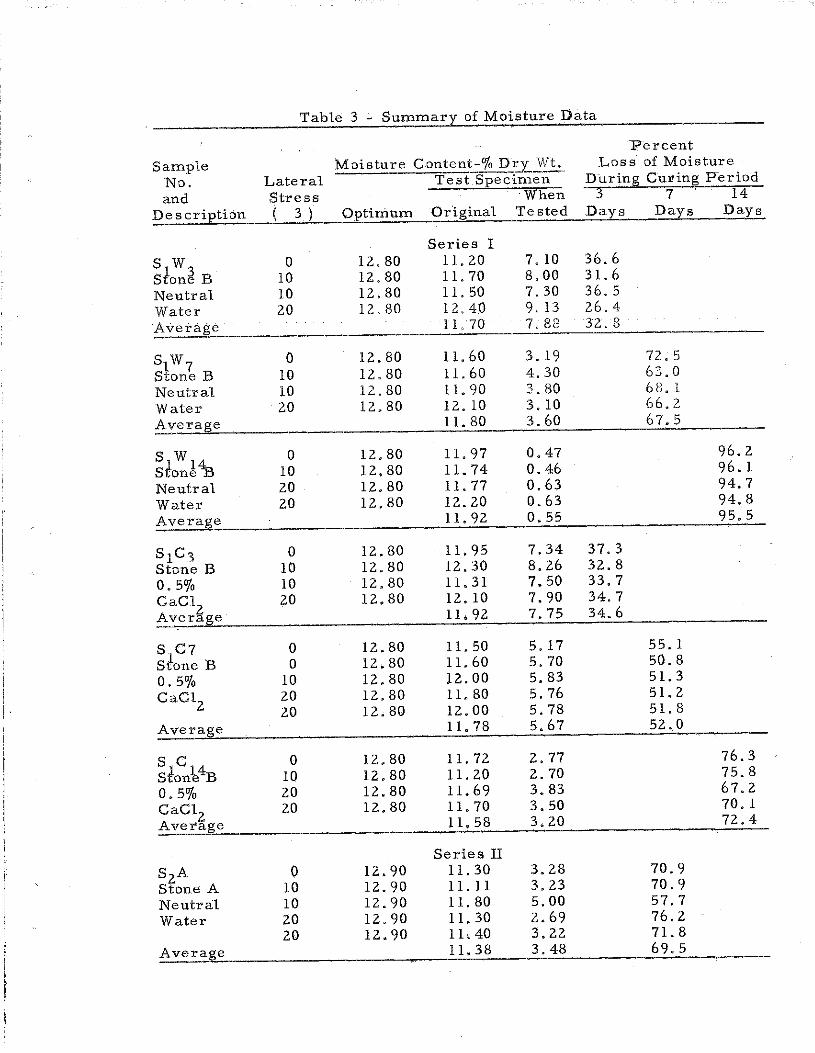
Table 3 - Summary of Moisture Data
1?ercent
Sample Moisture Content~_'1~p_r:_y__1:~ Loss of Moisture
No. Lateral Test Specimen _Durin!il Cul'ing Feriod
and Stress ·When 3 7 14
Des criEtion ( 3) Optimum Original Tested Days Days Days
Series I
st w3 0 12.80 11.20 7. 10 36.6
S one B 10 12.80 11.70 8.00 31. 6
Neutral 10 12.80 11. 50 7. 30 36. 5
Water 20 12.80 12.40 9. 13 26.4
Average 11.70 7.88 32.8
slw7 0 12.80 11.60 3. 19 72.5
S one B 10 12.80 11. 60 4.30 63.0
Neutral 10 12.80 11. 90 3.80 68.1
Water 20 12.80 12. 10 3. 10 66.2
A~era!ile 11. 80 3.60 67.5
st w 1'\! 0 12.80 11.97 0.47 96.2
S one 10 12.80 11.74 0. 46 96. 1
Neutral 20 12.80 11.77 0.63 94.7
Water 20 12.80 12.20 0.63 94.8
Average 11.92 0.55 95.5
S1C3 0 12.80 11.95 7.34 37.3
Stone B 10 12.80 12.30 8.26 32.8
0. 5o/o 10 12.80 11. 31 7.50 33.7
GaCl2
20 12.80 12. 10 7.90 34. 7
Average ll. 92 7.75 34.6
S C7 0 12.80 11. 50 5. 17 55. 1
Stone B 0 12.80 11.60 5,70 50.8
0 . 5"/o 10 12.80 l2.00 5.83 51.3
CaC12
20 12.80 11.80 5.76 51.2
20 12.80 12.00 5.78 Sl. 8
Avera!ile 11.78 5.67 52.0
s c 0 12.80 11.72 2.77 76.3
stonVB 10 12.80 11.20 2.70 75.8
0. 5% 20 12.80 11.69 3.83 67.2
CaC12 20 12.80 11.70 3.50 70. 1
Avera e 11, 58 3.20 72.4
Series II S 2A 0 12.90 11.30 3.28 70.9
Stone A 10 12.90 11. 11 3.23 70.9
Neutral 10 12.90 11. 80 5.00 57.7
Water 20 12.90 11. 30 2.69 76.2 20 12.90 11.40 3.22 71.8
Average 11.38 3.48 69.5
- 12
supplied data on curing of the specimen. Moisture values for each group
have been averaged to permit comparison on the basis of variations occurr
ing within each group of specimens.
Series I contained two sets of comparable specimens cured for
three, seven, and fourteen days. One set (designated as s 1 W) was pre-
pared with neutral mixing water and the second set (designated as s1
C)
with-__ mixing water containing 0. 5 percent calcium chloride.
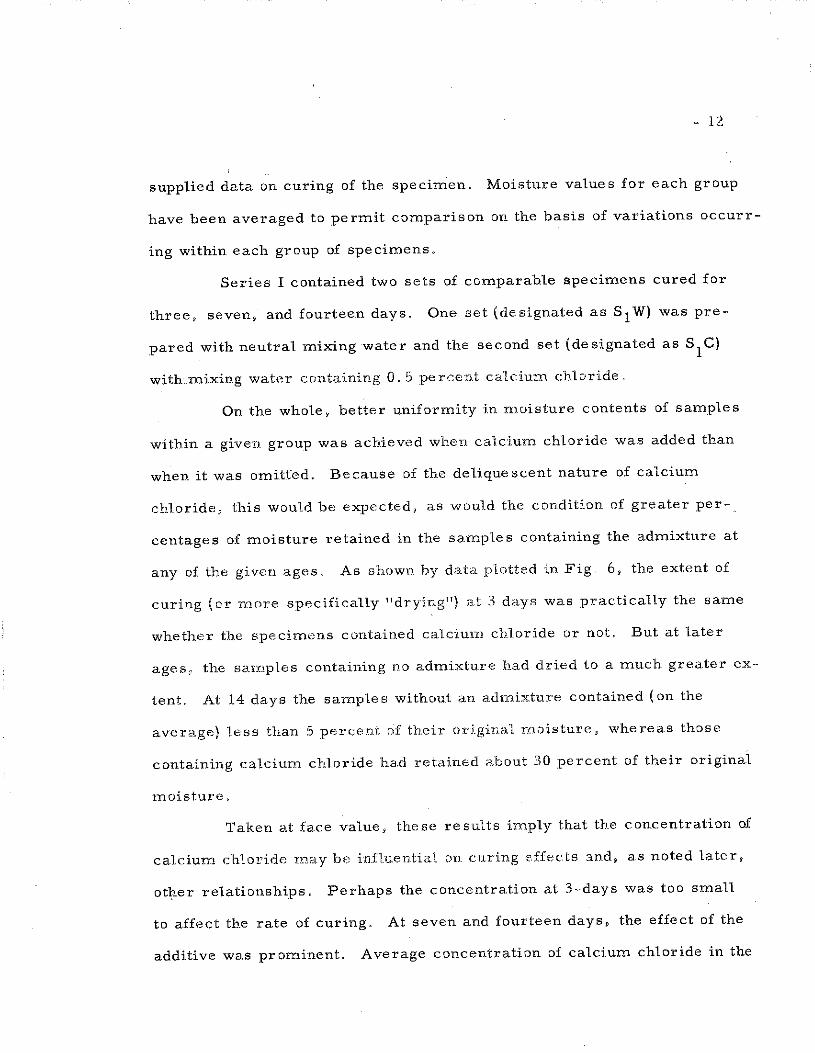
On the whole, better uniformity in moisture contents of samples
within a given group was achieved when calciu·m chloride was added than
when it was omitted. Because of the deliquescent nature of calcium
chloride, this would be expected, as would the condition of greater per
centages of moisture retained in the samples containing the admixture at
any of the given ages. As shown by data plotted in Fig. 6, the extent of
curing (or more specifically "drying") at 3 days was practically the same
whether the specimens contained calciurn cbloride or not. But at later
ages, the saxnples containing no admixture had dried to a rnuch greater ex
tent. At 14 days the samples without an adrnixture contained (on the
average) less than 5 percent of their original moistur<e, whereas those
containing calciurn chloride ha.d retained ;o.bout 30 percent of their original
1noisturf'!.
Taken at face value, these results imply that the concentration of
calcium chloride rnay be influential on curing effects :md, as noted later,
other relationships. Perhaps the concentration at 3-days was too small
to affect the rate of curing. At seven and fourteen days, the effect of the
additive was prorninent. Average concentration of calcium chloride inthe

100
90
..; 80 u 1>,
bJ) 70 10 • ..... (j)
60 ...... ::l ::l l)~ 50 'H ..... 0 0
40 ... ::21 p"H 2 0 30 ~ ., zo Cil 00
0 ...:1 10
0
100
_,_; 90 u 1>, 80 bJ)
p . ..... (j) 70 ... ... ::J ::J l)~ 60 "" ..... 0 0 50 ,.,::21 p"" 2 0
40
·~ n "' 30 [,1 ., 0 zo ...:1
10
0
_.... HzO
_,....... .--- -/
..... ·,z--___ A_, ·--
/ - - H-:;-0+0. 5o/oCaCh
/-----_,._ '?"
/y / ··-
1/, I ' L I I I I
3 7 14
Curing Period - Days
Fig. !c - Relationship between extent of curing and curing time for stone B (Tested in Series I)
~Neutral Water
13] Neutral Water+ o. 5% CaCl2
~ Acid Water
illill Alkol; •> c_,, •.••• ..::,
Water
A B c D
SLYc Designa'tions
Fig. 7 - .Average: percentage moisture loc;t by groups of specln1,.::;ns at 7 -dz~y curing period.

- 13
water {based on a specimen originally containing 412 grams of stone dust,
52,, 7 grams of water and 2. 06 grams of calcium chloride) at the various
curing periods were as follows:
Curing Period (days)
0
3
7
14
Concentration of Calcium Chloride
(percent-w"/w)
5,8
8. 1
13.9
These relationships and those plotted in Fig. 6, mean that, ob1>-tensibly at
least, a concentration of calcium chloride less than six percent of the
weight of water contained in the specimen had no effect upon the rate or
extent of curing, but all concentrations of this value or greater resulted
in .a uniformly reduced rate of curing with regard to specimens containing
only neutral mixing water.
In Fig. 7 comparisons among specimens comprising the four
different stones are made on the basis of percentage moisture lost at the
age of seven days. As in the previous ca.se, losses of moisture from the
specimens containing no admixture were consistently higher than those
from the samples containing calcium chloride. With regard to average re-
sults there were only minor variations in the curing conditions for com-
parable samples made with Stones A, B, and D, the specimens with no
admixture having about 70 percent loss of moisture and those with the ad-
mixture averaging close to 50 percent loss. In the case of Stone C, the
mean value of moisture loss from samples having no admixture, was ab-
normally low ( only 60 percent) for which there is no obvious reason -

- 14
including the fact that specimens containing Stone C had relatively low
densities or unit weights. It should be noted that variations among the
moisture contents of individual samples in a given group were greater
for.Stonf;!. C than for any of the other aggregates_.
Relationship.s established by tests on samples containing Stone
B and made with acid and alkaline mixing water are obscured by the un-
usually large spread of data·in one instance- S4Ba, Table 31 .(acid water).
There is no obvious or logical reason why the rate of drying should be ma-
terially different when acid water instead of neutral or alkaline water is
used.
Density
Measured physical p.;l'operties and ·results of triaxial compression
tests orr each of the individual specimens are presented in Table 4. Each
set of results cor·responds to those bearing the same designation given for
moisture content data in Table 3.
All the physical properties (except moisture content) are expressions
of density. Bulk specific gravity applies to the compacted test sample while
apparent gravity describes thf;! dust particles themselves. Unit weight was
included as a convenient and often-encount,ered expression of bulk gravity. . . '
Void ratio, which by definition relates tb,e volume of voids to the volume
of solids, was calculated from the expression:
e ~ Ga-Gb Gb
where e = void ratio~
Ga = apparent specific gravity
and Gb = bulk specific gravity
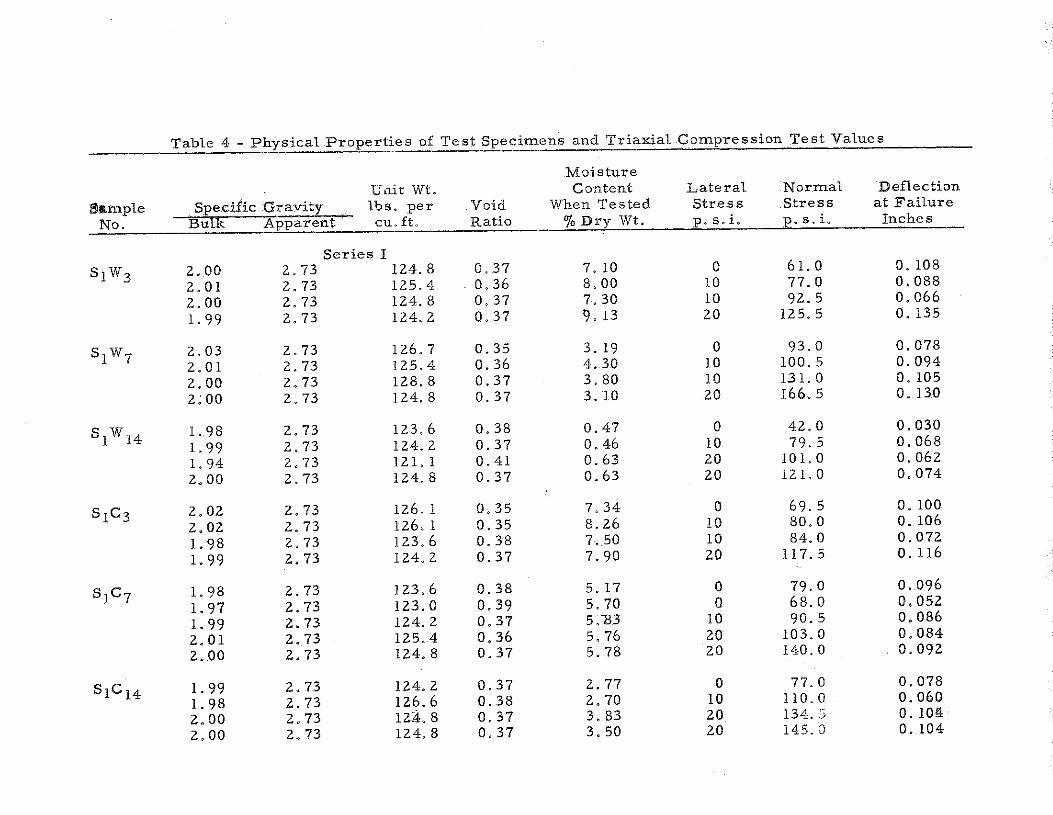
Table 4 - Physical Properties of Test Specimens and Triaxial Compression Test Values
Moisture 1J,;it Wt. Content Lateral Normal Deflection
Sample Specific Gravity lbs. per Void When Tested Stress Stress at Failure
No. Bulk Apparent cu. ft. Ratio o/o Dry Wt. p. s.i. p. s. i. Inches
Series l
s1w3 2.00 2.73 124.8 0.37 7. 10 0 61.0 0. 108
2.01 2.73 125.4 0. 36 8.00 10 77.0 0.088
2.00 2.73 124. 8 0.37 7.30 10 92.5 0.066
l. 99 2.73 124.2 0.37 9. 13 20 125. 5 0. 135
s1 w7 2.03 2.73 126. 7 0.35 3. 19 0 93.0 0.078
2. 01 2.73 125.4 0.36 4. 30 10 100.5 0.094
2.00 2.73 128.8 0.37 3.80 10 131. 0 0. 105
2;oo 2.73 124.8 0.37 3.10 20 I66. 5 o. no
slw 14 l. 98 2.73 123.6 0.38 0.47 0 42.0 0.030
l. 99 2.73 124.2 0.37 o. 46 10 79.5 0.068
l. 94 2.73 121. l 0.41 0.63 20 10 l. 0 0.062
2.00 2.73 124. 8 0.37 0.63 20 121. 0 0.074
S1C3 2.02 2.73 126. l 0.35 7.34 0 69.5 0. 100
2.02 2.73 126. 1 0.35 8.26 10 80.0 0 .. 106
l. 98 2.73 123.6 0.38 7 .. 50 10 84.0 o. 072
l. 99 2.73 124.2 0.37 7.90 20 117. 5 0. 116
S1C7 l. 98 2.73 123.6 0.38 5.17 0 79.0 0.096
l. 97 2.73 123.0 0.39 5. 70 0 68.0 0.052
1. 99 2.73 124.2 0.37 5.133 10 90.5 0.086
2.01 2 .. 73 125.4 0.36 5.76 20 103.0 0.084
2.00 2.73 124.8 0.37 5.78 20 140.0 0.092
S1C14 l. 99 2.73 124.2 0.37 2.77 0 77.0 0.078
l. 98 2.73 126.6 0.38 2.70 10 110.0 0.060
2.00 2.73 1 z.A. 8 0.37 3. 83 20 134.5 0. 10&
2.00 2.73 124.8 0.37 3.50 20 145.0 0. 104

Table 4 (Continuedl
Moisture Unit Wt. Content Lateral Normal Deflection
Sample S:eecific Gravity lbs. per Void When Tested Stress Stress at Failure No. Bulk Apparent cu. ft. Ratio %Dry Wt. p. s. i. p. s~ L Inches
s3B l. 98 2.73 126.3 0.38 5. 17 0 79.0 0.096 1. 97 2.73 123.0 0.39 5.70 0 68.0 0. 0·52 l. 99 2.73 124.2 0. 37 5.83 ro 90.5 0.086 2.01 2.73 125.4 0. 36 5.76 20 103.0 0.084 2.00 2.73 124.8 0.37 5.87 20 140.0 0.092
s3c 1. 82 2.67 113.6 0. 46 6.85 0 69.0 0.048 1. 83 2.67 114.2 0,46 8.73 10 94.5 0.098 l. 83 2.67 114.2 0.46 8.30 10 87.0 0.094 1. 81 2.67 112.9 0.48 6.40 10 114.0 0.078 1. 84 2.67 114.8 0.45 7.06 20 157.0 0. 140 1. 82 2.67 113.6 0. 46 6. 50 20 150.0 0. 124
s3D 1. 95 2.82 121. 7 0.45 6.86 0 47.0 0.144 1. 92 2.82 119.8 0.47 5.80 0 51. 0 0.080 1. 90 2.82 118.6 0.48 7.50 10 88.0 0.240 l. 93 2.82 120.4 0,46 7.09 10 85.0 0. 168
1. 92 2.82 119.8 0.45 6. 80 20 100.0 0. 196
Series IV S4B 2.03 2.73 12t..1 0.35 3. 19 0 93.0 0.078
2.01 2.73 125.4 0.36 4.30 10 100.5 0. 096 2.00 2. 73 124.8 0.37 3, .. \SO. 10 131.0 0. 105
2.00 2,73 124.8 0.37 3. 10 20 166.5 0. 130
S4Ba l. 95 2.73 121. 7 0.45 7.76 0 73.5 0. 120 l. 95 2.73 121. 7 0.45 5.30 10 113.5 0. 124
1. 94 2.73 121. 1 0.46 3.50 20 148.0 o. 092
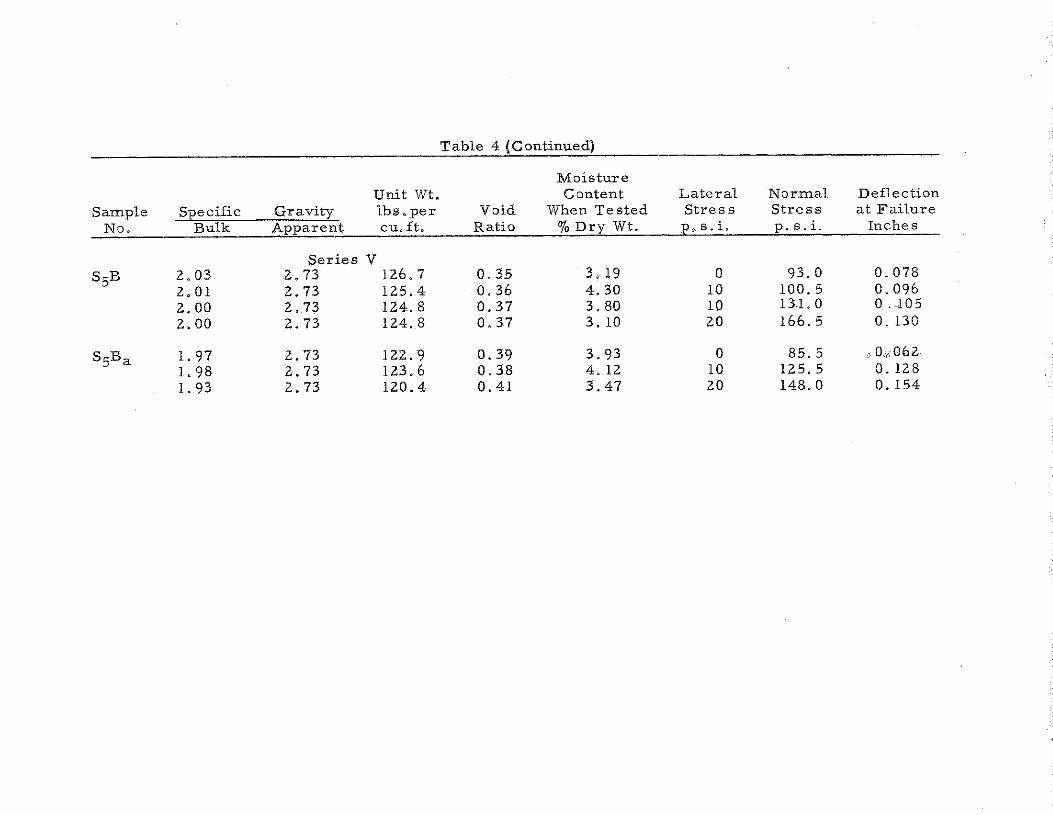
Table 4 {Continued)
Moisture Unit Wt. Content Lateral Normal Deflection
Sample Specific Gravity lbs. per Void When Tested Stress Stress at Failure No. Bulk Apparent cu. ft. Ratio o/o Dry Wt. p, s. i. p.s.L Inches
Series V s 5B 2.03 2.73 126.7 0.35 3. 19 0 93.0 0.078
2.01 2.73 125.4 0.36 4.30 10 100.5 0.096 2.00 2.73 124.8 0.37 3,80 10 131.0 0.-105
2.00 2.73 124.8 0.37 3. 10 20 166.5 0. 130
SsBa I. 97 2.73 122.9 0.39 3.93 0 85.5 .. Oi;, 062
I. 98 2.73 123.6 0.38 4. 12 10 125.5 0. 128
1. 93 2.73 120.4 0.41 3.47 20 148.0 0. 154

- 15
All the physical properties are of considerable significance since they
define the condition of the material at the time it was tested in ttiaxial
compression. Comparability of results within a given group, and among
groups too, is dependent upon uniformity of physical properties of the
specimens.
The general consistency in bulk specific gravity or unit weight
of the spechnetls representing given combinations of materials implies
uniformity of samples. Occassionally there were pronounced discrepan~·
cies, even for samptes that ~re intended to be duplicates, but in al
most every respect the unit weights and volumetric relationships were
much more uniforrn than the moisture contents.
Significant differences in the sarnples containing different stones
were evident. For example, the unit weights and void ratios of samples
with Stone A and B were very much alike, as might be expected since
both had high calcium carbonate contents and very similar gradations. On
the other hand, StoneD (high magnesium carbonate), which also had about
the same particle gradation, compacted to unit weights that were somewhat
lower or to void ratios very much higher than those of which stones A and
B were compacted. The much increased void in samples with Stone D in
dicates a resistance to compaction which is probably dependent on shape,
or surface texture of the particles, and of course the unit weight also re
flects the considerably greater apparent specific gravity of this stone.
Stone C, which had a high silicon content, a much different gradation, and
a lower apparent specific gravity than any of the other materials, had con
sistently the lowest unit weights, and void ratios approaching those of
Stone D.

- 16
The triaxial cornpression test data tabulated in Table 4 indicates
rather broad variations among strength properties of the specimens.
These contrast with the relative uniformity of physical properti<;>s just
discussed. Theoretically the results should be practically the same
where duplicate specimens and duplicate test conditions are involved.
Actually, identical results can rarely be expected, and the range in
acceptable variations is smnetimes relatively large. This is so be-
cause of limitations in preparing samples and controlling test conditions,
especial.ly moisture content. Probably most of the variation that occurs
in tests on materials such as these can be attributed to lack of uniformity
in the specimens, despite the indicated similarity in physical properties
previously discu•ssed. In this respect, particle orientation and chal)ges
in density and moisture at different points within a sample are uncontrol-
able and are not necessarily reflected by any measured property of the
separate test sarnpleso
Triaxial con1pression test values·~· lateral stress$ normal stress~
and deflection at fail.tire-·a.re included in Table 4 to permit comparison of
test values with respect to uniformity of test specimenso Lateral stress
( cr<jl) was~ in each case~ a _preselected value. However~ nor·mal stress :J
was a measured value dependent upon lateral applied stress and shearing
strength of the specimen. It represents the net vertical stress (O'i -03)
measured at the point of failure as determined by plotting stress-deforma-
tion curves and selecting the peak value. These curves are included in
- 17
the Appendix. Deflection at failure was obtained from these same
graphs and was the total deformation of the specimen at failure.
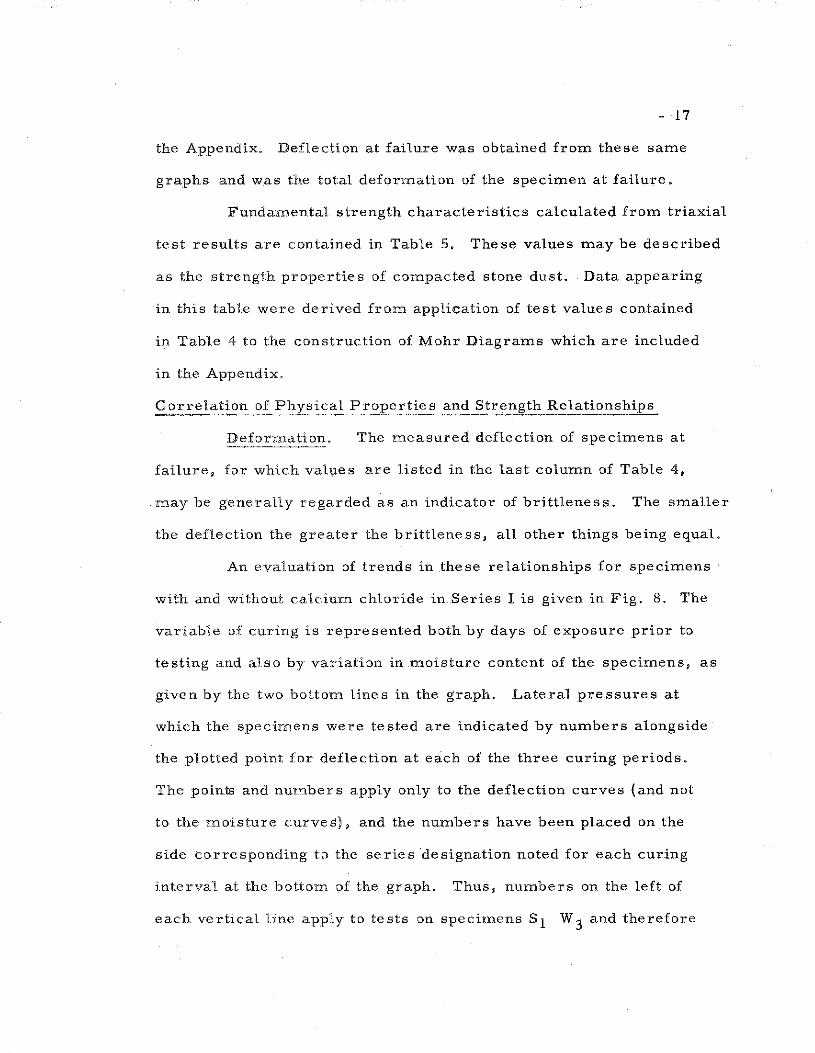
Fundarnental strength characteristics calculated from triaxial
test results are contained in Table 5, These values may be described
as the strength properties of compacted stone dust. Data appearing
in this table were derived from application of test values contained
in Table 4 to the construction of Mohr Diagrams which are included
in the Appendix.
Co.2:relation of Physical Properties and Strength Relationships
Defonnation. The rneasured deflection of specimens at
failure, for which values are listed in the last column of Table 4,
may be generally regarded as an indicator of brittleness. The smaller
the deflection the greater the brittleness, all other things being equal.
An evaluation of trends in these relationships for specimens
with and without caldum chloride in Series I is given in Fig. 8. The
variable of curing is represented both by days of exposure prior to
testing and also by variation in moisture content of the specimens, as
given by the two botton1 lines in the graph. Lateral pressures at
which the specirnens were tested are indicated by numbers alongside
the plotted point for deflection at each of the three curing periods.
The points and numbers apply only to the deflection curves (and not
to the moisture curves), and the numbers have been placed on the
side corresponding to the series ·designation noted for each curing
interval at the bottom of the graph. Thus, numbers on the left of
each vertical line apply to tests on specimens sl w 3 and therefore
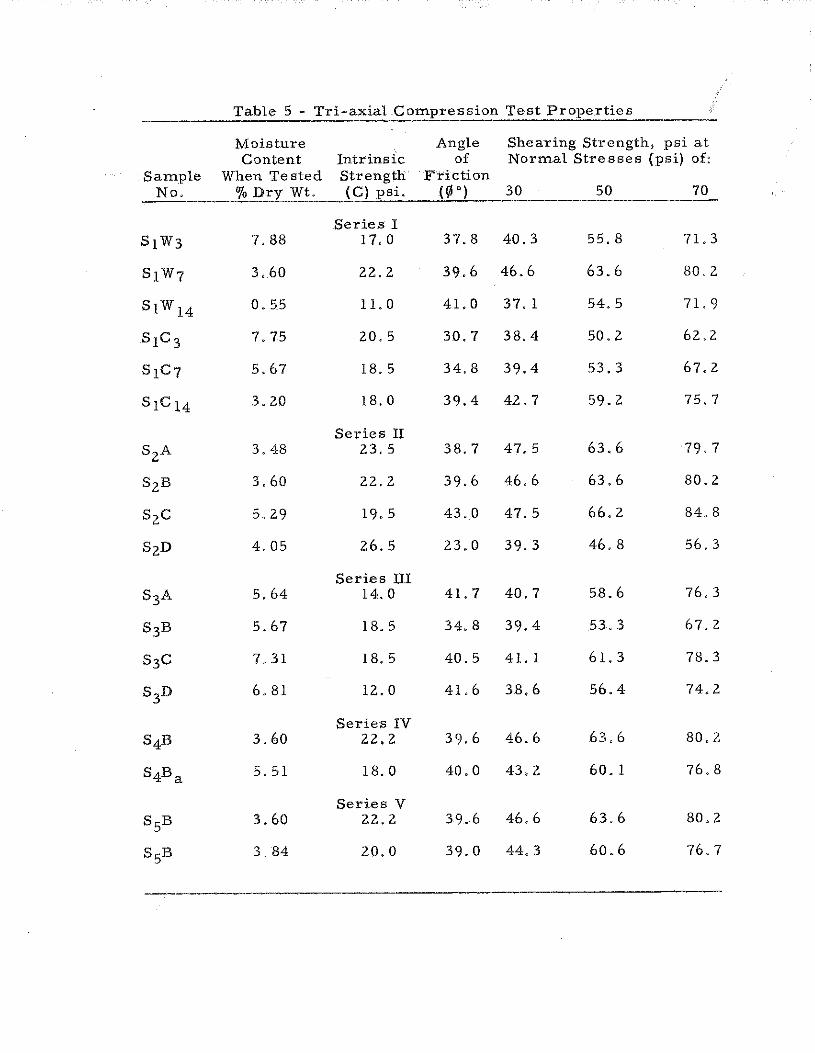
Table 5 - Tri-axialCompression Test Properties
Moisture Angle Shearing Strength, psi at Content Intrinsic of Normal Stresses (psi) of:
Sample When Tested Strength Friction No. o/o Dry Wt. (C) psi. .( ~ 0) 30 50 70
Series I S1W3 7.88 17.0 37.8 40.3 55.8 71.3
s1w7 3,60 22.2 39.6 46.6 63.6 80.2
s1w 14 0.55 11.0 41.0 37.1 54.5 71. 9
s1c3 7. 75 20.5 30.7 38.4 50.2 62.2
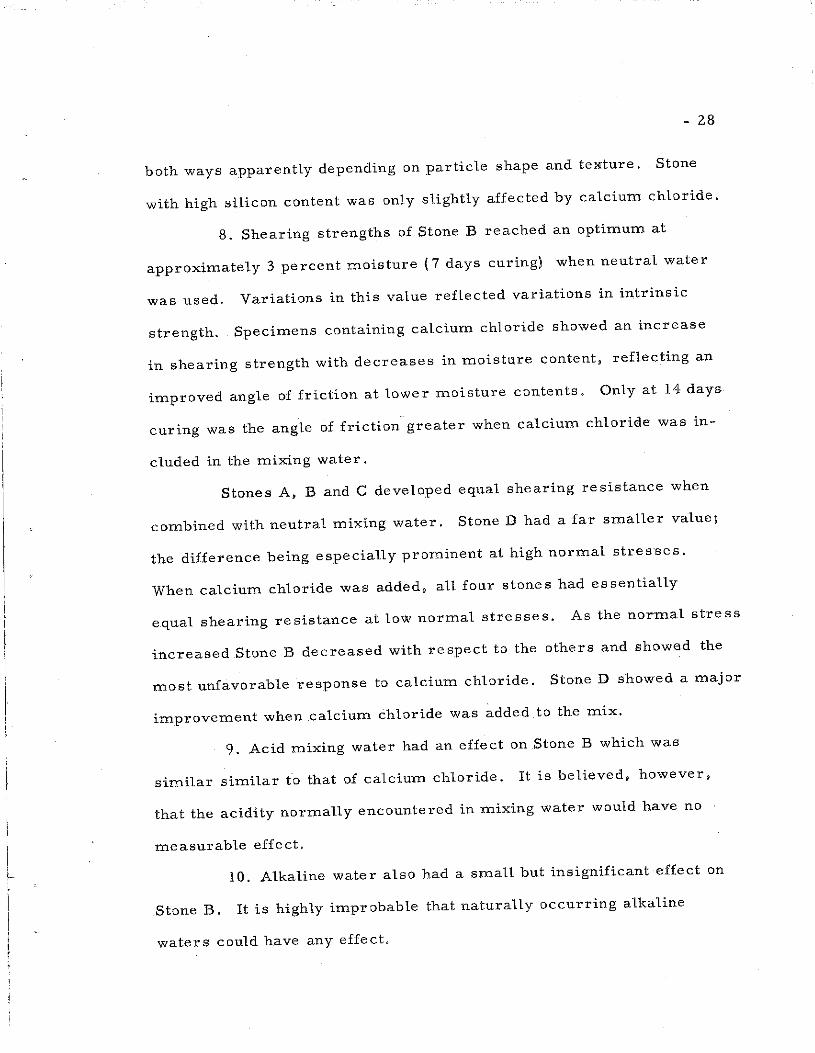
SlC7 5.67 18.5 34.8 39.4 53.3 67.2
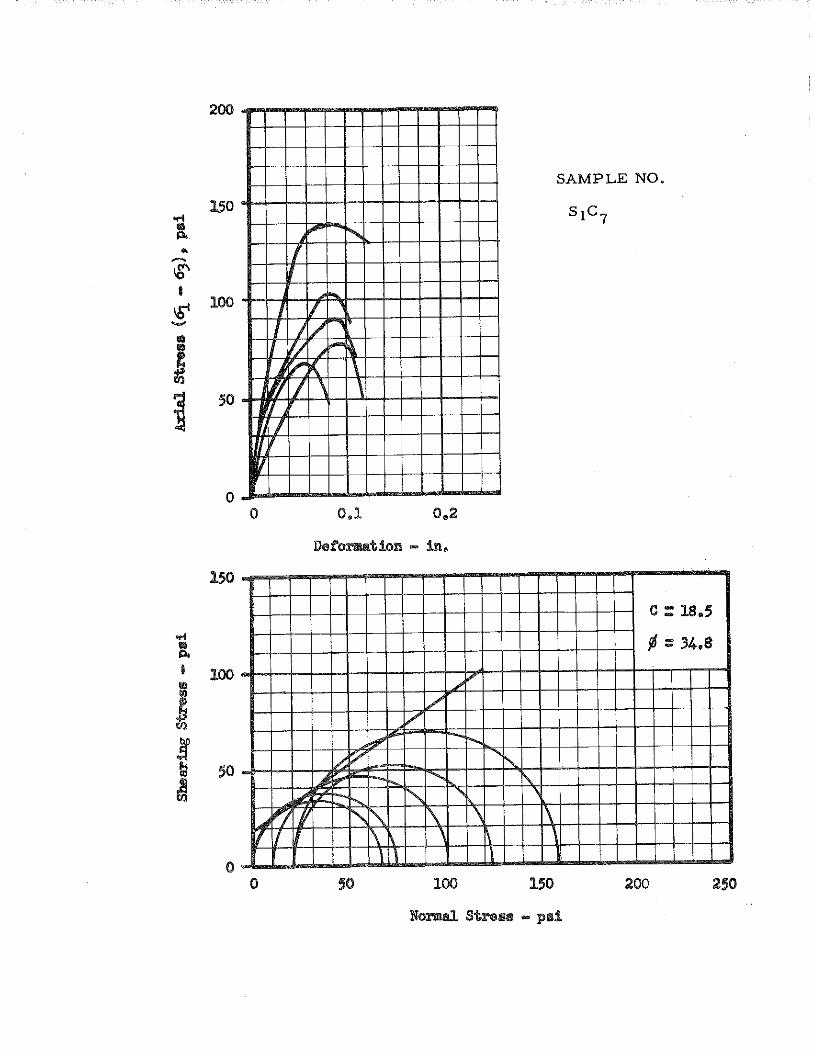
s1cl4 3.20 18.0 39.4 42. 7 59.2 75. 7
Series II s 2A 3.48 23.5 38. 7 47. 5 63.6 79.7
S2B 3.60 22.2 39.6 46.6 63.6 80.2
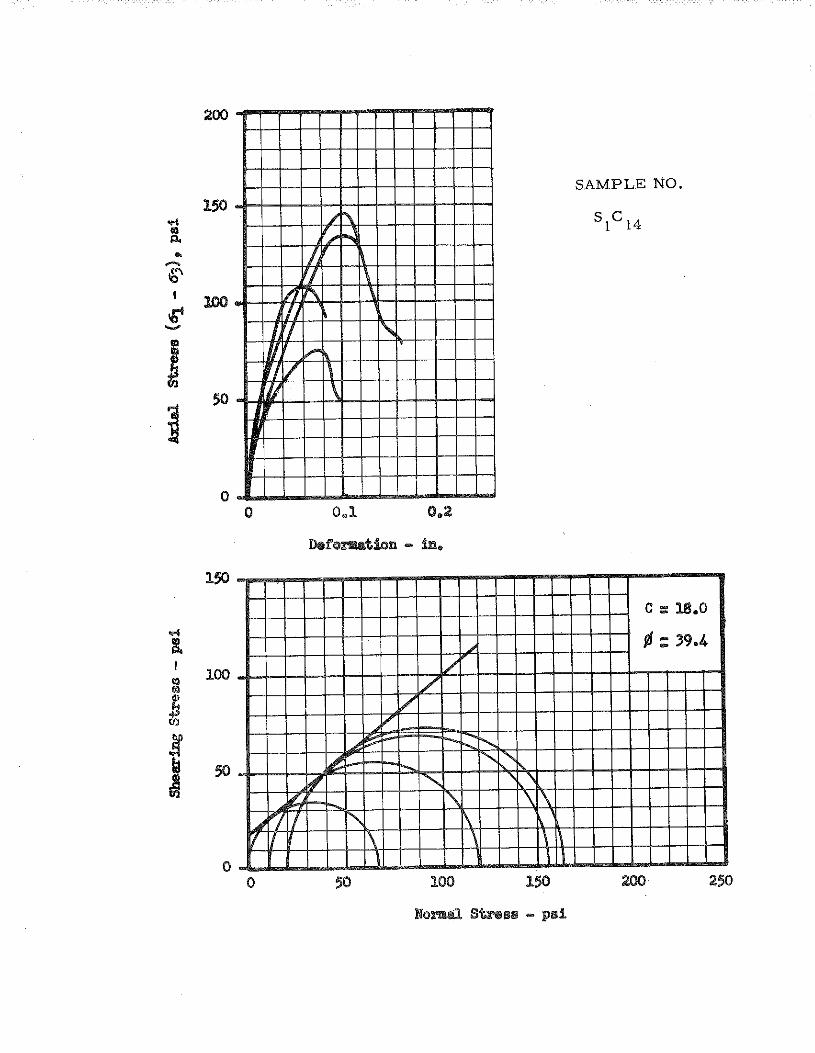
s 2c 5.29 19. 5 43.0 47.5 66.2 84,8
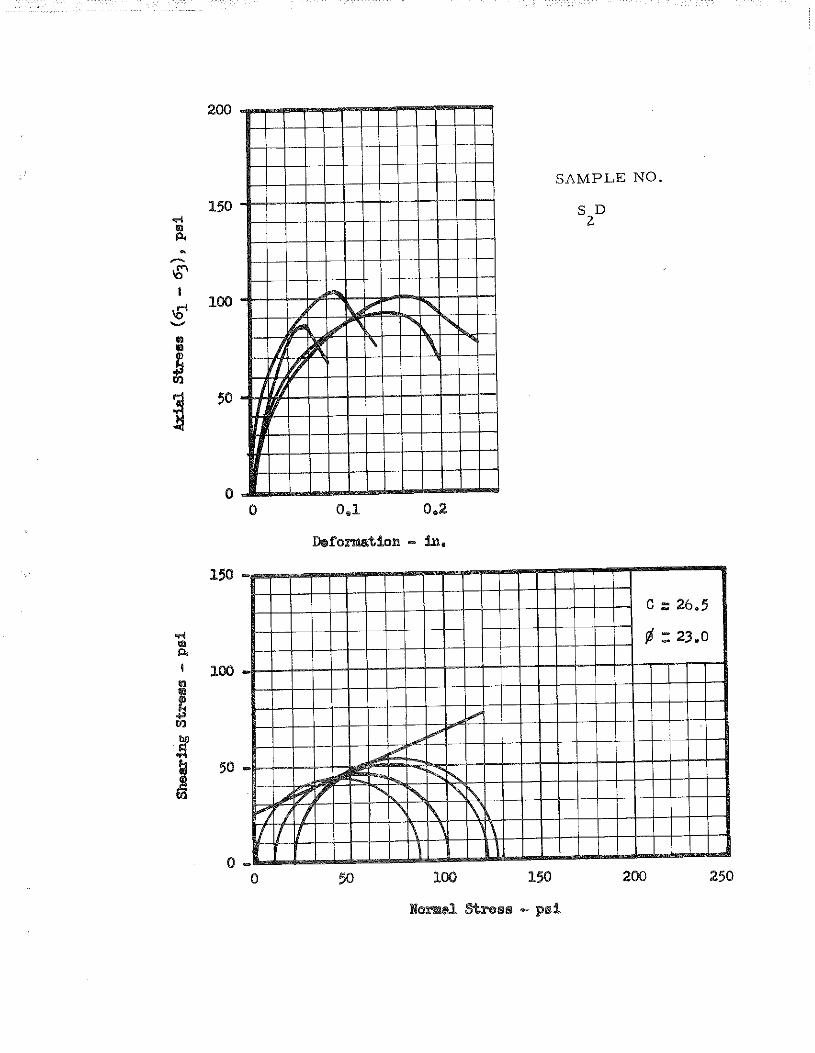
s 2D 4.05 26.5 23.0 39.3 46.8 56.3
Series III S3A 5.64 14.0 41.7 40.7 58.6 76.3
S3B 5.67 18. 5 34.8 39.4 53.3 67.2
s3c 7.31 18.5 40.5 41. 1 61.3 78.3
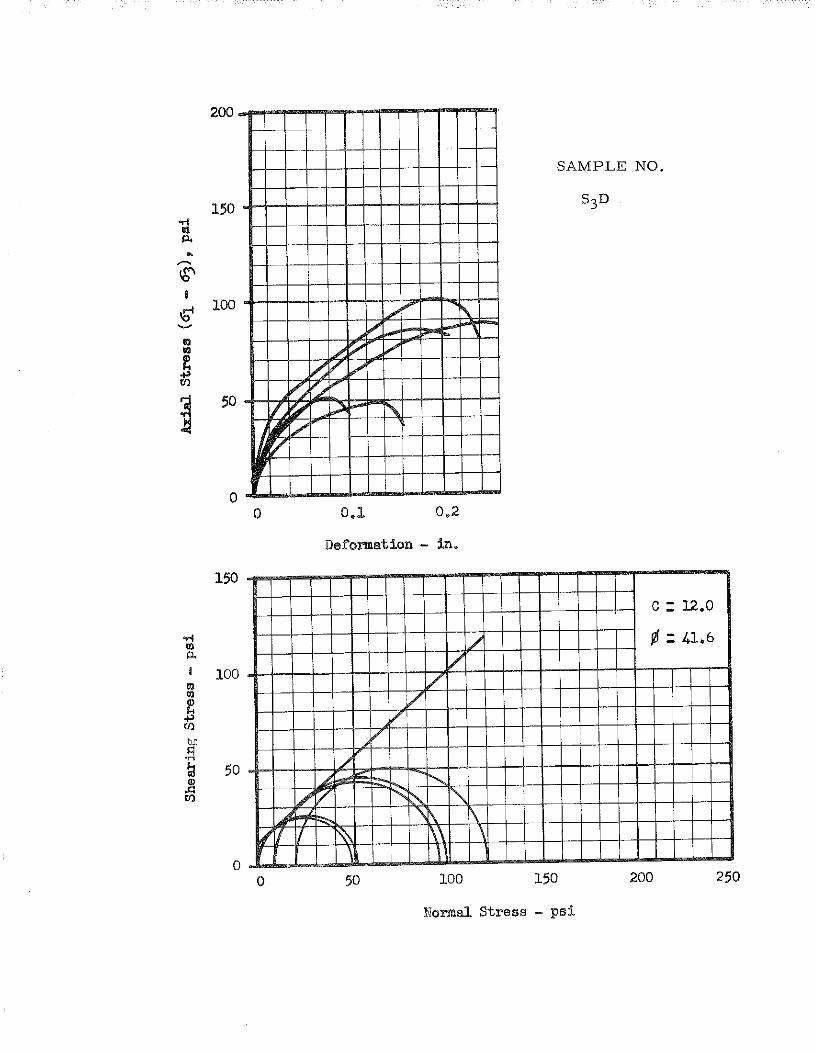
S3D 6.81 12.0 4L6 38.6 56.4 74.2
Series IV S4B 3.60 22.2 39.6 46.6 63.6 80.2
S4Ba 5.51 18.0 40.0 43.2 60. 1 76.8
Series V s5B 3.60 22.2 39.6 46.6 63.6 80.2
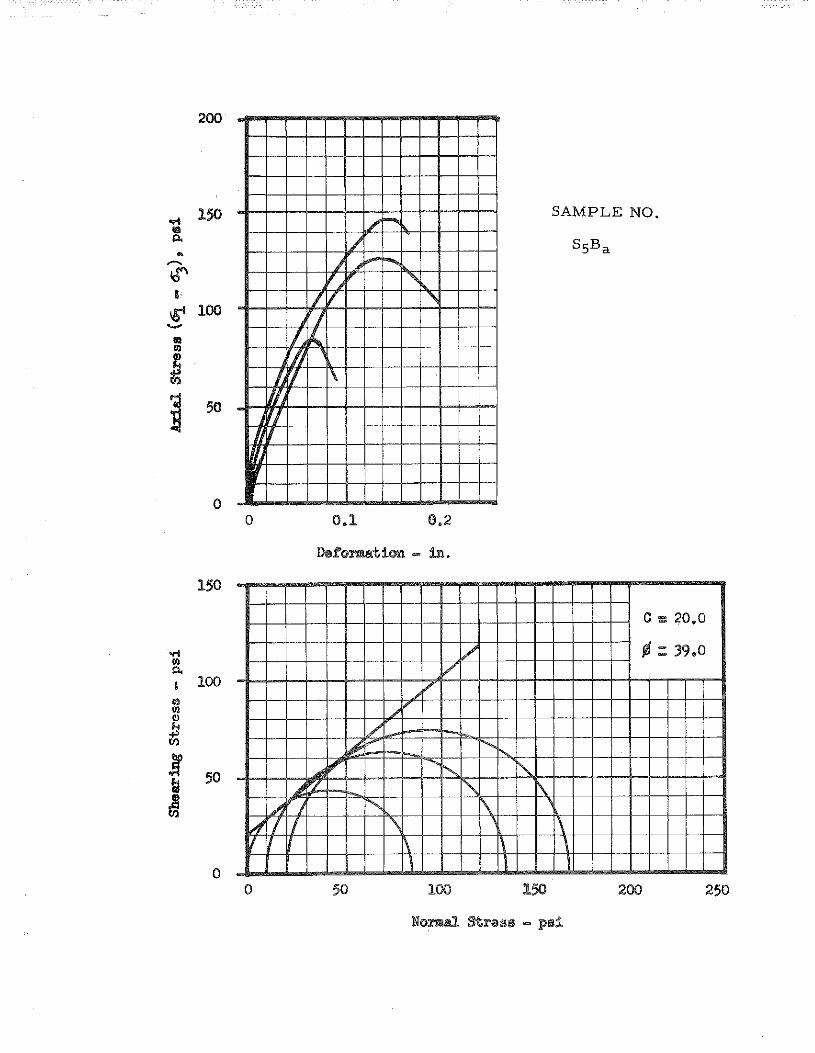
s5B 3.84 20.0 39.0 44.3 60.6 76.7

., "' ..d u <=!
H
<=! 0 ·~ .... u
'" ...... "+<
" C1
0. 13
0. 12
0. 11
0. 10
0.09
0.08
0.07
0.06
0.05
0.04
0,03
0.02
0.01
0
... ;s: >... 0 ....
<=!
'" u ... (\)
11<
.... <=!
"' .... <=! 0 u "' ... ;::! ... ., ·~ 0
::s "' OJ) ... ... "' > ..::
l3
12 II.
11 ~ 10
20
~0
01-10
'In
9 ~ 8
"'l 0-l!. ~
~"
20
10- -20,20
'- 10-f=~o ~o ~"'--..._ 1i8 _ _:._ ~~,- - ~--
O--l H 2 0+0. 5o/o CaCl2 "" 2o-r-o
7
6 10-l'u "'\' ~..-........_ ~TU
zii\..=
5
4
3
2
1 ~ -~-Ul [/)
0 3
. ..........-' ~~ ~ HzO+O. 5%CaCl2
" • ~ -..............X ...... ""' " -....!{~ . ......
t"-i ,.... __!;;,
v -1-Ul [/)
7
.......... ~2o -................
Curing Period - Days
;1G -·-"'"fV.l
14
Fig. 8 - The effect of curing {samples with and without calcium chloride) on deflection· of test
specimens (the upper pair). Moisture-time curves (the lower pair) are included to permit
a comparison of deflection-moisture content relationships.

- 18
define J!_le position of the solid curve relating deflection and curing
period for the specimens mixed with neutral water (HzO) and no calcium
chloride.
Obviously just the general trends are implied by the graphs,
considering the broad distribution of points. The intent is not toes
tablish definite relationships.
The line representing samples with neutral water indicated that
approximately the same deflection of specimens of this description may
be expected at three and seven days. Therefore, moi,sture content at
these intervals had little effect on maximum deflections. At fourteen
days, however, the effect of reduced moisture content was quite
noticeable. Specimens had entered a range of brittleness where slight
deflections produced failure. The trend line representing specimens
containing calcimn chloride showed little difference in the deflection
required to produce failure at 3, 7, or 14 days. It is highly doubtful
that there is any significance in these differences .. Changes in de
formation which changes in lateral pressure were· not consistent, and
the differences in defor:mation at various ages were not great enough
to define m.ore than a very general trend at best.
It should be noted in Table 4 (Series II and III) that deflections
(at 7 days curing) or specimens made with Stones A, C, and D increas
ed when calciun1 chloride was added to the mixing water - a reversal
of the effect observed with Stone B. Also, the use of both acid and
alkaline waters resulted in slightly increased deflection values. These
- 19
observations led to the conclusion that the trends indicated in Fig. 8,
did not represent a general relationship and applied only to the particular
stone involved.
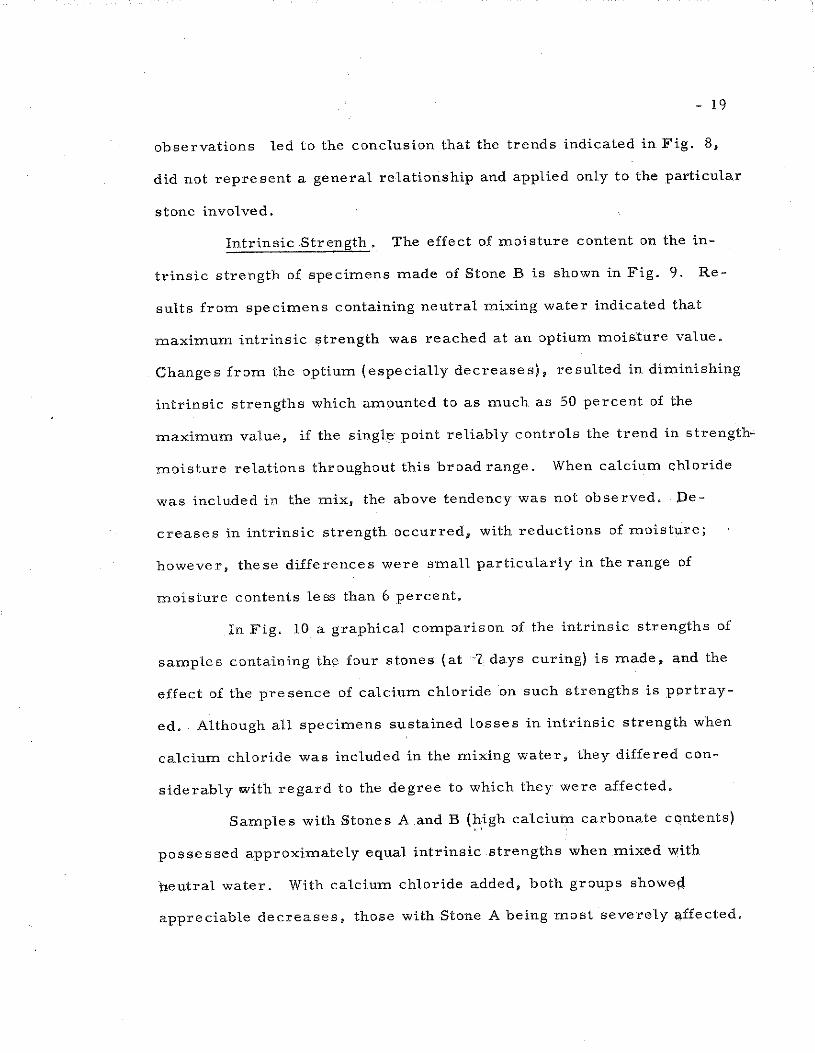
Intrinsic Strength. The effect of moisture content on the in
trinsic strength of specimens made of Stone B is shown in Fig. 9. Re
sults from specimens containing neutral mixing water indicated that
maximum intrinsic strength was reached at an optium mois'ture value.
Changes from the optium (especially decreases), resulted in diminishing
intrinsic strengths which amounted to as much as 50 percent of the
maximum value, if the single point reliably controls the trend in strength
moisture relations throughout this broad range. When calcium chloride
was included in the mix, the above tendency was not observed. De
creases in intrinsic strength occurred, with reductions of moisture;
however, these differences were small particularly in the range of
moisture contents less than 6 percent.
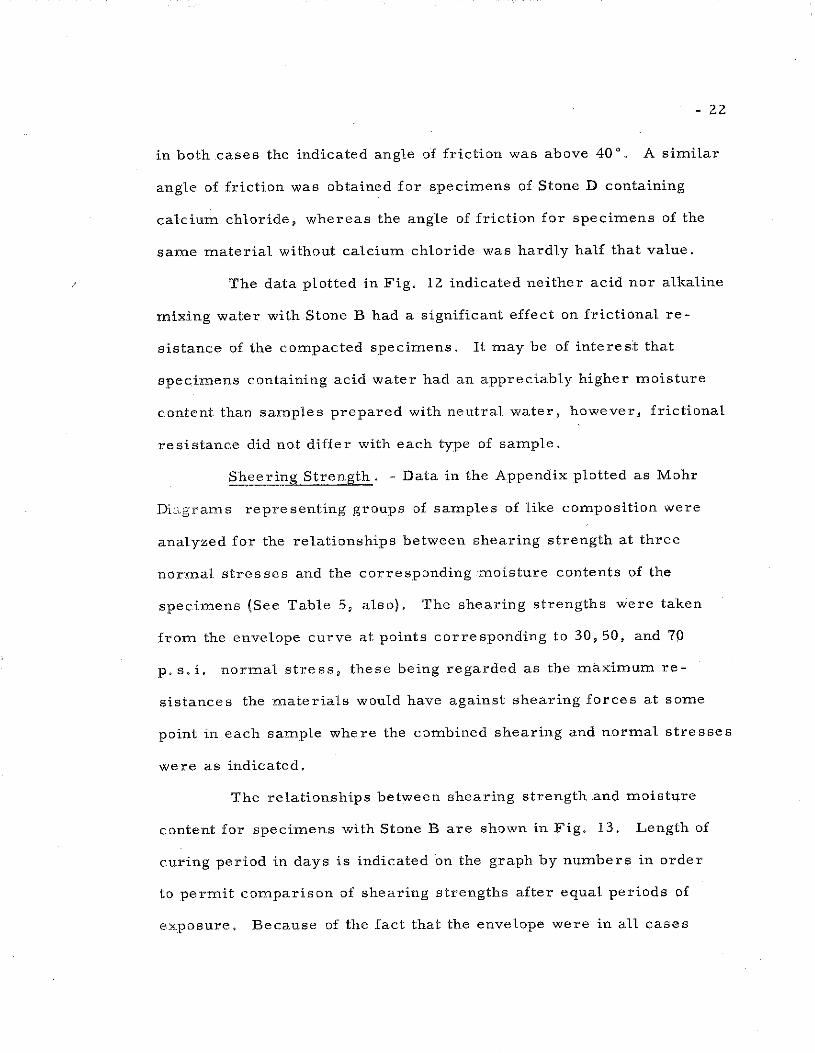
In Fig. 10 a graphical comparison of the intrinsic strengths of
samples containing the four stones (at ··7. days curing) is made, and the
effect of the presence of calcium chloride on such strengths is pprtray
ed. Although all specimens sustained losses in intrinsic strength when
calcium chloride was included in the mixing water, they differed con
siderably with regard to the degree to which they were affected.
Samples with Stones A and B (high calcium carbonate contents)
possessed approximately equal intrinsic strengths when mixed with
heutral water. With calcium chloride added, both groups showed
appreciable decreases, those with Stone A being most severely affected,

28
26
241 22
HzO 1-1\
...... ..... .. ll. 20 v K •• '
..c:: .., I 1--"" 18 Oil
~~ _,.. - ... - lJ "· .::
" ... .., U)
u .... ., .:: ..... ... .... .:: .....
16 H 2C 1+0. : 1'/oCa ~lz .... '
I !4
12
• !0
8
0 1 2 3 4 5 6 7 8
Moisture Content - Percent Dry Wt.
Fig. 9 -Relationship of intrinsic strength to moisture content for stone B (test specimens with and without calcium chloride).
. ... "' p..
' ..c:: ... Oil .:: " ... .....
(f.!
u ..... ., .:: . .... ... .... .:: .....
28 D
26 ~
24 A
It
22 iR~
20
18
.. c .. eB i ;!. -
16
A 14 ...
r
D
12 ~ ixin Wa er ~
G - H 0 10
l - H 0+0 5o/oC aCl2 8
~ -A id v ater -A kali eW ter I
0 2 3 4 5 6 7 8
Moisture Content - Percent Dry Wt.
Fig. 10 - Comparison of ,intrinsic strengths and moisture contents of the four limestones (after seven days curing).

- 20
'Samples with Stone C (high silicon content) were ostensibly affected very
little by the addition of calcium chloride, while specimens. with StoneD
suffered the greatest loss and in all respects exhibited the most extreme
intrinsic strengths.
Angle of Friction. Fig. 11 shows the relationship between angle
of friction and moisture content fur samples made of Stone B. The angle
of friction for those specimens containing neutral mixing water varied only
slightly with changes in moisture content, whereas specimens containing
calciurn chloride apparently were very sensitive to changes in moisture
content. For the latter, high moisture contents produced relatively low
angles of friction, but there were rapid increase in this angle with de
creases in moisture.
Both the curves in Fig. 11 show near -linear relationships be
tween moisture content and angle of friction. These curves intersett:
at a moisture content of 3 percent and an angle of friction of approximately
40 degrees. At moisture contents greater than 3 percent specimens pre
pared with neutral water had a definite superiority with regard to angle
of friction.
Viewed from the standpoint of concentration of calcium chloride
in the water remaining at various intervals of curing of specirn,ens con
taining Stone B, the results indicated the angle of internal friction in
creased with increasing percentages of calcium chloride. In effect,
within the range represented the concentration of calcium chloride in
creased £IJ~;>m 4 per cent to approximately 14 per cent of the weight
of water. At that point (see Fig. 11) the angle ·Of internal friction equaled

0 ..,..
~ 0 .... ... u .... ...
"" .... 0 ., ,... "" ~
....::
4 8
4 6 l !
'" 4
4 z ........
o>-• ... ,
~-- ~2o
' ~ 8
' Ill
4
3
" 6 r-.x 3
H 20 1!-0.5 oCa( 12 1'\..::-..
2
~
3
3
3 0
2 8
0 l 2 3 4 5 6 7 8
Moisture Content - Percent Dry Wt.
Fig. ll - Relationship of angle of friction to mois
ture content for stone B (test specimens with
and without calcium chloride).
44
42
.,c _!: ,.. ')4 c
B A I X 40 • -
oi! 38 A
• ,_ 36 I
..,. B ~ 34 0 . ... ... u 32 . ...
Mi:x ng 1 ate1
... "" .... 30 0
. - li_2o
., ,... 00 28 ~
X - fl:20 0.5 o Ca ~lz
....::
26 ~- ~cid Wat r I
24 ~- ~lka ine \Tate
•D
0 l 2 3 4 5 6 7 8
Moisture Content - Percent Dry Wt.
Fig. 12 - Comparison of angles of friction and mois
ture contents of the four lime stones at three
normal stresses (test specimens with· and with
out calcium chloride).

- 21
the value achieved with neutral mixing water - there being comparable I
moisture contents in the specimens of both types. Because of the limited
data and other circumstances of modified gradation, this is not meant to
imply a definite relationship that would exist in dense-graded aggregate
bases made with Stone B and different Rinds of mixing water.
A comparison of the angles of friction of samples containing
the stones after a 7--day curing period is given in Fig. 12. The frictional
angle for each material is presented with respect to the average moisture
content at which the specimens were tested.
The addition of calcium chloride produced widely varying re-
sults. Samples of Stone A and B (both high calcium carbonate) had
nearly identical values when neutral water was used, but showed
opposite responses to calcium chloride. The decrease which occurred
with Stone B has already been discussed. Stone A, a material similar
to Stone B (See Table 1 and 2), showed a tnarked increase in angle of
friction when calcium chloride was added. Note also that moisture
contents of these two stones (with and without calcium chloride) were
almost identical and densities (See Table 4) as indicated by void ratios
showed little variation. No particular significance is attached to these
contrasts in relationships under these circumstances, although in
general the results for Stone B would be considered the more
significant in view of the greater number and variety of tests with
that material.
Stone C showed a decrease in angle of friction when calcium
chloride was added. However, the change was relatively slight, and
- 22
in both cases the indicated angle of friction was above 40'" A similar
angle of friction was obtained for specimens of Stone D containing
calcium chloride, whereas the angle of friction for specimens of the
same material without caleium chloride was hardly half that value.
The data plotted in Fig" 12 indicated neither acid nor alkaline
mixing water with Stone B had a significant effect on frictional re
sistance of the compacted specimens. It may be of intere s:t that
specimens containing add water had an appreciably higher moisture
content than samples prepared with neutral water, however, frictional
resistance did not differ with each type of sample.
Sheering Streng!h_. - Data in the Appendix plotted as Mohr
Dic.grarns representing groups of samples of like composition were
analyzed for the relationships between shearing strength at three
normal stresses and the corresponding moisture contents of the
specirnens (See Table 5, also). The shearing strengths were taken
from the envelope curve at points corresponding to 30, 50, and 70
p.s.i. normal stress, these being regarded as the maximum re
sistances the materials would have against shearing forces at some
point in each sample where the combined shearing and normal stresses
were as indicated.
The relationships between shearing strength and moisture
content for specimens with Stone B are shown in Fig. 13. Length of
curing period in days is indicated on the graph by numbers in order
to permit comparison of shearing strengths after equal periods of
exposure. Because of the fact that the envelope were in all cases

..... "' 0..
"' "' " ... +.> Ul 0.0 ~ ..... ... Ill Ill
,.d Ul
.... .. 0..
"' .. Ill ... ....
Ul 0.0 ~ .... ... Ill
" ,.d Ul
100 Viixing W ~ter
90 11!1-I-l 20+0. 5% l::aCl 7
80 7
• - }l 2o
70
60
50
40
30
.~ I"'"
1:, ......... ~oo....__ 3 -!'± _, -'¥· ~--- -1!
N= 70 ps . 7
4.,....,-14111 ....... 7
J --·-r--.,.
N= 50 pe i.
-~ .,. ~;.- 7 3
I 1~- ~ --· N = .5U p i. 3
0 2 4 6 8 10 12
Moisture Content- Percent Dry Wt.
Fig. 13 - Relationship of shearing stress to moisture content for
stone B at three normal stresses (test specimens with and with
out calcium chloride).
100 Mixing r\fater
90 • - _!: bO.
80
c Ill- f 2o + o. 5' CaCl2 A,B • A-J cid Wate
70 B El
H~ D XC - ALI<:aLu e water
a ") X N= 70 psi. . "'-
60 A,pt: c· .~> c
50
40
DfBa A-w XD N= 50 psi.
lip
/nft~ 3 ol,; 1
s:; N= 30 J)_Si 6 'ai
/'D D MJI A "D
30 0 2 4 I 8 10 12
Moisture Content - Percent Dry Wt.
Fig. 14 - Comparison of shearing strengths and moisture contents of
the four limestones after seven days curing (test specimens with
and without calcium chloride).

drawn as straight lines, uniform patterns of results at the three
different normal stresses were inevitable.
- 23
Mixtures prepared with neutral water possessed greater shear
ing resistance at 3 and 7 days hut less at 14 days than did the samples
containing calcium chloride. A definite optin1urn moisture content
at which the greatest shearing resistance oceurred was indicated for
specimens prepared with neutral water. Changes from this optimum
value resulted in a reduction of resistance to shearing forees and de
creases were more pronounced at lower than at higher moisture con
tents. This condition was caused rnore by'a loss of intrinsic. strength
at low rnoist:ure contents than by decrease in the angle of friction.
Specimens containing calcium chloride exhibited a slight but steady
increase in shearing strength with decreases in moisture content. Pre
sumably this trend would continue at moisture contents lower than
those measured in this study. Further, shearing stresses of these
samples demonstrated less sensitivity to rnoisture content than did
specimens prepared with neutral water.
A decrease' in shearing resistan_ce of specimens containing
calcium chloride with respect to those prepared with neutral mixing
water occurred as the normal stress increased. This point reflects
the relatively low frictional resistance and high cohesion of specimens
containing calcium chloride at high -moisture contents. Only the 14-day
specimens retained the same relative position on the graph and in this
case the angle of friction was essentially equal to that acheived with
neutral water.

- 24
Fig. 14 shows the relationships between moisture content
and shearing strength at failure for specimens of the four stones at the
three arbitrarily selected normal stresses. All specimens were tested
after 7 days curing.
When mixing with neutral water Stones A and B (high calcium
carbonate) and Stone C (high silicon) developed equal or almost equal
shearing resistances at normal stresses of 30 and 50 p. s.i., but at 70
p. s. i. Stone C had a slightly higher value reflecting its greater angle
of friction. Stone D, which had very low angle of friction and high
intrinsic strength, developed appreciably lower shearing resistance
even at low normal stresses. As these stresses increased, increases in
shearing strength of the magnitude observed with other stme s did not
occur ostensibly indicating this to be an inferior material when pre
pared with neutral water.
Pronounced effects were achi.e.ved by adding calcium chloride
to the mixing waters. Samples with Stones A, B, and C suffered losses
of shearing strength. Changes in Stones A and C were approximately
equal while the loss occuring with Stone B was appreciably greater at
high normal stresses. StoneD showed a contrasting response, the
shearing resistance being increased rather than decreased. This stone
was the only one which, with the addition of calcium chloride, had an in
crease in angle of friction at this curing period. Its values were essential
ly equal to those of the other three stones with calcium chloride added
but were still less than the values achieved by the other stones mixed
with neutral water.

- 25 SUMMARY OF DBSERVAT10NS AND CONCLUSIONS
This study has extablished differences in .the individual re
spouse of several lime stone dusts when mixed with neutral water and
water containing 0. 5 percent calciurr1 chloride. A single stone dust
was tested after curing periods of three, seven, and fourteen days
(with and without calcium chloride) in an attempt to establish a
pattern of performance by which the other three stones might be
judged. In some respects, at least, this attempt was unsuccessful
in that the control stone when cured for a seven day period often
exhibited characteristics materially different from the other dusts.
However, xnany findings appear to be significant and these are
enumerated as follows:
l. The method of curing did not insure uniform moisture
contents of all specimens when tested. Moisture contents wet"<;), how
ever, sufficiently unifor·m to produce satisfactory results in every in
stance except one.
2. Specin1ens with and without cal durn chloride sustained
equal losses of moisture at three days of curing. After longer periods,
those specimens containing calcium chloride retained a higher l?ercent
age of moisture and the data indicated that the effectiveness of calcium
chloride as a moisture retaining agent is dependent upon its con
centration in the mixing water.
3. Three of the lin1estones showed little variation in IT)Oisture
lost at seven days curing when neutral rnixing water was used. The
fourth, Stone C, which had a high silicon content, lost appreciaply less

moisture during this period, Approximately equal moisture losses
for all stones occurred when the calcium chloride was added,
- 26
4, Intrinsic strength was highly sensitive to moisture
content when neutral mixing water was used and a definite opt'imum
moisture content with respect to this value was indicated, Large
reductions in intrinsic strength resulted where moisture contents
varied from this optimum, The inclusion of calcium chloride in
mixing water resulted in reasonably uniform intrinsic strengths
which were affected only by high moisture contents or possibly by
concentration of calcium chloride in the mixing water,
5, Specimens of the four stones containing neutral water,
when cured for 7 days, developed different intrinsic strengths,
Stones A and B (high calcium carbonate) had very similar values,
StoneD (high magnesium carbonate) had an appreciably higher value
than Stones A and B while Stone G (high silicon) had an appreciably
lower value, All these values were reduced when calcium chloride
was added. Stone A was affected, in this manner, more than Stone
B, although their chemical and physical characteristics (other than
particle shape and texture) were very similar, Stone D showed the
greatest sensitivity to calcium chloride and Stone G the least,
6. The angle of friction showed little variation with moisture
content when neutral water was used but was highly sensitive when
calciurn chloride was added to the mixing water. When calcium
chloride was present in the quantity used in this study, serious

- 2 7
reduction of the angle of friction occurred at moisture contents above
3 percent. It was presumed that lower moisture contents would result
in higher frictional resistance, but the data did not extend far enough
to definitely establish this point. Data did indicate that the concentration
of calcium chloride in the water, as well as moisture content, hqs an
important effect on angle of friction, since concentrations of less than
6 percent by weight of water appeared to produce reductions in
frictional resistance.
7. Calcium chloride did not affect Stone A in the same manner
that it did Stone B. At 7 days curing, the angle of friction of these
stones was essentially equal when neutral water was used. When
calcium chloride was added, Stone B (composed of !l;mo.oth. particles)
exhibited a loss of friction while Stone A (having chunky, grainy particles)
gained an equal amount. Stone C possessed the highest frictional re
sistance of all stones measured, when neutral water was used, but
the angle of internal friction decreased slightly when calcium chloride
was added. StoneD had an exceptionally low angle of friction when
neutral water was used, but this value became the highest of the four
stones when the mixing water contained calcium chloride.
In essence, these re suUs imply that the addition of calcium
chloride does not have the same effect on all limestones tested and that
the effect, as measured in this study, may be either beneficial or
detrimental depending upon the individual material. The stones con
taining large amounts of rnagesium carbonate was most benefited by
calcium chloride addition. High calcium carbonate stones responded
- 28
both ways apparently depending on particle shape and texture. Stone
with high silicon content was only slightly affected by calcium chloride.
8. Shearing strengths of Stone B reached an optimum at
approximately 3 percent moisture ( 7 days curing) when neutral water
was used. Variations in this value reflected variations in intrinsic
strength. Specimens containing calcium chloride showed an increase
in shearing strength with decreases in moisture content, reflecting an
improved angle of friction at lower moisture contents. Only at 14 days
curing was the angle of friction greater when calcium chloride was in
cluded in the mixing water.
Stones A, B and C developed equal shearing resistance when
combined with neutral mixing water. Stone D had a far smaller value;
the difference being especially prominent at high normal stresses.
When calcium chloride was added, all four stones had essentially
equal shearing resistance at low normal stresses. As the norrnal stress
increased Stone B decreased with respect to the others and showed the
most unfavorable response to calcium chloride. StoneD showed a major
improvement when calcium chloride was added to the mix.
9. Acid mixing water had an effect on Stone B which was
similar similar to that of calcium chloride. It is believed, however,
that the acidity normally encountered in mixing water would have no
measurable effect.
10. Alkaline water also had a small but insignificant effect on
Stone B. It is highly improbable that naturally occurring alkaline
waters could have any effect.

APPENDIX

200
150 SAMPLE NO.
.... 1111 p, ~ ,.... ~
j.,..-r.. !I
I 100 10' ........ II Ill
~
;/
f- - - ---
'I' v ' I I. ... !...
J u
~ 50 /
I / If
1/ v Jill
0 , 0
Deformation - in.
150
--~-
c;: 17,0
.... 1111 p,
If= 37.8
100 ., " f
v v ..,
(<) /
M ;1 tl 50
~
[7 .. ~ r..... - f'.... """ J?t~ r..... :".. 1\
1\ ------
\ 17 1/ \ ' i
0 -0 50 100 150 200 250
Normal Stress - psi

f"" ~
150
-= p.
lj SAMPLE NO.
.. ....... IS' I
~ ~ \ I
~ 100
....... Ill
~ 1\
" ' J 1-I
r-
i 50 •I-
0 0
150
c ::: 22.2
v rd ::: 39.6 v .. "
/
L b - 1"-
~ /. r .......
I".. r\. - 1"--.. '' I
r-~ Vt 1"- ~ \
~ I I [\ 1\ ~
' II -0 I I
0 100 150 200 250

200
150 SAMPLE NO • ..-1
"" Po .. ~
" 100 ll 1\ It ~
.J._j_ II ' fl)
w
i I L r \
\
J 50
If tl \
0 0 0,1
Defol:'!llat:!.on - :!.n.
150
c ::: n.o
¢ = 41.0
L /
lL v
v ~ -
I'"" !:--/ v )"-... 1\.
.~ ~ I' [\
it J. \ \ r 1\ '\
0 - J 0 50 100 150 200 250
Nol:'!llal Stress - psi

.... 150 SAMPLE NO.
!. r- - 1-
.. .......
"' .-- --
I
~ 100
Ill
"' j
/ 1\ ....
~ f\ J 'I A ..... "'
i 50 ·I- 'I l\
r- t--
0 I 0 0,1 0.2
c .. 20.5
¢::: 30.7
i'\
1/ \ ' o~ U I
0 100 150 200 250
200
SAMPLE NO.
150 '" !. ,... !""-.. ~
1$' 1/ 1/
I
~ 100
.... ll ......
1111 .,
~ ~
50
1 IL ~ i<'""
.i~ ~ N1 lL ' Ill
_L 'I
0
, 0 0,1
150
c :: 18.;
'" l ¢ = .34,8
I 100 Ill
j /
1/ /
!f t! ;o ~
~ r-..
~ I?' ' )'.._
...... 1'\
""' l' "' '
~ " 1'\ [\ 'I ~ I 1\
0 l 1\ I
0 so 100 150 200
Normal Stress - psi
.. ...... I!)'
f
200
150
50
0
150
100
0
0
"' rt
0
~ 1"\. v, r-.l
J rl 1\ 17"'1 ' i.-'"'
v 1\ \
0.1
~ ~
~ lff f'
1\ I
SAMPLE NO.
'
c = 18.0
p$ ::: 39.4 /
1/ /
/ -.... t-.....
"' ·" .........
I'\ \ ;\ r\
I 100 150 200 250

200
1/ ' I/ SAMPLE NO.
""' 150
&
2 ..-; \.
a ~
oS' v 17 , ..... r....
1/ J I/ !"\ I
~ 100 ~~ "' 1\. ~
Ill ll '/ rll
~ v ····· t-
I
~ so I IJ
' , 0
0 0,1 0.2
Deformation - in.
150 -C·"' 23.5
v ¢:: 38.7 v
I 100 - /
I~ ..... r.... '/ ......
!-...
~ ....... !-... "
~ ... ' I'- 1'\
F;:: r-... ~ 1'\. 1\ "" ·--
1./, '\ !'.. 1\ 1\ ' f"2 l_f I 1"\ \ \ 1/ ,f -
II -0 0 50 100 150 200 250
Normal Stress - psi
200 I,. " --1--- 1--
\ --
I II
1- f-
\ - 1--1- -··-,- --
1--- SAMPLE NO.
..-! 150
I J ~
T 1\ \ Ill 10. I - \ ~
~ II (7 -..;;
'¢' J 1\
~ 100 I 1/ \
II 1/ ...... Ill Ill
~
II w I 1/
If rr
j 50 I 1/
0 0 0.1 0,2
Deformation - in.
150
----- I-l7 c :: 19.5
v ¢ :: 43.0 v
17' ...... .... 100
~ r--.. lA !,...- t--- "
lA ~ !'. '
Uhf "' ...... \
I\ \ 1\ rs 1\ 1\ ' --
'\ \ - -- t-- 1--1\
50
0 I I
0 50 100 150 200 250
Normal Stress - psi
'" ., p. ~
.-.. 16'
~ ......, ., Ill
~ ~
.... ., p.
' " ! ... <fl
£f
J
200
150
100 .....
I' ~ ......
50
rr~ 1""1 " I'
I' ' 'Nu, 'fl
I
0 0 0.1
Defo:nu.tion - :l.n,
150-
·r-- 1--
100-
50-.~ 'r"7 / [_ . '
0-0 50
_,. ~
i' b-.
' '\
1\ 1\ ' I
100
'
.....
~ ~·· 1\
150
SAMPLE NO.
S D 2
200
c ::: 26.5
¢ : 23.0
:
'
250
200
.
SAMPLE NO.
150 ..... "' p. ~
~
'8'
~ 100 L.;
,..... 1\
~
"' "' 2! +' t:l)
~ 50
I-' / p v
~ v ~ v.., '.L.
r !.--" ~
'
I 0
0 0.1 0.2
Deformation - in.
150
c : 12.0
..... "' p.
I 100
"' "' Gl
.13 t:l)
I/ ¢ : 41.6
v v
L v
bD v .~ I--
!iJ 50 Q)
.<:: t:l)
/
" l/ v r-.; f::\, I'\ "\
- l\ 1\ 1!:: 1/ ~ 1\ I
0 0 50 100 150 200 250
Normal Stress - psi

200
SAMPLE NO .
.... 150 " p. ,..... b-.
~
~
.g' II
I
~ 100 ~
Cll
II """ b
/ I
"' (])
H +' (f)
'OJ •.-1
50 l;j
,, II lr
I v ' v 1/ /
I ~
0 0 .1 .2
Deformatio:o - in.
150 -
. ~-c ::: 18.0
. ., "' p. v ¢ :: 40.0
I 100 "' "'
v v
(]) H +'
/ (f)
till
-~ H
50 ol (])
..c (f)
/ ..• ~ t---
"""' v f"-..
j.t !'- ['..
I? ~ 1\. -
' A "/ I f'\. \ 1\ -, -
0 1\ 0 50 100 150 20) 250
Normal Stress - psi
200
'" 150
II / r. SAMPLE NO.
A a ~
'o"' ~ 1"--"' ,,
..;-' 100 ..... I 1/ ' )
Ill ., ~
1/. v... ~ -
r/J --j rl I\
~ 50 1/J I
' HI
0 0 0,1 0,2
Deformation - in.
150
- ~ ~-c :: 20,0
'" !II A I 100
v ¢ ;:: 39.0 - -- v
"' ., - ~ ~
"' " / ,.. ., Ill
l 50 li! ~ •
' ""-~ !'.... - I'\ 1\
1- -;;; 1\ lA 'I 1/ \ 1\ t-1/ II
~ ~~
I -0 0 50 100 150 200 250