Embed Size (px)
Citation preview
Devin D’Angelo
Himax Technologies (HIMX)
Agenda
2
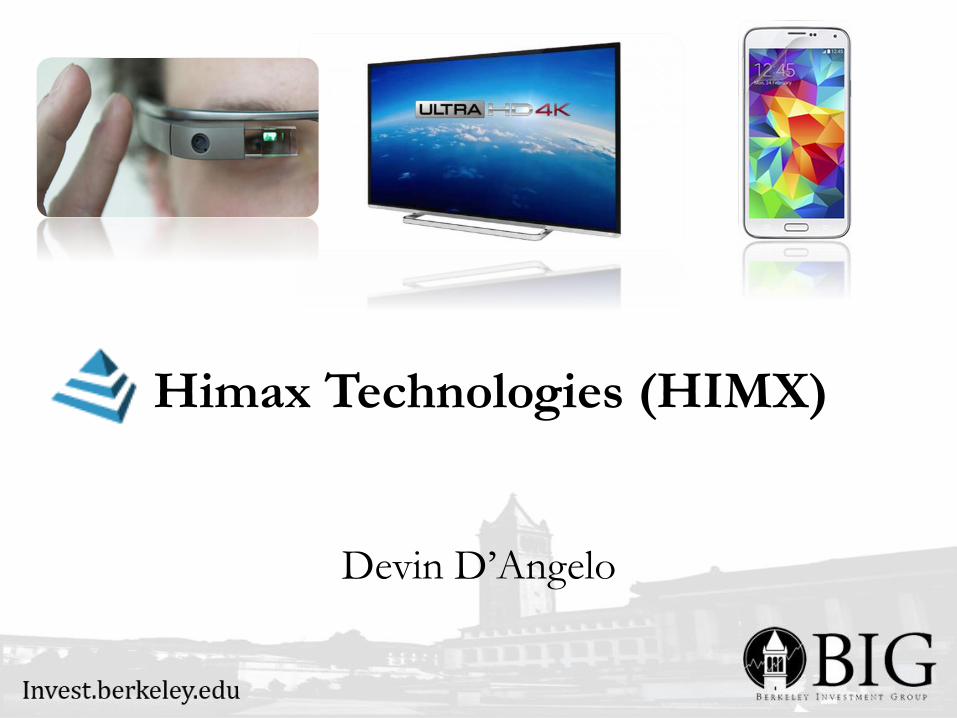
Executive Summary
Industry Thesis
Company Thesis
Valuation & Recommendation
Business Overview
3
30%
54%
16%
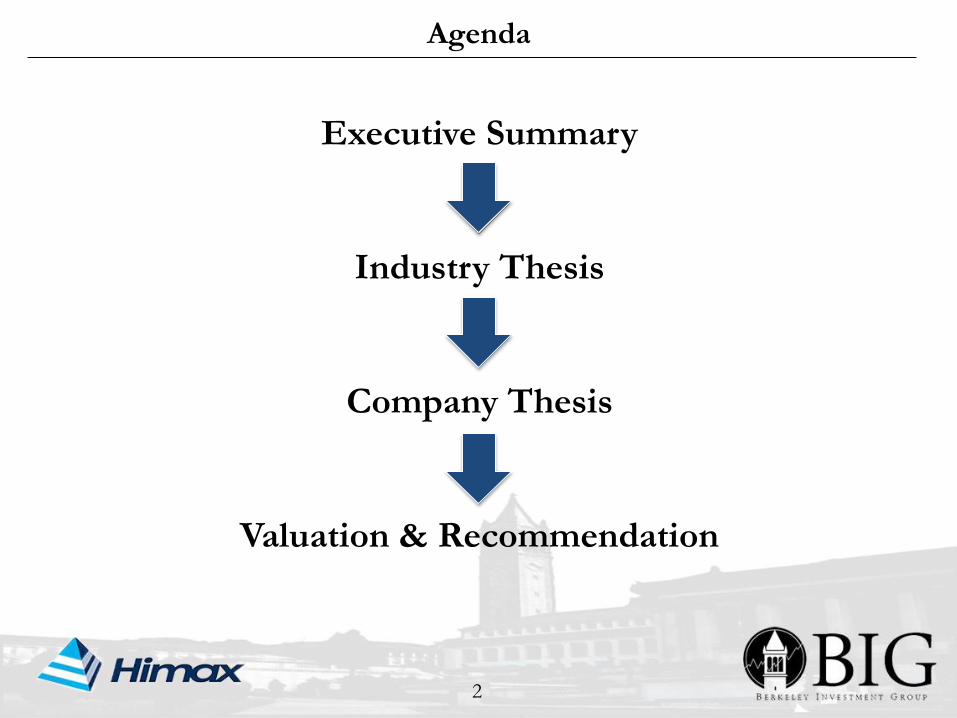
Revenue By Segment 2013
Large Panel Drivers Small and Medium Panel Drivers Total Non-Drivers
• Himax is a fabless semiconductor design
house located in Taiwan.
• 84% of Revenue from Display Driver IC
in LCD Panels.
• For 5 years, the company has seen rapid
declines in Large Panel Driver IC and
rapid growth in Small/Medium Panel
Driver IC.
• Non Driver products expected to achieve
profitability in 2015.
Large Panel Small/Medium Panel
TVs PC Monitors Notebook PCs
Non Driver
Smartphones Tablets
Consumer
Electronics
Investment Thesis
4
Company Thesis
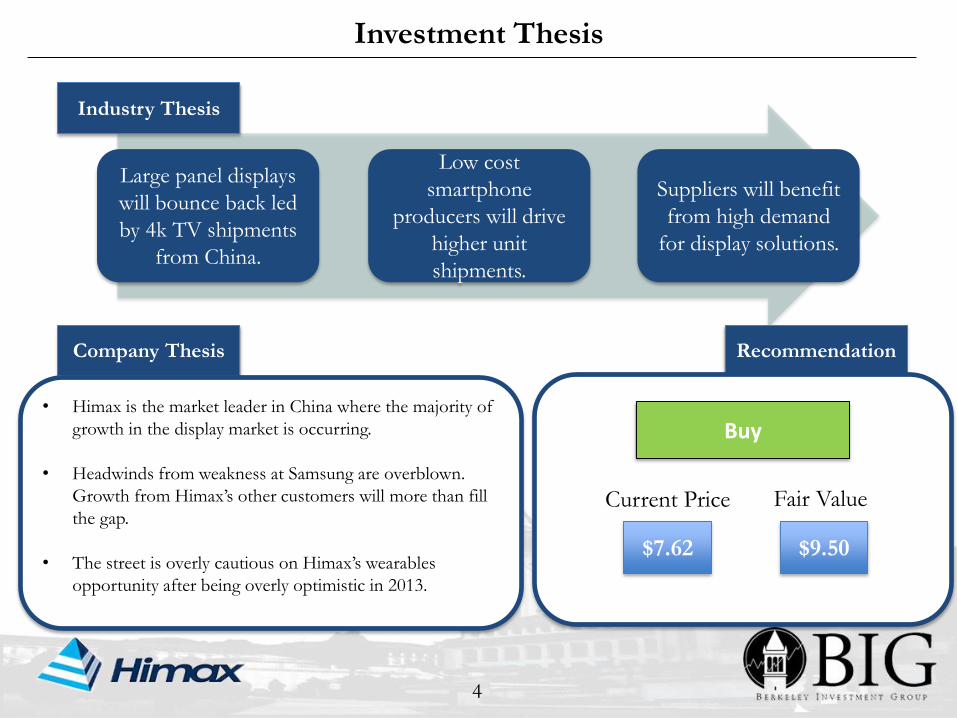
• Himax is the market leader in China where the majority of
growth in the display market is occurring.
• Headwinds from weakness at Samsung are overblown.
Growth from Himax’s other customers will more than fill
the gap.
• The street is overly cautious on Himax’s wearables
opportunity after being overly optimistic in 2013.
Large panel displays
will bounce back led
by 4k TV shipments
from China.
Low cost
smartphone
producers will drive
higher unit
shipments.
Suppliers will benefit
from high demand
for display solutions.
Industry Thesis
Recommendation
$9.50
Fair Value
$7.62
Current Price
Buy

5
Industry ThesisLCD Displays
Global TV Shipments
6
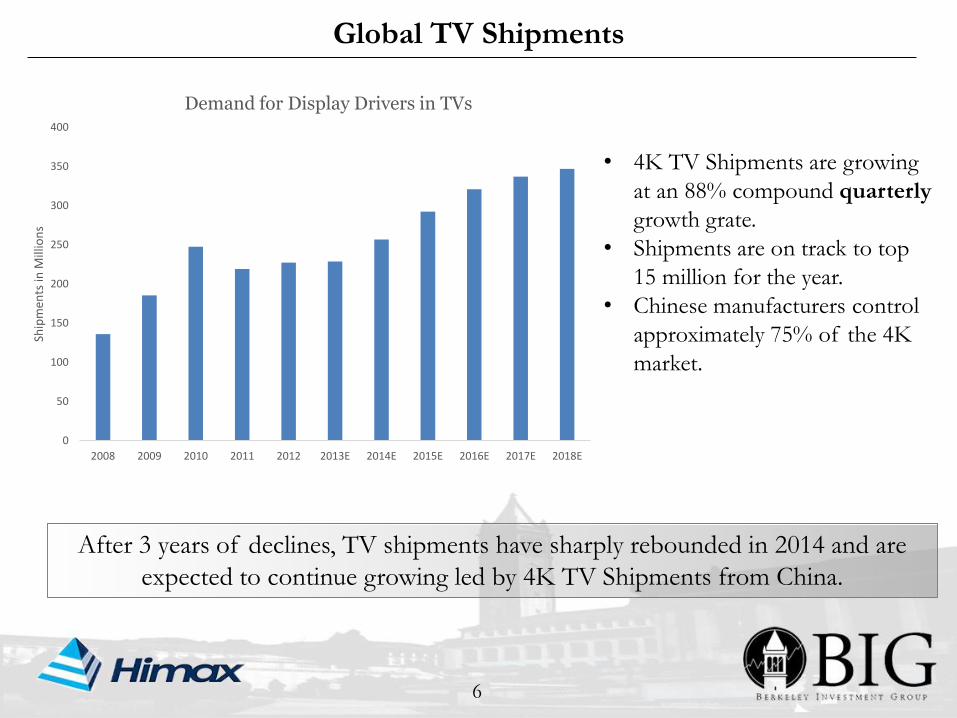
After 3 years of declines, TV shipments have sharply rebounded in 2014 and are
expected to continue growing led by 4K TV Shipments from China.
• 4K TV Shipments are growing
at an 88% compound quarterly
growth grate.
• Shipments are on track to top
15 million for the year.
• Chinese manufacturers control
approximately 75% of the 4K
market.
0
50
100
150
200
250
300
350
400
2008 2009 2010 2011 2012 2013E 2014E 2015E 2016E 2017E 2018E
Ship
men
ts in
Mill
ion
s
Demand for Display Drivers in TVs
4K TVs
7
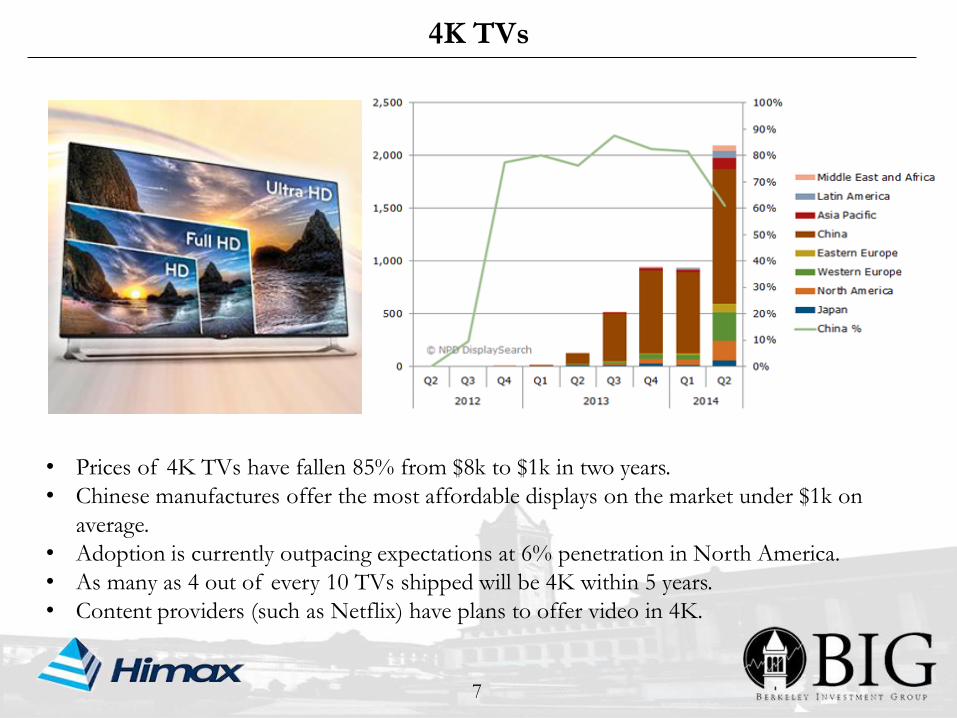
• Prices of 4K TVs have fallen 85% from $8k to $1k in two years.
• Chinese manufactures offer the most affordable displays on the market under $1k on
average.
• Adoption is currently outpacing expectations at 6% penetration in North America.
• As many as 4 out of every 10 TVs shipped will be 4K within 5 years.
• Content providers (such as Netflix) have plans to offer video in 4K.
Smartphones and Tablets
8
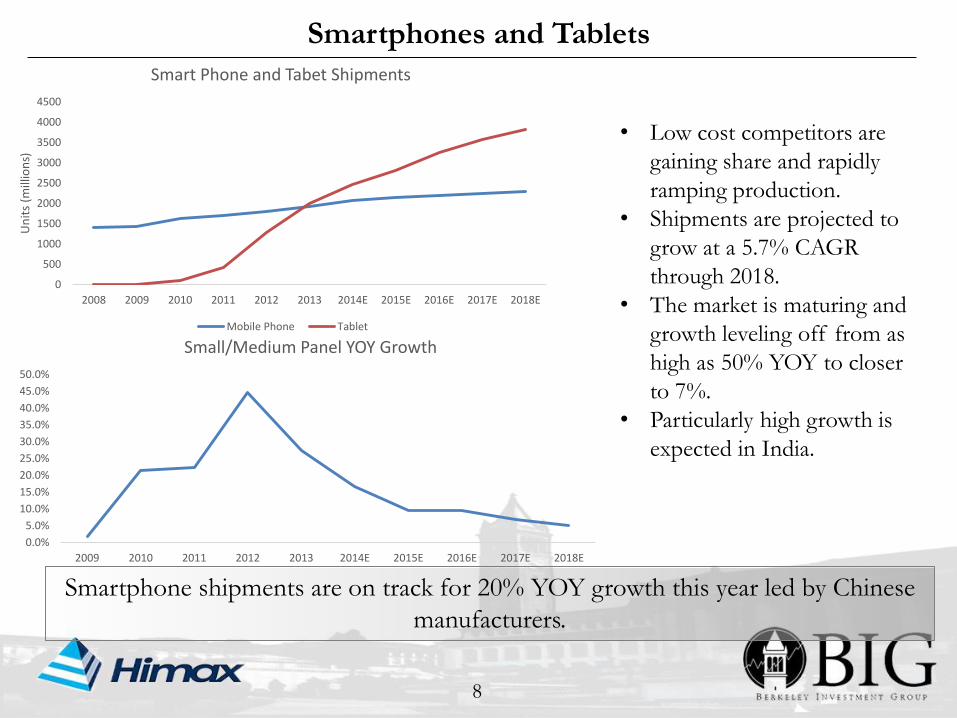
Smartphone shipments are on track for 20% YOY growth this year led by Chinese
manufacturers.
• Low cost competitors are
gaining share and rapidly
ramping production.
• Shipments are projected to
grow at a 5.7% CAGR
through 2018.
• The market is maturing and
growth leveling off from as
high as 50% YOY to closer
to 7%.
• Particularly high growth is
expected in India.
0
500
1000
1500
2000
2500
3000
3500
4000
4500
2008 2009 2010 2011 2012 2013 2014E 2015E 2016E 2017E 2018E
Un
its
(mill
ion
s)
Smart Phone and Tabet Shipments
Mobile Phone Tablet
0.0%
5.0%
10.0%
15.0%
20.0%
25.0%
30.0%
35.0%
40.0%
45.0%
50.0%
2009 2010 2011 2012 2013 2014E 2015E 2016E 2017E 2018E
Small/Medium Panel YOY Growth
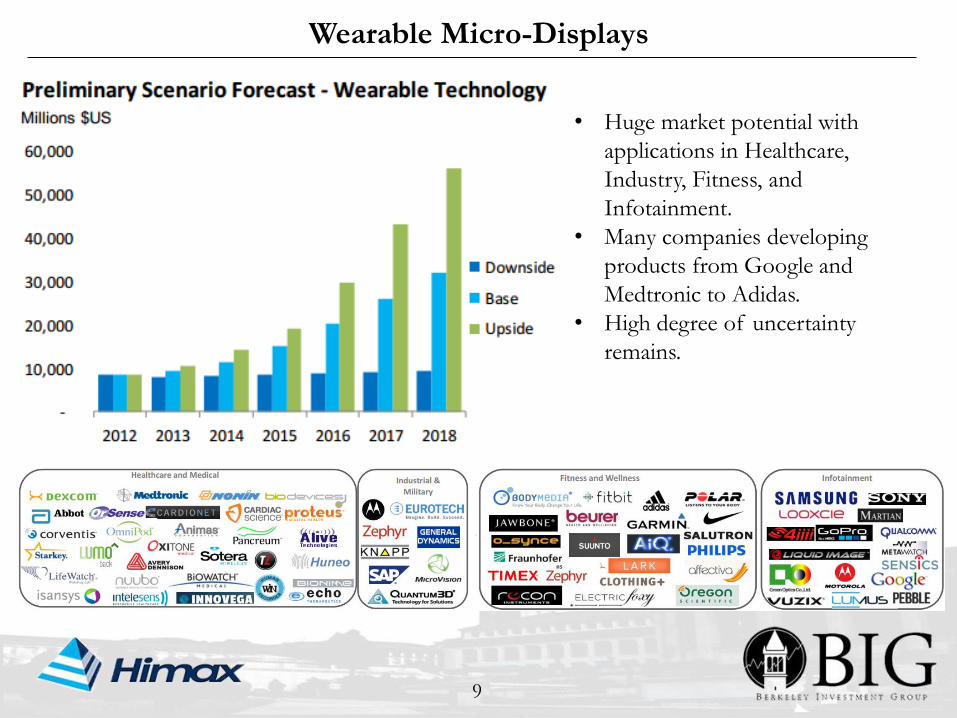
Wearable Micro-Displays
9
• Huge market potential with
applications in Healthcare,
Industry, Fitness, and
Infotainment.
• Many companies developing
products from Google and
Medtronic to Adidas.
• High degree of uncertainty
remains.
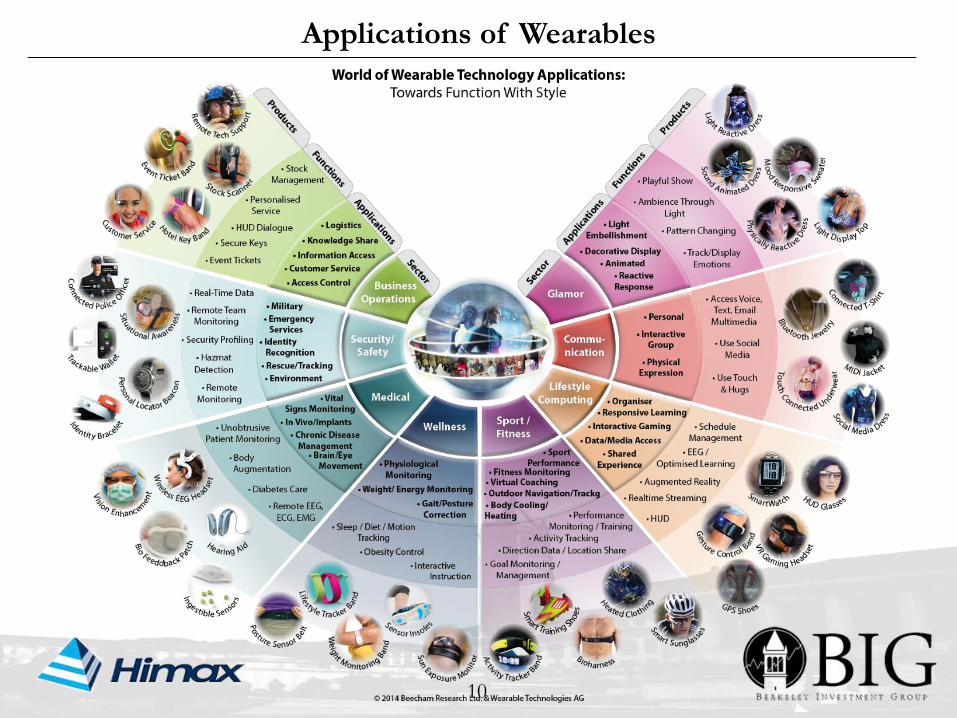
Applications of Wearables
10
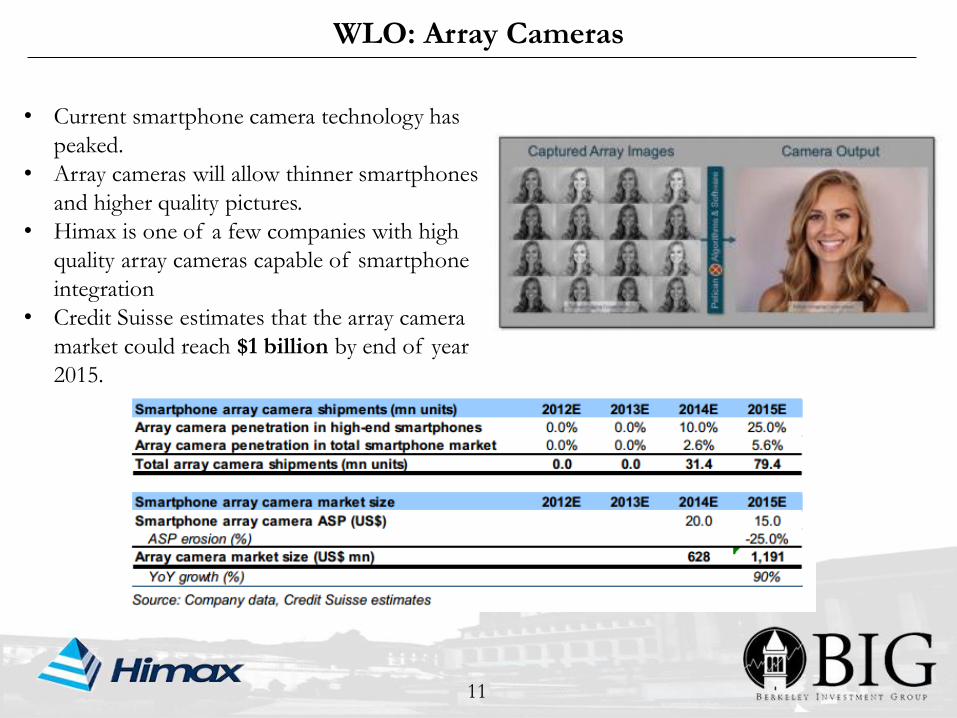
WLO: Array Cameras
11
• Current smartphone camera technology has
peaked.
• Array cameras will allow thinner smartphones
and higher quality pictures.
• Himax is one of a few companies with high
quality array cameras capable of smartphone
integration
• Credit Suisse estimates that the array camera
market could reach $1 billion by end of year
2015.

12
Company ThesisHimax Technologies (HIMX)
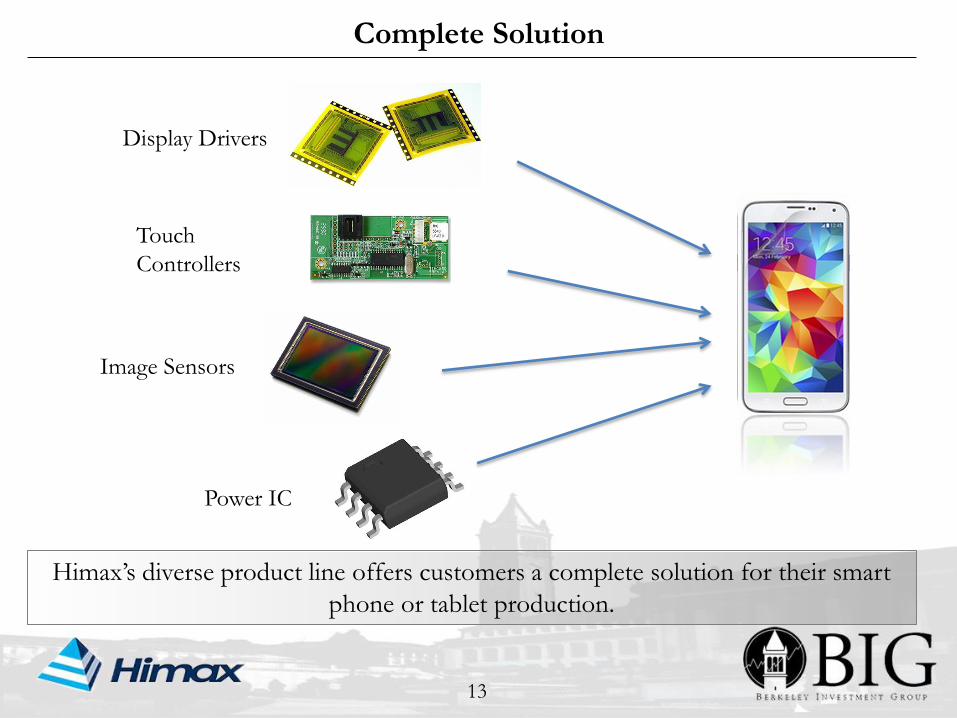
Complete Solution
13
Display Drivers
Touch
Controllers
Image Sensors
Himax’s diverse product line offers customers a complete solution for their smart
phone or tablet production.
Power IC
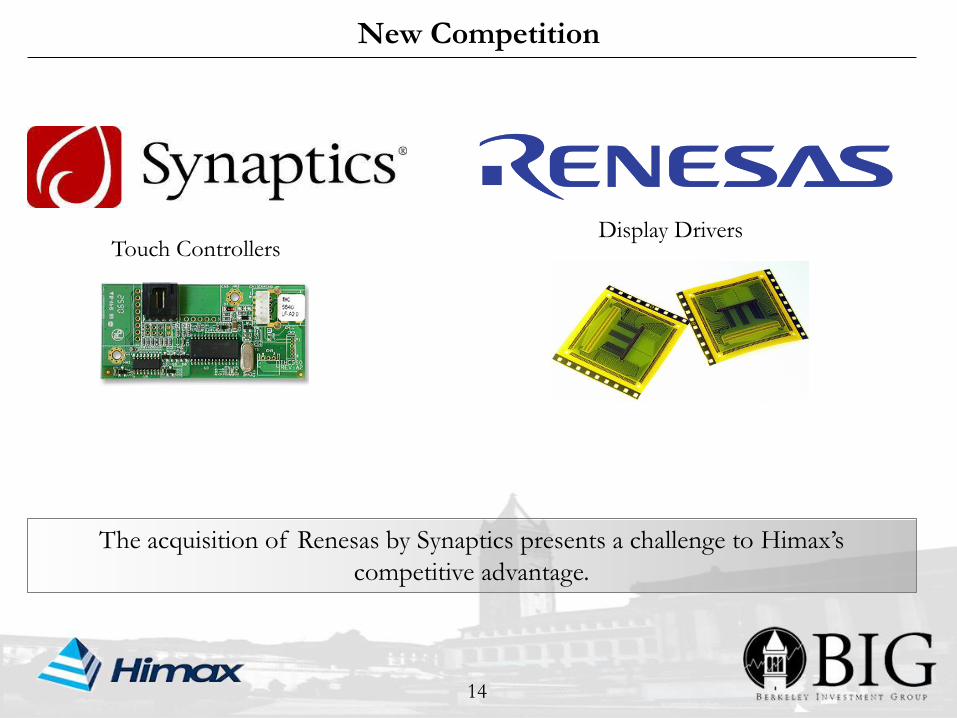
New Competition
14
The acquisition of Renesas by Synaptics presents a challenge to Himax’s
competitive advantage.
Display DriversTouch Controllers
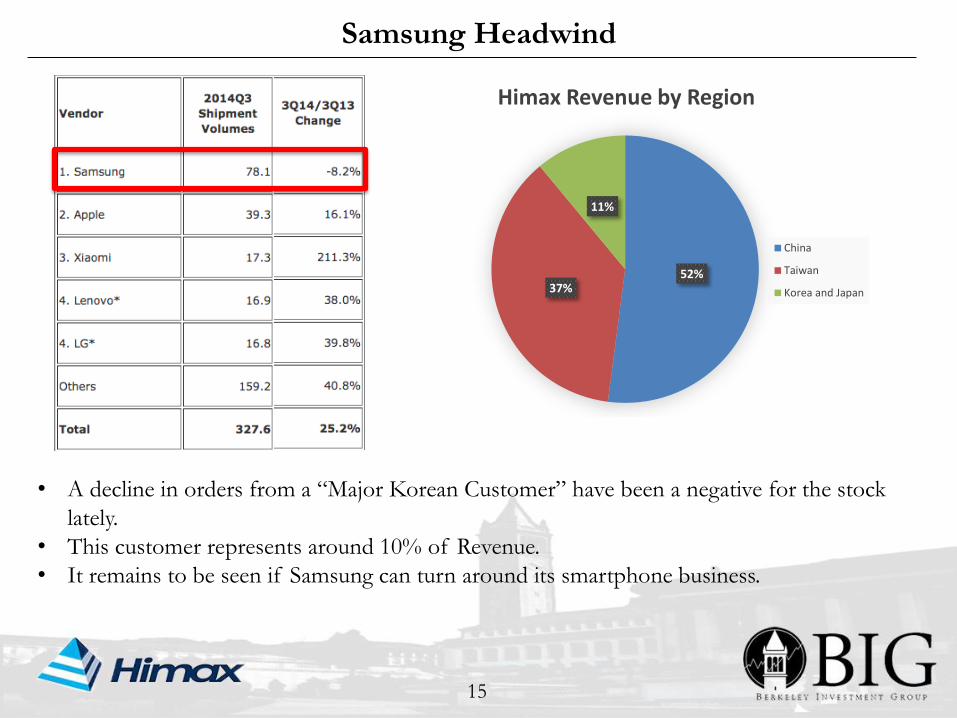
Samsung Headwind
15
• A decline in orders from a “Major Korean Customer” have been a negative for the stock
lately.
• This customer represents around 10% of Revenue.
• It remains to be seen if Samsung can turn around its smartphone business.
52%37%
11%
Himax Revenue by Region
China
Taiwan
Korea and Japan
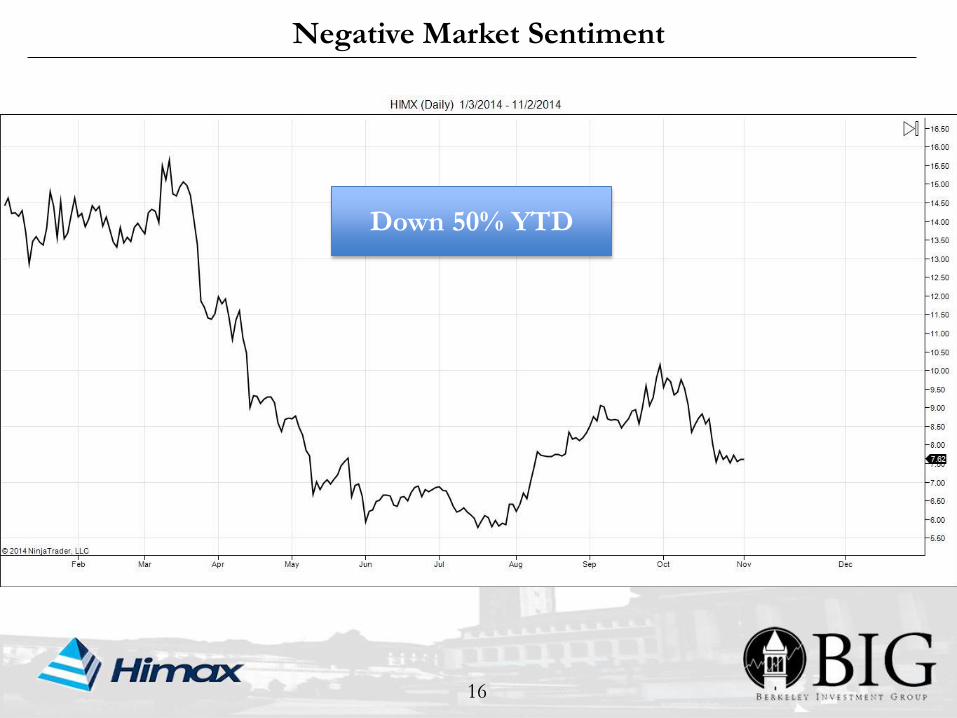
Negative Market Sentiment
16
Down 50% YTD
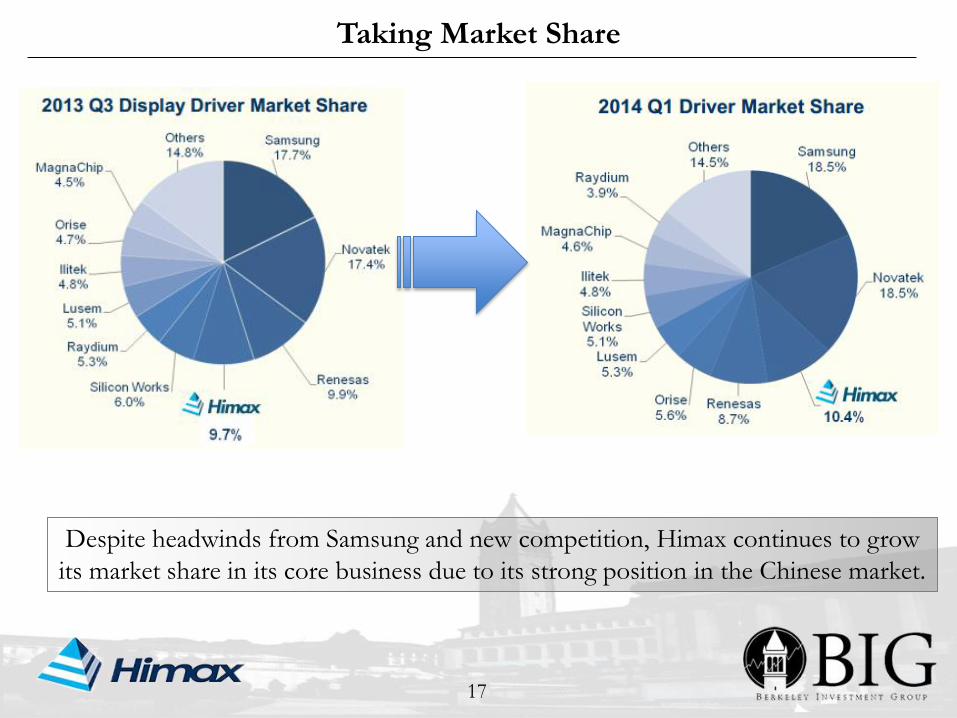
Taking Market Share
17
Despite headwinds from Samsung and new competition, Himax continues to grow
its market share in its core business due to its strong position in the Chinese market.
New Design Wins
18
+211%
+40%
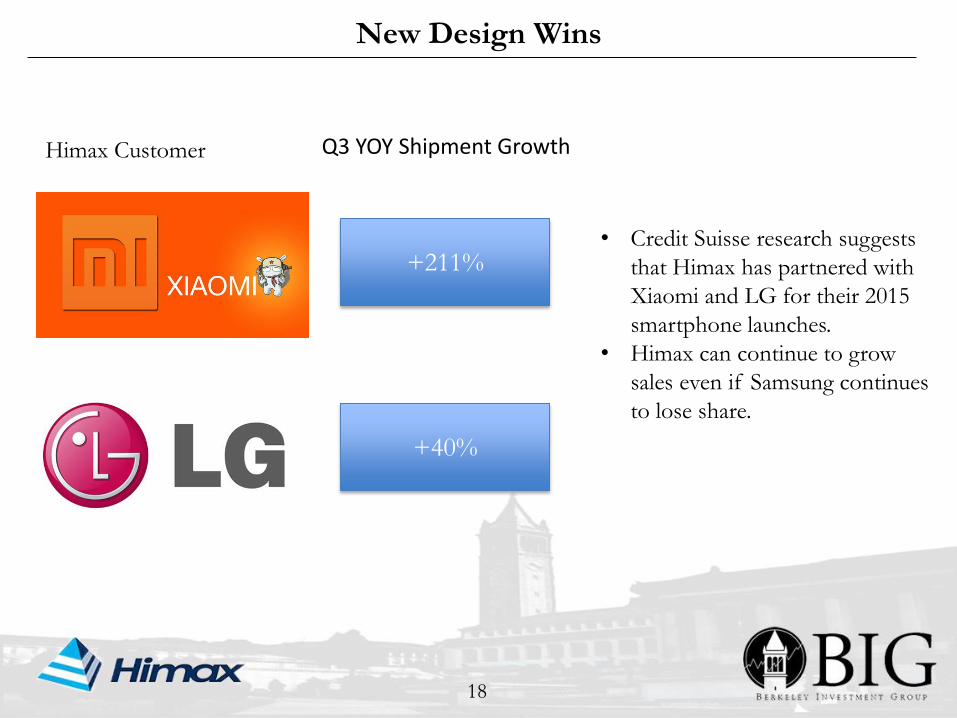
Himax Customer Q3 YOY Shipment Growth
• Credit Suisse research suggests
that Himax has partnered with
Xiaomi and LG for their 2015
smartphone launches.
• Himax can continue to grow
sales even if Samsung continues
to lose share.
Losing Google?
19
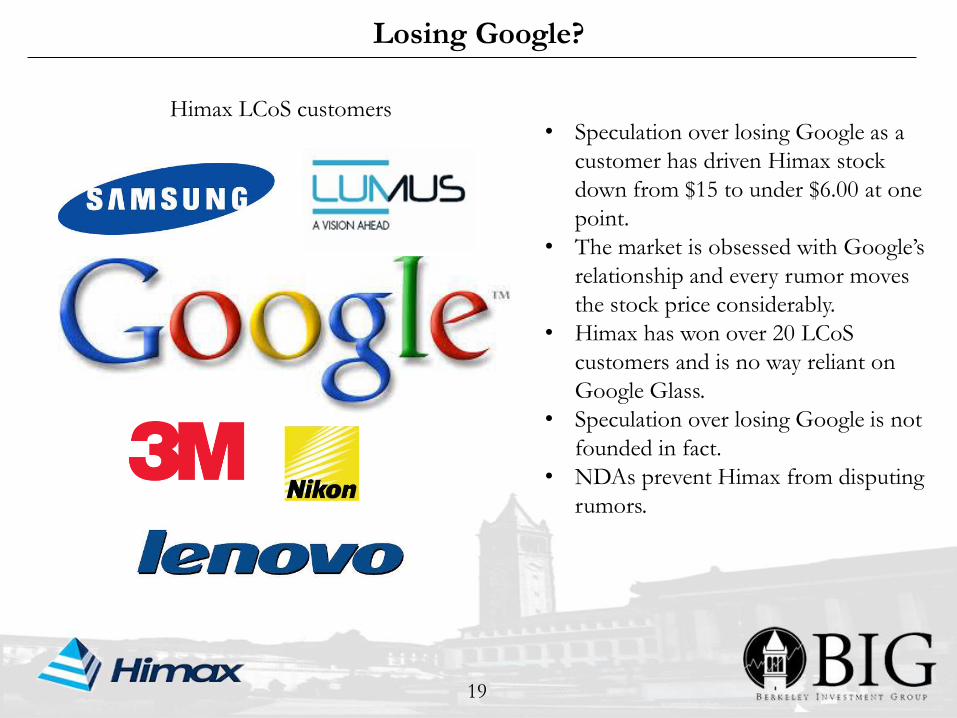
• Speculation over losing Google as a
customer has driven Himax stock
down from $15 to under $6.00 at one
point.
• The market is obsessed with Google’s
relationship and every rumor moves
the stock price considerably.
• Himax has won over 20 LCoS
customers and is no way reliant on
Google Glass.
• Speculation over losing Google is not
founded in fact.
• NDAs prevent Himax from disputing
rumors.
Himax LCoS customers
Wearables Market Leader
20
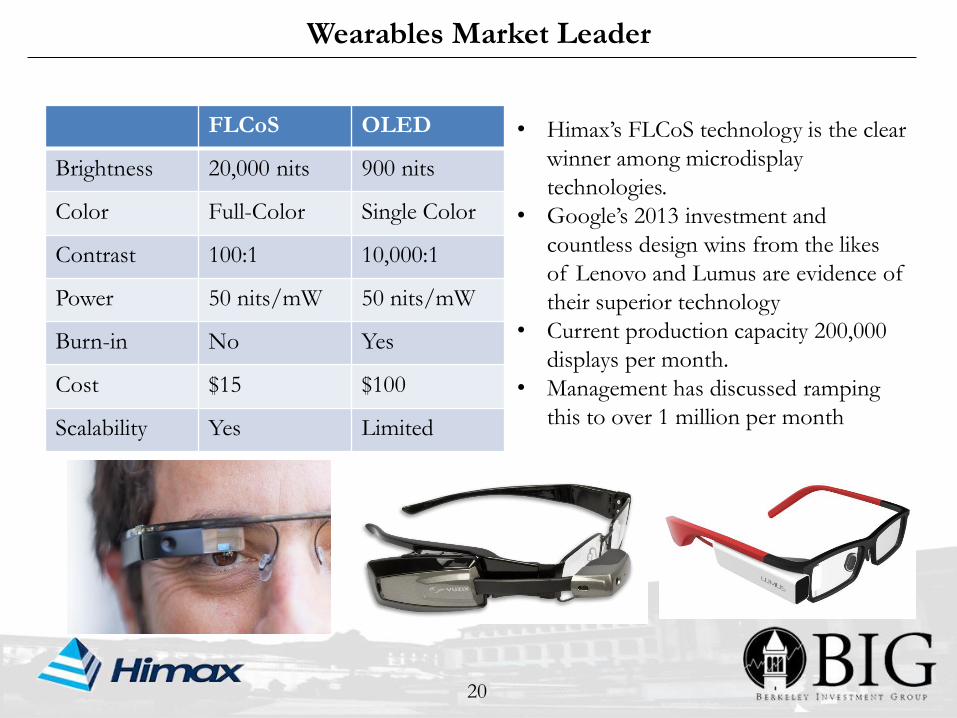
FLCoS OLED
Brightness 20,000 nits 900 nits
Color Full-Color Single Color
Contrast 100:1 10,000:1
Power 50 nits/mW 50 nits/mW
Burn-in No Yes
Cost $15 $100
Scalability Yes Limited
• Himax’s FLCoS technology is the clear
winner among microdisplay
technologies.
• Google’s 2013 investment and
countless design wins from the likes
of Lenovo and Lumus are evidence of
their superior technology
• Current production capacity 200,000
displays per month.
• Management has discussed ramping
this to over 1 million per month
Street Overly Cautious
21
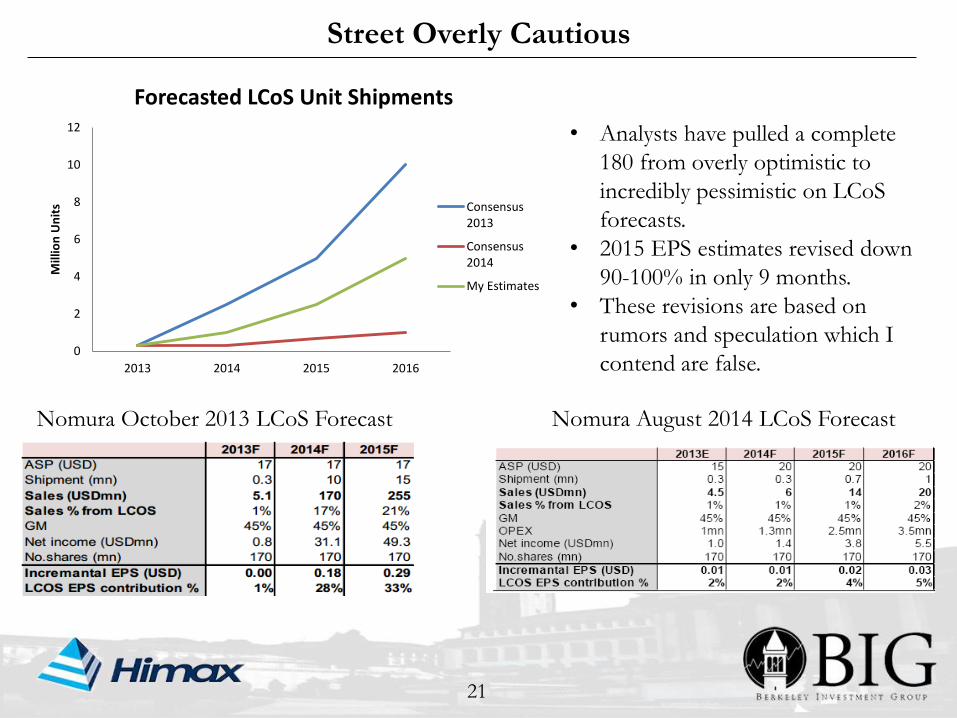
Nomura October 2013 LCoS Forecast Nomura August 2014 LCoS Forecast
• Analysts have pulled a complete
180 from overly optimistic to
incredibly pessimistic on LCoS
forecasts.
• 2015 EPS estimates revised down
90-100% in only 9 months.
• These revisions are based on
rumors and speculation which I
contend are false.0
2
4
6
8
10
12
2013 2014 2015 2016
Mill
ion
Un
its
Forecasted LCoS Unit Shipments
Consensus2013
Consensus2014
My Estimates
Returning Value to Shareholders
22
Dr. Biing-Seng Wu:
Founder Chairmen
of the board. 4.0%
7.0%
10.4%
9.1%
5.9%
3.4%
4.4%4.0%
5.4%
6.4%
0.0%
2.0%
4.0%
6.0%
8.0%
10.0%
12.0%
2007 2008 2009 2010 2011 2012 2013 2014 2015 2016
Dividend Yield
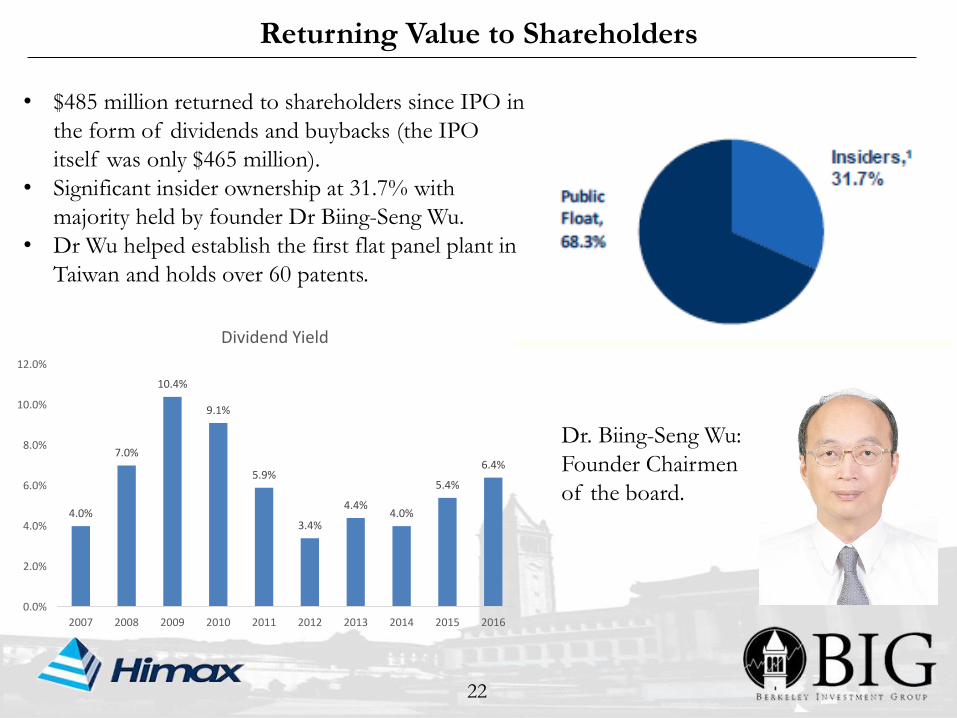
• $485 million returned to shareholders since IPO in
the form of dividends and buybacks (the IPO
itself was only $465 million).
• Significant insider ownership at 31.7% with
majority held by founder Dr Biing-Seng Wu.
• Dr Wu helped establish the first flat panel plant in
Taiwan and holds over 60 patents.

23
Valuation and Recommendation
Valuation Assumptions
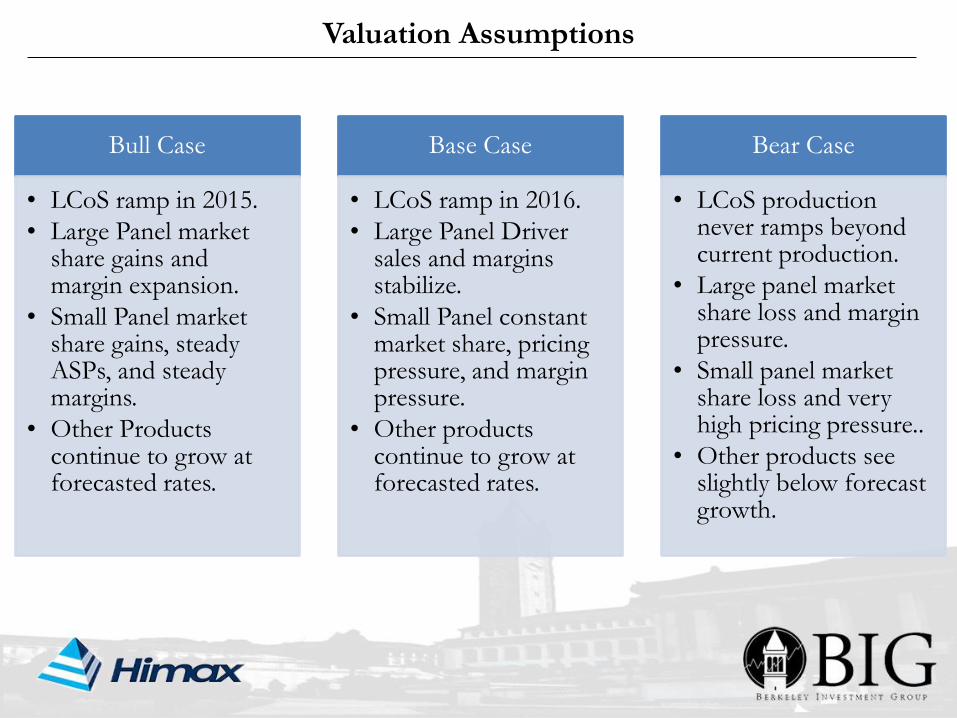
Bull Case
• LCoS ramp in 2015.
• Large Panel market share gains and margin expansion.
• Small Panel market share gains, steady ASPs, and steady margins.
• Other Products continue to grow at forecasted rates.
Base Case
• LCoS ramp in 2016.
• Large Panel Driver sales and margins stabilize.
• Small Panel constant market share, pricing pressure, and margin pressure.
• Other products continue to grow at forecasted rates.
Bear Case
• LCoS production never ramps beyond current production.
• Large panel market share loss and margin pressure.
• Small panel market share loss and very high pricing pressure..
• Other products see slightly below forecast growth.
Large Panel Projections
25
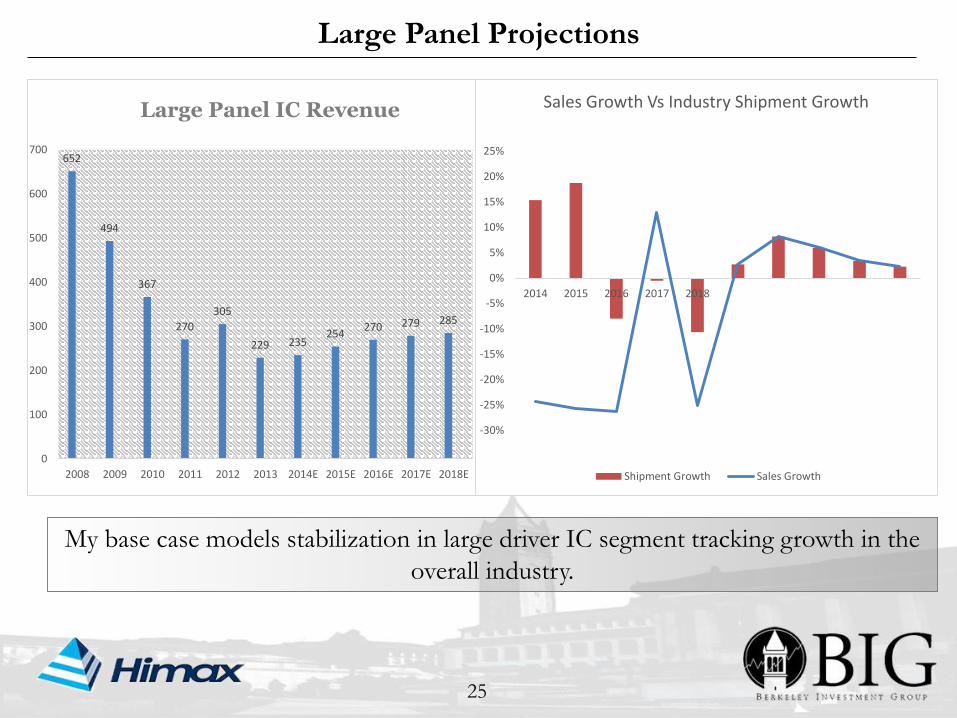
My base case models stabilization in large driver IC segment tracking growth in the
overall industry.
652
494
367
270
305
229 235254
270 279 285
0
100
200
300
400
500
600
700
2008 2009 2010 2011 2012 2013 2014E 2015E 2016E 2017E 2018E
Large Panel IC Revenue
-30%
-25%
-20%
-15%
-10%
-5%
0%
5%
10%
15%
20%
25%
2014 2015 2016 2017 2018
Sales Growth Vs Industry Shipment Growth
Shipment Growth Sales Growth
Small Panel Projections
26
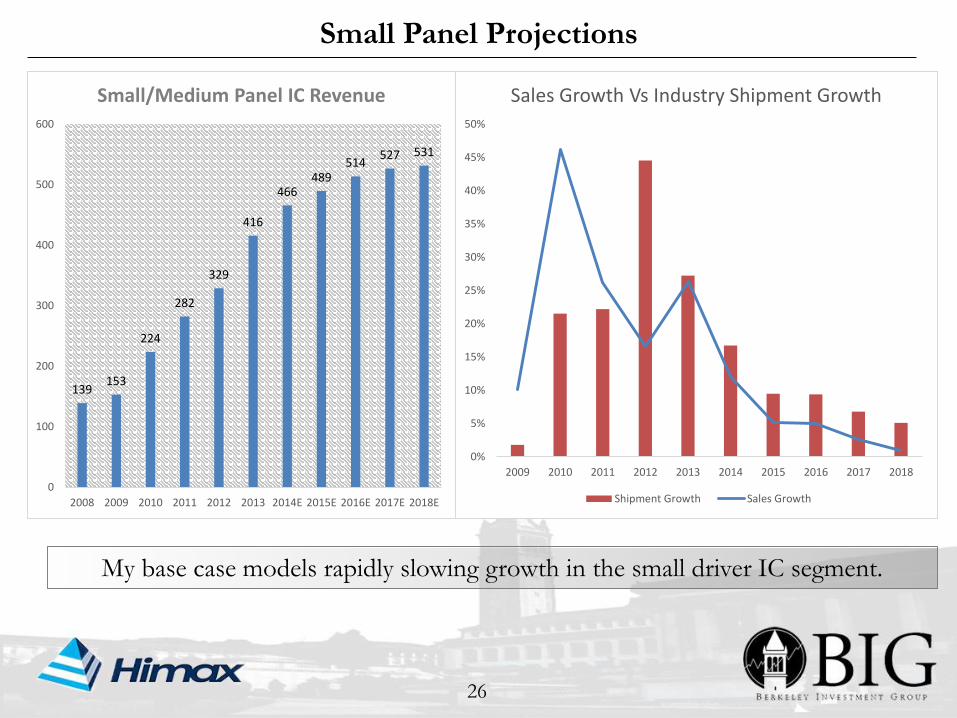
My base case models rapidly slowing growth in the small driver IC segment.
0%
5%
10%
15%
20%
25%
30%
35%
40%
45%
50%
2009 2010 2011 2012 2013 2014 2015 2016 2017 2018
Sales Growth Vs Industry Shipment Growth
Shipment Growth Sales Growth
139153
224
282
329
416
466489
514527 531
0
100
200
300
400
500
600
2008 2009 2010 2011 2012 2013 2014E 2015E 2016E 2017E 2018E
Small/Medium Panel IC Revenue
Non-Driver Projections
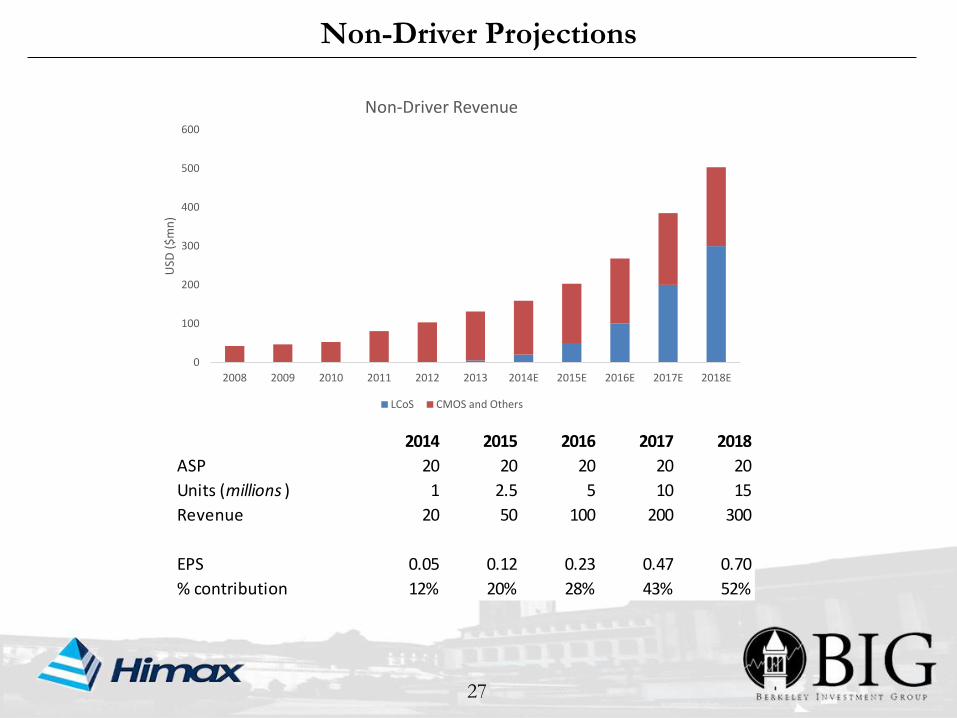
27
2014 2015 2016 2017 2018
ASP 20 20 20 20 20
Units (millions ) 1 2.5 5 10 15
Revenue 20 50 100 200 300
EPS 0.05 0.12 0.23 0.47 0.70
% contribution 12% 20% 28% 43% 52%
0
100
200
300
400
500
600
2008 2009 2010 2011 2012 2013 2014E 2015E 2016E 2017E 2018E
USD
($
mn
)
Non-Driver Revenue
LCoS CMOS and Others
Revenue and Earnings Mix
28
21.0%
22.0%
23.0%
24.0%
25.0%
26.0%
27.0%
28.0%
29.0%
30.0%
2013 2014E 2015E 2016E 2017E 2018E
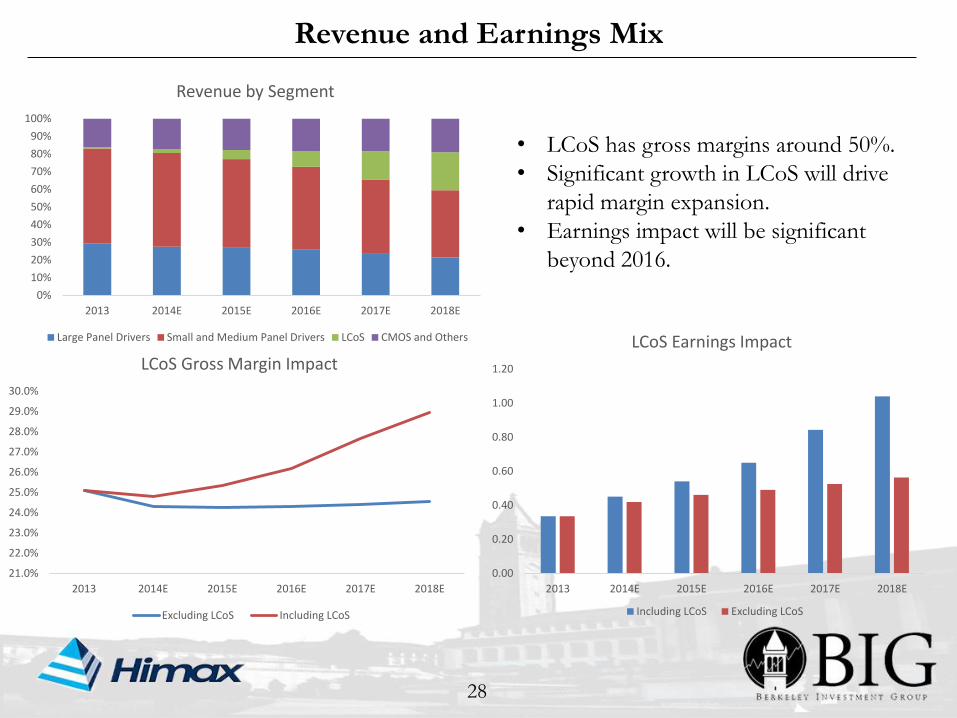
LCoS Gross Margin Impact
Excluding LCoS Including LCoS
0.00
0.20
0.40
0.60
0.80
1.00
1.20
2013 2014E 2015E 2016E 2017E 2018E
LCoS Earnings Impact
Including LCoS Excluding LCoS
• LCoS has gross margins around 50%.
• Significant growth in LCoS will drive
rapid margin expansion.
• Earnings impact will be significant
beyond 2016.
0%
10%
20%
30%
40%
50%
60%
70%
80%
90%
100%
2013 2014E 2015E 2016E 2017E 2018E
Revenue by Segment
Large Panel Drivers Small and Medium Panel Drivers LCoS CMOS and Others
29
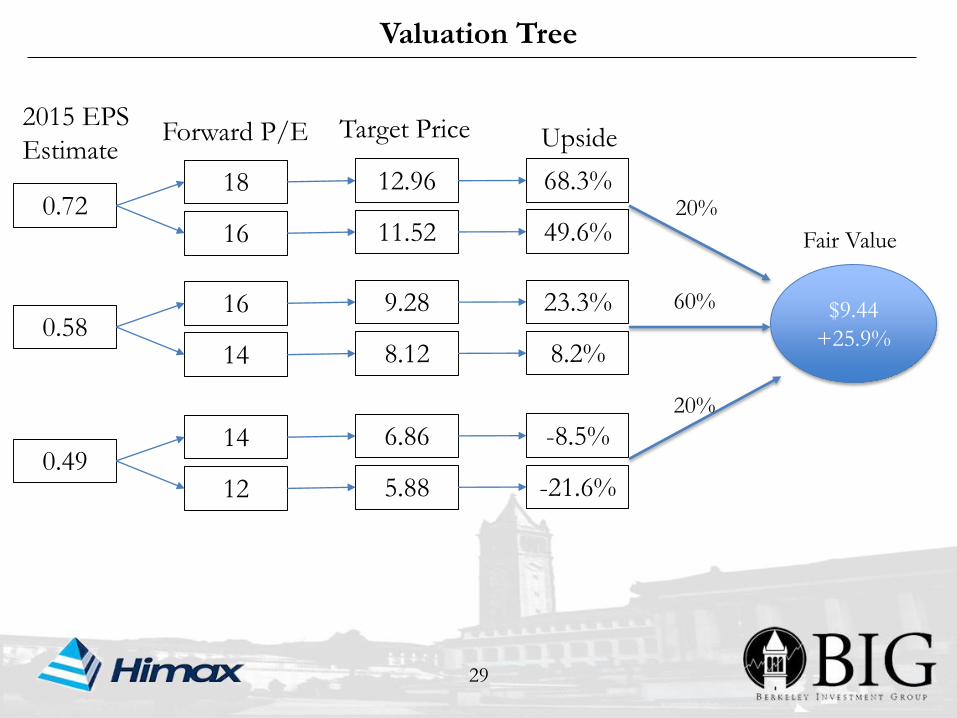
0.72
2015 EPS
Estimate
0.58
0.49
18
Forward P/E Target Price
16
16
14
14
12
12.96
11.52
9.28
8.12
6.86
5.88
Upside
68.3%
49.6%
23.3%
8.2%
-8.5%
-21.6%
20%
60% $9.44
+25.9%
20%
Fair Value
Valuation Tree
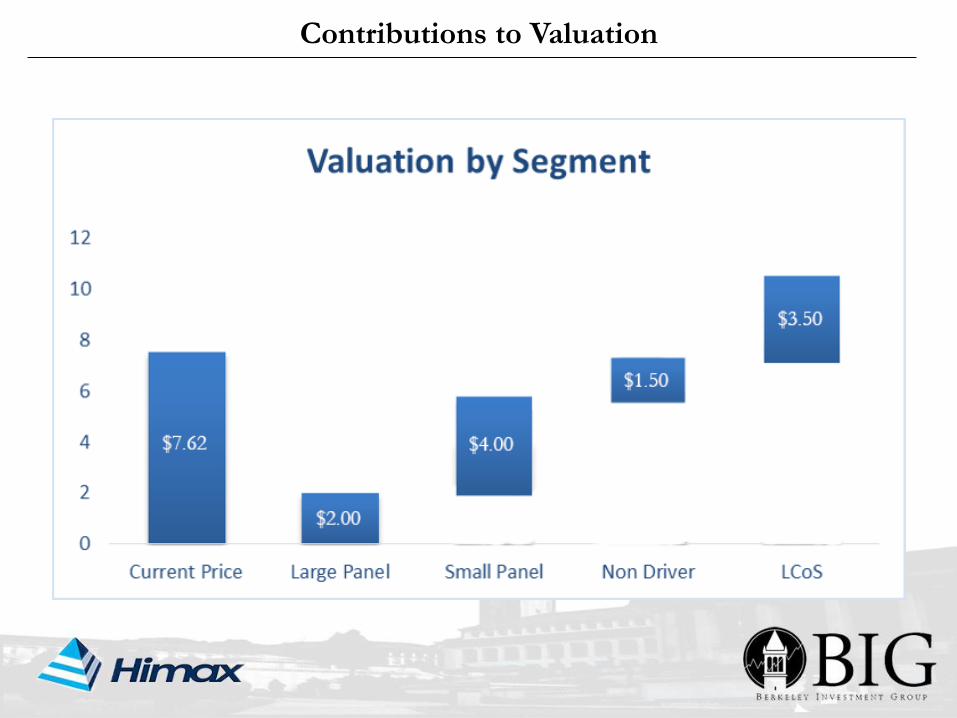
Contributions to Valuation
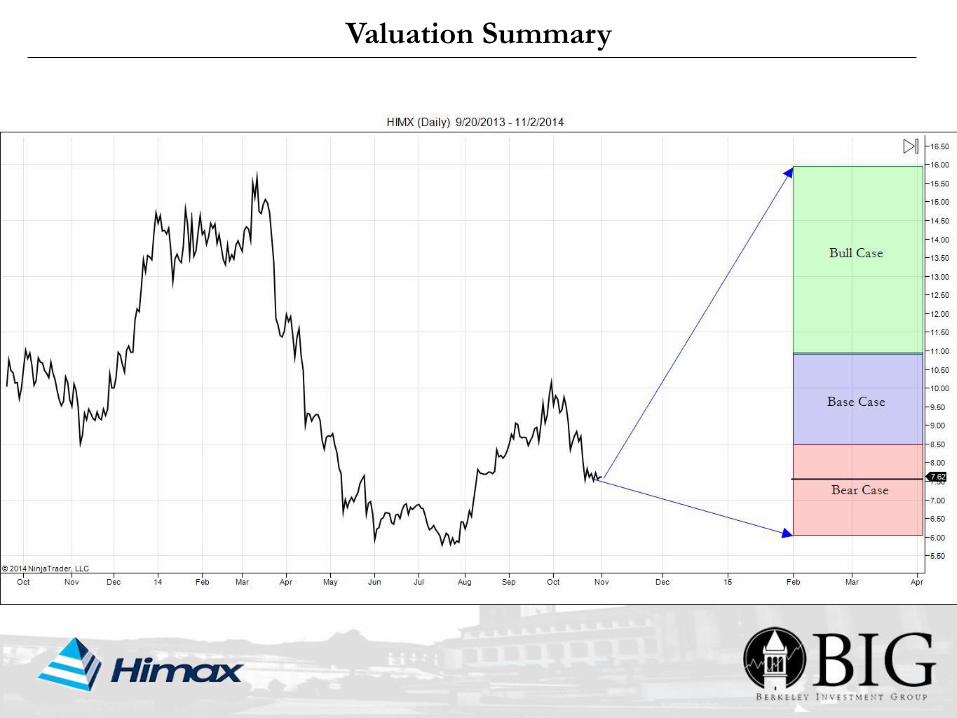
Valuation Summary
32
Appendix
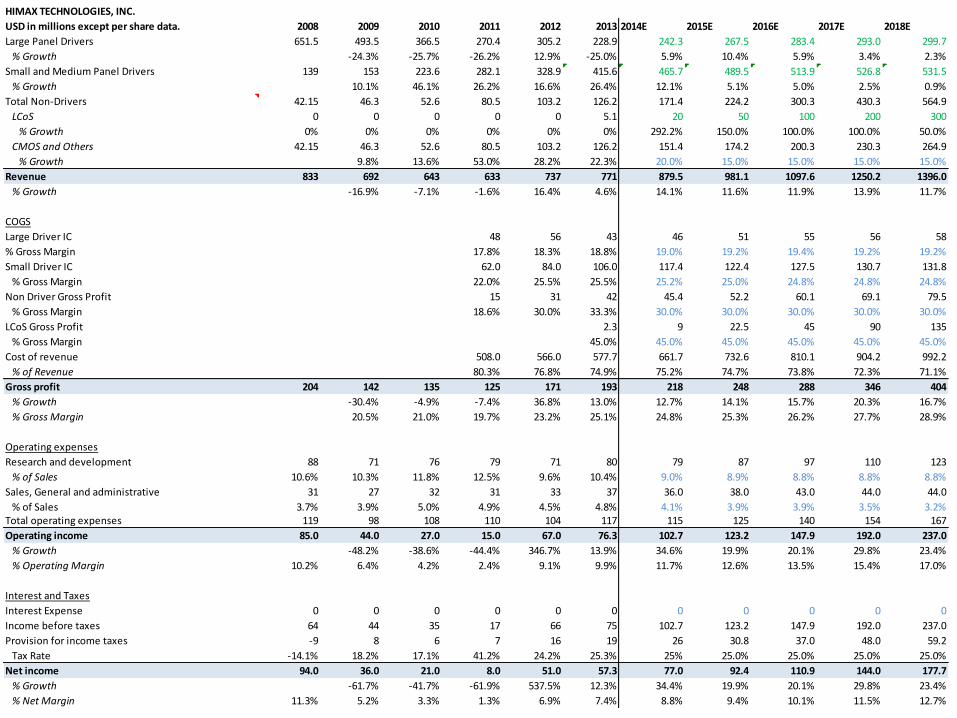
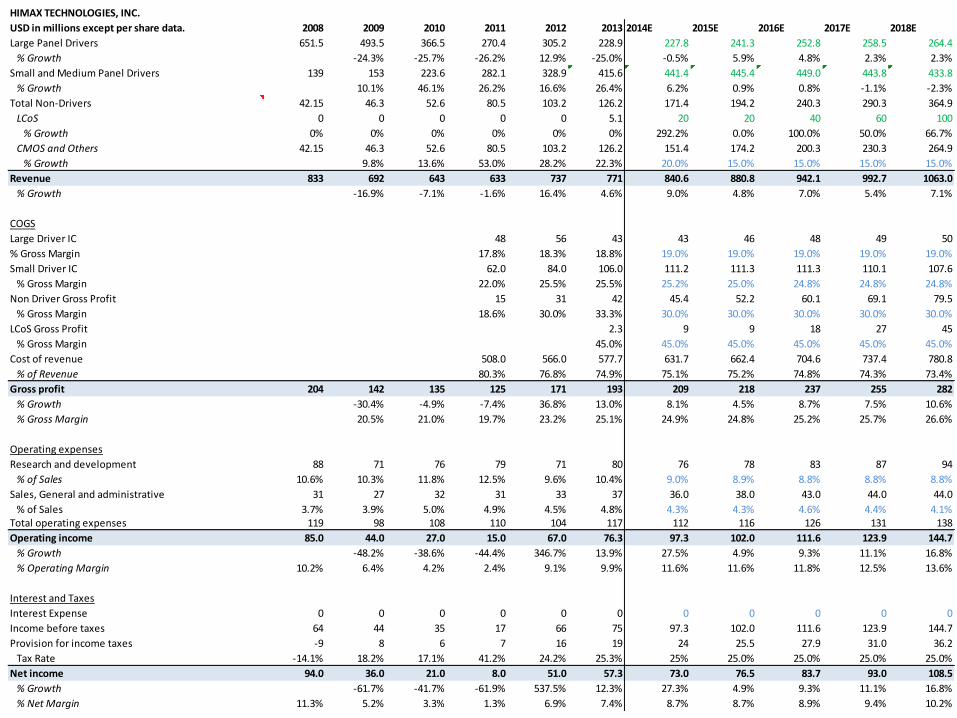
HIMAX TECHNOLOGIES, INC.
USD in millions except per share data. 2008 2009 2010 2011 2012 2013 2014E 2015E 2016E 2017E 2018E
Large Panel Drivers 651.5 493.5 366.5 270.4 305.2 228.9 242.3 267.5 283.4 293.0 299.7
% Growth -24.3% -25.7% -26.2% 12.9% -25.0% 5.9% 10.4% 5.9% 3.4% 2.3%
Small and Medium Panel Drivers 139 153 223.6 282.1 328.9 415.6 465.7 489.5 513.9 526.8 531.5
% Growth 10.1% 46.1% 26.2% 16.6% 26.4% 12.1% 5.1% 5.0% 2.5% 0.9%
Total Non-Drivers 42.15 46.3 52.6 80.5 103.2 126.2 171.4 224.2 300.3 430.3 564.9
LCoS 0 0 0 0 0 5.1 20 50 100 200 300
% Growth 0% 0% 0% 0% 0% 0% 292.2% 150.0% 100.0% 100.0% 50.0%
CMOS and Others 42.15 46.3 52.6 80.5 103.2 126.2 151.4 174.2 200.3 230.3 264.9
% Growth 9.8% 13.6% 53.0% 28.2% 22.3% 20.0% 15.0% 15.0% 15.0% 15.0%
Revenue 833 692 643 633 737 771 879.5 981.1 1097.6 1250.2 1396.0
% Growth -16.9% -7.1% -1.6% 16.4% 4.6% 14.1% 11.6% 11.9% 13.9% 11.7%
COGS
Large Driver IC 48 56 43 46 51 55 56 58
% Gross Margin 17.8% 18.3% 18.8% 19.0% 19.2% 19.4% 19.2% 19.2%
Small Driver IC 62.0 84.0 106.0 117.4 122.4 127.5 130.7 131.8
% Gross Margin 22.0% 25.5% 25.5% 25.2% 25.0% 24.8% 24.8% 24.8%
Non Driver Gross Profit 15 31 42 45.4 52.2 60.1 69.1 79.5
% Gross Margin 18.6% 30.0% 33.3% 30.0% 30.0% 30.0% 30.0% 30.0%
LCoS Gross Profit 2.3 9 22.5 45 90 135
% Gross Margin 45.0% 45.0% 45.0% 45.0% 45.0% 45.0%
Cost of revenue 508.0 566.0 577.7 661.7 732.6 810.1 904.2 992.2
% of Revenue 80.3% 76.8% 74.9% 75.2% 74.7% 73.8% 72.3% 71.1%
Gross profit 204 142 135 125 171 193 218 248 288 346 404
% Growth -30.4% -4.9% -7.4% 36.8% 13.0% 12.7% 14.1% 15.7% 20.3% 16.7%
% Gross Margin 20.5% 21.0% 19.7% 23.2% 25.1% 24.8% 25.3% 26.2% 27.7% 28.9%
Operating expenses
Research and development 88 71 76 79 71 80 79 87 97 110 123
% of Sales 10.6% 10.3% 11.8% 12.5% 9.6% 10.4% 9.0% 8.9% 8.8% 8.8% 8.8%
Sales, General and administrative 31 27 32 31 33 37 36.0 38.0 43.0 44.0 44.0
% of Sales 3.7% 3.9% 5.0% 4.9% 4.5% 4.8% 4.1% 3.9% 3.9% 3.5% 3.2%Total operating expenses 119 98 108 110 104 117 115 125 140 154 167
Operating income 85.0 44.0 27.0 15.0 67.0 76.3 102.7 123.2 147.9 192.0 237.0
% Growth -48.2% -38.6% -44.4% 346.7% 13.9% 34.6% 19.9% 20.1% 29.8% 23.4%
% Operating Margin 10.2% 6.4% 4.2% 2.4% 9.1% 9.9% 11.7% 12.6% 13.5% 15.4% 17.0%
Interest and Taxes
Interest Expense 0 0 0 0 0 0 0 0 0 0 0
Income before taxes 64 44 35 17 66 75 102.7 123.2 147.9 192.0 237.0
Provision for income taxes -9 8 6 7 16 19 26 30.8 37.0 48.0 59.2
Tax Rate -14.1% 18.2% 17.1% 41.2% 24.2% 25.3% 25% 25.0% 25.0% 25.0% 25.0%
Net income 94.0 36.0 21.0 8.0 51.0 57.3 77.0 92.4 110.9 144.0 177.7
% Growth -61.7% -41.7% -61.9% 537.5% 12.3% 34.4% 19.9% 20.1% 29.8% 23.4%
% Net Margin 11.3% 5.2% 3.3% 1.3% 6.9% 7.4% 8.8% 9.4% 10.1% 11.5% 12.7%
HIMAX TECHNOLOGIES, INC.
USD in millions except per share data. 2008 2009 2010 2011 2012 2013 2014E 2015E 2016E 2017E 2018E
Large Panel Drivers 651.5 493.5 366.5 270.4 305.2 228.9 252.1 283.8 306.4 316.8 324.0
% Growth -24.3% -25.7% -26.2% 12.9% -25.0% 10.2% 12.5% 8.0% 3.4% 2.3%
Small and Medium Panel Drivers 139 153 223.6 282.1 328.9 415.6 495.7 554.2 618.8 660.8 694.3
% Growth 10.1% 46.1% 26.2% 16.6% 26.4% 19.3% 11.8% 11.7% 6.8% 5.1%
Total Non-Drivers 42.15 46.3 52.6 80.5 103.2 126.2 171.4 274.2 400.3 530.3 664.9
LCoS 0 0 0 0 0 5.1 20 100 200 300 400
% Growth 0% 0% 0% 0% 0% 0% 292.2% 400.0% 100.0% 50.0% 33.3%
CMOS and Others 42.15 46.3 52.6 80.5 103.2 126.2 151.4 174.2 200.3 230.3 264.9
% Growth 9.8% 13.6% 53.0% 28.2% 22.3% 20.0% 15.0% 15.0% 15.0% 15.0%
Revenue 833 692 643 633 737 771 919.3 1112.1 1325.5 1507.9 1683.2
% Growth -16.9% -7.1% -1.6% 16.4% 4.6% 19.2% 21.0% 19.2% 13.8% 11.6%
COGS
Large Driver IC 48 56 43 48 55 60 62 64
% Gross Margin 17.8% 18.3% 18.8% 19.2% 19.5% 19.6% 19.6% 19.6%
Small Driver IC 62.0 84.0 106.0 127.4 143.5 161.5 173.8 184.0
% Gross Margin 22.0% 25.5% 25.5% 25.7% 25.9% 26.1% 26.3% 26.5%
Non Driver Gross Profit 15 31 42 45.4 52.2 60.1 69.1 79.5
% Gross Margin 18.6% 30.0% 33.3% 30.0% 30.0% 30.0% 30.0% 30.0%
LCoS Gross Profit 2.3 9 50 100 150 200
% Gross Margin 45.0% 45.0% 50.0% 50.0% 50.0% 50.0%
Cost of revenue 508.0 566.0 577.7 689.0 811.0 943.8 1052.9 1156.2
% of Revenue 80.3% 76.8% 74.9% 75.0% 72.9% 71.2% 69.8% 68.7%
Gross profit 204 142 135 125 171 193 230 301 382 455 527
% Growth -30.4% -4.9% -7.4% 36.8% 13.0% 19.1% 30.8% 26.7% 19.2% 15.8%
% Gross Margin 20.5% 21.0% 19.7% 23.2% 25.1% 25.0% 27.1% 28.8% 30.2% 31.3%
Operating expenses
Research and development 88 71 76 79 71 80 83 99 117 133 148
% of Sales 10.6% 10.3% 11.8% 12.5% 9.6% 10.4% 9.0% 8.9% 8.8% 8.8% 8.8%
Sales, General and administrative 31 27 32 31 33 37 36.0 38.0 43.0 44.0 44.0
% of Sales 3.7% 3.9% 5.0% 4.9% 4.5% 4.8% 3.9% 3.4% 3.2% 2.9% 2.6%Total operating expenses 119 98 108 110 104 117 119 137 160 177 192
Operating income 85.0 44.0 27.0 15.0 67.0 76.3 111.5 164.1 222.0 278.3 334.8
% Growth -48.2% -38.6% -44.4% 346.7% 13.9% 46.1% 47.2% 35.3% 25.3% 20.3%
% Operating Margin 10.2% 6.4% 4.2% 2.4% 9.1% 9.9% 12.1% 14.8% 16.7% 18.5% 19.9%
Interest and Taxes
Interest Expense 0 0 0 0 0 0 0 0 0 0 0
Income before taxes 64 44 35 17 66 75 111.5 164.1 222.0 278.3 334.8
Provision for income taxes -9 8 6 7 16 19 28 41.0 55.5 69.6 83.7
Tax Rate -14.1% 18.2% 17.1% 41.2% 24.2% 25.3% 25% 25.0% 25.0% 25.0% 25.0%
Net income 94.0 36.0 21.0 8.0 51.0 57.3 83.6 123.1 166.5 208.7 251.1
% Growth -61.7% -41.7% -61.9% 537.5% 12.3% 46.0% 47.2% 35.3% 25.3% 20.3%
% Net Margin 11.3% 5.2% 3.3% 1.3% 6.9% 7.4% 9.1% 11.1% 12.6% 13.8% 14.9%
HIMAX TECHNOLOGIES, INC.
USD in millions except per share data. 2008 2009 2010 2011 2012 2013 2014E 2015E 2016E 2017E 2018E
Large Panel Drivers 651.5 493.5 366.5 270.4 305.2 228.9 227.8 241.3 252.8 258.5 264.4
% Growth -24.3% -25.7% -26.2% 12.9% -25.0% -0.5% 5.9% 4.8% 2.3% 2.3%
Small and Medium Panel Drivers 139 153 223.6 282.1 328.9 415.6 441.4 445.4 449.0 443.8 433.8
% Growth 10.1% 46.1% 26.2% 16.6% 26.4% 6.2% 0.9% 0.8% -1.1% -2.3%
Total Non-Drivers 42.15 46.3 52.6 80.5 103.2 126.2 171.4 194.2 240.3 290.3 364.9
LCoS 0 0 0 0 0 5.1 20 20 40 60 100
% Growth 0% 0% 0% 0% 0% 0% 292.2% 0.0% 100.0% 50.0% 66.7%
CMOS and Others 42.15 46.3 52.6 80.5 103.2 126.2 151.4 174.2 200.3 230.3 264.9
% Growth 9.8% 13.6% 53.0% 28.2% 22.3% 20.0% 15.0% 15.0% 15.0% 15.0%
Revenue 833 692 643 633 737 771 840.6 880.8 942.1 992.7 1063.0
% Growth -16.9% -7.1% -1.6% 16.4% 4.6% 9.0% 4.8% 7.0% 5.4% 7.1%
COGS
Large Driver IC 48 56 43 43 46 48 49 50
% Gross Margin 17.8% 18.3% 18.8% 19.0% 19.0% 19.0% 19.0% 19.0%
Small Driver IC 62.0 84.0 106.0 111.2 111.3 111.3 110.1 107.6
% Gross Margin 22.0% 25.5% 25.5% 25.2% 25.0% 24.8% 24.8% 24.8%
Non Driver Gross Profit 15 31 42 45.4 52.2 60.1 69.1 79.5
% Gross Margin 18.6% 30.0% 33.3% 30.0% 30.0% 30.0% 30.0% 30.0%
LCoS Gross Profit 2.3 9 9 18 27 45
% Gross Margin 45.0% 45.0% 45.0% 45.0% 45.0% 45.0%
Cost of revenue 508.0 566.0 577.7 631.7 662.4 704.6 737.4 780.8
% of Revenue 80.3% 76.8% 74.9% 75.1% 75.2% 74.8% 74.3% 73.4%
Gross profit 204 142 135 125 171 193 209 218 237 255 282
% Growth -30.4% -4.9% -7.4% 36.8% 13.0% 8.1% 4.5% 8.7% 7.5% 10.6%
% Gross Margin 20.5% 21.0% 19.7% 23.2% 25.1% 24.9% 24.8% 25.2% 25.7% 26.6%
Operating expenses
Research and development 88 71 76 79 71 80 76 78 83 87 94
% of Sales 10.6% 10.3% 11.8% 12.5% 9.6% 10.4% 9.0% 8.9% 8.8% 8.8% 8.8%
Sales, General and administrative 31 27 32 31 33 37 36.0 38.0 43.0 44.0 44.0
% of Sales 3.7% 3.9% 5.0% 4.9% 4.5% 4.8% 4.3% 4.3% 4.6% 4.4% 4.1%Total operating expenses 119 98 108 110 104 117 112 116 126 131 138
Operating income 85.0 44.0 27.0 15.0 67.0 76.3 97.3 102.0 111.6 123.9 144.7
% Growth -48.2% -38.6% -44.4% 346.7% 13.9% 27.5% 4.9% 9.3% 11.1% 16.8%
% Operating Margin 10.2% 6.4% 4.2% 2.4% 9.1% 9.9% 11.6% 11.6% 11.8% 12.5% 13.6%
Interest and Taxes
Interest Expense 0 0 0 0 0 0 0 0 0 0 0
Income before taxes 64 44 35 17 66 75 97.3 102.0 111.6 123.9 144.7
Provision for income taxes -9 8 6 7 16 19 24 25.5 27.9 31.0 36.2
Tax Rate -14.1% 18.2% 17.1% 41.2% 24.2% 25.3% 25% 25.0% 25.0% 25.0% 25.0%
Net income 94.0 36.0 21.0 8.0 51.0 57.3 73.0 76.5 83.7 93.0 108.5
% Growth -61.7% -41.7% -61.9% 537.5% 12.3% 27.3% 4.9% 9.3% 11.1% 16.8%
% Net Margin 11.3% 5.2% 3.3% 1.3% 6.9% 7.4% 8.7% 8.7% 8.9% 9.4% 10.2%
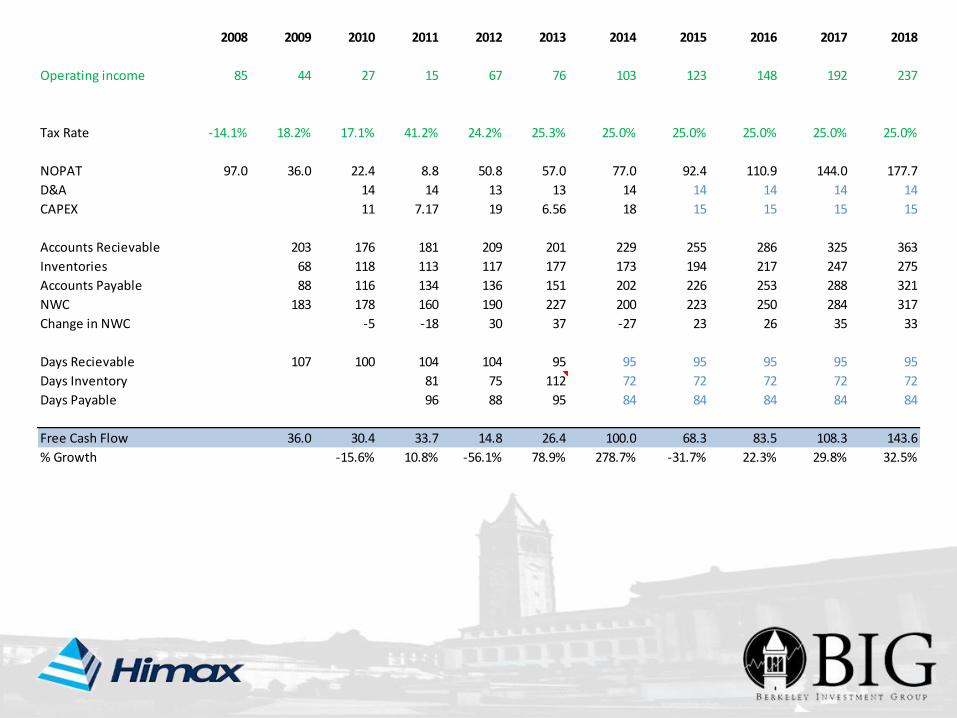
2008 2009 2010 2011 2012 2013 2014 2015 2016 2017 2018
Operating income 85 44 27 15 67 76 103 123 148 192 237
Tax Rate -14.1% 18.2% 17.1% 41.2% 24.2% 25.3% 25.0% 25.0% 25.0% 25.0% 25.0%
NOPAT 97.0 36.0 22.4 8.8 50.8 57.0 77.0 92.4 110.9 144.0 177.7
D&A 14 14 13 13 14 14 14 14 14
CAPEX 11 7.17 19 6.56 18 15 15 15 15
Accounts Recievable 203 176 181 209 201 229 255 286 325 363
Inventories 68 118 113 117 177 173 194 217 247 275
Accounts Payable 88 116 134 136 151 202 226 253 288 321
NWC 183 178 160 190 227 200 223 250 284 317
Change in NWC -5 -18 30 37 -27 23 26 35 33
Days Recievable 107 100 104 104 95 95 95 95 95 95
Days Inventory 81 75 112 72 72 72 72 72
Days Payable 96 88 95 84 84 84 84 84
Free Cash Flow 36.0 30.4 33.7 14.8 26.4 100.0 68.3 83.5 108.3 143.6
% Growth -15.6% 10.8% -56.1% 78.9% 278.7% -31.7% 22.3% 29.8% 32.5%


![Fundamental Properties and Optimal Gains of a Steady …file.scirp.org/pdf/ARS_2014061110444755.pdfK. Saho 64 1) Random velocity process noise model [7] [8]: let w(k) of Equation (1)](https://img.pdfslide.net/doc/110x75/5af0ee227f8b9ad0618ebb8f/fundamental-properties-and-optimal-gains-of-a-steady-filescirporgpdfars.jpg)