Embed Size (px)
Citation preview

Hincks Avenue Primary School Annual Report
2013

Hincks Avenue Primary School Annual Report 2013
Page 1
GOVERNING COUNCIL REPORT
As usual Hincks Avenue Primary School has continued to be a busy place. I would like to thank my fellow councillors for their support in 2013, Matt Trigwell, Kerry Traum, Cathy Hutchinson and Marilyn Blieschke. The teaching and support staff have also given their time to attend meetings as well as helping to strive for continued improvement at Hincks Avenue Primary School.
I believe that the improvement in attendance has been one of the most important highlights for the school and the students have certainly looked forward to assembly to receive acknowledgement of their efforts. The students love assembly and enjoy this time to focus on success and showcase their learning.
This year we trialled a Twilight Sports Carnival and this was met with some success and mixed feelings in the school community. A number of classes went on camp including Stephenie Herbert’s class who went to Errappa, Iron Knob, for an overnight stay. And Kylie Thorpe and Prue Lange’s class were also joined by some students from Nikki Dormand’s class, they visited Thuruna. It was also a terrific opportunity for the students from the special class to join the other classes for a night. This was greatly supported.
At the final meeting for 2013 it was decided that we would offer the opportunity for parents/carers to purchase school lunches on Tuesday and Thursday only, this would support the front office staff in their daily duties.
Late in term 4 Mrs Linda Weetra informed me that she had won a Principal position in Adelaide, Black Forest Primary School. Linda has over a period of 7 years developed a culture of success, strength in community and a fierce commitment to Hincks Avenue Primary School. Although I felt saddened that she was leaving us I thought “how lucky is the school she is moving to.” Linda has ensured that setting the bar high for all students and through the development of whole school agreements the school has been successful academically and supporting the learning of all students. Thank you Linda for all that you have done for our school and your many hours of work and we wish you all the very best at your new school.
I have no doubt that 2014 will be full of exciting learning and even greater success due to the path Linda has set our school on.
Aaron Wilson Governing Council Chairperson
Annual Report 2013
Page 1
Context
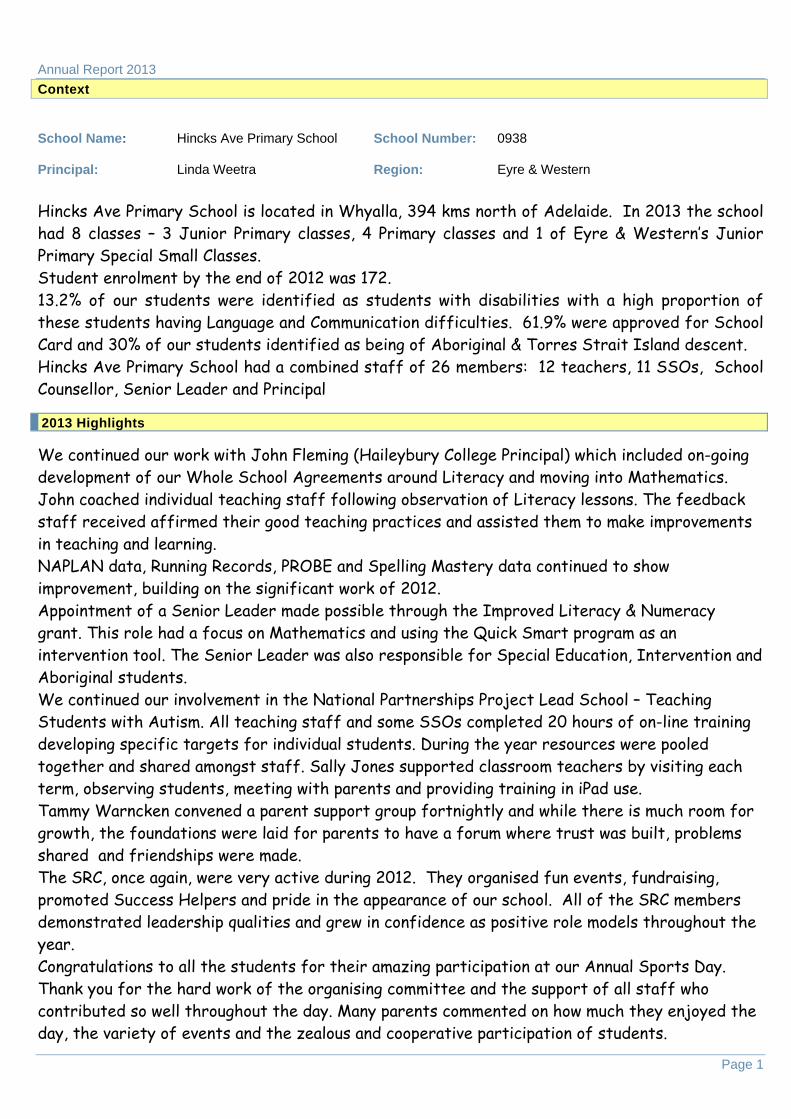
School Name: Hincks Ave Primary School School Number: 0938
Principal: Linda Weetra Region: Eyre & Western
Hincks Ave Primary School is located in Whyalla, 394 kms north of Adelaide. In 2013 the school had 8 classes – 3 Junior Primary classes, 4 Primary classes and 1 of Eyre & Western’s Junior Primary Special Small Classes. Student enrolment by the end of 2012 was 172. 13.2% of our students were identified as students with disabilities with a high proportion of these students having Language and Communication difficulties. 61.9% were approved for School Card and 30% of our students identified as being of Aboriginal & Torres Strait Island descent. Hincks Ave Primary School had a combined staff of 26 members: 12 teachers, 11 SSOs, School Counsellor, Senior Leader and Principal
2013 Highlights
We continued our work with John Fleming (Haileybury College Principal) which included on-going development of our Whole School Agreements around Literacy and moving into Mathematics. John coached individual teaching staff following observation of Literacy lessons. The feedback staff received affirmed their good teaching practices and assisted them to make improvements in teaching and learning. NAPLAN data, Running Records, PROBE and Spelling Mastery data continued to show improvement, building on the significant work of 2012. Appointment of a Senior Leader made possible through the Improved Literacy & Numeracy grant. This role had a focus on Mathematics and using the Quick Smart program as an intervention tool. The Senior Leader was also responsible for Special Education, Intervention and Aboriginal students. We continued our involvement in the National Partnerships Project Lead School – Teaching Students with Autism. All teaching staff and some SSOs completed 20 hours of on-line training developing specific targets for individual students. During the year resources were pooled together and shared amongst staff. Sally Jones supported classroom teachers by visiting each term, observing students, meeting with parents and providing training in iPad use. Tammy Warncken convened a parent support group fortnightly and while there is much room for growth, the foundations were laid for parents to have a forum where trust was built, problems shared and friendships were made. The SRC, once again, were very active during 2012. They organised fun events, fundraising, promoted Success Helpers and pride in the appearance of our school. All of the SRC members demonstrated leadership qualities and grew in confidence as positive role models throughout the year. Congratulations to all the students for their amazing participation at our Annual Sports Day. Thank you for the hard work of the organising committee and the support of all staff who contributed so well throughout the day. Many parents commented on how much they enjoyed the day, the variety of events and the zealous and cooperative participation of students.

Annual Report 2013
Page 2
Site Improvement Planning
PRIORITY 1: LITERACY IMPROVEMENT
TARGET 1: READING
EARLY YEARS
By the end of Term 4 2013:-
- 100% of Receptions (at the end of 4 terms at school) will achieve PM Levels 6-10 as measured by Running records.
- 100% of Yr 1s will achieve PM Levels 16-20 as measured by Running Records. - 100% of Yr 2s will achieve PM Levels 26-30 as measured by Running Records.
MIDDLE PRIMARY
By the end of Term 4 2013-
All students to improve by 2 levels as measured by PROBE at end of Term 4
UPPER PRIMARY
All students to improve by 2 levels as measured by PROBE at the end of Term 4
TARGET 2: WRITING
100% of all students will improve by a minimum of 2 scales for each genre as measured by EALD (English as an Additional Language or Dialect) Scaling in Week 8 of each term (From pre-test to post test)
TARGET 3: NAPLAN
Yr 3 – WRITING – 15% of Year 3s will achieve in the top 2 proficiency bands as measured in 2013 NAPLAN.
Yr 3 – READING – 15% of Year 3s will achieve in the top 2 proficiency bands
Yr 3 – SPELLING – 15% of Year 3s will achieve in the top 2 proficiency bands
Yr 5 – WRITING – 20% of Yr 5s will achieve in the top 2 proficiency bands as measured by the 2013 NAPLAN (an improvement of 20%)
Yr 5 – READING – the % of students in the top 2 proficiency bands will improve from 16% to 20%

Annual Report 2013
Page 3
Yr 5 – SPELLING – 20% of Year 5s will achieve in the top 2 proficiency bands (as compared to 33% in 2012)
Yr 7 – WRITING – 25% of Year 7s will achieve in the top 2 proficiency bands as measured in the 2013 NAPLAN (as compared to 31% in 2012)
Yr 7 – READING – the % of students in the top 2 proficiency bands will improve from 10% to 20%
Yr 7 – SPELLING – 20% of Year 7s will achieve in the top 2 proficiency bands
PRIORITY 2 : NUMERACY IMPROVEMENT
TARGET: NAPLAN
Year 3: 15% of Year 3s will achieve in the top 2 Proficiency Bands as measured by NAPLAN 2013
Year 5: 20% of Year 5s will achieve in the top 2 Proficiency Bands
Year 7: 25% will achieve in the top 2 Proficiency Bands
PRIORITY 3: ATTENDANCE IMPROVEMENT
TARGET: (as measured by Data Mart at the end of each term 2013
Attendance rate will improve from 89% to 93% for all students.
Attendance rate for ATSI students will improve from 89% to 93% - An increase of 1.9 days per student.
Attendance rate for non-ATSI students will improve from 89% to 93% an increase of 1.9 days per student.
Unauthorised absence rate to decrease from 4.4% to 2% by the end of Term 4.
Annual Report 2013
Page 4
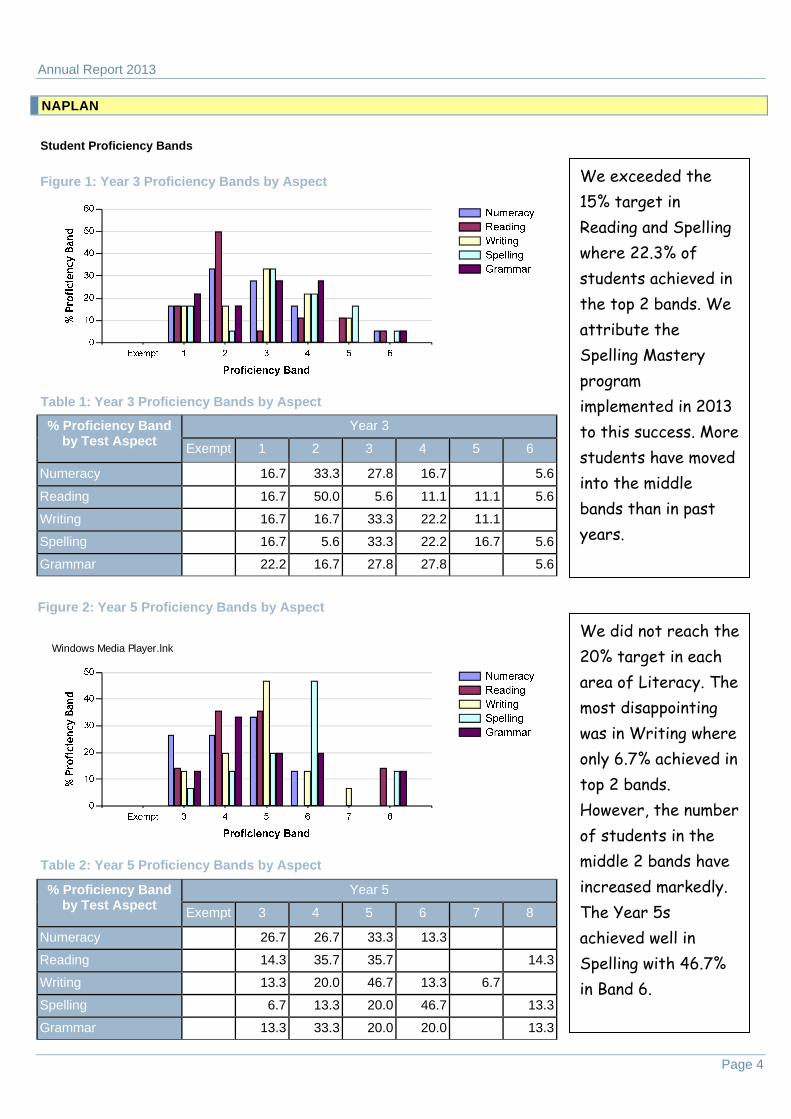
NAPLAN
Student Proficiency Bands
Figure 1: Year 3 Proficiency Bands by Aspect
Table 1: Year 3 Proficiency Bands by Aspect
% Proficiency Band by Test Aspect
Year 3
Exempt 1 2 3 4 5 6
Numeracy 16.7 33.3 27.8 16.7 5.6
Reading 16.7 50.0 5.6 11.1 11.1 5.6
Writing 16.7 16.7 33.3 22.2 11.1
Spelling 16.7 5.6 33.3 22.2 16.7 5.6
Grammar 22.2 16.7 27.8 27.8 5.6
Figure 2: Year 5 Proficiency Bands by Aspect
Windows Media Player.lnk
Table 2: Year 5 Proficiency Bands by Aspect
% Proficiency Band by Test Aspect
Year 5
Exempt 3 4 5 6 7 8
Numeracy 26.7 26.7 33.3 13.3
Reading 14.3 35.7 35.7 14.3
Writing 13.3 20.0 46.7 13.3 6.7
Spelling 6.7 13.3 20.0 46.7 13.3
Grammar 13.3 33.3 20.0 20.0 13.3
We exceeded the 15% target in Reading and Spelling where 22.3% of students achieved in the top 2 bands. We attribute the Spelling Mastery program implemented in 2013 to this success. More students have moved into the middle bands than in past years.
We did not reach the 20% target in each area of Literacy. The most disappointing was in Writing where only 6.7% achieved in top 2 bands. However, the number of students in the middle 2 bands have increased markedly. The Year 5s achieved well in Spelling with 46.7% in Band 6.

Annual Report 2013
Page 5
Figure 3: Year 7 Proficiency Bands by Aspect
Table 3: Year 7 Proficiency Bands by Aspect
% Proficiency Band by Test Aspect
Year 7
Exempt 4 5 6 7 8 9
Numeracy 47.1 35.3 11.8 5.9
Reading 18.8 18.8 25.0 18.8 18.8
Writing 17.6 5.9 52.9 11.8 11.8
Spelling 5.9 17.6 35.3 23.5 5.9 11.8
Grammar 17.6 17.6 23.5 11.8 17.6 11.8
Figure 4: Year 3 Mean Scores
Table 4: Year 3 Mean Scores
Mean Scores by Test Aspect
Year 3
2011 2012 2013
Numeracy 341.1 319.4 327.0
Reading 340.1 362.9 332.1
Writing 344.9 402.5 328.7
Spelling 346.4 369.1 359.2
Grammar 307.7 346.7 326.1
Grammar saw students achieve well above the 20% target set. 29.2% of students achieved in the top 2 bands.
17.7% achieved in top 2 bands for Spelling – a 2.3% difference.
Growth in Mean Scores have changed little over the last 3 years for Year 3s. From this chart we can see that students did well in 2012 in Literacy and the mean scores dropped in 2013.
The one significant area of improvement was in Numeracy.
Annual Report 2013
Page 6
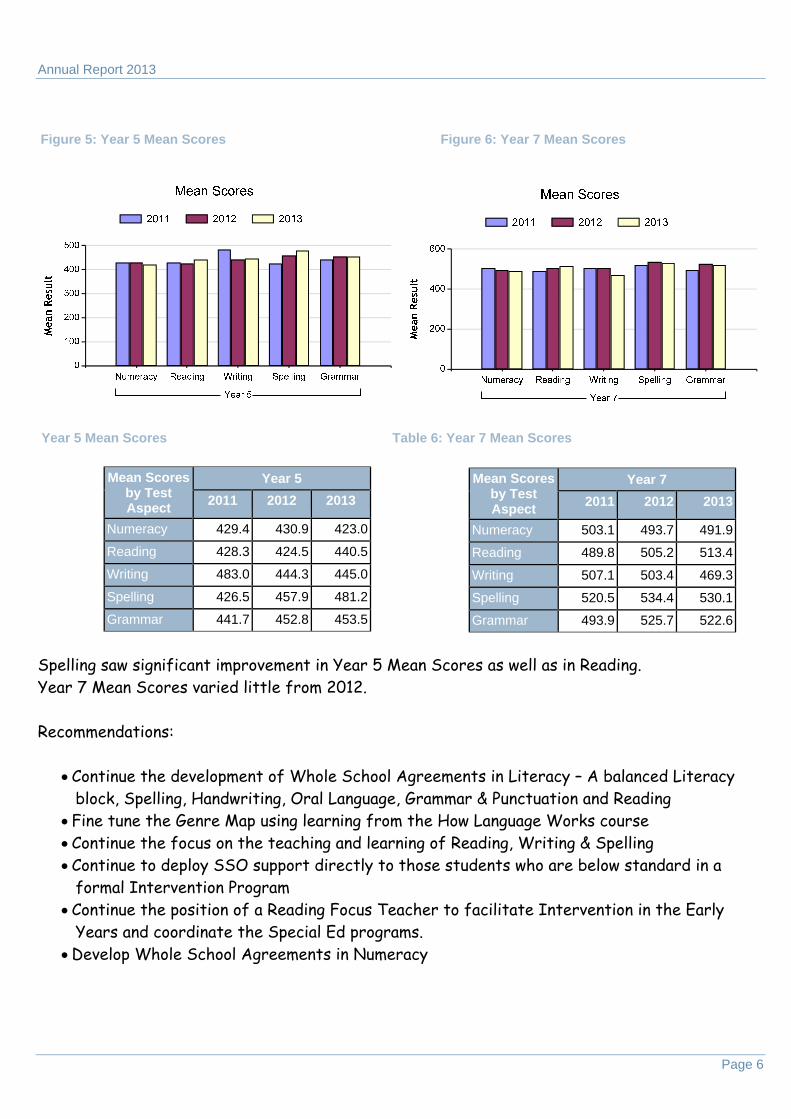
Figure 5: Year 5 Mean Scores Figure 6: Year 7 Mean Scores
Year 5 Mean Scores Table 6: Year 7 Mean Scores
Mean Scores by Test Aspect
Year 5
2011 2012 2013
Numeracy 429.4 430.9 423.0
Reading 428.3 424.5 440.5
Writing 483.0 444.3 445.0
Spelling 426.5 457.9 481.2
Grammar 441.7 452.8 453.5 Spelling saw significant improvement in Year 5 Mean Scores as well as in Reading. Year 7 Mean Scores varied little from 2012. Recommendations:
Continue the development of Whole School Agreements in Literacy – A balanced Literacy block, Spelling, Handwriting, Oral Language, Grammar & Punctuation and Reading
Fine tune the Genre Map using learning from the How Language Works course Continue the focus on the teaching and learning of Reading, Writing & Spelling Continue to deploy SSO support directly to those students who are below standard in a
formal Intervention Program Continue the position of a Reading Focus Teacher to facilitate Intervention in the Early
Years and coordinate the Special Ed programs. Develop Whole School Agreements in Numeracy
Mean Scores by Test Aspect
Year 7
2011 2012 2013
Numeracy 503.1 493.7 491.9
Reading 489.8 505.2 513.4
Writing 507.1 503.4 469.3
Spelling 520.5 534.4 530.1
Grammar 493.9 525.7 522.6

Annual Report 2013
Page 7
Running Records were taken and data collected every 4 weeks.
The graphs clearly show improvement across the year with the most outstanding result showing in the Reception class. Most students reached, and even exceeded their end of year target!
High expectations, a rigorous teaching and learning program and the monitoring of student progress has ensured excellent learning outcomes for these students.
Running Record Data
0
1
2
3
4
5
6
7
8
9
10
11
12
13
14
15
16
17
18
19
20
21
22
23
24
25
26
STUDEN
T
STUDEN
T
STUDEN
T
STUDEN
T
STUDEN
T
STUDEN
T
STUDEN
T
STUDEN
T
STUDEN
T
STUDEN
T
STUDEN
T
STUDEN
T
STUDEN
T
STUDEN
T
STUDEN
T
Class‐Kerry Collins Yr Rec Comparison RR Data 2013
Term 1 Term 2 Term 3 Term 4 Expected current RR Level Expected End of year Running Record Level
0
1
2
3
4
5
6
7
8
9
10
11
12
13
14
15
16
17
18
19
20
21
22
23
24
25
26
STUDEN
T
STUDEN
T
STUDEN
T
STUDEN
T
STUDEN
T
STUDEN
T
STUDEN
T
STUDEN
T
STUDEN
T
STUDEN
T
STUDEN
T
STUDEN
T
STUDEN
T
STUDEN
T
STUDEN
T
STUDEN
T
STUDEN
T
Class‐Ali Smith/Prue Lange Yr R/1 Comparison RR Data 2013
Term 1 Term 2 Term 3 Term 4 Expected currentRR Level
Expected E.O.Y. RR Level
0123456789
1011121314151617181920212223242526
ABINETT‐BOSTOCK, Locky
BRYAN (PH
ILLIPS), Sianna
DIX, Zac
DONOGHUE, Bec
EVERETT, Dylan
STUDEN
T
STUDEN
T
STUDEN
T
STUDEN
T
STUDEN
T
STUDEN
T
STUDEN
T
STUDEN
T
STUDEN
T
STUDEN
T
Class‐Kylie Thorpe Yr 1/2 ‐ Comparison RR Data 2013
Term 1 Term 2 Term 3 Term 4 Expected E.O.Y.Running Record Level

Annual Report 2013
Page 8
PROBE Data
PROBE data was collected each term, alternating between fiction and non-fiction texts. This data clearly shows the growth experienced by students across the year levels, providing strong evidence that explicit teaching, Warm Ups, the focus on comprehension and intensive intervention are proving to be successful.
0123456789
1011121314151617181920
STUDEN
T
STUDEN
T
STUDEN
T
STUDEN
T
STUDEN
T
STUDEN
T
STUDEN
T
STUDEN
T
STUDEN
T
STUDEN
T
STUDEN
T
STUDEN
T
STUDEN
T
STUDEN
T
STUDEN
T
STUDEN
T
STUDEN
T
STUDEN
T
STUDEN
T
STUDEN
T
STUDEN
T
STUDEN
T
Linda Brown Yr 3/4 PROBE DATA Comparison 2013
Term 1 Term 2 Term 3 Term 4 Expected current Probe Level
Expected E.O.Y. Probe Level
0123456789
1011121314151617181920
STUDEN
T
STUDEN
T
STUDEN
T
STUDEN
T
STUDEN
T
STUDEN
T
STUDEN
T
STUDEN
T
STUDEN
T
STUDEN
T
STUDEN
T
STUDEN
T
STUDEN
T
STUDEN
T
STUDEN
T
STUDEN
T
STUDEN
T
STUDEN
T
STUDEN
T
STUDEN
T
STUDEN
T
STUDEN
T
STUDEN
T
Class‐ Nikki Dormand Yr 2/3 PROBE Comparison Data 2013
Term 1 Term 2 Term 3 Term 4 Expected current… Expected E.O.Y. current…

Annual Report 2013
Page 9
Intervention
Reading Each afternoon 6 SSOs supported students in Reading Intervention Groups to develop their reading skills. 59 students moved through the Reading Intervention program in 2013.
Of these 59 students:
18 graduated from the program 9 left our school 6 were withdrawn from the program due to poor attendance at school 26 are ongoing in the program
We continued using the Fitzroy Reading Program during the year. Changes to the Reading Intervention Program included:
All staff involved, were trained in Phonological Awareness Skills Mapping (PASM) and this lead to staff using the PASM to assess the Intervention students
Personalised Intervention Plans (PIPS) using the data from the PASM were developed for each student in order to address their individual learning needs.
The Fitzroy Reading Program was downloaded onto Ipads to improve student engagement in Intervention
Introduction of Running Records ( Term 4) undertaken weekly to assess student reading and to address areas of need (also included in students PIPS)
1:1 support PIPS reviewed every 5 weeks to check on student progress Graduation Levels for Intervention that match school expectations/benchmarks
Students 9.9.13 30.10.13 29.11.13
DE 5 13 19
CB 7 11 13
SB 12 18 19
CB 11 17 19
DJ 24 26 26
EW 5 7 8
IE 9 13 14
JW 31 35 36
LM 5 7 9
SH 11 12 12
SH 11 17 21
TW 13 16 17
TS 10 12 14
CW 3 6 6
OS 9 15 16
LA 22 35 38
JT 30 32 34
LW 23 25 27
LD 11 14 16
SS 7 12 18
DE CB SB CB DJ EW IE JW LM SH SH TW TS CW OS LA JT LW LD SS
9.9.13 5 7 12 11 24 5 9 31 5 11 11 13 10 3 9 22 30 23 11 7
30.10.13 13 11 18 17 26 7 13 35 7 12 17 16 12 6 15 35 32 25 14 12
29.11.13 19 13 19 19 26 8 14 36 9 12 21 17 14 6 16 38 34 27 16 18
0
5
10
15
20
25
30
35
40
Reading Levels
Fitzroy Reading Levels Progress

Annual Report 2013
Page 10
We have found that the students are making progress in their reading skills. By checking on their progress every 5 weeks, we are able to set new goals for individuals or alternatively change the strategies we were using to ensure the students experience successful outcomes.
QuickSmart (QS)
This year 4 of our staff were trained in the QuickSmart Program. QuickSmart Numeracy is an educational program designed to support numeracy skill development. It emphasises the role of automaticity in learning. Automaticity is the immediate recall of basic information. QuickSmart focuses on developing students’ understanding and quick recall of basic academic facts. The program is called QuickSmart because it encourages students to become quick in their response speed and smart in their strategy use when learning basic academic skills.
We implemented the QuickSmart program in June and 16 of our students were selected, based on their NAPLAN results, to participate in the program. They were assessed on the Cognitive Aptitude Assessment System (OZCAAS) and the Progressive Achievement Test Mathematics (PATM) at the beginning of the program and at the end of the year (Week 6, Term 4) to measure their progress and the success of the QuickSmart program. In order to measure the growth of our students in the program, we also selected 6 comparison students, also based on their NAPLAN results (these students did not participate in QuickSmart, they received their normal numeracy learning in the classroom).
We received our first progress report in November and the results are very pleasing.
Cognitive Aptitude Assessment System (OZCAAS) (Assesses a student’s speed and accuracy)

Annual Report 2013
Page 11
The Addition Speed and Accuracy graphs are included as the majority of the QuickSmart students are currently working on addition number facts. You can see by the graphs that they have become “quicker” and “smarter” in a short time.
All students in Years 4,5,6 and 7, had to undertake the PATM Australian-normed standardised test at the beginning and ending of the year to measure their growth in Mathematics. SIMMER (QuickSmart Developers) use this test to measure the growth of the QuickSmart students against the growth of their peers in the classroom (the comparison group). Our results were fantastic:
Group No of
Students
Gain Effect Size
All QS students 13 11.177 1.355
Indigenous QS students 5 9.54 1.479
Comparison Students 6 2.683 0.35
Effect Size Effect sizes below 0.2 are considered poor Effect Size scores of 0.4 - 0.6 are considered strong Effect Sizes between 0.6 – 0.8 are considered very strong; and Effect Size scores above 0.8 represent substantial improvement of the order of
approximately three years’ growth The above results indicate a higher gain for QuickSmart students in relation to their average-achieving peers in the Comparison group. This improvement is in excess of the expected yearly growth of students’ scores as measured on the PATM of 5 scale score points.
Kale Mia CoreyThoma
sAlisha
Chianta
Charlie JaimeLachla
nJordan Ryan
Rachael
Hayley Gabby
Pre Accuracy 85 94.7 100 100 100 94.7 89.5 82.4 95 76.5 57.9
Post Accuracy 89.5 100 100 100 100 94.7 78.9 94.7 100 100 90 94.7
0
20
40
60
80
100
120
Accuracy
Pre and Post Testing Accuracy Addition QuickSmart 2013

Annual Report 2013
Page 12
Improving Literacy and Numeracy National Partnership (ILNNP)
As the Literacy and Numeracy Coordinator, Deb Smith attended several days in Adelaide for the ILNNP. Our school focus was Numeracy. Her role was to work with staff on their Numeracy skills/teaching in order to improve individual student learning outcomes in the classroom. She lead discussions on numerous occasions, including:
Open Ended Questions and Problem Solving in the classroom Differentiation in Numeracy QuickSmart Problem Solving Strategy Development and implementation of a Numeracy Block
Each teaching staff member was given a copy of an excellent resource book: “Open Ended Mathematics Tasks” by Peter Sullivan. Teachers have reported an increased focus on problem solving in their classrooms and it has been fantastic to see the students sharing their problem solving work with her
Recommendations for Intervention in 2014
To continue the Reading Intervention Program with Junior Primary Students
Develop and implement a Comprehension Intervention Program for Middle and Upper Primary students
To continue QuickSmart with our students from 2013 and offer places to new students as the original students graduate
To continue to develop our Numeracy Block and trial in classes
To continue to focus on open-ended questioning and problem solving in Mathematics

Annual Report 2013
Page 13
Student Data
Attendance by Year Level
Attendance by Year Level % Attendance
2011 2012 2013
Reception 85.4 90.9 86.0
Year 1 89.5 87.7 87.9
Year 2 94.4 87.6 86.7
Year 3 92.1 89.7 80.0
Year 4 92.1 89.4 91.1
Year 5 89.5 90.8 85.4
Year 6 89.5 89.9 84.3
Year 7 90.1 82.7 82.4
Primary Other 95.0 91.0 84.0
Total All Year Levels 90.4 88.5 85.3
Total ACARA 1 TO 10 91.0 88.0 85.3
Despite significant efforts to improve attendance in 2013 we did not reach our target of 93%. Approximately 18% of students achieved 100% attendance each term and they were rewarded at our school assemblies. The Year 4 cohort did particularly well, achieving 91% for the year.
Actions Taken in 2013
Implementation of Attendance Policy and Procedures. Students at risk targeted each term. Training and development for staff revising processes. Students, parents, teachers and leadership worked together to collaboratively address
underlying issues.

Annual Report 2013
Page 14
Behaviour Support
There has been a considerable decrease in Take homes in 2013 from 55 in 2012 down to only 29. There was only 1 exclusion compared to 3 last year. Internal suspensions also reduced with 4 compared to 6 in 2012. Suspensions also decreased from 25 down to 17. For 4 students this was their first suspension and others were involved in several offences. The types of offences that led to suspension ranged from violent acts, threatening violence, threatening the good order, threatening the safety and wellbeing and acting illegally. One of the repeat offenders was also excluded due to the violence and threatening safety. We will continue to provide support to students who demonstrate unsafe behaviour and stress to the school community that violent behaviour is not acceptable or excused at Hincks Avenue Primary School. 2012 saw the introduction of REBE (Rational Emotive Behaviour Education) and this year Hincks was able to adopt this approach to behaviour education for the entire year. Imbedded within this program is an approach that provides students and staff with language that support students to make positive behaviour decisions. Students learn that they are responsible for the choices they make and their attitude is the most powerful and influential aspect to any situation. Complimenting this program was the continuation of the ‘Success Helper Awards’. Adults within the school are able to nominate students displaying ‘Colour Spot Capabilities’ (REBE) & Program Achieve Values. Hincks Hero Awards were introduced in 2013. These awards promote positive behaviour from the REBE Colour Spot Capabilities. When students received 10 ‘Success Helper Awards’ they earned a $5.00 canteen voucher for displaying positive behaviours. The School Counsellor has continued to work with individual students and whole classes to support teachers to present Child Protection Curriculum, Drug Strategy, Cyber Safety and Growth and Development lessons.

Annual Report 2013
Page 15
Intended Destination Leave Reason 2012
School Region Index DECD
No % % % %
Employment 5.0% 3.6% 2.9%
Interstate/Overseas 8 10.5% 7.0% 7.3% 9.1%
Other 1 1.3% 1.7% 3.1% 2.3%
Seeking Employment 4.5% 5.0% 3.3%
Tertiary/TAFE/Training 5.5% 5.1% 4.2%
Transfer to Non-Govt Schl 3 3.9% 10.2% 5.8% 9.8%
Transfer to SA Govt Schl 64 84.2% 53.9% 52.0% 48.0%
Unknown 12.3% 18.0% 20.4%
Staff
Teacher Qualifications All teachers at this school are qualified and registered with the SA Teachers Registration Board.
Qualification Level Number of
Qualifications
Bachelor Degrees or Diplomas 14
Post Graduate Qualifications 1
Please note: Staff that have more than 1 qualification will be counted more than once in the above qualification table. Therefore the total number of staff by qualification type may be more than the total number of teaching staff.
Workforce Composition including Indigenous staff
Workforce Composition Teaching Staff Non-Teaching Staff
Indigenous Non Indigenous Indigenous Non Indigenous
Full-time Equivalents 0.0 1.0 8.57
Persons 0 15 1 12

Annual Report 2013
Page 16
Financial Statement
Income by Funding Source
Funding Source Amount 1 Grants: State 2,046,327.112 Grants: Commonwealth 89,767.683 Parent Contributions 39,134.364 Other 36,643.47
Student Survey Results

Annual Report 2013
Page 17
Some students were chosen to complete the Student Survey. Responses are as follows:
1. Learning programs at this school are responsive to student needs – 67% of students agreed or strongly agreed with this statement
2. Teachers clearly explain what students are learning – 88% of students agreed or strongly agreed with this statement
3. Teachers are enthusiastic in their teaching – 82.5% of students agreed or strongly agreed with this statement
4. Assessment processes provide information on students strengths and areas for further development – 44% of students agreed or strongly agreed with this statement
5. Uses student assessment information to evaluate, develop and refine teaching programs – 77% of students agreed or strongly agreed with this statement
6. Teachers use a variety of teaching and learning strategies to help students – 93.5% of students agreed or strongly agreed with this statement
7. Teachers include the active participation of students in their lessons – 66% of students agreed or strongly agreed with this statement
8. Teachers use a variety of assessment methods which give students the opportunity to show how well they have learned – 88% of students agreed or strongly agreed with this statement
9. Learning programs at this school respond to the range of students' abilities – 66% of students agreed or strongly agreed with this statement
10. Staff are supported by the school in the management of students' behaviour – 66% of students agreed or strongly agreed with this statement
11. This school has high educational expectations of the students – 71.5% of students agreed or strongly agreed with this statement
12. Students at this school are encouraged to achieve to the best of their ability – 88% of students agreed or strongly agreed with this statement
13. Teachers at this school care about how their students are going – 77% of students agreed or strongly agreed with this statement
14. Our school environment is focussed on learning – 71.5% of students agreed or strongly agreed with this statement
15. Teachers have high learning expectations for all students – 77% of students agreed or strongly agreed with this statement
16. Our school's programs provide for the needs of every student – 88% of students agreed or strongly agreed with this statement
17. Teachers at this school use strategies which enable students to be life-long learners – 82.5% of students agreed or strongly agreed with this statement
18. This school provides a safe and secure environment – 77% of students agreed or strongly agreed with this statement
19. This school provides good management of students' injuries and illnesses – 71.5% of students agreed or strongly agreed with this statement
20. Discipline problems at our school are handled fairly – 44% of students agreed or strongly agreed with this statement
21. Our school has effective procedures to address bullying and harassment issues – 60.5% of students agreed or strongly agreed with this statement
22. This school encourages students to have a sense of pride in their achievement – 88% of students agreed or strongly agreed with this statement
23. There are effective student behaviour management procedures in this school – 66% of students agreed or strongly agreed with this statement
Staff Survey Results

Annual Report 2013
Page 18
Quality of Teaching and Learning
Support of Learning
Relationships and Communication (Part 1)

Annual Report 2013
Page 19
Relationships and Communication (Part 2)
Annual Report 2013
Page 20
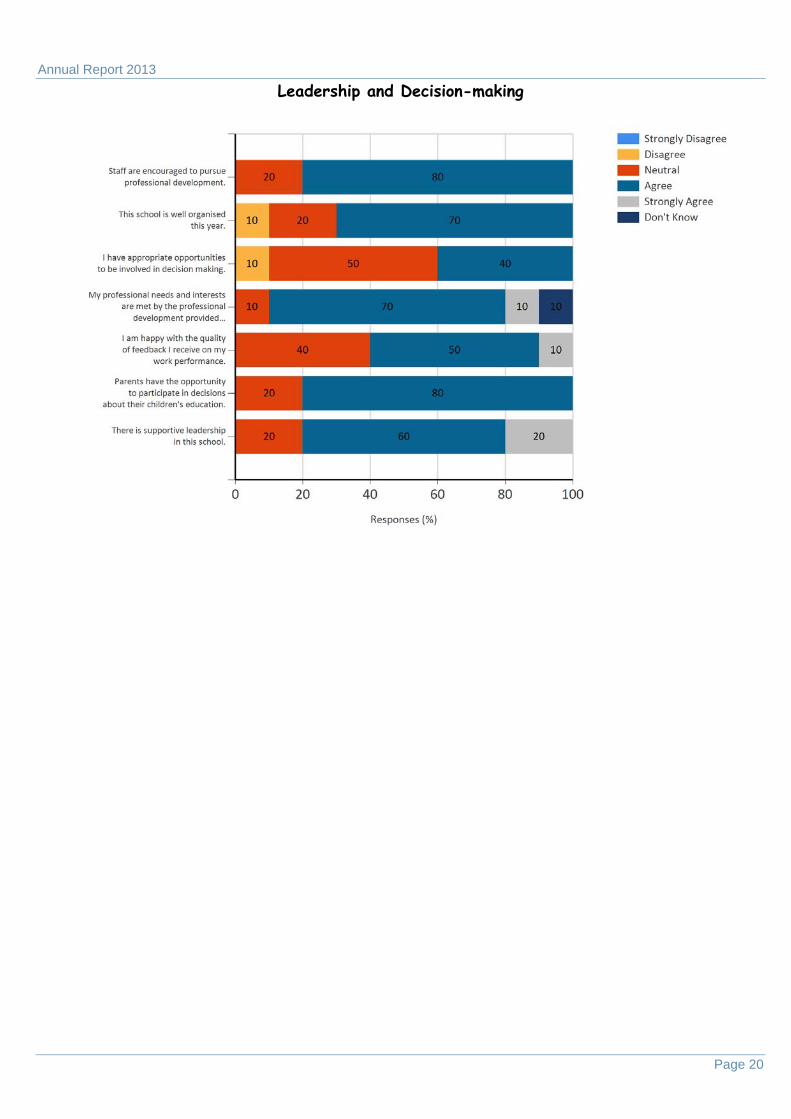
Leadership and Decision-making