Embed Size (px)
Citation preview

Edelweiss Research is also available on www.edelresearch.com, Bloomberg EDEL <GO>, Thomson First Call, Reuters and Factset. Edelweiss Securities Limited
Hindustan Unilever’s (HUL) 4% YoY volume growth in Q2FY18 came in line with our estimate, while 20% EBITDA spurt was marginally ahead. The volume growth is decent considering: (i) quarter was characterised by GST transition; and (ii) sub‐par CSD performance. HUL’s ad spends were aggressive—up 20.2% YoY (peers cut back)—largely to back new launches like Ayush and Citra, which is the right strategy, in our view. Sustained cost rationalisation measures led to comparable EBITDA margin expansion of 180bps YoY. New launches in the natural space (skincare under brand Citra), clinical validation of Indulekha as well as pan‐India roll out of Ayush are potential triggers. Maintain ‘HOLD’.
Broad‐based growth
Key highlights: On a comparative basis, sales grew 10% YoY. Key movers were: (i)
home care segment grew 13% YoY aided by double digit surge in fabric care and Vim
bar’s strong performance; (ii) personal care segment grew 8% YoY led by personal
wash, skin care and hair care (Indulekha and Ayush also contributed favourably); oral
care however continued to remain subdued; (iii) refreshments grew at 10% YoY fuelled
by tea, coffee and festive season cheer for ice creams & frozen desserts segment; and
(iv) foods segment grew 11% YoY (post 4 quarters of sub‐5% YoY growth) driven by
robust spurt in ketchup and new variants in Knorr.
Q2FY18 conference call: Key takeaways
Volume growth for rural was broadly in line with urban. With monsoon in the water
starved geographies, coupled with increase in MSP and right spending by Government,
rural growth should improve. HUL did not take any price hike in Q2FY18. Lever Ayush
has got off to a good start with pan India launch. Premium portfolio contributes 1/4th
of the total revenues and HUL is confident of the premiumisation trend increasing.
Outlook and valuations: Long‐term positive; maintain ‘HOLD’
We envisage HUL to be key beneficiary of anticipated rural recovery and herbal push. At CMP, the stock is trading at 44.4x FY19E EPS. On better‐than‐expected EBITDA, we
revise up FY18/19E EPS 3.0%/0.7%, respectively, and also our target multiple to 45x
(earlier 44x) to arrive at revised target price of INR1,290 (INR1,253 earlier). Maintain
‘HOLD/SP’ since at CMP stock offers limited upside.
RESULT UPDATE
HINDUSTAN UNILEVERVolumes recover; sustained cost cuts boost margins
EDELWEISS 4D RATINGS
Absolute Rating HOLD
Rating Relative to Sector Performer
Risk Rating Relative to Sector Low
Sector Relative to Market Underweight
MARKET DATA (R: HLL.BO, B: HUVR IN)
CMP : INR 1,272
Target Price : INR 1,290
52‐week range (INR) : 1,289 / 782
Share in issue (mn) : 2,164.5
M cap (INR bn/USD mn) : 2,754 / 42,427
Avg. Daily Vol.BSE/NSE(‘000) : 1,330.3 SHARE HOLDING PATTERN (%)
Current Q1FY18 Q4FY17
Promoters *
67.2 67.2 67.2
MF's, FI's & BK’s 5.8 5.6 5.7
FII's 13.3 13.5 13.3
Others 13.7 13.8 13.9
* Promoters pledged shares (% of share in issue)
: NIL
PRICE PERFORMANCE (%)
Stock Nifty
EW FMCG Index
1 month 2.0 4.3 3.3
3 months 10.7 3.3 0.9
12 months 52.9 18.5 21.3
Abneesh Roy +91 22 6620 3141
Alok Shah +91 22 6620 3040
Rajiv Berlia +91 22 6623 3377
India Equity Research| Consumer Goods
October 25, 2017
Financials (INR mn)
Year to March Q2FY18 Q2FY17 % change Q1FY18 % change FY17 FY18E FY19E
Net rev. 83,090 78,427 5.9 85,290 (2.6) 331,620 366,358 405,443
EBITDA 16,820 14,046 19.7 18,660 (9.9) 63,400 76,231 89,156
Adjusted profit 12,400 10,837 14.4 12,960 (4.3) 42,650 53,238 62,070
Dil. EPS (INR) 5.7 5.0 14.4 6.0 (4.3) 19.7 24.6 28.7
Diluted P/E (x) 64.6 51.7 44.4
EV/EBITDA (x) 42.6 35.5 30.3
ROAE (%) 63.8 75.7 81.1

Consumer Goods
2 Edelweiss Securities Limited
Table 1: Segmental growth and margins under IND AS (not LTL comparable)
Source: Company
Table 2: Performance trend across categories at a glance (according to IGAAP segmental reporting)
Source: Edelweiss research
Q2FY18 conference call: Key takeaways
Overall:
• Management perceives gradual recovery in the trade channel. Some turbulence still in
the wholesale channel, but it is receding and normalising.
• While transition to GST impacted trade purchases in early part of the quarter,
consumer offtake remained stable.
• During the quarter, one of the drivers was restocking, which offset the CSD impact.
• According to HUL, bulk of future growth will come from market development and not
market share.
• CSD shortfall will not be loss of offtake, but it is an important channel. CSD is 85‐90%
back to normal level. CSD contributes ~7% to HUL’s total sales.
• Rural volume growth broadly in line with urban. However, monsoon in water starved
geographies is a good sign. This, coupled with right spending by the government and
increase in MSP, should augur well for rural markets.
Q1FY17 Q2FY17 Q3FY17 Q4FY17 Q1FY18 Q1FY18
% sales growth (YoY)
Home care 6.8 3.2 1.0 7.4 5.9 (1.4)
Personal care 2.1 (0.3) (2.7) 8.1 3.5 (2.9)
Foods 4.7 2.4 0.5 2.4 4.4 1.4
Refreshment 5.4 8.4 8.1 10.5 10.8 4.5
Others NM (15.2) (27.3) (30.4) (17.6) (31.2)
EBIT margins (%)
Home care 13.9 10.1 8.7 12.9 14.7 14.0
Personal care 26.2 22.9 23.1 24.1 24.7 24.2
Foods 6.4 4.9 9.4 9.5 14.4 6.0
Refreshment 16.1 14.8 14.7 16.8 18.9 17.5
Others (4.8) 4.2 (8.5) (2.0) (3.6) (4.0)
% sales growth (YoY) Q1FY14 Q2FY14 Q3FY14 Q4FY14 Q1FY15 Q2FY15 Q3FY15 Q4FY15 Q1FY16 Q2FY16 Q3FY16 Q4FY16
Soaps and detergents 7.7 6.4 7.1 9.6 12.9 11.1 6.0 5.0 0.2 1.6 0.8 2.1
Personal products 2.0 11.8 12.4 8.3 14.7 9.9 6.5 13.4 11.4 9.5 5.6 2.8
Beverages 15.8 16.1 7.2 7.5 10.5 7.5 8.2 12.3 9.4 6.1 7.0 6.1
Packaged Food 4.8 8.7 12.9 12.7 18.8 13.4 12.6 13.6 11.8 12.4 11.8 11.7
Overall volume growth
(% YoY)4.0 5.0 4.0 3.0 6.0 5.0 3.0 6.0 6.0 7.0 6.0 4.0
% EBIT growth (YoY) Q1FY14 Q2FY14 Q3FY14 Q4FY14 Q1FY15 Q2FY15 Q3FY15 Q4FY15 Q1FY16 Q2FY16 Q3FY16 Q4FY16
Soaps and detergents 14.0 4.5 14.5 10.1 21.1 7.9 11.4 15.8 12.4 (4.1) 1.3 11.6
Personal products (1.6) 5.3 13.9 5.1 27.4 17.4 3.3 26.0 19.5 17.2 9.9 9.2
Beverages 46.1 37.5 (2.2) 19.7 (1.8) 9.9 2.7 11.4 5.3 (11.5) 22.6 9.5
EBIT margins (%) Q1FY14 Q2FY14 Q3FY14 Q4FY14 Q1FY15 Q2FY15 Q3FY15 Q4FY15 Q1FY16 Q2FY16 Q3FY16 Q4FY16
Soaps and detergents 12.9 14.0 13.3 12.1 13.8 13.6 14.0 13.3 15.5 12.8 14.0 14.5
Personal products 24.9 22.8 28.6 25.0 27.6 24.4 27.7 27.8 29.6 26.1 28.9 29.5
Beverages 18.3 17.0 16.2 18.8 16.3 17.3 15.3 18.6 15.7 14.5 17.6 19.2
Packaged Food 8.4 3.3 (3.6) 5.5 10.9 4.4 (5.1) 5.3 8.9 5.3 3.2 5.7

Hindustan Unilever
3 Edelweiss Securities Limited
• Management expects gradual improvement in rural demand. Trade conditions to
continue to improve.
• Management is now focusing on natural portfolio. Though nascent, it will be a focused
category for HUL.
• Comparable domestic consumer business grew at 10% YoY with underlying volumes
growing 4% YoY.
• Input costs to inflate further due to increase in crude and vegetable oil prices.
• The future strategy for channels is e‐commerce, followed by modern trade and then
general trade.
• Modern trade constitutes 12% of turnover and will increase going forward with the
current improvement in the way sales are clocking within the MT channel.
• Premium portfolio contributes one fourth to total revenue. HUL is confident that the
trend of premiumization will increase going forward across rural and urban markets.
• Market share is robust across all segments; modern trade is growing at a much faster
rate, partly due to wholesale channel being weak. However, management expects cash
and carry to grow at a faster pace going ahead.
• Bulk of the growth comes from the core and the innovations happening in the core; 25‐
30% of total portfolio comes from the new products that they are working on.
• Central India contributes ~20% to overall sales and is growing at 1.5x rest of the
country.
Pricing
• Approximate 3‐4% price cut to pass on net GST benefits. The price cuts largely offset
gain on input taxes received.
• HUL did not hike prices during the quarter.
GST
• Wholesale and CSD channels were impacted early during the quarter, but improved as
the quarter progressed. Consumer off take remained stable during the quarter.
• In order to claim refund of 58% of the CGST payable on value addition requires
significant amount of paper work. No communication from government on refund of
balance 48%.
Home care
• This segment recorded comparable sales growth of 13% YoY.
• Surf, Rin and Wheel grew in double digits.
• In Q2FY18, laundry posted robust double digit growth across the category.
• Growth in household care was led by strong performance of Vim Bar.
• Water business saw the launch of new RO 2‐in‐1 range.
• Fabric Wash: Broad‐based double‐digit growth across the category in mass as well as
premium segments. Premiumisation story is here to stay.
Personal care: Broad‐based growth across personal products and personal wash
• This segment recorded comparable sales growth of 8% YoY.
• There were some price drops in body lotion and personal care segments.

Consumer Goods
4 Edelweiss Securities Limited
• Personal wash saw broad‐based growth across key brands led by Dove, Lux and
Lifebuoy. Growth in soaps was driven mainly by price hikes.
• Personal wash is back on growth and HUL expects this trend to pick up in coming
quarters.
• Many new launches in personal care segment are lined up.
• Growth in hair care was led by Dove.
• Colour cosmetics delivered yet another quarter of double digit growth.
• Lever Ayush
o Lever Ayush got off to a good start after the national launch in Q1FY18. HUL has
strengthened the brand’s products and equity.
o Ayush went national on 21st July.
o Lever Ayush is present mainly in urban and across all channels.
• Indulekha
o Indulekha continued its strong momentum and further strengthened its brand
credentials by receiving clinical validation of being an ayurvedic medicine to
prevent hair fall and also help hair growth.
o Indulekha is not a wholesale driven strategy; positioned in very specific channels;
brand has been performing well.
o Penetration in this category is low and with clinical results coming in, it should
provide a fillip to the brand.
• Lakme colour cosmetics has been on a good growth path. Argan oil range of Lakme has
performed well.
• Skin Care: Growth driven by buoyant winter sell in.
• Oral Care
o HUL is taking actions to get back on the growth path since performance remained
subdued.
o GST‐led price cuts were effected.
o The company expects growth to come back with Ayush.
• Deodorants: Performance led by Axe.
Foods: Growth driven by Kissan
• Comparable sales growth of 10% YoY even though revenues were flat YoY.
• Prices were cut in food segment.
• Kissan delivered strong growth driven by ketchups.
• Knorr saw the launch of multiple variants under Soups and Noodles. International
flavour variants were launched in noodles in select markets.
Refreshments: ▪ Refreshment : Robust growth sustained
• Comparable sales growth of 10% YoY.
• Tea delivered yet another quarter of strong broad‐based growth. Taj Mahal Tea
relaunched during the quarter.
• Coffee: Growth led by strong activations.
• Ice‐cream and frozen desserts also delivered robust volume led growth due to festival
sales.
Hindustan Unilever
5 Edelweiss Securities Limited
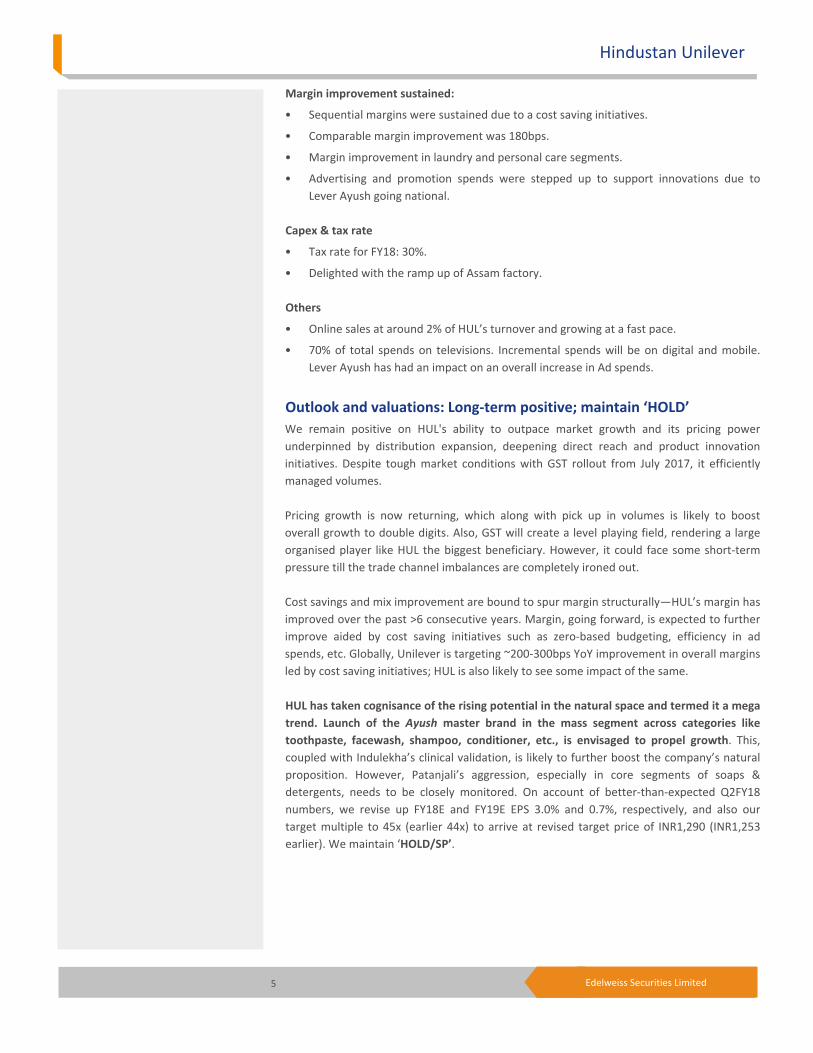
Margin improvement sustained:
• Sequential margins were sustained due to a cost saving initiatives.
• Comparable margin improvement was 180bps.
• Margin improvement in laundry and personal care segments.
• Advertising and promotion spends were stepped up to support innovations due to
Lever Ayush going national.
Capex & tax rate
• Tax rate for FY18: 30%.
• Delighted with the ramp up of Assam factory.
Others
• Online sales at around 2% of HUL’s turnover and growing at a fast pace.
• 70% of total spends on televisions. Incremental spends will be on digital and mobile.
Lever Ayush has had an impact on an overall increase in Ad spends.
Outlook and valuations: Long‐term positive; maintain ‘HOLD’
We remain positive on HUL's ability to outpace market growth and its pricing power
underpinned by distribution expansion, deepening direct reach and product innovation
initiatives. Despite tough market conditions with GST rollout from July 2017, it efficiently
managed volumes.
Pricing growth is now returning, which along with pick up in volumes is likely to boost
overall growth to double digits. Also, GST will create a level playing field, rendering a large
organised player like HUL the biggest beneficiary. However, it could face some short‐term
pressure till the trade channel imbalances are completely ironed out.
Cost savings and mix improvement are bound to spur margin structurally—HUL’s margin has
improved over the past >6 consecutive years. Margin, going forward, is expected to further
improve aided by cost saving initiatives such as zero‐based budgeting, efficiency in ad
spends, etc. Globally, Unilever is targeting ~200‐300bps YoY improvement in overall margins
led by cost saving initiatives; HUL is also likely to see some impact of the same.
HUL has taken cognisance of the rising potential in the natural space and termed it a mega
trend. Launch of the Ayush master brand in the mass segment across categories like
toothpaste, facewash, shampoo, conditioner, etc., is envisaged to propel growth. This,
coupled with Indulekha’s clinical validation, is likely to further boost the company’s natural
proposition. However, Patanjali’s aggression, especially in core segments of soaps &
detergents, needs to be closely monitored. On account of better‐than‐expected Q2FY18
numbers, we revise up FY18E and FY19E EPS 3.0% and 0.7%, respectively, and also our
target multiple to 45x (earlier 44x) to arrive at revised target price of INR1,290 (INR1,253
earlier). We maintain ‘HOLD/SP’.

Consumer Goods
6 Edelweiss Securities Limited
Chart 1: Overall volume growth
Source: Company, Edelweiss research
Chart 2: A&P spends
Source: Company, Edelweiss research
(5.0)
(1.0)
3.0
7.0
11.0
15.0
Q2FY12
Q3FY12
Q4FY12
Q1FY13
Q2FY13
Q3FY13
Q4FY13
Q1FY14
Q2FY14
Q3FY14
Q4FY14
Q1FY15
Q2FY15
Q3FY15
Q4FY15
Q1FY16
Q2FY16
Q3FY16
Q4FY16
Q1FY17
Q2FY17
Q3FY17
Q4FY17
Q1FY18
Q2FY18
(%)
0.0
3.5
7.0
10.5
14.0
17.5
Q2FY12
Q3FY12
Q4FY12
Q1FY13
Q2FY13
Q3FY13
Q4FY13
Q1FY14
Q2FY14
Q3FY14
Q4FY14
Q1FY15
Q2FY15
Q3FY15
Q4FY15
Q1FY16
Q2FY16
Q3FY16
Q4FY16
Q1FY17
Q2FY17
Q3FY17
Q4FY17
Q1FY18
Q2FY18
(% of sales)

Hindustan Unilever
7 Edelweiss Securities Limited
Chart 3: Category‐wise contribution—Sales
Chart 4: Category‐wise contribution—EBIT
Source: Company, Edelweiss research
Home care33%
Personal care47%
Foods3%
Refreshments15%
Others2%
Q2FY18 revenue split
Home care24%
Personal care61%
Foods1%
Refreshments14%
Others0%
Q2FY18 ‐ EBIT contribution
Home care33%
Personal care47%
Foods3%
Refreshments14%
Others3%
Q2FY17 revenue split
Home care20%
Personal care66%
Foods1%
Refreshments12%
Others1%
Q2FY17 ‐ EBIT contribution

Consumer Goods
8 Edelweiss Securities Limited
Table 3: Segmental performance (not LTL comparable)
Source: Company, Edelweiss research
Chart 5: One year forward P/E chart
Source: Edelweiss research
Year to March ‐ Revenues (INR mn) Q2FY18 Q2FY17 YoY growth Q1FY18 QoQ growth
Home care 27,390 27,770 (1.4) 30,470 (10.1)
Personal care 39,100 40,280 (2.9) 43,680 (10.5)
Foods 2,820 2,780 1.4 2,840 (0.7)
Refreshments 12,220 11,690 4.5 13,460 (9.2)
Others (includes exports, infant and feminine care etc) 1,500 2,180 (31.2) 1,680 (10.7)
Segment results (Profit/(Loss) before tax and interest)
Home care 3,830 2,800 36.8 4,480 (14.5)
Personal care 9,480 9,230 2.7 10,790 (12.1)
Foods 170 140 21.4 410 (58.5)
Refreshments 2,140 1,720 24.4 2,550 (16.1)
Others (includes exports, infant and feminine care etc) (60) 90 NA (60) NM
Segment margins
Margin (%)
Home care 14.0 10.1 390 14.7 (72)
Personal care 24.2 22.9 133 24.7 (46)
Foods 6.0 5.0 99 14.4 (841)
Refreshments 17.5 14.7 280 18.9 (143)
Others (includes exports, infant and feminine care etc) (4.0) 4.1 NM (3.6) NM
0
260
520
780
1,040
1,300
Oct‐12
Apr‐13
Oct‐13
Apr‐14
Oct‐14
Apr‐15
Oct‐15
Apr‐16
Oct‐16
Apr‐17
Oct‐17
(INR)
20x
40x
45x
25x30x
35x
Hindustan Unilever
9 Edelweiss Securities Limited
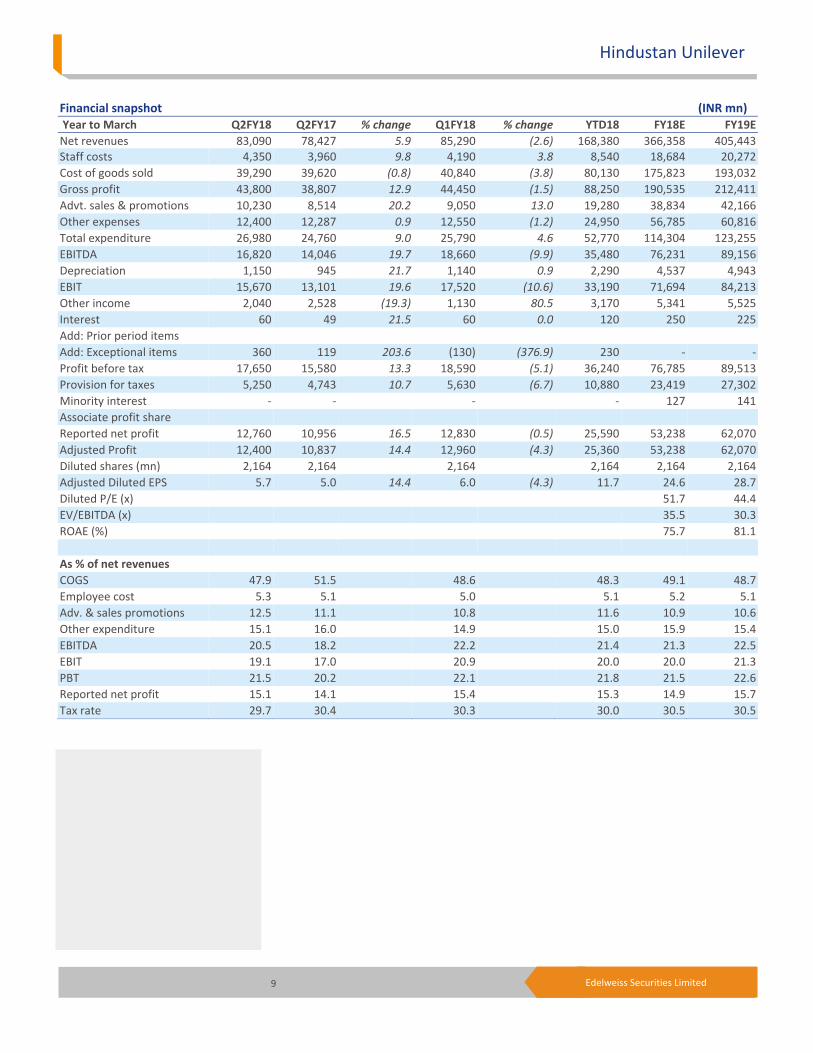
Financial snapshot (INR mn) Year to March Q2FY18 Q2FY17 % change Q1FY18 % change YTD18 FY18E FY19E
Net revenues 83,090 78,427 5.9 85,290 (2.6) 168,380 366,358 405,443 Staff costs 4,350 3,960 9.8 4,190 3.8 8,540 18,684 20,272
Cost of goods sold 39,290 39,620 (0.8) 40,840 (3.8) 80,130 175,823 193,032
Gross profit 43,800 38,807 12.9 44,450 (1.5) 88,250 190,535 212,411
Advt. sales & promotions 10,230 8,514 20.2 9,050 13.0 19,280 38,834 42,166
Other expenses 12,400 12,287 0.9 12,550 (1.2) 24,950 56,785 60,816
Total expenditure 26,980 24,760 9.0 25,790 4.6 52,770 114,304 123,255
EBITDA 16,820 14,046 19.7 18,660 (9.9) 35,480 76,231 89,156
Depreciation 1,150 945 21.7 1,140 0.9 2,290 4,537 4,943
EBIT 15,670 13,101 19.6 17,520 (10.6) 33,190 71,694 84,213
Other income 2,040 2,528 (19.3) 1,130 80.5 3,170 5,341 5,525
Interest 60 49 21.5 60 0.0 120 250 225
Add: Prior period items
Add: Exceptional items 360 119 203.6 (130) (376.9) 230 ‐ ‐
Profit before tax 17,650 15,580 13.3 18,590 (5.1) 36,240 76,785 89,513
Provision for taxes 5,250 4,743 10.7 5,630 (6.7) 10,880 23,419 27,302
Minority interest ‐ ‐ ‐ ‐ 127 141
Associate profit share
Reported net profit 12,760 10,956 16.5 12,830 (0.5) 25,590 53,238 62,070
Adjusted Profit 12,400 10,837 14.4 12,960 (4.3) 25,360 53,238 62,070
Diluted shares (mn) 2,164 2,164 2,164 2,164 2,164 2,164
Adjusted Diluted EPS 5.7 5.0 14.4 6.0 (4.3) 11.7 24.6 28.7
Diluted P/E (x) 51.7 44.4
EV/EBITDA (x) 35.5 30.3
ROAE (%) 75.7 81.1
As % of net revenues
COGS 47.9 51.5 48.6 48.3 49.1 48.7
Employee cost 5.3 5.1 5.0 5.1 5.2 5.1
Adv. & sales promotions 12.5 11.1 10.8 11.6 10.9 10.6
Other expenditure 15.1 16.0 14.9 15.0 15.9 15.4
EBITDA 20.5 18.2 22.2 21.4 21.3 22.5
EBIT 19.1 17.0 20.9 20.0 20.0 21.3
PBT 21.5 20.2 22.1 21.8 21.5 22.6
Reported net profit 15.1 14.1 15.4 15.3 14.9 15.7
Tax rate 29.7 30.4 30.3 30.0 30.5 30.5

Consumer Goods
10 Edelweiss Securities Limited
Company Description
HUL, the largest FMCG Company in India, was formed by merging three subsidiaries of
Unilever in 1956. At present, Unilever Plc holds a 67.2% stake in the company. HUL’s
portfolio of products covers a wide spectrum including soaps, detergents, skin creams,
shampoos, toothpastes, tea, coffee, packaged foods and branded atta.
Powerful brands and an envious distribution network (direct coverage of >3.2mn outlets)
are HUL’s primary strengths. The company operates through segments—Home care,
personal care, Refreshments, Foods and other operations. Investment Theme
HUL is a play on consumption growth in India. The company has displayed its ability to effect
price hikes and ability to grow ahead of market, which, combined with improved outlook for
S&D and personal care, and strong growth in processed foods and beverages, boosts our
positive outlook on the company. We like its revenue growth from a medium to long term
perspective. Commodity price correction will aid gross margin expansion though we expect
partial benefit to be passed on to customers through promotional offers/select price cuts.
We expect higher investment in A&P to support brand equity and counter pick up in
competitive intensity (especially from regional players). However with an anticipated
recovery in urban demand and commodity correction to aid EBITDA margin expansion, we
expect HUL to potentially benefit.
Key Risks
Depreciation in rupee impacts price of imported raw materials.
Ad spends likely to spike due to increased competition from regional players. Maintaining
market share will also be a challenge for HUL.
The price war in HUL’s popular segments with new entrants entering the fray could hit the
company hard.
11 Edelweiss Securities Limited
Hindustan Unilever
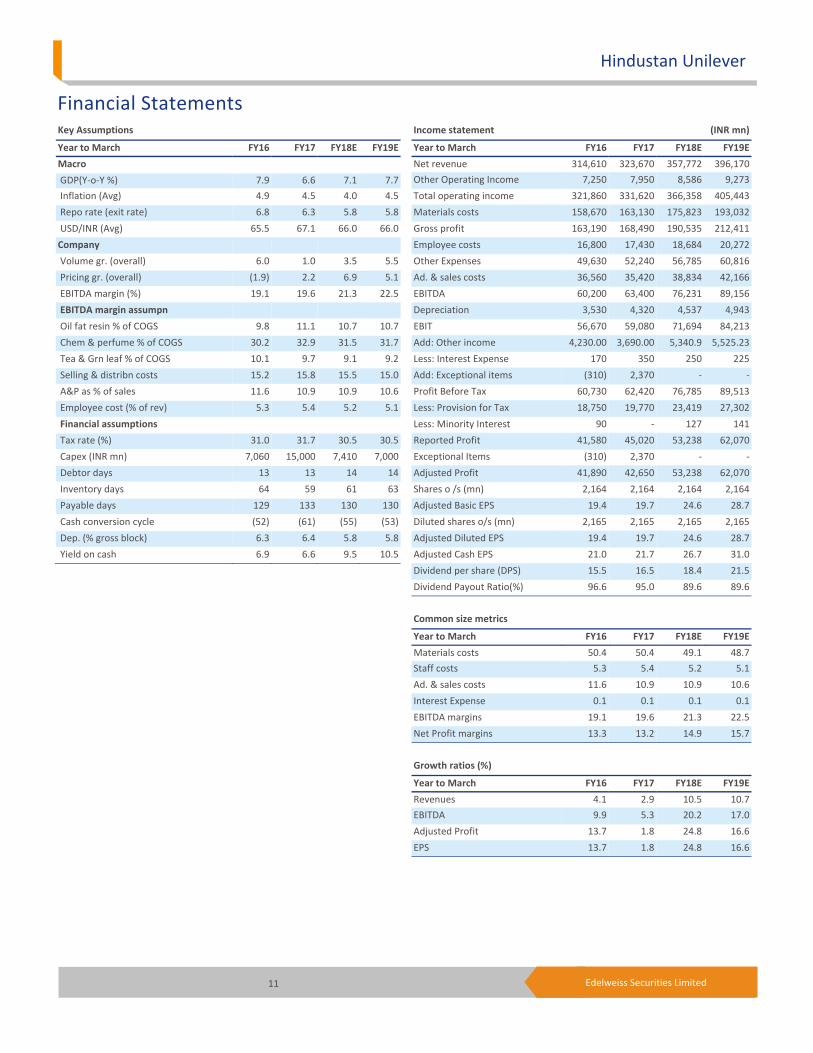
Financial Statements
Income statement (INR mn)
Year to March FY16 FY17 FY18E FY19E
Net revenue 314,610 323,670 357,772 396,170
Other Operating Income 7,250 7,950 8,586 9,273
Total operating income 321,860 331,620 366,358 405,443
Materials costs 158,670 163,130 175,823 193,032
Gross profit 163,190 168,490 190,535 212,411
Employee costs 16,800 17,430 18,684 20,272
Other Expenses 49,630 52,240 56,785 60,816
Ad. & sales costs 36,560 35,420 38,834 42,166
EBITDA 60,200 63,400 76,231 89,156
Depreciation 3,530 4,320 4,537 4,943
EBIT 56,670 59,080 71,694 84,213
Add: Other income 4,230.00 3,690.00 5,340.9 5,525.23
Less: Interest Expense 170 350 250 225
Add: Exceptional items (310) 2,370 ‐ ‐
Profit Before Tax 60,730 62,420 76,785 89,513
Less: Provision for Tax 18,750 19,770 23,419 27,302
Less: Minority Interest 90 ‐ 127 141
Reported Profit 41,580 45,020 53,238 62,070
Exceptional Items (310) 2,370 ‐ ‐
Adjusted Profit 41,890 42,650 53,238 62,070
Shares o /s (mn) 2,164 2,164 2,164 2,164
Adjusted Basic EPS 19.4 19.7 24.6 28.7
Diluted shares o/s (mn) 2,165 2,165 2,165 2,165
Adjusted Diluted EPS 19.4 19.7 24.6 28.7
Adjusted Cash EPS 21.0 21.7 26.7 31.0
Dividend per share (DPS) 15.5 16.5 18.4 21.5
Dividend Payout Ratio(%) 96.6 95.0 89.6 89.6
Common size metrics
Year to March FY16 FY17 FY18E FY19E
Materials costs 50.4 50.4 49.1 48.7
Staff costs 5.3 5.4 5.2 5.1
Ad. & sales costs 11.6 10.9 10.9 10.6
Interest Expense 0.1 0.1 0.1 0.1
EBITDA margins 19.1 19.6 21.3 22.5
Net Profit margins 13.3 13.2 14.9 15.7
Growth ratios (%)
Year to March FY16 FY17 FY18E FY19E
Revenues 4.1 2.9 10.5 10.7
EBITDA 9.9 5.3 20.2 17.0
Adjusted Profit 13.7 1.8 24.8 16.6
EPS 13.7 1.8 24.8 16.6
Key Assumptions
Year to March FY16 FY17 FY18E FY19E
Macro
GDP(Y‐o‐Y %) 7.9 6.6 7.1 7.7
Inflation (Avg) 4.9 4.5 4.0 4.5
Repo rate (exit rate) 6.8 6.3 5.8 5.8
USD/INR (Avg) 65.5 67.1 66.0 66.0
Company
Volume gr. (overall) 6.0 1.0 3.5 5.5
Pricing gr. (overall) (1.9) 2.2 6.9 5.1
EBITDA margin (%) 19.1 19.6 21.3 22.5
EBITDA margin assumpn
Oil fat resin % of COGS 9.8 11.1 10.7 10.7
Chem & perfume % of COGS 30.2 32.9 31.5 31.7
Tea & Grn leaf % of COGS 10.1 9.7 9.1 9.2
Selling & distribn costs 15.2 15.8 15.5 15.0
A&P as % of sales 11.6 10.9 10.9 10.6
Employee cost (% of rev) 5.3 5.4 5.2 5.1
Financial assumptions
Tax rate (%) 31.0 31.7 30.5 30.5
Capex (INR mn) 7,060 15,000 7,410 7,000
Debtor days 13 13 14 14
Inventory days 64 59 61 63
Payable days 129 133 130 130
Cash conversion cycle (52) (61) (55) (53)
Dep. (% gross block) 6.3 6.4 5.8 5.8
Yield on cash 6.9 6.6 9.5 10.5

12 Edelweiss Securities Limited
Consumer Goods
Peer comparison valuation
Market cap Diluted P/E (X) EV / EBITDA (X) ROAE (%)
Name (USD mn) FY18E FY19E FY18E FY19E FY18E FY19E
Hindustan Unilever 42,427 51.7 44.4 35.5 30.3 75.7 81.1
Colgate 4,349 44.1 36.7 26.8 22.7 46.7 48.6
Dabur 8,768 41.2 34.4 35.5 29.3 26.3 27.2
Emami 4,095 66.9 45.1 33.0 25.5 23.5 30.2
Marico 6,262 46.6 38.6 32.5 26.8 35.1 36.3
Nestle Ltd 10,625 57.2 45.7 32.1 26.2 38.4 44.1
Median ‐ 49.2 41.5 32.8 26.5 36.8 40.2
AVERAGE ‐ 51.3 40.8 32.6 26.8 41.0 44.6
Source: Edelweiss research
Cash flow metrics
Year to March FY16 FY17 FY18E FY19E
Operating cash flow 41,790 52,060 51,738 68,076
Investing cash flow (2,820) (11,730) (7,410) (7,000)
Financing cash flow (38,640) (42,140) (47,927) (55,812)
Net cash Flow 330 (1,810) (3,599) 5,264
Capex (7,060) (15,000) (7,410) (7,000)
Dividend paid (40,090) (42,640) (47,677) (55,587)
Profitability and efficiency ratios
Year to March FY16 FY17 FY18E FY19E
ROAE (%) 78.9 63.8 75.7 81.1
ROACE (%) 112.1 90.9 105.1 113.0
Inventory Days 63 59 61 63
Debtors Days 14 13 14 14
Payable Days 131 133 130 130
Cash Conversion Cycle (54) (61) (55) (53)
Current Ratio 1.6 1.5 1.5 1.5
Gross Debt/EBITDA ‐ ‐ ‐ ‐
Gross Debt/Equity ‐ ‐ ‐ ‐
Adjusted Debt/Equity ‐ ‐ ‐ ‐
Net Debt/Equity (0.8) (0.8) (0.7) (0.7)
Interest Coverage Ratio 333.4 168.8 286.8 374.3
Operating ratios
Year to March FY16 FY17 FY18E FY19E
Total Asset Turnover 4.9 4.1 4.3 4.4
Fixed Asset Turnover 10.4 8.4 7.9 8.3
Equity Turnover 5.9 4.8 5.1 5.2
Valuation parameters
Year to March FY16 FY17 FY18E FY19E
Adj. Diluted EPS (INR) 19.4 19.7 24.6 28.7
Y‐o‐Y growth (%) 13.7 1.8 24.8 16.6
Adjusted Cash EPS (INR) 21.0 21.7 26.7 31.0
Diluted P/E (x) 65.7 64.6 51.7 44.4
P/B (x) 41.9 40.8 37.7 34.7
EV / Sales (x) 8.6 8.3 7.6 6.8
EV / EBITDA (x) 44.8 42.6 35.5 30.3
Dividend Yield (%) 1.2 1.3 1.4 1.7
Balance sheet (INR mn)
As on 31st March FY16 FY17 FY18E FY19E
Share capital 2,164 2,164 2,164 2,164
Reserves & Surplus 63,570 65,280 70,841 77,324
Shareholders' funds 65,734 67,444 73,005 79,489
Minority Interest 200 220 347 489
Short term borrowings 1,770 2,770 2,770 2,770
Total Borrowings 1,770 2,770 2,770 2,770
Long Term Liabilities 11,330 12,260 12,260 12,260
Def. Tax Liability (net) (1,670) (1,700) (1,700) (1,700)
Sources of funds 77,364 80,994 86,683 93,307
Gross Block 59,730 74,730 81,730 88,730
Net Block 31,650 39,680 42,143 44,199
Capital work in progress 4,080 2,290 2,700 2,700
Intangible Assets 930 4,510 4,510 4,510
Total Fixed Assets 36,660 46,480 49,353 51,409
Non current investments 320 60 60 60
Cash and Equivalents 55,690 56,160 52,561 57,826
Inventories 27,260 25,410 29,384 33,318
Sundry Debtors 12,640 10,850 14,052 15,551
Loans & Advances 3,860 4,590 4,590 4,590
Other Current Assets 9,834 11,814 11,814 11,814
Current Assets (ex cash) 53,594 52,664 59,841 65,273
Trade payable 56,850 61,860 62,622 68,751
Other Current Liab 12,050 12,510 12,510 12,510
Total Current Liab 68,900 74,370 75,132 81,261
Net Curr Assets‐ex cash (15,306) (21,706) (15,291) (15,988)
Uses of funds 77,364 80,994 86,683 93,307
BVPS (INR) 30.4 31.2 33.7 36.7
Free cash flow (INR mn)
Year to March FY16 FY17 FY18E FY19E
Reported Profit 41,580 45,020 53,238 62,070
Add: Depreciation 3,530 4,320 4,537 4,943
Interest (Net of Tax) 118 239 174 156
Others (2,628) (4,669) 204 210
Less: Changes in WC 120 (8,650) 6,414 (696)
Operating cash flow 42,480 53,560 51,738 68,076
Less: Capex 7,060 15,000 7,410 7,000
Free Cash Flow 35,420 38,560 44,328 61,076

13 Edelweiss Securities Limited
Hindustan Unilever
Holding – Top10 Perc. Holding Perc. Holding
Life Insurance Corp Of India 1.9 Vanguard Group 1.6
Blackrock 1.1 Aberdeen Asset Managers 1.1
Franklin Resources 0.5 Nomura 0.5
Birla Sun Life Asset Management 0.3 Schroders Plc 0.3
Sbi Funds Management 0.3 Vontobel Asset Management 0.3
*as per last available data
Insider Trades Reporting Data Acquired / Seller B/S Qty Traded
No Data Available
*in last one year
Bulk Deals Data Acquired / Seller B/S Qty Traded Price
No Data Available
*in last one year
Additional Data
Directors Data Mr. Harish Manwani Chairman Mr. Sanjiv Mehta Managing Director and Chief Executive Officer
Mr. P. B. Balaji Executive Director, Finance & IT and Chief Financial Officer Mr. Pradeep Banerjee Executive Director, Supply Chain
Mr. Dev Bajpai Executive Director, Legal & CS Mr. A. Narayan Independent Director
Mr. S. Ramadorai Independent Director Ms. Kalpana Morparia Independent Director
Mr. O. P. Bhatt Independent Director Dr. Sanjiv Misra Independent Director
Auditors ‐ BSR & Co. LLP
*as per last annual report

14 Edelweiss Securities Limited
Company Absolute
reco Relative
reco Relative
risk
Company Absolute
reco
Relative
reco
Relative
Risk
Asian Paints BUY SO M Bajaj Corp HOLD SU H
Berger Paints BUY SO L Britannia Industries BUY SO L
Colgate HOLD SP M Dabur BUY SO M
Emami BUY SO H GlaxoSmithKline Consumer
Healthcare
HOLD SU M
Godrej Consumer BUY SO H Hindustan Unilever HOLD SP L
ITC HOLD SP M Marico BUY SO M
Nestle Ltd HOLD SP L Pidilite Industries BUY SO M
United Spirits HOLD SP H
RATING & INTERPRETATION
ABSOLUTE RATING
Ratings Expected absolute returns over 12 months
Buy More than 15%
Hold Between 15% and - 5%
Reduce Less than -5%
RELATIVE RETURNS RATING
Ratings Criteria
Sector Outperformer (SO) Stock return > 1.25 x Sector return
Sector Performer (SP) Stock return > 0.75 x Sector return
Stock return < 1.25 x Sector return
Sector Underperformer (SU) Stock return < 0.75 x Sector return
Sector return is market cap weighted average return for the coverage universe within the sector
RELATIVE RISK RATING
Ratings Criteria
Low (L) Bottom 1/3rd percentile in the sector
Medium (M) Middle 1/3rd percentile in the sector
High (H) Top 1/3rd percentile in the sector
Risk ratings are based on Edelweiss risk model
SECTOR RATING
Ratings Criteria
Overweight (OW) Sector return > 1.25 x Nifty return
Equalweight (EW) Sector return > 0.75 x Nifty return
Sector return < 1.25 x Nifty return
Underweight (UW) Sector return < 0.75 x Nifty return

15 Edelweiss Securities Limited
Hindustan Unilever
Edelweiss Securities Limited, Edelweiss House, off C.S.T. Road, Kalina, Mumbai – 400 098.
Board: (91‐22) 4009 4400, Email: [email protected]
Aditya Narain
Head of Research
Coverage group(s) of stocks by primary analyst(s): Consumer Goods
Asian Paints, Bajaj Corp, Berger Paints, Britannia Industries, Colgate, Dabur, Godrej Consumer, Emami, Hindustan Unilever, ITC, Marico, Nestle Ltd, Pidilite Industries, GlaxoSmithKline Consumer Healthcare, United Spirits
Distribution of Ratings / Market Cap
Edelweiss Research Coverage Universe
Rating Distribution* 161 67 11 240* 1stocks under review
Market Cap (INR) 156 62 11
Date Company Title Price (INR) Recos
Recent Research
24‐Oct‐17 AsianPaints
Volume looks up; inflationary input cost a drag ; Result Update
1,223 Buy
16‐Oct‐17 Colgate Palmolive
Volumes extend decline; all eyes on innovation; Result Update
1,603 Hold
13‐Oct‐17 BajajCorp
Volumes recoup to positive trajectory; Result Update
415 Hold
> 50bn Between 10bn and 50 bn < 10bn
Buy Hold Reduce Total
Rating Interpretation
Buy appreciate more than 15% over a 12‐month period
Hold appreciate up to 15% over a 12‐month period
Reduce depreciate more than 5% over a 12‐month period
Rating Expected to
One year price chart
400
600
800
1,000
1,200
1,400
Oct‐16
Nov‐16
Dec‐16
Jan‐17
Feb‐17
Mar‐17
Apr‐17
May‐17
Jun‐17
Jul‐17
Aug‐17
Sep‐17
Oct‐17
(INR)
Hindustan Unilever

16 Edelweiss Securities Limited
Consumer Goods
DISCLAIMER
Edelweiss Securities Limited (“ESL” or “Research Entity”) is regulated by the Securities and Exchange Board of India (“SEBI”) and is licensed to carry on the business of broking, depository services and related activities. The business of ESL and its Associates (list available on www.edelweissfin.com) are organized around five broad business groups – Credit including Housing and SME Finance, Commodities, Financial Markets, Asset Management and Life Insurance.
This Report has been prepared by Edelweiss Securities Limited in the capacity of a Research Analyst having SEBI Registration No.INH200000121 and distributed as per SEBI (Research Analysts) Regulations 2014. This report does not constitute an offer or solicitation for the purchase or sale of any financial instrument or as an official confirmation of any transaction. Securities as defined in clause (h) of section 2 of the Securities Contracts (Regulation) Act, 1956 includes Financial Instruments and Currency Derivatives. The information contained herein is from publicly available data or other sources believed to be reliable. This report is provided for assistance only and is not intended to be and must not alone be taken as the basis for an investment decision. The user assumes the entire risk of any use made of this information. Each recipient of this report should make such investigation as it deems necessary to arrive at an independent evaluation of an investment in Securities referred to in this document (including the merits and risks involved), and should consult his own advisors to determine the merits and risks of such investment. The investment discussed or views expressed may not be suitable for all investors.
This information is strictly confidential and is being furnished to you solely for your information. This information should not be reproduced or redistributed or passed on directly or indirectly in any form to any other person or published, copied, in whole or in part, for any purpose. This report is not directed or intended for distribution to, or use by, any person or entity who is a citizen or resident of or located in any locality, state, country or other jurisdiction, where such distribution, publication, availability or use would be contrary to law, regulation or which would subject ESL and associates / group companies to any registration or licensing requirements within such jurisdiction. The distribution of this report in certain jurisdictions may be restricted by law, and persons in whose possession this report comes, should observe, any such restrictions. The information given in this report is as of the date of this report and there can be no assurance that future results or events will be consistent with this information. This information is subject to change without any prior notice. ESL reserves the right to make modifications and alterations to this statement as may be required from time to time. ESL or any of its associates / group companies shall not be in any way responsible for any loss or damage that may arise to any person from any inadvertent error in the information contained in this report. ESL is committed to providing independent and transparent recommendation to its clients. Neither ESL nor any of its associates, group companies, directors, employees, agents or representatives shall be liable for any damages whether direct, indirect, special or consequential including loss of revenue or lost profits that may arise from or in connection with the use of the information. Our proprietary trading and investment businesses may make investment decisions that are inconsistent with the recommendations expressed herein. Past performance is not necessarily a guide to future performance .The disclosures of interest statements incorporated in this report are provided solely to enhance the transparency and should not be treated as endorsement of the views expressed in the report. The information provided in these reports remains, unless otherwise stated, the copyright of ESL. All layout, design, original artwork, concepts and other Intellectual Properties, remains the property and copyright of ESL and may not be used in any form or for any purpose whatsoever by any party without the express written permission of the copyright holders.
ESL shall not be liable for any delay or any other interruption which may occur in presenting the data due to any reason including network (Internet) reasons or snags in the system, break down of the system or any other equipment, server breakdown, maintenance shutdown, breakdown of communication services or inability of the ESL to present the data. In no event shall ESL be liable for any damages, including without limitation direct or indirect, special, incidental, or consequential damages, losses or expenses arising in connection with the data presented by the ESL through this report.
We offer our research services to clients as well as our prospects. Though this report is disseminated to all the customers simultaneously, not all customers may receive this report at the same time. We will not treat recipients as customers by virtue of their receiving this report.
ESL and its associates, officer, directors, and employees, research analyst (including relatives) worldwide may: (a) from time to time, have long or short positions in, and buy or sell the Securities, mentioned herein or (b) be engaged in any other transaction involving such Securities and earn brokerage or other compensation or act as a market maker in the financial instruments of the subject company/company(ies) discussed herein or act as advisor or lender/borrower to such company(ies) or have other potential/material conflict of interest with respect to any recommendation and related information and opinions at the time of publication of research report or at the time of public appearance. ESL may have proprietary long/short position in the above mentioned scrip(s) and therefore should be considered as interested. The views provided herein are general in nature and do not consider risk appetite or investment objective of any particular investor; readers are requested to take independent professional advice before investing. This should not be construed as invitation or solicitation to do business with ESL.

17 Edelweiss Securities Limited
Hindustan Unilever
ESL or its associates may have received compensation from the subject company in the past 12 months. ESL or its associates may have managed or co‐managed public offering of securities for the subject company in the past 12 months. ESL or its associates may have received compensation for investment banking or merchant banking or brokerage services from the subject company in the past 12 months. ESL or its associates may have received any compensation for products or services other than investment banking or merchant banking or brokerage services from the subject company in the past 12 months. ESL or its associates have not received any compensation or other benefits from the Subject Company or third party in connection with the research report. Research analyst or his/her relative or ESL’s associates may have financial interest in the subject company. ESL and/or its Group Companies, their Directors, affiliates and/or employees may have interests/ positions, financial or otherwise in the Securities/Currencies and other investment products mentioned in this report. ESL, its associates, research analyst and his/her relative may have other potential/material conflict of interest with respect to any recommendation and related information and opinions at the time of publication of research report or at the time of public appearance.
Participants in foreign exchange transactions may incur risks arising from several factors, including the following: ( i) exchange rates can be volatile and are subject to large fluctuations; ( ii) the value of currencies may be affected by numerous market factors, including world and national economic, political and regulatory events, events in equity and debt markets and changes in interest rates; and (iii) currencies may be subject to devaluation or government imposed exchange controls which could affect the value of the currency. Investors in securities such as ADRs and Currency Derivatives, whose values are affected by the currency of an underlying security, effectively assume currency risk.
Research analyst has served as an officer, director or employee of subject Company: No
ESL has financial interest in the subject companies: No
ESL’s Associates may have actual / beneficial ownership of 1% or more securities of the subject company at the end of the month immediately preceding the date of publication of research report.
Research analyst or his/her relative has actual/beneficial ownership of 1% or more securities of the subject company at the end of the month immediately preceding the date of publication of research report: No
ESL has actual/beneficial ownership of 1% or more securities of the subject company at the end of the month immediately preceding the date of publication of research report: No
Subject company may have been client during twelve months preceding the date of distribution of the research report.
There were no instances of non‐compliance by ESL on any matter related to the capital markets, resulting in significant and material disciplinary action during the last three years except that ESL had submitted an offer of settlement with Securities and Exchange commission, USA (SEC) and the same has been accepted by SEC without admitting or denying the findings in relation to their charges of non registration as a broker dealer.
A graph of daily closing prices of the securities is also available at www.nseindia.com
Analyst Certification:
The analyst for this report certifies that all of the views expressed in this report accurately reflect his or her personal views about the subject company or companies and its or their securities, and no part of his or her compensation was, is or will be, directly or indirectly related to specific recommendations or views expressed in this report.
Additional Disclaimers
Disclaimer for U.S. Persons
This research report is a product of Edelweiss Securities Limited, which is the employer of the research analyst(s) who has prepared the research report. The research analyst(s) preparing the research report is/are resident outside the United States (U.S.) and are not associated persons of any U.S. regulated broker‐dealer and therefore the analyst(s) is/are not subject to supervision by a U.S. broker‐dealer, and is/are not required to satisfy the regulatory licensing requirements of FINRA or required to otherwise comply with U.S. rules or regulations regarding, among other things, communications with a subject company, public appearances and trading securities held by a research analyst account.
This report is intended for distribution by Edelweiss Securities Limited only to "Major Institutional Investors" as defined by Rule 15a‐6(b)(4) of the U.S. Securities and Exchange Act, 1934 (the Exchange Act) and interpretations thereof by U.S. Securities and Exchange Commission (SEC) in reliance on Rule 15a 6(a)(2). If the recipient of this report is not a Major Institutional Investor as specified above, then it should not act upon this report and return the same to the sender. Further, this report may not be copied, duplicated and/or transmitted onward to any U.S. person, which is not the Major Institutional Investor.

18 Edelweiss Securities Limited
Consumer Goods
Access the entire repository of Edelweiss Research on www.edelresearch.com
In reliance on the exemption from registration provided by Rule 15a‐6 of the Exchange Act and interpretations thereof by the SEC in order to conduct certain business with Major Institutional Investors, Edelweiss Securities Limited has entered into an agreement with a U.S. registered broker‐dealer, Edelweiss Financial Services Inc. ("EFSI"). Transactions in securities discussed in this research report should be effected through Edelweiss Financial Services Inc. Disclaimer for U.K. Persons
The contents of this research report have not been approved by an authorised person within the meaning of the Financial Services and Markets Act 2000 ("FSMA"). In the United Kingdom, this research report is being distributed only to and is directed only at (a) persons who have professional experience in matters relating to investments falling within Article 19(5) of the FSMA (Financial Promotion) Order 2005 (the “Order”); (b) persons falling within Article 49(2)(a) to (d) of the Order (including high net worth companies and unincorporated associations); and (c) any other persons to whom it may otherwise lawfully be communicated (all such persons together being referred to as “relevant persons”). This research report must not be acted on or relied on by persons who are not relevant persons. Any investment or investment activity to which this research report relates is available only to relevant persons and will be engaged in only with relevant persons. Any person who is not a relevant person should not act or rely on this research report or any of its contents. This research report must not be distributed, published, reproduced or disclosed (in whole or in part) by recipients to any other person. Disclaimer for Canadian Persons
This research report is a product of Edelweiss Securities Limited ("ESL"), which is the employer of the research analysts who have prepared the research report. The research analysts preparing the research report are resident outside the Canada and are not associated persons of any Canadian registered adviser and/or dealer and, therefore, the analysts are not subject to supervision by a Canadian registered adviser and/or dealer, and are not required to satisfy the regulatory licensing requirements of the Ontario Securities Commission, other Canadian provincial securities regulators, the Investment Industry Regulatory Organization of Canada and are not required to otherwise comply with Canadian rules or regulations regarding, among other things, the research analysts' business or relationship with a subject company or trading of securities by a research analyst. This report is intended for distribution by ESL only to "Permitted Clients" (as defined in National Instrument 31‐103 ("NI 31‐103")) who are resident in the Province of Ontario, Canada (an "Ontario Permitted Client"). If the recipient of this report is not an Ontario Permitted Client, as specified above, then the recipient should not act upon this report and should return the report to the sender. Further, this report may not be copied, duplicated and/or transmitted onward to any Canadian person. ESL is relying on an exemption from the adviser and/or dealer registration requirements under NI 31‐103 available to certain international advisers and/or dealers. Please be advised that (i) ESL is not registered in the Province of Ontario to trade in securities nor is it registered in the Province of Ontario to provide advice with respect to securities; (ii) ESL's head office or principal place of business is located in India; (iii) all or substantially all of ESL's assets may be situated outside of Canada; (iv) there may be difficulty enforcing legal rights against ESL because of the above; and (v) the name and address of the ESL's agent for service of process in the Province of Ontario is: Bamac Services Inc., 181 Bay Street, Suite 2100, Toronto, Ontario M5J 2T3 Canada. Disclaimer for Singapore Persons
In Singapore, this report is being distributed by Edelweiss Investment Advisors Private Limited ("EIAPL") (Co. Reg. No. 201016306H) which is a holder of a capital markets services license and an exempt financial adviser in Singapore and (ii) solely to persons who qualify as "institutional investors" or "accredited investors" as defined in section 4A(1) of the Securities and Futures Act, Chapter 289 of Singapore ("the SFA"). Pursuant to regulations 33, 34, 35 and 36 of the Financial Advisers Regulations ("FAR"), sections 25, 27 and 36 of the Financial Advisers Act, Chapter 110 of Singapore shall not apply to EIAPL when providing any financial advisory services to an accredited investor (as defined in regulation 36 of the FAR. Persons in Singapore should contact EIAPL in respect of any matter arising from, or in connection with this publication/communication. This report is not suitable for private investors.
Copyright 2009 Edelweiss Research (Edelweiss Securities Ltd). All rights reserved