Embed Size (px)
Citation preview
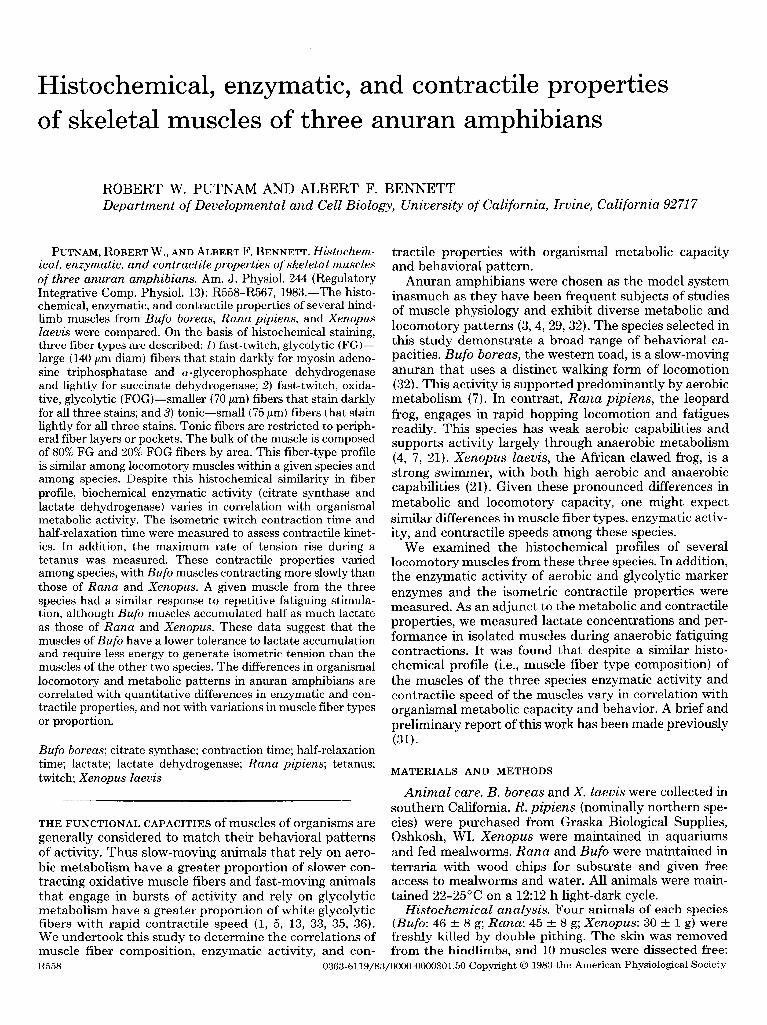
Histochemical, enzymatic, and contractile properties of skeletal muscles of three anuran amphibians
ROBERT W. PUTNAM AND ALBERT F. BENNETT Department of Developmental and Cell Biology, University of California, Irvine, California 92717
PUTNAM,ROBERT W., ANDALBERT F. BENNETT. Histochem- ical, enzymatic, and contractile properties of skeletal muscles of three anuran amphibians. Am. J. Physiol. 244 (Regulatory Integrative Comp. Physiol. 13): R558-R567, 1983.-The histo- chemical, enzymatic, and contractile properties of several hind- limb muscles from Bufo boreas, Rana pipiens, and Xenopus Zaeuis were compared. On the basis of histochemical staining, three fiber types are described: I) fast-twitch, glycolytic (FG)- large (140 pm diam) fibers that stain darkly for myosin adeno- sine triphosphatase and cw-glycerophosphate dehydrogenase and lightly for succinate dehydrogenase; 2) fast-twitch, oxida- tive, glycolytic (FOG)-smaller (70 ,um) fibers that stain darkly for all three stains; and 3) tonic -small (75 pm) fibers that stain lightly for all three stains. Tonic fibers are restricted to periph- eral fiber layers or pockets. The bulk of the muscle is composed of 80% FG and 20% FOG fibers by area. This fiber-type profile is similar among locomotory muscles within a given species and among species. Despite this histochemical similarity in fiber profile, biochemical enzymatic activity (citrate synthase and lactate dehydrogenase) varies in correlation with organismal metabolic activity. The isometric twitch contraction time and half-relaxation time were measured to assess contractile kinet- ics. In addition, the maximum rate of tension rise during a tetanus was measured. These contractile properties varied among species, with Bufo muscles contracting more slowly than those of Rana and Xenopus. A given muscle from the three species had a similar response to repetitive fatiguing stimula- tion, although Bufo muscles accumulated half as much lactate as those of Rana and Xenopus. These data suggest that the muscles of Bufo have a lower tolerance to lactate accumulation and require less energy to generate isometric tension than the muscles of the other two species. The differences in organismal locomotory and metabolic patterns in anuran amphibians are correlated with quantitative differences in enzymatic and con- tractile properties, and not with variations in muscle fiber types or proportion.
Bufo boreas; citrate synthase; contraction time; half-relaxation time; lactate; lactate dehydrogenase; Rana pipiens; tetanus; twitch; Xenopus Zaevis
THE FUNCTIONAL CAPACITIES Of muscles Of Organisms are generally considered to match their behavioral patterns of activity. Thus slow-moving animals that rely on aero- bic metabolism have a greater proportion of slower con- tracting oxidative muscle fibers and fast-moving animals that engage in bursts of activity and rely on glycolytic metabolism have a greater proportion of white glycolytic fibers with rapid contractile speed (1, 5, 13, 33, 35, 36). We undertook this study to determine the correlations of muscle fiber composition, enzymatic activity, and con-
tractile properties with organismal metabolic capacity and behavioral pattern.
Anuran amphibians were chosen as the model system inasmuch as they have been frequent subjects of studies of muscle physiology and exhibit diverse metabolic and locomotory patterns (3,4,29,32). The species selected in this study demonstrate a broad range of behavioral ca- pacities. Bufo boreas, the western toad, is a slow-moving anuran that uses a distinct walking form of locomotion (32). This activity is supported predominantly by aerobic metabolism (7). In contrast, Rana pipiens, the leopard frog, engages in rapid hopping locomotion and fatigues readily. This species has weak aerobic capabilities and supports activity largely through anaerobic metabolism (4, 7, 21). Xenopus laevis, the African clawed frog, is a strong swimmer, with both high aerobic and anaerobic capabilities (21). Given these pronounced differences in metabolic and locomotory capacity, one might expect similar differences in muscle fiber types, enzymatic activ- ity, and contractile speeds among these species.
We examined the histochemical profiles of several locomotory muscles from these three species. In addition, the enzymatic activity of aerobic and glycolytic marker enzymes and the isometric contractile properties were measured. As an adjunct to the metabolic and contractile properties, we measured lactate concentrations and per- formance in isolated muscles during anaerobic fatiguing contractions. It was found that despite a similar histo- chemical profile (i.e., muscle fiber type composition) of the muscles of the three species enzymatic activity and contractile speed of the muscles vary in correlation with organismal metabolic capacity and behavior. A brief and preliminary report of this work has been made previously (31) .
MATERIALS AND METHODS
Animal care. B. boreas and X. laevis were collected in southern California. R . pipiens (nominally northern spe- ties) were purchased from Graska Biological Supplies, Oshkosh, WI. Xenopus were maintained in aquariums and fed mealworms. Rana and Bufo were maintained in terraria with wood chips for substrate and given free access to mealworms and water. All animals were main- tained 22-25°C on a 12:12 h light-dark cycle.
Histochemical analysis. Four animals of each species (Bufo: 46 t 8 g; Rana: 45 t 8 g; Xenopus: 30 t 1 g) were freshly killed by double pithing. The skin was removed from the hindlimbs, and 10 muscles were dissected free:
R558 0363-6119/83/0000-0000$01.50 Copyright 0 1983 the American Physiological Society
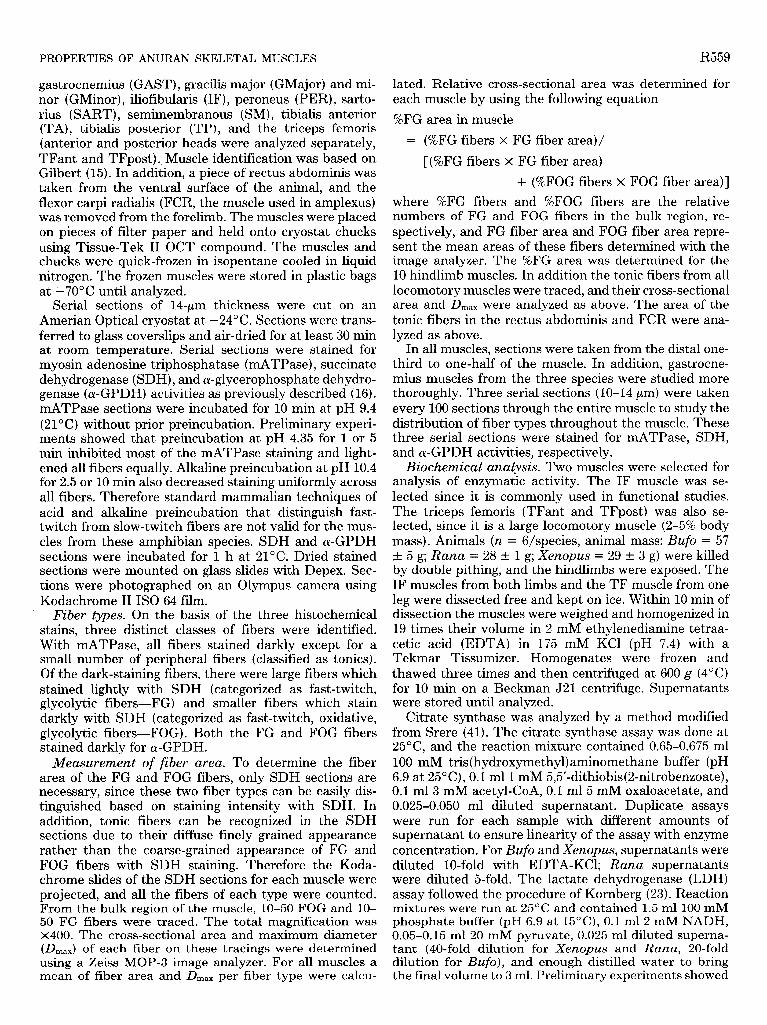
PROPERTIES OF ANURAN SKELETAL MUSCLES R559
gastrocnemius (GAST), gracilis major (GMajor) and mi- nor (GMinor) , iliofibularis (IF), peroneus (PER), sarto- rius (SART), semimembranous (SM), tibialis anterior (?‘A), tibialis posterior (TP), and the triceps femoris (anterior and posterior heads were analyzed separately, TFant and TFpost). Muscle identification was based on Gilbert (15). In addition, a piece of rectus abdominis was taken from the ventral surface of the animal, and the flexor carpi radialis (FCR, the muscle used in amplexus) was removed from the forelimb. The muscles were placed on pieces of filter paper and held onto cryostat chucks using Tissue-Tek II OCT compound. The muscles and chucks were quick-frozen in isopentane cooled in liquid nitrogen. The frozen muscles were stored in plastic bags at -70°C until analyzed.
Serial sections of 14-pm thickness were cut on an Amerian Optical cryostat at -24°C. Sections were trans- ferred to glass coverslips and air-dried for at least 30 min at room temperature. Serial sections were stained for myosin adenosine triphosphatase (mATPase), succinate dehydrogenase (SDH), and cu-glycerophosphate dehydro- genase (c~-GPDH) activities as previously described (16). mATPase sections were incubated for 10 min at pH 9.4 (21 O C) without prior preincubation. Preliminary experi- ments showed that preincubation at pH 4.35 for 1 or 5 min inhibited most of the mATPase staining and light- ened all fibers equally. Alkaline preincubation at pH 10.4 for 2.5 or 10 min also decreased staining uniformly across all fibers. Therefore standard mammalian techniques of acid and alkaline preincubation that distinguish fast- twitch from slow-twitch fibers are not valid for the mus- cles from these amphibian species. SDH and a-GPDH sections were incubated for 1 h at 21°C. Dried stained sections were mounted on glass slides with Depex. Sec- tions were photographed on an Olympus camera using Kodachrome II IS0 64 film.
Fiber types. On the basis of the three histochemical stains, three distinct classes of fibers were identified. With mATPase, all fibers stained darkly except for a small number of peripheral fibers (classified as tonics). Of the dark-staining fibers, there were large fibers which stained lightly with SDH (categorized as fast-twitch, glycolytic fibers- FG) and smaller fibers which stain darkly with SDH (categorized as fast-twitch, oxidative, glycolytic fibers- FOG). Both the FG and FOG fibers stained darkly for c~-GPDH.
Measurement of fiber area. To determine the fiber area of the FG and FOG fibers, only SDH sections are necessary, since these two fiber types can be easily dis- tinguished based on staining intensity with SDH. In addition, tonic fibers can be recognized in the SDH sections due to their diffuse finely grained appearance rather than the coarse-grained appearance of FG and FOG fibers with SDH staining. Therefore the Koda- chrome slides of the SDH sections for each muscle were projected, and all the fibers of each type were counted. From the bulk region of the muscle, lo-50 FOG and lo- 50 FG fibers were traced. The total magnification was x400. The cross-sectional area and maximum diameter (Dmax) of each fiber on these tracings were determined using a Zeiss MOP-3 image analyzer. For all muscles a mean of fiber area and D,,, per fiber type were calcu-
lated . . Relative each muscle by
cross- using
sectional area was determined the following equation
%FG area in muscle
= (%FG fibers x FG fiber area)/
[ (%FG fibers x FG fiber area)
for
+ (%FOG fibers x FOG fiber area)]
where %FG fibers and %FOG fibers are the relative numbers of FG and FOG fibers in the bulk region, re- spectively, and FG fiber area and FOG fiber area repre- sent the mean areas of these fibers determined with the image analyzer. The %FG area was determined for the 10 hindlimb muscles. In addition the tonic fibers from all locomotory muscles were traced, and their cross-sectional area and Dmax were analyzed as above. The area of the tonic fibers in the rectus abdominis and FCR were ana- lyzed as above.
In all muscles, sections were taken from the distal one- third to one-half of the muscle. In addition, gastrocne- mius muscles from the three species were studied more thoroughly. Three serial sections (lo-14 pm) were taken every 100 sections through the entire muscle to study the distribution of fiber types throughout the muscle. These three serial sections were stained for mATPase, SDH, and a-GPDH activities, respectively.
Biochemical analysis. Two muscles were selected for analysis of enzymatic activity. The IF muscle was se- lected since it is commonly used in functional studies. The triceps femoris (TFant and TFpost) was also se- lected, since it is a large locomotory muscle (2-5% body mass). Animals (n = G/species, animal mass: Bufo = 57 t 5 g; Rana = 28 t 1 g; Xenopus = 29 t 3 g) were killed by double pithing, and the hindlimbs were exposed. The IF muscles from both limbs and the TF muscle from one leg were dissected free and kept on ice. Within 10 min of dissection the muscles were weighed and homogenized in 19 times their volume in 2 mM ethylenediamine tetraa- cetic acid (EDTA) in 175 mM KC1 (pH 7.4) with a Tekmar Tissumizer. Homogenates were frozen and thawed three times and then centrifuged at 600 g (4°C) for 10 min on a Beckman 521 centrifuge. Supernatants were stored until analyzed.
Citrate synthase was analyzed by a method modified from Srere (41). The citrate synthase assay was done at 25OC, and the reaction mixture contained 0.65-0.675 ml 100 mM tris(hydroxymethyl)aminomethane buffer (pH 6.9 at 25”C), 0.1 ml 1 mM 5,5’-dithiobis(2-nitrobenzoate), 0.1 ml 3 mM acetyl-CoA, 0.1 ml 5 mM oxaloacetate, and 0.025-0.050 ml diluted supernatant. Duplicate assays were run for each sample with different amounts of supernatant to ensure linearity of the assay with enzyme concentration. For Bufo and Xenopus, supernatants were diluted lo-fold with EDTA-KCl; Rana supernatants were diluted 5-fold. The lactate dehydrogenase (LDH) assay followed the procedure of Kornberg (23). Reaction mixtures were run at 25°C and contained 1.5 ml 100 mM phosphate buffer (pH 6.9 at 15”C), 0.1 ml 2 mM NADH, 0.05-0.15 ml 20 mM pyruvate, 0.025 ml diluted superna- tant (40-fold dilution for Xenopus and Rana, 20-fold dilution for Bufo), and enough distilled water to bring the final volume to 3 ml. Preliminary experiments showed
R560 R. W. PUTNAM AND A. F. BENNETT
maximal LDH activity occurred between 0.33 and 0.66 mM pyruvate for Bufo and Rana and between 0.66 and 1.0 mM pyruvate for Xenopus. Each sample was there- fore assayed at these concentrations. The duplicates agreed closely with each other, and the higher activity was used. The protein content of the supernatants was determined using the biuret technique. All enzyme activ- ities are expressed in terms of micromoles of product per minute and gram of muscle (U/g muscle) or micromoles of product per minute and gram of protein (U/g protein).
Contractile properties and fatigue. All animals were killed by double pithing. The skin was removed from the hindlimbs, and the iliofibularis and gastrocnemius mus- cles from both legs were dissected free and placed in a dish of Ringer solution (14) at pH 7.4 and 23-24OC. The gastrocnemius muscles were removed with the femur still attached.
One of the gastrocnemius muscles was attached to a Grass FTl0.C force transducer by a silver chain tied to the Achilles tendon with 00 surgical silk. The femur was secured in a bone clamp. The muscle was suspended between two platinum S-shaped surface electrodes ar- ranged so that current would pass transversely through the muscle. Muscle length was adjusted to give maximal isometric twitch response. The muscle was kept moist with Ringer solution (14). One iliofibularis muscle was treated identically except the tendon of origin was tied to the bone clamp with 00 surgical silk.
The output of the transducers went to a polygraph and to an oscilloscope. The system had a half-amplitude frequency of 50 Hz and a O-100% response time of 18 ms. Stimulation consisted of I-ms square-wave pulses of 20- 80 V (gastrocnemius) or 2-20 V (iliofibularis). The stim- ulation regime was the same for all muscles. The con- traction time (CT, time from first mechanical response to maximal twitch height), half-relaxation time (RTl,z, time from maximal twitch height to one-half of maximal twitch height during relaxation), and maximal twitch tension (Pt) were determined on a single twitch. Next, a series of 0.5 s tetani were given from 20 to 100 Hz to determine maximal tetanic tension (PO). The maximal rate of tension rise (dP,/dt) was determined from the slope of the linear rising portion of the tetanic tension curve. Another twitch was measured after the tetanic measurements to see whether any fatigue had occurred. The maximum change in twitch parameters was a de- crease in P, to 88%, a 12-ms increase in CT, and a 28-ms increase in RT1,2, all in gastrocnemius muscles from Rana. Other muscles showed less change in twitch pa- rameters. Fatigue curves were then measured by stimu- lating the muscles to give isometric twitches at 1 Hz (l- ms pulses) for 5 min. Within 30 s of fatigue, three addi- tional twitches were measured to assess the effect of fatigue on twitch parameters. The muscle was then rap- idly trimmed free of bone and tendons and frozen in liquid nitrogen. The contralateral muscle, which was soaked in Ringer solution the entire time, was also frozen in liquid nitrogen. These muscles were stored frozen at -7OOC for later lactate analysis. After each stimulation regime, the transducer was calibrated by hanging weights from it. The entire procedure took at most 2 h for each animal.
A second set of experiments was done to assess the energetic changes associated with fatigue. Gastrocnemius muscles were removed and stimulated as previously de- scribed (30). Briefly, the- gastrocnemius muscle was placed vertically in a Plexiglas chamber and stimulated transversely. Humidified nitrogen gas (22-24 O C) perfused the chamber to eliminate aerobic metabolism. Muscles were stimulated to a fixed level of fatigue, 10% maximum Pt, at a frequency of 1 Hz. Tension was measured with a Grass FTl0.C force transducer and monitored on a Grass model 5 polygraph. After fatigue, stimulated muscles were frozen in liquid nitrogen, whereas control muscles were frozen in liquid nitrogen immediately after dissec- tion. These muscles were stored at -7OOC for later anal- ysis of lactate content.
Frozen muscles were weighed to the nearest milligram and homogenized in 20-40 times their weight of ice-cold 0.6 N perchloric acid. The homogenates were spun for 15 min at maximum speed on an IEC clinical centrifuge. The lactate content of the supernatant was determined with a Boehringer-Mannheim single vial lactate kit after filtration through a Millipore filter.
The tensions generated by the muscles are expressed in units of kilonewtons per square meter of muscle cross- sectional area (kN/m2). Cross-sectional area was calcu- lated as the ratio of muscle mass to muscle length. This method is accurate for a parallel-fibered muscle (iliofi- bularis) but underestimates actual cross-sectional area in a pinnate muscle (gastrocnemius).
Statistics. All values are expressed as means t SE. Paired comparisons were done with t tests, and three means were compared with a one-way analysis of vari- ance (9) using Scheffe’s technique for multiple paired comparisons (34). The fatigue curves were compared with a Kruskal-Wallis rank sums test (22). All tests were two-tailed with a level of significance of 0.05.
RESULTS
Fiber types. Three distinct types of fibers could be distinguished on the basis of histochemical staining (Fig. 1, A-C). The first fiber type is composed of large fast- twitch, glycolytic (FG) fibers, which stain darkly for mATPase and c~-GPDH and lightly for SDH. The second fiber type includes variable-sized fast-twitch, oxidative, glycolytic (FOG) fibers. These fibers stain moderately to darkly for mATPase and darkly for both SDH and cy- GPDH. The final fiber type consists of presumed tonic fibers, staining lightly for mATPase and cx-GPDH and lightly to moderately for SDH. When stained for SDH, tonic fibers have a fine-grained appearance rather than the usual coarse-grained pattern seen with SDH staining of fast fibers.
The fiber areas and Dmax are shown in Table 1. The diameters measured are maximal diameters and are about 25-30% larger than average diameters, assuming muscle fibers are circular in cross section. The FG fibers are three to four times larger than the FOG fibers or tonic fibers. Among species, Xenopus has significantly larger FG fibers than Bufo or Rana; Bufo has signifi- cantly larger tonic fibers than the other two species (Table 1). FOG fibers do not differ in size among the species.
PROPERTIES OF ANURAN SKELETAL MUSCLES R561
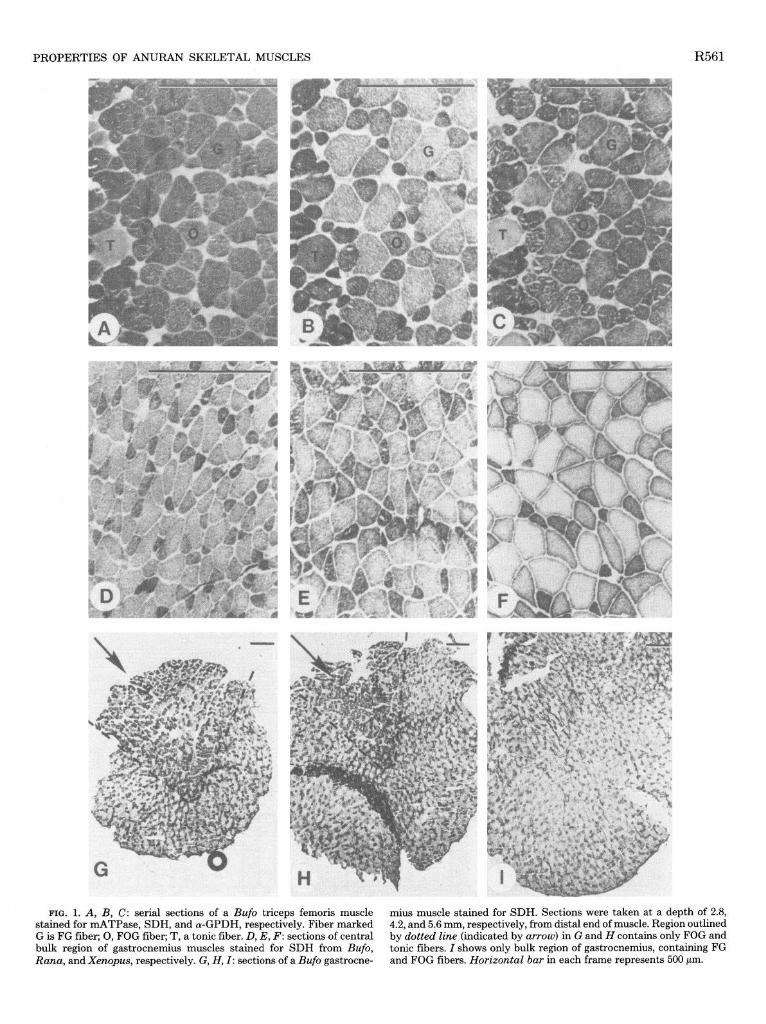
FIG. 1. A, B, C: serial sections of a Bafo triceps femoris muscle stained for mATPase, SDH, and (Y-GPDH, respectively. Fiber marked G is FG fiber; 0, FOG fiber; T, a tonic fiber. D, E, F: sections of central bulk region of gastrocnemius muscles stained for SDH from Bufo, Rana, and Xenopus, respectively. G, H, I: sections of a Bufo gastrocne-
mius muscle stained for SDH. Sections were taken at a depth of 2.8, 4.2, and 5.6 mm, respectively, from distal end of muscle. Region outlined by dotted line (indicated by arrow) in G and H contains only FOG and tonic fibers. I shows only bulk region of gastrocnemius, containing FG and FOG fibers. Horizontal bar in each frame represents 500 pm.
R. W. PUTNAM AND A. F. BENNETT R562
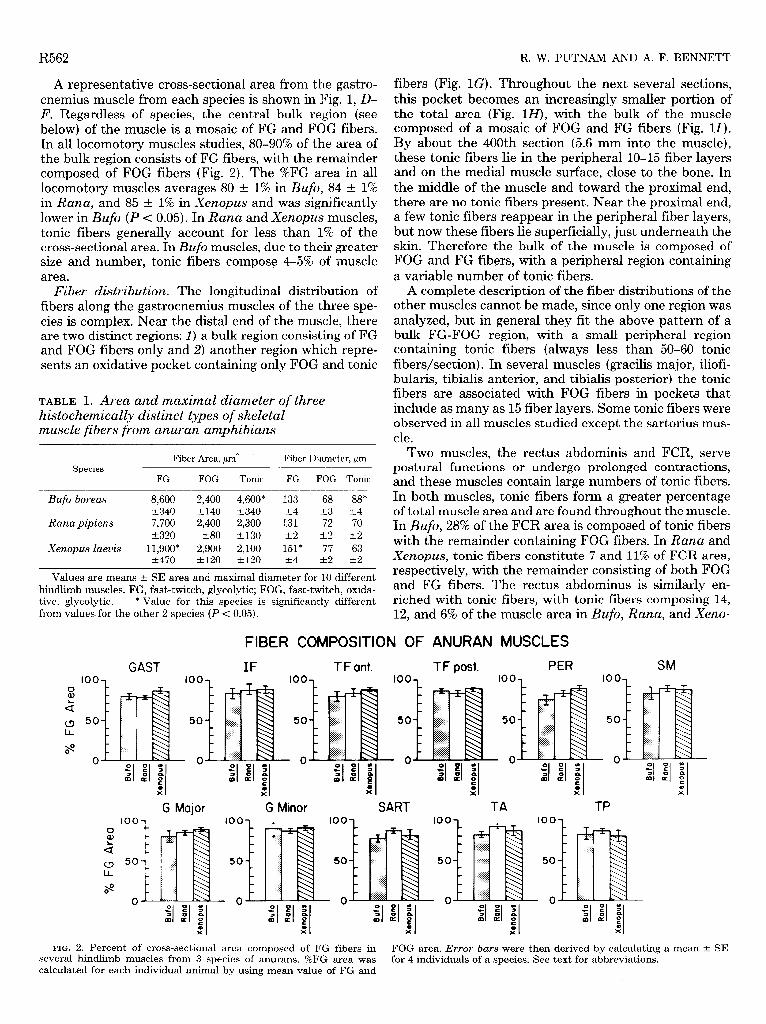
A representative cross-sectional area from the gastro- cnemius muscle from each species is shown in Fig. 1, D- F. Regardless of species, the central bulk region (see below) of the muscle is a mosaic of FG and FOG fibers. In all locomotory muscles studies, 80-90% of th.e area of the bulk region consists of FG fibers, with the remainder composed of FOG fibers (Fig. 2). The %FG area in all locomotory muscles averages 80 t 1% in Bufo, 84 t 1% in Rana, and 85 t 1% in Xenopus and was significantly lower in Bufo (P < 0.05). In Rana and Xenopus muscles, tonic fibers generally account for less than 1% of the cross-sectional area. In Bufo muscles, due to their greater size and number, tonic fibers compose 4-5% of muscle area.
Fiber distribution. The longitudinal distribution of fibers along the gastrocnemius muscles of the three spe- cies is complex. Near the distal end of the muscle, there are two distinct regions: 1) a bulk region consisting of FG and FOG fibers only and 2) another region which repre- sents an oxidative pocket containing only FOG and tonic
TABLE 1. Area and maximal diameter of three histochemically distinct types of skeletal muscle fibers from anuran amphibians
Fiber Area, pm” Fiber Diameter, ,um Species
FG FOG Tonic FG FOG Tonic
Bufo boreas 8,600 2,400 4,600" 133 68 88" t340 t140 -+340 t4 t3 t4
Rana pipiens 7,700 2,400 2,300 131 72 70 t320 t80 t130 t2 t,2 t2
Xenopus laevis 11,900" 2,900 2,100 El* 77 63 t470 t,120 +120 t4 ' t2 t2
Values are means t SE area and maximal diameter for 10 different hindlimb muscles. FG, fast-twitch, glycolytic; FOG, fast-twitch, oxida- tive, glycolytic. * Value for this species is significantly different from values for the other 2 species (P < 0.05).
fibers (Fig. 1G). Throughout the next several sections, this pocket becomes an increasingly smaller portion of the total area (Fig. lff), with the bulk of the muscle composed of a mosaic of FOG and FG fibers (Fig. 11). By about the 400th section (5.6 mm into the muscle), these tonic fibers lie in the peripheral lo-15 fiber layers and on the medial muscle surface, close to the bone. In the middle of the muscle and toward the proximal end, there are no tonic fibers present. Near the proximal end, a few tonic fibers reappear in the peripheral fiber layers, but now these fibers lie superficially, just underneath the skin. Therefore the bulk bf the muscle is composed of FOG and FG fibers, with a peripheral region containing a variable number of tonic fibers.
A complete description of the fiber distributions of the other muscles cannot be made, since only one region was analyzed, but in general they fit the above pattern of a bulk FG-FOG region, with a small peripheral region containing tonic fibers (always less than 50-60 tonic fibers/section). In several muscles (gracilis major, iliofi- bularis, tibialis anterior, and tibialis posterior) the tonic fibers are associated with FOG fibers in pockets that include as many as 15 fiber layers. Some tonic fibers were observed in all muscles studied except the sartorius mus- cle.
Two muscles, the rectus abdominis and FCR, serve postural functions or undergo prolonged contractions, and these muscles contain large numbers of tonic fibers. In both muscles, tonic fibers form a greater percentage of total muscle area and are found throughout the muscle. In Bufo, 28% of the FCR area is composed of tonic fibers with the remainder containing FOG fibers. In Rana and Xenopus, tonic fibers constitute 7 and 11% of FCR area, respectively, with the remainder consisting of both FOG and FG fibers. The rectus abdominus is similarly en- riched with tonic fibers, with tonic fibers composing 14, 12, and 6% of the muscle area in Bufo, Rana, and Xeno-
FIBER COMPOSITION OF ANURAN MUSCLES
GAST IF T F ant. TF post. PER SM 100
50
- 0 r
TA TP
100
50
- 0 i
100
50
-0
Minor SART G Major
FIG. 2. Percent of cross-sectional area composed of FG fibers in FOG area. Error bars were then derived by calculating a mean t SE several hindlimb muscles from 3 species of anurans. %FG area was for 4 individuals of a species. See text for abbreviations. calculated for each individual anitnal by using mean value of FG and

PROPERTIES OF ANURAN SKELETAL MUSCLES R563
TABLE 2. Properties of iliofibularis and gastrocnemius muscles fi-om three species of anuran amphibians
Species Body Mass, g Mass, g
Iliofibularis Muscle
Length, cm Area, cm’
Gastrocnemius Muscle
Mass, g Length, cm Area, cm2
Rana pipiens 35.38 t 2.22 0.071 t 0.005 2.50 Ilt 0.10 0.029 t 0.001 0.839 t 0.065 3.50 t 0.09 0.256 t 0.015 n 9 9 9 9 7 7 7
Xenopus laevis 20.93 t 1.50 0.038 t 0.004 1.73 t 0.05 0.022 t 0.002 0.506 zk 0.027 2.50 -+ 0.10 0.201 t 0.012 n 6 6 6 6 6 6 6
Bufo boreas 50.59 t 3.84 0.066 t, 0.007 2.15 t 0.05 0.031 t 0.004 0.293 t 0.027 2.30 z!x 0.06 0.129 t 0.013 n 7 7 7 7 7 7 7
Values are means t SE; n, sample size. Area, cross-sectional area = mass/length.
A IF TF
300 1
B
FIG. 3. A: citrate synthase activity measured in iliofibularis (IF) and triceps femoris (TF) muscle of 3 anuran species. B: lactate dehydrogen- ase activities in IF and TF muscles of 3 species of anurans. Height of bars represents mean; verticaZ lines, &SE.
pus, respectively. Enzyme activities. Despite the similarities in histo-
chemical profiles of the locomotory muscles, the meta- bolic enzyme activities are different in the three species (Fig. 3). The activity of citrate synthase, an oxidative marker enzyme, differs significantly among the species. In the IF muscle, citrate synthase activity is higher in Bufo (22 t 1 U/g muscle) and Xenopus (19 t 3 U/g muscle) than in Rana (5 t 1 U/g muscle), whereas in the TF muscle, citrate synthase activity varies with Xen- opus (26 t 3 U/g muscle) greater than Bufo (20 t 1 U/
TABLE 3. Contraction time and half-relaxation time of isometric twitches before and after fatigue in two muscles from three spectes of anuran amphibians -- - -
Iliofibularis Muscle Gastrocnemius Muscle
Species RT,2, n CT, ms ms n CT, ms RX/e,
ms
Rana$Gpiens Initial 9 51 47 7 54 36 t2 t7 k3 t6
Fatigue 8 71 114 7 85 188 +4 +14 k9 t20
Xenopus laevis Initial 6 43 42 6 51 38 t,2 t2 t2 t2
Fatigue 6 69 131 6 86 229 k5 t12 t4 t21
Bufo boreas Initial 7 65” 58 7 71” 43 k3 t5 t3 k5
Fatigue 6 107 224 6 103 204 t12 t50 tll k30
Values are means t SE; n, sample size. CT, contraction time; RTl,z, half-relaxation time. * Bufo muscle CTs significantly greater than those of Rana and Xenopus (P < 0.05).
g muscle), which was greater than Rana (7 t 1 U/g muscle (P < 0.05). Rana muscle LDH (a glycolytic marker enzyme) activity (108 t 7 U/g muscle) is signifi- cantly higher than Bufo (75 t 6 U/g muscle) and Xeno- pus (90 t 14 U/g muscle) LDH activities in the TF muscle, and Rana (82 t 7 U/g muscle) and Xenopus (94 t 11 U/g muscle) LDH activities are higher than Bufo (71 t 6 U/g muscle) in the IF muscle (P < 0.05). There- fore citrate synthase activities are higher in the species with greater aerobic capacity (Bufo and Xenopus in comparison with Rana), whereas LDH activities are higher in the species with high anaerobic capacities (Rana and Xenopus in comparison with Bufo).
Contractile properties. Muscle parameters are re- ported in Table 2. Both muscles from the three species had a fast-twitch response to a single stimulus (Table 3). The muscles from Bufo had a 30-50s longer CT than the same muscle from Rana or Xenopus (P < 0.05). This slower CT for Bufo muscles during a twitch correlates with the slower (dP,/dt) during a tetanus in Bufo muscles compared with Rana and Xenopus (Table 4). P, and P, were similar among the species for a given muscle (Table 4) .
Response of muscles to 5 min of stimulation. In re- sponse to 5 min of stimulation both the iliofibularis and gastrocnemius muscles fatigued readily and to a similar
R564 R. W. PUTNAM AND A. F. BENNETT
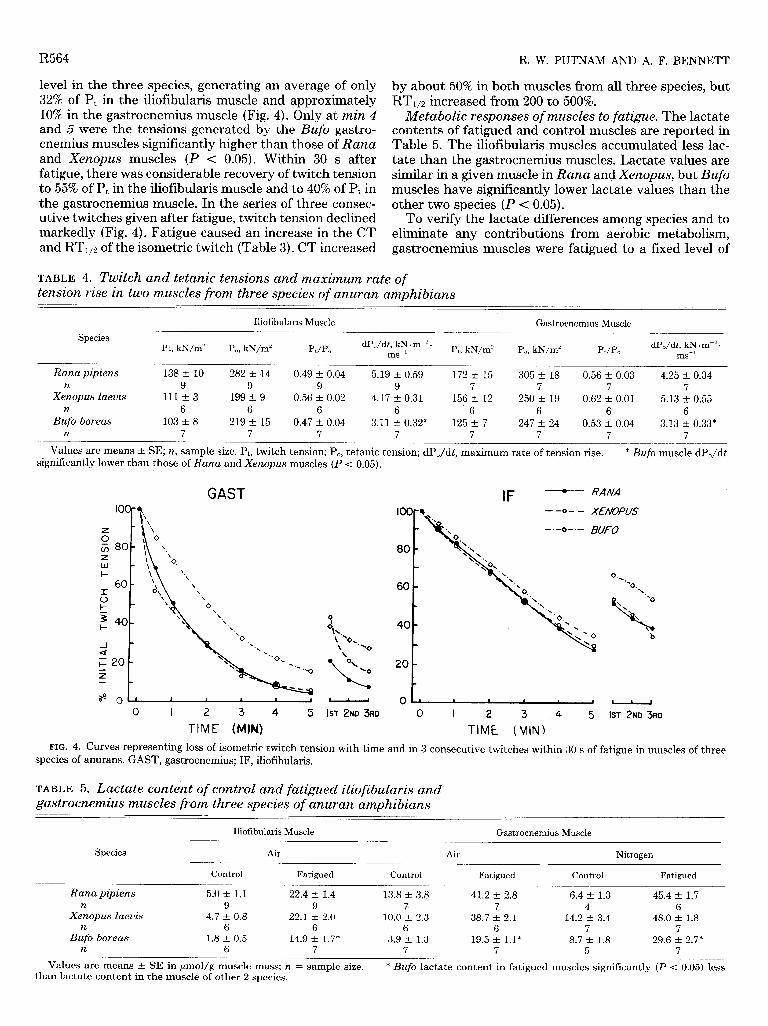
level in the three species, generating an average of only 32% of Pt in the iliofibularis muscle and approximately 10% in the gastrocnemius muscle (Fig. 4). Only at min 4 and 5 were the tensions generated by the Bufo gastro- cnemius muscles significantly higher than those of Rana and Xenopus muscles (P < 0.05). Within 30 s after fatigue, there was considerable recovery of twitch tension to 55% of Pt in the iliofibularis muscle and to 40% of Pt in the gastrocnemius muscle. In the series of three consec- utive twitches given after fatigue, twitch tension declined markedly (Fig. 4). Fatigue caused an increase in the CT and RTl12 of the isometric twitch (Table 3). CT increased
by about 50% in both muscles from all three species, but RT1,2 increased from 200 to 500%.
Metabolic responses of muscles to fatigue. The lactate contents of fatigued and control muscles are reported in Table 5. The iliofibularis muscles accumulated less lac- tate than the gastrocnemius muscles. Lactate values are similar in a given muscle in Rana and Xenopus, but Bufo muscles have significantly lower lactate values than the other two species (P < 0.05).
To verify the lactate differences among species and to eliminate any contributions from aerobic metabolism, gastrocnemius muscles were fatigued to a fixed level of
TABLE 4. Twitch and tetanic tensions and maximum rate of tension rise in two muscles from three species of anuran amphibians
Species Pt, kN/m2
Iliofibularis Muscle
P,, kN/m” wpo
Gastrocnemius Muscle
dP,/dt, kN l rn-*. Pt, kN/m’ P,, kN/m’ wpo
dP,/dt, kN l m-* - ms-l ms-’
Rana pipiens 138 t 10 282 +: I4 0.49 t 0.04 i.19 t 0.59 172 t 15 305 t 18 0.56 t 0.03 4.25 zk 0.34 n 9 9 9 9 7 7 7 7
Xenopus laevis lilt, 3 199 t 9 0.56 t 0.02 4.17 -+ 0.31 156 -+ 12 250 + 19 0.62 t 0.01 5.13 t 0.55 n 6 6 6 6 6 6 6 6
Bufo boreas 103 t 8 219 t 15 0.47 t 0.04 3.11 + 0.32" 125 t 7 247 -+ 24 0.53 lk 0.04 3.13 -+ 0.33" n 7 7 7 7 7 7 7 7
Values are means t SE; n, sample size. Pt, twitch tension; P,, tetanic tension; dP,/dt, maximum rate of tension rise. significantly lower than those of Rana and Xenopus muscles (P < 0.05).
* Bufo muscle dP,/dt
GAST IF - RANA
0 I 2 3 4 5
TIME (MIN) (ST 2ND 3RD 0 I 2 3 4 5 IST 2ND 3RD
TIME (MINI FIG. 4. Curves representing loss of isometric twitch tension with time and in 3 consecutive twitches within 30 s of fatigue in muscles of three
species of anurans. GAST, gastrocnemius; IF, iliofibularis.
TABLE 5. Lactate content of control and fatigued iliofibularis and gastrocnemius muscles from three species of anuran amphibians
Species
Iliofibularis Muscle
Air
Control Fatigued Control
Air
Gastrocnemius Muscle
Nitrogen
Fatigued Control Fatigued
Rana pipiens 5.0 + 1.1 22.4 + 1.4 13.8 Ik 3.8 41.2 + 2.8 6.4 t 1.3 45.4 t, 1.7 n 9 9 7 7 4 6
Xenopus laevis 4.7 t 0.8 22.1 t 2.0 10.0 t 2.3 38.7 t 2.1 14.2 t 3.4 48.0 t 1.8 n 6 6 6 6 7 7
Bufo boreas 1.8 ~fr 0.5 14.9 t 1‘7" 3.9 +: 1.3 19.5 t, 1.1* 8.7 -+ 1.8 29.6 t 2.7" n 6 7 7 7 5 7
Values are means t SE in pmol/g muscle mass; n = sample size. than lactate content in the muscle of other 2 species.
* Bufo lactate content in fatigued muscles significantly (P c 0.05) less
PROPERTIES OF ANURAN SKELETAL MUSCLES
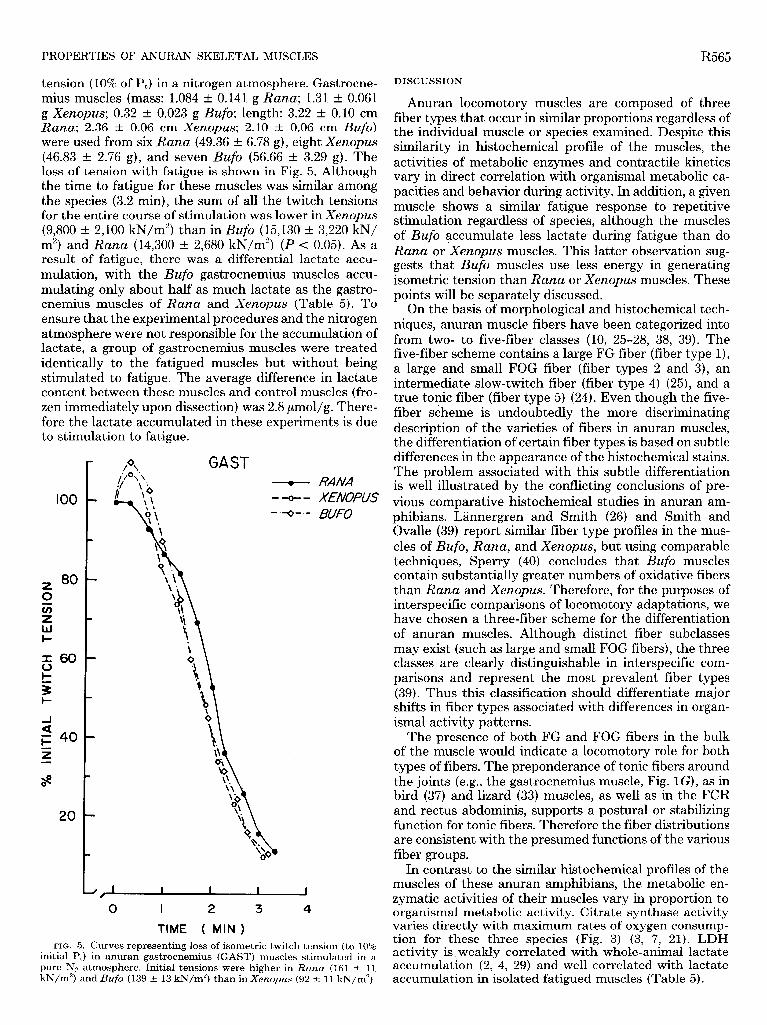
tension (10% of Pt) in a nitrogen atmosphere. Gastrocne- mius muscles (mass: 1.084 t 0.141 g Rana; 1.31 t 0.061 g Xenopus; 0.32 t 0.023 g Bufo; length: 3.22 t 0.10 cm Rana; 2.36 t 0.06 cm Xenopus; 2.10 t 0.06 cm Bufo) were used from six Rana (49.36 t 6.78 g), eight Xenopus (46.83 t 2.76 g), and seven Bufo (56.66 t 3.29 g). The loss of tension with fatigue is shown in Fig. 5. Although the time to fatigue for these muscles was similar among the species (3.2 min), the sum of all the twitch tensions for the entire course of stimulation was lower in Xenopus (9,800 t 2,100 kN/m2) than in Bufo (15,130 t 3,220 kN/ m2) and Rana (14,300 t 2,680 kN/m”) (P < 0.05). As a result of fatigue, there was a differential lactate accu- mulation, with the Bufo gastrocnemius muscles accu- mulating only about half as much lactate as the gastro- cnemius muscles of Rana and Xenopus (Table 5). To ensure that the experimental procedures and the nitrogen atmosphere were not responsible for the accumulation of lactate, a group of gastrocnemius muscles were treated identically to the fatigued muscles but without being stimulated to fatigue. The average difference in lactate content between these muscles and control muscles (fro- zen immediately upon dissection) was 2.8 pmol/g. There- fore the lactate accumulated in these experiments is due to stimulation to fatigue.
too
2 80 0
E IAI I-
20
FIG. 5. Curves representing loss of isometric twitch tension (to 10% initial PJ in anuran gastrocnemius (GAST) muscles stimulated in a
J, 1 1 I I I
0 I 2 3 4
TIME ( MIN)
pure N2 atmosphere. Initial tensions were kN/m2)
higher in and Bufo (139 t 13 kN/m2) than in Xenopus
RANA XENOPUS BUFO
Rana (161 t 11 (92 t 1 1 kN/m2).
R565
DISCUSSION
Anuran locomotory muscles are composed of three fiber types that occur in similar proportions regardless of the individual muscle or species examined. Despite this similarity in histochemical profile of the muscles, the activities of metabolic enzymes and contractile kinetics vary in direct correlation with organismal metabolic ca- pacities and behavior during activity. In addition, a given muscle shows a similar fatigue response to repetitive stimulation regardless of species, although the muscles of Bufo accumulate less lactate during fatigue than do Rana or Xenopus muscles. This latter observation sug- gests that Bufo muscles use less energy in generating isometric tension than Rana or Xenopus muscles. These points will be separately discussed.
On the basis of morphological and histochemical tech- niques, anuran muscle fibers have been categorized into from two- to five-fiber classes (10, 25-28, 38, 39). The five-fiber scheme contains a large FG fiber (fiber type l), a large and small FOG fiber (fiber types 2 and 3), an intermediate slow-twitch fiber (fiber type 4) (25), and a true tonic fiber (fiber type 5) (24). Even though the five- fiber scheme is undoubtedly the more discriminating description of the varieties of fibers in anuran muscles, the differentiation of certain fiber types is based on subtle differences in the appearance of the histochemical stains. The problem associated with this subtle differentiation is well illustrated by the conflicting conclusions of pre- vious comparative histochemical studies in anuran am- phibians. Lannergren and Smith (26) and Smith and Ovalle (39) report similar fiber type profiles in the mus- cles of Bufo, Rana, and Xenopus, but using comparable techniques, Sperry (40) concludes that Bufo muscles contain substantially greater numbers of oxidative fibers than Rana and Xenopus. Therefore, for the purposes of interspecific comparisons of locomotory adaptations, we have chosen a three-fiber scheme for the differentiation of anuran muscles. Although distinct fiber subclasses may exist (such as large and small FOG fibers), the three classes are clearly distinguishable in interspecific com- parisons and represent the most prevalent fiber types (39). Thus this classification should differentiate major shifts in fiber types associated with differences in organ- ismal activity patterns.
The presence of both FG and FOG fibers in the bulk of the muscle would indicate a locomotory role for both types of fibers. The preponderance of tonic fibers around the joints (e.g., the gastrocnemius muscle, Fig. lG), as in bird (37) and lizard (33) muscles, as well as in the FCR and rectus abdominis, supports a postural or stabilizing function for tonic fibers. Therefore the fiber distributions are consistent with the presumed functions of the various fiber groups.
In contrast to the similar histochemical profiles of the muscles of these anuran amphibians, the metabolic en- zymatic activities of their muscles vary in proportion to organismal metabolic activity. Citrate synthase activity varies directly with maximum rates of oxygen consump- tion for these three species (Fig. 3) (3, 7, 21). LDH activity is weakly correlated with whole-animal lactate accumulation (2, 4, 29) and well correlated with lactate accumulation in isolated fatigued muscles (Table 5).
R566
The contractile kinetics also differ among species. Bufo muscles have CTs which are 30-50s longer than those of Rana and Xenopus muscles (Table 3). In correlation with these CT data, dP,/dt is 50% slower in Bufo muscles than in Rana and Xenopus muscles. These differences in contractile kinetics are substantial but not as great as differences in contraction times among fiber types in a given species (6,26) and therefore would not be expected to be detectable with histochemical techniques. Based on the CT and dP,/dt data, Bufo muscles contract more slowly than Rana and Xenopus muscles. This difference reflects the slower pattern of locomotion in Bufo (32).
When repetitively stimulated the muscles from these anurans exhibit a similar level and time course of fatigue (Figs. 4 and 5). Fatigue is commonly associated with the accumulation of lactic acid in muscles stimulated in vitro, and the two are believed to be causally linked (11, 20, 30). In this study, lactate concentration increased mark- edly in stimulated muscles, although Bufo muscles ac- cumulated significantly less lactate than did the muscles of the other two species. The muscles from these species can be used as a comparative model system with which to study the effects of lactic acid accumulation on muscle function. With the experimental procedures used in this study, the diffusion of oxygen into these large muscles would be slow and minimize the contribution of aerobic metabolism to muscle energetics during stimulation. However, to verify this differential lactate accumulation, the stimulation was repeated with the muscles in a pure nitrogen atmosphere, thus eliminating any contribution from aerobic metabolism. The only sources of energy for contraction are lactate production and decreases in the concentrations of creatine phosphate (CP) and ATP. In Rana muscles stimulated to fatigue, the ATP and CP concentrations are about 1 and 13 ,umol/g, respectively (11). Even though we cannot discount possible differ- ences in CP utilization among the species, lactate pro- duction will probably be the major source of energy for muscle contraction under these anaerobic conditions. Since the gastrocnemius muscles from the three species generate comparable amounts of tension (Fig. 5), but Bufo muscles accumulate less lactate and thus use less energy (Table 5), Bufo muscles appear to use less energy to generate isometric tension. Goldspink et al. (17) showed that hamster muscle slow fibers were more eco- nomical at maintaining isometric tension than hamster fast fibers, but the present study suggests differences among a given fiber type (FG fiber) in different species. Hill and Howarth (19) showed that toad muscles have a higher isometric heat coefficient than frog muscles; Gibbs
REFERENCES
1. ADRIANO, M. A.,R. B. ARMSTRONG, AND V. R. EDGERTON. Hind- limb muscle fiber populations of five mammals. J. Histochem. Cytochem. 21:51-55,1973.
2. BENNETT, A. F. Enzymatic correlates of activity metabolism in anuran amphibians. Am. J. Physiol. 226: 1149-1151, 1974.
3. BENNETT, A. F., AND P. LICHT. Relative contributions of anaerobic and aerobic energy production during activity in amphibia. J. Comp.Physiol. 87: 351-360,1973.
4. BENNETT, A. F., AND P. LICHT. Anaerobic metabolism during activity in amphibians. Comp. Biochem. Physiol. A 48: 319-327, 1974.
5. BODDECKE, R., E. SLIPJER, AND A. VAN DER STELT. Histological
R. W. PUTNAM AND A. F. BENNETT
and Chapman (14) showed that toad sartorious muscles are more efficient during isotonic contractions than frog muscles. These studies support the contention that Bufo FG fibers require less energy to generate a given amount of tension than Rana or Xenopus.
Histochemistry yields qualitative information about muscle structure and function. To describe and compare muscle properties more quantitative
more completely among species, the techniques of biochemistry and func-
tional studies are necessary. Despite similarities in the histochemical profiles of the muscles of various species of anurans, there are marked differences in metabolic enzyme activities. Further, contractile kinetics vary among species with the muscles of Bufo contracting more slowly than the muscles of the other two species (see also Ref. 18). Therefore quantitative differences exist in both the functional and metabolic properties of that are not resolvable with histochemical
these muscles techniques. It
may be that the quantitative differences (<2-fold for any property) in the muscles of these species are too small to be resolved with histochemical techniques. The degree to which these quantitative differences are due to differ- ences in any particular fiber type, or are due to differ- ences in all fiber types, must await the application of quantitative techniques to single fiber studies.
There is a quantitative difference in the enzymatic and contractile profiles of muscles of anuran amphibians with different metabolic and locomotory patterns but not an elaboration of new fiber types. The degree to which these muscle properties determine organismal properties, or are governed by patterns of use and activity by the animal, remains to be determined. Changes in activity patterns (i.e., training) can alter both the metabolic pro- files (8) and contractile properties (12) of muscle. By assessing the effect of changes induced in the biochemical and contractile properties of muscle on organismal loco- motory and metabolic patterns, the degree to which muscle properties are correlated with organismal pat- terns can be determined.
We thank the Dept. of Psychobiology, University of California, Irvine, for the use of the cryostat, Alyse Korzeniowski for technical assistance in various aspects of this work, and Drs. R. K. Josephson and R. Marsh for helpful discussion and comments on an earlier version of this manuscript.
This study was supported by National Institutes of Health Grant K04-AM-00351 and National Science Foundation Grants PCM 77- 24208 and 81-02331 to A. F. Bennett and by a Muscular Dystrophy Postdoctoral Fellowship to R. W. Putnam.
Present address of R. W. Putnam, Dept. of Physiology and Biophys- ics, Washington University School of Medicine, St. Louis, MO 63110.
Received 29 March 1982; accepted in final form 4 October 1982.
characteristics of the body musculature of fishes in connection with their mode of life. Koninklcke Ned. Akad. Weterschappen Ser. C 62:576-588,1959.
6. BURKE, R. E. Motor units: physiological/histochemical profiles, neural connectivity and functional specializations. Am. ZooZ. 18: 127-134,1978.
7. CAREY, C. Aerobic and anaerobic energy expenditure during rest and activity in montane Bufo b. boreas and Rana pipiens. Oecol- ogia 39:213-228,1979.
8. CUMMINGS, J. W. Physiological and biochemical adaptations to training in Ranapipiens. J. Comp. PhysioZ. 134: 345-350, 1979.
9. DUNN, 0. J., AND V. CLARK. AppZied Statistics: Analysis of Vari-

PROPERTIES OF ANURAN SKELETAL MUSCLES
ante and Regression. New York: Wiley, 1974. 10. ENGEL, W. K., AND R. L. IRWIN. A histochemical-physiological
correlation of frog skeletal muscle fibers. Am. J. Physiol. 213: Xl- 518,1967.
11. FITTS, R., AND J. HOLLOSZY. Lactate and contractile force in frog muscle during development of fatigue and recovery. Am. J. PhysioZ. 231:430-433,1976.
12. FITTS, R. H., AND J. 0. HOLLOSZY. Contractile properties of rat soleus muscle: effects of training and fatigue. Am. J. PhysioZ. 233 (Cell PhysioZ. 2): C86-C91, 1977.
13. FREDERICK, E. C., M. F. HAMANT, S. A. RASMUSSEN, A. K. CHAN, AND G. E. GOSLOW, JR. Correlation of histochemical and physio- logical properties of muscle units in the striped skunk. Experientia 34:372-374,1978.
14. GIBBS, C. L., AND J. B. CHAPMAN. Effects of stimulus conditions, temperature, and length on energy output of frog and toad sartorius. Am. J. PhysioZ. 227: 964-971, 1974.
15. GILBERT, S. G. PictoriaZ Anatomy of the Frog. Seattle, WA: Univ. of Washington Press, 1974.
16. GLEESON, T. T., R. W. PUTNAM, AND A. F. BENNETT. Histochem- ical, enzymatic and contractile properties of skeletal muscle fibers in the lizard Dipsosaurus dorsalis. J. Exp. ZooZ. 214: 293-302,198O.
17. GOLDSPINK, G., R. E. LARSON, AND R. E. DAVIES. The immediate energy supply and the cost of maintenance of isometric tension for different muscles in the hamster. 2. VgZ. PhysioZ. 66: 389-397, 1970.
18. HILL, A. V. The series elastic component of muscle. Proc. R. Sot. Lond0nSer.B 137:273-280,195O.
19. HILL, A. V., AND J. V. HOWARTH. The reversal of chemical reactions in contracting muscle during an applied stretch. Proc. R. Sot. Lond0nSer.B 151:169-193,1959.
20. HILL, A. V., AND P. KUPLAOV. Anaerobic and aerobic activity in isolated muscle. Proc. R. Sot. London Ser. B 105: 313-322, 1930.
21. HILLMAN, S. S. Cardiovascular correlates of maximal oxygen con- sumption rates in anuran amphibians. J. Comp. Physiol. 109: 199- 207,1976.
22. HOLLANDER, M., AND D. WOLFE. Nonparametric StatisticaL Meth- ods. New York: Wiley, 1973.
23. KORNBERG, A. Lactic dehydrogenase in muscle. In: Methods in Enzymology, edited by S. Colowick and N. Kaplan. New York: Academic, 1955, vol. 1, p. 441-443.
24. LANNERGREN, J. The force-velocity relation of isolated twitch and slow muscle fibres of Xenopus Zaevis. J. PhysioZ. London 283: 501- 521,1978.
25. LANNERGREN, J. An intermediate type of muscle fibre in Xenopus
R567
Zaevis. Nature London 279: 254-256, 1979. 26. LXNNERGREN, J., AND R. S. SMITH. Types of muscle fibres in toad
skeletal muscle. Acta PhysioZ. Stand. 68: 263-274, 1966. 27. OGATA, T., AND M. MORI. Histochemical study of oxidative en-
zymes in vertebrate muscles. J. Histochem. Cytochem. 12: 171-182, 1964.
28. PEACHEY, L. D., AND A. F. HUXLEY. Structural identification of twitch and slow striated muscle fibres of the frog. J. CeZZ BioZ. 13: 177-180,1962.
29. PUTNAM, R. W. The basis for differences in lactic acid content after activity in different species of anuran amphibians. PhysioZ. ZooZ. 52:509-519,1979.
30. PUTNAM, R. W. The role of lactic acid accumulation in muscle fatigue of two anurans, Xenopus Zaevis and Rana pipiens. J. Exp. BioZ. 82: 35-51, 1979.
31. PUTNAM, R. W., AND A. F. BENNETT. Comparative physiology of anuran muscles. Am. ZooZ. 20: 941, 1980.
32. PUTNAM, R. W., AND A. F. BENNETT. Thermal dependence of behavioural performance of anuran amphibians. Anim. Behav. 29: 502-509,1981.
33. PUTNAM, R. W., T. T. GLEESON, AND A. F. BENNETT. Histochem- ical determination of the fiber composition of locomotory muscles in a lizard, Dipsosaurus dorsalis. J. Exp. ZooZ. 214: 303-309, 1980.
34. SCHEFF~~, N. A. A method for judging all contrasts in the analysis of variance. Biometrika 40: 87-104, 1953.
35. SICKLES, D. W., AND C. A. PINKSTAFF. Comparative histochemical study of prosimian primate hindlimb muscles. I. Muscle fiber types. Am.J. Anat. 160:175-186,1981.
36. SICKLES, D. W., AND C. A. PINKSTAFF. Comparative histochemical study of prosimian primate hindlimb muscles. II. Populations of fiber types. Am. J. Anat. 160: 187-194, 1981.
37. SIMPSON, S. The distribution of tonic and twitch muscle fibers in the avian wing. Am. ZooZ. 19: 929, 1979.
38. SKOROBOVICHUK, N. F., AND N. A. CHIZHOVA. Distribution of three types of muscle fibers in skeletal muscles of the frog Rana tempor- aria. J. EvoZ. Biochem. Physiol. 12: 133-139, 1976.
39. SMITH, R. S., AND W. K. OVALLE, JR. Varieties of fast and slow extrafusal muscle fibres in -amphibian hindlimb muscles. J. Anat. 116:1-24,1973.
40. SPERRY, D. G. Fiber type composition and postmetamorphic growth of anuran hindlimb muscles. J. MorphoZ. 170: 321-345,198l.
41. SRERE, P. A. Citrate synthase. In: Methods of Enzymology, edited by J. W. Lowenstein. New York: Academic, 1969, vol. 13, p. 3-11.