Embed Size (px)
Citation preview

916 Copyright © 2018 The Korean Society of Radiology
Histogram Analysis of Diffusion Kurtosis Magnetic Resonance Imaging for Diagnosis of Hepatic Fibrosis Ruo-Fan Sheng, MD1, Kai-Pu Jin, MD1, Li Yang, MD1, He-Qing Wang, MD1, Hao Liu, MM1, Yuan Ji, MD2, Cai-Xia Fu, MS3, Meng-Su Zeng, MD, PhD1
1Department of Radiology, Zhongshan Hospital, Fudan University, Shanghai Institute of Medical Imaging, Shanghai 200032, China; 2Department of Pathology, Zhongshan Hospital, Fudan University, Shanghai 200032, China; 3MR Collaboration NEA, Siemens Ltd. China, Shanghai 201318, China
Objective: To investigate the diagnostic value of diffusion kurtosis imaging (DKI) histogram analysis in hepatic fibrosis staging.Materials and Methods: Thirty-six rats were divided into carbon tetrachloride-induced fibrosis groups (6 rats per group for 2, 4, 6, and 8 weeks) and a control group (n = 12). MRI was performed using a 3T scanner. Histograms of DKI were obtained for corrected apparent diffusion (D), kurtosis (K) and apparent diffusion coefficient (ADC). Mean, median, skewness, kurtosis and 25th and 75th percentiles were generated and compared according to the fibrosis stage and inflammatory activity.Results: A total of 35 rats were included, and 12, 5, 5, 6, and 7 rats were diagnosed as F0–F4. The mean, median, 25th and 75th percentiles, kurtosis of D map, median, 25th percentile, skewness of K map, and 75th percentile of ADC map demonstrated significant correlation with fibrosis stage (r = -0.767 to 0.339, p < 0.001 to p = 0.039). The fibrosis score was the independent variable associated with histogram parameters compared with inflammatory activity grade (p < 0.001 to p = 0.041), except the median of K map (p = 0.185). Areas under the receiver operating characteristic curve of D were larger than K and ADC maps in fibrosis staging, although no significant differences existed in pairwise comparisons (p = 0.0512 to p = 0.847).Conclusion: Corrected apparent diffusion of DKI histogram analysis provides added value and better diagnostic performance to detect various liver fibrosis stages compared with ADC. Keywords: Liver; Fibrosis; Histogram analysis; Diffusion kurtosis imaging; Magnetic resonance imaging
Received July 5, 2017; accepted after revision February 9, 2018.This study was supported by the National Natural Science Foundation for Young Scientists of China (grant number 81601488); the Shanghai Sailing Program (grant number 16YF1410600); and the National Natural Science Foundation of China (grant number 81571661).Corresponding author: Meng-Su Zeng, MD, PhD, Department of Radiology, Zhongshan Hospital, Fudan University, No. 180 Fenglin Road, Xuhui District, Shanghai 200032, China.• Tel: (8621) 64041990-2130 • Fax: (8621) 64439906• E-mail: [email protected] is an Open Access article distributed under the terms of the Creative Commons Attribution Non-Commercial License (https://creativecommons.org/licenses/by-nc/4.0) which permits unrestricted non-commercial use, distribution, and reproduction in any medium, provided the original work is properly cited.
INTRODUCTION
Liver fibrosis precedes cirrhosis in the natural history of chronic liver disease (CLD). Diagnosis of liver fibrosis in patients with CLD is critical, as untreated fibrosis increases the risk of cirrhosis, and end-stage liver disease, hepatocellular carcinoma or liver failure (1). Hepatic fibrosis is regarded as a dynamic process with potential for regression (2, 3). Therefore, early and accurate assessment of the disease is essential to prevent and even reverse the process. Liver biopsy is regarded as the standard of reference for the diagnosis of liver fibrosis. By contrast, biopsy is an invasive procedure with life-threatening complications. Problems including sampling errors and
Korean J Radiol 2018;19(5):916-922
https://doi.org/10.3348/kjr.2018.19.5.916pISSN 1229-6929 · eISSN 2005-8330
Original Article | Gastrointestinal Imaging

917
DKI Histogram Analysis for Hepatic Fibrosis
Korean J Radiol 19(5), Sep/Oct 2018kjronline.org
Shenzhen Magnetic Resonance Ltd., Shenzhen, China). DKI was performed with a single-shot spin-echo echoplanar sequence using tri-directional motion-probing gradients (3-scan trace mode) with 6 b-values (0, 200, 500, 1000, 1500, and 2000 s/mm2). Detailed parameters were as follows: repetition time/echo time 5100/96.8 ms, slice thickness 2.0 mm, interslice gap 0.5 mm, field of view 138 x 138 mm, scan matrix 148 x 148, half Fourier factor 7/8, GeneRalized Autocalibrating Partial Parallel Acquisition accelerated factor 2, average 4, total scan time 5 minutes 52 seconds.
Imaging AnalysesDigital Imaging and Communications in Medicine (DICOM)
images from the DKI sequence were postprocessed using in-house software programmed in MeVisLab (Version 1.2.0; MeVis Medical Solutions AG, Bremen, Germany). This program was performed using voxel-by-voxel analysis, fitting diffusion-weighted signal intensities as a function of b-value using the equation: S = S0 x exp (-b x D + b2 x D2 x K/6), b represents b-value, D represents corrected apparent diffusion accounting for non-Gaussian diffusion behavior, and K represents excessive kurtosis (a unitless parameter representing the deviation of water motion from the Gaussian distribution) (9, 18). The program also calculated ADC for each pixel using b-values 0–500 s/mm2 based on a standard mono-exponential fit with the equation S = S0 x exp (-b x ADC). Based on these calculations, the program output maps for D, K, and ADC were obtained.
Histogram AnalysesA prototype software (MR OncoTreat, Siemens
Healthineers) was used for histogram analysis. DICOM data including D map, K map, and ADC map were loaded into the software. The histogram images were analyzed by a single radiologist (with 12 years of experience in animal abdominal imaging), who was blinded to the animal groupings and histopathology. ROIs were manually drawn covering the whole liver parenchyma on axial and multiplanar reconstruction images followed by segmentation. Care was taken to avoid large vessels, focal lesions and artifacts. Finally, voxel-based histogram data were generated for the ROIs, and the following parameters were calculated: mean, median, skewness, kurtosis, and the cumulative frequency distributions of 25th and 75th percentiles (Fig. 1).
Pathological AnalysesAfter MR examination, all rats were humanely sacrificed
inter-/intra-observer variability limit its application (4, 5). Several non-invasive techniques, including multiparametric
magnetic resonance (MR) technologies, make the non-invasive evaluation of liver fibrosis a reality (6, 7). Diffusion kurtosis imaging (DKI) is an advanced diffusion-weighted imaging (DWI) model that quantifies non-Gaussian behavior of diffusion, yielding a corrected apparent diffusion coefficient (ADC) as well as excessive kurtosis of tissue (8). A deviation from a simple mono-exponential decay has readily been identified in the liver. Thus, DKI provides an opportunity to investigate liver diffusivities and tissue microstructural complexity compared with conventional DWI (9). Our previous study also indicated that DKI may provide additional information and represents a valuable tool for the characterization of liver fibrosis (10).
However, routine MR signal measurements only provide mean values, which do not account for the underlying spatial distribution. MR histogram analysis is a new approach for quantification of the distribution of signal intensity of voxels using routinely acquired MR data, and refers to a mathematical approach to evaluate variations in gray-level intensity within a region of interest (ROI), which reflects histological heterogeneity (11, 12). MR histogram analysis facilitated the detection and staging of liver fibrosis, confined to the application of gadoxetic acid-enhanced MRI and conventional DWI (13-15). Therefore, the purpose of this study was to investigate the diagnostic value of DKI histogram analysis in assessing and quantifying hepatic fibrosis, as well as the potential influence of inflammatory activity.
MATERIALS AND METHODS
Animal ModelOur institutional animal care and use committee approved
this study. Thirty-six male, 8-week-old Sprague-Dawley rats (ca., 250–280 g) were randomly divided into four experimental groups (n = 6 per group) and one control group (n = 12). The rats in the experimental groups were treated with 50% carbon tetrachloride (CCl4) and olive oil intraperitoneally twice a week at a dose of 1.5 mL/kg, for 2, 4, 6, and 8 weeks, respectively. Rats in the control group were administered an equal dose of olive oil for 8 weeks (16, 17).
Image AcquisitionMRI was performed using a 3T scanner (Verio, Siemens
Healthcare, Erlangen, Germany) with a phased-array animal coil with 4 coil elements (CG-MUC39-H300-AS, Siemens
918
Sheng et al.
Korean J Radiol 19(5), Sep/Oct 2018 kjronline.org
and the livers were removed. Liver samples were stained with hematoxylin and eosin Masson’s trichrome stains. All pathological specimens were reviewed by a pathologist (with 20 years of experience in liver pathology). The fibrosis stage (“F” grade) and the inflammatory activity (“A” grade) were evaluated using the METAVIR scoring system (19). The degree of fibrosis was assessed using a scale ranging from 0 to 4: F0 = no fibrosis; F1 = mild fibrosis, portal fibrosis without septa; F2 = substantial fibrosis, periportal fibrosis and few septa; F3 = advanced fibrosis, septal fibrosis without cirrhosis; and F4 = widespread fibrosis, cirrhosis. The degree of inflammatory activity was graded on a scale of 0–3: A0 = no activity, A1 = mild activity, A2 = moderate activity, and A3 = severe activity.
Statistical AnalysesAll statistical analyses were performed using SPSS 22.0
(IBM Corp., Armonk, NY, USA) and MedCalc 15.0 (MediCalc Software bvba, Mariakerke, Belgium). The Spearman’s rank-correlation test and multiple regression analysis were used to measure the relationship between MR histogram parameters and the degree of fibrosis and inflammatory activity. Correlation coefficients were classified as follows: 0.0−0.2, very weak to negligible correlation; 0.2−0.4, weak correlation; 0.4−0.7, moderate correlation; 0.7−0.9, strong correlation; and 0.9−1.0, very strong correlation (20). The diagnostic performance of variables with significant correlation with fibrosis in predicting the fibrotic stage was assessed using receiver operating characteristic (ROC) curve analysis. The corresponding areas under the ROC curve (AUCs), sensitivity and specificity for the classification of fibrosis (grade F1 or higher, F2 or higher, and F4) were calculated. For all significant parameters of D, K, and ADC maps, the highest AUCs of each MR parameter were used to
A
D
B
E F
C
Fig. 1. Example of DKI histogram analysis in rat graded A3F4. (A) Placement of region of interest on parametric map of K map. (B) Semi-logarithmic plot of hepatic diffusion-related signal decay with respect to increasing b-values demonstrates improved fit of measured data with diffusional kurtosis model compared with monoexponential ADC model. Corresponding histograms were generated for (C) D map, (D) K map, and (E) ADC map. Different distributions of parameters, as relatively low percentile D values with left-skewed broad distribution, high percentile K values with right-skewed broad distribution, and medium percentile ADC values are shown. (F) Microscopy shows liver with cirrhosis (F4) and severe inflammatory activity (A3) (hematoxylin-eosin stain, x 40). ADC = apparent diffusion coefficient, D = corrected apparent diffusion, DKI = diffusion kurtosis imaging, K = kurtosis

919
DKI Histogram Analysis for Hepatic Fibrosis
Korean J Radiol 19(5), Sep/Oct 2018kjronline.org
compare the diagnostic performance in fibrosis staging (12), using the DeLong method (21). All tests were two-sided and p < 0.05 was considered statistically significant.
RESULTS
Animal ModelA total of 35 rats were included (one rat died in the
seventh week after CCl4 administration). Histopathologically, 12, 5, 5, 6, and 7 rats were diagnosed as F0–F4, respectively, and 17, 5, 7, and 6 rats were diagnosed as A0–A3, respectively. A strong correlation was observed between fibrosis grade and inflammatory activity grade (r = 0.842, p < 0.001).
Histograms and Histological FindingsCorrelations between the histogram parameters of D, K,
ADC, and the fibrosis score are presented in Table 1. Mean, median, 25th and 75th percentiles, kurtosis of D map, median, 25th percentile, skewness of K map, and 75th percentile of ADC map demonstrated significant correlations
with the fibrosis stage (r = -0.767 to 0.339, p < 0.001 to p = 0.039). Among all the parameters above, mean, median, and 25th percentile of D showed strong inverse correlations (r = -0.767 to -0.705).
Mean, median, 25th and 75th percentiles of D map, and 75th percentile of ADC map showed significant correlation with the inflammatory activity score (r = -0.676 to -0.336, p < 0.001 to p = 0.036) (Supplementary Table 1 in the online-only Data Supplement).
In general, the 25th percentile of D map demonstrated the strongest correlation with both fibrosis stage (r = -0.767, p < 0.001) and inflammatory activity (r = -0.676, p < 0.001). The fibrosis score was the independent variable associated with histogram parameters, compared with the inflammatory activity grade (p < 0.001 to p = 0.041), except the median of K map (p = 0.185).
Diagnostic Performance in Fibrosis StagingThe AUCs of histogram parameters significantly correlating
with fibrosis as well as the optimal cutoff values along with the respective diagnostic performances according to
Table 1. Correlations between MR Histogram Parameters (D, K, ADC) and METAVIR Fibrosis Score D K ADC
r 95% CI P r 95% CI P r 95% CI PMean -0.705 -0.845 to -0.491 < 0.001* 0.175 -0.185 to 0.531 0.286 -0.251 -0.563 to 0.093 0.124Median -0.757 -0.861 to -0.572 < 0.001* 0.331 -0.049 to 0.625 0.039* -0.219 -0.542 to 0.135 0.18125th -0.767 -0.871 to -0.612 < 0.001* 0.339 0.028 to 0.631 0.035* -0.084 -0.450 to 0.276 0.61175th -0.695 -0.843 to -0.441 < 0.001* 0.186 -0.192 to 0.539 0.257 -0.416 -0.675 to -0.087 0.008*Skewness 0.253 -0.103 to 0.599 0.120 -0.521 -0.733 to -0.236 0.001* -0.178 -0.455 to 0.115 0.280Kurtosis 0.343 0.007 to 0.617 0.033* -0.011 -0.364 to 0.316 0.949 -0.074 -0.388 to 0.215 0.654
*p < 0.05. ADC = apparent diffusion coefficient, CI = confidence interval, D = corrected apparent diffusion, K = kurtosis, MR = magnetic resonance
Table 2. Diagnostic Performance of MR Histogram Parameters (D, K, and ADC) in Prediction of METAVIR Fibrosis Score (“F” grade)F ≥ 1 F ≥ 2 F ≥ 4
Cutoff AUC Sen. Spec. Cutoff AUC Sen. Spec. Cutoff AUC Sen. Spec.D (10-3 mm2/s)
Mean 1.75 0.899* 81.3 91.3 1.49 0.810* 85.7 72.2 1.42 0.906* 87.5 100.0Median 1.70 0.912* 75.0 95.7 1.42 0.866* 90.5 72.2 1.39 0.920* 81.3 100.025th 1.45 0.933* 75.0 100.0 1.20 0.893* 95.2 72.2 1.20 0.871* 78.1 100.075th 2.05 0.851* 75.0 87.0 1.95 0.807* 71.4 77.8 1.64 0.973* 93.8 100.0Kurtosis 5.48 0.586 52.2 87.5 5.476 0.656 61.1 85.7 5.48 0.902* 100.0 78.1
KMedian 1.03 0.793* 82.6 68.7 1.21 0.688* 44.4 90.5 1.04 0.540 56.3 71.425th 0.91 0.747* 69.6 81.2 0.91 0.667 66.7 66.7 0.91 0.589 71.4 56.2Skewness 0.086 0.731* 81.3 60.9 0.028 0.730* 76.2 61.1 -1.33 0.884* 96.9 71.4
ADC (10-3 mm2/s)75th 0.73 0.807* 68.8 91.3 0.72 0.757* 61.9 83.3 0.75 0.522 25.0 100.0
*p < 0.05. AUC = area under curve, Sen. = sensitivity, Spec. = specificity
920
Sheng et al.
Korean J Radiol 19(5), Sep/Oct 2018 kjronline.org
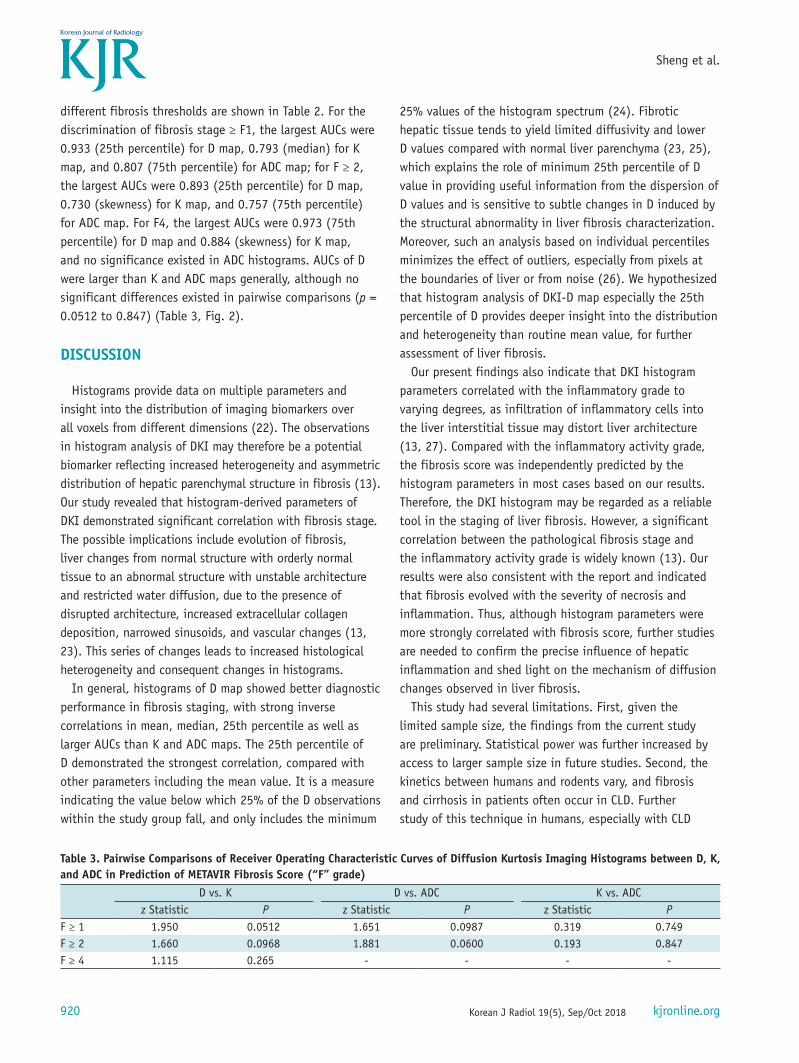
different fibrosis thresholds are shown in Table 2. For the discrimination of fibrosis stage ≥ F1, the largest AUCs were 0.933 (25th percentile) for D map, 0.793 (median) for K map, and 0.807 (75th percentile) for ADC map; for F ≥ 2, the largest AUCs were 0.893 (25th percentile) for D map, 0.730 (skewness) for K map, and 0.757 (75th percentile) for ADC map. For F4, the largest AUCs were 0.973 (75th percentile) for D map and 0.884 (skewness) for K map, and no significance existed in ADC histograms. AUCs of D were larger than K and ADC maps generally, although no significant differences existed in pairwise comparisons (p = 0.0512 to 0.847) (Table 3, Fig. 2).
DISCUSSION
Histograms provide data on multiple parameters and insight into the distribution of imaging biomarkers over all voxels from different dimensions (22). The observations in histogram analysis of DKI may therefore be a potential biomarker reflecting increased heterogeneity and asymmetric distribution of hepatic parenchymal structure in fibrosis (13). Our study revealed that histogram-derived parameters of DKI demonstrated significant correlation with fibrosis stage. The possible implications include evolution of fibrosis, liver changes from normal structure with orderly normal tissue to an abnormal structure with unstable architecture and restricted water diffusion, due to the presence of disrupted architecture, increased extracellular collagen deposition, narrowed sinusoids, and vascular changes (13, 23). This series of changes leads to increased histological heterogeneity and consequent changes in histograms.
In general, histograms of D map showed better diagnostic performance in fibrosis staging, with strong inverse correlations in mean, median, 25th percentile as well as larger AUCs than K and ADC maps. The 25th percentile of D demonstrated the strongest correlation, compared with other parameters including the mean value. It is a measure indicating the value below which 25% of the D observations within the study group fall, and only includes the minimum
25% values of the histogram spectrum (24). Fibrotic hepatic tissue tends to yield limited diffusivity and lower D values compared with normal liver parenchyma (23, 25), which explains the role of minimum 25th percentile of D value in providing useful information from the dispersion of D values and is sensitive to subtle changes in D induced by the structural abnormality in liver fibrosis characterization. Moreover, such an analysis based on individual percentiles minimizes the effect of outliers, especially from pixels at the boundaries of liver or from noise (26). We hypothesized that histogram analysis of DKI-D map especially the 25th percentile of D provides deeper insight into the distribution and heterogeneity than routine mean value, for further assessment of liver fibrosis.
Our present findings also indicate that DKI histogram parameters correlated with the inflammatory grade to varying degrees, as infiltration of inflammatory cells into the liver interstitial tissue may distort liver architecture (13, 27). Compared with the inflammatory activity grade, the fibrosis score was independently predicted by the histogram parameters in most cases based on our results. Therefore, the DKI histogram may be regarded as a reliable tool in the staging of liver fibrosis. However, a significant correlation between the pathological fibrosis stage and the inflammatory activity grade is widely known (13). Our results were also consistent with the report and indicated that fibrosis evolved with the severity of necrosis and inflammation. Thus, although histogram parameters were more strongly correlated with fibrosis score, further studies are needed to confirm the precise influence of hepatic inflammation and shed light on the mechanism of diffusion changes observed in liver fibrosis.
This study had several limitations. First, given the limited sample size, the findings from the current study are preliminary. Statistical power was further increased by access to larger sample size in future studies. Second, the kinetics between humans and rodents vary, and fibrosis and cirrhosis in patients often occur in CLD. Further study of this technique in humans, especially with CLD
Table 3. Pairwise Comparisons of Receiver Operating Characteristic Curves of Diffusion Kurtosis Imaging Histograms between D, K, and ADC in Prediction of METAVIR Fibrosis Score (“F” grade)
D vs. K D vs. ADC K vs. ADCz Statistic P z Statistic P z Statistic P
F ≥ 1 1.950 0.0512 1.651 0.0987 0.319 0.749F ≥ 2 1.660 0.0968 1.881 0.0600 0.193 0.847F ≥ 4 1.115 0.265 - - - -
921
DKI Histogram Analysis for Hepatic Fibrosis
Korean J Radiol 19(5), Sep/Oct 2018kjronline.org
is warranted to fully explore its potential clinical utility. Finally, histogram measurements were performed by a single observer, and the inter- and intra-observer variations were not assessed. However, as shown by previous studies (24, 28), these variations are expected to be small and barely affect the results in whole-volume measurements.
In conclusion, D of DKI histogram analysis provides added value and improves the diagnostic performance in detecting
various stages in liver fibrosis compared with ADC, and may offer a promising noninvasive tool in staging liver fibrosis.
Supplementary Materials
The online-only Data Supplement is available with this article at https://doi.org/10.3348/kjr.2018.19.5.916.
100
80
60
40
20
0
100
80
60
40
20
0
100
80
60
40
20
0
Sens
itiv
ity
Sens
itiv
ity
Sens
itiv
ity
0
0
020
20
2040
40
4060
60
6080
80
80100
100
100
100-Specificity
100-Specificity
100-Specificity
–
–
–
–
–
–
–
–
–
–
–
–
–
–
–
–
–
–
A
C
B
D (25% percentile) K (median) ADC (75% percentile)
D (25% percentile) K (skewness)
D (25% percentile) K (skewness) ADC (75% percentile)
Fig. 2. ROC curves for identification of fibrosis grade (A) F1 or higher, (B) F2 or higher, and (C) F4 using histogram analyses for D, K, and ADC. Highest areas under ROC curve of all significant parameters for each magnetic resonance parameter are used. ROC analysis showed no significance in ADC for prediction of F4, and pairwise comparison was only conducted between D and K. ROC = receiver operating characteristics

922
Sheng et al.
Korean J Radiol 19(5), Sep/Oct 2018 kjronline.org
REFERENCES
1. Polasek M, Fuchs BC, Uppal R, Schühle DT, Alford JK, Loving GS, et al. Molecular MR imaging of liver fibrosis: a feasibility study using rat and mouse models. J Hepatol 2012;57:549-555
2. Faria SC, Ganesan K, Mwangi I, Shiehmorteza M, Viamonte B, Mazhar S, et al. MR imaging of liver fibrosis: current state of the art. Radiographics 2009;29:1615-1635
3. Trautwein C, Friedman SL, Schuppan D, Pinzani M. Hepatic fibrosis: concept to treatment. J Hepatol 2015;62(1 Suppl):S15-S24
4. Yoon JH, Lee JM, Baek JH, Shin CI, Kiefer B, Han JK, et al. Evaluation of hepatic fibrosis using intravoxel incoherent motion in diffusion-weighted liver MRI. J Comput Assist Tomogr 2014;38:110-116
5. Ahn SJ, Lee JM, Chang W, Lee SM, Kang HJ, Yang H, et al. Prospective validation of intra- and interobserver reproducibility of a new point shear wave elastographic technique for assessing liver stiffness in patients with chronic liver disease. Korean J Radiol 2017;18:926-935
6. Lee GM, Kim YR, Ryu JH, Kim TH, Cho EY, Lee YH, et al. Quantitative measurement of hepatic fibrosis with gadoxetic acid-enhanced magnetic resonance imaging in patients with chronic hepatitis B infection: a comparative study on aspartate aminotransferase to platelet ratio index and fibrosis-4 index. Korean J Radiol 2017;18:444-451
7. Xie S, Li Q, Cheng Y, Zhang Y, Zhuo Z, Zhao G, et al. Impact of liver fibrosis and fatty liver on T1rho measurements: a prospective study. Korean J Radiol 2017;18:898-905
8. Jensen JH, Helpern JA, Ramani A, Lu HZ, Kaczynski K. Diffusional kurtosis imaging: the quantification of non-Gaussian water diffusion by means of magnetic resonance imaging. Magn Reson Med 2005;53:1432-1440
9. Rosenkrantz AB, Sigmund EE, Winnick A, Niver BE, Spieler B, Morgan GR, et al. Assessment of hepatocellular carcinoma using apparent diffusion coefficient and diffusion kurtosis indices: preliminary experience in fresh liver explants. Magn Reson Imaging 2012;30:1534-1540
10. Sheng RF, Wang HQ, Yang L, Jin KP, Xie YH, Chen CZ, et al. Diffusion kurtosis imaging and diffusion-weighted imaging in assessment of liver fibrosis stage and necroinflammatory activity. Abdom Radiol (NY) 2017;42:1176-1182
11. Hu XX, Yang ZX, Liang HY, Ding Y, Grimm R, Fu CX, et al. Whole-tumor MRI histogram analyses of hepatocellular carcinoma: correlations with Ki-67 labeling index. J Magn Reson Imaging 2017;46:383-392
12. Huang YQ, Liang HY, Yang ZX, Ding Y, Zeng MS, Rao SX. Value of MR histogram analyses for prediction of microvascular invasion of hepatocellular carcinoma. Medicine (Baltimore) 2016;95:e4034
13. Fujimoto K, Tonan T, Azuma S, Kage M, Nakashima O, Johkoh T, et al. Evaluation of the mean and entropy of apparent diffusion coefficient values in chronic hepatitis C: correlation with pathologic fibrosis stage and inflammatory activity grade. Radiology 2011;258:739-748
14. Choi JY, Kim H, Sun M, Sirlin CB. Histogram analysis of hepatobiliary phase MR imaging as a quantitative value
for liver cirrhosis: preliminary observations. Yonsei Med J 2014;55:651-659
15. Kim H, Park SH, Kim EK, Kim MJ, Park YN, Park HJ, et al. Histogram analysis of gadoxetic acid-enhanced MRI for quantitative hepatic fibrosis measurement. PLoS One 2014;9:e114224
16. Lagadec M, Doblas S, Giraudeau C, Ronot M, Lambert SA, Fasseu M, et al. Advanced fibrosis: correlation between pharmacokinetic parameters at dynamic gadoxetate-enhanced MR imaging and hepatocyte organic anion transporter expression in rat liver. Radiology 2015;274:379-386
17. Dong D, Yin L, Qi Y, Xu L, Peng J. Protective effect of the total saponins from Rosa laevigata michx fruit against carbon tetrachloride-induced liver fibrosis in rats. Nutrients 2015;7:4829-4850
18. Tamada T, Prabhu V, Li J, Babb JS, Taneja SS, Rosenkrantz AB. Prostate cancer: diffusion-weighted MR imaging for detection and assessment of aggressiveness-comparison between conventional and kurtosis models. Radiology 2017;284:100-108
19. Bedossa P, Poynard T. An algorithm for the grading of activity in chronic hepatitis C. Hepatology 1996;24:289-293
20. Karlik SJ. Exploring and summarizing radiologic data. AJR Am J Roentgenol 2003;180:47-54
21. DeLong ER, DeLong DM, Clarke-Pearson DL. Comparing the areas under two or more correlated receiver operating characteristic curves: a nonparametric approach. Biometrics 1988;44:837-845
22. Liang HY, Huang YQ, Yang ZX, Ying D, Zeng MS, Rao SX. Potential of MR histogram analyses for prediction of response to chemotherapy in patients with colorectal hepatic metastases. Eur Radiol 2016;26:2009-2018
23. Taouli B, Chouli M, Martin AJ, Qayyum A, Coakley FV, Vilgrain V. Chronic hepatitis: role of diffusion-weighted imaging and diffusion-tensor imaging for the diagnosis of liver fibrosis and inflammation. J Magn Reson Imaging 2008;28:89-95
24. Lambregts DM, Martens MH, Quah RC, Nikiforaki K, Heijnen LA, Dejong CH, et al. Whole-liver diffusion-weighted MRI histogram analysis: effect of the presence of colorectal hepatic metastases on the remaining liver parenchyma. Eur J Gastroenterol Hepatol 2015;27:399-404
25. Anderson SW, Barry B, Soto J, Ozonoff A, O’Brien M, Jara H. Characterizing non-gaussian, high b-value diffusion in liver fibrosis: stretched exponential and diffusional kurtosis modeling. J Magn Reson Imaging 2014;39:827-834
26. Drevelegas K, Nikiforaki K, Constantinides M, Papanikolaou N, Papalavrentios L, Stoikou I, et al. Apparent diffusion coefficient quantification in determining the histological diagnosis of malignant liver lesions. J Cancer 2016;7:730-735
27. Asayama Y, Nishie A, Ishigami K, Ushijima Y, Takayama Y, Okamoto D, et al. Histogram analysis of noncancerous liver parenchyma on gadoxetic acid-enhanced MRI: predictive value for liver function and pathology. Abdom Radiol (NY) 2016;41:1751-1757
28. Lambregts DM, Beets GL, Maas M, Curvo-Semedo L, Kessels AG, Thywissen T, et al. Tumour ADC measurements in rectal cancer: effect of ROI methods on ADC values and interobserver variability. Eur Radiol 2011;21:2567-2574


![영상처리 실습 #4 Histogram 연산 [ Histogram 대화상자 만들기 ]. Histogram 대화상자 만들기](https://img.pdfslide.net/doc/110x75/5697bfe71a28abf838cb5e1a/-4-histogram-histogram-.jpg)