Embed Size (px)
Citation preview
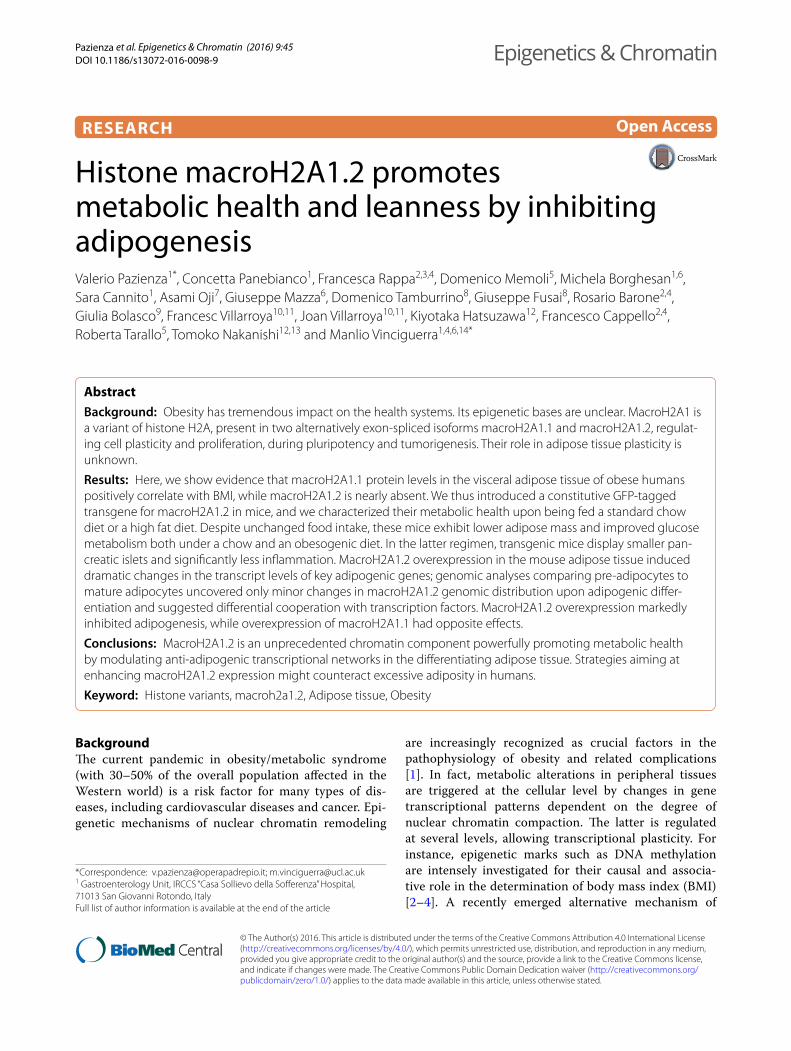
Pazienza et al. Epigenetics & Chromatin (2016) 9:45 DOI 10.1186/s13072-016-0098-9
RESEARCH
Histone macroH2A1.2 promotes metabolic health and leanness by inhibiting adipogenesisValerio Pazienza1*, Concetta Panebianco1, Francesca Rappa2,3,4, Domenico Memoli5, Michela Borghesan1,6, Sara Cannito1, Asami Oji7, Giuseppe Mazza6, Domenico Tamburrino8, Giuseppe Fusai8, Rosario Barone2,4, Giulia Bolasco9, Francesc Villarroya10,11, Joan Villarroya10,11, Kiyotaka Hatsuzawa12, Francesco Cappello2,4, Roberta Tarallo5, Tomoko Nakanishi12,13 and Manlio Vinciguerra1,4,6,14*
Abstract
Background: Obesity has tremendous impact on the health systems. Its epigenetic bases are unclear. MacroH2A1 is a variant of histone H2A, present in two alternatively exon-spliced isoforms macroH2A1.1 and macroH2A1.2, regulat-ing cell plasticity and proliferation, during pluripotency and tumorigenesis. Their role in adipose tissue plasticity is unknown.
Results: Here, we show evidence that macroH2A1.1 protein levels in the visceral adipose tissue of obese humans positively correlate with BMI, while macroH2A1.2 is nearly absent. We thus introduced a constitutive GFP-tagged transgene for macroH2A1.2 in mice, and we characterized their metabolic health upon being fed a standard chow diet or a high fat diet. Despite unchanged food intake, these mice exhibit lower adipose mass and improved glucose metabolism both under a chow and an obesogenic diet. In the latter regimen, transgenic mice display smaller pan-creatic islets and significantly less inflammation. MacroH2A1.2 overexpression in the mouse adipose tissue induced dramatic changes in the transcript levels of key adipogenic genes; genomic analyses comparing pre-adipocytes to mature adipocytes uncovered only minor changes in macroH2A1.2 genomic distribution upon adipogenic differ-entiation and suggested differential cooperation with transcription factors. MacroH2A1.2 overexpression markedly inhibited adipogenesis, while overexpression of macroH2A1.1 had opposite effects.
Conclusions: MacroH2A1.2 is an unprecedented chromatin component powerfully promoting metabolic health by modulating anti-adipogenic transcriptional networks in the differentiating adipose tissue. Strategies aiming at enhancing macroH2A1.2 expression might counteract excessive adiposity in humans.
Keyword: Histone variants, macroh2a1.2, Adipose tissue, Obesity
© The Author(s) 2016. This article is distributed under the terms of the Creative Commons Attribution 4.0 International License (http://creativecommons.org/licenses/by/4.0/), which permits unrestricted use, distribution, and reproduction in any medium, provided you give appropriate credit to the original author(s) and the source, provide a link to the Creative Commons license, and indicate if changes were made. The Creative Commons Public Domain Dedication waiver (http://creativecommons.org/publicdomain/zero/1.0/) applies to the data made available in this article, unless otherwise stated.
BackgroundThe current pandemic in obesity/metabolic syndrome (with 30–50% of the overall population affected in the Western world) is a risk factor for many types of dis-eases, including cardiovascular diseases and cancer. Epi-genetic mechanisms of nuclear chromatin remodeling
are increasingly recognized as crucial factors in the pathophysiology of obesity and related complications [1]. In fact, metabolic alterations in peripheral tissues are triggered at the cellular level by changes in gene transcriptional patterns dependent on the degree of nuclear chromatin compaction. The latter is regulated at several levels, allowing transcriptional plasticity. For instance, epigenetic marks such as DNA methylation are intensely investigated for their causal and associa-tive role in the determination of body mass index (BMI) [2–4]. A recently emerged alternative mechanism of
Open Access
Epigenetics & Chromatin
*Correspondence: [email protected]; [email protected] 1 Gastroenterology Unit, IRCCS “Casa Sollievo della Sofferenza” Hospital, 71013 San Giovanni Rotondo, ItalyFull list of author information is available at the end of the article
Page 2 of 19Pazienza et al. Epigenetics & Chromatin (2016) 9:45
transcriptional plasticity is the replacement of canoni-cal histones, around which DNA is wrapped (H2A, H2B, H3 and H4), with the incorporation of histone variants, mostly of histones H2A or H3 [5–7]. The histone vari-ant of H2A, known as macroH2A1, is believed to act as a strong transcriptional modulator that can either repress transcription or activate it in response to as yet unde-fined nutrients or growth signals [8–13]. The impact of macroH2A1 on transcriptional processes has now come to take a center stage in the plasticity of stem cell differ-entiation and in the pathogenesis of a growing number of cancer types [14–17]. MacroH2A1 is composed of a domain displaying 66% homology with histone H2A, and a domain called macro that is conserved in multiple functionally unrelated proteins throughout the animal kingdom and that can bind in vitro with tight affinity ADP-ribose-like metabolites, providing a direct molecu-lar interaction between intermediate metabolism and the chromatin, whereby a metabolite can tweak gene expression in vitro [18]. MacroH2A1 is in turn present in two alternatively exon-spliced isoforms, macroH2A1.1 and macroH2A1.2, which differ for a few amino acids [18]. Whether these two isoforms play different roles in cell plasticity is debated and context dependent; how-ever, most reports support a pro-differentiation role for macroH2A1.1 and an anti-differentiation and pro-pro-liferative role for macroH2A1.2 [14–17, 19, 20]. Mice models, knockout (KO) for the whole macroH2A1 gene, have been reported. In KO mice generated in the pure C57BL/6 J background, modest developmental changes in macroH2A1-mediated gene regulation under a stand-ard diet, and a very mild systemic protection against obesity upon a high fat regimen, were observed [21, 22]. By contrast, in KO mice for macroH2A1 generated in a mixed background a variable hepatic lipid accumula-tion in 50% of the females has been described, without changes in body weight [23]. Therefore, despite compel-ling in vitro evidence that macroH2A1 modulates gene expression programs involved in cell metabolism, prolif-eration and differentiation, the existing evidence for its role at the organism level upon nutritional stress, espe-cially during fat accumulation obesity, is controversial. Moreover, data deriving from KO approaches might be often influenced by functional redundancy or compen-satory effects between the isoforms. Under a standard diet, in SWR/J mice, featuring a higher metabolic health and a better triglyceride metabolism compared to com-mon BALB/cByJ and C57BL/6J strains, a >threefold increase in hepatic basal mRNA levels of macroH2A1.2, among the top 15 upregulated genes, was found [24]. Conversely, in genetic or dietary mice models of non-alcoholic fatty liver disease (NAFLD), a disorder that is present in 90% of obese subjects, the hepatic content of
macroH2A1.2, but not of macroH2A1.1, is augmented [25].
The in vivo role of macroH2A1 isoforms in lipid metab-olism and obesity is thus unclear. Here, we challenged newly generated macroH2A1.2–EGFP transgenic (Tg) mice [26] with an obesogenic high fat diet (60% energy from lard): Our findings identify macroH2A1.2 as a new and potent epigenetic inhibitor of adipogenesis. Its sys-temic overexpression leads to a spectacular protection from obesity and its related complications. Mechanisti-cally, macroH2A1.2 strongly impaired adipogenesis, both in vitro and in vivo.
ResultsDifferential association between macroH2A1.1 and macroH2A1.2 protein levels and BMI in human adipose tissue.
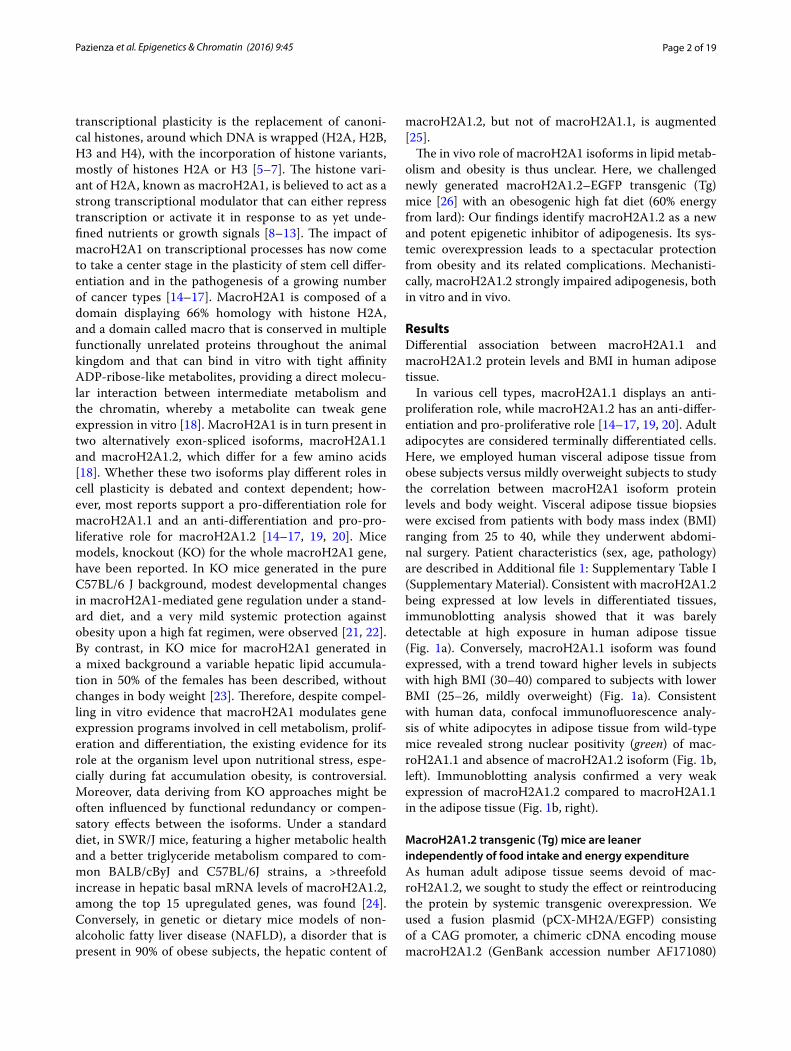
In various cell types, macroH2A1.1 displays an anti-proliferation role, while macroH2A1.2 has an anti-differ-entiation and pro-proliferative role [14–17, 19, 20]. Adult adipocytes are considered terminally differentiated cells. Here, we employed human visceral adipose tissue from obese subjects versus mildly overweight subjects to study the correlation between macroH2A1 isoform protein levels and body weight. Visceral adipose tissue biopsies were excised from patients with body mass index (BMI) ranging from 25 to 40, while they underwent abdomi-nal surgery. Patient characteristics (sex, age, pathology) are described in Additional file 1: Supplementary Table I (Supplementary Material). Consistent with macroH2A1.2 being expressed at low levels in differentiated tissues, immunoblotting analysis showed that it was barely detectable at high exposure in human adipose tissue (Fig. 1a). Conversely, macroH2A1.1 isoform was found expressed, with a trend toward higher levels in subjects with high BMI (30–40) compared to subjects with lower BMI (25–26, mildly overweight) (Fig. 1a). Consistent with human data, confocal immunofluorescence analy-sis of white adipocytes in adipose tissue from wild-type mice revealed strong nuclear positivity (green) of mac-roH2A1.1 and absence of macroH2A1.2 isoform (Fig. 1b, left). Immunoblotting analysis confirmed a very weak expression of macroH2A1.2 compared to macroH2A1.1 in the adipose tissue (Fig. 1b, right).
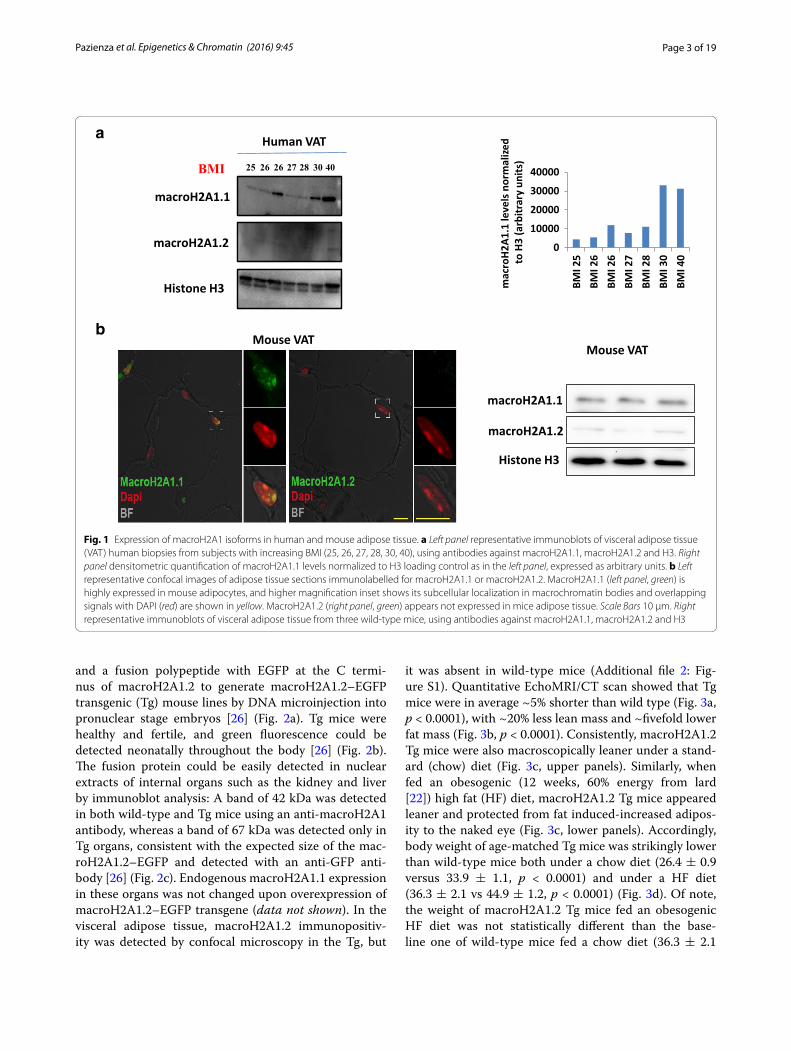
MacroH2A1.2 transgenic (Tg) mice are leaner independently of food intake and energy expenditureAs human adult adipose tissue seems devoid of mac-roH2A1.2, we sought to study the effect or reintroducing the protein by systemic transgenic overexpression. We used a fusion plasmid (pCX-MH2A/EGFP) consisting of a CAG promoter, a chimeric cDNA encoding mouse macroH2A1.2 (GenBank accession number AF171080)
Page 3 of 19Pazienza et al. Epigenetics & Chromatin (2016) 9:45
and a fusion polypeptide with EGFP at the C termi-nus of macroH2A1.2 to generate macroH2A1.2–EGFP transgenic (Tg) mouse lines by DNA microinjection into pronuclear stage embryos [26] (Fig. 2a). Tg mice were healthy and fertile, and green fluorescence could be detected neonatally throughout the body [26] (Fig. 2b). The fusion protein could be easily detected in nuclear extracts of internal organs such as the kidney and liver by immunoblot analysis: A band of 42 kDa was detected in both wild-type and Tg mice using an anti-macroH2A1 antibody, whereas a band of 67 kDa was detected only in Tg organs, consistent with the expected size of the mac-roH2A1.2–EGFP and detected with an anti-GFP anti-body [26] (Fig. 2c). Endogenous macroH2A1.1 expression in these organs was not changed upon overexpression of macroH2A1.2–EGFP transgene (data not shown). In the visceral adipose tissue, macroH2A1.2 immunopositiv-ity was detected by confocal microscopy in the Tg, but
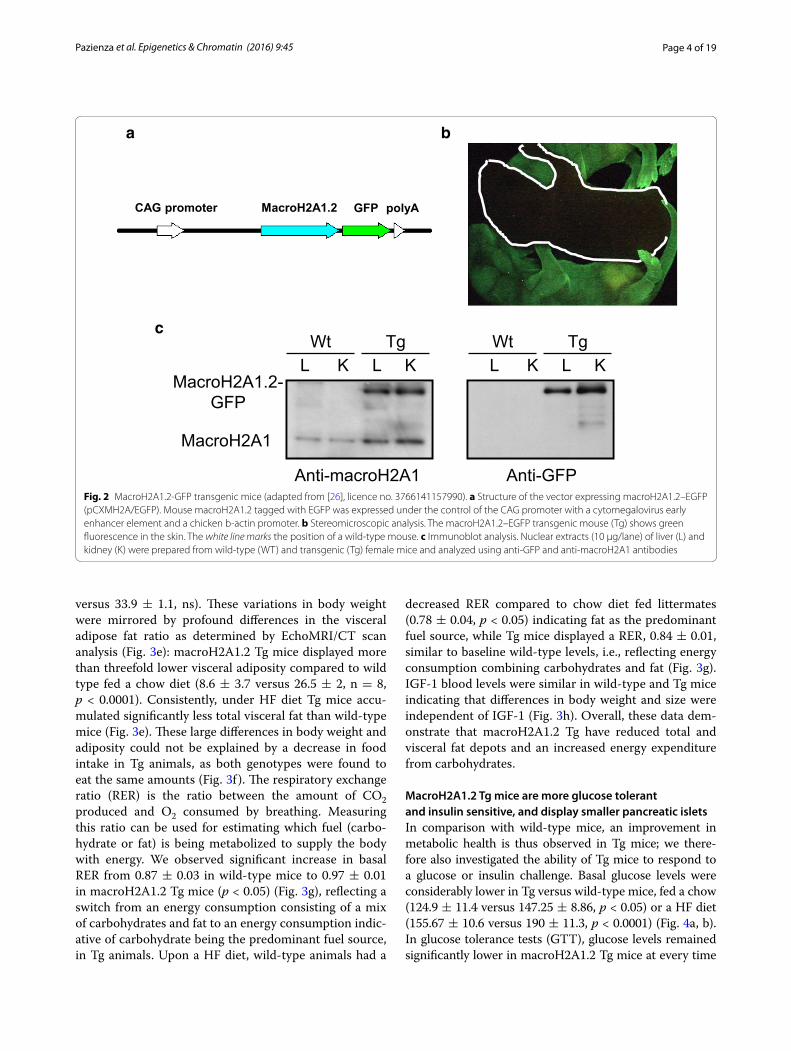
it was absent in wild-type mice (Additional file 2: Fig-ure S1). Quantitative EchoMRI/CT scan showed that Tg mice were in average ~5% shorter than wild type (Fig. 3a, p < 0.0001), with ~20% less lean mass and ~fivefold lower fat mass (Fig. 3b, p < 0.0001). Consistently, macroH2A1.2 Tg mice were also macroscopically leaner under a stand-ard (chow) diet (Fig. 3c, upper panels). Similarly, when fed an obesogenic (12 weeks, 60% energy from lard [22]) high fat (HF) diet, macroH2A1.2 Tg mice appeared leaner and protected from fat induced-increased adipos-ity to the naked eye (Fig. 3c, lower panels). Accordingly, body weight of age-matched Tg mice was strikingly lower than wild-type mice both under a chow diet (26.4 ± 0.9 versus 33.9 ± 1.1, p < 0.0001) and under a HF diet (36.3 ± 2.1 vs 44.9 ± 1.2, p < 0.0001) (Fig. 3d). Of note, the weight of macroH2A1.2 Tg mice fed an obesogenic HF diet was not statistically different than the base-line one of wild-type mice fed a chow diet (36.3 ± 2.1
macroH2A1.2
macroH2A1.1
Histone H3
BMI 40 30 28 27 26 26 25
Human VAT
0
10000
20000
30000
40000
BMI 2
5BM
I 26
BMI 2
6BM
I 27
BMI 2
8BM
I 30
BMI 4
0
mac
roH2
A1.1
leve
ls n
orm
alize
d
to H
3 (a
rbitr
ary
units
)
Mouse VAT
a
b
macroH2A1.2
macroH2A1.1
Histone H3
Mouse VAT
Fig. 1 Expression of macroH2A1 isoforms in human and mouse adipose tissue. a Left panel representative immunoblots of visceral adipose tissue (VAT) human biopsies from subjects with increasing BMI (25, 26, 27, 28, 30, 40), using antibodies against macroH2A1.1, macroH2A1.2 and H3. Right panel densitometric quantification of macroH2A1.1 levels normalized to H3 loading control as in the left panel, expressed as arbitrary units. b Left representative confocal images of adipose tissue sections immunolabelled for macroH2A1.1 or macroH2A1.2. MacroH2A1.1 (left panel, green) is highly expressed in mouse adipocytes, and higher magnification inset shows its subcellular localization in macrochromatin bodies and overlapping signals with DAPI (red) are shown in yellow. MacroH2A1.2 (right panel, green) appears not expressed in mice adipose tissue. Scale Bars 10 μm. Right representative immunoblots of visceral adipose tissue from three wild-type mice, using antibodies against macroH2A1.1, macroH2A1.2 and H3
Page 4 of 19Pazienza et al. Epigenetics & Chromatin (2016) 9:45
versus 33.9 ± 1.1, ns). These variations in body weight were mirrored by profound differences in the visceral adipose fat ratio as determined by EchoMRI/CT scan analysis (Fig. 3e): macroH2A1.2 Tg mice displayed more than threefold lower visceral adiposity compared to wild type fed a chow diet (8.6 ± 3.7 versus 26.5 ± 2, n = 8, p < 0.0001). Consistently, under HF diet Tg mice accu-mulated significantly less total visceral fat than wild-type mice (Fig. 3e). These large differences in body weight and adiposity could not be explained by a decrease in food intake in Tg animals, as both genotypes were found to eat the same amounts (Fig. 3f ). The respiratory exchange ratio (RER) is the ratio between the amount of CO2 produced and O2 consumed by breathing. Measuring this ratio can be used for estimating which fuel (carbo-hydrate or fat) is being metabolized to supply the body with energy. We observed significant increase in basal RER from 0.87 ± 0.03 in wild-type mice to 0.97 ± 0.01 in macroH2A1.2 Tg mice (p < 0.05) (Fig. 3g), reflecting a switch from an energy consumption consisting of a mix of carbohydrates and fat to an energy consumption indic-ative of carbohydrate being the predominant fuel source, in Tg animals. Upon a HF diet, wild-type animals had a
decreased RER compared to chow diet fed littermates (0.78 ± 0.04, p < 0.05) indicating fat as the predominant fuel source, while Tg mice displayed a RER, 0.84 ± 0.01, similar to baseline wild-type levels, i.e., reflecting energy consumption combining carbohydrates and fat (Fig. 3g). IGF-1 blood levels were similar in wild-type and Tg mice indicating that differences in body weight and size were independent of IGF-1 (Fig. 3h). Overall, these data dem-onstrate that macroH2A1.2 Tg have reduced total and visceral fat depots and an increased energy expenditure from carbohydrates.
MacroH2A1.2 Tg mice are more glucose tolerant and insulin sensitive, and display smaller pancreatic isletsIn comparison with wild-type mice, an improvement in metabolic health is thus observed in Tg mice; we there-fore also investigated the ability of Tg mice to respond to a glucose or insulin challenge. Basal glucose levels were considerably lower in Tg versus wild-type mice, fed a chow (124.9 ± 11.4 versus 147.25 ± 8.86, p < 0.05) or a HF diet (155.67 ± 10.6 versus 190 ± 11.3, p < 0.0001) (Fig. 4a, b). In glucose tolerance tests (GTT), glucose levels remained significantly lower in macroH2A1.2 Tg mice at every time
CAG promoter MacroH2A1.2 GFP polyA
MacroH2A1
MacroH2A1.2-GFP
Anti-macroH2A1
Tg L K L K
Wt
Anti-GFP
Tg L K L K Wt
a
c
b
Fig. 2 MacroH2A1.2-GFP transgenic mice (adapted from [26], licence no. 3766141157990). a Structure of the vector expressing macroH2A1.2–EGFP (pCXMH2A/EGFP). Mouse macroH2A1.2 tagged with EGFP was expressed under the control of the CAG promoter with a cytomegalovirus early enhancer element and a chicken b-actin promoter. b Stereomicroscopic analysis. The macroH2A1.2–EGFP transgenic mouse (Tg) shows green fluorescence in the skin. The white line marks the position of a wild-type mouse. c Immunoblot analysis. Nuclear extracts (10 µg/lane) of liver (L) and kidney (K) were prepared from wild-type (WT) and transgenic (Tg) female mice and analyzed using anti-GFP and anti-macroH2A1 antibodies
Page 5 of 19Pazienza et al. Epigenetics & Chromatin (2016) 9:45
point, compared to wild-type littermates, both upon a chow or a HF diet (Fig. 4a). Insulin tolerance tests (ITT) showed that the insulin-mediated decrease in glycemia was much more pronounced and statistically significant in Tg mice versus wild-type mice at every time measured (p < 0.0001 at 15, 30, 45, 60, 120 min time points) upon a chow diet (Fig. 4b). Upon a HF diet, statistical differ-ences were observed between macroH2A1.2 Tg and wild-type mice only after 30 min (Fig. 4b). To gain insight into the mechanism by which systemic glucose tolerance is
improved in chow and HF diet fed macroH2A1.2 Tg mice, we characterized insulin-induced AKT signaling in the skeletal muscle, liver and adipose tissues under insulin-stimulated conditions (0.75 U kg − 1 body weight, injected 15 min before killing) (Additional file 3: Figure S2). AKT phosphorylation (Ser473) was increased in insulin-respon-sive peripheral tissues of macroH2A1.2 Tg mice fed either a chow or a HF diet compared with wild-type controls (Additional file 3: Figure S2). Circulating insulin levels did not differ between genotypes under a chow diet, and they
Body
Len
gth
(mm
)
***
TG WT
Chow
die
t
TG WT
HF d
iet
a cb
fed
01020304050
Body
wei
ght (
gr)
***
*** ###
01234
Food
inta
ke
(gr/
day)
g
*
*
Resp
irato
ry q
uo�e
nt
(CO
2 pro
duc�
on/O
2co
nsum
p�on
)
***
***
TG
WT
% o
f bod
y m
ass
0102030405060
Visc
eral
Fat
Ra�
o (%
)
***
*** ##
50
70
90
110
WT TG0
5
10
15
Lean mass Fat mass
WT
TG
01000200030004000
IGF-
1 le
vels
(pg/
ml)
h
0.60.70.80.9
1
Fig. 3 Metabolic phenotyping of macroH2A1.2 Tg mice. a CT scan of a representative WT and macroH2A1.2 Tg mouse (upper panels), image-assisted quantification of body length (lower panel); b lean and fat masses were determined by CT scan c representative pictures of WT and macroH2A1.2 Tg mice fed a chow diet (upper panels) or a HF diet (lower panels) mice, with a dorsal view (left panels) and a ventral view of peritoneal cavity showing internal organs upon killing (right panels); d body weight in WT and macroH2A1.2 Tg mice fed a chow or a HF diet at the experimen-tal end point; e visceral fat ratio as determined by EchoMRI/CT scan in the four mice groups; f food intake in the four mice groups was assessed; g respiratory CO2/O2 exchange ratio as determined by metabolic cages; h IGF-1 blood levels, measured by ELISA (Milliplex) upon killing. Data are expressed as means} S.E.M. (n = 8–9 per group). *p < 0.05, ***p < 0.001 change versus WT fed a chow diet; ##p < 0.01 change versus WT fed a HF diet
Page 6 of 19Pazienza et al. Epigenetics & Chromatin (2016) 9:45
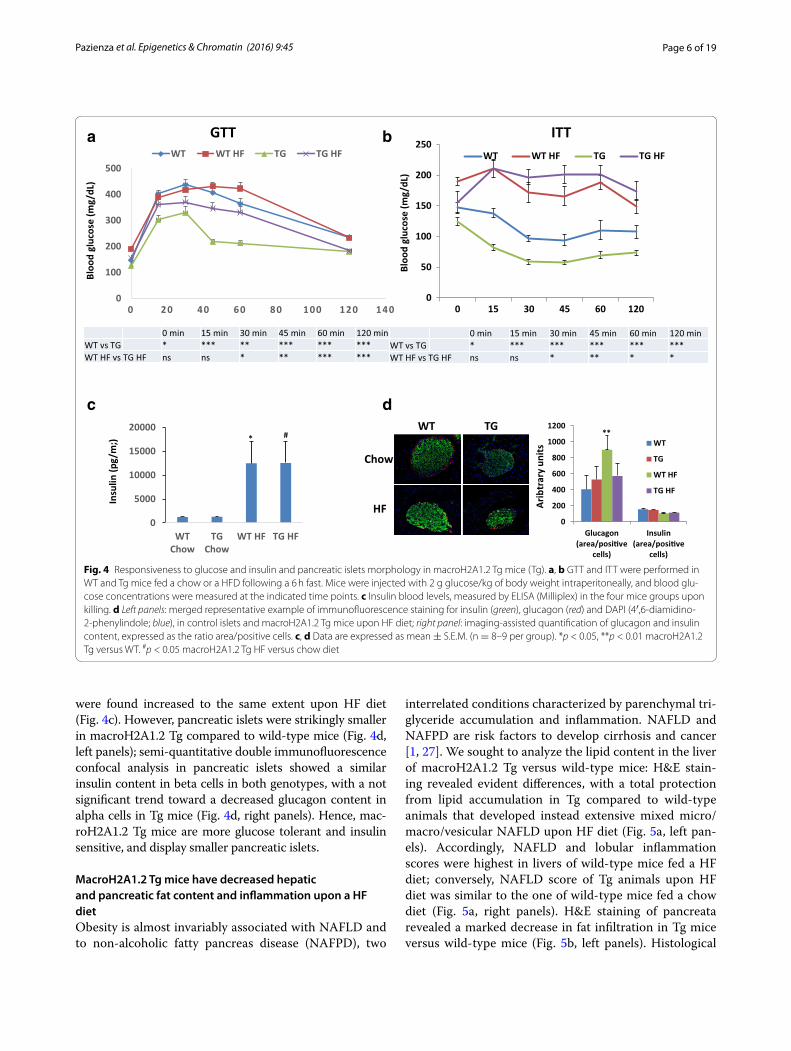
were found increased to the same extent upon HF diet (Fig. 4c). However, pancreatic islets were strikingly smaller in macroH2A1.2 Tg compared to wild-type mice (Fig. 4d, left panels); semi-quantitative double immunofluorescence confocal analysis in pancreatic islets showed a similar insulin content in beta cells in both genotypes, with a not significant trend toward a decreased glucagon content in alpha cells in Tg mice (Fig. 4d, right panels). Hence, mac-roH2A1.2 Tg mice are more glucose tolerant and insulin sensitive, and display smaller pancreatic islets.
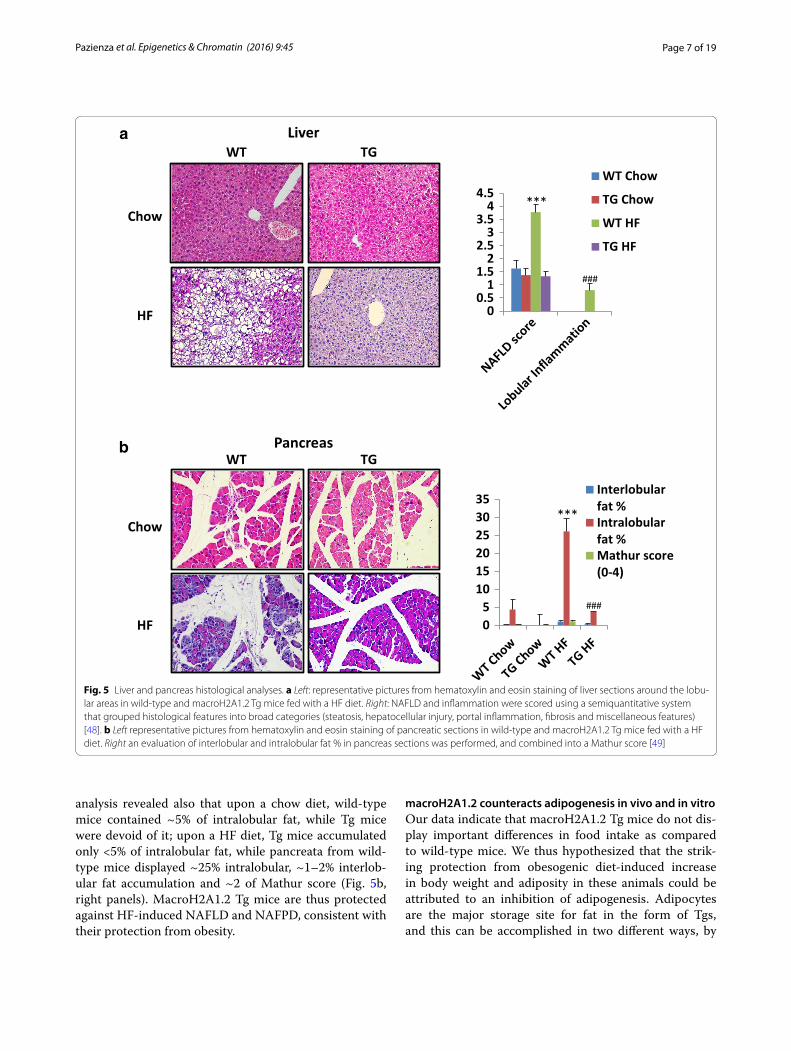
MacroH2A1.2 Tg mice have decreased hepatic and pancreatic fat content and inflammation upon a HF dietObesity is almost invariably associated with NAFLD and to non-alcoholic fatty pancreas disease (NAFPD), two
interrelated conditions characterized by parenchymal tri-glyceride accumulation and inflammation. NAFLD and NAFPD are risk factors to develop cirrhosis and cancer [1, 27]. We sought to analyze the lipid content in the liver of macroH2A1.2 Tg versus wild-type mice: H&E stain-ing revealed evident differences, with a total protection from lipid accumulation in Tg compared to wild-type animals that developed instead extensive mixed micro/macro/vesicular NAFLD upon HF diet (Fig. 5a, left pan-els). Accordingly, NAFLD and lobular inflammation scores were highest in livers of wild-type mice fed a HF diet; conversely, NAFLD score of Tg animals upon HF diet was similar to the one of wild-type mice fed a chow diet (Fig. 5a, right panels). H&E staining of pancreata revealed a marked decrease in fat infiltration in Tg mice versus wild-type mice (Fig. 5b, left panels). Histological
0 min 15 min 30 min 45 min 60 min 120 min WT vs TG * *** ** *** *** *** WT HF vs TG HF ns ns * ** *** ***
Bloo
d gl
ucos
e (m
g/dL
)
0
100
200
300
400
500
0 20 40 60 80 100 120 140
WT WT HF TG TG HF
0 min 15 min 30 min 45 min 60 min 120 min WT vs TG * *** *** *** *** *** WT HF vs TG HF ns ns * ** * *
Bloo
d gl
ucos
e (m
g/dL
)
TTITTG
0
50
100
150
200
250
0 15 30 45 60 120
WT WT HF TG TG HF
a b
WT TG
dc
Arib
trar
y un
its
Chow
HF 0
200
400
600
800
1000
1200
Glucagon(area/posi�ve
cells)
Insulin(area/posi�ve
cells)
WT
TG
WT HF
TG HF
**
0
5000
10000
15000
20000
WTChow
TGChow
WT HF TG HF
Insu
lin (p
g/m
;) * #
Fig. 4 Responsiveness to glucose and insulin and pancreatic islets morphology in macroH2A1.2 Tg mice (Tg). a, b GTT and ITT were performed in WT and Tg mice fed a chow or a HFD following a 6 h fast. Mice were injected with 2 g glucose/kg of body weight intraperitoneally, and blood glu-cose concentrations were measured at the indicated time points. c Insulin blood levels, measured by ELISA (Milliplex) in the four mice groups upon killing. d Left panels: merged representative example of immunofluorescence staining for insulin (green), glucagon (red) and DAPI (4′,6-diamidino-2-phenylindole; blue), in control islets and macroH2A1.2 Tg mice upon HF diet; right panel: imaging-assisted quantification of glucagon and insulin content, expressed as the ratio area/positive cells. c, d Data are expressed as mean ± S.E.M. (n = 8–9 per group). *p < 0.05, **p < 0.01 macroH2A1.2 Tg versus WT. #p < 0.05 macroH2A1.2 Tg HF versus chow diet
Page 7 of 19Pazienza et al. Epigenetics & Chromatin (2016) 9:45
analysis revealed also that upon a chow diet, wild-type mice contained ~5% of intralobular fat, while Tg mice were devoid of it; upon a HF diet, Tg mice accumulated only <5% of intralobular fat, while pancreata from wild-type mice displayed ~25% intralobular, ~1–2% interlob-ular fat accumulation and ~2 of Mathur score (Fig. 5b, right panels). MacroH2A1.2 Tg mice are thus protected against HF-induced NAFLD and NAFPD, consistent with their protection from obesity.
macroH2A1.2 counteracts adipogenesis in vivo and in vitroOur data indicate that macroH2A1.2 Tg mice do not dis-play important differences in food intake as compared to wild-type mice. We thus hypothesized that the strik-ing protection from obesogenic diet-induced increase in body weight and adiposity in these animals could be attributed to an inhibition of adipogenesis. Adipocytes are the major storage site for fat in the form of Tgs, and this can be accomplished in two different ways, by
a
b
***
Chow
HF
***
Chow
HF
Liver
Pancreas
WT TG
WT TG
00.5
11.5
22.5
33.5
44.5
WT Chow
TG Chow
WT HF
TG HF
05
101520253035
Interlobularfat %Intralobularfat %Mathur score(0-4)
###
###
Fig. 5 Liver and pancreas histological analyses. a Left: representative pictures from hematoxylin and eosin staining of liver sections around the lobu-lar areas in wild-type and macroH2A1.2 Tg mice fed with a HF diet. Right: NAFLD and inflammation were scored using a semiquantitative system that grouped histological features into broad categories (steatosis, hepatocellular injury, portal inflammation, fibrosis and miscellaneous features) [48]. b Left representative pictures from hematoxylin and eosin staining of pancreatic sections in wild-type and macroH2A1.2 Tg mice fed with a HF diet. Right an evaluation of interlobular and intralobular fat % in pancreas sections was performed, and combined into a Mathur score [49]
Page 8 of 19Pazienza et al. Epigenetics & Chromatin (2016) 9:45
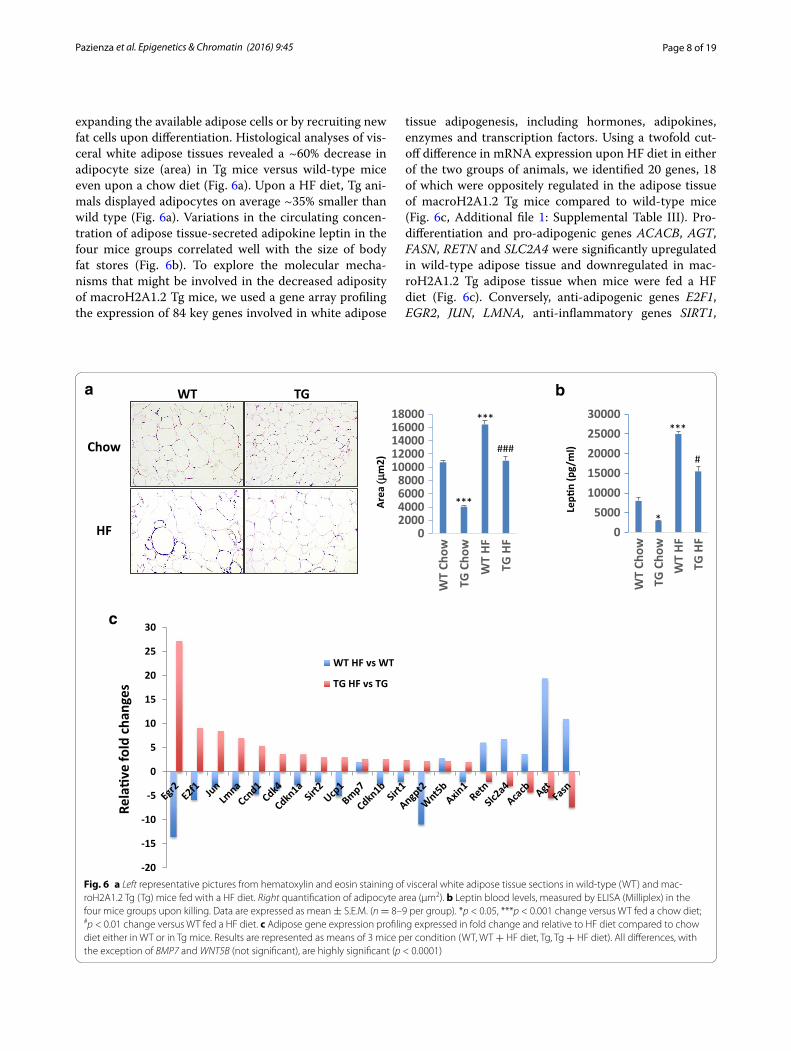
expanding the available adipose cells or by recruiting new fat cells upon differentiation. Histological analyses of vis-ceral white adipose tissues revealed a ~60% decrease in adipocyte size (area) in Tg mice versus wild-type mice even upon a chow diet (Fig. 6a). Upon a HF diet, Tg ani-mals displayed adipocytes on average ~35% smaller than wild type (Fig. 6a). Variations in the circulating concen-tration of adipose tissue-secreted adipokine leptin in the four mice groups correlated well with the size of body fat stores (Fig. 6b). To explore the molecular mecha-nisms that might be involved in the decreased adiposity of macroH2A1.2 Tg mice, we used a gene array profiling the expression of 84 key genes involved in white adipose
tissue adipogenesis, including hormones, adipokines, enzymes and transcription factors. Using a twofold cut-off difference in mRNA expression upon HF diet in either of the two groups of animals, we identified 20 genes, 18 of which were oppositely regulated in the adipose tissue of macroH2A1.2 Tg mice compared to wild-type mice (Fig. 6c, Additional file 1: Supplemental Table III). Pro-differentiation and pro-adipogenic genes ACACB, AGT, FASN, RETN and SLC2A4 were significantly upregulated in wild-type adipose tissue and downregulated in mac-roH2A1.2 Tg adipose tissue when mice were fed a HF diet (Fig. 6c). Conversely, anti-adipogenic genes E2F1, EGR2, JUN, LMNA, anti-inflammatory genes SIRT1,
a
c
WT TGAr
ea (µ
m2)
Rela
�ve
fold
cha
nges
Chow
HF 02000400060008000
1000012000140001600018000
WT
Chow
TG C
how
WT
HF
TG H
F***
***
###
b
05000
1000015000200002500030000
WT
Chow
TG C
how
WT
HFTG
HF
Lep�
n (p
g/m
l)
***
*
#
-20
-15
-10
-5
0
5
10
15
20
25
30
WT HF vs WT
TG HF vs TG
Fig. 6 a Left representative pictures from hematoxylin and eosin staining of visceral white adipose tissue sections in wild-type (WT) and mac-roH2A1.2 Tg (Tg) mice fed with a HF diet. Right quantification of adipocyte area (μm2). b Leptin blood levels, measured by ELISA (Milliplex) in the four mice groups upon killing. Data are expressed as mean ± S.E.M. (n = 8–9 per group). *p < 0.05, ***p < 0.001 change versus WT fed a chow diet; #p < 0.01 change versus WT fed a HF diet. c Adipose gene expression profiling expressed in fold change and relative to HF diet compared to chow diet either in WT or in Tg mice. Results are represented as means of 3 mice per condition (WT, WT + HF diet, Tg, Tg + HF diet). All differences, with the exception of BMP7 and WNT5B (not significant), are highly significant (p < 0.0001)
Page 9 of 19Pazienza et al. Epigenetics & Chromatin (2016) 9:45
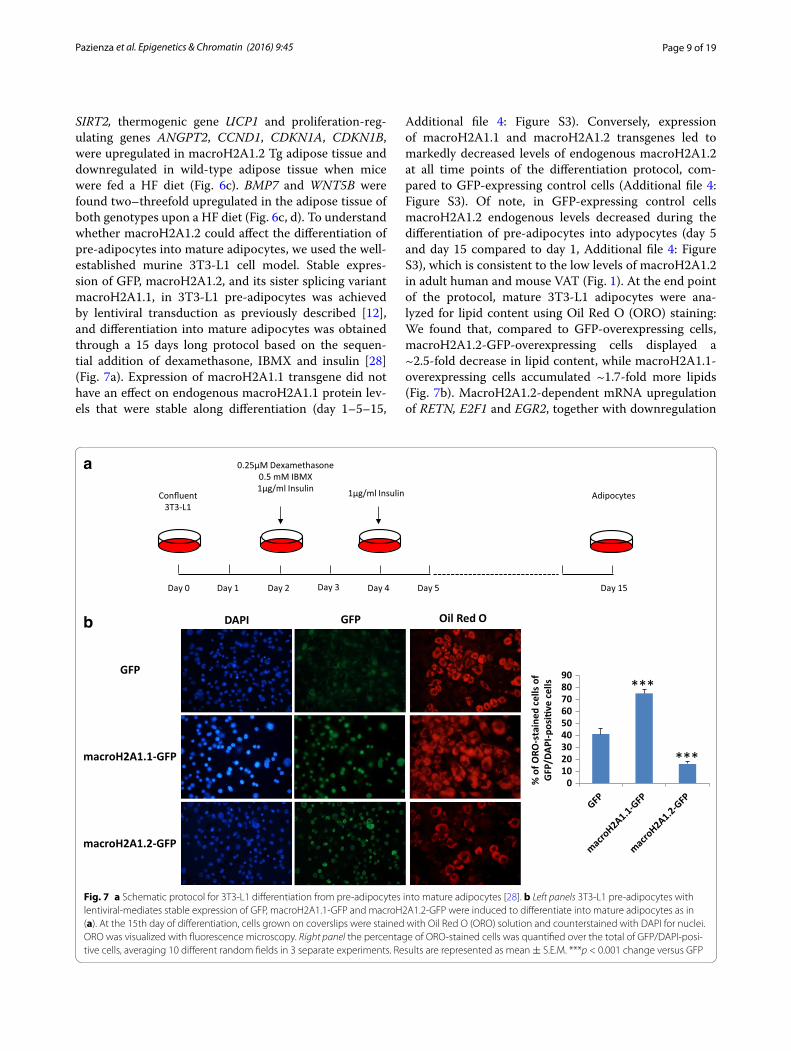
SIRT2, thermogenic gene UCP1 and proliferation-reg-ulating genes ANGPT2, CCND1, CDKN1A, CDKN1B, were upregulated in macroH2A1.2 Tg adipose tissue and downregulated in wild-type adipose tissue when mice were fed a HF diet (Fig. 6c). BMP7 and WNT5B were found two–threefold upregulated in the adipose tissue of both genotypes upon a HF diet (Fig. 6c, d). To understand whether macroH2A1.2 could affect the differentiation of pre-adipocytes into mature adipocytes, we used the well-established murine 3T3-L1 cell model. Stable expres-sion of GFP, macroH2A1.2, and its sister splicing variant macroH2A1.1, in 3T3-L1 pre-adipocytes was achieved by lentiviral transduction as previously described [12], and differentiation into mature adipocytes was obtained through a 15 days long protocol based on the sequen-tial addition of dexamethasone, IBMX and insulin [28] (Fig. 7a). Expression of macroH2A1.1 transgene did not have an effect on endogenous macroH2A1.1 protein lev-els that were stable along differentiation (day 1–5–15,
Additional file 4: Figure S3). Conversely, expression of macroH2A1.1 and macroH2A1.2 transgenes led to markedly decreased levels of endogenous macroH2A1.2 at all time points of the differentiation protocol, com-pared to GFP-expressing control cells (Additional file 4: Figure S3). Of note, in GFP-expressing control cells macroH2A1.2 endogenous levels decreased during the differentiation of pre-adipocytes into adypocytes (day 5 and day 15 compared to day 1, Additional file 4: Figure S3), which is consistent to the low levels of macroH2A1.2 in adult human and mouse VAT (Fig. 1). At the end point of the protocol, mature 3T3-L1 adipocytes were ana-lyzed for lipid content using Oil Red O (ORO) staining: We found that, compared to GFP-overexpressing cells, macroH2A1.2-GFP-overexpressing cells displayed a ~2.5-fold decrease in lipid content, while macroH2A1.1-overexpressing cells accumulated ~1.7-fold more lipids (Fig. 7b). MacroH2A1.2-dependent mRNA upregulation of RETN, E2F1 and EGR2, together with downregulation
a
b
Day 0 Day 2 Day 51yaD5yaD4Day 1 Day 3
Confluent 3T3-L1
0.25µM Dexamethasone 0.5 mM IBMX 1µg/ml Insulin 1µg/ml Insulin Adipocytes
GFP
macroH2A1.2-GFP
GFP DAPI Oil Red O
macroH2A1.1-GFP
0102030405060708090
***
***
% o
f ORO
-sta
ined
cells
of
GFP
/DAP
I-pos
i�ve
cells
Fig. 7 a Schematic protocol for 3T3-L1 differentiation from pre-adipocytes into mature adipocytes [28]. b Left panels 3T3-L1 pre-adipocytes with lentiviral-mediates stable expression of GFP, macroH2A1.1-GFP and macroH2A1.2-GFP were induced to differentiate into mature adipocytes as in (a). At the 15th day of differentiation, cells grown on coverslips were stained with Oil Red O (ORO) solution and counterstained with DAPI for nuclei. ORO was visualized with fluorescence microscopy. Right panel the percentage of ORO-stained cells was quantified over the total of GFP/DAPI-posi-tive cells, averaging 10 different random fields in 3 separate experiments. Results are represented as mean ± S.E.M. ***p < 0.001 change versus GFP
Page 10 of 19Pazienza et al. Epigenetics & Chromatin (2016) 9:45
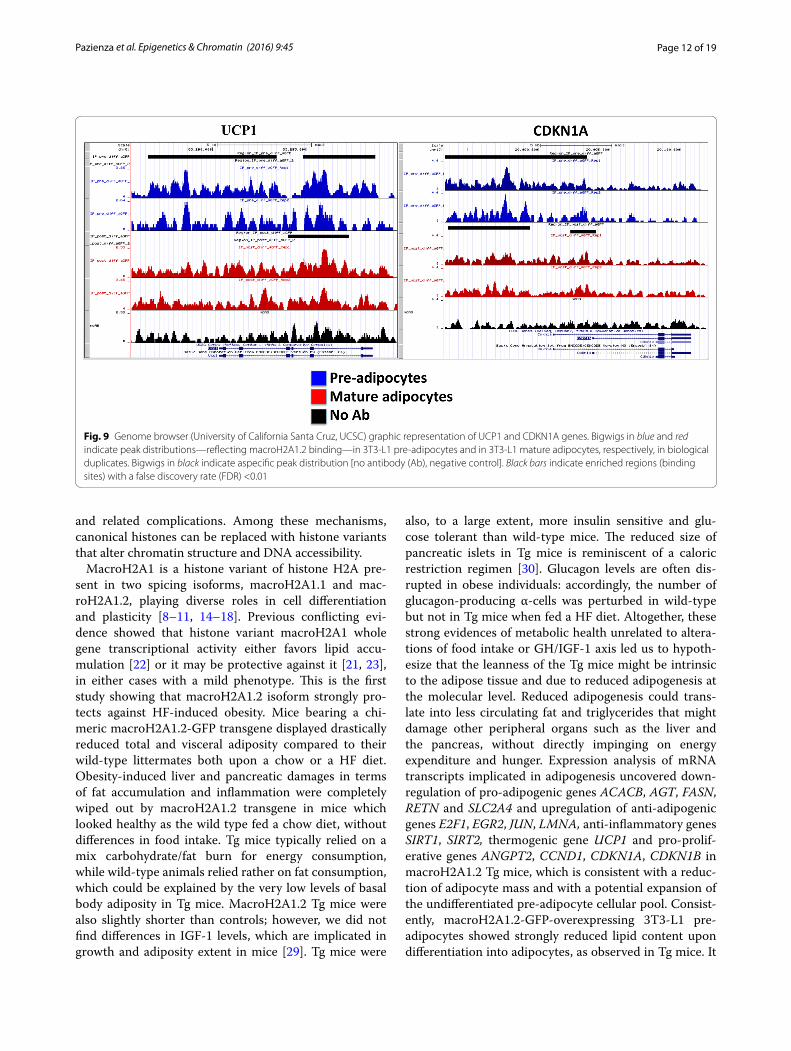
of FASN, was observed in 3T3-L1 adipocytes, mirror-ing the in vivo data (Additional file 5: Figure S4). In vitro and in vivo data collectively suggest that macroH2A1.2 might impair adipocyte differentiation while, in the 3T3-L1 model, overexpression of macroH2A1.1 leads to aug-mented lipid accumulation. Interestingly, macroH2A1.1 has been consistently reported to be highly expressed and have an anti-proliferative action, while macroH2A1.2 was expressed at low levels, in differentiated cells [14]. Consistently, confocal immunofluorescence analysis of adult heart tissue, which is slowly or not proliferating and possesses scarce regenerative capacity, in WT mice fed a chow diet revealed predominant expression of mac-roH2A1.1 and not of macroH2A1.2 (Additional file 6: Figure S5). In contrast, under the same conditions the adult mouse liver, which is a regenerative organ mainly due to the high proliferation rate of hepatocytes, both macroH2A1.1 and macroH2A1.2 are expressed (Addi-tional file 6: Figure S5).
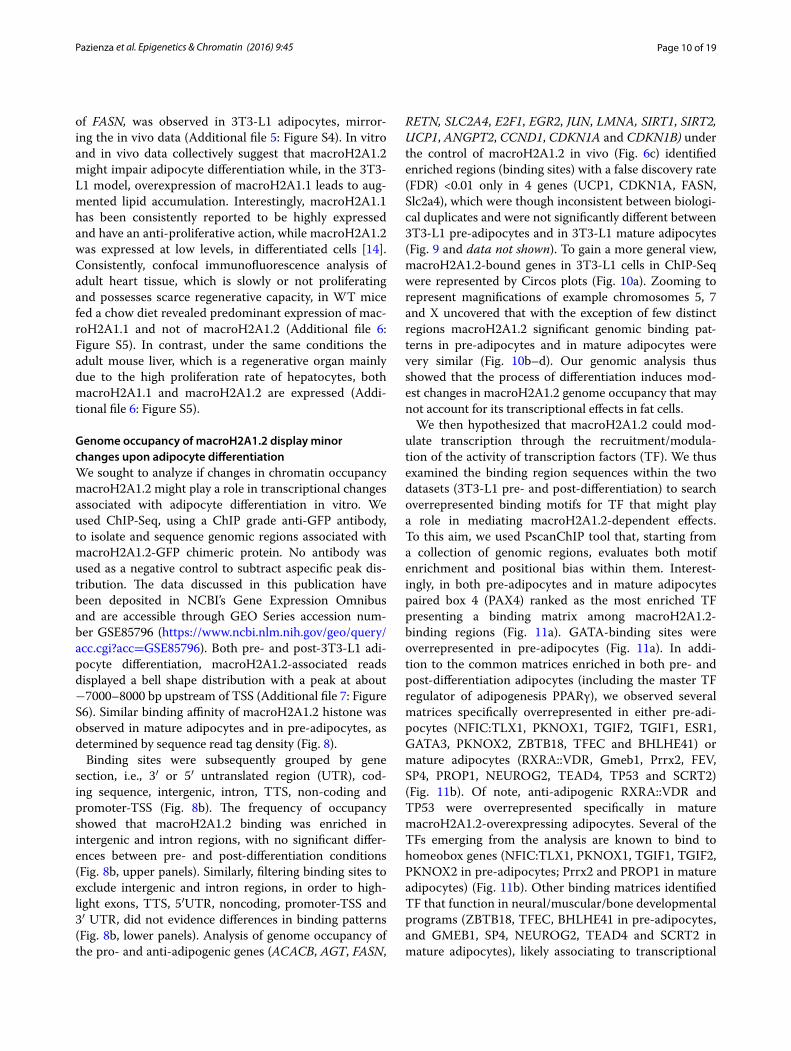
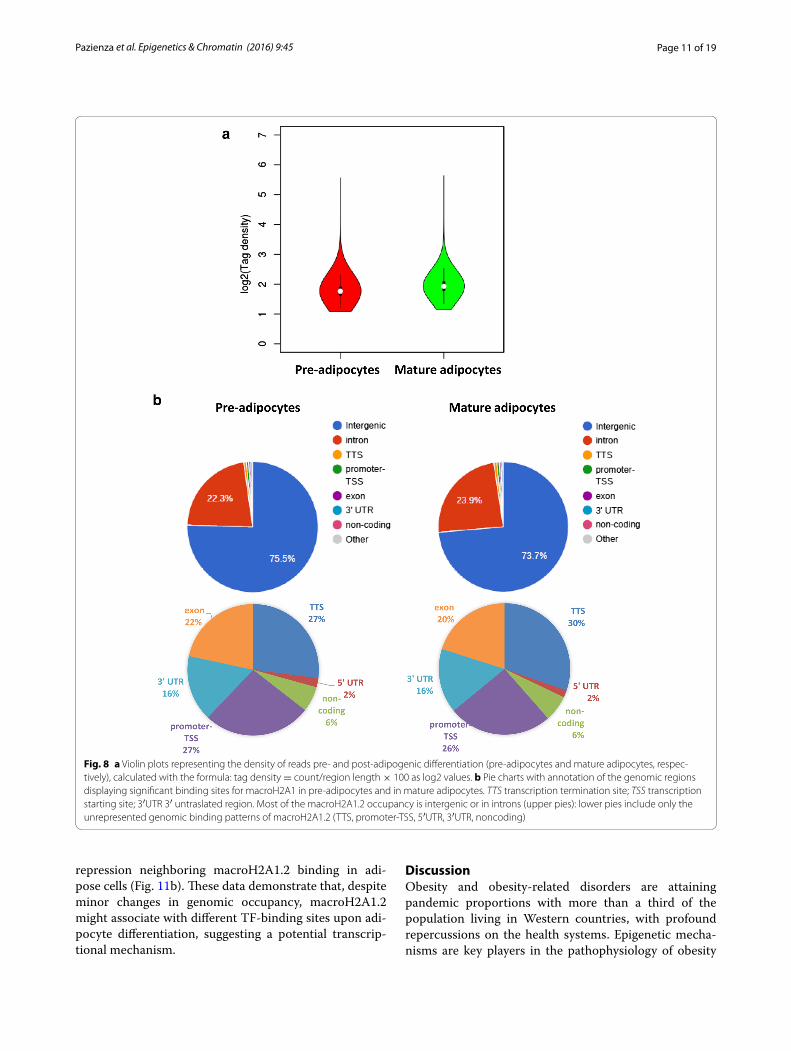
Genome occupancy of macroH2A1.2 display minor changes upon adipocyte differentiationWe sought to analyze if changes in chromatin occupancy macroH2A1.2 might play a role in transcriptional changes associated with adipocyte differentiation in vitro. We used ChIP-Seq, using a ChIP grade anti-GFP antibody, to isolate and sequence genomic regions associated with macroH2A1.2-GFP chimeric protein. No antibody was used as a negative control to subtract aspecific peak dis-tribution. The data discussed in this publication have been deposited in NCBI’s Gene Expression Omnibus and are accessible through GEO Series accession num-ber GSE85796 (https://www.ncbi.nlm.nih.gov/geo/query/acc.cgi?acc=GSE85796). Both pre- and post-3T3-L1 adi-pocyte differentiation, macroH2A1.2-associated reads displayed a bell shape distribution with a peak at about −7000–8000 bp upstream of TSS (Additional file 7: Figure S6). Similar binding affinity of macroH2A1.2 histone was observed in mature adipocytes and in pre-adipocytes, as determined by sequence read tag density (Fig. 8).
Binding sites were subsequently grouped by gene section, i.e., 3′ or 5′ untranslated region (UTR), cod-ing sequence, intergenic, intron, TTS, non-coding and promoter-TSS (Fig. 8b). The frequency of occupancy showed that macroH2A1.2 binding was enriched in intergenic and intron regions, with no significant differ-ences between pre- and post-differentiation conditions (Fig. 8b, upper panels). Similarly, filtering binding sites to exclude intergenic and intron regions, in order to high-light exons, TTS, 5′UTR, noncoding, promoter-TSS and 3′ UTR, did not evidence differences in binding patterns (Fig. 8b, lower panels). Analysis of genome occupancy of the pro- and anti-adipogenic genes (ACACB, AGT, FASN,
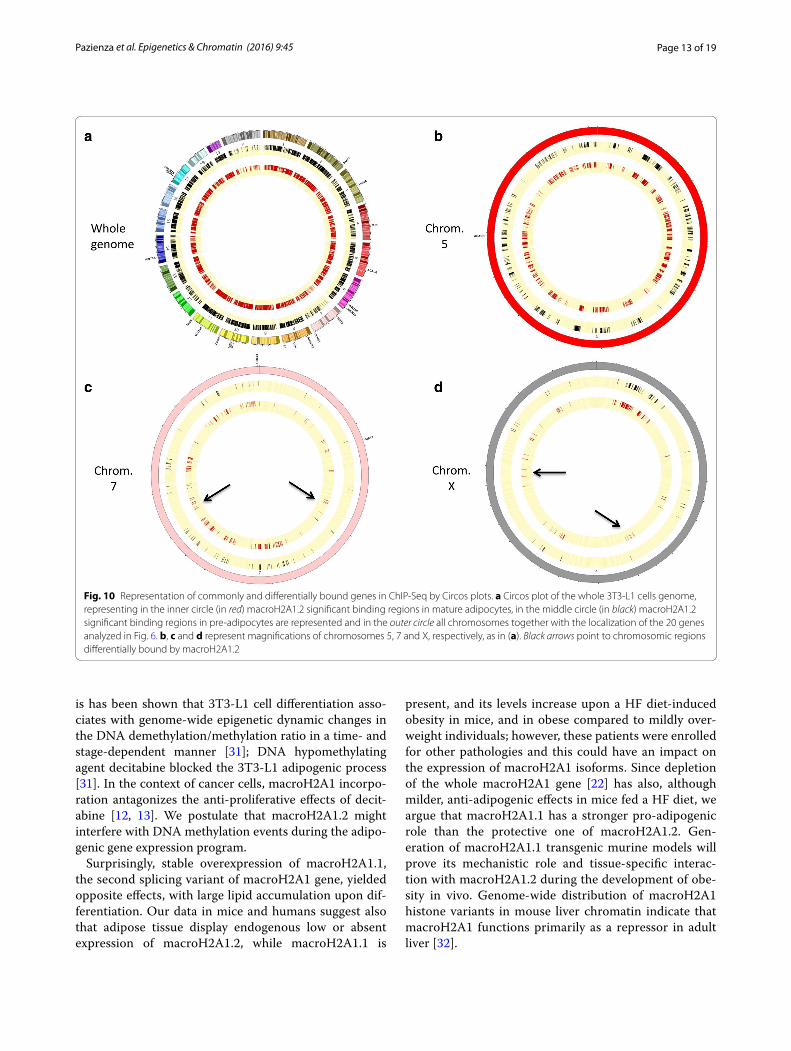
RETN, SLC2A4, E2F1, EGR2, JUN, LMNA, SIRT1, SIRT2, UCP1, ANGPT2, CCND1, CDKN1A and CDKN1B) under the control of macroH2A1.2 in vivo (Fig. 6c) identified enriched regions (binding sites) with a false discovery rate (FDR) <0.01 only in 4 genes (UCP1, CDKN1A, FASN, Slc2a4), which were though inconsistent between biologi-cal duplicates and were not significantly different between 3T3-L1 pre-adipocytes and in 3T3-L1 mature adipocytes (Fig. 9 and data not shown). To gain a more general view, macroH2A1.2-bound genes in 3T3-L1 cells in ChIP-Seq were represented by Circos plots (Fig. 10a). Zooming to represent magnifications of example chromosomes 5, 7 and X uncovered that with the exception of few distinct regions macroH2A1.2 significant genomic binding pat-terns in pre-adipocytes and in mature adipocytes were very similar (Fig. 10b–d). Our genomic analysis thus showed that the process of differentiation induces mod-est changes in macroH2A1.2 genome occupancy that may not account for its transcriptional effects in fat cells.
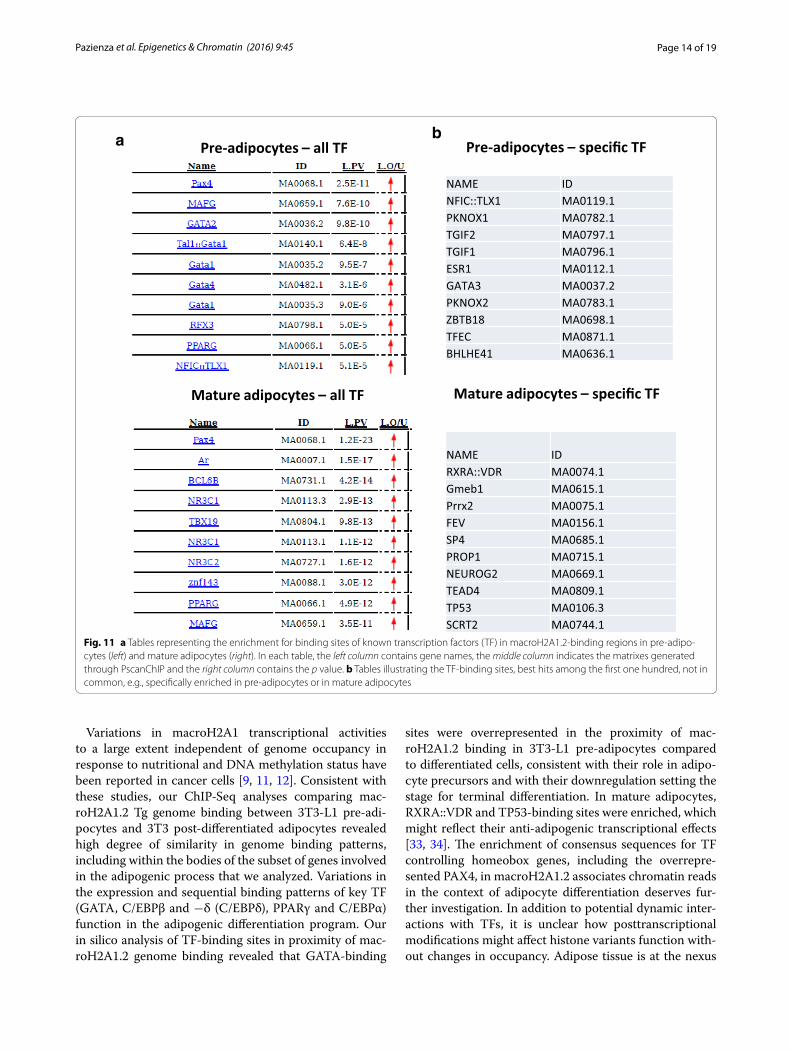
We then hypothesized that macroH2A1.2 could mod-ulate transcription through the recruitment/modula-tion of the activity of transcription factors (TF). We thus examined the binding region sequences within the two datasets (3T3-L1 pre- and post-differentiation) to search overrepresented binding motifs for TF that might play a role in mediating macroH2A1.2-dependent effects. To this aim, we used PscanChIP tool that, starting from a collection of genomic regions, evaluates both motif enrichment and positional bias within them. Interest-ingly, in both pre-adipocytes and in mature adipocytes paired box 4 (PAX4) ranked as the most enriched TF presenting a binding matrix among macroH2A1.2-binding regions (Fig. 11a). GATA-binding sites were overrepresented in pre-adipocytes (Fig. 11a). In addi-tion to the common matrices enriched in both pre- and post-differentiation adipocytes (including the master TF regulator of adipogenesis PPARγ), we observed several matrices specifically overrepresented in either pre-adi-pocytes (NFIC:TLX1, PKNOX1, TGIF2, TGIF1, ESR1, GATA3, PKNOX2, ZBTB18, TFEC and BHLHE41) or mature adipocytes (RXRA::VDR, Gmeb1, Prrx2, FEV, SP4, PROP1, NEUROG2, TEAD4, TP53 and SCRT2) (Fig. 11b). Of note, anti-adipogenic RXRA::VDR and TP53 were overrepresented specifically in mature macroH2A1.2-overexpressing adipocytes. Several of the TFs emerging from the analysis are known to bind to homeobox genes (NFIC:TLX1, PKNOX1, TGIF1, TGIF2, PKNOX2 in pre-adipocytes; Prrx2 and PROP1 in mature adipocytes) (Fig. 11b). Other binding matrices identified TF that function in neural/muscular/bone developmental programs (ZBTB18, TFEC, BHLHE41 in pre-adipocytes, and GMEB1, SP4, NEUROG2, TEAD4 and SCRT2 in mature adipocytes), likely associating to transcriptional
Page 11 of 19Pazienza et al. Epigenetics & Chromatin (2016) 9:45
repression neighboring macroH2A1.2 binding in adi-pose cells (Fig. 11b). These data demonstrate that, despite minor changes in genomic occupancy, macroH2A1.2 might associate with different TF-binding sites upon adi-pocyte differentiation, suggesting a potential transcrip-tional mechanism.
DiscussionObesity and obesity-related disorders are attaining pandemic proportions with more than a third of the population living in Western countries, with profound repercussions on the health systems. Epigenetic mecha-nisms are key players in the pathophysiology of obesity
Fig. 8 a Violin plots representing the density of reads pre- and post-adipogenic differentiation (pre-adipocytes and mature adipocytes, respec-tively), calculated with the formula: tag density = count/region length × 100 as log2 values. b Pie charts with annotation of the genomic regions displaying significant binding sites for macroH2A1 in pre-adipocytes and in mature adipocytes. TTS transcription termination site; TSS transcription starting site; 3′UTR 3′ untraslated region. Most of the macroH2A1.2 occupancy is intergenic or in introns (upper pies): lower pies include only the unrepresented genomic binding patterns of macroH2A1.2 (TTS, promoter-TSS, 5′UTR, 3′UTR, noncoding)
Page 12 of 19Pazienza et al. Epigenetics & Chromatin (2016) 9:45
and related complications. Among these mechanisms, canonical histones can be replaced with histone variants that alter chromatin structure and DNA accessibility.
MacroH2A1 is a histone variant of histone H2A pre-sent in two spicing isoforms, macroH2A1.1 and mac-roH2A1.2, playing diverse roles in cell differentiation and plasticity [8–11, 14–18]. Previous conflicting evi-dence showed that histone variant macroH2A1 whole gene transcriptional activity either favors lipid accu-mulation [22] or it may be protective against it [21, 23], in either cases with a mild phenotype. This is the first study showing that macroH2A1.2 isoform strongly pro-tects against HF-induced obesity. Mice bearing a chi-meric macroH2A1.2-GFP transgene displayed drastically reduced total and visceral adiposity compared to their wild-type littermates both upon a chow or a HF diet. Obesity-induced liver and pancreatic damages in terms of fat accumulation and inflammation were completely wiped out by macroH2A1.2 transgene in mice which looked healthy as the wild type fed a chow diet, without differences in food intake. Tg mice typically relied on a mix carbohydrate/fat burn for energy consumption, while wild-type animals relied rather on fat consumption, which could be explained by the very low levels of basal body adiposity in Tg mice. MacroH2A1.2 Tg mice were also slightly shorter than controls; however, we did not find differences in IGF-1 levels, which are implicated in growth and adiposity extent in mice [29]. Tg mice were
also, to a large extent, more insulin sensitive and glu-cose tolerant than wild-type mice. The reduced size of pancreatic islets in Tg mice is reminiscent of a caloric restriction regimen [30]. Glucagon levels are often dis-rupted in obese individuals: accordingly, the number of glucagon-producing α-cells was perturbed in wild-type but not in Tg mice when fed a HF diet. Altogether, these strong evidences of metabolic health unrelated to altera-tions of food intake or GH/IGF-1 axis led us to hypoth-esize that the leanness of the Tg mice might be intrinsic to the adipose tissue and due to reduced adipogenesis at the molecular level. Reduced adipogenesis could trans-late into less circulating fat and triglycerides that might damage other peripheral organs such as the liver and the pancreas, without directly impinging on energy expenditure and hunger. Expression analysis of mRNA transcripts implicated in adipogenesis uncovered down-regulation of pro-adipogenic genes ACACB, AGT, FASN, RETN and SLC2A4 and upregulation of anti-adipogenic genes E2F1, EGR2, JUN, LMNA, anti-inflammatory genes SIRT1, SIRT2, thermogenic gene UCP1 and pro-prolif-erative genes ANGPT2, CCND1, CDKN1A, CDKN1B in macroH2A1.2 Tg mice, which is consistent with a reduc-tion of adipocyte mass and with a potential expansion of the undifferentiated pre-adipocyte cellular pool. Consist-ently, macroH2A1.2-GFP-overexpressing 3T3-L1 pre-adipocytes showed strongly reduced lipid content upon differentiation into adipocytes, as observed in Tg mice. It
Fig. 9 Genome browser (University of California Santa Cruz, UCSC) graphic representation of UCP1 and CDKN1A genes. Bigwigs in blue and red indicate peak distributions—reflecting macroH2A1.2 binding—in 3T3-L1 pre-adipocytes and in 3T3-L1 mature adipocytes, respectively, in biological duplicates. Bigwigs in black indicate aspecific peak distribution [no antibody (Ab), negative control]. Black bars indicate enriched regions (binding sites) with a false discovery rate (FDR) <0.01
Page 13 of 19Pazienza et al. Epigenetics & Chromatin (2016) 9:45
is has been shown that 3T3-L1 cell differentiation asso-ciates with genome-wide epigenetic dynamic changes in the DNA demethylation/methylation ratio in a time- and stage-dependent manner [31]; DNA hypomethylating agent decitabine blocked the 3T3-L1 adipogenic process [31]. In the context of cancer cells, macroH2A1 incorpo-ration antagonizes the anti-proliferative effects of decit-abine [12, 13]. We postulate that macroH2A1.2 might interfere with DNA methylation events during the adipo-genic gene expression program.
Surprisingly, stable overexpression of macroH2A1.1, the second splicing variant of macroH2A1 gene, yielded opposite effects, with large lipid accumulation upon dif-ferentiation. Our data in mice and humans suggest also that adipose tissue display endogenous low or absent expression of macroH2A1.2, while macroH2A1.1 is
present, and its levels increase upon a HF diet-induced obesity in mice, and in obese compared to mildly over-weight individuals; however, these patients were enrolled for other pathologies and this could have an impact on the expression of macroH2A1 isoforms. Since depletion of the whole macroH2A1 gene [22] has also, although milder, anti-adipogenic effects in mice fed a HF diet, we argue that macroH2A1.1 has a stronger pro-adipogenic role than the protective one of macroH2A1.2. Gen-eration of macroH2A1.1 transgenic murine models will prove its mechanistic role and tissue-specific interac-tion with macroH2A1.2 during the development of obe-sity in vivo. Genome-wide distribution of macroH2A1 histone variants in mouse liver chromatin indicate that macroH2A1 functions primarily as a repressor in adult liver [32].
Fig. 10 Representation of commonly and differentially bound genes in ChIP-Seq by Circos plots. a Circos plot of the whole 3T3-L1 cells genome, representing in the inner circle (in red) macroH2A1.2 significant binding regions in mature adipocytes, in the middle circle (in black) macroH2A1.2 significant binding regions in pre-adipocytes are represented and in the outer circle all chromosomes together with the localization of the 20 genes analyzed in Fig. 6. b, c and d represent magnifications of chromosomes 5, 7 and X, respectively, as in (a). Black arrows point to chromosomic regions differentially bound by macroH2A1.2
Page 14 of 19Pazienza et al. Epigenetics & Chromatin (2016) 9:45
Variations in macroH2A1 transcriptional activities to a large extent independent of genome occupancy in response to nutritional and DNA methylation status have been reported in cancer cells [9, 11, 12]. Consistent with these studies, our ChIP-Seq analyses comparing mac-roH2A1.2 Tg genome binding between 3T3-L1 pre-adi-pocytes and 3T3 post-differentiated adipocytes revealed high degree of similarity in genome binding patterns, including within the bodies of the subset of genes involved in the adipogenic process that we analyzed. Variations in the expression and sequential binding patterns of key TF (GATA, C/EBPβ and −δ (C/EBPδ), PPARγ and C/EBPα) function in the adipogenic differentiation program. Our in silico analysis of TF-binding sites in proximity of mac-roH2A1.2 genome binding revealed that GATA-binding
sites were overrepresented in the proximity of mac-roH2A1.2 binding in 3T3-L1 pre-adipocytes compared to differentiated cells, consistent with their role in adipo-cyte precursors and with their downregulation setting the stage for terminal differentiation. In mature adipocytes, RXRA::VDR and TP53-binding sites were enriched, which might reflect their anti-adipogenic transcriptional effects [33, 34]. The enrichment of consensus sequences for TF controlling homeobox genes, including the overrepre-sented PAX4, in macroH2A1.2 associates chromatin reads in the context of adipocyte differentiation deserves fur-ther investigation. In addition to potential dynamic inter-actions with TFs, it is unclear how posttranscriptional modifications might affect histone variants function with-out changes in occupancy. Adipose tissue is at the nexus
ba
NAME ID NFIC::TLX1 MA0119.1 PKNOX1 MA0782.1 TGIF2 MA0797.1 TGIF1 MA0796.1 ESR1 MA0112.1 GATA3 MA0037.2 PKNOX2 MA0783.1 ZBTB18 MA0698.1 TFEC MA0871.1 BHLHE41 MA0636.1
NAME ID RXRA::VDR MA0074.1 Gmeb1 MA0615.1 Prrx2 MA0075.1 FEV MA0156.1 SP4 MA0685.1 PROP1 MA0715.1 NEUROG2 MA0669.1 TEAD4 MA0809.1 TP53 MA0106.3 SCRT2 MA0744.1
Pre-adipocytes – all TF
Mature adipocytes – all TF
Pre-adipocytes – specific TF
Mature adipocytes – specific TF
Fig. 11 a Tables representing the enrichment for binding sites of known transcription factors (TF) in macroH2A1.2-binding regions in pre-adipo-cytes (left) and mature adipocytes (right). In each table, the left column contains gene names, the middle column indicates the matrixes generated through PscanChIP and the right column contains the p value. b Tables illustrating the TF-binding sites, best hits among the first one hundred, not in common, e.g., specifically enriched in pre-adipocytes or in mature adipocytes
Page 15 of 19Pazienza et al. Epigenetics & Chromatin (2016) 9:45
of processes involved in health span and metabolic dys-function: Progression of age-related fat tissue dysfunction follows different trajectories across different fat depots, with fat becoming redistributed from subcutaneous to intraperitoneal depots and ultimately ectopic sites. This is associated with metabolic disturbances. The pre-adipo-cytes from which new fat cells develop switch into a pro-inflammatory, tissue-remodeling state in old age, instead of differentiating into fat cells [35]. In cellular senescence, proliferation becomes arrested and cells acquire a pro-inflammatory senescent secretory phenotype (SASP), with release of chemokines and cytokines [35]. We and others have shown that macroH2A1.1 ectopic expression sustains SASP in fibroblasts and hepatoma cells [12, 36]; a similar signaling loop might take place in the adipose tis-sue. How to boost macroH2A1.2 expression/activity, to the detriment of macroH2A1.1, with an anti-obesity ther-apeutic purpose? Some of the switch factors controlling macroH2A1 splicing into macroH2A1.1 or macroH2A1.2 isoforms have been identified in cancer cells: QKI and RNA helicases Ddx17/Ddx5 [37, 38]. Epigenetic splicing regulatory strategies are already being explored for can-cer therapy and might hold also a potential against obesity and its related complications.
ConclusionsHistone variant macroH2A1.2 is an unprecedented chro-matin component that, if overexpressed, inhibits pro-adipogenic transcriptional programs, fat deposition and massively protects mice from high fat diet-induced obe-sity. Given that this histone is not expressed in human differentiated adipose tissue, it is possible to envisage that strategies aiming at its reintroduction in fat tissues could pave the way for new anti-obesity therapies.
MethodsHuman biopsiesSeven patients with BMI from 25 to 40 were enrolled (Additional file 1: Supplementary Table I, Supplemen-tary Material). Patient underwent surgical procedures (Whipple’s, right hepatectomy, wedge resections of the liver) according to conditions including pancreatic ade-nocarcinoma and colorectal liver metastases. Informed consent was obtained from each patient. Procedures to extract adipose tissue biopsies were performed through incision that depended on the type of operation, trans-verse abdominal for pancreas, midline or inverted L shape for liver. The incision of the skin was performed with the blade knife until the subcutaneous tissue was visualized. Around the umbilicus, a small part of the subcutaneous fat (0.5 cm3) was resected with the scissors. Specimens were frozen at −80 °C before fur-ther characterization by immunoblotting. The study
was approved by the UCL Royal Free Biobank Ethi-cal Review Committee (NRES Rec Reference: 11/WA/0077). Tissues were processed in accordance with the UCL Royal Free Biobank protocols under the Research Tissue Bank Human Tissue Act licence, prior to use in research [39].
AnimalsThe MacroH2A1.2–EGFP transgenic mouse line estab-lished by Soma et al. [26] was backcrossed to C57BL/6 J for 5–6 generations. Tg mice positive for the transgene were identified by PCR amplification from tail tissue genomic DNA, using the primers 5′-TGACAGAAA-GCTGAAATCCATCGC-3′ and 5′-TCCAGCAGGAC-CATGTGATCGC-3′, and by observing whole-body EGFP fluorescence using a UVL-56 handheld UV lamp (UVP, Cambridge, UK or Upland, CA, USA). All experi-ments were approved by Tottori University Ethical Com-mittee, were performed using heterozygous transgenic mice and were carried out according to the Guide for the Care and Use of Laboratory Animals of Tottori Univer-sity. Six-week old wild-type (WT) and transgenic (Tg) mice were assigned into 4 groups (8–9 mice/group): WT fed with chow diet, Tg fed with chow diet, WT fed with high fat (HF) diet and Tg fed with HF diet for 12 weeks. Obesogenic diet consist 60% energy from lard [22].
EchoMRI quantitative magnetic resonance and CT scanEchoMRI™ quantitative magnetic resonance (QMR) technology was used to measure the body composition of live mice in terms of whole-body fat, and lean masses, according to manufacturer’s instructions: Measurements were made by placing live free moving mice into a thin wall plastic cylinder (4.7 cm, inside diameter; 0.15 cm thick) with freedom to turn about but limited to ~4 cm vertical movements by a plastic insert. After 2 min, when the measurement was completed, conscious mice returned to their home cage. Alternatively, CT scan-ning was performed in isofluorane-anesthetized ani-mals at 2-mm intervals from head to tail to determine body length, or from the diaphragm to the bottom of the abdominal cavity to determine visceral fat and liver fat content, using a LaTheta™ LCT 200 in vivo micro-CT scanner, according to manufacturer’s instructions (Hitachi, Aloka Medical, Japan).
Metabolic cages, glucose tolerance test (GTT) and insulin tolerance test (ITT)In order to monitor in real time the metabolic gas exchange, groups of 8–9 mice per genotype on HFD were placed in indirect calorimetric cages where energy expenditure, food intake and activity were evaluated [22]: The whole-body energy metabolism in mice was
Page 16 of 19Pazienza et al. Epigenetics & Chromatin (2016) 9:45
calculated in vivo as previously described [22]. GTT and ITT were performed as previously described [40].
Histology and immunofluorescenceHistological analyses and immunofluorescence staining are described in detail in the Additional file 1: Supple-mentary Materials and methods.
Quantification of circulating cytokinesInsulin, leptin and IGF-1 levels were assessed in the sera of wild-type and macroH2A1.2 Tg animals, using a cus-tomized mouse MILLIPLEX® MAP (multi-analyte pan-els) Luminex system (Merck Millipore) [22], according to the manufacturer’s instructions.
Gene expressionA commercially available adipogenesis array (mouse RT-Profiler array, Qiagen, Italy) was used to measure genes involved in adipogenesis by qRT‐PCR in mice visceral adipose tissue; expression data were normalized to the geometric mean of three house keeping genes (Actb, GAPDH and GusB). Briefly, after homogenization, tis-sue RNAs were isolated using Trizol (1 ml per 100 mg), according to manufacturer’s protocol. RNA samples were purified using mini spin columns (Qiagen), quan-tified using Nanodrop Spectrophotometer (Thermo scientific, UK). As for 3T3-L1 cell differentiation experi-ments, the following QuantiTect primers (Qiagen) were used: FASN (QT00149240), RETN (QT00093450), EGR2 (QT00160125) and E2F1 (QT01079106). qRT-PCR for determining gene expression in 3T3-L1 cells was per-formed on 50 ng of purified RNA using the one-step QuantiFast SYBR Green RT-PCR kit (Qiagen) and the Mouse SYBR Green QuantiTect primer assay. All reac-tions were set up in 96-well plates using a 7700HT Real-Time PCR System (Applied Biosystems, Foster City, CA).
Western blotTotal and cytoplasmic/nuclear/histone proteins extrac-tion and immunoblotting analyses were performed as previously described [12]. Primary antibodies were as follows: anti-GFP (Abcam, ab13970) anti-macroH2A1.1 (Cell Signaling, Cat 12455), anti-macroH2A1.2 (Cell Signaling, Cat. 4827), anti-AKT (Cell Signaling, Cat. 9272), anti-phosphoAKT-Ser473 (Cell Signaling, Cat. 9271), anti-β-actin (Cell Signaling, Cat. 4967) and anti-H3 (Cell Signaling, Cat. 9715).
Generation of stable clones of 3T3‑L1 cells: differentiation and lipid stainingStable expression of macroH2A1.2 variant in 3T3-L1 pre-adipocytes was achieved by lentiviral transduction
as previously described [12]. Stable 3T3-L1 pre-adipo-cytes were cultured to differentiate into mature adipo-cytes according to an established 15-day protocol [28]. 3T3-L1 cells at the 15th day of differentiation seeded on coverslips were washed with PBS and fixed with 4% paraformaldehyde for 10 min at room temperature. After fixation and further washings with PBS, cells were stained with an Oil Red O solution in 40% isopro-panol. Coverslips were then mounted on microscope slides with Vectashield mounting medium with DAPI, and images were collected using a Nikon Eclipse E600 microscope.
Chromatin immunoprecipitation, sequencing and data analysisChromatin immunoprecipitation was performed in mice adipose tissue with a modified protocol as described previously [12, 41], using an anti-GFP anti-body (ab290, Abcam). 10 ng of purified ChIP DNA was used as starting material for sequencing librar-ies preparation. Indexed libraries were prepared with TruSeq ChIP Sample Prep Kit (Illumina Inc.). Size dis-tribution of each ChIP library sample was assessed by running a 1 µl aliquot on Agilent High Sensitivity DNA chip using an Agilent Technologies 2100 Bioanalyzer (Agilent Technologies). The concentration of each sam-ple was determined by using a Qubit Fluorometer (Life Technologies). Libraries were sequenced (single read, 1 × 50 cycles) at a concentration of 10 pM/lane on HiSeq 2500 (Illumina Inc.). The raw sequence files gen-erated (fastq) underwent quality control analysis using FASTQC (http://www.bioinformatics.babraham.ac.uk/projects/fastqc/). Reads were aligned to the mus mus-culus genome (assembly mm10) using Bowtie software, allowing up to 2 mismatch and considering uniquely mappable reads. Duplicate sequences were removed before peaks enrichment calculation using MarkDupli-cates (Picard Tools; https://broadinstitute.github.io/pic-ard/). Violin plots representing the density of reads were generated with the vioplot package [42]. The enriched ChIP-Seq regions were identified using Spatial Cluster-ing for Identification of ChIP-Enriched Regions (SICER) [43] setting standard parameters and a false discovery rate of 1%. For each analyzed condition, only regions in common between the two biological replicates were considered for further analysis. The annotation of peaks to the nearest gene was performed using the annotate-Peaks.pl function from HOMER [44]. Overrepresented transcription factor binding sites analysis was per-formed using PscanChip [45], while annotation plots were generated using ChIPseek [46]. Circos plot was generated with Circos [47].
Page 17 of 19Pazienza et al. Epigenetics & Chromatin (2016) 9:45
Statistical testsResults are expressed as mean ± S.E.M. Comparisons between groups were performed with the parametric Student’s t test or the nonparametric Mann–Whitney U test, as appropriate, using GraphPad Prism software (version 5.00 for Windows, San Diego, CA, USA): A P value ≤0.05 was considered significant.
AbbreviationsBMI: body mass index; ChIP: chromatin immunoprecipitation; CT: computer tomography; EchoMRI: quantitative echography and magnetic resonance imaging; GTT: glucose tolerance test; ITT: insulin tolerance test; KO: knock out; ORO: Oil Red O; NAFLD: non-alcoholic fatty liver disease; NAFPD: non-alcoholic fatty pancreas disease; Tg: transgenic.
Authors’ contributionsVP, TN and MV conceived the study; VP and MV analyzed the data and wrote the manuscript; CP and MB performed cell culture experiments; VP, AO, KH, TN and MV performed animal experiments; MB, MV, SC, CP, DM, and RT performed ChIP-Seq experiments and analyses; MB performed qRT-PCR experiments
Additional files
Additional file 1.
Additional file 2. Figure S1. Representative images of wild-type and macroH2A1.2 transgenic (Tg) mice adipose tissue (VAT) sections immunostained for macroH2A1.2 (red). Nuclei were counterstained with Hoechst (blue), while perilipin was immunostained to define adipose cell membranes (green). macroH2A1.2 expression was detected only in the VAT of Tg animals but not in wild-type animals (white arrows).
Additional file 3. Figure S2. Increased glucose clearance because of enhanced insulin sensitivity in the muscle, liver and adipose tissue. Mice fed a chow diet were injected with insulin (INS, 0.75 U kg − 1) 15 min before being killed, after which phosphorylation status of AKT (Ser473) was determined by western blot. Representative immunoblots are shown in the skeletal muscle, liver and adipose tissue. Immunoblots were quanti-fied by densitometry and normalized against total protein levels of AKT. *P < 0.05, ***P < 0.001 change WT + INS vs WT; ###P < 0.001 change Tg + INS vs Tg; $P < 0.05 Tg + INS vs WT + INS.
Additional file 4. Figure S3. MacroH2A1.1 and macroH2A1.2 expres-sion in 3T3-L1 pre-adipocytes and adipocytes. 3T3-L1 pre-adipocytes with lentiviral-mediates stable expression of GFP, macroH2A1.1-GFP and macroH2A1.2-GFP were induced to differentiate into mature adipocytes as in Fig. 6. At the 1st, 5th and 15th day of differentiation, histones were extracted and processed for immunoblotting with anti-macroH2A1.1, macroH2A1.2 and anti-H3-specific antibodies. Representative blots are shown, together with MW ladder.
Additional file 5. Figure S4. Gene expression in 3T3-L1 adipocytes. 3T3-L1 pre-adipocytes with lentiviral-mediates stable expression of GFP, macroH2A1.1-GFP and macroH2A1.2-GFP were induced to differentiate into mature adipocytes as in Fig. 6. At the 15th day of differentiation, RNA was extracted and processed for qPCR analyses with specific primers. Results were normalized to pre-differentiation gene levels. Values are rep-resented as means (N = 3) ± S.E.M. *P < 0.05; ***P < 0.0001 change vs GFP.
Additional file 6. Figure S5. Representative images of liver (left panels) and heart (right panels) sections immunostained for macroH2A1.1 or for macroH2A1.2 (green). Both isoforms appear to be highly expressed in hepatocytes, whereas there a strong reduction in expression pattern of macroH2A1.2 is observed in mouse heart tissue. Nuclei were counter-stained with DAPI.
Additional file 7. Figure S6. Histogram representing the distance and the frequency of macroH2A1.2-binding regions from transcriptional start-ing site (TSS), genome-wide.
and immunoblotting; GB, FR, RB and FC performed histological analyses and immunofluorescence experiments; FV and JV performed ELISA experiments; GM, DT and GF provided human specimens; VP, CP and MV performed the statistical analyses; VP, TN and MV critically revised the manuscript. All authors read and approved the final manuscript.
Author details1 Gastroenterology Unit, IRCCS “Casa Sollievo della Sofferenza” Hospital, 71013 San Giovanni Rotondo, Italy. 2 Department of Experimental Biomedi-cine and Clinical Neurosciences, Section of Human Anatomy, University of Palermo, 90127 Palermo, Italy. 3 Department of Legal, Society and Sport Sciences, University of Palermo, 90133 Palermo, Italy. 4 Euro-Mediterranean Institute of Science and Technology (IEMEST), 90146 Palermo, Italy. 5 Labora-tory of Molecular Medicine and Genomics, Department of Medicine, Surgery and Dentistry ‘Schola Medica Salernitana’, University of Salerno, 84081 Baro-nissi, SA, Italy. 6 Institute for Liver and Digestive Health, University College London (UCL), Royal Free Hospital, London NW3 2PF, UK. 7 Research Institute for Microbial Diseases, Osaka University, Suita, Osaka 5650871, Japan. 8 Centre for HPB Surgery and Liver Transplantation, Royal Free Hospital, London NW3 2QG, UK. 9 Mouse Biology Unit, European Molecular Biology Laboratory (EMBL), 00015 Monterotondo, Italy. 10 Departament de Bioquimica i Biologia Molecular, Institut de Biomedicina de la Universitat de Barcelona (IBUB), and CIBER Fisiopatologia de la Obesidad y Nutricion, University of Barcelona, Barcelona 08007, Spain. 11 Centro de Investigación Biomédica en Red Fisiopa-tología de la Obesidad y Nutrición (CIBEROBN) ISCIII, Madrid, Spain. 12 Faculty of Medicine, Tottori University, Yonago 683-8503, Japan. 13 The Institute of Medical Sciences, University of Tokyo, Tokyo 108-8639, Japan. 14 Center for Translational Medicine (CTM), International Clinical Research Center (ICRC), St. Anne’s University Hospital, Brno 656 91, Czech Republic.
AcknowledgementsWe thank Hiroshi Shigeta for assistance with CT scan imaging and Masaru Tanaka for help with animal experiments; Illar Pata and Pille Pata for generat-ing transgenic 3T3-L1 cell lines.
FundingM.V. is supported by a My First Associazione Italiana Ricerca sul Cancro (AIRC) Grant-AIRC Grant No. 13419, by University College London and by grants No. LQ1605 from the National Program of Sustainability II (MEYS CR) and FNUSA-ICRC No. CZ.1.05/1.1.00/02.0123 (OP VaVpI). P.V. and M.V. are supported by Italian Ministry of Health, Bando GR-2010-2311017. Research was also supported by the Ministry of Education, University and Research (MIUR grants RBFR12W5V5_003 and PON03PE_00146_1) and National Research Council (CNR, Flagship Project InterOmics) of Italy and Genomix4Life Srl. D.M. is a PhD student of the Research Doctorate “Molecular Medicine and Medical Biotech-nology,” University of Naples ‘Federico II’.
Competing interestsThe authors declare that they have no competing interests.
Received: 22 March 2016 Accepted: 17 October 2016
References 1. Podrini C, Borghesan M, Greco A, Pazienza V, Mazzoccoli G, Vinciguerra M.
Redox homeostasis and epigenetics in non-alcoholic fatty liver disease (NAFLD). Curr Pharm Des. 2013;19(15):2737–46.
2. Goni L, Milagro FI, Cuervo M, Martinez JA. Single-nucleotide polymor-phisms and DNA methylation markers associated with central obesity and regulation of body weight. Nutr Rev. 2014;72(11):673–90.
3. Martinez JA, Milagro FI, Claycombe KJ, Schalinske KL. Epigenet-ics in adipose tissue, obesity, weight loss, and diabetes. Adv Nutr. 2014;5(1):71–81.
4. Dick KJ, Nelson CP, Tsaprouni L, Sandling JK, Aissi D, Wahl S, Meduri E, Morange PE, Gagnon F, Grallert H, et al. DNA methylation and body-mass index: a genome-wide analysis. Lancet. 2014;383(9933):1990–8.
5. Henikoff S, Smith MM. Histone variants and epigenetics. Cold Spring Harb Perspect Biol. 2015;7(1):a019364.
Page 18 of 19Pazienza et al. Epigenetics & Chromatin (2016) 9:45
6. Skene PJ, Henikoff S. Histone variants in pluripotency and disease. Devel-opment. 2013;140(12):2513–24.
7. Talbert PB, Henikoff S. Histone variants–ancient wrap artists of the epig-enome. Nat Rev Mol Cell Biol. 2010;11(4):264–75.
8. Doyen CM, An W, Angelov D, Bondarenko V, Mietton F, Studitsky VM, Hamiche A, Roeder RG, Bouvet P, Dimitrov S. Mechanism of polymerase II transcription repression by the histone variant macroH2A. Mol Cell Biol. 2006;26(3):1156–64.
9. Borghesan M, Mazzoccoli G, Sheedfar F, Oben J, Pazienza V, Vin-ciguerra M. Histone variants and lipid metabolism. Biochem Soc Trans. 2014;42(5):1409–13.
10. Pazienza V, Borghesan M, Mazza T, Sheedfar F, Panebianco C, Williams R, Mazzoccoli G, Andriulli A, Nakanishi T, Vinciguerra M. SIRT1-metabolite binding histone macroH2A1.1 protects hepatocytes against lipid accu-mulation. Aging. 2014;6(1):35–47.
11. Gamble MJ, Frizzell KM, Yang C, Krishnakumar R, Kraus WL. The histone variant macroH2A1 marks repressed autosomal chromatin, but protects a subset of its target genes from silencing. Genes Dev. 2010;24(1):21–32.
12. Borghesan M, Fusilli C, Rappa F, Panebianco C, Rizzo G, Oben JA, Mazzoc-coli G, Faulkes C, Pata I, Agodi A, Rezaee F, Minogue S, Warren A, Peterson A, Sedivy JM, Douet J, Buschbeck M, Cappello F, Mazza T, Pazienza V, Vinciguerra M. DNA hypomethylation and histone variant macroH2A1 synergistically attenuate chemotherapy-induced senescence to promote hepatocellular carcinoma progression. Cancer Res. 2016;76(3):594–606.
13. Jueliger S, Lyons J, Cannito S, Pata I, Pata P, Shkolnaya M, Lo Re O, Peyrou M, Villarroya F, Pazienza V, Rappa F, Cappello F, Azab M, Taverna P, Vinciguerra M: Efficacy and epigenetic interactions of novel DNA hypomethylating agent guadecitabine (SGI-110) in preclinical models of hepatocellular carcinoma. Epigenetics Published online: 11 Aug 2016. doi: 10.1080/15592294.2016.1214781.
14. Creppe C, Janich P, Cantarino N, Noguera M, Valero V, Musulen E, Douet J, Posavec M, Martin-Caballero J, Sumoy L, et al. MacroH2A1 regulates the balance between self-renewal and differentiation commitment in embryonic and adult stem cells. Mol Cell Biol. 2012;32(8):1442–52.
15. Cantarino N, Douet J, Buschbeck M. MacroH2A–an epigenetic regulator of cancer. Cancer Lett. 2013;336(2):247–52.
16. Barrero MJ, Sese B, Kuebler B, Bilic J, Boue S, Marti M, Izpisua Belmonte JC. Macrohistone variants preserve cell identity by preventing the gain of H3K4me2 during reprogramming to pluripotency. Cell Rep. 2013;3(4):1005–11.
17. Gaspar-Maia A, Qadeer ZA, Hasson D, Ratnakumar K, Leu NA, Leroy G, Liu S, Costanzi C, Valle-Garcia D, Schaniel C, et al. MacroH2A histone variants act as a barrier upon reprogramming towards pluripotency. Nat Com-mun. 2013;4:1565.
18. Kustatscher G, Hothorn M, Pugieux C, Scheffzek K, Ladurner AG. Splicing regulates NAD metabolite binding to histone macroH2A. Nat Struct Mol Biol. 2005;12(7):624–5.
19. Sporn JC, Jung B. Differential regulation and predictive potential of Mac-roH2A1 isoforms in colon cancer. Am J Pathol. 2012;180(6):2516–26.
20. Sporn JC, Kustatscher G, Hothorn T, Collado M, Serrano M, Muley T, Sch-nabel P, Ladurner AG. Histone macroH2A isoforms predict the risk of lung cancer recurrence. Oncogene. 2009;28(38):3423–8.
21. Changolkar LN, Costanzi C, Leu NA, Chen D, McLaughlin KJ, Pehrson JR. Developmental changes in histone macroH2A1-mediated gene regula-tion. Mol Cell Biol. 2007;27(7):2758–64.
22. Sheedfar F, Vermeer M, Pazienza V, Villarroya J, Rappa F, Cappello F, Maz-zoccoli G, Villarroya F, van der Molen H, Hofker MH, et al. Genetic ablation of macrohistone H2A1 leads to increased leanness, glucose tolerance and energy expenditure in mice fed a high-fat diet. Int J Obes (Lond). 2015;39(2):331–8.
23. Boulard M, Storck S, Cong R, Pinto R, Delage H, Bouvet P. Histone variant macroH2A1 deletion in mice causes female-specific steatosis. Epigenetics Chromatin. 2010;3(1):8.
24. Lin X, Yue P, Chen Z, Schonfeld G. Hepatic triglyceride contents are genetically determined in mice: results of a strain survey. Am J Physiol Gastrointest Liver Physiol. 2005;288(6):G1179–89.
25. Rappa F, Greco A, Podrini C, Cappello F, Foti M, Bourgoin L, Peyrou M, Marino A, Scibetta N, Williams R, et al. Immunopositivity for histone mac-roH2A1 isoforms marks steatosis-associated hepatocellular carcinoma. PLoS ONE. 2013;8(1):e54458.
26. Soma A, Sato K, Nakanishi T. Visualization of inactive X chromosome in preimplantation embryos utilizing MacroH2A-EGFP transgenic mouse. Genesis. 2013;51(4):259–67.
27. Carter R, Mouralidarane A, Soeda J, Ray S, Pombo J, Saraswati R, Novelli M, Fusai G, Rappa F, Saracino C, et al. Non-alcoholic fatty pancreas disease pathogenesis: a role for developmental programming and altered circa-dian rhythms. PLoS ONE. 2014;9(3):e89505.
28. Arsenijevic T, Gregoire F, Delforge V, Delporte C, Perret J. Murine 3T3-L1 adipocyte cell differentiation model: validated reference genes for qPCR gene expression analysis. PLoS ONE. 2012;7(5):e37517.
29. Fontana L, Vinciguerra M, Longo VD. Growth factors, nutrient signaling, and cardiovascular aging. Circ Res. 2012;110(8):1139–50.
30. Gao X, Yan D, Zhao Y, Tao H, Zhou Y. Moderate calorie restriction to achieve normal weight reverses beta-cell dysfunction in diet-induced obese mice: involvement of autophagy. Nutr Metab (Lond). 2015;12:34.
31. Sakamoto H, Kogo Y, Ohgane J, Hattori N, Yagi S, Tanaka S, Shiota K. Sequential changes in genome-wide DNA methylation status during adipocyte differentiation. Biochem Biophys Res Commun. 2008;366(2):360–6.
32. Changolkar LN, Singh G, Cui K, Berletch JB, Zhao K, Disteche CM, Pehrson JR. Genome-wide distribution of macroH2A1 histone variants in mouse liver chromatin. Mol Cell Biol. 2010;30(23):5473–83.
33. Molchadsky A, Ezra O, Amendola PG, Krantz D, Kogan-Sakin I, Buganim Y, Rivlin N, Goldfinger N, Folgiero V, Falcioni R, et al. p53 is required for brown adipogenic differentiation and has a protective role against diet-induced obesity. Cell Death Differ. 2013;20(5):774–83.
34. Ji S, Doumit ME, Hill RA. Regulation of adipogenesis and key adipogenic gene expression by 1, 25-dihydroxyvitamin D in 3T3-L1 cells. PLoS ONE. 2015;10(6):e0126142.
35. Tchkonia T, Morbeck DE, Von Zglinicki T, Van Deursen J, Lustgarten J, Scrable H, Khosla S, Jensen MD, Kirkland JL. Fat tissue, aging, and cellular senescence. Aging Cell. 2010;9(5):667–84.
36. Chen H, Ruiz PD, McKimpson WM, Novikov L, Kitsis RN, Gamble MJ. Mac-roH2A1 and ATM play opposing roles in paracrine senescence and the senescence-associated secretory phenotype. Mol Cell. 2015;59(5):719–31.
37. Novikov L, Park JW, Chen H, Klerman H, Jalloh AS, Gamble MJ. QKI-mediated alternative splicing of the histone variant MacroH2A1 regulates cancer cell proliferation. Mol Cell Biol. 2011;31(20):4244–55.
38. Dardenne E, Pierredon S, Driouch K, Gratadou L, Lacroix-Triki M, Espinoza MP, Zonta E, Germann S, Mortada H, Villemin JP, et al. Splicing switch of an epigenetic regulator by RNA helicases promotes tumor-cell invasiveness. Nat Struct Mol Biol. 2012;19(11):1139–46.
39. Mazza G, Rombouts K, Rennie Hall A, Urbani L, Vinh Luong T, Al-Akkad W, Longato L, Brown D, Maghsoudlou P, Dhillon AP, et al. Decellularized human liver as a natural 3D-scaffold for liver bioengineering and trans-plantation. Sci Rep. 2015;5:13079.
40. Veyrat-Durebex C, Montet X, Vinciguerra M, Gjinovci A, Meda P, Foti M, Rohner-Jeanrenaud F. The Lou/C rat: a model of spontaneous food restriction associated with improved insulin sensitivity and decreased lipid storage in adipose tissue. Am J Physiol Endocrinol Metab. 2009;296(5):E1120–32.
41. Bolasco G, Calogero R, Carrara M, Banchaabouchi MA, Bilbao D, Mazzoc-coli G, Vinciguerra M. Cardioprotective mIGF-1/SIRT1 signaling induces hypertension, leukocytosis and fear response in mice. Aging (Albany NY). 2012;4(6):402–16.
42. Hintze JL, Nelson RD. Violin plots: a box plot-density trace synergism. Am Stat. 1998;52(2):181–4.
43. Xu S, Grullon S, Ge K, Peng W. Spatial clustering for identification of ChIP-enriched regions (SICER) to map regions of histone methylation patterns in embryonic stem cells. Methods Mol Biol. 2014;1150:97–111.
44. Heinz S, Benner C, Spann N, Bertolino E, Lin YC, Laslo P, Cheng JX, Murre C, Singh H, Glass CK. Simple combinations of lineage-determining transcrip-tion factors prime cis-regulatory elements required for macrophage and B cell identities. Mol Cell. 2010;38(4):576–89.
45. Zambelli F, Pesole G, Pavesi G: PscanChIP: finding over-represented tran-scription factor-binding site motifs and their correlations in sequences from ChIP-Seq experiments. Nucleic Acids Res 2013, 41(Web Server issue):W535–543.
46. Chen TW, Li HP, Lee CC, Gan RC, Huang PJ, Wu TH, Lee CY, Chang YF, Tang P. ChIPseek, a web-based analysis tool for ChIP data. BMC Genom. 2014;15:539.

Page 19 of 19Pazienza et al. Epigenetics & Chromatin (2016) 9:45
• We accept pre-submission inquiries
• Our selector tool helps you to find the most relevant journal
• We provide round the clock customer support
• Convenient online submission
• Thorough peer review
• Inclusion in PubMed and all major indexing services
• Maximum visibility for your research
Submit your manuscript atwww.biomedcentral.com/submit
Submit your next manuscript to BioMed Central and we will help you at every step:
47. Krzywinski M, Schein J, Birol I, Connors J, Gascoyne R, Horsman D, Jones SJ, Marra MA. Circos: an information aesthetic for comparative genomics. Genome Res. 2009;19(9):1639–45.
48. Kleiner DE, Brunt EM, Van Natta M, Behling C, Contos MJ, Cummings OW, Ferrell LD, Liu YC, Torbenson MS, Unalp-Arida A, et al. Design and
validation of a histological scoring system for nonalcoholic fatty liver disease. Hepatology. 2005;41(6):1313–21.
49. Mathur A, Marine M, Lu D, Swartz-Basile DA, Saxena R, Zyromski NJ, Pitt HA. Nonalcoholic fatty pancreas disease. HPB (Oxford). 2007;9(4):312–8.


![Histone Lysine-to-Methionine Mutations Reduce Histone Methylation · PDF fileHistone Lysine-to-Methionine Mutations Reduce Histone Methylation and Cause Developmental Pleiotropy1[OPEN]](https://img.pdfslide.net/doc/110x75/5aad2cf97f8b9a2e088de0be/histone-lysine-to-methionine-mutations-reduce-histone-methylation-lysine-to-methionine.jpg)