Embed Size (px)
Citation preview
8/6/2019 Historic Changes in High Yield Bond Market
http://slidepdf.com/reader/full/historic-changes-in-high-yield-bond-market 1/15
Journal of Applied Corporate Finance • Volume 21 Number 3 A Morgan Stanley Publication • Summer 2009 65
Historic Changes in the High Yield Bond Market
* The authors acknowledge the data provided by Barclays Capital and Moody’s, as
well as data and comments from Edward Altman.
1. See Blume-Keim, (1991b), Cornell (1992), and Reilly-Wright (1994, 1999).
2. These included studies by Altman and Nammacher (1985), Altman (1990, 1991),
Asquith, Mullins and Wolf (1989), Blume-Keim (1991a), Cheung, Bencivenga and
Fabozzi (1992), and Fridson (1992, 1994).
3. See Altman and Kishore (1996), Altman, Brady, Rasti and Sironi (2005), and
Moody’s (2009)
by Frank K. Reilly, University of Notre Dame, David J. Wright, University of Wisconsin-Parkside, and
James A. Gentry, University of Illinois*
The “modern” high-yield (HY) bond market inthe U.S. is a relatively new asset class, certainly when compared to the equity and investment-grade (IG) bond markets, both o which were
well established in the 1800s. The beginnings o the HY bondmarket as we know it are generally traced to the late 1970s or
early 1980s when it became possible or a wide cross sectiono public companies to issue non-investment grade bonds.The purpose o this paper is to contribute to the high-yieldbond literature by analyzing the evolving characteristics o this market and considering the implications o some recenthistoric changes or issuers, analysts, and investors.
We begin by reviewing studies that have examined theinvestment perormance o HY bonds over time. Our analysiso the overall growth o the HY bond market shows strongbut markedly cyclical growth as well as a notable change inthe composition o the asset class toward lower-risk Ba-ratedbonds. Consistent with this development, studies o the
perormance o HY bonds show Ba-rated bonds experienc-ing not only lower risk, but also higher returns than Caa-ratedbonds, which have produced surprisingly low average returnsalong with exceptionally high volatility. At the same time,studies o the correlation o HY bond returns with returns onother major asset classes report that HY bonds have consis-tently stronger relationships with common stocks (especially small-cap stocks) than with Treasuries and investment-gradebonds. The research also shows that, although HY and IGbonds have experienced similar levels o volatility duringstable economic periods, HY bond volatility tends to explodeduring periods o economic uncertainty, with Caa-rated bonds
accounting or most o the sharp increases in volatility. We also considered the promised yield spread on HY bonds relative to Treasury bonds, commonly reerred to asthe credit risk spread (CRS). Our analysis shows that the CRSseries is very volatile, has a non-normal distribution, and ishighly sensitive to the business cycle. One notable develop-ment was a recent change in the timing relationship betweencredit risk spreads and deault rates. During the recessions o 1990-91 and 2001-2002, sharp increases in credit spreads
pretty much coincided with spikes in deault rates. By contrast,the dramatic increase in CRS (to an historic high) in late 2008took place well beore the rst major hike in deault rates inmid-2009—and since that time, credit risk spreads have allensharply while deaults have been on a clear upward trend.Finally, the research documents a strongly negative relation-
ship between deault rates and recovery rates on HY bondsthat has compounded the cyclicality o their returns.
For investors and analysts, perhaps the most strikingnding in our report is the large element o cyclicality involatility and returns, and its relationship to the business cycle.To the extent investors are better able than most to anticipateups and downs in the economy, one may also be able to usehistorical patterns in CRS to avoid risks and take advantageo return opportunities resulting rom the large swings inthe CRS over the business cycle. Finally, the recent apparentbreakdown in the close relationship between the CRS and HY deault/recovery rates suggests that investors should give more
consideration to other variables that also aect CRS—notably,general liquidity and capital market risk.
Studies of HY Bond PerformanceThe large academic literature on the perormance o HY bonds can be divided into several themes. Early studies gener-ally reported that HY bonds experienced higher returns thaninvestment-grade bonds and had higher risk, as indicated by the greater volatility o returns.1 The major surprise in thisresearch was that the volatility o HY bond returns as a classhas been lower than one might expect over the entire periodo analysis.
A second group o studies examined HY bond deaultsand their eects on total investor returns.2 Apart rom acontroversy about how to measure the deault rate (with someadvocating use o cumulative deault rates over several years inplace o the more conventional average annual deault rates),the results show that the credit risk o HY bonds has beensubstantially greater than that o investment-grade bonds, andthat there has been a pronounced cyclical pattern in deaultrates.3 These studies also extended the analysis o deaults to
8/6/2019 Historic Changes in High Yield Bond Market
http://slidepdf.com/reader/full/historic-changes-in-high-yield-bond-market 2/15
66 Journal of Applied Corporate Finance • Volume 21 Number 3 A Morgan Stanley Publication • Summer 2009
0
100
200
300
400
500
600
700
12/86 12/87 12/88 12/89 12/90 12/91 12/92 12/93 12/94 12/95 12/96 12/97 12/98 12/99 12/00 12/01 12/02 12/03 12/04 12/05 12/06 12/07 12/08 12/09
M a r k e t V a l u e ( $ b i l l i o n s )
HY-Caa HY-B HY-Ba
Annual Compound Growth Rates Dec/1986–Aug/2009
Ba = 17.11%
B = 9.43%
Caa = 14.63%
Month–Year
4. These included studies by Altman (1992), Fridson (1994), Reilly and Wright
(2001), and Shane (1994).
5. Exhibit 1 in the appendix lists the stock and bond market indexes used in this
study. With the exception of the Altman Defaulted Bond Index, all of the rate-of-return
series include monthly data for at least the 24-year period 1985 through August 2009.
Exhibit 1 Annual Global High Yield Market New Issue Dollar Volume by Principal Amount 1977–2008
$0
$20
$40
$60
$80
$100
$120
$140
$160
$180
$200
’77 ’78 ’79 ’80 ’81 ’82 ’83 ’84 ’85 ’86 ’87 ’88 ’89 ’90 ’91 ’92 ’93 ’94 ’95 ’96 ’97 ’98 ’99 ’00 ’01 ’02 ’03 ’04 ’00 ’06 ’07 ’08
Year
B i l l i o n s o f U . S .
D o l l a r s
Annual Compound Growth Rate 1977 – 2008 = 13.06%
Exhibit 2 Market Value of the Barclays Capital High Yield Ba, B, and Caa Bonds (in $ billions) Dec. 1986–Aug. 2009
consider the recovery rates on the deaulted bonds and theeect o these recovery rates on HY bond losses. A notablending in this regard was a signicant negative relationshipbetween deault rates and recovery rates—in other words,the higher the deault rate in a given period, the lower therecoveries on the deaulted bonds.
A third set o studies considered portolio eects by
examining the correlations among the returns on HY bondsand the returns on other asset classes, mainly commonstocks and investment-grade bonds.4 These studies showedthat although the returns o HY bonds were positively corre-lated with those o IG bonds, the HY bond returns had asignicantly stronger relationship to the returns on commonstocks, especially small cap stocks. At the same time, studiesthat examined the correlations o HY bonds with other assetsound signicant dierences in the correlations among thethree dierent credit rating classes o HY bonds: Ba, B, and
Caa. For example, whereas the returns on Ba-rated bonds werehighly sensitive to changes in Treasury yields, the returns onB and Caa-rated bonds were minimally aected by Treasury interest rate changes, but highly correlated with the returnson common stocks.
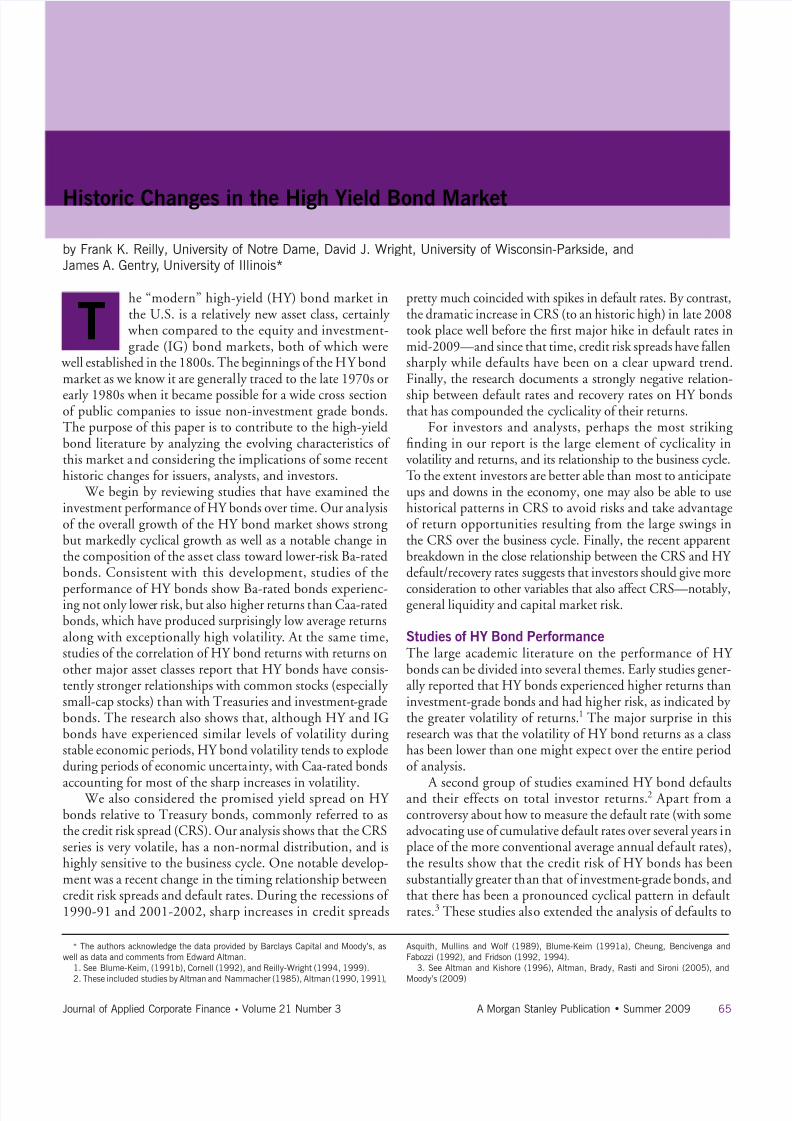
Overall Growth and Changing Market Composition
Since its emergence in the late 1970s, the HY bond markethas experienced strong but cyclical growth. As can be seenin Exhibit 1, which shows the new HY bond issuance oreach year since 1977,5 the rst major growth phase took placerom 1983 to 1989, with subsequent declines during the reces-sion years o 1990-91, 2001-2002, and 2008 to mid-2009. While the compound annual growth o new HY bond issu-ance has exceeded 13%, the fow has been very sensitive to theeconomic environment. With a current outstanding value o about $1.1 tril lion, HY bonds are clearly a signicant compo-
8/6/2019 Historic Changes in High Yield Bond Market
http://slidepdf.com/reader/full/historic-changes-in-high-yield-bond-market 3/15
67Journal of Applied Corporate Finance • Volume 21 Number 3 A Morgan Stanley Publication • Summer 2009
6. These data were originally from Lehman Brothers (now Barclays) that provide a
breakdown by rating category. As such, they are based upon the bonds included in the
widely-used bond index database that we will henceforth refer to as the Barclays Capital
Indices. For details of the rebranding of the indices, see (Barclays, 2008).
Exhibit 3 Scatter Plot of the Geometric Mean Annual Returns Versus the Standard Deviation of
Annual Returns for Alternative Stock and Bond Indexes (1985–Aug. 2009)
DEF BOND
BC HY-Caa
RUS 2000
SP500
BC HY-COM
BC HY-B
BC HY-Ba
BC CORP
BC BaaBC TSY
BC AGGR
0
1
2
3
4
5
6
7
8
9
10
11
0 5 10 15 20 25 30 35
Standard Deviation of Annual Returns
G e o m e t r i c M e a n A n n u a l R e t u r n %
Exhibit 4 Comparison of Annual Returns: Aggregate Investment Grade Bonds and Composite High Yield Bonds
(1985–Aug. 2009)
-40
-30
-20
-10
0
10
20
30
40
50
1 98 5 1 98 6 1 98 7 1 98 8 1 98 9 1 99 0 1 99 1 1 99 2 1 99 3 1 99 4 1 99 5 1 99 6 1 99 7 1 99 8 1 99 9 2 00 0 2 00 1 2 00 2 2 00 3 2 00 4 2 00 5 2 00 6 2 00 7 2 00 8 2 00 9
Year
A n n u a l R e t u r n %
BC AGGR BC HY-COM
NOTE: The line represents the regression line of all of the points except BC HY-Caa and DEF BOND. The regression line has the following equation and t-statistics:
Y = 7.81 + 0.088 X
(13.54) (1.95)
R-square = .35
NOTE: DEF-BOND excludes 1985 & 1986 returns.
nent—representing as much as 25%—o the U.S. corporatebond market.
As shown in Exhibit 2, the growth in the overall HY market can be decomposed into its Ba, B, and Caa-ratedcomponents.6 From 1987 (the rst year or which suchsegmented inormation is available) to the present, theaggregate value o the HY bond market has grown at anannual compound rate o almost 11%. While B-rated bondshave constituted the largest percentage o total market valueduring most o this 22-year period, they have declined as apercentage o the HY market, alling rom 65% to 44%. Atthe same time, Ba-rated bonds have increased rom about
19% o the total HY market in 1986 to 33% in 2009. Andconrming this pattern, the growth rate or Ba-rated issues
during this 22-year period was 17.1%, as compared to just9.4% or Bs and 14.6% or Caas. The Caa-rated proportionhas experienced a airly cyclical pattern over time, startingat 15% in 1986, declining to a low o about 3% in 1993and then increasing to its peak o just over 23% in August2009.
These results have two contrasting implications. The rstis that, thanks to a signicant shit rom B to Ba-rated bonds,there has been a secular increase in the overall credit quality o this market. At the same time, the current record proportion
8/6/2019 Historic Changes in High Yield Bond Market
http://slidepdf.com/reader/full/historic-changes-in-high-yield-bond-market 4/15
68 Journal of Applied Corporate Finance • Volume 21 Number 3 A Morgan Stanley Publication • Summer 2009
7. These overall results in a scatter plot of the geometric mean annual returns and
standard deviation of returns indicate that most asset classes plot very close to a risk-
return regression line that excludes the Caa-rated and defaulted bonds.
Exhibit 5 Comparison of Annual Returns: Ba, B, and Caa Rated High Yield Bonds (1985–Aug. 2009)
1985 1986 1987 1988 1989 1990 1991 1992 1993 1994 1995 1996 1997 1998 1999 2000 2001 2002 2003 2004 2005 2006 2007 2008 2009
Year
BC HY-Ba
BC HY-BBC HY-Caa
-50
-30
-10
10
30
50
70
90
A n n u a l R e t u r n %
Exhibit 6 Static Pools Cumulative 10-Year Average Bond Default Rates
Aaa Aaa A Baa Average Inv. Grade Baa B Caa Average HY Grade
Bond Rating
P e r c e n t D e f a u l t R a t e
0%
10%
20%
30%
40%
50%
60%
o Caa-rated bonds could lead to signicantly higher deaultrates in the uture.
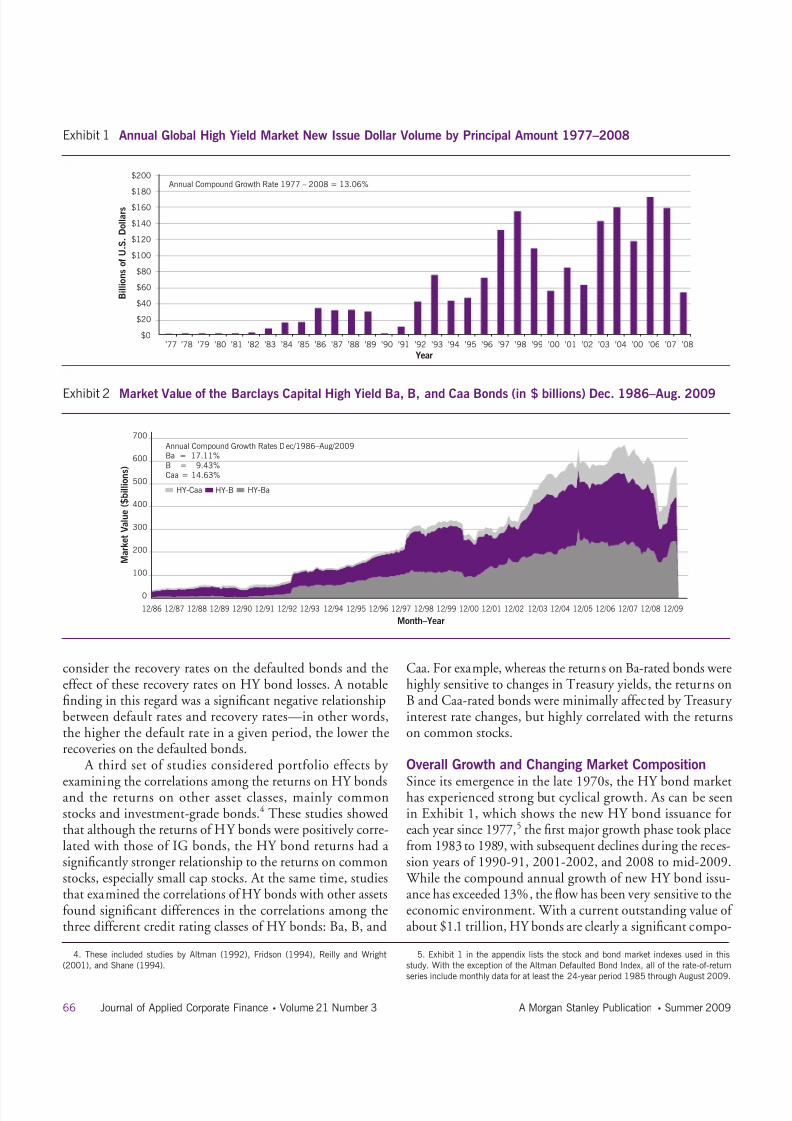
Risks and ReturnsExhibit 3 reports the risks and returns or several stock andbond series or the almost 25 year period rom January 1985through the end o August 2009. As expected, the average
rates o return on common stocks have been greater than thereturns or the entire classes o investment-grade and HY bonds. But surprisingly, although the risk associated withcommon stocks (as measured by the standard deviation o their annual returns) has been large, the highest risk measureshave been reported or two categories o HY bonds: Caa-rated bonds and deaulted bonds.7 At the same time, botho these high-risk asset classes have provided investors withrelatively low returns. This combination o high risk and low return goes a long way in explaining another puzzle: while
the standard deviation o HY bond annual returns has beenmore than double that o aggregate IG bonds—15.4% versus5.9%—the average returns have been roughly the same, bothalling between 8% and 9%. (The major dierences in risk between in IG and HY bonds can be seen clearly in Exhibit4, which shows that while IG bonds experienced two years
with small negative returns, HY bonds had ve years o nega-
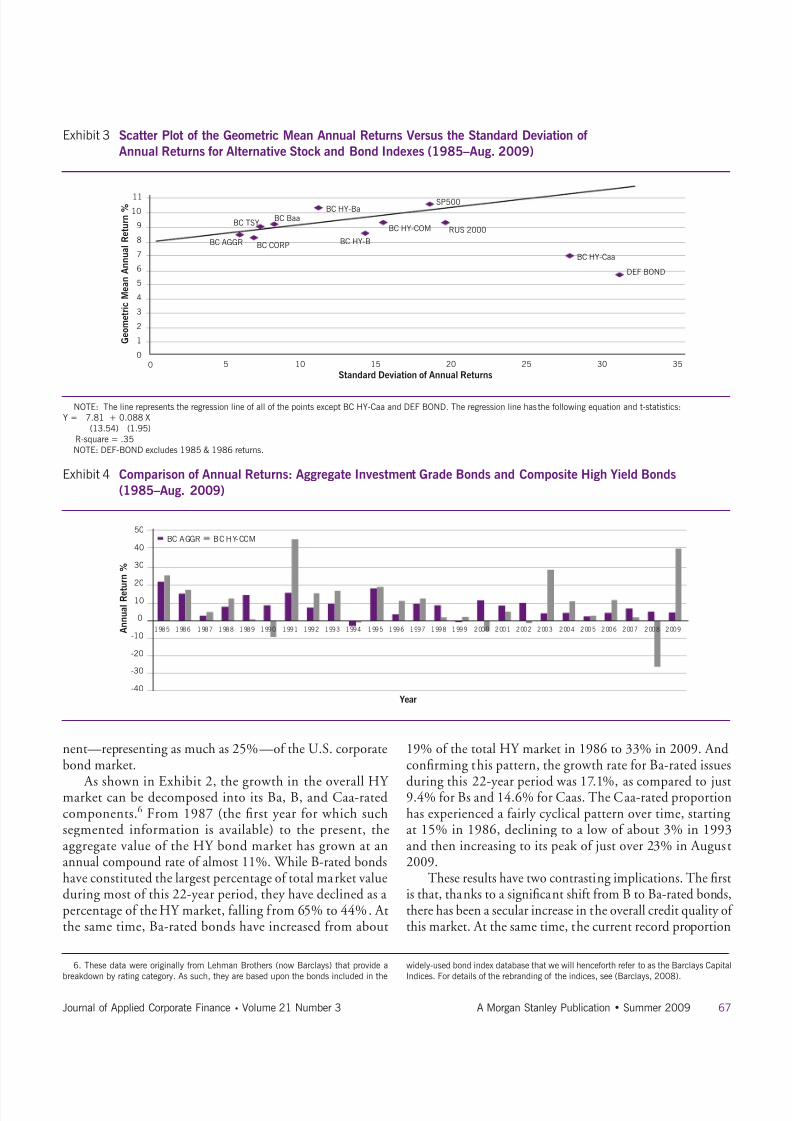
tive returns as well as three years o strong positive returnsollowing each o the last three recessions).Like Caa-rated and deaulted issues, moreover, B-rated
issues have a lso surprised researchers by providing loweraverage returns than less risky Ba-rated issues. And thus, whilethe risk measures or rated HY bonds have all increased withlower bond ratings as expected, the average annual rates o return provided by the dierent classes o HY bond have beenthe complete opposite o expectations —with Ba-rated producingthe highest average returns ollowed by B-rated bonds, and
8/6/2019 Historic Changes in High Yield Bond Market
http://slidepdf.com/reader/full/historic-changes-in-high-yield-bond-market 5/15
69Journal of Applied Corporate Finance • Volume 21 Number 3 A Morgan Stanley Publication • Summer 2009
*Signicant at the 5% level.
NOTE: The Altman Defaulted Bond index statistics excludes 1985 & 1986 monthly returns.
the Caa-rated bonds experiencing the lowest returns. Thelarge annual variation in returns is especially visible in thecase o Caa-rated bonds, which, as can be seen in Exhibit 5,experienced negative returns in eight, or nearly a third, o the years examined.
These dierences between the risk o HY and IG bonds,and among the dierent ratings classes o HY bond, are alsoclearly refected in dierences in their cumulative deault rates. As reported in Exhibit 6, the 10-year cumulative deault rateor IG bonds has ranged rom 0.5% or Aaa-rated bonds to
4.7% or Baa-rated bonds, with an overall average cumulativedeault rate or IG bonds o 2.1%. By contrast, the cumulativedeault rate or HY bonds has ranged rom 17.4% or Ba-ratedbonds to 52.2% or Caa-rated bonds, and an overal l averagecumulative deault rate or HY bonds o 26.6%.
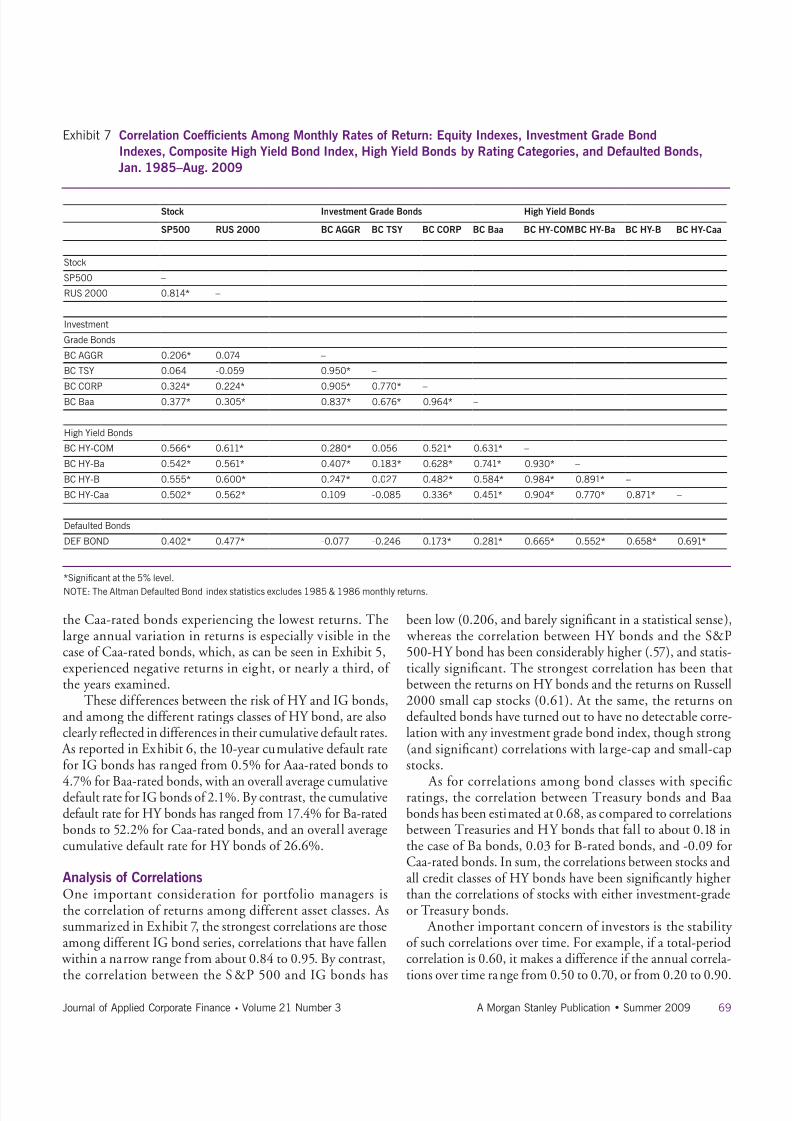
Analysis of CorrelationsOne important consideration or portolio managers isthe correlation o returns among dierent asset classes. Assummarized in Exhibit 7, the strongest correlations are thoseamong dierent IG bond series, correlations that have allen within a narrow range rom about 0.84 to 0.95. By contrast,
the correlation between the S&P 500 and IG bonds has
been low (0.206, and barely signicant in a statistical sense), whereas the correlation between HY bonds and the S&P500-HY bond has been considerably higher (.57), and statis-tically signicant. The strongest correlation has been thatbetween the returns on HY bonds and the returns on Russell2000 small cap stocks (0.61). At the same, the returns ondeaulted bonds have turned out to have no detectable corre-lation with any investment grade bond index, though strong(and signicant) correlations with large-cap and small-capstocks.
As or correlations among bond classes with specicratings, the correlation between Treasury bonds and Baabonds has been estimated at 0.68, as compared to correlationsbetween Treasuries and HY bonds that all to about 0.18 inthe case o Ba bonds, 0.03 or B-rated bonds, and -0.09 orCaa-rated bonds. In sum, the correlations between stocks andall credit classes o HY bonds have been signicantly higherthan the correlations o stocks with either investment-gradeor Treasury bonds.
Another important concern o investors is the stability o such correlations over time. For example, i a total-periodcorrelation is 0.60, it makes a dierence i the annual correla-
tions over time range rom 0.50 to 0.70, or rom 0.20 to 0.90.
Exhibit 7 Correlation Coefcients Among Monthly Rates of Return: Equity Indexes, Investment Grade Bond
Indexes, Composite High Yield Bond Index, High Yield Bonds by Rating Categories, and Defaulted Bonds,
Jan. 1985–Aug. 2009
Stock Investment Grade Bonds High Yield Bonds
SP500 RUS 2000 BC AGGR BC TSY BC CORP BC Baa BC HY-COMBC HY-Ba BC HY-B BC HY-Caa
Stock
SP500 –
RUS 2000 0.814* –
Investment
Grade Bonds
BC AGGR 0.206* 0.074 –
BC TSY 0.064 -0.059 0.950* –
BC CORP 0.324* 0.224* 0.905* 0.770* –
BC Baa 0.377* 0.305* 0.837* 0.676* 0.964* –
High Yield Bonds
BC HY-COM 0.566* 0.611* 0.280* 0.056 0.521* 0.631* –
BC HY-Ba 0.542* 0.561* 0.407* 0.183* 0.628* 0.741* 0.930* –
BC HY-B 0.555* 0.600* 0.247* 0.027 0.482* 0.584* 0.984* 0.891* –
BC HY-Caa 0.502* 0.562* 0.109 -0.085 0.336* 0.451* 0.904* 0.770* 0.871* –
Defaulted Bonds
DEF BOND 0.402* 0.477* -0.077 -0.246 0.173* 0.281* 0.665* 0.552* 0.658* 0.691*
8/6/2019 Historic Changes in High Yield Bond Market
http://slidepdf.com/reader/full/historic-changes-in-high-yield-bond-market 6/15
70 Journal of Applied Corporate Finance • Volume 21 Number 3 A Morgan Stanley Publication • Summer 2009
8. These differences among the correlations over time by ratings supports the idea of
some segmentation between HY bonds with different ratings.
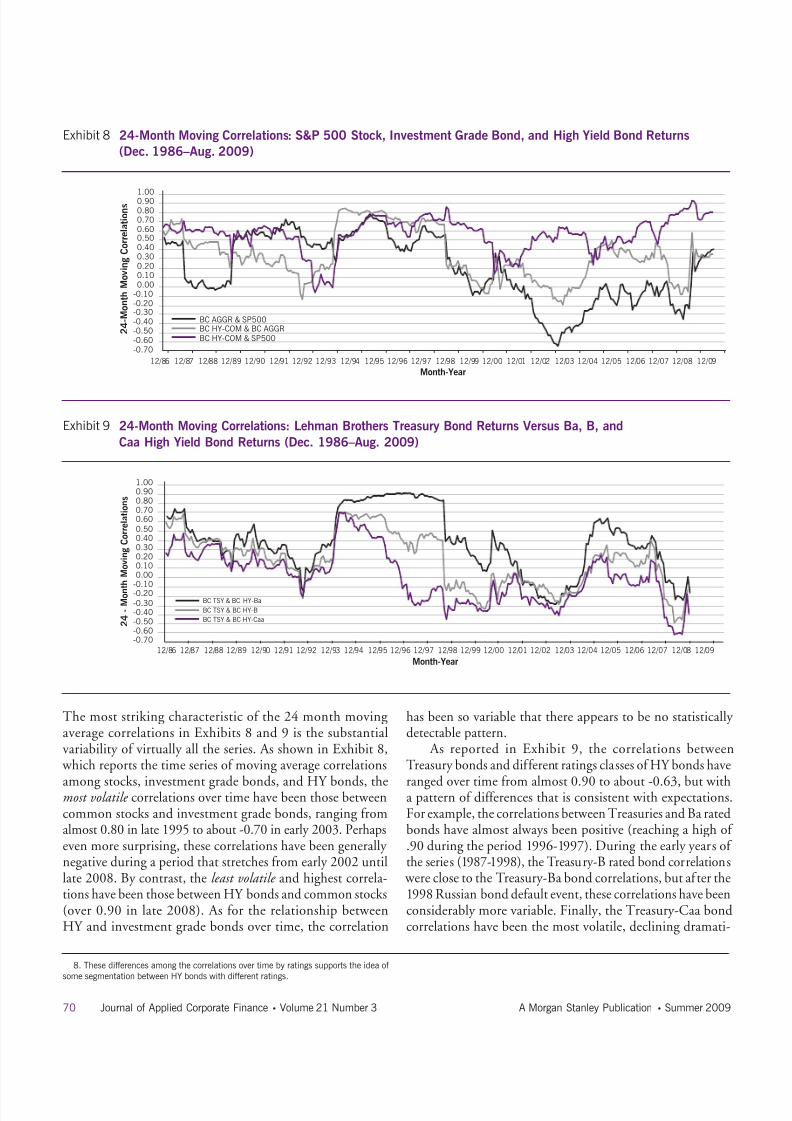
The most striking characteristic o the 24 month movingaverage correlations in Exhibits 8 and 9 is the substantialvariability o virtually all the series. As shown in Exhibit 8, which reports the time series o moving average correlations
among stocks, investment grade bonds, and HY bonds, themost volatile correlations over time have been those betweencommon stocks and investment grade bonds, ranging romalmost 0.80 in late 1995 to about -0.70 in early 2003. Perhapseven more surprising, these correlations have been generally negative during a period that stretches rom early 2002 untillate 2008. By contrast, the least volatile and highest correla-tions have been those between HY bonds and common stocks(over 0.90 in late 2008). As or the relationship betweenHY and investment grade bonds over time, the correlation
has been so variable that there appears to be no statistically detectable pattern.
As reported in Exhibit 9, the correlations betweenTreasury bonds and dierent ratings classes o HY bonds have
ranged over time rom almost 0.90 to about -0.63, but witha pattern o dierences that is consistent with expectations.For example, the correlations between Treasuries and Ba ratedbonds have almost always been positive (reaching a high o .90 during the period 1996-1997). During the early years o the series (1987-1998), the Treasury-B rated bond correlations were close to the Treasury-Ba bond correlations, but ater the1998 Russian bond deault event, these correlations have beenconsiderably more variable. Finally, the Treasury-Caa bondcorrelations have been the most volatile, declining dramati-
Exhibit 8 24-Month Moving Correlations: S&P 500 Stock, Investment Grade Bond, and High Yield Bond Returns
(Dec. 1986–Aug. 2009)
-0.70
-0.60
-0.50
-0.40
-0.30
-0.20
-0.10
0.00
0.10
0.20
0.30
0.40
0.50
0.60
0.70
0.80
0.90
1.00
BC AGGR & SP500
BC HY-COM & BC AGGR
BC HY-COM & SP500 2 4 - M o n t h M o v i n g C o r r e l a t i o n s
12/86 12/87 12/88 12/89 12/90 12/91 12/92 12/93 12/94 12/95 12/96 12/97 12/98 12/99 12/00 12/01 12/02 12/03 12/04 12/05 12/06 12/07 12/08 12/09
Month-Year
Exhibit 9 24-Month Moving Correlations: Lehman Brothers Treasury Bond Returns Versus Ba, B, and
Caa High Yield Bond Returns (Dec. 1986–Aug. 2009)
-0.70
-0.60
-0.50
-0.40
-0.30
-0.20
-0.10
0.00
0.10
0.20
0.30
0.40
0.50
0.60
0.70
0.80
0.90
1.00
12/86 12/87 12/88 12/89 12/90 12/91 12/92 12/93 12/94 12/95 12/96 12/97 12/98 12/99 12/00 12/01 12/02 12/03 12/04 12/05 12/06 12/07 12/08 12/09
Month-Year
BC TSY & BC HY-Ba
BC TSY & BC HY-B
BC TSY & BC HY-Caa 2 4 - M o n t h M o v i n g C o r r e l a t i o n s
8/6/2019 Historic Changes in High Yield Bond Market
http://slidepdf.com/reader/full/historic-changes-in-high-yield-bond-market 7/15
71Journal of Applied Corporate Finance • Volume 21 Number 3 A Morgan Stanley Publication • Summer 2009
Exhibit 10 12-Month Moving Standard Deviations: Aggregate Investment Grade Bond, SP500, and Composite High
Yield Bond Monthly Returns Versus NBER Contractions (Dec. 1985–Aug. 2009)
0.00
1.00
2.00
3.00
4.00
5.00
6.00
7.00
8.00
9.00
12/85 12/86 12/87 12/88 12/89 12/90 12/91 12/92 12/93 12/94 12/95 12/96 12/97 12/98 12/99 12/00 12/01 12/02 12/03 12/04 12/05 12/06 12/07 12/08 12/09
Month-Year
M o v i n g S t a n d a r d D e v i a t i o n s
Contractions
BC AGGR
BC HY-COM
9. The time series of volatility was also examined relative to periods of easy monetary
policy identied as periods when the Federal Reserve was reducing or had reduced the
discount rate. This measure of monetary policy has been justied in a number of studies
(see Jensen, Johnson and Mercer (2000)). The results indicated that the periods of easy
monetary policy were very frequent over our study period and covered all the recessions,
but also many months that were economic expansions and the relationship between
monetary policy and changes in volatility were not meaningful so we have not included
these exhibits.
10. Again, we examined the CRS series relative to periods of easy monetary policy
and the pattern likewise implied that there would not be a signicant relationship be -
cause of the preponderance of easy money periods.
cally starting in 1995 and mostly negative since 1997.8
We also examined the intertemporal correlations betweencommon stock and the rated HY bonds, but have not reportedthe results. What we will note is that these correlations havebecome much less volatile than in the past, thus providingstill more evidence o a much stronger and more consistentrelationship between HY bonds and stocks than betweenHY and IG bonds.
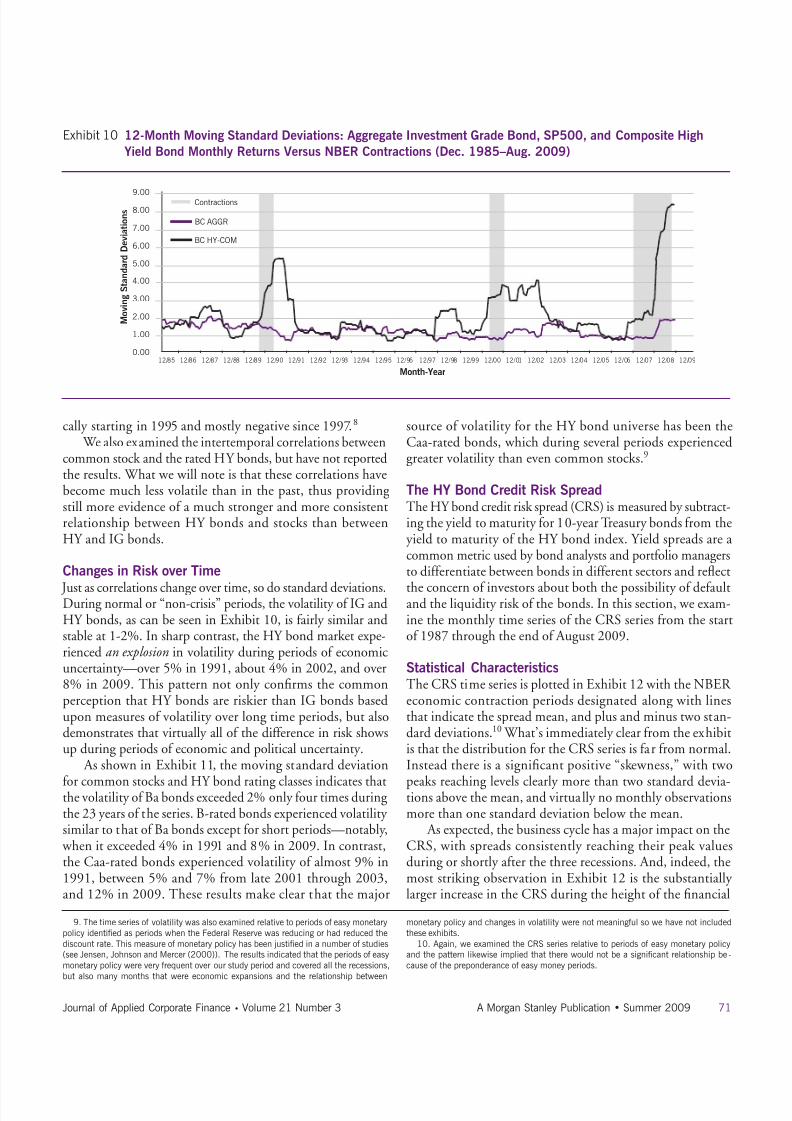
Changes in Risk over Time
Just as correlations change over time, so do standard deviations.During normal or “non-crisis” periods, the volatility o IG andHY bonds, as can be seen in Exhibit 10, is airly similar andstable at 1-2%. In sharp contrast, the HY bond market expe-rienced an explosion in volatility during periods o economicuncertainty—over 5% in 1991, about 4% in 2002, and over8% in 2009. This pattern not only conrms the commonperception that HY bonds are riskier than IG bonds basedupon measures o volatility over long time periods, but alsodemonstrates that virtually all o the dierence in risk showsup during periods o economic and political uncertainty.
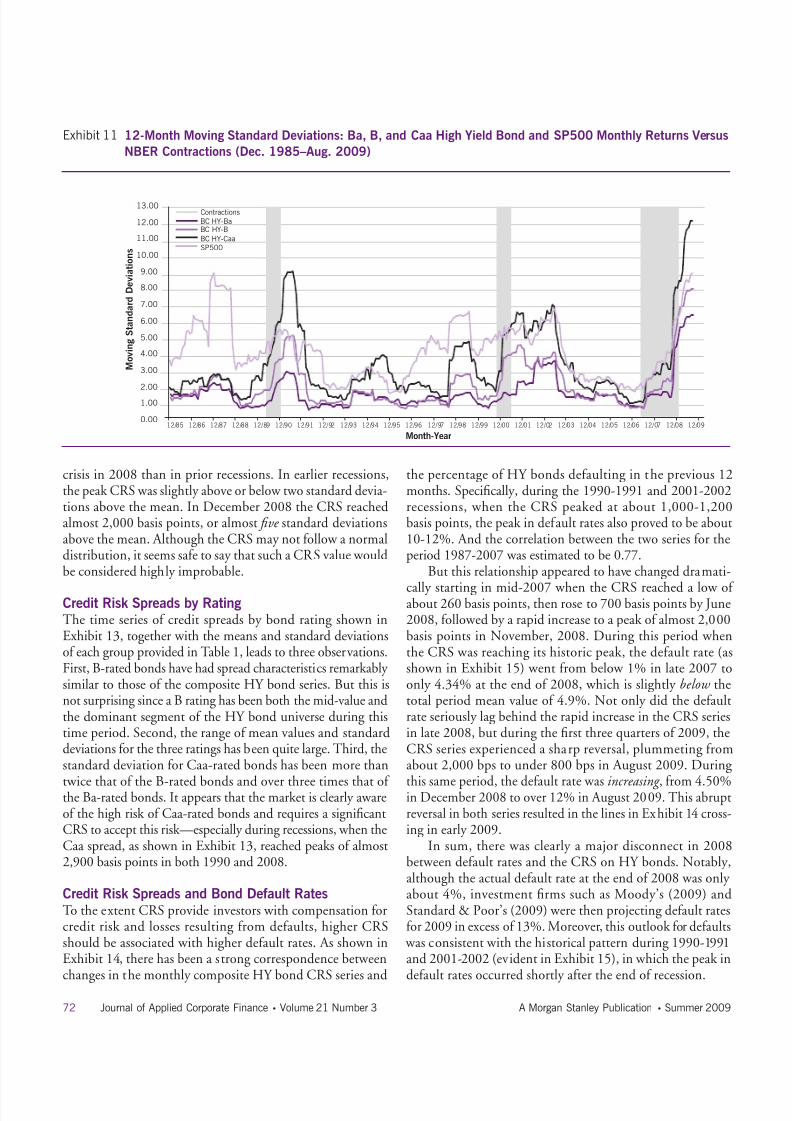
As shown in Exhibit 11, the moving standard deviation
or common stocks and HY bond rating classes indicates thatthe volatility o Ba bonds exceeded 2% only our times duringthe 23 years o the series. B-rated bonds experienced volatility similar to that o Ba bonds except or short periods—notably, when it exceeded 4% in 1991 and 8% in 2009. In contrast,the Caa-rated bonds experienced volatility o almost 9% in1991, between 5% and 7% rom late 2001 through 2003,and 12% in 2009. These results make clear that the major
source o volatility or the HY bond universe has been theCaa-rated bonds, which during several periods experiencedgreater volatility than even common stocks.9
The HY Bond Credit Risk SpreadThe HY bond credit risk spread (CRS) is measured by subtract-ing the yield to maturity or 10-year Treasury bonds rom theyield to maturity o the HY bond index. Yield spreads are acommon metric used by bond analysts and portolio managersto dierentiate between bonds in dierent sectors and refect
the concern o investors about both the possibility o deaultand the liquidity risk o the bonds. In this section, we exam-ine the monthly time series o the CRS series rom the starto 1987 through the end o August 2009.
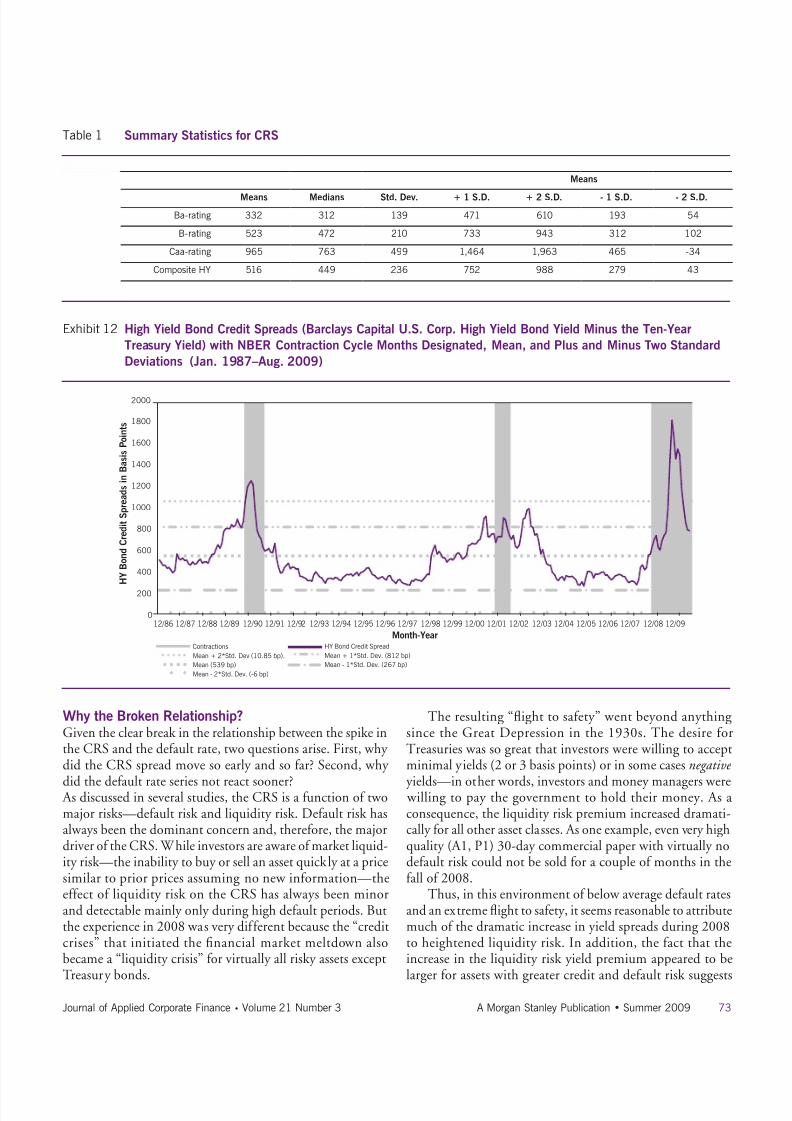
Statistical CharacteristicsThe CRS time series is plotted in Exhibit 12 with the NBER economic contraction periods designated along with linesthat indicate the spread mean, and plus and minus two stan-dard deviations.10 What’s immediately clear rom the exhibitis that the distribution or the CRS series is ar rom normal.Instead there is a signicant positive “skewness,” with two
peaks reaching levels clearly more than two standard devia-tions above the mean, and virtually no monthly observationsmore than one standard deviation below the mean.
As expected, the business cycle has a major impact on theCRS, with spreads consistently reaching their peak valuesduring or shortly ater the three recessions. And, indeed, themost striking observation in Exhibit 12 is the substantially larger increase in the CRS during the height o the nancial
8/6/2019 Historic Changes in High Yield Bond Market
http://slidepdf.com/reader/full/historic-changes-in-high-yield-bond-market 8/15
72 Journal of Applied Corporate Finance • Volume 21 Number 3 A Morgan Stanley Publication • Summer 2009
Exhibit 11 12-Month Moving Standard Deviations: Ba, B, and Caa High Yield Bond and SP500 Monthly Returns Versus
NBER Contractions (Dec. 1985–Aug. 2009)
0.00
1.00
2.00
3.00
4.00
5.00
6.00
7.00
8.00
9.00
10.00
11.00
12.00
13.00
M o v i n g S t a n d a r d D e v i a t i o n s
BC HY-Ba
BC HY-B
BC HY-Caa
SP500
12/85 12/86 12/87 12/88 12/89 12/90 12/91 12/92 12/93 12/94 12/95 12/96 12/97 12/98 12/99 12/00 12/01 12/02 12/03 12/04 12/05 12/06 12/07 12/08 12/09
Month-Year
Contractions
crisis in 2008 than in prior recessions. In earlier recessions,the peak CRS was slightly above or below two standard devia-tions above the mean. In December 2008 the CRS reachedalmost 2,000 basis points, or almost fve standard deviationsabove the mean. Although the CRS may not ollow a normaldistribution, it seems sae to say that such a CRS value wouldbe considered highly improbable.
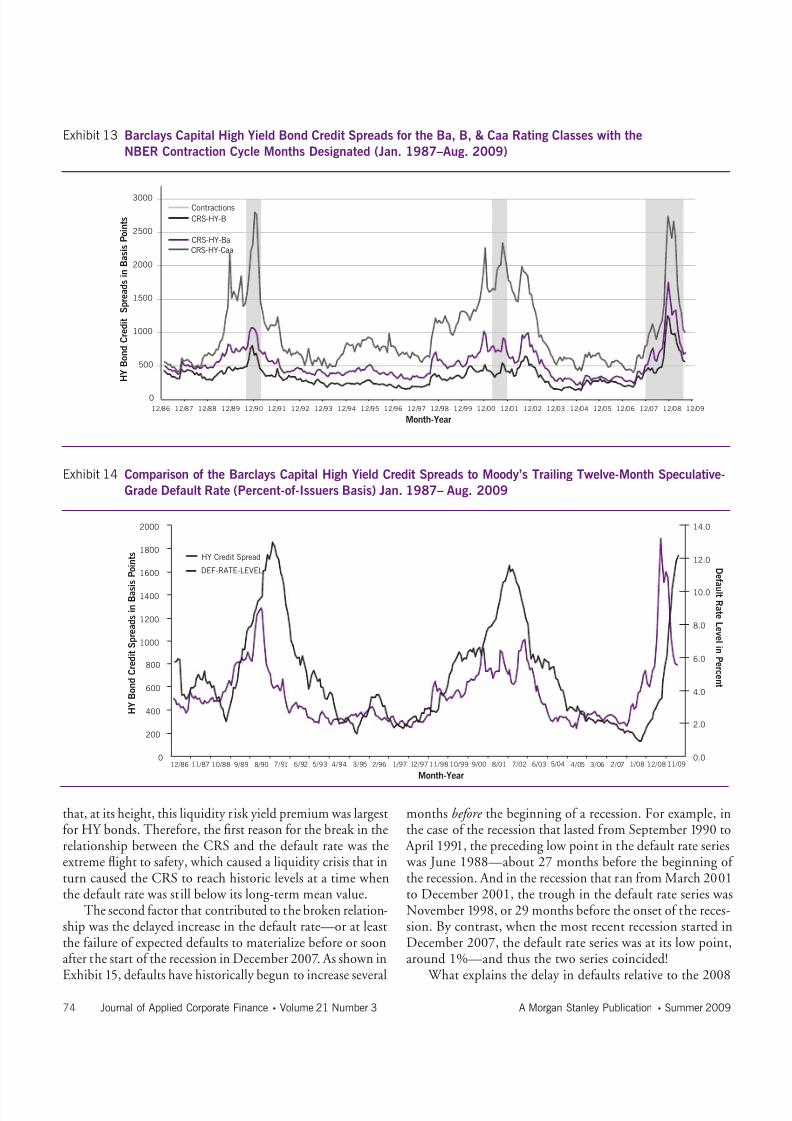
Credit Risk Spreads by RatingThe time series o credit spreads by bond rating shown inExhibit 13, together with the means and standard deviationso each group provided in Table 1, leads to three observations.First, B-rated bonds have had spread characteristics remarkably similar to those o the composite HY bond series. But this isnot surprising since a B rating has been both the mid-value andthe dominant segment o the HY bond universe during thistime period. Second, the range o mean values and standarddeviations or the three ratings has been quite large. Third, thestandard deviation or Caa-rated bonds has been more than
twice that o the B-rated bonds and over three times that o the Ba-rated bonds. It appears that the market is clearly awareo the high risk o Caa-rated bonds and requires a signicantCRS to accept this risk—especially during recessions, when theCaa spread, as shown in Exhibit 13, reached peaks o almost2,900 basis points in both 1990 and 2008.
Credit Risk Spreads and Bond Default RatesTo the extent CRS provide investors with compensation orcredit risk and losses resulting rom deaults, higher CRSshould be associated with higher deault rates. As shown inExhibit 14, there has been a strong correspondence between
changes in the monthly composite HY bond CRS series and
the percentage o HY bonds deaulting in the previous 12months. Specically, during the 1990-1991 and 2001-2002recessions, when the CRS peaked at about 1,000-1,200basis points, the peak in deault rates also proved to be about10-12%. And the correlation between the two series or theperiod 1987-2007 was estimated to be 0.77.
But this relationship appeared to have changed dramati-
cally starting in mid-2007 when the CRS reached a low o about 260 basis points, then rose to 700 basis points by June2008, ollowed by a rapid increase to a peak o almost 2,000basis points in November, 2008. During this period whenthe CRS was reaching its historic peak, the deault rate (asshown in Exhibit 15) went rom below 1% in late 2007 toonly 4.34% at the end o 2008, which is slightly below thetotal period mean value o 4.9%. Not only did the deaultrate seriously lag behind the rapid increase in the CRS seriesin late 2008, but during the rst three quarters o 2009, theCRS series experienced a sharp reversal, plummeting romabout 2,000 bps to under 800 bps in August 2009. During
this same period, the deault rate was increasing , rom 4.50%in December 2008 to over 12% in August 2009. This abruptreversal in both series resulted in the lines in Exhibit 14 cross-ing in early 2009.
In sum, there was clearly a major disconnect in 2008between deault rates and the CRS on HY bonds. Notably,although the actual deault rate at the end o 2008 was only about 4%, investment rms such as Moody’s (2009) andStandard & Poor’s (2009) were then projecting deault ratesor 2009 in excess o 13%. Moreover, this outlook or deaults was consistent with the historical pattern during 1990-1991and 2001-2002 (evident in Exhibit 15), in which the peak in
deault rates occurred shortly ater the end o recession.
8/6/2019 Historic Changes in High Yield Bond Market
http://slidepdf.com/reader/full/historic-changes-in-high-yield-bond-market 9/15
73Journal of Applied Corporate Finance • Volume 21 Number 3 A Morgan Stanley Publication • Summer 2009
Exhibit 12 High Yield Bond Credit Spreads (Barclays Capital U.S. Corp. High Yield Bond Yield Minus the Ten-Year
Treasury Yield) with NBER Contraction Cycle Months Designated, Mean, and Plus and Minus Two Standard
Deviations (Jan. 1987–Aug. 2009)
12/86 12/87 12/88 12/89 12/90 12/91 12/92 12/93 12/94 12/95 12/96 12/97 12/98 12/99 12/00 12/01 12/02 12/03 12/04 12/05 12/06 12/07 12/08 12/09
Month-Year
0
200
400
600
800
1000
1200
1400
1600
1800
2000
H Y
B o n d
C r e d i t S p r e a d s i n
B a s i s P o i n t s
Contractions HY Bond Credit Spread
Mean + 2*Std. Dev (10.85 bp). Mean + 1*Std. Dev. (812 bp)
Mean (539 bp) Mean - 1*Std. Dev. (267 bp)
Mean - 2*Std. Dev. (-6 bp)
Why the Broken Relationship?Given the clear break in the relationship between the spike inthe CRS and the deault rate, two questions arise. First, why did the CRS spread move so early and so ar? Second, why
did the deault rate series not react sooner? As discussed in several studies, the CRS is a unction o twomajor risks—deault risk and liquidity risk. Deault risk hasalways been the dominant concern and, thereore, the majordriver o the CRS. While investors are aware o market liquid-ity risk—the inability to buy or sell an asset quickly at a pricesimilar to prior prices assuming no new inormation—theeect o liquidity risk on the CRS has always been minorand detectable mainly only during high deault periods. Butthe experience in 2008 was very dierent because the “creditcrises” that initiated the nancial market meltdown alsobecame a “liquidity crisis” or virtually all risky assets except
Treasury bonds.
The resulting “fight to saety” went beyond anythingsince the Great Depression in the 1930s. The desire orTreasuries was so great that investors were willing to acceptminimal yields (2 or 3 basis points) or in some cases negative
yields—in other words, investors and money managers were willing to pay the government to hold their money. As aconsequence, the liquidity risk premium increased dramati-cally or all other asset classes. As one example, even very highquality (A1, P1) 30-day commercial paper with virtually nodeault risk could not be sold or a couple o months in theall o 2008.
Thus, in this environment o below average deault ratesand an extreme fight to saety, it seems reasonable to attributemuch o the dramatic increase in yield spreads during 2008to heightened liquidity risk. In addition, the act that theincrease in the liquidity risk yield premium appeared to be
larger or assets with greater credit and deault risk suggests
Means
Means Medians Std. Dev. + 1 S.D. + 2 S.D. - 1 S.D. - 2 S.D.
Ba-rating 332 312 139 471 610 193 54
B-rating 523 472 210 733 943 312 102
Caa-rating 965 763 499 1,464 1,963 465 -34
Composite HY 516 449 236 752 988 279 43
Table 1 Summary Statistics for CRS
8/6/2019 Historic Changes in High Yield Bond Market
http://slidepdf.com/reader/full/historic-changes-in-high-yield-bond-market 10/15
74 Journal of Applied Corporate Finance • Volume 21 Number 3 A Morgan Stanley Publication • Summer 2009
Exhibit 13 Barclays Capital High Yield Bond Credit Spreads for the Ba, B, & Caa Rating Classes with the
NBER Contraction Cycle Months Designated (Jan. 1987–Aug. 2009)
Exhibit 14 Comparison of the Barclays Capital High Yield Credit Spreads to Moody’s Trailing Twelve-Month Speculative-
Grade Default Rate (Percent-of-Issuers Basis) Jan. 1987– Aug. 2009
0
500
1000
1500
2000
2500
3000
12/86 12/87 12/88 12/89 12/90 12/91 12/92 12/93 12/94 12/95 12/96 12/97 12/98 12/99 12/00 12/01 12/02 12/03 12/04 12/05 12/06 12/07 12/08 12/09
Month-Year
Contractions
CRS-HY-B
CRS-HY-Ba
CRS-HY-Caa
H Y
B o n d
C r e d i t
S p r e a d s i n
B a s i s P o i n t s
0
200
400
600
800
1000
1200
1400
1600
1800
2000
12/86 11/87 10/88 9/89 8/90 7/91 6/92 5/93 4/94 3/95 2/96 1/97 12/97 11/98 10/99 9/00 8/01 7/02 6/03 5/04 4/05 3/06 2/07 1/08 12/08 11/09
Month-Year
H Y
B o n d
C r e d i t S p r e a d s i n
B a s
i s P o i n t s
0.0
2.0
4.0
6.0
8.0
10.0
12.0
14.0
D e f a ul t R a t e L e v e l i n
P e r c e n t
HY Credit Spread
DEF-RATE-LEVEL
that, at its height, this liquidity risk yield premium was largestor HY bonds. Thereore, the rst reason or the break in therelationship between the CRS and the deault rate was theextreme fight to saety, which caused a liquidity crisis that inturn caused the CRS to reach historic levels at a time whenthe deault rate was still below its long-term mean value.
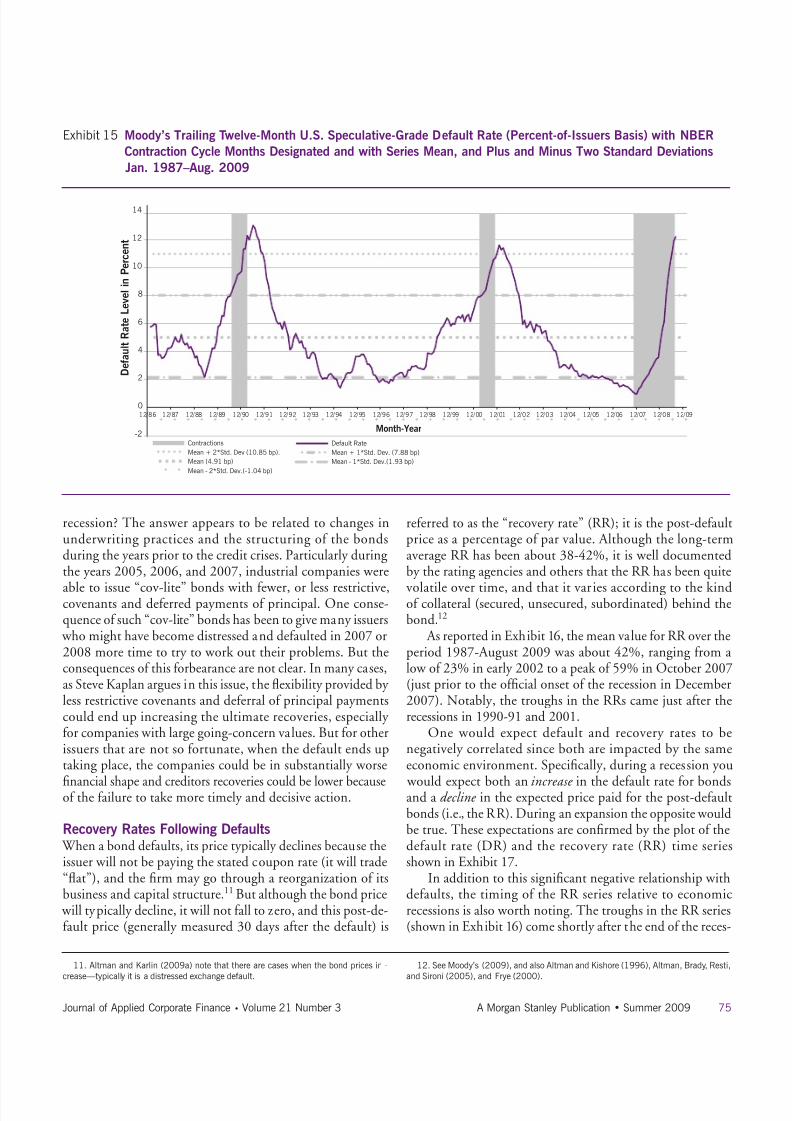
The second actor that contributed to the broken relation-ship was the delayed increase in the deault rate—or at leastthe ailure o expected deaults to materialize beore or soonater the start o the recession in December 2007. As shown in
Exhibit 15, deaults have historically begun to increase several
months before the beginning o a recession. For example, inthe case o the recession that lasted rom September 1990 to April 1991, the preceding low point in the deault rate series was June 1988—about 27 months beore the beginning o the recession. And in the recession that ran rom March 2001to December 2001, the trough in the deault rate series wasNovember 1998, or 29 months beore the onset o the reces-sion. By contrast, when the most recent recession started inDecember 2007, the deault rate series was at its low point,around 1%—and thus the two series coincided!
What explains the delay in deaults relative to the 2008
8/6/2019 Historic Changes in High Yield Bond Market
http://slidepdf.com/reader/full/historic-changes-in-high-yield-bond-market 11/15
75Journal of Applied Corporate Finance • Volume 21 Number 3 A Morgan Stanley Publication • Summer 2009
Exhibit 15 Moody’s Trailing Twelve-Month U.S. Speculative-Grade Default Rate (Percent-of-Issuers Basis) with NBER
Contraction Cycle Months Designated and with Series Mean, and Plus and Minus Two Standard Deviations
Jan. 1987–Aug. 2009
-2
0
2
4
6
8
10
12
14
12/86 12/87 12/88 12/89 12/90 12/91 12/92 12/93 12/94 12/95 12/96 12/97 12/98 12/99 12/00 12/01 12/02 12/03 12/04 12/05 12/06 12/07 12/08 12/09
Month-Year
D e f a u l t R a t e L e v e l i n
P e r c e n t
Contractions Default Rate
Mean + 2*Std. Dev (10.85 bp). Mean + 1*Std. Dev. (7.88 bp)
Mean (4.91 bp) Mean - 1*Std. Dev.(1.93 bp)
Mean - 2*Std. Dev.(-1.04 bp)
11. Altman and Karlin (2009a) note that there are cases when the bond prices in -
crease—typically it is a distressed exchange default.
12. See Moody’s (2009), and also Altman and Kishore (1996), Altman, Brady, Resti,
and Sironi (2005), and Frye (2000).
recession? The answer appears to be related to changes inunderwriting practices and the structuring o the bondsduring the years prior to the credit crises. Particularly duringthe years 2005, 2006, and 2007, industrial companies were
able to issue “cov-lite” bonds with ewer, or less restrictive,covenants and deerred payments o principal. One conse-quence o such “cov-lite” bonds has been to give many issuers who might have become distressed and deaulted in 2007 or2008 more time to try to work out their problems. But theconsequences o this orbearance are not clear. In many cases,as Steve Kaplan argues in this issue, the fexibility provided by less restrictive covenants and deerral o principal paymentscould end up increasing the ultimate recoveries, especially or companies with large going-concern values. But or otherissuers that are not so ortunate, when the deault ends uptaking place, the companies could be in substantially worse
nancial shape and creditors recoveries could be lower becauseo the ailure to take more timely and decisive action.
Recovery Rates Following Defaults When a bond deaults, its price typically declines because theissuer will not be paying the stated coupon rate (it will trade“fat”), and the rm may go through a reorganization o itsbusiness and capital structure.11 But although the bond price will typically decline, it will not all to zero, and this post-de-ault price (generally measured 30 days ater the deault) is
reerred to as the “recovery rate” (RR); it is the post-deaultprice as a percentage o par value. Although the long-termaverage RR has been about 38-42%, it is well documentedby the rating agencies and others that the RR has been quite
volatile over time, and that it varies according to the kindo collateral (secured, unsecured, subordinated) behind thebond.12
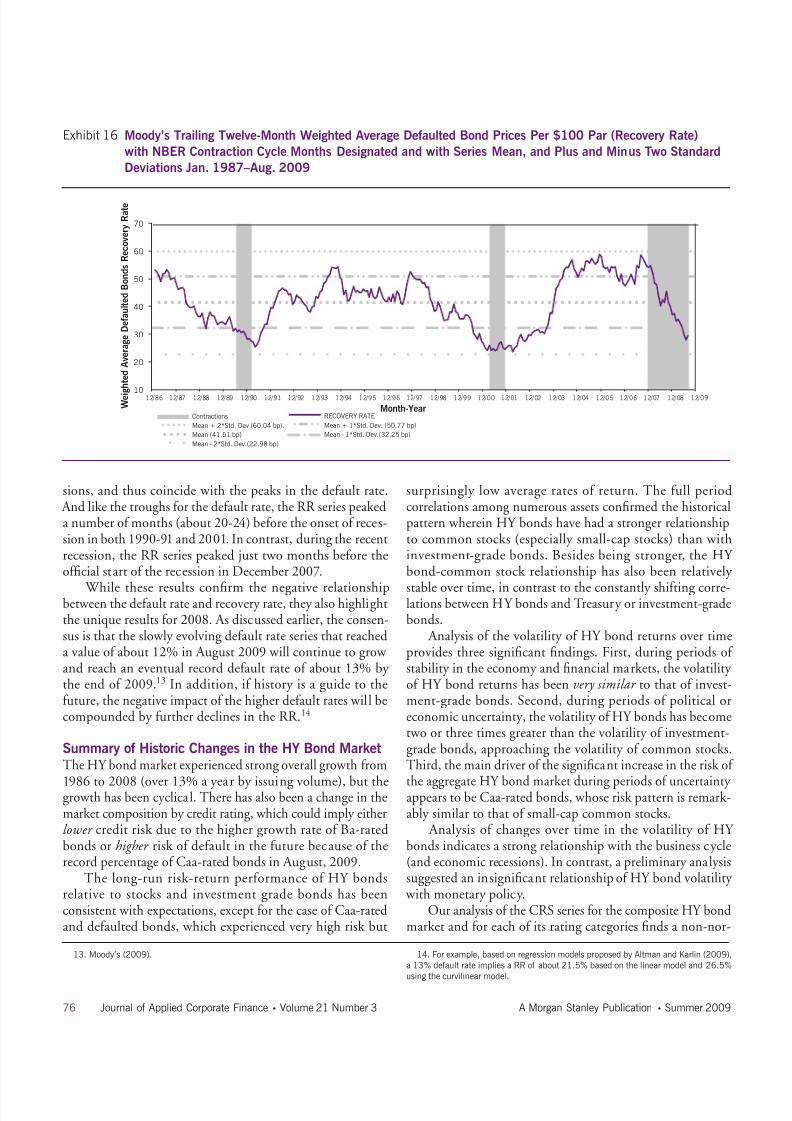
As reported in Exhibit 16, the mean value or RR over theperiod 1987-August 2009 was about 42%, ranging rom alow o 23% in early 2002 to a peak o 59% in October 2007(just prior to the ocial onset o the recession in December2007). Notably, the troughs in the RRs came just ater therecessions in 1990-91 and 2001.
One would expect deault and recovery rates to benegatively correlated since both are impacted by the sameeconomic environment. Specically, during a recession you
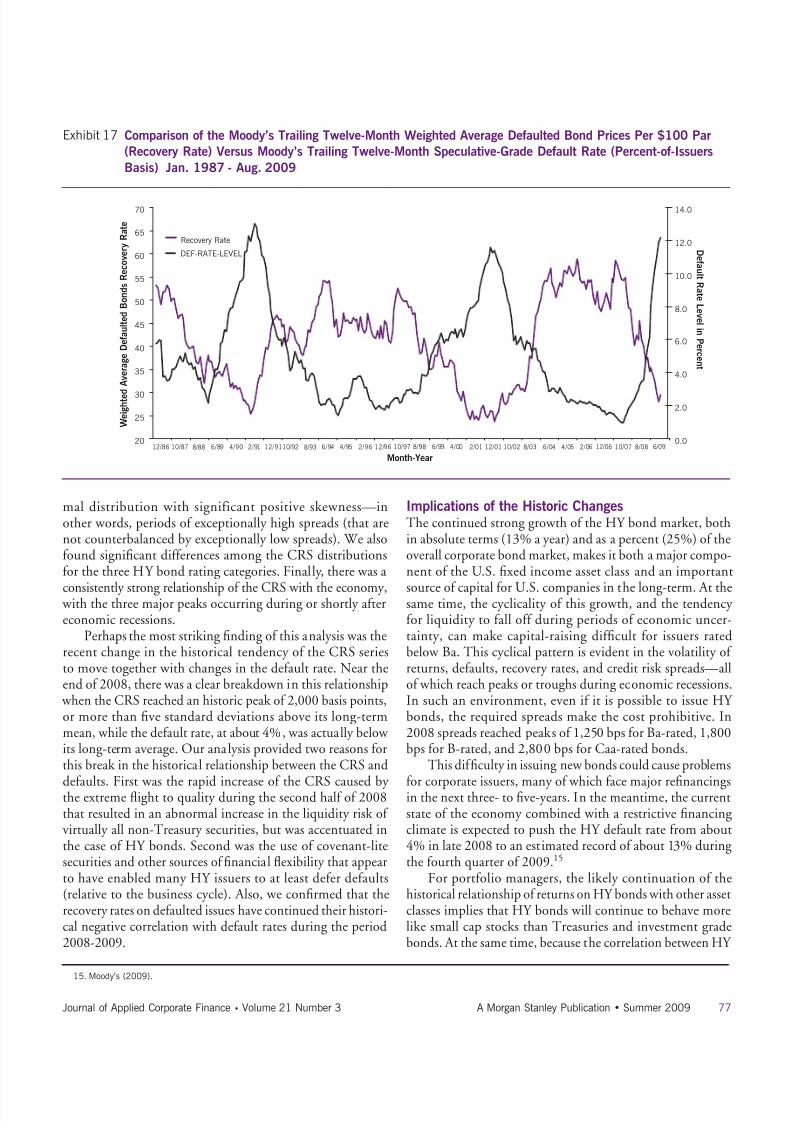
would expect both an increase in the deault rate or bondsand a decline in the expected price paid or the post-deaultbonds (i.e., the RR). During an expansion the opposite wouldbe true. These expectations are conrmed by the plot o thedeault rate (DR) and the recovery rate (RR) time seriesshown in Exhibit 17.
In addition to this signicant negative relationship withdeaults, the timing o the RR series relative to economicrecessions is also worth noting. The troughs in the RR series(shown in Exhibit 16) come shortly ater the end o the reces-
8/6/2019 Historic Changes in High Yield Bond Market
http://slidepdf.com/reader/full/historic-changes-in-high-yield-bond-market 12/15
76 Journal of Applied Corporate Finance • Volume 21 Number 3 A Morgan Stanley Publication • Summer 2009
Exhibit 16 Moody’s Trailing Twelve-Month Weighted Average Defaulted Bond Prices Per $100 Par (Recovery Rate)
with NBER Contraction Cycle Months Designated and with Series Mean, and Plus and Minus Two Standard
Deviations Jan. 1987–Aug. 2009
12/86 12/87 12/88 12/89 12/90 12/91 12/92 12/93 12/94 12/95 12/96 12/97 12/98 12/99 12/00 12/01 12/02 12/03 12/04 12/05 12/06 12/07 12/08 12/09
W e i g
h t e d A v e r a g e D e f a u l t e d B o n d s R e c o v e r y R a t e
10
20
30
40
50
60
70
Month-YearContractions RECOVERY RATE
Mean + 2*Std. Dev (60.04 bp). Mean + 1*Std. Dev. (50.77 bp)
Mean (41.51 bp) Mean - 1*Std. Dev.(32.25 bp)
Mean - 2*Std. Dev.(22.98 bp)
13. Moody’s (2009). 14. For example, based on regression models proposed by Altman and Karlin (2009),
a 13% default rate implies a RR of about 21.5% based on the linear model and 26.5%
using the curvilinear model.
sions, and thus coincide with the peaks in the deault rate. And like the troughs or the deault rate, the RR series peakeda number o months (about 20-24) beore the onset o reces-sion in both 1990-91 and 2001. In contrast, during the recentrecession, the RR series peaked just two months beore theocial start o the recession in December 2007.
While these results conrm the negative relationshipbetween the deault rate and recovery rate, they also highlightthe unique results or 2008. As discussed earlier, the consen-sus is that the slowly evolving deault rate series that reacheda value o about 12% in August 2009 will continue to grow and reach an eventual record deault rate o about 13% by the end o 2009.13 In addition, i history is a guide to theuture, the negative impact o the higher deault rates will becompounded by urther declines in the RR.14
Summary of Historic Changes in the HY Bond MarketThe HY bond market experienced strong overall growth rom
1986 to 2008 (over 13% a year by issuing volume), but thegrowth has been cyclical. There has also been a change in themarket composition by credit rating, which could imply eitherlower credit risk due to the higher growth rate o Ba-ratedbonds or higher risk o deault in the uture because o therecord percentage o Caa-rated bonds in August, 2009.
The long-run risk-return perormance o HY bondsrelative to stocks and investment grade bonds has beenconsistent with expectations, except or the case o Caa-ratedand deaulted bonds, which experienced very high risk but
surprisingly low average rates o return. The ull periodcorrelations among numerous assets conrmed the historicalpattern wherein HY bonds have had a stronger relationshipto common stocks (especially small-cap stocks) than withinvestment-grade bonds. Besides being stronger, the HY bond-common stock relationship has also been relatively
stable over time, in contrast to the constantly shiting corre-lations between HY bonds and Treasury or investment-gradebonds.
Analysis o the volatility o HY bond returns over timeprovides three signicant ndings. First, during periods o stability in the economy and nancial markets, the volatility o HY bond returns has been very similar to that o invest-ment-grade bonds. Second, during periods o political oreconomic uncertainty, the volatility o HY bonds has becometwo or three times greater than the volatility o investment-grade bonds, approaching the volatility o common stocks.Third, the main driver o the signicant increase in the risk o
the aggregate HY bond market during periods o uncertainty appears to be Caa-rated bonds, whose risk pattern is remark-ably similar to that o small-cap common stocks.
Analysis o changes over time in the volatility o HY bonds indicates a strong relationship with the business cycle(and economic recessions). In contrast, a preliminary analysissuggested an insignicant relationship o HY bond volatility with monetary policy.
Our analysis o the CRS series or the composite HY bondmarket and or each o its rating categories nds a non-nor-
8/6/2019 Historic Changes in High Yield Bond Market
http://slidepdf.com/reader/full/historic-changes-in-high-yield-bond-market 13/15
77Journal of Applied Corporate Finance • Volume 21 Number 3 A Morgan Stanley Publication • Summer 2009
15. Moody’s (2009).
mal distribution with signiicant positive skewness—inother words, periods o exceptionally high spreads (that arenot counterbalanced by exceptionally low spreads). We alsoound signicant dierences among the CRS distributionsor the three HY bond rating categories. Finally, there was a
consistently strong relationship o the CRS with the economy, with the three major peaks occurring during or shortly atereconomic recessions.
Perhaps the most striking nding o this analysis was therecent change in the historical tendency o the CRS seriesto move together with changes in the deault rate. Near theend o 2008, there was a clear breakdown in this relationship
when the CRS reached an historic peak o 2,000 basis points,or more than ve standard deviations above its long-termmean, while the deault rate, at about 4%, was actually below its long-term average. Our analysis provided two reasons orthis break in the historical relationship between the CRS and
deaults. First was the rapid increase o the CRS caused by the extreme fight to quality during the second hal o 2008that resulted in an abnormal increase in the liquidity risk o virtually all non-Treasury securities, but was accentuated inthe case o HY bonds. Second was the use o covenant-litesecurities and other sources o nancial fexibility that appearto have enabled many HY issuers to at least deer deaults(relative to the business cycle). Also, we conrmed that therecovery rates on deaulted issues have continued their histori-cal negative correlation with deault rates during the period2008-2009.
Implications of the Historic ChangesThe continued strong growth o the HY bond market, bothin absolute terms (13% a year) and as a percent (25%) o theoverall corporate bond market, makes it both a major compo-nent o the U.S. xed income asset class and an important
source o capital or U.S. companies in the long-term. At thesame time, the cyclicality o this growth, and the tendency or liquidity to all o during periods o economic uncer-tainty, can make capital-raising dicult or issuers ratedbelow Ba. This cyclical pattern is evident in the volatility o returns, deaults, recovery rates, and credit risk spreads—allo which reach peaks or troughs during economic recessions.In such an environment, even i it is possible to issue HY bonds, the required spreads make the cost prohibitive. In2008 spreads reached peaks o 1,250 bps or Ba-rated, 1,800bps or B-rated, and 2,800 bps or Caa-rated bonds.
This diculty in issuing new bonds could cause problems
or corporate issuers, many o which ace major renancingsin the next three- to ve-years. In the meantime, the currentstate o the economy combined with a restrictive nancingclimate is expected to push the HY deault rate rom about4% in late 2008 to an estimated record o about 13% duringthe ourth quarter o 2009.15
For portolio managers, the likely continuation o thehistorical relationship o returns on HY bonds with other assetclasses implies that HY bonds will continue to behave morelike small cap stocks than Treasuries and investment gradebonds. At the same time, because the correlation between HY
Exhibit 17 Comparison of the Moody’s Trailing Twelve-Month Weighted Average Defaulted Bond Prices Per $100 Par
(Recovery Rate) Versus Moody’s Trailing Twelve-Month Speculative-Grade Default Rate (Percent-of-Issuers
Basis) Jan. 1987 - Aug. 2009
20
25
30
35
40
45
50
55
60
65
70
W e i g h t e d
A v e r a g e D e f a u l t e d B o n d s R e c o v e r y R a t e
0.0
2.0
4.0
6.0
8.0
10.0
12.0
14.0
D e f a ul t R a t e L e v e l i n
P e r c e n t
Month-Year
12/86 10/87 8/88 6/89 4/90 2/91 12/91 10/92 8/93 6/94 4/95 2/96 12/96 10/97 8/98 6/99 4/00 2/01 12/01 10/02 8/03 6/04 4/05 2/06 12/06 10/07 8/08 6/09
Recovery Rate
DEF-RATE-LEVEL
8/6/2019 Historic Changes in High Yield Bond Market
http://slidepdf.com/reader/full/historic-changes-in-high-yield-bond-market 14/15
78 Journal of Applied Corporate Finance • Volume 21 Number 3 A Morgan Stanley Publication • Summer 2009
and IG bonds is only about 0.20-0.30, an investment in HY bonds continues to promise substantial diversication benetsor IG bond investors. Further, while the correlations betweenHY bonds and common stocks indicate that HY bonds are
more like stocks than bonds, the correlation o about 0.60suggests that modest diversication is still possible withHY bonds and common stocks. Also, the dierences in thestock-HY bond correlations or bonds with dierent ratingspoints to the likelihood o “segmentation” within the HY bond asset class, with dierent kinds o bond investors gravi-tating to the dierent credit classes o HY bonds. But givenour ndings that the signicant dierences in risk betweenHY and IG bonds occur almost exclusively during recessions,and that most o the dramatic change in risk during reces-sionary periods is attributable to the Caa-rated segment o HY bonds, HY investors appear to have the option o limiting
their risks simply by avoiding the riskier classes o bonds.The dramatic changes in the CRS over the business cycle
imply large changes in the required yield or these securi-ties. In turn, this leads to very large returns, both positiveand negative, or HY bonds during and ater recessions. Forexample, the CRS that prevailed in early 2007 (about 250basis points) was one standard deviation below the long-term
mean (the limit during earlier economic expansions, as shownin Exhibit 12). Investors who interpreted this as an indica-tion o very ull pricing could have avoided the substantialnegative returns (-26%) experienced in 2008. At the same
time, knowing that the CRSs in 1990-1991 and 2001-2002 were in excess o 1,000 basis points—and thus over twostandard deviations above the long-term mean yield spread—might have been interpreted as a very positive investmentenvironment, thereby enabling HY investors to earn returnso 45% in 1991 and almost 30% in 2003. Knowledge o thispattern could have been especially benecial in late 2008, when the spread was approaching 2,000 basis points (aboutve standard deviations above the long-term mean). Sincethen, returns have exceeded 40%.
frank k. reilly is Professor of Finance at the University of Notre
Dame.
david j. wright is Professor of Finance at the University of
Wisconsin-Parkside.
james a. gentry is Emeritus Professor of Finance at the University of
Illinois at Urbana/Champaign.
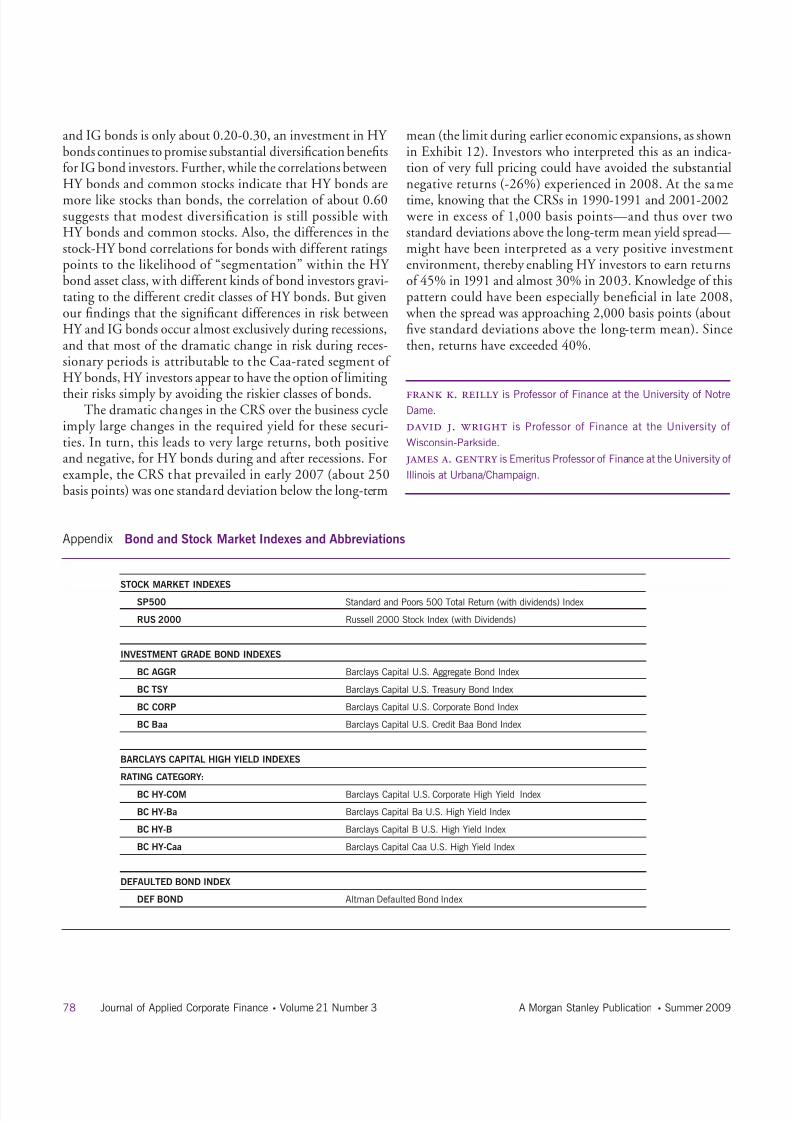
Appendix Bond and Stock Market Indexes and Abbreviations
STOCK MARKET INDEXESSP500 Standard and Poors 500 Total Return (with dividends) Index
RUS 2000 Russell 2000 Stock Index (with Dividends)
INVESTMENT GRADE BOND INDEXES
BC AGGR Barclays Capital U.S. Aggregate Bond Index
BC TSY Barclays Capital U.S. Treasury Bond Index
BC CORP Barclays Capital U.S. Corporate Bond Index
BC Baa Barclays Capital U.S. Credit Baa Bond Index
BARCLAYS CAPITAL HIGH YIELD INDEXES
RATING CATEGORY:
BC HY-COM Barclays Capital U.S. Corporate High Yield Index
BC HY-Ba Barclays Capital Ba U.S. High Yield Index
BC HY-B Barclays Capital B U.S. High Yield Index
BC HY-Caa Barclays Capital Caa U.S. High Yield Index
DEFAULTED BOND INDEX
DEF BOND Altman Defaulted Bond Index

8/6/2019 Historic Changes in High Yield Bond Market
http://slidepdf.com/reader/full/historic-changes-in-high-yield-bond-market 15/15
79Journal of Applied Corporate Finance • Volume 21 Number 3 A Morgan Stanley Publication • Summer 2009
References Altman, Edward I. and Scott Nammacher, “The DeaultRate Experience on High-Yield Corporate Debt,” Financial Analysts Journal , 41, no. 4 (July/August, 1985), pp. 25-41.
Altman, Edward I. “Measuring Corporate Bond Mortality and Perormance,” Journal of Finance , 44, No. 4 (September1989), pp. 909-922.
Altman, Edward I. “Revisiting the High-Yield BondMarket,” Financial Management , 21, No. 2 (Summer 1992),pp. 78-92.
Altman, Edward I. “Setting the Record Straight on Junk Bonds: A Review o the Research on Deault Ratesand Returns,” Journal of Applied Corporate Finance , 3, No. 2(Summer 1990), pp. 82-95.
Altman, Edward I. and V.M. Kishore, “Almost Every-thing You Wanted to Know About Recoveries on Deaulted
Bonds,” Financial Analysts Journal , 52, No. 6 (November/December 1996), pp. 57-64.
Altman, Edward I., B. Brady, A. Rasti, and A. Sironi,“The Link Between Deault and Recovery Rates: Theory,Empirical Evidence, and Implications,” Journal of Business ,78, No. 6 (December 2005), pp. 2203-2227.
Altman, Edward I. and Brenda J. Karlin, “Deaults andReturns in the High-Yield Bond Market: The Year 2008 inReview and Outlook,” New York University Salomon Center,Leonard N. Stern School o Business (February, 2009).
Asquith, P., D.W. Mullins, Jr. and E.D. Wol. “Origi-nal Issue High Yield Bonds: Aging Analyses o Deaults,
Exchanges, and Calls,” Journal o Finance , 44, No. 4 (Septem-ber 1989), pp. 923-952.
Barclays Capital. “The Benchmark in Fixed Income:Barclays Capital Indices,” (December, 2008)
Barnhill, Theodore , Frederick L. Joutz and William F.Maxwell, “Modeling the Yields on Noninvestment – GradeBonds,” in Theodore Barnhill, Jr., William Maxwell, andMark Shenkman, eds. High Yield Bonds, New York: McGraw-Hill, 1999.
Blume, Marshall E., and Donald B. Keim. “RealizedReturns and Deaults on Low-Grade Bonds: The Cohort o 1977 and 1978.” Financial Analysts Journal , 47, No. 2 (March/
April 1991a), pp. 63-72.Blume, Marshall E., and Donald B. Keim. “The Risk andReturn o Low-Grade Bonds: An Update.” Financial Analysts Journal , 47, No. 5 (September/October 1991b), pp. 85-89.
Cheung, Rayner, Joseph C. Bencivenga, and Frank J.Fabozzi. “Original Issue High Yield Bonds: Historical Returnand Deault Experiences 1977-1989.” The Journal of Fixed Income , 2, No. 2 (September 1992), pp. 58-76.
Fridson, Martin S. “Do High-Yield Bonds Have anEquity Component?” Financial Management , 23, No. 2(Summer 1994), pp. 82-84.
Fridson, Martin S. “High Yield Indexes and Benchmark Portolios.” The Journal of Portfolio Management , 18, No. 2(Winter 1992), pp. 77-83.
Fridson, Martin S. and Jerey A. Bersh. “Spread Versus
Treasuries as a Market-Timing Tool or High-Yield Investors.” Journal of Fixed Income , 3, No. 2 (June 1994), pp. 63-69.
Fridson, Martin S. and Jon G. Jonsson, “Spread VersusTreasuries and the Riskiness o High-Yield Bonds.” Journal o Fixed Income , 4, No. 4 (December 1995), pp. 79-88.
Fridson, Martin S. “The State o the High Yield BondMarket: Overshooting or Return to Normalcy?” Journal of Applied Corporate Finance , 7, No. 1 (Spring 1994), pp.85-97.
Frye, John, “Depressing Recoveries,” Risk (November2000).
Garman, M. Christopher and Martin S. Fridson,
“Monetary Inluences on the High Yield Spread VersusTreasuries,” In Theodore Barnhill Jr., William Maxwell andMark Shenkman, eds. High Yield Bonds . New York: McGraw-Hill, 1999.
Jensen, Gerald R., Robert R. Johnson, and Jerey Mercer,The Role of Monetary Policy in Investment Management ,Charlottesville, VA: The Research Foundation o AIMR,2000.
Moody’s, “Deault and Recovery Rates o CorporateBond Issuers: 1920-2008. Moody’s Investor Services, New York (February 2009).
Moody’s “August Deault Report,” Moody’s Investor
Services, New York (September 8, 2009).Reilly, Frank K. and David J. Wright. “An Analysis o
High-Yield Bond Benchmarks.” The Journal o Fixed Income ,3, No. 4 (March 1994), pp. 6-25.
Reilly, Frank K. and David J. Wright. “An Analysis o High Yield Bond Indices.” In Theodore M. Barnhill, Jr., William F. Maxwell, and Mark R. Shenkman, eds., HighYield Bonds . New York: McGraw-Hill, 1999.
Reilly, Frank K. and David J. Wright, “Unique Risk-Return Characteristics o High-Yield Bonds.” Journal o Fixed Income , 20, No. 3 (September 2001): 65-82.
Reilly, Frank K. and Keith C. Brown, Investment Analysis
and Portolio Management , 9th
ed., Mason, OH: South-West-ern Cengage Learning, 2009.Shane, H. “Comovements o Low-Grade Debt and
Equity Returns o Highly Leveraged Firms.” The Journal of Fixed Income , 3, No. 4 (March 1994), pp. 79-89.
Standard & Poor’s, Ratings Direct, “U.S. CorporateDeault Rate Forecasted to Reach All-Time High o 13.9%in 2009.” (January 23, 2009).