Embed Size (px)
Citation preview

Historical and contemporary gene dispersal in wild carrot(Daucus carota ssp. carota) populations
Jun Rong1,*, Stef Janson1, Mikihisa Umehara2, Michiyuki Ono3 and Klaas Vrieling1
1Plant Ecology and Phytochemistry, Institute of Biology Leiden, Leiden University, PO Box 9505, 2300 RA Leiden,The Netherlands, 2RIKEN Plant Science Center, Tsurumi, Yokohama 230-0045, Japan and 3Gene Research Center,
University of Tsukuba, Tsukuba, Ibaraki 305-8572, Japan* For correspondence. E-mail [email protected] or [email protected]
Received: 22 October 2009 Returned for revision: 5 January 2010 Accepted: 19 April 2010 Published electronically: 21 June 2010
† Background and Aims Wild carrot is the ancestor of cultivated carrot and is the most important gene pool forcarrot breeding. Transgenic carrot may be released into the environment in the future. The aim of the presentstudy was to determine how far a gene can disperse in wild carrot populations, facilitating risk assessmentand management of transgene introgression from cultivated to wild carrots and helping to design sampling strat-egies for germplasm collections.† Methods Wild carrots were sampled from Meijendel and Alkmaar in The Netherlands and genotyped with 12microsatellite markers. Spatial autocorrelation analyses were used to detect spatial genetic structures (SGSs).Historical gene dispersal estimates were based on an isolation by distance model. Mating system and contempor-ary pollen dispersal were estimated using 437 offspring of 20 mothers with different spatial distances and a cor-related paternity analysis in the Meijendel population.† Key Results Significant SGSs are found in both populations and they are not significantly different from eachother. Combined SGS analysis indicated significant positive genetic correlations up to 27 m. Historical gene dis-persal sg and neighbourhood size Nb were estimated to be 4–12 m [95 % confidence interval (CI): 3–25] and42–73 plants (95 % CI: 28–322) in Meijendel and 10–31 m (95 % CI: 7–1) and 57–198 plants (95 % CI:28–1) in Alkmaar with longer gene dispersal in lower density populations. Contemporary pollen dispersalfollows a fat-tailed exponential-power distribution, implying pollen of wild carrots could be dispersed byinsects over long distance. The estimated outcrossing rate was 96 %.† Conclusions SGSs in wild carrots may be the result of high outcrossing, restricted seed dispersal and long-dis-tance pollen dispersal. High outcrossing and long-distance pollen dispersal suggest high frequency of transgeneflow might occur from cultivated to wild carrots and that they could easily spread within and betweenpopulations.
Key words: Daucus carota, gene flow, isolation by distance, microsatellite, neighbourhood size, outcrossingrate, pollen dispersal, transgene escape.
INTRODUCTION
As one of the most popular vegetables cultivated worldwideand the main source of dietary provitamin A, cultivatedcarrot (Daucus carota ssp. sativus) is attracting increasingattention for genetic modifications. Genetically modified(GM) carrots have already been developed with antifungalactivities, herbicide and salt tolerance (Chen and Punja,2002; Kumar et al., 2004), and increased nutritional benefits(Morris et al., 2008), and are also used for the production ofdrugs (Imani et al., 2002). Although there is no commercialGM carrot permitted at present, it may be released into theenvironment in the near future. However, there are potentialenvironmental risks with GM carrot. Would transgene intro-gression occur from GM carrot into its wild relatives,leading to ecological and evolutionary consequences innatural populations?
Introgression is the permanent incorporation of genes fromone set of differentiated populations (species, subspecies,races, etc.) into another (Stewart et al., 2003). Introgression
of genes from crops to wild relatives can be divided intothree stages. First, hybridization occurs through gene flowfrom crops into wild relatives. Secondly, local establishmentof introduced genes occurs through hybrid formation and back-crossing with wild relatives. Thirdly, introduced genes move todistant populations through gene flow among populations.Therefore, the process of introgression may involve severalhybrid generations, depending on the fitness of introducedgenes in natural populations and gene flow within andamong populations. Introgression from cultivated plantspecies into their wild relatives may lead to evolutionaryeffects on wild populations (Ellstrand et al., 1999; Ellstrand,2003). The persistence of new or locally rare alleles in wildgene pools may considerably change the genetic diversityand structure of wild populations (Song et al., 2006; Xuet al., 2006). If some specific genes from crops promote thefitness of wild recipients, the introgression into wild popu-lations, especially for weed species, may contribute to theevolution of more aggressive weeds (Ellstrand et al., 1999;Snow et al., 2001; Ellstrand, 2003). In addition, the
# The Author 2010. Published by Oxford University Press on behalf of the Annals of Botany Company. All rights reserved.
For Permissions, please email: [email protected]
Annals of Botany 106: 285–296, 2010
doi:10.1093/aob/mcq108, available online at www.aob.oxfordjournals.org
Dow
nloaded from https://academ
ic.oup.com/aob/article/106/2/285/199515 by guest on 22 D
ecember 2021

incorporation of genes from domesticated plant species mayalso be implicated in the extinction of some local wild popu-lations (Ellstrand et al., 1999; Ellstrand, 2003). For instance,the gene flow from cultivated rice contributed to the decreasein fertility of seed and pollen in wild rice (Oryza rufipogon)and probably led to the extinction of wild rice in Taiwan(Ellstrand, 2003; Song et al., 2005). Therefore, studies ofcrop-to-wild hybridization and introgression can help ourunderstanding of the evolution of aggressive weeds and theextinction of rare species (Ellstrand et al., 1999; Ellstrand,2003).
Wild carrot (D. carota ssp. carota), also known as QueenAnne’s lace, is native to temperate regions of Europe andwestern Asia, and has been introduced into America, NewZealand, Australia and Japan (Hauser et al., 2004; Umeharaet al., 2005). It is a serious weed in North America andJapan (Umehara et al., 2005; Magnussen and Hauser, 2007).Umehara et al. (2005) indicated it could rapidly expand insunny areas and wastelands disturbed by human activity. Iftransgenes with selective advantages (e.g. herbicide tolerance,disease resistance) escape from GM carrot into wild carrot,they might lead to wild carrot becoming a more serious weed.
Wild carrot is the ancestor of cultivated carrot. They belongto the same species (D. carota), and can easily hybridize witheach other in the field with apparently no barrier to crossing(Hauser and Bjorn, 2001; Hauser, 2002). Spontaneous hybrid-ization between wild carrot and earlier yellow- and white-rooted cultivated carrots was suggested to be involved in theorigin of western, orange-rooted carrots (Heywood, 1983). Itis well known that pollen dispersal from adjacent wildcarrots may lead to the ‘contamination’ of commercial seedsin cultivated carrot fields (Wijnheijmer et al., 1989; Hauserand Bjorn, 2001; Hauser, 2002). Both wild and cultivatedcarrots are predominantly cross-pollinated by a large diversityof insects (Koul et al., 1989; Lamborn and Ollerton, 2000).Therefore, gene flow frequency between cultivated and wildcarrot may be very high when both spatial distribution andflowering are overlapping in the field. Wild carrot populationsoften occur next to cultivated carrot fields (Umehara et al.,2005; Magnussen and Hauser, 2007). In Denmark, althoughcommercial seed production of cultivated carrot has ceaseddue to unstable yields (Hauser et al., 2004), flowering carrotscan still be found in most of the carrot root production fieldsand gene flow via pollen and seed dispersal between cultivatedand wild carrot is probably rather frequent (Hauser and Bjorn,2001). Some of these flowering plants (‘bolters’) might orig-inate from the hybrids between cultivated and wild carrotinheriting a potential for flowering in their first year becausein the southern seed production regions wild carrot is annual(Hauser et al., 2004). The Netherlands has a wide distributionof wild carrot and a long history of carrot cultivation. Today’sorange-coloured carrot was first observed in The Netherlandsin the 17th or at the beginning of the 18th century, and TheNetherlands was the main centre of carrot breeding for atime (Stein and Nothnagel, 1995). Wijnheijmer et al. (1989)found that wild carrots adjacent to Dutch seed productionfields of cultivated carrot were intermediate to typical wildand cultivated plants in morphology, suggesting hybridizationsoccurred between wild and cultivated carrot. To summarize,previous studies suggest that if GM carrot is released into
the environment, transgenes could move into wild carrot popu-lations through gene flow from both root and seed productionfields. However, little is known about the patterns of fine-scalegenetic structure, mating system and gene dispersal in wildcarrot and their dynamics within and among populations,which provide the baseline knowledge for assessing and mana-ging risks of transgene introgression in carrot. In addition, wildcarrot is the most important gene pool for carrot breeding. Forexample, the most widely used form of male sterility for pro-duction of commercial carrot hybrids, ‘petaloid’ male sterility,was first discovered in wild carrot and then transferred into cul-tivated carrot inbred lines (Simon et al., 2007). Introducinggenetic diversity from wild carrot can expand the genetic vari-ation of cultivated carrot and therefore facilitate the improve-ment of cultivation traits (Simon et al., 2007), for examplepest and disease resistance and cold tolerance. Therefore,knowledge of spatial genetic structures in wild carrot popu-lations will also help to design appropriate sampling strategiesfor the purpose of germplasm collections.
Spatial genetic structure (SGS) is the non-random distri-bution of genotypes, which may result from limited gene dis-persals at a fine spatial scale (Vekemans and Hardy, 2004).The most popular way to analyse the patterns of fine-scalegenetic structures within populations is via the spatial autocor-relation method, calculating the correlations between geneticdistances using multi-allele, multi-locus genotypic data ofindividuals and their geographical distances (Smouse et al.,2008). Gene dispersal and neighbourhood size can be esti-mated from SGS analysis. The standard method for indirectlyestimating gene dispersal and neighbourhood size withinpopulations is based on the model of isolation by distance(IBD) for a continuous population (Hardy et al., 2006).However, the SGS and gene dispersal estimated either byspatial autocorrelation or IBD are historical due to many gen-erations of gene dispersal. The IBD method assumes equili-brium between genetic drift and gene dispersal (Hardy et al.,2006), and therefore it may be of limited value when dealingwith contemporary ecological processes and the results maynot reflect current patterns of gene flow (Robledo-Arnuncioet al., 2006). For instance, Oddou-Muratorio and Klein(2008) compared historical and contemporary estimates ofgene flow in a tree species using the IBD model and parentageassignment method, respectively, and found that the contem-porary estimate was about two-fold smaller than the historicalestimate, possibly reflecting a recent restriction in the scale ofgene flow in a context of increasing forest fragmentation. Theyargued that historical estimates had low precision and sufferedfrom the uncertainty in the effective density, and the combi-nation of historical and contemporary estimates couldprovide clearer interpretations of gene dispersal patterns(Oddou-Muratorio and Klein, 2008). However, because con-temporary estimation using direct parentage assignmentrequires exhaustive sampling, it may underestimate long-distance gene dispersal if some potential parent samples aremissing (Oddou-Muratorio and Klein, 2008). As they used along-lived tree species, it was difficult to quantify temporalvariation in density especially as intensive logging couldleading to low precision of the historical estimate(Oddou-Muratorio and Klein, 2008). By contrast, Lebloiset al. (2004) showed that the historical estimate based on
Rong et al. — Gene dispersal in wild carrot populations286
Dow
nloaded from https://academ
ic.oup.com/aob/article/106/2/285/199515 by guest on 22 D
ecember 2021

SGS was robust to relatively recent temporal and spatial demo-graphic fluctuations. Therefore, additional studies are neededto compare the historical and contemporary estimates ofgene dispersal. Robledo-Arnuncio et al. (2006) developed amethod to indirectly estimate the current pollen dispersalfrom mother–offspring genotypic data based on a normalizedmeasure of correlated paternity between the offspring ofmother plants with different spatial distances. The methoddoes not require the costly mapping and genotyping of allpotential pollen donors as the direct paternity-basedapproaches, therefore allowing the sampling spatial scale tobe extended at low cost to gain a better indication of long-distance dispersal (Robledo-Arnuncio et al., 2007). Slavovet al. (2009) showed that the indirect correlated paternitymethod could achieve similar pollen dispersal curve estimatesas direct paternity analysis. As wild carrot is a short-livedmonocarpic species (Lacey, 1988), that is generally annual(Wijnheijmer et al., 1989) or biennial in The Netherlands, itis easy to quantify density. Although there is no informationabout recent demographic events of wild carrots at the studysites that could lead to changes in current gene flow, the his-torical and contemporary gene flow estimates should be inclose agreement to each other if the historical estimate isindeed sensitive to recent demographic events (Leblois et al.,2004). Moreover, the gene dispersal estimated by the IBDmodel is the total gene flow and it is difficult to distinguishpollen and seed dispersals from each other, especially usingnuclear markers (Austerlitz et al., 2004). To assess the risksof transgene introgression, knowing the current gene flowpattern by pollen dispersal is essential for tracing the dynamicsof transgenes in wild populations. In addition, to establish IBDto minimize the level of transgene escape into wild populationsor possible ‘contamination’ from wild relatives in cultivar seedproduction fields, it is necessary to know how far the pollengrains could travel and result in gene flow. The present studyestimated the current pollen dispersal curve in wild carrotsand compared the results with historical gene dispersal. Asthere is no accurate outcrossing rate for wild carrot, the out-crossing rate was also directly estimated in wild carrot.
The main questions were: (1) Do fine-scale genetic struc-tures occur in wild carrot populations? (2) What is themating system of wild carrots? (3) How far can genes dispersein wild carrot populations?
MATERIALS AND METHODS
Plant material
Two different habitats were chosen in The Netherlands for thepresent study, Meijendel and Alkmaar. Meijendel, SouthHolland, is a part of a dune nature reserve with low levels ofhuman interference and a sandy soil. Wild carrot Daucuscarota L. ssp. carota is well distributed in a wild populationat Meijendel (52 89′19–24′′N, 4 822′44–52′′E) with anaverage density (D of flowering plants) of ≥0.4056 m22.Every 5–10 m along a cross transect (210 m in one directionand 77 m perpendicular) (Fig. 1), 44 leaf samples were col-lected for DNA extraction, microsatellite genotyping andSGS analysis in September, 2007. Besides the leaf samples,umbels with mature seeds were collected from 20 wild carrot
mother plants in order to estimate the contemporary orcurrent pollen dispersal and mating system in wild carrots.The spatial positions of all the samples were recorded andmapped. About 100 seeds were randomly chosen from eachof the 20 mother plants and germinated in Petri dishes in aclimate room (16-h day/8-h night, temperature 20 8C, relativehumidity 70 %). The overall germination rate was 77+ 16 %(mean+ s.d.). About 20–26 seedlings were randomlychosen from each mother plant for DNA extraction and micro-satellite genotyping.
The wild carrot population of Alkmaar, North Holland(52 837′13–20′′N, 4 851′23–59′′E), is along the verge of aroad next to cultivation fields with relatively high disturbancefrom human activities. The soil here is clayey. The wild carrotswere distributed at a relatively low average density (D) ofabout 0.0982 m22. Along a transect of 713 m (Fig. 2), 43leaf samples were collected for DNA extraction, microsatellitegenotyping and SGS analysis in July, 2008.
Sampling inAlkmaar(WAL)
Cultivation fields
Cultivation fields100 m
N
FI G. 2. Illustration of the sampling from a wild carrot population in Alkmaar(WAL), North Holland, The Netherlands. Small crosses indicate the positions
of samples.
Sampling inMeijendel(WM)
N
25 m
FI G. 1. Illustration of the sampling from a wild carrot population in Meijendel(WM), South Holland, The Netherlands. Small crosses indicate the positions
of samples.
Rong et al. — Gene dispersal in wild carrot populations 287
Dow
nloaded from https://academ
ic.oup.com/aob/article/106/2/285/199515 by guest on 22 D
ecember 2021
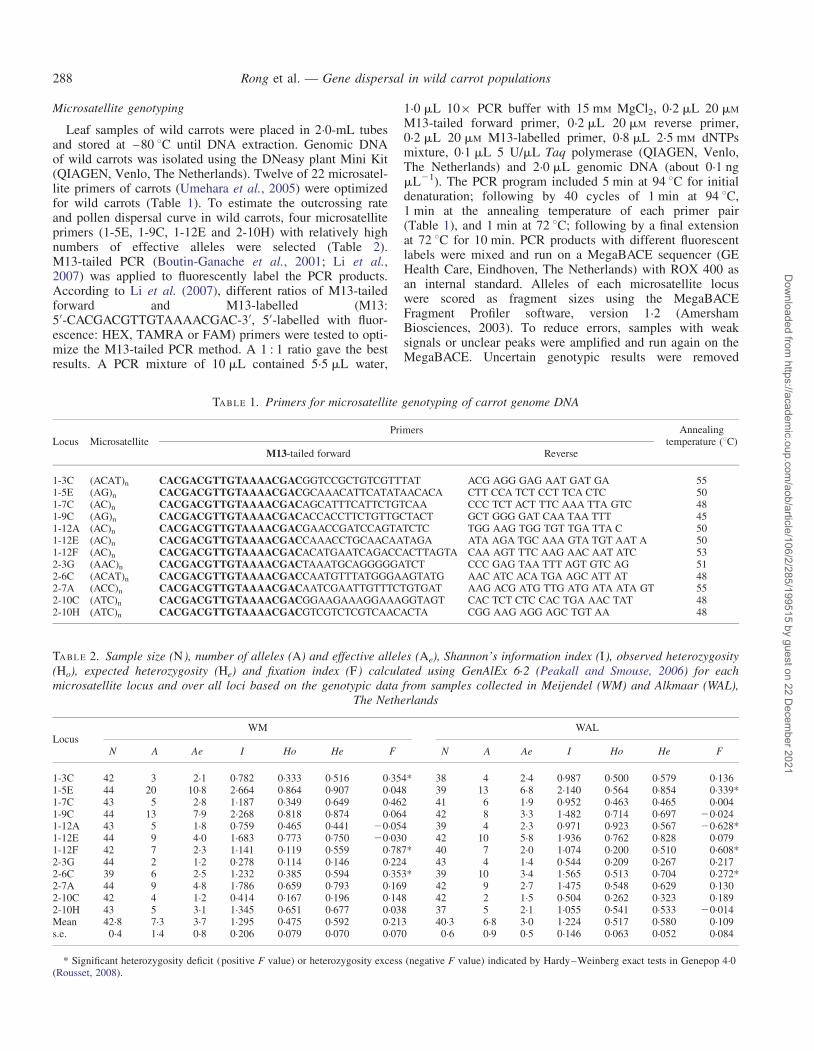
Microsatellite genotyping
Leaf samples of wild carrots were placed in 2.0-mL tubesand stored at –80 8C until DNA extraction. Genomic DNAof wild carrots was isolated using the DNeasy plant Mini Kit(QIAGEN, Venlo, The Netherlands). Twelve of 22 microsatel-lite primers of carrots (Umehara et al., 2005) were optimizedfor wild carrots (Table 1). To estimate the outcrossing rateand pollen dispersal curve in wild carrots, four microsatelliteprimers (1-5E, 1-9C, 1-12E and 2-10H) with relatively highnumbers of effective alleles were selected (Table 2).M13-tailed PCR (Boutin-Ganache et al., 2001; Li et al.,2007) was applied to fluorescently label the PCR products.According to Li et al. (2007), different ratios of M13-tailedforward and M13-labelled (M13:5′-CACGACGTTGTAAAACGAC-3′, 5′-labelled with fluor-escence: HEX, TAMRA or FAM) primers were tested to opti-mize the M13-tailed PCR method. A 1 : 1 ratio gave the bestresults. A PCR mixture of 10 mL contained 5.5 mL water,
1.0 mL 10× PCR buffer with 15 mM MgCl2, 0.2 mL 20 mM
M13-tailed forward primer, 0.2 mL 20 mM reverse primer,0.2 mL 20 mM M13-labelled primer, 0.8 mL 2.5 mM dNTPsmixture, 0.1 mL 5 U/mL Taq polymerase (QIAGEN, Venlo,The Netherlands) and 2.0 mL genomic DNA (about 0.1 ngmL21). The PCR program included 5 min at 94 8C for initialdenaturation; following by 40 cycles of 1 min at 94 8C,1 min at the annealing temperature of each primer pair(Table 1), and 1 min at 72 8C; following by a final extensionat 72 8C for 10 min. PCR products with different fluorescentlabels were mixed and run on a MegaBACE sequencer (GEHealth Care, Eindhoven, The Netherlands) with ROX 400 asan internal standard. Alleles of each microsatellite locuswere scored as fragment sizes using the MegaBACEFragment Profiler software, version 1.2 (AmershamBiosciences, 2003). To reduce errors, samples with weaksignals or unclear peaks were amplified and run again on theMegaBACE. Uncertain genotypic results were removed
TABLE 2. Sample size (N), number of alleles (A) and effective alleles (Ae), Shannon’s information index (I), observed heterozygosity(Ho), expected heterozygosity (He) and fixation index (F) calculated using GenAlEx 6.2 (Peakall and Smouse, 2006) for eachmicrosatellite locus and over all loci based on the genotypic data from samples collected in Meijendel (WM) and Alkmaar (WAL),
The Netherlands
LocusWM WAL
N A Ae I Ho He F N A Ae I Ho He F
1-3C 42 3 2.1 0.782 0.333 0.516 0.354* 38 4 2.4 0.987 0.500 0.579 0.1361-5E 44 20 10.8 2.664 0.864 0.907 0.048 39 13 6.8 2.140 0.564 0.854 0.339*1-7C 43 5 2.8 1.187 0.349 0.649 0.462 41 6 1.9 0.952 0.463 0.465 0.0041-9C 44 13 7.9 2.268 0.818 0.874 0.064 42 8 3.3 1.482 0.714 0.697 20.0241-12A 43 5 1.8 0.759 0.465 0.441 20.054 39 4 2.3 0.971 0.923 0.567 20.628*1-12E 44 9 4.0 1.683 0.773 0.750 20.030 42 10 5.8 1.936 0.762 0.828 0.0791-12F 42 7 2.3 1.141 0.119 0.559 0.787* 40 7 2.0 1.074 0.200 0.510 0.608*2-3G 44 2 1.2 0.278 0.114 0.146 0.224 43 4 1.4 0.544 0.209 0.267 0.2172-6C 39 6 2.5 1.232 0.385 0.594 0.353* 39 10 3.4 1.565 0.513 0.704 0.272*2-7A 44 9 4.8 1.786 0.659 0.793 0.169 42 9 2.7 1.475 0.548 0.629 0.1302-10C 42 4 1.2 0.414 0.167 0.196 0.148 42 2 1.5 0.504 0.262 0.323 0.1892-10H 43 5 3.1 1.345 0.651 0.677 0.038 37 5 2.1 1.055 0.541 0.533 20.014Mean 42.8 7.3 3.7 1.295 0.475 0.592 0.213 40.3 6.8 3.0 1.224 0.517 0.580 0.109s.e. 0.4 1.4 0.8 0.206 0.079 0.070 0.070 0.6 0.9 0.5 0.146 0.063 0.052 0.084
* Significant heterozygosity deficit (positive F value) or heterozygosity excess (negative F value) indicated by Hardy–Weinberg exact tests in Genepop 4.0(Rousset, 2008).
TABLE 1. Primers for microsatellite genotyping of carrot genome DNA
Locus MicrosatellitePrimers Annealing
temperature (8C)M13-tailed forward Reverse
1-3C (ACAT)n CACGACGTTGTAAAACGACGGTCCGCTGTCGTTTAT ACG AGG GAG AAT GAT GA 551-5E (AG)n CACGACGTTGTAAAACGACGCAAACATTCATATAACACA CTT CCA TCT CCT TCA CTC 501-7C (AC)n CACGACGTTGTAAAACGACAGCATTTCATTCTGTCAA CCC TCT ACT TTC AAA TTA GTC 481-9C (AG)n CACGACGTTGTAAAACGACACCACCTTCTGTTGCTACT GCT GGG GAT CAA TAA TTT 451-12A (AC)n CACGACGTTGTAAAACGACGAACCGATCCAGTATCTC TGG AAG TGG TGT TGA TTA C 501-12E (AC)n CACGACGTTGTAAAACGACCAAACCTGCAACAATAGA ATA AGA TGC AAA GTA TGT AAT A 501-12F (AC)n CACGACGTTGTAAAACGACACATGAATCAGACCACTTAGTA CAA AGT TTC AAG AAC AAT ATC 532-3G (AAC)n CACGACGTTGTAAAACGACTAAATGCAGGGGGATCT CCC GAG TAA TTT AGT GTC AG 512-6C (ACAT)n CACGACGTTGTAAAACGACCAATGTTTATGGGAAGTATG AAC ATC ACA TGA AGC ATT AT 482-7A (ACC)n CACGACGTTGTAAAACGACAATCGAATTGTTTCTGTGAT AAG ACG ATG TTG ATG ATA ATA GT 552-10C (ATC)n CACGACGTTGTAAAACGACGGAAGAAAGGAAAGGTAGT CAC TCT CTC CAC TGA AAC TAT 482-10H (ATC)n CACGACGTTGTAAAACGACGTCGTCTCGTCAACACTA CGG AAG AGG AGC TGT AA 48
Rong et al. — Gene dispersal in wild carrot populations288
Dow
nloaded from https://academ
ic.oup.com/aob/article/106/2/285/199515 by guest on 22 D
ecember 2021

(about 4 % from each microsatellite locus) and regarded asmissing data. In a few cases alleles were cloned using TOPOTA Cloning Kit (Invitrogen, Merelbeke, Belgium) andsequenced (MACROGEN, Amsterdam, The Netherlands) toconfirm whether the fragments were from the microsatellitelocus.
Data analysis
Summary of the microsatellite loci. The number of alleles (A)and effective alleles (Ae), Shannon’s information index (I )(I ¼ 2Spilnpi where pi is the frequency of the ith allele),observed heterozygosity (Ho), expected heterozygosity (He)and fixation index (F ¼ 1 – Ho/He) were calculated for eachmicrosatellite locus and over all loci based on the genotypicdata of samples collected from Meijendel (WM) andAlkmaar (WAL) using GenAlEx 6.2 (Peakall and Smouse,2006). The population-level outcrossing rate t was estimatedwith the mean fixation index [t ¼ (1 – F )/(1 + F )]. Theexact tests for Hardy–Weinberg equilibrium (HWE) and thetests for linkage disequilibrium were performed usingGenepop 4.0 (Rousset, 2008). The Markov chain parametersfor all tests were 10 000 dememorizations, 1000 batches and10 000 iterations per batch. Sequential Bonferroni tests wereused to determine levels of significance (Rice, 1989).
Spatial autocorrelation analysis. Spatial autocorrelation ana-lyses were performed using GenAlEx 6.2 (Peakall andSmouse, 2006). Tests for the significance of a single spatialcorrelation within a site and spatial genetic heterogeneityamong sites (Smouse et al., 2008) were performed via‘Advanced’ spatial options in GenAlEx 6.2, i.e. Adv SinglePop and Adv Multiple Pops (no. of permutations: 999; no.of bootstraps: 1000). Distance classes were selected witheven sample sizes so that the confidence limits were more orless the same in each one.
Historical gene dispersal, Sp statistic and mating system.Pairwise kinship coefficients Fij were calculated usingSPAGeDi 1.2 (Hardy and Vekemans, 2002) for each microsa-tellite locus and over all loci using the same settings of dis-tance classes as in GenAlEx 6.2. Because some loci showeda significant heterozygosity deficit (Table 2) and the genotypesof these loci did not follow Hardy–Weinberg proportions, thepairwise kinship coefficients were computed as correlationcoefficients between allelic states according to J. Nason(Loiselle et al., 1995; Vekemans and Hardy, 2004). Numbersof permutations were 1000 (1 % significance level). Meanjackknife estimators and jackknife standard errors were com-puted for multilocus average statistics. The standard deviationsof gene dispersal sg were estimated according to Vekemansand Hardy (2004) and Hardy et al. (2006) by SPAGeDi 1.2given different effective densities (De). The De depending onthe variance in reproductive success among individuals andthrough time can be approximated as D ¼ Ne/N where Ne/Nis the ratio of the effective over the census population sizesand D is the census population density (Vekemans andHardy, 2004). Previous studies have suggested that Ne/N inplant populations typically ranges between 0.1 and 0.5(Frankham, 1995). Therefore, values of De in wild carrotsprobably range from D/10 to D/2. Neighbourhood sizes were
calculated as: Nb ¼ 4pDesg2 (Hardy et al., 2006). The Sp stat-
istics for WM and WAL were calculated as: Sp ¼ b / (F1 – 1),where F1 was the mean of kinship coefficient Fij between indi-viduals in the first distance class, and in two-dimensionalspace b was the restricted regression slope of Fij on ln(rij)(natural logarithm of distance) in the range sg , rij , 20sg
(Vekemans and Hardy, 2004; Hardy et al., 2006). Rousset(1999) showed that in one-dimensional space genetic differen-tiation should depend on distance rather than the logarithm ofdistance. The regression of Fij on ln(rij) fits better than thoseon rij in both WM and WAL, suggesting that wild carrots inWAL might be distributed not only along the road sides butalso on the verges of cultivation fields and/or ditches in two-dimensional space (Fig. 2). The Sp statistics can be compareddirectly with other species to provide information over themating system (Vekemans and Hardy, 2004). For confirmation,the mating system of wild carrots was estimated directly basedon the mother–offspring genotypic data (WM only) usingMLTR for Windows, version 3.3 (Ritland, 2002). Allele fre-quencies were assumed to be homogenous among and withinfamilies (no group existed among and within families).Standard errors of estimates were calculated based upon1000 bootstraps by re-sampling families. The Newton–Raphson (NR) numerical method was chosen for themaximum-likelihood estimates. Whether or not allele frequen-cies in pollen and ovule were set to be equal did not affect theresults.
Current pollen dispersal. Current pollen dispersal was estimatedaccording to the methods described by Robledo-Arnuncioet al. (2006) using the KINDIST program of POLDISP 1.0c(Robledo-Arnuncio et al., 2007). The methods were basedon calculating the probability of paternal identity within andamong maternal sibships, i.e. Qo, the probability of a motherplant mating twice with the same father, and Q(z), the prob-ability of two mother plants at a distance z apart mating withthe same father (Robledo-Arnuncio et al., 2006). Qo andQ(z) are the functions of effective density (De) and probabilitydensity function of pollen dispersal ( p). The pollen probabilitydensity function p(u; x, y) describes the probability of a motherplant at (0, 0) receiving a single pollen grain from coordinates(x, y) with u being a set of parameters for different distri-butions. In KINDIST, u includes pollen dispersal curves withtwo bivariate one-parameter dispersal distributions (normaland exponential) and three bivariate two-parameter dispersaldistributions (exponential-power, geometric and two-dimensional Student’s t) (Austerlitz et al., 2004). InKINDIST, the genetic structure of the pollen pool is quantifiedby (Robledo-Arnuncio et al., 2006):
Cexp
ij (u, zij) =Q(zij)�Qo
=�+1
−1
�+1
−1p(u; x, y)p(u; x − zij, y)dxdy�+1
−1
�+1
−1p2(u; x, y)dxdy
(1)
which cancels the effective density and is only a function ofpollen dispersal. The pairwise observed C can be calculatedfrom Qo and Q(z) based on the computation of pairwisekinship coefficients (F ) between the paternal gametic
Rong et al. — Gene dispersal in wild carrot populations 289
Dow
nloaded from https://academ
ic.oup.com/aob/article/106/2/285/199515 by guest on 22 D
ecember 2021

genotypes of offspring pairs (Robledo-Arnuncio et al., 2006).Thus, the pollen dispersal parameters (u) can be estimated byminimizing the error sums of squares between observed andexpected C for the choice of those parameters(Robledo-Arnuncio et al., 2006). The average pollen dispersaldistance can be calculated as (Klein et al., 2006):
�r =∫+1
0
rp(u; r)2prdr (2)
where r ¼p
(x2 + y2). The cumulative probability within dis-tance r can be calculated as:
P =∫r
0
p(u; r)2prdr (3)
The estimate of the differentiation among pollen pools ofdifferent mothers, i.e. the observed Fft value (Austerlitzet al., 2004), was calculated using the TWOGENERprogram within POLDISP 1.0c (Robledo-Arnuncio et al.,2007). With the values of the dispersal parameters (u) esti-mated by KINDIST, the effective density of WM was esti-mated using TWOGENER by finding the value thatminimized the squared error between the observed andexpected Fft values (Austerlitz et al., 2004;Robledo-Arnuncio et al., 2007).
RESULTS
Summary of the microsatellite loci
Genotypic results for the 12 microsatellites are summarized inTable 2. All loci were polymorphic in both WM and WAL.Wild carrot had similar levels of genetic diversity I in bothWM and WAL (Table 2). However, the fixation index F washigher in WM, suggesting a higher level of biparental inbreed-ing than that in WAL (Table 2). The population-level outcross-ing rate t estimated from the mean fixation index (F ) was0.648+ 0.101 in WM and 0.803+ 0.148 in WAL (meansare given +s.e. unless indicated otherwise). According tothe exact test of HWE, loci 1-3C, 1-12F and 2-6C had a signifi-cant heterozygosity deficit in WM; loci 1-5E, 1-12F and 2-6Cshowed a significant heterozygosity deficit in WAL; and locus1-12A showed a significant heterozygosity excess in WAL(Table 2). The global HWE tests indicated that both WMand WAL had a significant deficit of heterozygotes (P ,0.0001). Except for loci 1-9C and 1-12E in WM, locishowed no linkage to each other in both WM and WAL.
Spatial autocorrelation analysis
The spatial autocorrelations were highly significant (P ¼0.001) in both WM and WAL. Significantly positive geneticcorrelations were found in the first distance class (0–14 m)(Fig. 3). Both the single class t-test and multiclass v testshowed no significant difference of the spatial autocorrelationpatterns in different distance classes and over all distanceclasses between WM and WAL (data not shown). Therefore,a combined spatial autocorrelation analysis was performed tosummarize the autocorrelation pattern in wild carrot (Fig. 3).
Because the estimated errors fell with increasing numbers ofpairwise individuals in different distance classes, the com-bined spatial autocorrelation analysis was highly significant(P ¼ 0.001) with positive genetic correlations (P ¼ 0.001) inboth the first (0–14 m) and the second (15–27 m) distanceclass (Fig. 3).
Historical gene dispersal
Historical gene dispersal and neighbourhood size of wildcarrots are summarized in Table 3. The effective densitieswere about four times higher in WM (0.0406–0.2028 m22)than in WAL (0.0098–0.0491 m22). The standard deviationsof gene dispersal sg were 4–12 m for WM and 10–31 m forWAL. The radii of the neighbourhood areas (2sg) were8–24 m in WM and 20–62 m in WAL with 42–73 individuals(neighbourhood size Nb) in WM and 57–198 in WAL. In somecases, the estimation procedures failed to converge (Table 3)because the regression slopes became null or positive at onestep or the ranges of the restricted regression went outsidethe sampling area (Hardy et al., 2006).
Sp statistic and mating system
The average kinship coefficients F1 between individuals inthe first distance class (0–14 m) were 0.033+ 0.011 in WMand 0.061+ 0.019 in WAL. The regression slopes b ofkinship coefficients on natural logarithm of distances were20.016+ 0.005 in WM and 20.012+ 0.009 in WAL. Fromthese, the Sp values were estimated as 0.017+ 0.005 in WMand 0.013+ 0.010 in WAL. Because the Sp values werefound to be related to plant mating systems (Vekemans andHardy, 2004), the average Sp value of wild carrots (0.015+0.008) was compared with the mean Sp values of plantspecies with different mating systems taken from Vekemansand Hardy (2004) (Fig. 4). The results suggest that wildcarrot is a predominantly outcrossing species (Fig. 4).
The mating system of wild carrots was estimated directlyusing MLTR (Ritland, 2002) with genotypic data from fourmicrosatellite loci (1-5E, 1-9C, 1-12E and 2-10H) of 437wild carrot offspring and 20 mother plants (about 20–26 off-spring per mother plant) in WM. The multilocus outcrossingrate tm was 0.963+ 0.013. The single-locus ts was 0.903+0.019 (tm – ts 0.060+ 0.014). The results are in agreementwith the Sp statistics suggesting that wild carrot is an outcross-ing species (Fig. 4). The outcrossing rate of wild carrots washigh and the variation among mother plants (families) waslow with a correlation of t among families (normalized var-iance of outcrossing) of 0.067+ 0.066. Among motherplants the outcrossing rate varied from 0.837 to 1. The multi-locus and single-locus correlations of paternity rp (the fractionof siblings sharing the same father) were 0.091+ 0.014 and0.077+ 0.016, respectively. Therefore, most of the offspringfrom a mother plant were from different fathers. However,the correlation of t among loci was 0.355+ 0.120, suggestinga high level (1 minus correlation of t among loci is about64.5+ 12.0 %) of biparental inbreeding of the wild carrotsin WM.
Rong et al. — Gene dispersal in wild carrot populations290
Dow
nloaded from https://academ
ic.oup.com/aob/article/106/2/285/199515 by guest on 22 D
ecember 2021

0·15
0·10
WM
WAL
Combined WM and WAL
0·05
0·00A
utoc
orre
latio
n co
effic
ient
, r–0·05
–0·10(83) (100) (106) (114) (102) (81) (100) (116) (101)
Upper
r
Lower
0·15
0·10
0·05
0·00
Aut
ocor
rela
tion
coef
ficie
nt, r
–0·05
–0·10(39) (40) (39) (38) (40) (38) (39) (40) (38)
0·15
0·10
0·05
0·00
Aut
ocor
rela
tion
coef
ficie
nt, r
–0·05
–0·10(122)
14
(140)
27
(145)
39
(152)
51
(142)
68
(119)
88
Distance class (end point, m)
(139)
109
(156)
135
(139)
160
***
***
***
***
FI G. 3. Correlograms summarizing the spatial genetic structure for the wild carrot population in Meijendel (WM) and Alkmaar (WAL) and the combined spatialstructure analysis for both of the populations using GenAlEx 6.2 (Peakall and Smouse, 2006; Smouse et al., 2008). The autocorrelation coefficient r indicates thegenetic similarity between pairs of individuals whose geographical separation falls within the specified distance class, e.g. 0–14, 15–27 m, etc. (Peakall andSmouse, 2006). The error bars show the 95 % confidence interval of r estimated with bootstrap re-sampling. The number of pairwise individuals within a distanceclass is given in parentheses. The dotted lines indicate the 95 % upper and lower confidence limits for the null hypothesis of no spatial genetic structure.
***P , 0.005 indicates significantly positive genetic correlation.
TABLE 3. Historical gene dispersal and neighbourhood size of wild carrots in Meijendel (WM) and Alkmaar (WAL) estimatedaccording to Vekemans and Hardy (2004) and Hardy et al. (2006) by SPAGeDi 1.2
De (effective density)
Population D/2 D/3 D/4 D/5 D/6 D/7 D/8 D/9 D/10
sg (m) WM 4 (3, 6) – – 8 (6, 11) 9 (7, 14) 10 (8, 14) 11 (8, 22) – 12 (9, 25)WAL 10 (7, +1) 12 (9, +1) – 17 (11, +1) 31 (16, +1) – – – –
Nb WM 42 (28, 88) – – 62 (40,121) 63 (37,161) 65 (42,138) 76 (42,322) – 73 (42,322)WAL 57 (28, +1) 63 (30, +1) – 71 (29, +1) 198 (55, +1) – – – –
The values of effective density De range from D/10 to D/2 (D, census population density) (Hardy et al., 2006). The value of sg indicates the standarddeviation of gene dispersal. The neighbourhood size Nb indicates the number of individuals in neighbourhood area (a radius of 2sg) contributing to about95 % of the gene dispersal. Values in parentheses show the lower and upper bounds for the 95 % confidence intervals estimated according to Hardy et al.(2006). The ‘1’ represents infinity. Failures of the estimation procedure are indicated with ‘–’.
Rong et al. — Gene dispersal in wild carrot populations 291
Dow
nloaded from https://academ
ic.oup.com/aob/article/106/2/285/199515 by guest on 22 D
ecember 2021

Current pollen dispersal
The genotypic data from four microsatellite loci (1-5E,1-9C, 1-12E and 2-10H) of 437 wild carrot offspring and20 mother plants with known geographical coordinates inWM (about 20–26 offspring per mother plant) were usedto estimate current pollen dispersal. The correlation of pater-nity among sibships among mother plants decreased signifi-cantly (Spearman’s rank correlation coefficientrs ¼ 20.613, n ¼ 190, P , 0.001) with increasing distancebetween mother plants (Fig. 5). The empirical results ofRobledo-Arnuncio et al. (2007) suggest that a significant cor-relation with rs , 20.1 would yield acceptable dispersal esti-mates and therefore the pollen dispersal analysis wasperformed. Because the pairwise kinship coefficient used toestimate the correlated paternity would become negativewhen individuals are less related than average (Fig. 5), athreshold distance is required to define unrelated pollen
pools as a reference calibrating the kinship coefficients forestimating the correlation of paternity (Robledo-Arnuncioet al., 2006). The threshold distance was set at the approxi-mate observed value beyond which correlated paternityamong mothers stabilized at a slightly negative value(Robledo-Arnuncio et al., 2007) (Fig. 5). Different valuesof the threshold distance were set to test the stability of theresults and a value of 110 m was finally set in the analysis.The results of the current pollen dispersal estimate showthat the exponential-power function is the best fit to observedC (Fig. 6 and Table 4). However, the pollen dispersal sp cal-culated using either the normal or exponential function wasmuch closer to the historical gene dispersal estimate thanthat using the exponential-power function (Table 4). The esti-mates using geometric and two-dimensional Student’s t func-tions failed to converge. The mean Fft value (0.057) waslow, indicating low genetic differentiation of pollen pools
0·200·18
0·00Selfing
(5)
Mixed mating
(7)
Wild carrot
Mating system
Outcrossing
(18)
Self-incompatible
(17)0·020·040·060·080·100·12
Sp
0·140·16
FI G. 4. Bar chart showing the mean Sp values of plant species with different mating systems and wild carrot. The Sp values of different mating systems are takenfrom Vekemans and Hardy (2004) based on the Sp statistics analysis of 47 plant species. Numbers in parentheses indicate the numbers of plant species used indifferent mating systems. Plant mating systems are classified as selfing (average selfing rate s higher than 90 %), mixed-mating (10 % ,s , 90 %), outcrossing(s , 10 % but self-compatible) and self-incompatible as indicated in Vekemans and Hardy (2004). The study by Vekemans and Hardy (2004) found the Sp valuewas significantly related to the mating system. The mean Sp value of wild carrot was estimated using the genetic and geographical distance data of wild carrotscollected from Meijendel (WM) and Alkmaar (WAL) according to Vekemans and Hardy (2004) and Hardy et al. (2006) using SPAGeDi 1.2 (Hardy and
Vekemans, 2002). The error bars indicate s.e.
0·25
0·20
–0·250 20 40 60 80
Distance between mother plants (m)
100 120 140 160
–0·20
–0·15
–0·10
–0·05
0·00
0·05
Am
ong-
sibs
hip
corr
elat
ed p
ater
nity
0·10
0·15
110 m rs = –0·613
P < 0·001
FI G. 5. Correlations of among-sibship correlated paternity (i.e. the probability of two mother plants at a distance apart mating with the same father) and distancebetween mother plants. The correlated paternity was estimated with the pairwise kinship coefficient, and therefore it became negative when individuals were lessrelated than the average; a threshold distance of 110 m was thus set to define unrelated pollen pools as a reference for calibrating the kinship coefficient estimates
(Robledo-Arnuncio et al., 2006, 2007). The rs value represents Spearman’s rank correlation coefficient (n ¼ 190).
Rong et al. — Gene dispersal in wild carrot populations292
Dow
nloaded from https://academ
ic.oup.com/aob/article/106/2/285/199515 by guest on 22 D
ecember 2021

among mother plants. The effective densities estimated byTWOGENER were very low (Table 4) compared with thecensus density in WM (D ≥ 0.4056 m22).
DISCUSSION
Spatial genetic structure and mating system in wild carrot
Weak, but significant, spatial genetic structures are detected inwild carrots from both Meijendel (WM) and Alkmaar (WAL;Fig. 3). The Sp statistics suggest that such kinds of spatialgenetic structures are typical in primarily outcrossing plant
species (Vekemans and Hardy, 2004; Fig. 4). Direct estimationof outcrossing rate shows that 96 % of the seeds of wild carrotsfrom WM are outcrossed, confirming that Sp statistics are agood indicator for plant mating systems. Such a high pro-portion of outcrossing in wild carrot is in line with previousobservations that carrot is strongly protandrous and stigmasonly become receptive when anthers of all staminate and her-maphrodite flowers in an umbel have completed dehiscence(Koul et al., 1989). The high outcrossing rate could increasethe frequency of pollen-mediated gene flow among distantindividuals and therefore weaken the spatial genetic structure.The population-level outcrossing rate indirectly estimated fromthe mean fixation index is only about 0.65 in WM. Because thefixation index is averaged over single microsatellite loci, andnot a multilocus estimate, it cannot distinguish biparentalinbreeding from selfing so the outcrossing rate estimated bythe fixation index method underestimates outcrossing inWM. From the direct method the level of biparental inbreedingcan be estimated. Ritland (2002) indicated, that although tm –ts was often used to quantify the level of biparental inbreedingit was always an underestimate as it depends on the number ofloci used. Instead, the correlation of outcrossing rate t (orselfing rate s) among loci was introduced to measure the frac-tion of biparental inbreeding (Ritland, 2002). If there is nobiparental inbreeding, the correlation of t among loci isequal to 1; biparental inbreeding will reduce the correlationof t among loci and 1 minus this correlation approximatesthe fraction of biparental inbreeding (Ritland, 2002).Accordingly, the results suggest about 64 % biparentalinbreeding in WM, which might be the result of limitedgene dispersal.
Although the habitats of the two sites are very different, thespatial genetic structures are not significantly different fromeach other. This could be due to the relatively large errors at
2·0
1·5
ye (Normal)ye (Exponential)ye (Exponential-power)yo (Observed)
1·0
0·5
0·0
–0·5
–1·00 20 40 60 80 100 120 140 160
y
Distance between mother plants (m)
FI G. 6. Relationship between C and distance between mother plants. Pairwise observed C (CO) was calculated based on the kinship coefficients relative to aproposed unrelated pollen pool (a threshold distance of 110 m) (Robledo-Arnuncio et al., 2006). Expected C (Ce) was calculated using the probability densityfunction of pollen dispersal of Normal, Exponential and Exponential-power (Austerlitz et al., 2004; Robledo-Arnuncio et al., 2006). Parameters of different
probability density functions were estimated by the KINDIST program of POLDISP 1.0c (Robledo-Arnuncio et al., 2007).
TABLE 4. Results of the current pollen dispersal estimation byPOLDISP 1.0c (Robledo-Arnuncio et al., 2007)
Normal ExponentialExponential-
power
a 39.9 21.0 0.0185b 2 2 0.2298Mean pollen dispersal (m) 35.4 42.0 474.195 % pollen dispersal (m) 69.0 99.4 1828.499 % pollen dispersal (m) 85.6 139.1 4172.8Square-root variance (sp; m) 28.2 36.3 723.8Kurtosis 2.0 3.3 110.1Least-square residual 22.3 20.3 17.2Global Fft 0.057 0.057 0.057Effective density De (m22) 0.000232 0.000508 0.000064
Normal, Exponential and Exponential-power represent different probabilitydensity functions used for fitting the experimental data of wild carrots inMeijendel (WM). The Normal and Exponential functions are one-parameterdistributions specified with parameter a and the Exponential-power functionis a two-parameter distribution specified with parameters a and b (for detailssee Austerlitz et al., 2004). The Global Fft value quantifies the meandifferentiation among pollen pools of different mother plants.
Rong et al. — Gene dispersal in wild carrot populations 293
Dow
nloaded from https://academ
ic.oup.com/aob/article/106/2/285/199515 by guest on 22 D
ecember 2021
different distance classes as a result of small sample sizes,especially in WAL (Fig. 3). The lower fixation index and thehence higher estimated outcrossing rate in WAL suggestlower levels of biparental inbreeding than that in WM,which might result from the linear plant distribution and lowindividual plant density. Nevertheless, the combined spatialgenetic structure analysis shows that a significantly positivegenetic correlation could exist up to 27 m in wild carrot popu-lations (Fig. 3). For the purposes of germplasm collections, theresults suggest that wild carrots should be sampled every 14–27 m in a well-distributed population in order to represent asmuch of the real genetic diversity as possible.
Gene dispersal in wild carrot
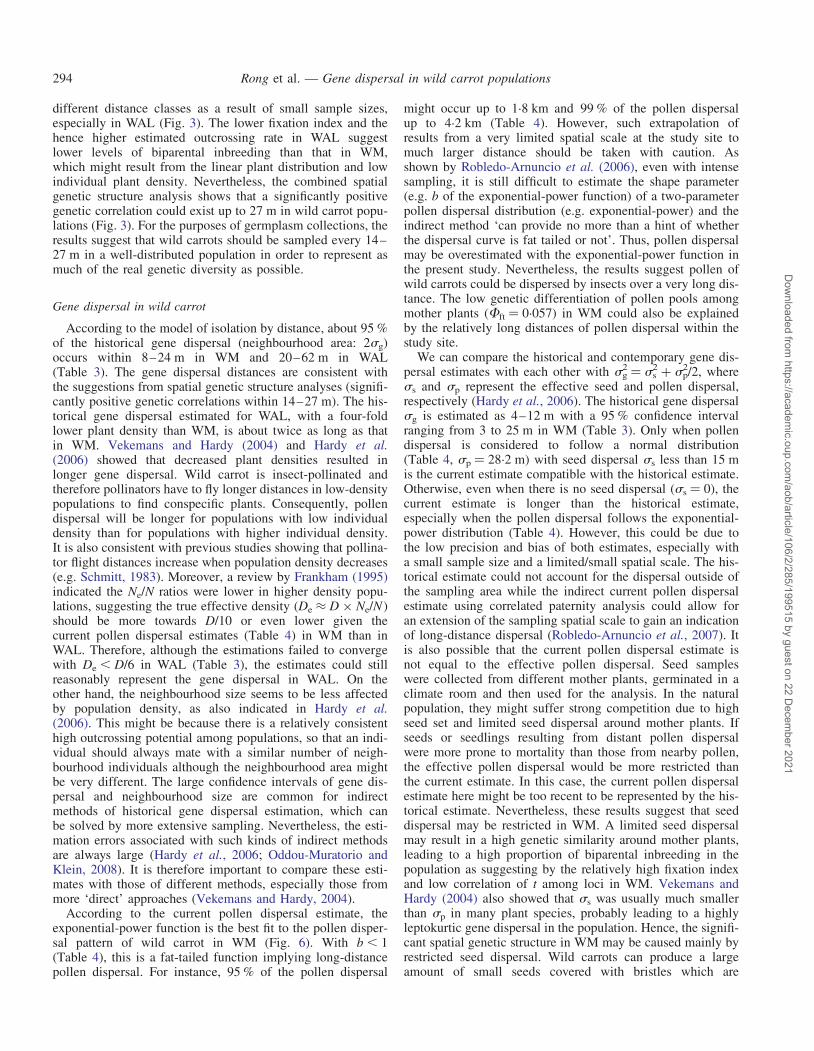
According to the model of isolation by distance, about 95 %of the historical gene dispersal (neighbourhood area: 2sg)occurs within 8–24 m in WM and 20–62 m in WAL(Table 3). The gene dispersal distances are consistent withthe suggestions from spatial genetic structure analyses (signifi-cantly positive genetic correlations within 14–27 m). The his-torical gene dispersal estimated for WAL, with a four-foldlower plant density than WM, is about twice as long as thatin WM. Vekemans and Hardy (2004) and Hardy et al.(2006) showed that decreased plant densities resulted inlonger gene dispersal. Wild carrot is insect-pollinated andtherefore pollinators have to fly longer distances in low-densitypopulations to find conspecific plants. Consequently, pollendispersal will be longer for populations with low individualdensity than for populations with higher individual density.It is also consistent with previous studies showing that pollina-tor flight distances increase when population density decreases(e.g. Schmitt, 1983). Moreover, a review by Frankham (1995)indicated the Ne/N ratios were lower in higher density popu-lations, suggesting the true effective density (De ≈ D × Ne/N)should be more towards D/10 or even lower given thecurrent pollen dispersal estimates (Table 4) in WM than inWAL. Therefore, although the estimations failed to convergewith De , D/6 in WAL (Table 3), the estimates could stillreasonably represent the gene dispersal in WAL. On theother hand, the neighbourhood size seems to be less affectedby population density, as also indicated in Hardy et al.(2006). This might be because there is a relatively consistenthigh outcrossing potential among populations, so that an indi-vidual should always mate with a similar number of neigh-bourhood individuals although the neighbourhood area mightbe very different. The large confidence intervals of gene dis-persal and neighbourhood size are common for indirectmethods of historical gene dispersal estimation, which canbe solved by more extensive sampling. Nevertheless, the esti-mation errors associated with such kinds of indirect methodsare always large (Hardy et al., 2006; Oddou-Muratorio andKlein, 2008). It is therefore important to compare these esti-mates with those of different methods, especially those frommore ‘direct’ approaches (Vekemans and Hardy, 2004).
According to the current pollen dispersal estimate, theexponential-power function is the best fit to the pollen disper-sal pattern of wild carrot in WM (Fig. 6). With b , 1(Table 4), this is a fat-tailed function implying long-distancepollen dispersal. For instance, 95 % of the pollen dispersal
might occur up to 1.8 km and 99 % of the pollen dispersalup to 4.2 km (Table 4). However, such extrapolation ofresults from a very limited spatial scale at the study site tomuch larger distance should be taken with caution. Asshown by Robledo-Arnuncio et al. (2006), even with intensesampling, it is still difficult to estimate the shape parameter(e.g. b of the exponential-power function) of a two-parameterpollen dispersal distribution (e.g. exponential-power) and theindirect method ‘can provide no more than a hint of whetherthe dispersal curve is fat tailed or not’. Thus, pollen dispersalmay be overestimated with the exponential-power function inthe present study. Nevertheless, the results suggest pollen ofwild carrots could be dispersed by insects over a very long dis-tance. The low genetic differentiation of pollen pools amongmother plants (Fft ¼ 0.057) in WM could also be explainedby the relatively long distances of pollen dispersal within thestudy site.
We can compare the historical and contemporary gene dis-persal estimates with each other with sg
2 ¼ ss2 + sp
2/2, wheress and sp represent the effective seed and pollen dispersal,respectively (Hardy et al., 2006). The historical gene dispersalsg is estimated as 4–12 m with a 95 % confidence intervalranging from 3 to 25 m in WM (Table 3). Only when pollendispersal is considered to follow a normal distribution(Table 4, sp ¼ 28.2 m) with seed dispersal ss less than 15 mis the current estimate compatible with the historical estimate.Otherwise, even when there is no seed dispersal (ss ¼ 0), thecurrent estimate is longer than the historical estimate,especially when the pollen dispersal follows the exponential-power distribution (Table 4). However, this could be due tothe low precision and bias of both estimates, especially witha small sample size and a limited/small spatial scale. The his-torical estimate could not account for the dispersal outside ofthe sampling area while the indirect current pollen dispersalestimate using correlated paternity analysis could allow foran extension of the sampling spatial scale to gain an indicationof long-distance dispersal (Robledo-Arnuncio et al., 2007). Itis also possible that the current pollen dispersal estimate isnot equal to the effective pollen dispersal. Seed sampleswere collected from different mother plants, germinated in aclimate room and then used for the analysis. In the naturalpopulation, they might suffer strong competition due to highseed set and limited seed dispersal around mother plants. Ifseeds or seedlings resulting from distant pollen dispersalwere more prone to mortality than those from nearby pollen,the effective pollen dispersal would be more restricted thanthe current estimate. In this case, the current pollen dispersalestimate here might be too recent to be represented by the his-torical estimate. Nevertheless, these results suggest that seeddispersal may be restricted in WM. A limited seed dispersalmay result in a high genetic similarity around mother plants,leading to a high proportion of biparental inbreeding in thepopulation as suggesting by the relatively high fixation indexand low correlation of t among loci in WM. Vekemans andHardy (2004) also showed that ss was usually much smallerthan sp in many plant species, probably leading to a highlyleptokurtic gene dispersal in the population. Hence, the signifi-cant spatial genetic structure in WM may be caused mainly byrestricted seed dispersal. Wild carrots can produce a largeamount of small seeds covered with bristles which are
Rong et al. — Gene dispersal in wild carrot populations294
Dow
nloaded from https://academ
ic.oup.com/aob/article/106/2/285/199515 by guest on 22 D
ecember 2021

probably transported by wind and animals (Umehara et al.,2005). They showed that wild carrot seeds were scatteredwithin 3 m with wind speeds below 3 m s21, and in a recentlytransplanted wild carrot field most of the wild carrots werewithin several metres of their maternal plants. Therefore,most of the seeds in WM might be dispersed by wind and scat-tered around mother plants. Yet, a small proportion of theseeds could be transferred very long distances outside of thestudy area by attaching to animals. As indicated by Umeharaet al. (2005), some wild carrot individuals were found about100 m away from the original area within 2 years. Moreover,a previous study showed that carrot seeds could be movedvery long distances (up to several hundred kilometres) via tra-ditional nomadic sheep (Manzano and Malo, 2006). Such seeddispersal would favour gene flow between distant wild carrotpopulations. Additional studies are needed to estimate thegene flow among distant populations that are involved in thelater stage of the introgression process.
Practical implications
For carrot seed productions, hybrid seeds among differentcultivars (crop-to-crop) should comprise ,1 % of the totaland those from wild to cultivated carrots (wild-to-crop)should comprise ,0.005 % (personal communication withbreeders). It is suggested by breeders that different seed pro-duction fields should be separated by 3 km and that farmersshould remove all wild carrots within 3 km around their seedproduction fields. The results of current pollen dispersal esti-mates here agree that long isolation distance is required toreduce unwanted pollen-mediated gene flow in carrots (e.g.transgene flow) (Table 4). However, this is based on theresults from well-distributed wild carrots with relatively highdensity (0.4056 m22 in WM vs. 0.0982 m22 in WAL).Insects might fly longer distances to reach different pollensources if they are more isolated, therefore changing the prob-ability density function of pollen dispersal into fatter tail dis-tributions. Further studies of the pollen dispersal curveshould be conducted on a larger spatial scale and with alarger sample size. Moreover, based on the results fromhistorical estimates, gene dispersal in wild carrots is density-dependent with longer gene dispersal in lower density popu-lations. On the other hand, the mass action-law governingthe mixing of pollen from different origins (Holsinger, 1991)may also play an important rule in the isolation distance. Acultivated carrot field with a higher density of flowers and/ora wild carrot population with lower density might requiremuch longer isolation distance to reduce gene flow from culti-vars to a certain threshold. In future studies, the effect ofdensity on gene dispersal among populations should be takeninto consideration by measuring the density in different popu-lations together with gene dispersal estimates. Therefore, aprecise figure (e.g. 3 or 4 km) of isolation distance may notbe practical for reducing unwanted gene flow because ofvarying population sizes and densities.
This study has determined for the first time the fine-scalegenetic structure, mating system and gene dispersal in wildcarrot using microsatellite markers. The results indicate weakbut significant spatial genetic structures in wild carrot as aresult of high outcrossing, restricted seed dispersal and
relatively long-distance pollen dispersal within populations.The high outcrossing rate in wild carrot implies that high fre-quencies of transgene flow may occur from GM carrots toadjacent wild carrots. In addition, pollen of wild carrotscould be dispersed by insects over a long distance. If suchtransgenes have positive fitness effects on wild carrots, theycould easily spread within and between wild populations viapollen dispersal. Therefore, the fitness of specific transgenesin F1 hybrids and sequent backcrossing generations in wildcarrot populations need to be assessed to determine if therisks of transgene introgression are indeed relatively high incarrot.
ACKNOWLEDGMENTS
We thank Ikue Eguchi and Prof. Hiroshi Kamada for carrotmicrosatellite marker development and pioneering studies ofcarrot gene flow, and the editors and reviewers for thierhelpful comments. We thank Drs Mark Beaumont, Juan JoseRobledo-Arnuncio and Frederic Austerlitz for comments oncurrent pollen dispersal estimates and generating expectedvalues with different probability density functions of pollendispersal, and Prof. Kermit Ritland for comments on matingsystem analysis. We thank technicians MarcelC. M. Eurlings, Rene Glas and Natasha S. Schidlo for helpwith DNA extractions, microsatellite analyses and sequencing,and Karin A. M. van der Veen, Cilke M. Hermans and HenkW. Nell for helping with germinating and growing wildcarrots. We thank Drs Tom de Jong, Martina Stang, WilTamis, Cilia Grebenstein, Patsy Haccou and Atiyo Ghosh fordiscussions and suggestions. This work was supported by theresearch programme ‘Ecology Regarding GeneticallyModified Organisms’ (ERGO) No. 838.06.031 of the DutchMinistries for the Environment, Economic Affairs,Agriculture and Science and Education, implemented by theEarth and Life Sciences Council (ALW) of the NetherlandsOrganisation for Scientific Research (NWO).
LITERATURE CITED
Austerlitz F, Dick CW, Dutech C, et al. 2004. Using genetic markers to esti-mate the pollen dispersal curve. Molecular Ecology 13: 937–954.
Boutin-Ganache I, Raposo M, Raymond M, Deschepper CF. 2001.M13-tailed primers improve the readability and usability of microsatelliteanalyses performed with two different allele-sizing methods.BioTechniques 31: 24–26, 28.
Chen WP, Punja ZK. 2002. Transgenic herbicide- and disease-tolerant carrot(Daucus carota L.) plants obtained through Agrobacterium-mediatedtransformation. Plant Cell Reports 20: 929–935.
Ellstrand NC. 2003. Current knowledge of gene flow in plants: implicationsfor transgene flow. Philosophical Transactions of the Royal Society ofLondon Series B-Biological Sciences 358: 1163–1170.
Ellstrand NC, Prentice HC, Hancock JF. 1999. Gene flow and introgressionfrom domesticated plants into their wild relatives. Annual Review ofEcology and Systematics 30: 539–563.
Frankham R. 1995. Effective population size/adult population size ratios inwildlife – a review. Genetical Research 66: 95–107.
Hardy OJ, Vekemans X. 2002. SPAGEDi: a versatile computer program toanalyse spatial genetic structure at the individual or population levels.Molecular Ecology Notes 2: 618–620.
Hardy OJ, Maggia L, Bandou E, et al. 2006. Fine-scale genetic structure andgene dispersal inferences in 10 Neotropical tree species. MolecularEcology 15: 559–571.
Rong et al. — Gene dispersal in wild carrot populations 295
Dow
nloaded from https://academ
ic.oup.com/aob/article/106/2/285/199515 by guest on 22 D
ecember 2021

Hauser TP. 2002. Frost sensitivity of hybrids between wild and cultivatedcarrots. Conservation Genetics 3: 75–78.
Hauser TP, Bjorn GK. 2001. Hybrids between wild and cultivated carrots inDanish carrot fields. Genetic Resources and Crop Evolution 48: 499–506.
Hauser TP, Bjorn GK, Magnussen L, Shim SI. 2004. Hybrids between cul-tivated and wild carrots: a life history. In: den Nijs HCM, Bartsch D,Sweet J. eds. Introgression from genetically modified plants into wildrelatives. Wallingford: CABI Publishing, 41–51.
Heywood VH. 1983. Relationships and evolution in the Daucus carotacomplex. Israel Journal of Botany 32: 51–65.
Holsinger KE. 1991. Mass-action models of plant mating systems – the evol-utionary stability of mixed mating systems. American Naturalist 138:606–622.
Imani J, Berting A, Nitsche S, Schaefer S, Gerlich WH, Neumann KH.2002. The integration of a major hepatitis B virus gene into cell-cyclesynchronized carrot cell suspension cultures and its expression in regen-erated carrot plants. Plant Cell Tissue and Organ Culture 71: 157–164.
Klein EK, Lavigne C, Picault H, Michel R, Gouyon PH. 2006. Pollen dis-persal of oilseed rape: estimation of the dispersal function and effects offield dimension. Journal of Applied Ecology 43: 141–151.
Koul P, Koul AK, Hamal IA. 1989. Reproductive-biology of wild and culti-vated carrot (Daucus carota L.). New Phytologist 112: 437–443.
Kumar S, Dhingra A, Daniell H. 2004. Plastid-expressed betaine aldehydedehydrogenase gene in carrot cultured cells, roots, and leaves confersenhanced salt tolerance. Plant Physiology 136: 2843–2854.
Lamborn E, Ollerton J. 2000. Experimental assessment of the functionalmorphology of inflorescences of Daucus carota (Apiaceae): testing the‘fly catcher effect’. Functional Ecology 14: 445–454.
Lacey EP. 1988. Latitudinal variation in reproductive timing of a short-livedmonocarp, Daucus carota (Apiaceae). Ecology 69: 220–232.
Leblois R, Rousset F, Estoup A. 2004. Influence of spatial and temporal het-erogeneities on the estimation of demographic parameters in a continuouspopulation using individual microsatellite data. Genetics 166:1081–1092.
Li J, Zhang YH, Sullivan M, et al. 2007. Typing Plasmodium yoelii micro-satellites using a simple and affordable fluorescent labeling method.Molecular and Biochemical Parasitology 155: 94–102.
Loiselle BA, Sork VL, Nason J, Graham C. 1995. Spatial genetic structureof a tropical understory shrub, Psychotria Officinalis (Rubiaceae).American Journal of Botany 82: 1420–1425.
Magnussen LS, Hauser TP. 2007. Hybrids between cultivated and wildcarrots in natural populations in Denmark. Heredity 99: 185–192.
Manzano P, Malo JE. 2006. Extreme long-distance seed dispersal via sheep.Frontiers in Ecology and the Environment 4: 244–248.
Morris J, Hawthorne KM, Hotze T, Abrams SA, Hirschi KD. 2008.Nutritional impact of elevated calcium transport activity in carrots.Proceedings of the National Academy of Sciences of the United Statesof America 105: 1431–1435.
Oddou-Muratorio S, Klein EK. 2008. Comparing direct vs. indirect estimatesof gene flow within a population of a scattered tree species. MolecularEcology 17: 2743–2754.
Peakall R, Smouse PE. 2006. GENALEX 6: genetic analysis in Excel.Population genetic software for teaching and research. MolecularEcology Notes 6: 288–295.
Rice WR. 1989. Analyzing tables of statistical tests. Evolution 43:223–225.
Ritland K. 2002. Extensions of models for the estimation of mating systemsusing n independent loci. Heredity 88: 221–228.
Robledo-Arnuncio JJ, Austerlitz F, Smouse PE. 2006. A new method ofestimating the pollen dispersal curve independently of effective density.Genetics 173: 1033–1045.
Robledo-Arnuncio JJ, Austerlitz F, Smouse PE. 2007. POLDISP: a softwarepackage for indirect estimation of contemporary pollen dispersal.Molecular Ecology Notes 7: 763–766.
Rousset F. 1999. Genetic differentiation within and between two habitats.Genetics 151: 397–407.
Rousset F. 2008. GENEPOP ’007: a complete re-implementation of theGENEPOP software for Windows and Linux. Molecular EcologyResources 8: 103–106.
Schmitt J. 1983. Density-dependent pollinator foraging, flowering phenology,and temporal pollen dispersal patterns in Linanthus Bicolor. Evolution 37:1247–1257.
Simon PW, Freeman RE, Vieira JV, et al. 2007. Carrot. In: Prohens J, NuezF. eds. Vegetables II Fabaceae, Liliaceae, Solanaceae, and Umbelliferae.New York: Springer, 327–357.
Slavov GT, Leonardi S, Burczyk J, Adams WT, Strauss SH, Difazio SP.2009. Extensive pollen flow in two ecologically contrasting populationsof Populus trichocarpa. Molecular Ecology 18: 357–373.
Smouse PE, Peakall R, Gonzales E. 2008. A heterogeneity test for fine-scalegenetic structure. Molecular Ecology 17: 3389–3400.
Snow AA, Uthus KL, Culley TM. 2001. Fitness of hybrids between weedyand cultivated radish: implications for weed evolution. EcologicalApplications 11: 934–943.
Song ZP, Li B, Chen JK, Lu BR. 2005. Genetic diversity and conservation ofcommon wild rice (Oryza rufipogon) in China. Plant Species Biology 20:83–92.
Song ZP, Zhu WY, Rong J, Xu X, Chen JK, Lu BR. 2006. Evidences ofintrogression from cultivated rice to Oryza rufipogon (Poaceae) popu-lations based on SSR fingerprinting: implications for wild rice differen-tiation and conservation. Evolutionary Ecology 20: 501–522.
Stein M, Nothnagel T. 1995. Some remarks on carrot breeding (Daucuscarota sativus Hoffm). Plant Breeding 114: 1–11.
Stewart CN, Halfhill MD, Warwick SI. 2003. Transgene introgression fromgenetically modified crops to their wild relatives. Nature ReviewsGenetics 4: 806–817.
Umehara M, Eguchi I, Kaneko D, Ono M, Kamada H. 2005. Evaluation ofgene flow and its environmental effects in the field. Plant Biotechnology22: 497–504.
Vekemans X, Hardy OJ. 2004. New insights from fine-scale spatial geneticstructure analyses in plant populations. Molecular Ecology 13: 921–935.
Wijnheijmer EHM, Brandenburg WA, Terborg SJ. 1989. Interactionsbetween wild and cultivated carrots (Daucus carota L) in theNetherlands. Euphytica 40: 147–154.
Xu X, Lu BR, Chen YH, et al. 2006. Inferring population history fromfine-scale spatial genetic analysis in Oryza rufipogon (Poaceae).Molecular Ecology 15: 1535–1544.
Rong et al. — Gene dispersal in wild carrot populations296
Dow
nloaded from https://academ
ic.oup.com/aob/article/106/2/285/199515 by guest on 22 D
ecember 2021