Embed Size (px)
Citation preview
HISTORICAL NATIONAL ACCOUNTS FOR BRITAIN, 1300-1850: SOME PRELIMINARY ESTIMATES
Stephen Broadberry, University of Warwick, [email protected]
Bruce Campbell, Queen’s University Belfast, [email protected]
Mark Overton, University of Exeter, [email protected]
Bas van Leeuwen, University of Warwick, [email protected]
Alexander Apostolides, University of Warwick, [email protected]
7 April 2009
File: BritishGDPLongRun.doc
Abstract: We provide annual estimates of GDP for England between 1300 and 1700 and
for Great Britain between 1700 and 1850, constructed from the output side. The GDP
data are combined with population estimates to calculate GDP per capita. Estimates of
nominal GDP are also provided by combining the volume series with price indices.
Previous studies, based on the analysis of daily real wages, have found no trend growth
before the late eighteenth century. In contrast, we find English per capita income growth
of 0.13 per cent per annum between 1300 and 1700, with the strongest growth after the
Black Death and in the second half of the seventeenth century. For the period 1700-1850,
we find British per capita income growth of 0.25 per cent, broadly in line with the widely
accepted Crafts/Harley estimates. The modest trend growth in per capita income before
the Industrial Revolution can be reconciled with the stability of daily real wages because
of an “industrious revolution”, increasing the days worked per year.
Acknowledgements: This paper forms part of the project “Reconstructing the National
Income of Britain and Holland, c.1270/1500 to 1850”, funded by the Leverhulme Trust,
Reference Number F/00215AR.
2
I. INTRODUCTION
Two very contrasting view of the development of the British economy between the late
medieval period and the Industrial Revolution co-exist. One view, which has been based
largely on real wage evidence, paints a bleak picture of long run stagnation from the late
thirteenth century to the middle of the nineteenth century, albeit with quite large
fluctuations over sustained periods (Phelps Brown and Hopkins, 1981). This view has
recently been supported by Clark (2005), who provides a real wage series which shows
less extreme fluctuations than that of Phelps Brown and Hopkins, but leaves the trend
unchanged. Furthermore, Clark (2007a) adds new time series for land rents and capital
income to arrive at a picture of long run stagnation in GDP per head. This view sits
uneasily with a second view, based largely on estimates of wealth and the appearance of
new products, which appears to show modest but sustained growth of living standards
between the middle ages and the Industrial Revolution (Overton, Whittle, Dean and
Haan, 2004; de Vries, 1994).
These two very different views of the long run development of the British
economy have been able to co-exist because of the absence of reliable and empirically
well grounded estimates of the output and labour productivity of the British economy
over much of this period. This paper forms part of a project to reconstruct the national
income of Britain and Holland between the late thirteenth century and the mid-nineteenth
century. Here, we present preliminary estimates of British GDP constructed from the
output side. For the period before 1700, we work only with estimates for England, but for
3
the period 1700-1850 our estimates are for the territory of Great Britain, including Wales
and Scotland as well as England.
For agriculture, we build on the pathbreaking study of Overton and Campbell
(1996), which tracked long run trends in agricultural output and labour productivity, but
was restricted to estimates for a small number of benchmark years. To provide annual
estimates, we rely heavily on three data sets assembled for the medieval, early modern
and modern periods. For the medieval period, we analyse the Medieval Accounts
Database assembled by Campbell (2000; 2007), drawing upon the archival labours of a
number of other historians, including David Farmer, John Langdon and Jan Titow. The
information on arable yields and animal stocking densities is taken largely from manorial
accounts, but is supplemented by information on the non-manorial sector from tithes. For
the early modern period, we use the probate inventory database assembled by Overton,
Whittle, Dean and Hann (2004), which provides indirect estimates of arable yields and
animal stocking densities from the valuation of the assets left by farmers. From the early
eighteenth century on, we make use of the database on farm accounts assembled by
Turner, Beckett and Afton (2001).
For industry and services, for the period after 1700 we build on the pioneering
approach of Deane and Cole (1962), as modified by Crafts and Harley (1992). Gross
output indicators for the major sectors have been assembled and weighted using value
added shares. For the period before 1700, a similar procedure has been used, drawing on
as many sources as possible for the output indicators and assembling new sectoral
4
weights at the key benchmark years of 1377 and 1522, as well as the more familiar 1688
benchmark based ultimately on the work of Gregory King. The national accounting
perspective suggests a number of tests which can be conducted to demonstrate
consistency, drawing on information from the income and expenditures sides.
The paper proceeds as follows. Sections II to IV describe the procedures for
estimating output in agriculture, industry and services, respectively. Section V then
aggregates the sectoral outputs into real GDP for England during the period 1300-1700
and Great Britain during 1700-1850, and combines these series with data on population to
derive estimates of GDP per capita. In section VI, real GDP is then reflated with price
indices to provide measures of nominal GDP, which can be compared with benchmark
estimates by other authors. Estimates from the output side are then cross-checked against
estimates from the income side and per capita consumption of calories in Section VII.
Section VIII concludes.
II. AGRICULTURAL PRODUCTION
1. Arable farming in England, 1250-1850
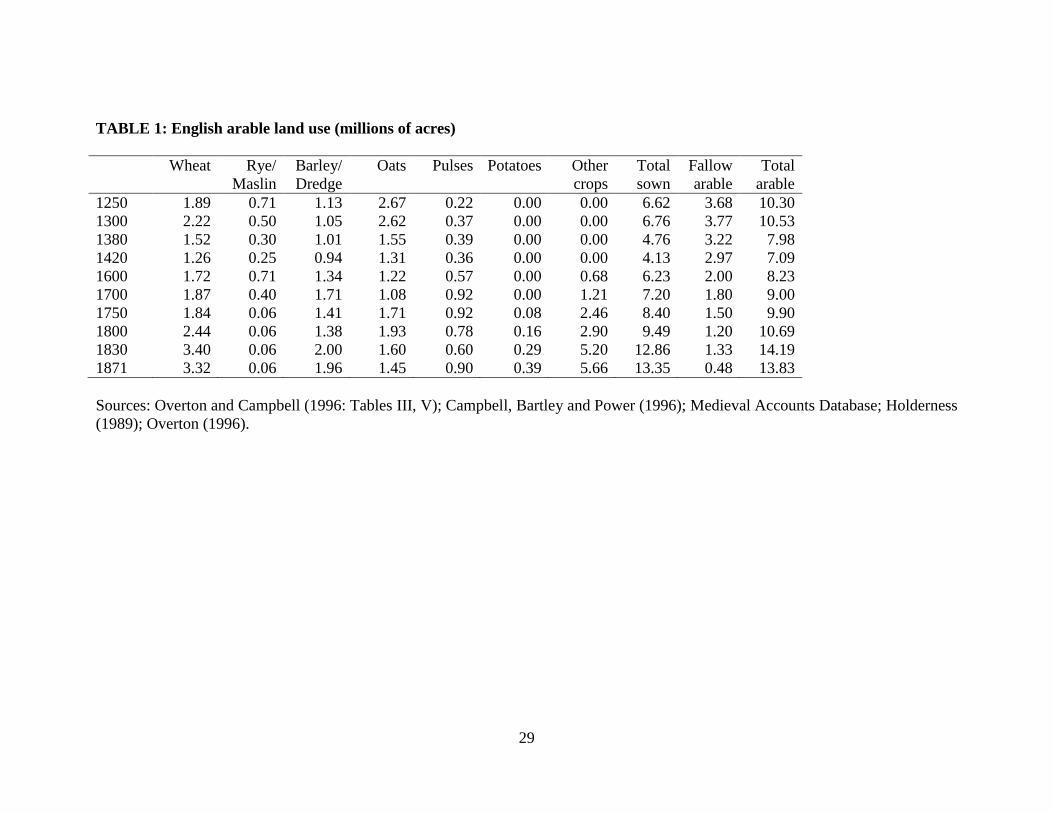
The starting point for any estimate of the output of the arable sector is the total area under
crop, which is set out in Table 1. For most benchmark years, the data are taken from
Overton and Campbell (1996). Firm estimates of land use only became available in the
agricultural returns of 1871, which therefore provides the starting point for the series. For
1830, the figures come from the tithe files and for 1800, 1750 and 1700 from estimates
by contemporaries (Holderness, 1989). The estimates for 1600 have been inferred by
5
extrapolating backwards from these later figures. For the medieval period, the starting
point is the estimate for 1300. Around this time, the population attained its medieval
peak, so that the arable acreage would also have been at its peak. Contrary to the claims
of Clark (2007b: 124), it is unlikely that the arable acreage in 1300 could have been much
above the level of 1800. Estimates for 1420, 1380 and 1250 are obtained by extrapolation
from 1300 on the basis of trends in the cropped acreage on demesnes and tithe data
(Campbell et al., 1996).
Having obtained estimates of the overall arable acreage in use, the next step is to
allocate it between fallow and the major crops sown. This information is taken from the
Medieval Accounts Database for the period before 1500, the Early Modern Probate
Inventories Database for the period 1500-1750 and from Holderness (1989) and Overton
(1996) for the period 1750-1850. For the medieval period, it should be noted that we
assume the distribution of crops in the demesne sector to be representative of the country
as a whole. This is broadly consistent with the much smaller amount of evidence on the
non-demesne sector (Sapoznik, 2008; Dodds, 2007).
The amount of fallow declined from around one third in the medieval period to
less than a quarter in the early modern period and to just 3.5 per cent by 1871.
Information on the crop distribution is taken from data that are intrinsically local and of
uneven geographical coverage, so that a system of regional weightings is essential to
ensure a reliable national total. Each region’s share of the national sown acreage is taken
from the 1801 crop returns, but within each region, the breakdown of crops varies over
6
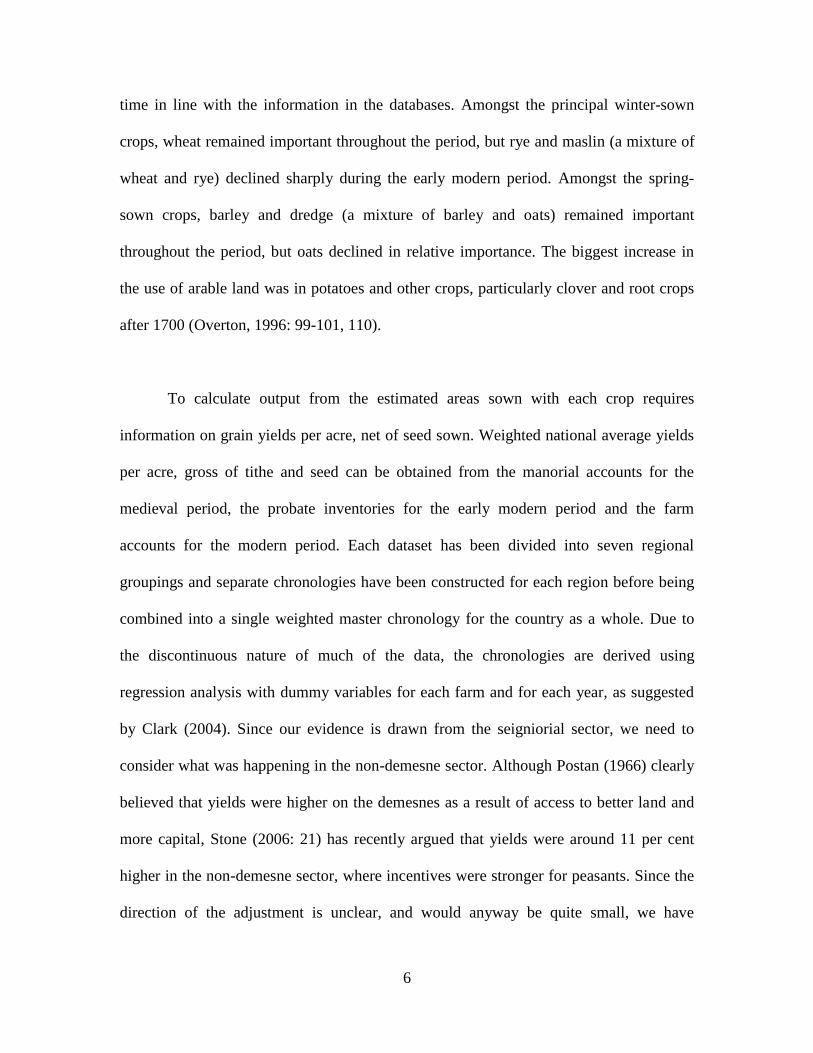
time in line with the information in the databases. Amongst the principal winter-sown
crops, wheat remained important throughout the period, but rye and maslin (a mixture of
wheat and rye) declined sharply during the early modern period. Amongst the spring-
sown crops, barley and dredge (a mixture of barley and oats) remained important
throughout the period, but oats declined in relative importance. The biggest increase in
the use of arable land was in potatoes and other crops, particularly clover and root crops
after 1700 (Overton, 1996: 99-101, 110).
To calculate output from the estimated areas sown with each crop requires
information on grain yields per acre, net of seed sown. Weighted national average yields
per acre, gross of tithe and seed can be obtained from the manorial accounts for the
medieval period, the probate inventories for the early modern period and the farm
accounts for the modern period. Each dataset has been divided into seven regional
groupings and separate chronologies have been constructed for each region before being
combined into a single weighted master chronology for the country as a whole. Due to
the discontinuous nature of much of the data, the chronologies are derived using
regression analysis with dummy variables for each farm and for each year, as suggested
by Clark (2004). Since our evidence is drawn from the seigniorial sector, we need to
consider what was happening in the non-demesne sector. Although Postan (1966) clearly
believed that yields were higher on the demesnes as a result of access to better land and
more capital, Stone (2006: 21) has recently argued that yields were around 11 per cent
higher in the non-demesne sector, where incentives were stronger for peasants. Since the
direction of the adjustment is unclear, and would anyway be quite small, we have
7
assumed that yields on the demesne sector were representative of English agriculture as a
whole.
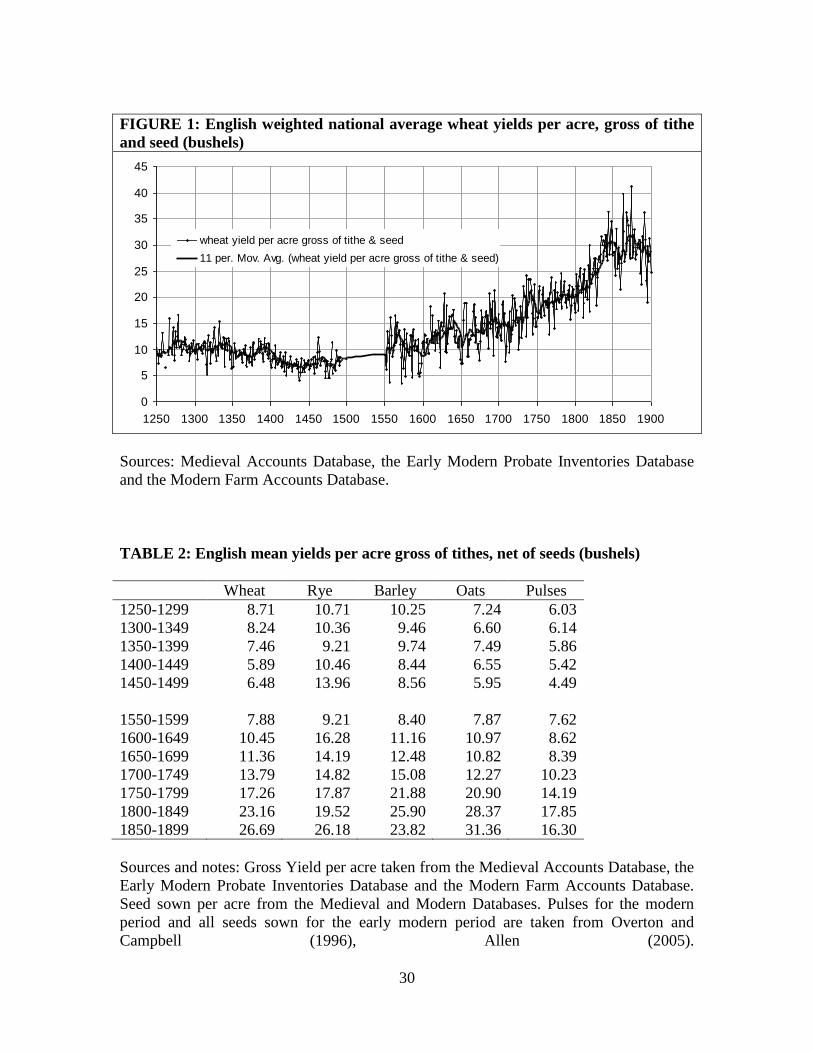
Wheat yields gross of seed as well as tithe are shown in Figure 1 for wheat, for
illustrative purposes. From these gross yields it is necessary to subtract grain used as seed
to derive the net yields shown in Table 2 for all the major crops. There are some
differences between crops, but the different datasets appear to tell a consistent story, with
yields declining during the late medieval period from around 1300, picking up again
during the early modern period from the mid-sixteenth century, and growing more
rapidly during the modern period from the early eighteenth century. The data exhibit a
high degree of short run volatility, which has been smoothed out in Figure 1 with an
eleven-year moving average.
In addition to making allowance for grain used as seed, calculation of the net
output of the arable sector must take account of consumption of oats and pulses by
animals working on the farm. For the medieval and early modern periods, estimates of
the numbers of working animals per 100 sown acres can be obtained from the medieval
accounts and probate inventory databases. For the early modern period, these stocking
densities are assumed to apply to the whole agricultural sector and hence are simply
multiplied with the sown acreage to produce estimates of the numbers of working
animals. However, for the medieval period, the demesne stocking densities have been
converted into the numbers of horses and oxen on all lands using Wrigley’s (2006: 449)
assumption that the stocking density of animals on non-seigniorial holdings was three-
8
quarters that on the demesnes. In making these estimates, allowance has been made for
both the declining share of demesne acreage and the lesser quantities of fodder consumed
by immature animals. As with the crop yields, a regional weighting scheme is needed to
derive the stocking densities for the country as a whole from the observations on
individual demesnes and farms. For the modern period, direct estimates of animal
numbers are taken from John (1989) and Allen (2005), since data on stocking densities
are unavailable.
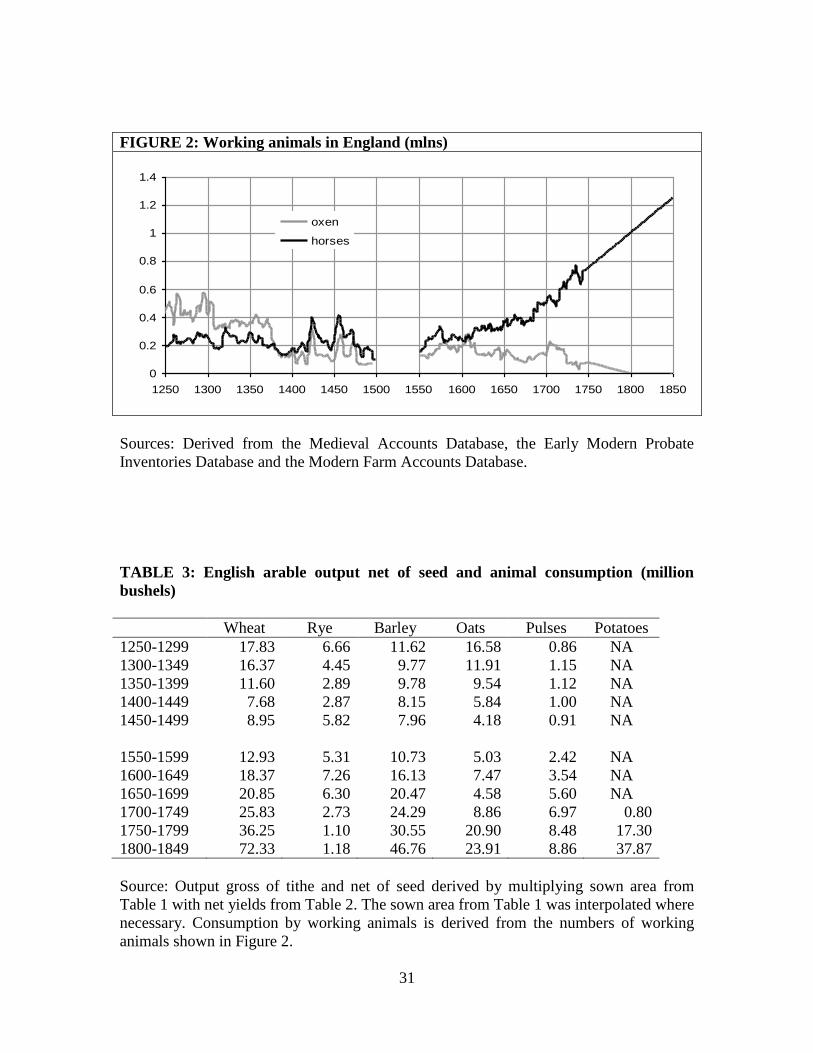
Figure 2 sets out the numbers of mature working animals in England. There was a
gradual process of substitution of horses for oxen as working animals, beginning in the
medieval period. By the nineteenth century, the use of oxen had more or less died out.
Using assumptions about consumption of oats and pulses by mature and immature
animals, it is possible to derive estimates of farm animal consumption, which are then
subtracted from gross output to derive arable output net of seed and animal consumption
in Table 3.
During the medieval period, output of wheat and rye, the principal bread grains,
declined substantially from the peak of the late thirteenth century, with a sharp fall in line
with population following the Black Death of the mid-fourteenth century. The output
decline was even sharper for oats, which fell out of favour as a crop for human
consumption. In place of malted oats, malted dredge (a barley/oats mixture) and malted
barley became the preferred brewing grains, and demand for barley remained buoyant.
Output of pulses also held up well during the medieval period.
9
By the end of the sixteenth century, output of the major grains was back to the
peak pre-Black Death level. Output of wheat continued to increase after 1600, while rye
declined. This reflected the growing preference for the more expensive bread grain. The
output of barley also increased markedly in line with the demand for better quality ale
brewed from the best barley malt. Output of pulses also grew throughout the early
modern and modern periods, but less rapidly than wheat and barley, while potatoes
became an important crop during the eighteenth century. Output of oats, net of
consumption by farm horses, fluctuated more erratically.
2. Pastoral farming in England, 1250-1850
The starting point for deriving the numbers of non-working animals is again the stocking
densities. As with the working animals, particular care must be taken for the medieval
period in moving from the stocking densities on the demesnes to the numbers of animals
in the country as a whole. Conversion of the seigniorial stocking densities into
corresponding national densities and numbers of animals is based on four key
assumptions. First, following Allen (2005), it has been assumed that due to their high unit
capital value, the density of cattle was one-third lower on the non-demesne lands.
Second, again following Allen (2005), mature cattle have been divided into milk and beef
animals in the ratio 53 to 47 percent. Third, swine, a quintessentially peasant animal, are
assumed to have been stocked at double the density by non-seigniorial producers
(Wrigley, 2006). Fourth, aggregate sheep numbers are assumed to have been stationary in
the long term, in contrast to their dynamic growth in the seigniorial sector. This is
10
consistent with trends in exports, inferred levels of domestic demand, and the decline in
average fleece weights noted by Stephenson (1988: 380).
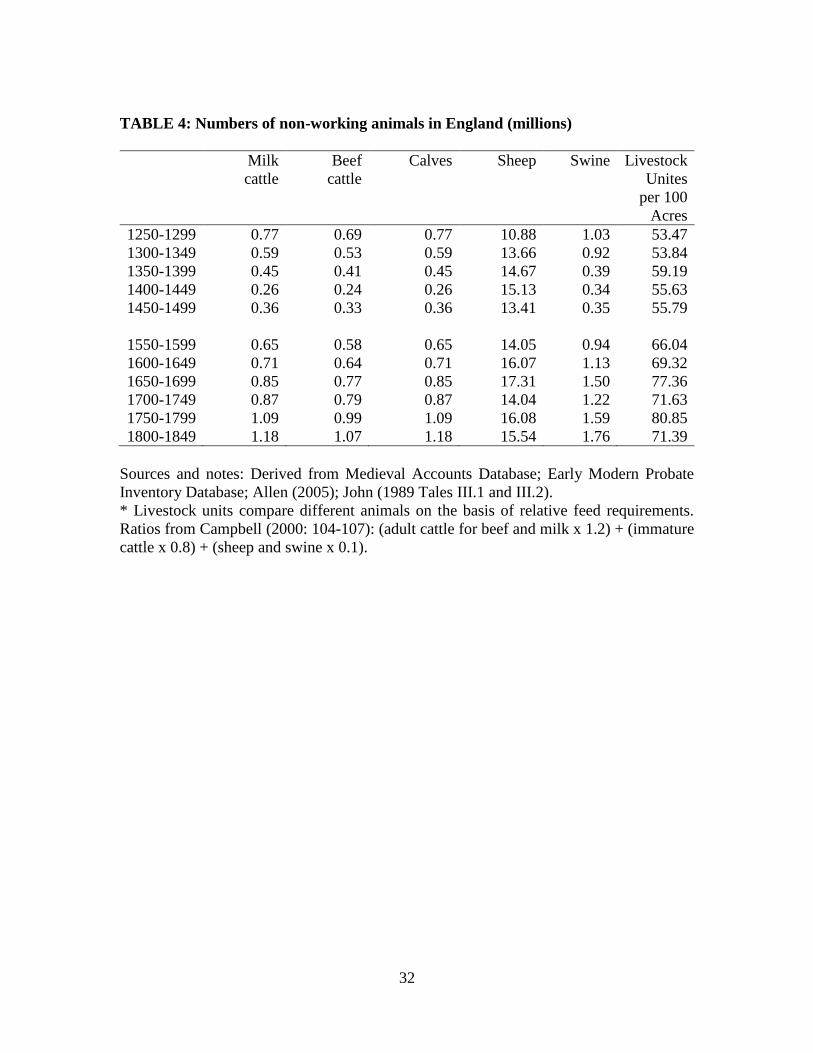
Stocking densities can also be obtained for the early modern period from probate
inventories, but are unavailable for the modern period. For 1750 onwards, animal
numbers are taken directly from contemporary estimates, summarised in John (1989), and
interpolated using data on annual sales at Smithfield Market from Mitchell (1988: 708).
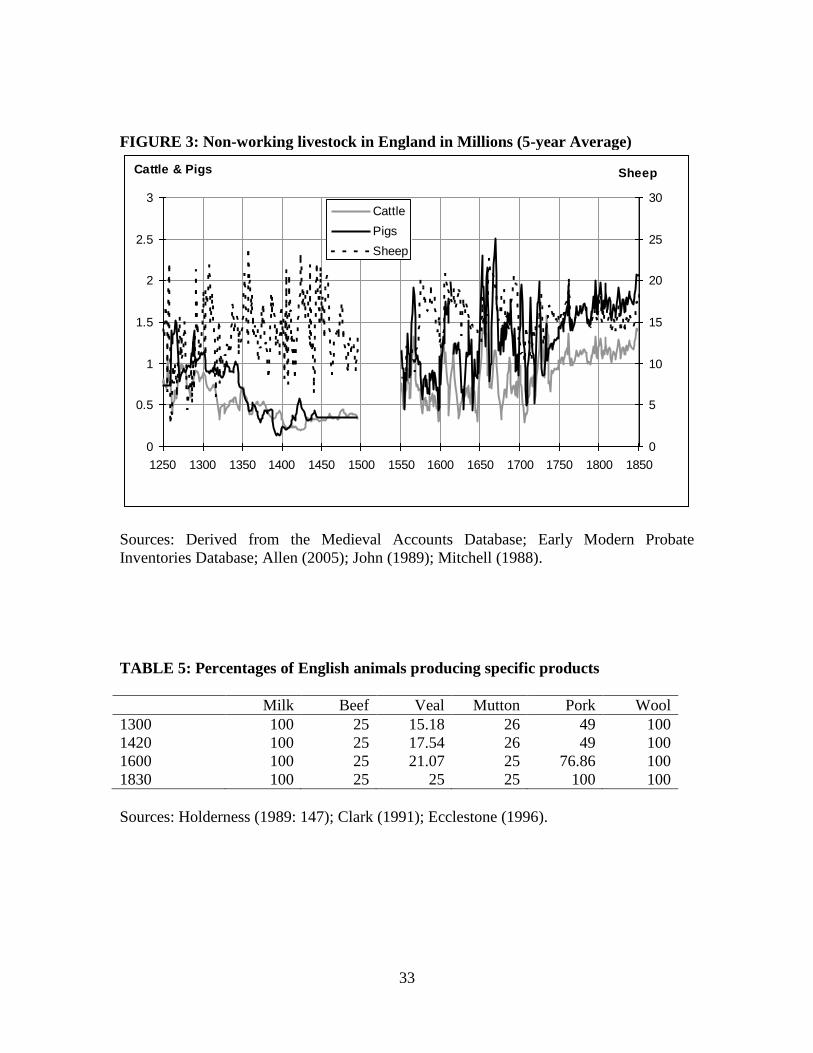
Non-working animal numbers for the whole period 1250-1850 are shown in Figure 3.
Calculating the output of the pastoral sector is more speculative than the
equivalent calculation for the arable sector, since the percentages of animals producing
specific products and the yields per animal have attracted less attention from historians
than crop yields. Until more systematic work is done on the sources, the estimates
advanced here are necessarily provisional.
The proportions of animals assumed to have been producing milk, meat and wool
are set out in Table 5. For simplicity, all cows are assumed to have produced milk and all
sheep to have yielded wool. Meat, however, was produced only by those animals that
were slaughtered. Following Holderness (1989: 147), it is assumed that a quarter of the
stock of cattle and sheep and all pigs, apart from those retained for breeding, were
slaughtered. These basic assumptions have been qualified with additional information
from Clark (1991) and Ecclestone (1996).
11
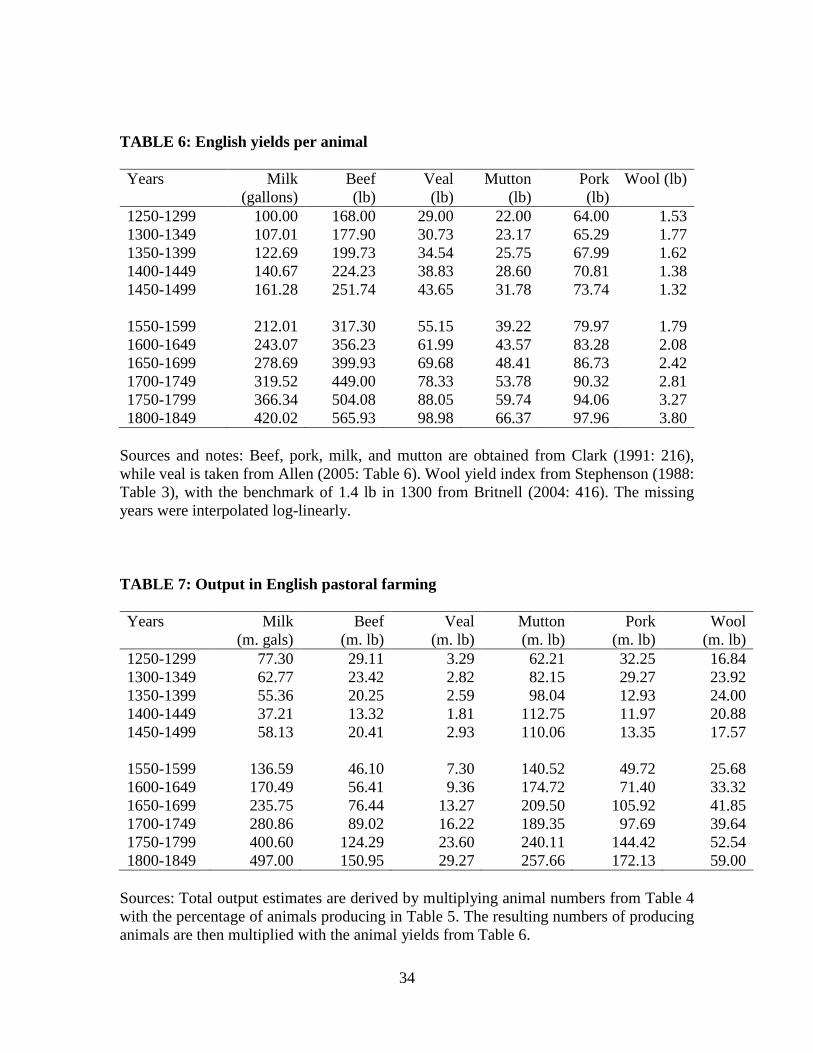
The next step in the calculations involves the estimation of yields of milk, meat
and wool per animal. Table 6 sets out preferred estimates, drawn from a number of
sources, including Clark (1991), Allen (2005), Stephenson (1988) and Britnell (2004).
Finally, Table 7 combines the information on numbers of animals, percentages of each
animal producing and yields per animal to provide estimates of output in the pastoral
farming sector.
Further assumptions are needed to derive output estimates for hay, hides and
skins, and dairy products. Hay output is derived from the numbers of non-farm horses, on
the assumption that each horse consumed 2.4 tons of hay per year (Allen, 2005). Output
of hides and skins is derived from the numbers of working and non-working animals
using assumptions on the percentages of each animal producing and yields per animal
from Clark (1991), Clarkson (1989) and Ecclestone (1996). In the dairy sector, output is
split between cheese, butter and fresh milk using data from Biddick (1989) and
Holderness (1989).
3. Total agricultural output in England, 1250-1850
Multiplying the output volumes by their prices yields the total value of net output. The
price data are taken largely from Clark (2004), who synthesises the published data of
Beveridge (1939), Thorold Rogers (1866-1902: volumes 1-30) and the multi-volume
Agrarian History of England and Wales, as well as integrating new archival material,
principally from the unpublished papers of William Beveridge and David Farmer. To
this, have been added the prices of hides from Thorold Rogers (1866-1902: volumes 1-
12
30) and of rye from Farmer (1988; 1991). Output can be valued in both current prices and
in constant 1700 prices.
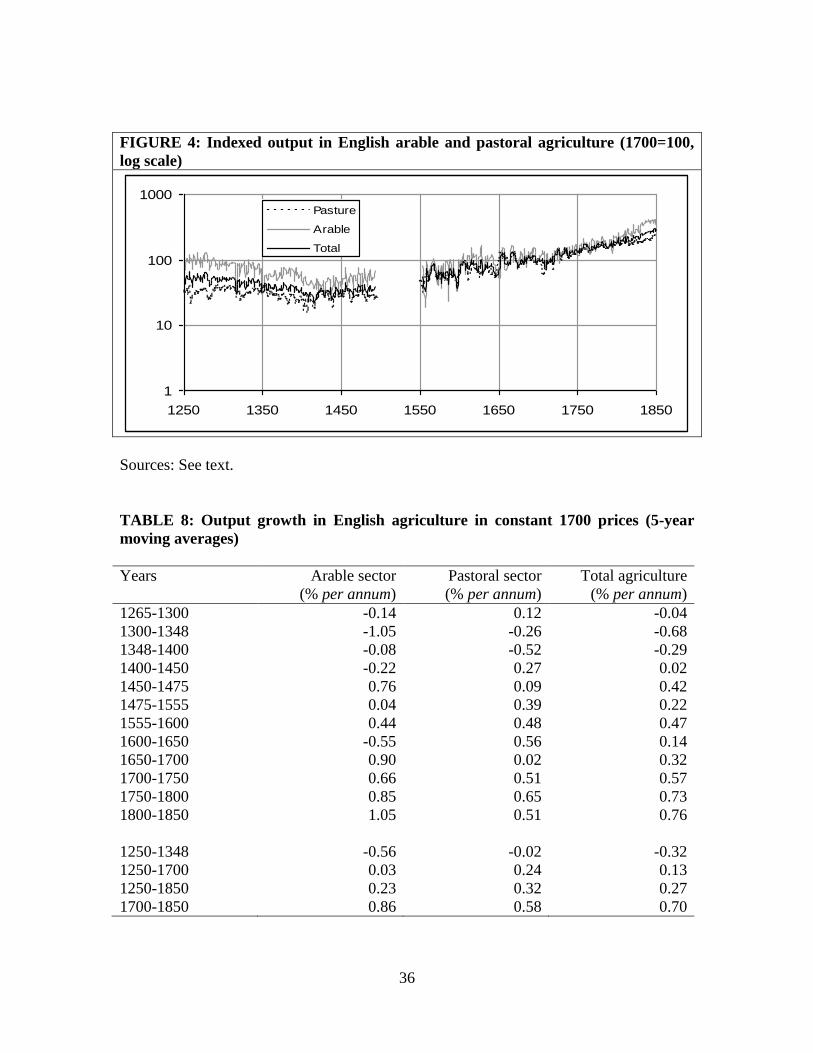
Figure 4 plots arable, pastoral and total agricultural output in constant prices on a
logarithmic scale, while Table 8 summarises the same information in growth rate form,
using 5-year averages. During the medieval period, arable output exhibited a downward
trend, while pastoral output showed long run stability. Agriculture as a whole thus
showed a modest decline in output. From the mid-sixteenth century, arable and pastoral
output grew at similar rates in real terms.
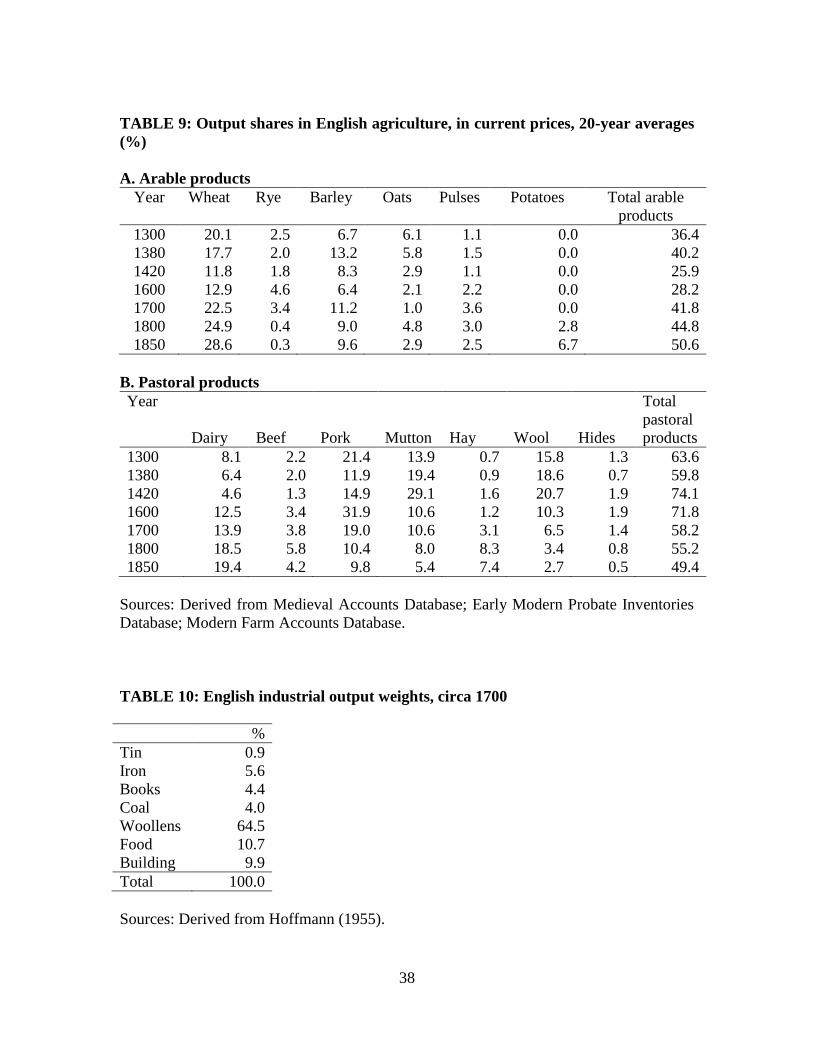
The price of pastoral products relative to arable products was relatively stable
during the medieval period, but then declined substantially after about 1500. As a result,
the pastoral sector increased its share of output in current price terms, as well as in
constant price terms, during the medieval period. After 1500, however, the share of the
pastoral sector declined in current price terms despite the broad stability of its share in
constant prices. Current price shares of individual products, as well as the arable and
pastoral sectors are shown in Table 9.
III. INDUSTRIAL PRODUCTION
1. Industrial output in England, 1300-1700
For the period before 1700, it is possible to obtain volume measures of some of the key
industries, including woollen textiles, iron, coal, tin and books. Exports of wool and
woollen cloth are given by Carus-Wilson and Coleman (1963) for the period 1280-1554.
13
However, the export of wool is negatively related to the export of cloth, so we use the
production of wool from agriculture minus wool exports as an indicator of the woollen
textile industry. King (2005) provides data on bar iron production for the period 1490-
1700. The output of coal in the 1560s and circa 1700 is taken from Hatcher (1993: 68),
interpolated using shipments of coal from Newcastle, taken from Nef (1932: 380-381).
Book production is measured by the index of new English language book titles obtained
from the English Short Title Catalogue (http://www.rlg.org/estc.html). Tin output is
available on an annual basis for the whole period from 1300 with relatively few gaps,
from Hatcher (1973: 156-159) and Mitchell (1988: 303-304). Food processing is assumed
to grow in line with agricultural output, while building is assumed to grow in line with
population.
We provide an index of industrial production using the weighting scheme shown
in Table 10. The weights for circa 1700 are derived Hoffmann (1955), but with a number
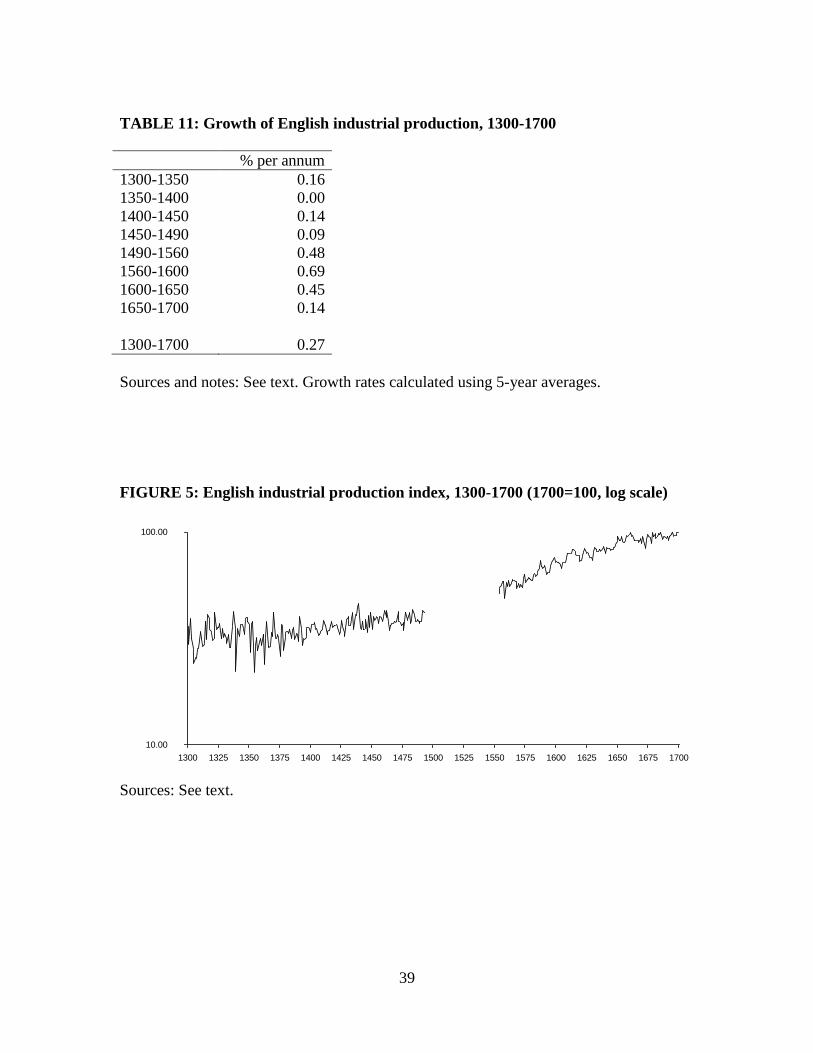
of modifications, including an allowance for the printing industry. Table 11 presents data
on industrial growth rates over fifty year periods. As in agriculture, there was a sharp
increase in the growth rate of the industrial sector after 1500 and a clear deceleration
during the second half of the seventeenth century. Both movements are clearly visible in
Figure 5.
2. Industrial output in Great Britain, 1700-1850
Industry is the one sector for which data have previously been analysed at annual
frequency during the period 1700-1850, building on the pioneering work of Hoffmann
14
(1955). However, as Crafts (1985) and Harley (1982) pointed out independently,
Hoffmann (1955) inadvertently overstated the growth rate of industrial output during the
Industrial Revolution as a result of his weighting procedures. The problem is that a few
industrial branches, most notably cotton and iron, grew much more rapidly than the rest
of industry, and these branches are included in Hoffmann’s data set. However, the
available time series cover only 56 per cent of industrial output, and the weights of these
industries are increased proportionally to achieve 100 per cent coverage of industrial
output. But this means that the unrepresentative, rapidly growing branches of cotton and
iron effectively have their weights doubled. Harley (1982) and Crafts et al. (1989)
propose that only the weights of industries other than cotton and iron should be increased
to arrive at 100 per cent coverage.
In addition to changing the weighting scheme, Harley (1982) and Crafts et al.
(1989) also replaced some of the older series used by Hoffmann (1955), drawing on the
latest scholarship. We use these series, together with some later additions, the most
important of which are the new series of bar iron output from King (2005), Feinstein’s
(1988: 446) series of investment in total buildings and works for output of the building
industry, and an index of new English language book titles derived from the English
Short Title Catalogue and the British Library for the output of the printing industry.
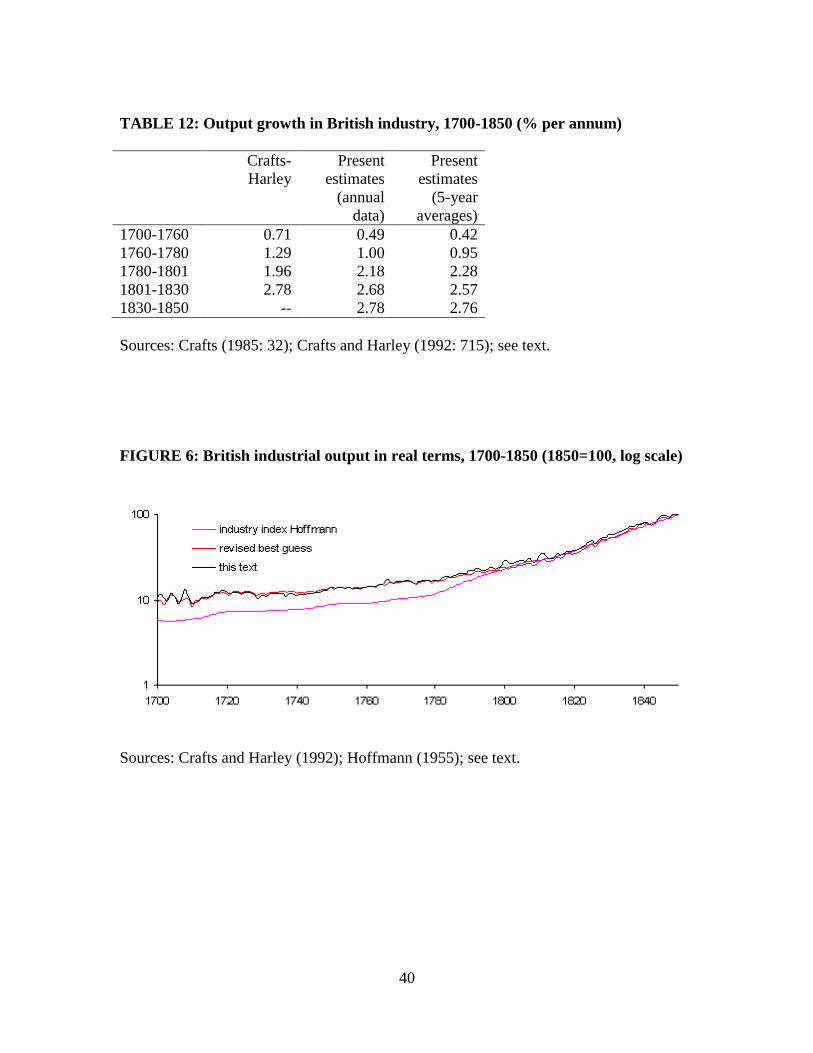
Figure 6 presents our series for industrial output, together with the “revised best
guess” series of Crafts and Harley (1992) and Hoffmann’s (1955) original index for
contrast. The biggest difference is between the Hoffmann index and the other two
15
indices, as a result of the excessive weight given to cotton textiles and iron in the former.
Our series shows slightly slower growth than the Crafts-Harley index during the early
eighteenth century, largely as a result of the inclusion of new series, particularly King’s
(2005) data for the iron industry. From the mid-eighteenth century onwards, differences
between the two series are relatively minor, and essentially confirm the picture originally
presented in Crafts et al. (1989). Output growth accelerated from around 1740 to 1840
before tapering off. Again, there is quite a substantial cyclical dimension to industrial
output. Table 12 presents the annual growth rates of industrial output over the
conventional sub-periods calculated using both the raw annual data and 5 year averages,
together with the Crafts-Harley estimates for comparison.
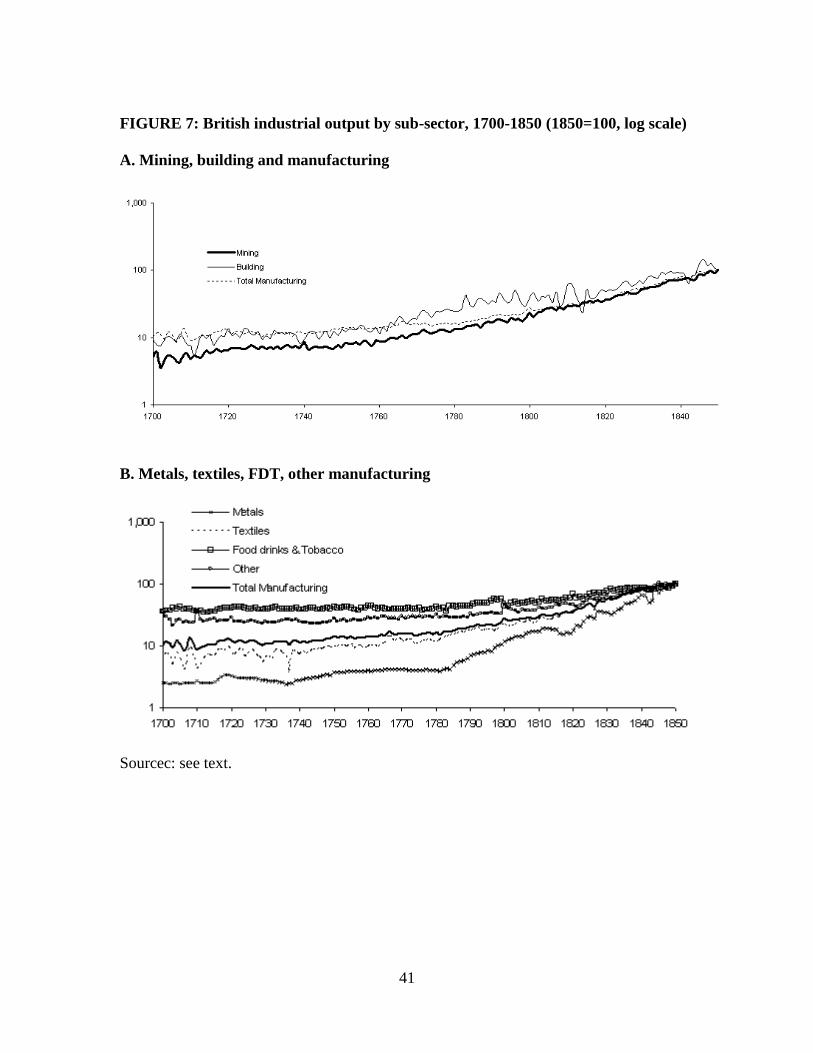
Part A of Figure 7 provides a breakdown of industrial production into
manufacturing, building and mining. The fastest rate of growth was in mining, with
manufacturing and building growing at similar rates over the period as a whole. Part B of
Figure 7 disaggregates manufacturing production into four main sectors. The most rapid
growth was in metal production, driven by the iron industry. Note that although textiles
as a whole grew only at about the same rate as the total manufacturing sector, this is
because the rapid growth of the cotton industry was offset by slower growth in the more
traditional textile industries. Food, drink and tobacco, and other manufacturing grew
more slowly.
IV. SERVICES
1. Services in England, 1300-1700
16
The service sector has received much less attention from economic historians than
agriculture and industry. Here, we follow the approach used by Deane and Cole (1967) to
estimate service sector output in eighteenth century Britain. For England 1300-1700, we
break down services into government, commerce, and housing and other services. For
government, we use an 11-year moving average of real government revenue from
O’Brien and Hunt (1999), which is available for the whole period from the European
State Finance Database at http://www.le.ac.uk/hi/bon/ESFDB/frameset.html. We follow
Deane and Cole in assuming that commerce grew in line with industry, while housing
and other services are assumed to grow in line with population.
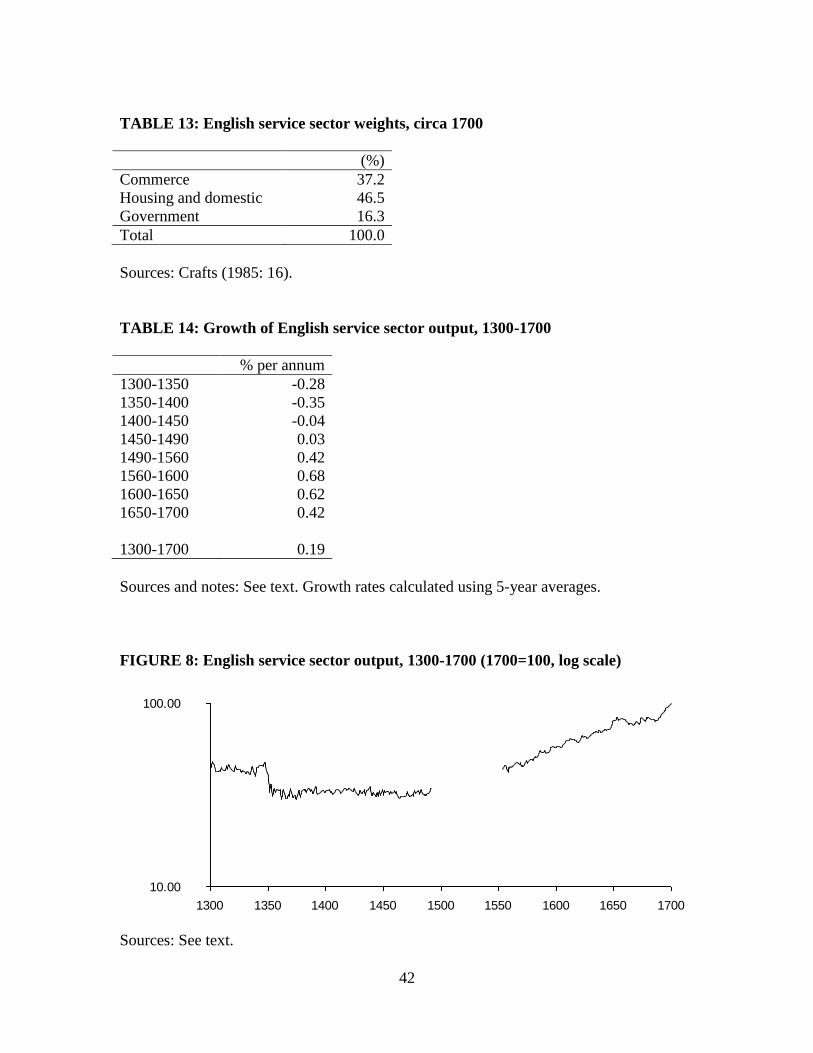
The weights for services are shown in Table 13, and are taken from the 1688
shares in Crafts (1985: 16). The resulting series for total service sector output are plotted
in Figure 8, and the growth rates presented in Table 14. Because of the importance of
housing and other services, which are assumed to move in line with population, total
service sector output trended downwards between 1300 and 1500, before picking up
strongly between 1500 and 1650. The fall in the growth rate during the second half of the
seventeenth century was less pronounced than in industry or agriculture. These trends are
graphed here in Figure 8.
2. Services in Great Britain, 1700-1850
For Great Britain, 1700-1850, we again follow the approach of Deane and Cole (1967),
who provided estimates for benchmark years. Here, however, we provide data at an
annual frequency. Also, we take account of the downwards revision by Crafts (1985) of
17
Deane and Cole’s estimates of service sector growth, particularly for the early nineteenth
century. For the eighteenth century Deane and Cole (1967: 76-78) assumed that
“commerce” grew at the same rate as industry, that “rent and miscellaneous services”
increased in line with population, and that “government and defence” could be measured
by real public expenditure. Crafts (1985: 35-37) made only minor changes here. For the
nineteenth century, however, Deane and Cole (1967: 166) derived estimates of income in
“trade and transport”, “domestic and personal”, “housing”, “government, professional
and other services” and deflated them by the Rousseaux price index. Crafts (1985: 31)
showed that this produces an implausibly high rate of growth for commerce, and assumed
instead that commerce grew in line with national income, thus introducing an element of
iteration into the estimates. Crafts (1985: 35-37) used employment growth for domestic
and personal services and new estimates of the housing stock for housing. He also revised
the growth rate of government using new data on employment growth.
Our estimates are broadly consistent with those of Crafts (1985), but make a few
changes to reflect the need for annual data. The most important difference is in
commerce, where we measure the growth of output using volume series covering
transport, finance and other commerce. This produces results which are not far out of line
with the Deane and Cole (1967) assumption for the eighteenth century, that commerce
grew in line with industry. This also avoids the iterative element in the Crafts (1985)
assumption that commerce grew in line with national income during 1801-31, and
ensures consistency of treatment throughout the whole period.
18
For government, we use civil government and defence expenditure throughout the
whole period, deflated using the Schumpeter-Gilboy and Rousseaux price indices. For
housing, we use the stock estimates of Feinstein (1988: 389), using a regression
relationship between housing stock and population to fill in gaps. Output of domestic and
personal services is assumed to rise in line with population throughout the whole period,
following Deane and Cole (1967) and Crafts (1985). This inevitably produces a relatively
stable path for output in domestic and personal services, which is consistent with most
assessments of this sector.
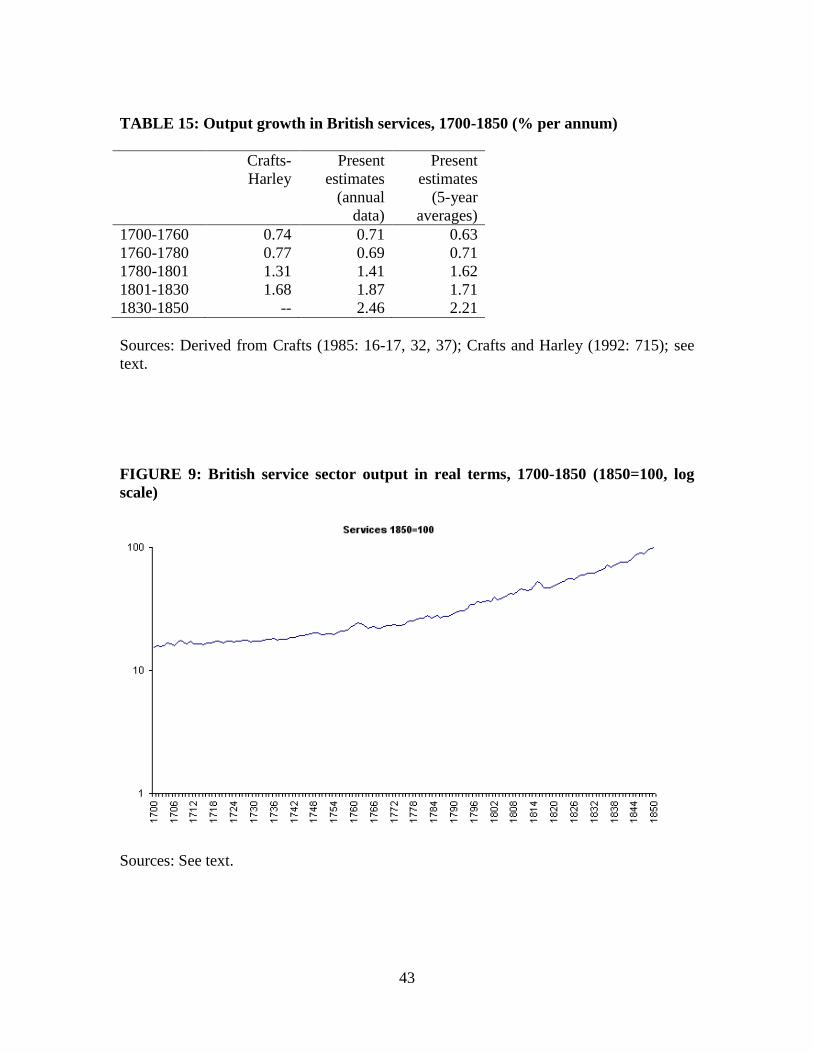
Our annual index of service sector output is plotted in Figure 9. The trend pattern
is of an increase in the growth rate from around 1780. As is usually the case, fluctuations
in services were milder than in industry or agriculture. Table 15 presents the annual
growth rates of services output over the conventional sub-periods calculated using both
the raw annual data and 5 year averages, together with the Crafts-Harley estimates for
comparison. Our growth rate estimates using the annual data are quite close to the Crafts-
Harley data, but using 5-year averages largely removes any difference between the 1780-
1801 and 1801-1830 periods.
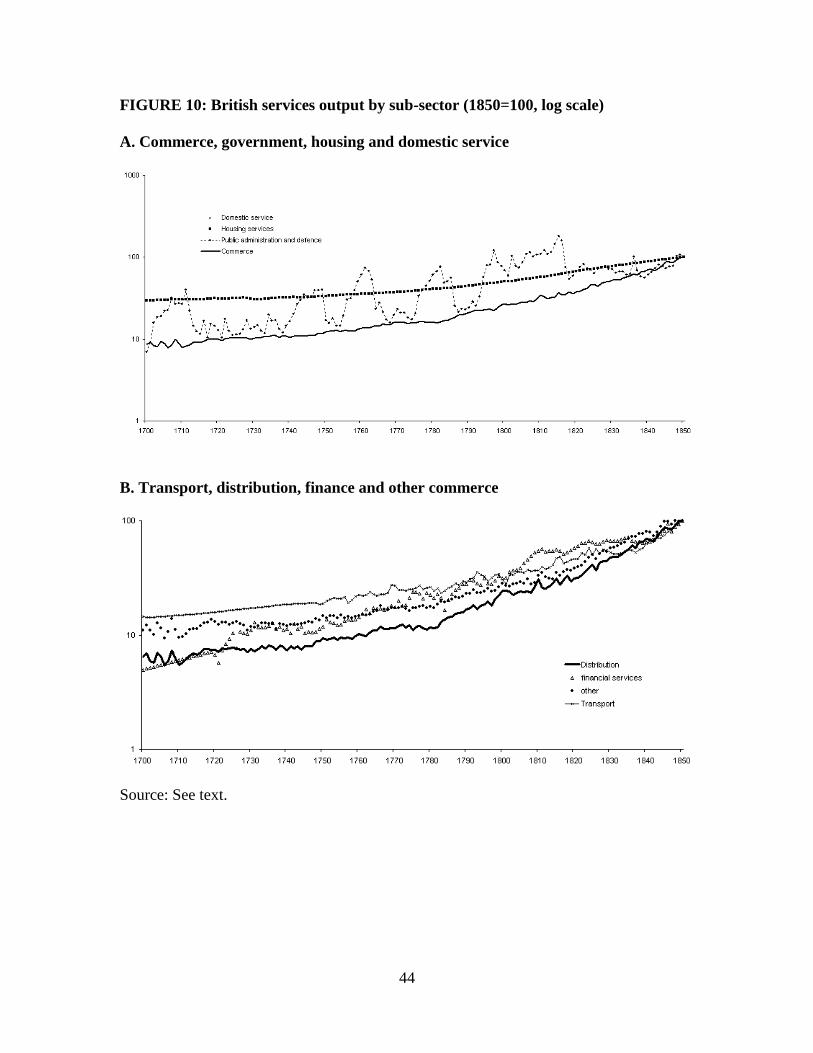
Figure 10 provides more detail on the service sector. Part A provides information
on commerce, government, housing and domestic services, while Part B breaks down
commerce into transport, distribution, finance and other commerce. In Part A, we see that
government grew most rapidly between 1700 and 1801, albeit in a sharply cyclical
fashion as a result of warfare. For the period 1801-1850, commerce was clearly the
19
fastest growing sector. Housing and domestic services grew more slowly but more
steadily than government or commerce. The former two series coincide in the chart
because domestic services were assumed to grow in line with population, whilst we found
a unit elasticity between housing and population. In Part B, we see that distribution and
finance grew more rapidly than transport, with finance particularly dynamic during the
first quarter of the nineteenth century, but distribution more dynamic during the second
quarter.
V. REAL GDP, POPULATION AND GDP PER CAPITA
1. Real GDP and GDP per capita in England, 1300-1700
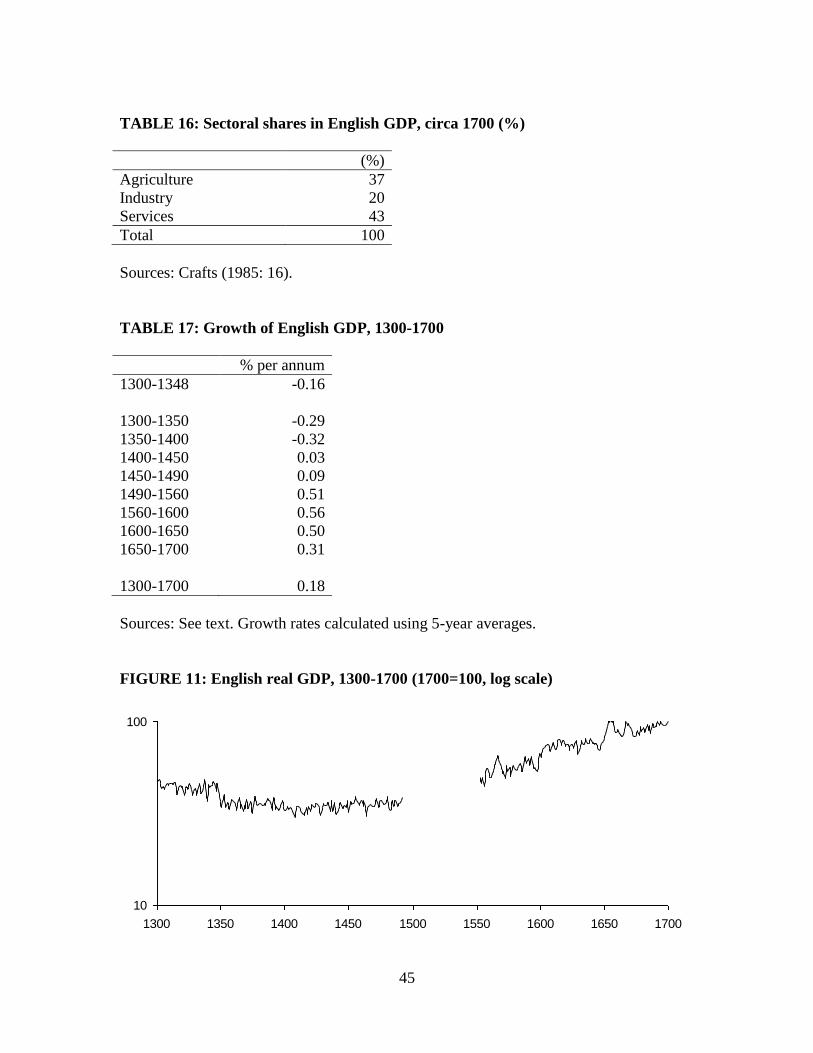
It is now possible to construct an index of real GDP for England over the period 1300-
1700 from the above series for agriculture, industry and services, using the sectoral
weights from Crafts (1985) for circa 1700, shown here in Table 16. The resulting series,
plotted in Figure 11, can be used to calculate growth rates over 50-year periods, presented
in Table 17. English GDP fell slightly between 1300 and 1500, before showing strong
growth between 1500 and 1650 and slower growth between 1650 and 1700. Over the
whole period 1300-1700, the English economy averaged a growth rate of 0.18 per cent
per annum.
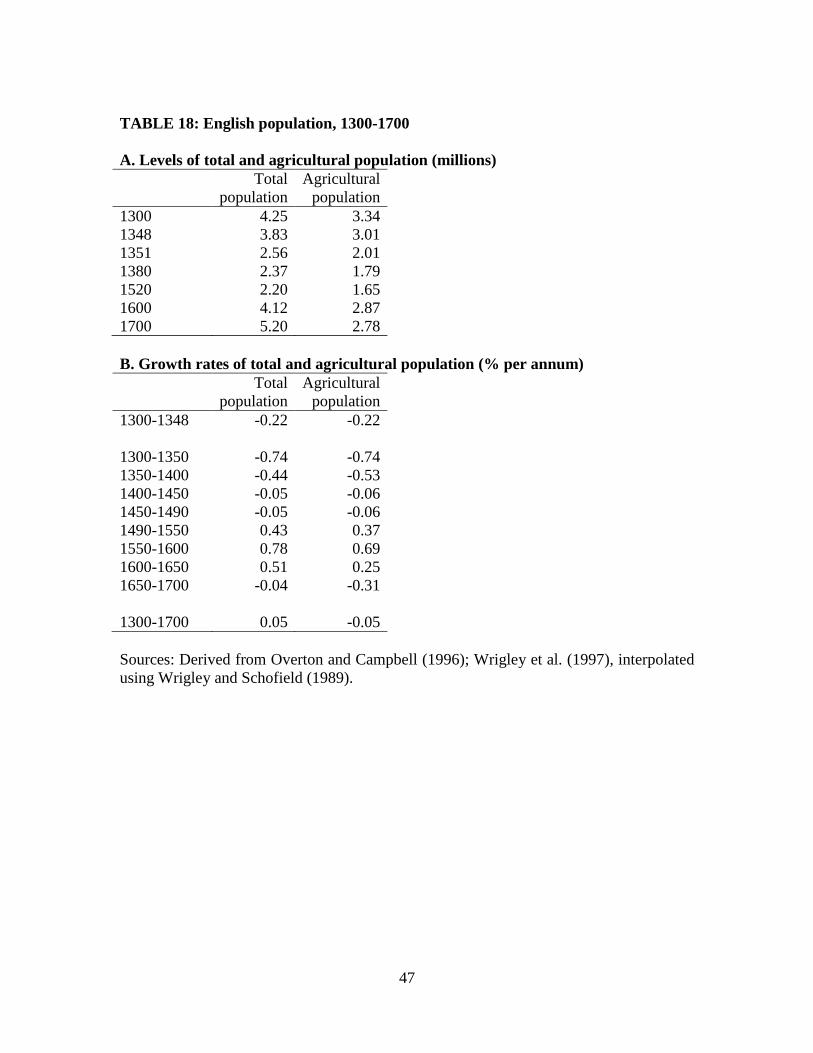
Ultimately, we are interested in what happened to GDP per capita, the most
widely accepted indicator of material living standards over the long run. Although the
population of England has been firmly reconstructed by Wrigley and Schofield (1989)
and Wrigley et al. (1997) for the period since the compulsory registration of births,
20
marriages and deaths, estimates before 1541 are more speculative. The data in Table 18
are based on the estimates of Wrigley et al. (1997), interpolated using Wrigley and
Schofield (1989) for the period 1600-1871 and Overton and Campbell (1996) for earlier
years. We have taken the mean of the Overton and Campbell estimates, which were
reported on the basis of upper and lower bounds. Additional observations have been
added between 1300 and 1380 by interpolation using assumptions derived from the
literature. This involves the assumption of a slow rate of decline in the population,
punctuated by the dramatic decline of the Black Death years 1348-51 and a number of
smaller crises. It should be noted that these population estimates are at the lower end of
the range of possibilities that have been suggested for the end of the thirteenth century,
with Hatcher (1977) and Smith (1991) arguing for a population of 6 million around 1300,
compared with the range of 4.0 to 4.5 million suggested by Overton and Campbell
(1996). However, as Overton and Campbell (1996) point out, such a high population
estimate has implications for other variables such as land use, crop combinations, yields
and kilocalorie extraction rates and the share of the population living in towns, which
would be hard to square with other evidence.
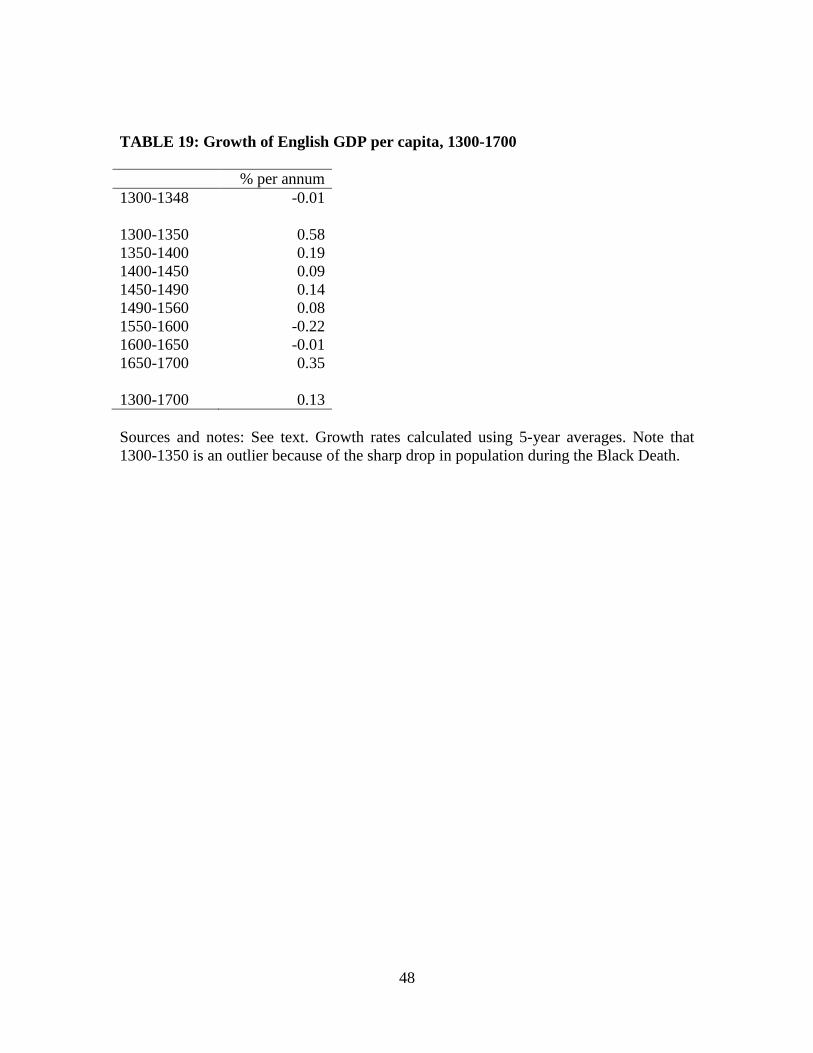
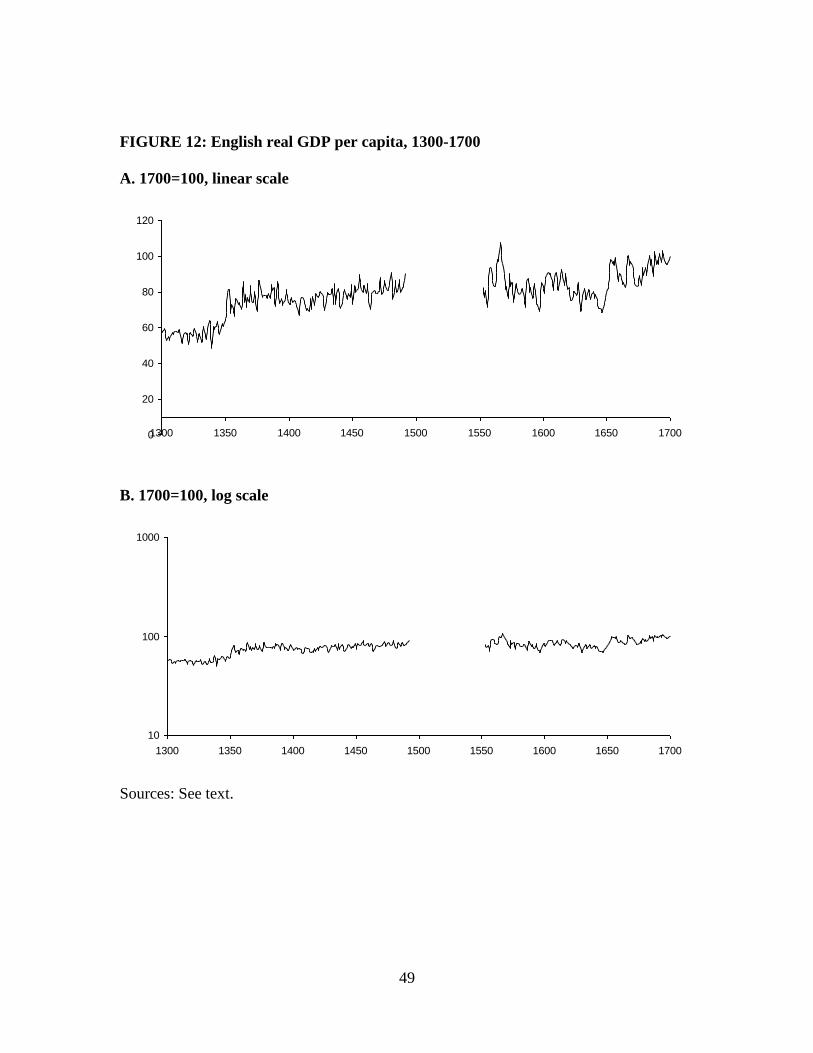
Combining the population data with the real GDP series produces our estimates of
GDP per capita growth in Table 19. The trend is of modest positive per capita income
growth between 1300 and1700, at an average annual rate of 0.13 per cent. However, the
path of growth was episodic. We find that GDP per capita was almost constant up to
1348, but received a sharp boost with the Black Death, and continued to grow during the
rest of the fourteenth century. Per capita incomes continued to grow quite modestly
21
between 1400 and 1550. Between 1550 and 1650, per capita incomes declined slightly
before returning to growth in the second half of the seventeenth century. These trends can
also be seen in Figure 12, which plots GDP per capita on both linear and logarithmic
scales.
2. Real GDP and GDP per capita in Great Britain, 1700-1850
For the period 1700-1850, our estimates of real GDP are for the territory of Great Britain.
We have assumed that British agriculture can be represented by developments in
England, so that the addition of Wales and Scotland merely raises the level of production,
leaving the trend and annual fluctuations unchanged. The time series for industry and
services refer to the territory of Great Britain. We present our weights in Table 20, taken
from Crafts (1985: 16-17). Crafts based his estimates upon Lindert and Williamson’s
(1982) revision of the social tables of Gregory King [1696] for 1688, Joseph Massie for
1759 and Patrick Colquhoun for 1801/3.
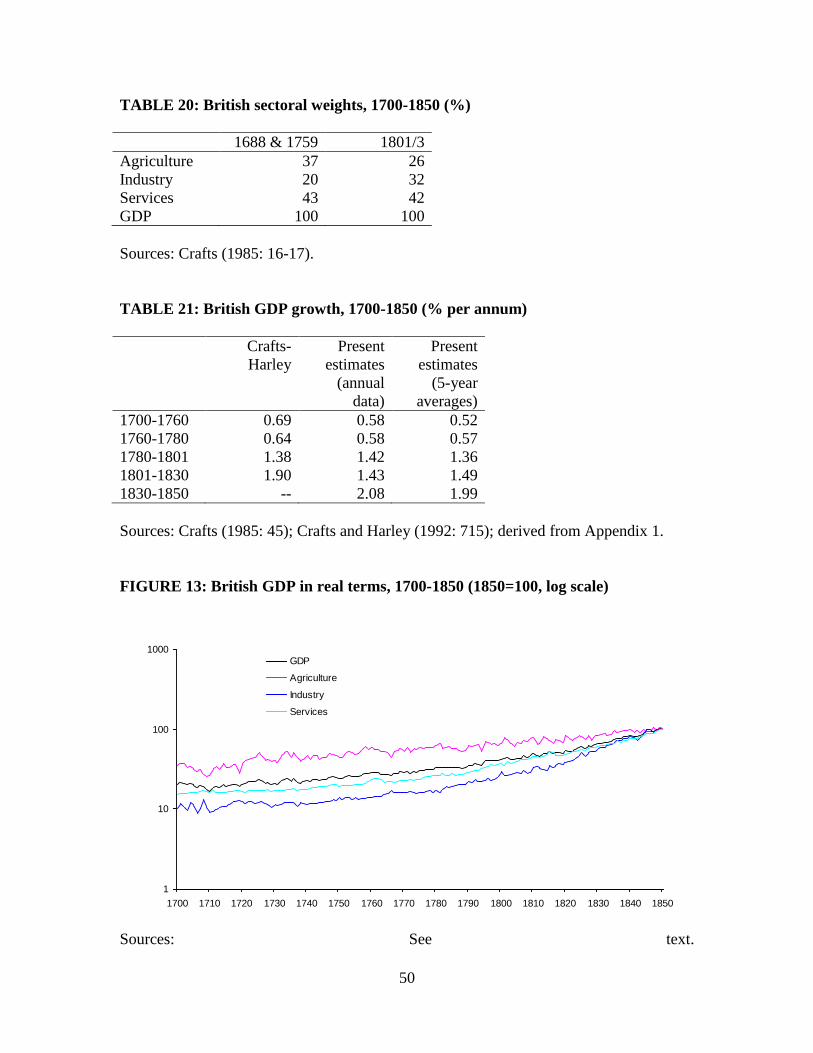
Putting the three main sectors together using the weights from Table 20, we arrive
at the annual index of British real GDP shown in Figure 13. Our series shows much the
same pattern of trend growth acceleration as the Crafts-Harley data, although the growth
rate during the period 1801-1830 is somewhat lower in our series, as a result of the lower
growth rate in agriculture at this time. This can be seen clearly in Table 21, which
presents the annual growth rates of aggregate output over the conventional sub-periods
calculated using both the raw annual data and 5 year averages, together with the Crafts-
Harley estimates for comparison. Figure 13 shows clearly that the fastest growth was in
22
industry and the slowest growth in agriculture, with services exhibiting an intermediate
growth rate.
To see what happened to per capita incomes, it is necessary to provide estimates
of the total population of Great Britain. From 1801 onwards, annual data on the
population of England, Wales and Scotland are available from Mitchell (1988: 9). For the
period before 1801, the population of England has been reconstructed firmly by Wrigley
and Schofield (1989) and Wrigley et al. (1997) for the period since the compulsory
registration of births, marriages and deaths. Since less information is available for Wales
and Scotland, we assume that the ratio of the population of Wales to England remained
the same for the period 1700-1801. For Scotland, we have population estimates for 1700
and 1750 (Schofield, 1994: 93). Other years are interpolated using the population of
England.
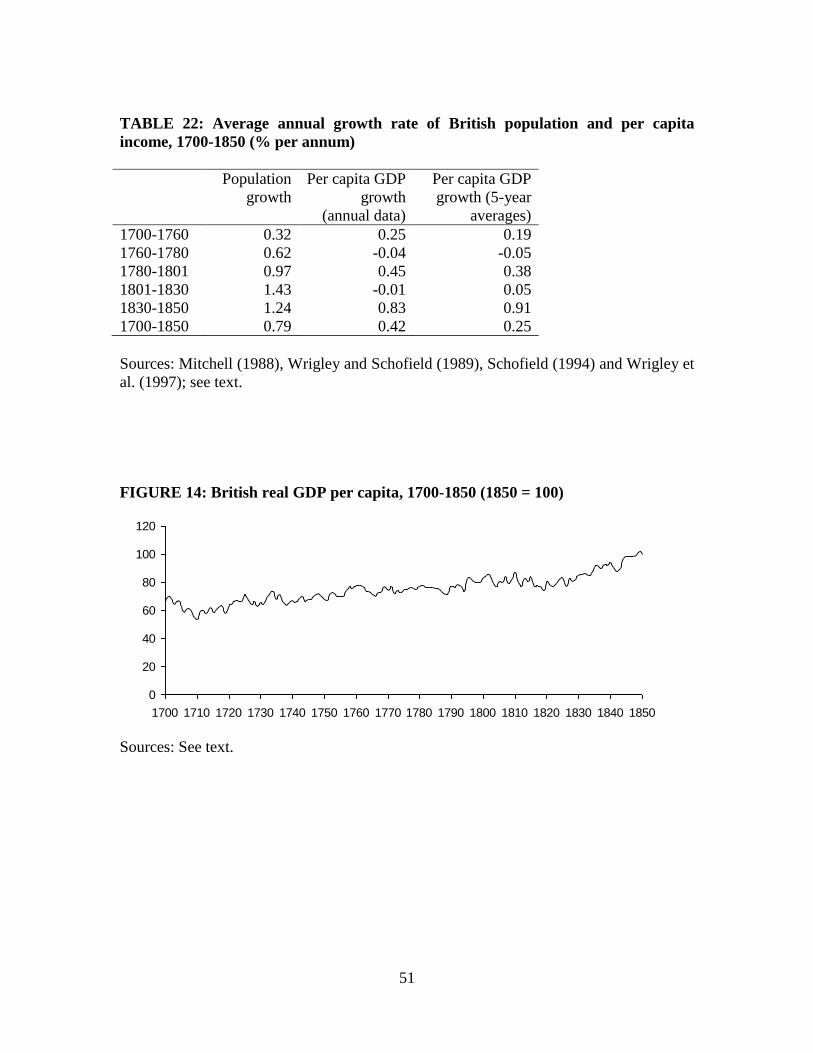
Combining the GDP series with the population data produces our estimates of per
capita income in Figure 14. Table 22 presents the same material in growth rate form. The
main finding is that per capita income growth slowed down considerably between 1760
and 1780, as agricultural output growth slowed. After an acceleration of growth between
1780 and 1801, the period 1801-1830 again witnessed slower per capita income growth.
However, for this period, agriculture, industry and services all witnessed substantial
growth, but this was outpaced by population growth. Only after 1830 did the growth of
the aggregate economy again substantially outpace population growth, leading to strong
growth in per capita incomes.
23
VI. PRICES AND NOMINAL GDP
1. Nominal GDP in England, 1300-1700
Real GDP can be converted to current prices by reflating the volume index by a price
index. The base year is 1688, where we have used the nominal value of GDP from
Snooks (1995: 50). This is taken from Lindert and Williamson (1982: 389), adjusted onto
an England only basis in line with the relative populations of England and Wales.
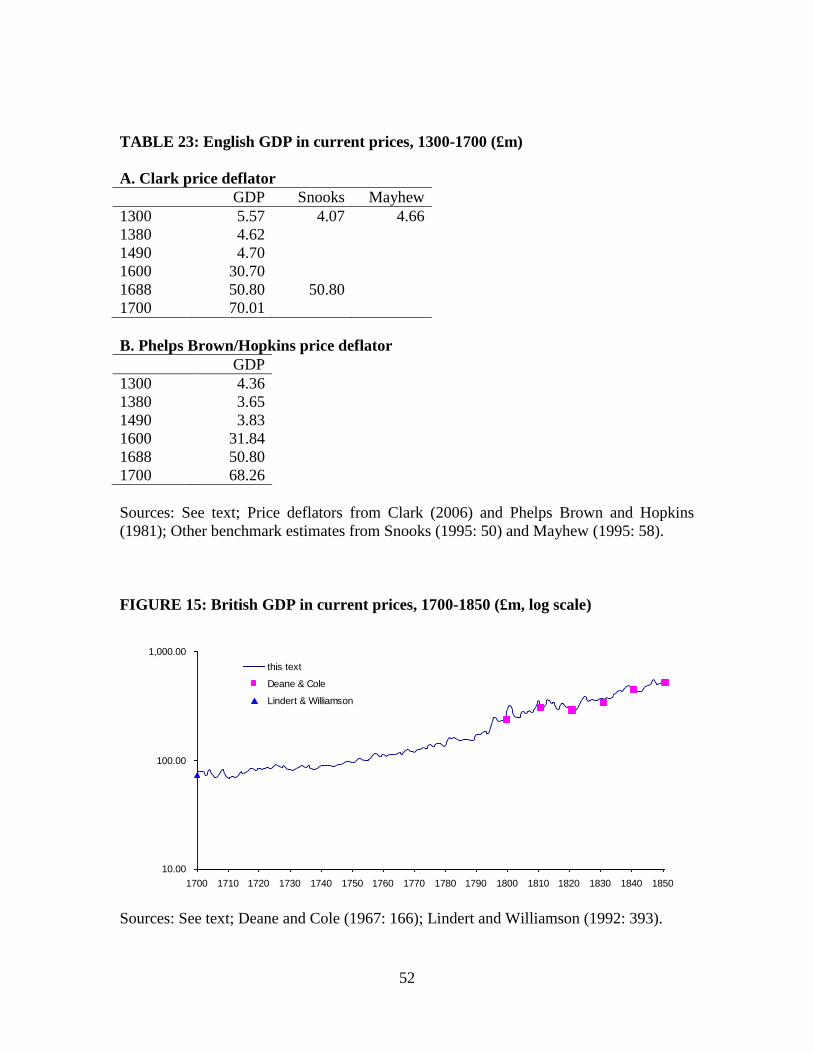
Estimates in Table 23 use two different price deflators, taken from Clark (2006) and
Phelps Brown and Hopkins (1981). The estimates using the Clark (2006) deflator
produce an estimate of GDP in 1300 which is higher than the independent benchmark
estimates of Snooks (1995) and Mayhew (1995). However, using the Phelps
Brown/Hopkins price deflator, the situation is less clear-cut, with our estimate of nominal
GDP in 1300 being lower than suggested by Mayhew, but higher than suggested by
Snooks.
2. Nominal GDP in Great Britain, 1700-1850
For the period 1700-1850, the estimates of real GDP in index number form can be stated
in constant prices simply by linking them to a benchmark estimate of GDP from Deane
and Cole (1967: 166). We work with 1841 as the benchmark year. Current price GDP can
be obtained by reflating the real output indices by sector-specific price indices. For
agriculture, our method involves the estimation of current price value added as well as
real output, with prices taken largely from Clark (2004). The price index for the industrial
sector is based on a weighted average of price series for industrial products. This series
24
moves closely in line with the Gilboy-Schumpeter price index for producers’ goods
between 1700 and 1800, and the Rousseaux price index for principal industrial products
from 1800 to 1850. However, it differs substantially from the industrial price index
estimated by O’Brien (1985), which has been criticised for its heavy reliance on raw
materials prices rather than prices of fabricated consumer goods (Overton, 2000: 140).
The price index for services is again obtained as a weighted average of price series
relating to individual service sector activities. Using the price series for agriculture,
industry and services to reflate real output in each sector yields the values for current
price GDP shown in Figure 15.
For comparison, we also show Deane and Cole’s (1967) current price GDP
estimates for other years, together with Lindert and Williamson’s (1982) revised figure of
Gregory King for 1688, projected forwards to 1700. The forward projection was made
using the Gilboy-Schumpeter price series to convert from 1688 to 1700 prices, and by
assuming the same real annual increase of 0.69 per cent between 1688 and 1700 as
occurred between 1700 and 1720. This yields an estimate of £73.1 million for England
and Wales, which is still a bit lower than our estimate of £79.14 million. However, it
must be remembered that our estimate applies to the whole of Great Britain, including
Scotland. Lee (1986: 127) estimates that Scotland contained 15.2 per cent of the
population of Great Britain in 1701, so assuming that GDP per head was lower in
Scotland than in England and Wales, the two figures are broadly consistent.
VII. CROSS-CHECKING THE OUTPUT ESTIMATES
25
1. Income and output based measures
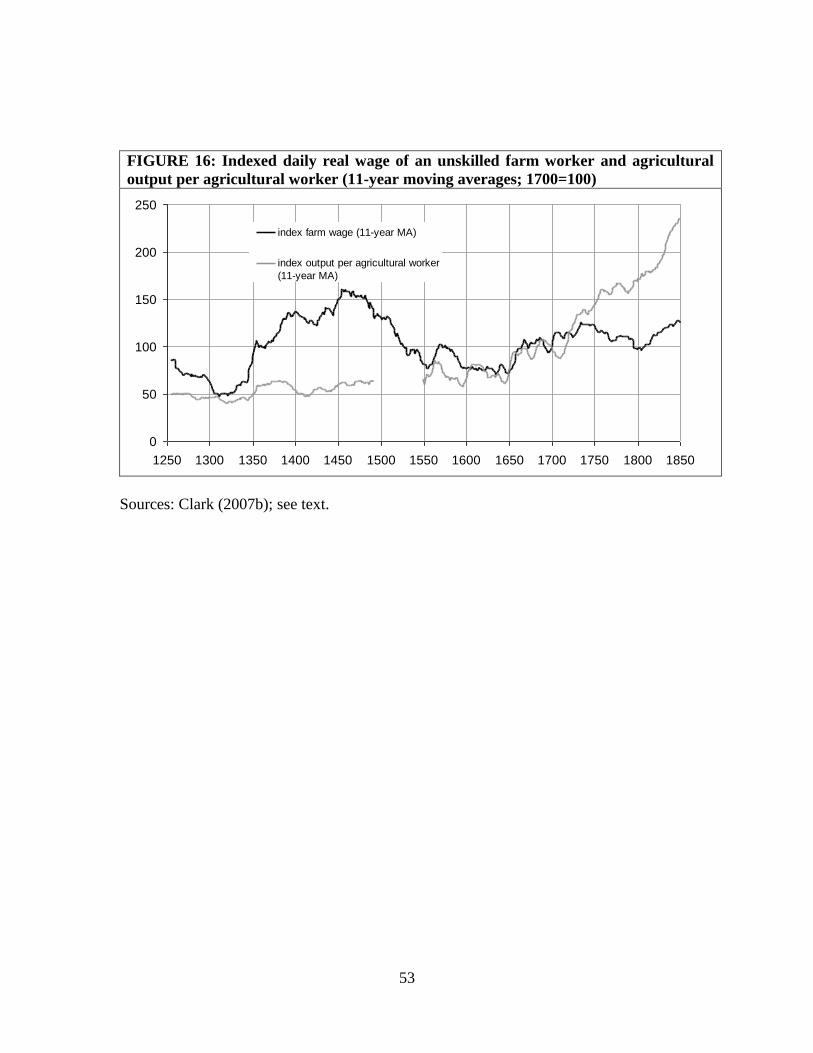
Figure 16 charts the indexed daily real wage of an unskilled farm labourer between 1250
and 1850, together with an index of agricultural output per worker in England. The real
wage series is taken from Clark (2007b), while the index of output per worker is obtained
by combining the agricultural output index from Figure 4 with the agricultural population
data from Table 18. In contrast to the upward trend of agricultural output per worker,
daily real wages in agriculture stagnated over the long run. Plotting the two series
together inevitably raises the issue of their compatibility. Here, this issue is pursued
within the framework of historical national accounting, where the value of net output
should equal the value of factor payments to labour, land and capital.
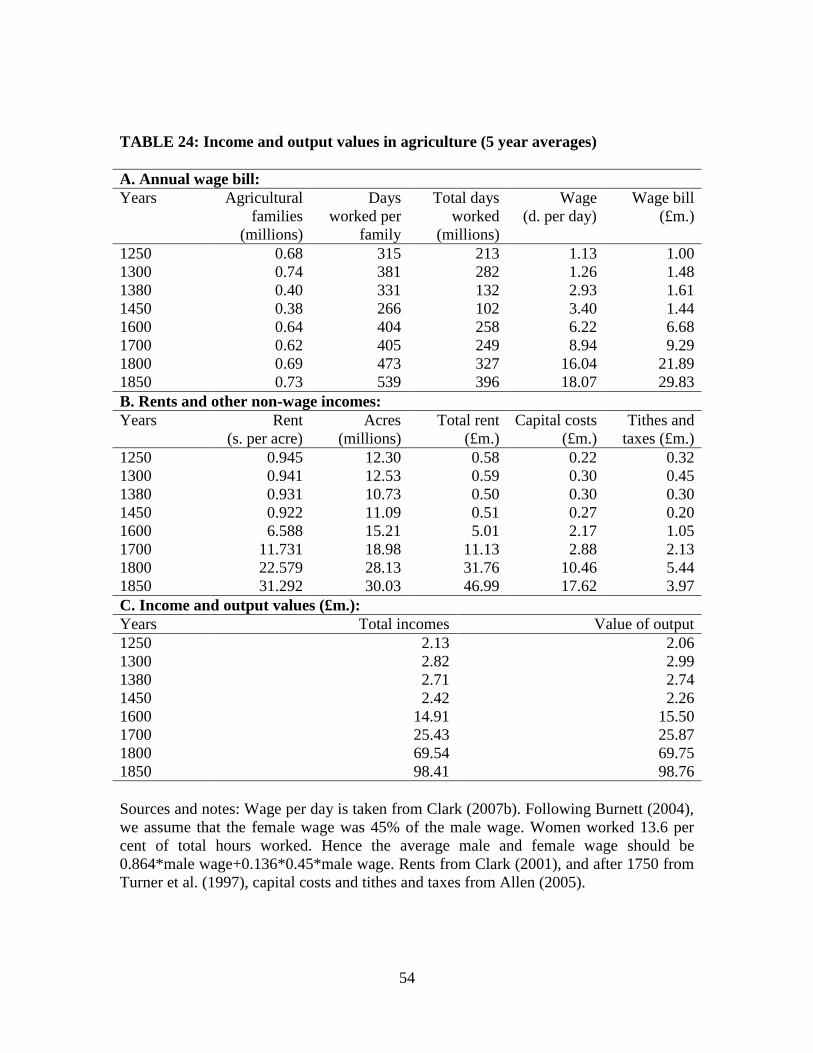
Starting on the income side, data on daily wages and the number of days worked
are needed to calculate payments to labour. The agricultural population estimates are
converted into the number of agricultural families in panel A of Table 24 on the
assumption that the average family consisted of two adults and 2.5 children (Allen,
2005). Allen (2005) then calculates the number of days needed to produce the output and
divides this by the number of families to arrive at the days worked per family. Allen’s
figure for days worked per family in 1300 has to be increased in order to reconcile it with
the data and results presented here. In contrast, his estimate for 1500 requires substantial
adjustment downwards, for two reasons. First, the estimate of output in the late fifteenth
century presented here on the basis of the medieval accounts database is substantially
lower than that assumed by Allen, who finds that despite a halving of the population,
agricultural output increased between 1300 and 1500. Second, the substantial increase in
26
days worked per family which Allen requires to achieve that increase in output would be
hard to square with most accounts of the response to the Black Death, which suggest a
decline in labour intensity (Bowden, 1967: 593-594). On the evidence summarised in
Panel A of Table 24, there was a substantial decrease in the number of days worked per
family between 1270 and 1450, consistent with an “indolent revolution” in contrast to the
suggestion of an “industrious revolution” in the early modern period (de Vries, 1994).
The industrious revolution can be seen in the substantial increase in days worked per
family between the sixteenth and nineteenth centuries.
To estimate total rental income requires data on rents and total land in use, set out
in Panel B of Table 24. Rents are obtained from the data of Clark (2001) and Turner et
al., 1997). The total land in use has to include pasture and meadow as well as arable land,
and is taken from Table 1, but multiplied with the ratio of pasture and meadow to arable
land from Allen (2005). Capital costs and tithes and taxes are also taken from Allen
(2005). Adding together wages, rents, capital incomes and tithes and taxes yields the total
incomes in Panel C, which matches reasonably well the value of output.
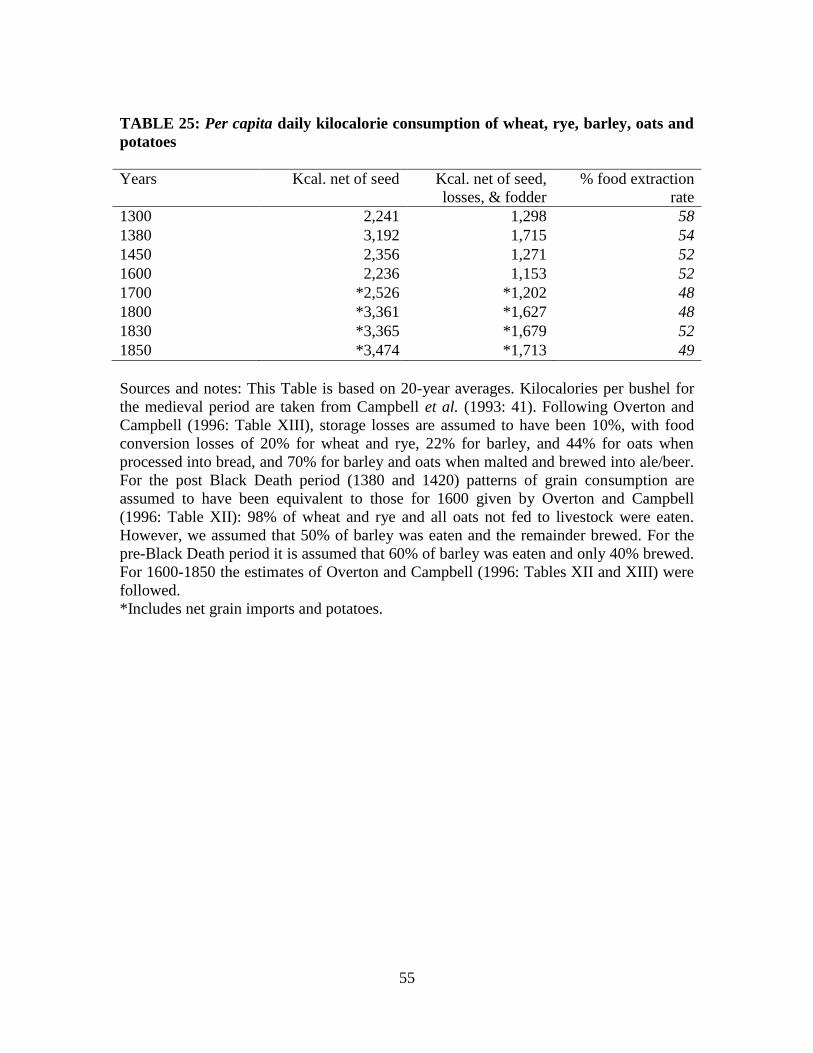
2. Consumption and output
An alternative way of assessing the credibility of the output estimates is to see what they
imply about the level and sufficiency of consumption per head. Converting the output of
the major grains in Table 3 to kilocalories and dividing by the population yields the per
capita consumption levels shown in Table 25. Figures in this table are 20-year averages,
to abstract from short run fluctuations. It is reasonable to assume that in a relatively poor
27
and predominantly agrarian economy such as that of medieval England, at least three-
quarters of daily kilocalorie food requirements were on average supplied by grain. Livi-
Bacci (1991) believes that for a population to have been adequately fed required an
average food intake of 2,000 kilocalories per capita per day. Adult males labouring on
the land would have required about twice this. Net grain output in agriculture when
processed into pottage, bread and ale, thus needed to be able to deliver at least 1,500
kilocalories per person per day to meet the basic subsistence needs of the population until
that population was sufficiently affluent to devote a larger share of its budget to dairy
produce, meat and fish or meet a substantial proportion of its food requirements from
imports.
The estimates suggest that grain output was sufficient to meet society’s needs
after the Black Death, but was significantly less so in 1300. The picture of English
society in the half century before the Black Death that emerges from this table is one of
an economy under pressure. Note also that it is hard to see how a population much above
the 4.25 million assumed her could have been sustained, given the grain yields and the
levels of land use underpinning the output estimates. Although per capita grain
consumption fell back subsequently, the growing share of the pastoral sector would have
provided a higher proportion of kilocalories in 1450 and 1600. By the eighteenth century,
the increase in population was once more putting pressure on the adequacy of the diet,
but by 1800, per capita consumption of kilocalories from grain production, supplemented
by potatoes and grain imports, was again above sufficiency.
28
VIII. CONCLUSIONS
This paper provides the first annual estimates of GDP for England between 1300 and
1700 and for Great Britain between 1700 and 1850, constructed from the output side. For
agriculture, the estimates rest on a detailed reconstruction of arable and pastoral farming,
built up from manorial records during the modern period, probate inventories during the
early modern period and farm accounts during the modern period. For industry and
services, indices of gross output are assembled for the major sectors and combined with
value added weights. The GDP data are then combined with population estimates to
calculate GDP per capita. Estimates of nominal GDP are also provided by combining the
volume series with price indices.
Previous studies, based on the analysis of daily real wages, have found no trend
growth before the late eighteenth century. In contrast, we find English per capita income
growth of 0.13 per cent per annum between 1300 and 1700, with the strongest growth
after the Black Death and in the second half of the seventeenth century. For the period
1700-1850, we find British per capita income growth of 0.25 per cent, broadly in line
with the widely accepted estimates of Crafts and Harley (1992). The modest trend growth
in per capita income before the Industrial Revolution can be reconciled with the stability
of daily real wages because of an “industrious revolution”, increasing the days worked
per year.
29
TABLE 1: English arable land use (millions of acres)
Wheat Rye/
Maslin
Barley/
Dredge
Oats Pulses Potatoes Other
crops
Total
sown
Fallow
arable
Total
arable
1250 1.89 0.71 1.13 2.67 0.22 0.00 0.00 6.62 3.68 10.30
1300 2.22 0.50 1.05 2.62 0.37 0.00 0.00 6.76 3.77 10.53
1380 1.52 0.30 1.01 1.55 0.39 0.00 0.00 4.76 3.22 7.98
1420 1.26 0.25 0.94 1.31 0.36 0.00 0.00 4.13 2.97 7.09
1600 1.72 0.71 1.34 1.22 0.57 0.00 0.68 6.23 2.00 8.23
1700 1.87 0.40 1.71 1.08 0.92 0.00 1.21 7.20 1.80 9.00
1750 1.84 0.06 1.41 1.71 0.92 0.08 2.46 8.40 1.50 9.90
1800 2.44 0.06 1.38 1.93 0.78 0.16 2.90 9.49 1.20 10.69
1830 3.40 0.06 2.00 1.60 0.60 0.29 5.20 12.86 1.33 14.19
1871 3.32 0.06 1.96 1.45 0.90 0.39 5.66 13.35 0.48 13.83
Sources: Overton and Campbell (1996: Tables III, V); Campbell, Bartley and Power (1996); Medieval Accounts Database; Holderness
(1989); Overton (1996).
30
FIGURE 1: English weighted national average wheat yields per acre, gross of tithe
and seed (bushels)
0
5
10
15
20
25
30
35
40
45
1250 1300 1350 1400 1450 1500 1550 1600 1650 1700 1750 1800 1850 1900
wheat yield per acre gross of tithe & seed
11 per. Mov. Avg. (wheat yield per acre gross of tithe & seed)
Sources: Medieval Accounts Database, the Early Modern Probate Inventories Database
and the Modern Farm Accounts Database.
TABLE 2: English mean yields per acre gross of tithes, net of seeds (bushels)
Wheat Rye Barley Oats Pulses
1250-1299 8.71 10.71 10.25 7.24 6.03
1300-1349 8.24 10.36 9.46 6.60 6.14
1350-1399 7.46 9.21 9.74 7.49 5.86
1400-1449 5.89 10.46 8.44 6.55 5.42
1450-1499 6.48 13.96 8.56 5.95 4.49
1550-1599 7.88 9.21 8.40 7.87 7.62
1600-1649 10.45 16.28 11.16 10.97 8.62
1650-1699 11.36 14.19 12.48 10.82 8.39
1700-1749 13.79 14.82 15.08 12.27 10.23
1750-1799 17.26 17.87 21.88 20.90 14.19
1800-1849 23.16 19.52 25.90 28.37 17.85
1850-1899 26.69 26.18 23.82 31.36 16.30
Sources and notes: Gross Yield per acre taken from the Medieval Accounts Database, the
Early Modern Probate Inventories Database and the Modern Farm Accounts Database.
Seed sown per acre from the Medieval and Modern Databases. Pulses for the modern
period and all seeds sown for the early modern period are taken from Overton and
Campbell (1996), Allen (2005).
31
FIGURE 2: Working animals in England (mlns)
0
0.2
0.4
0.6
0.8
1
1.2
1.4
1250 1300 1350 1400 1450 1500 1550 1600 1650 1700 1750 1800 1850
oxen
horses
Sources: Derived from the Medieval Accounts Database, the Early Modern Probate
Inventories Database and the Modern Farm Accounts Database.
TABLE 3: English arable output net of seed and animal consumption (million
bushels)
Wheat Rye Barley Oats Pulses Potatoes
1250-1299 17.83 6.66 11.62 16.58 0.86 NA
1300-1349 16.37 4.45 9.77 11.91 1.15 NA
1350-1399 11.60 2.89 9.78 9.54 1.12 NA
1400-1449 7.68 2.87 8.15 5.84 1.00 NA
1450-1499 8.95 5.82 7.96 4.18 0.91 NA
1550-1599 12.93 5.31 10.73 5.03 2.42 NA
1600-1649 18.37 7.26 16.13 7.47 3.54 NA
1650-1699 20.85 6.30 20.47 4.58 5.60 NA
1700-1749 25.83 2.73 24.29 8.86 6.97 0.80
1750-1799 36.25 1.10 30.55 20.90 8.48 17.30
1800-1849 72.33 1.18 46.76 23.91 8.86 37.87
Source: Output gross of tithe and net of seed derived by multiplying sown area from
Table 1 with net yields from Table 2. The sown area from Table 1 was interpolated where
necessary. Consumption by working animals is derived from the numbers of working
animals shown in Figure 2.
32
TABLE 4: Numbers of non-working animals in England (millions)
Milk
cattle
Beef
cattle
Calves Sheep Swine Livestock
Unites
per 100
Acres
1250-1299 0.77 0.69 0.77 10.88 1.03 53.47
1300-1349 0.59 0.53 0.59 13.66 0.92 53.84
1350-1399 0.45 0.41 0.45 14.67 0.39 59.19
1400-1449 0.26 0.24 0.26 15.13 0.34 55.63
1450-1499 0.36 0.33 0.36 13.41 0.35 55.79
1550-1599 0.65 0.58 0.65 14.05 0.94 66.04
1600-1649 0.71 0.64 0.71 16.07 1.13 69.32
1650-1699 0.85 0.77 0.85 17.31 1.50 77.36
1700-1749 0.87 0.79 0.87 14.04 1.22 71.63
1750-1799 1.09 0.99 1.09 16.08 1.59 80.85
1800-1849 1.18 1.07 1.18 15.54 1.76 71.39
Sources and notes: Derived from Medieval Accounts Database; Early Modern Probate
Inventory Database; Allen (2005); John (1989 Tales III.1 and III.2).
* Livestock units compare different animals on the basis of relative feed requirements.
Ratios from Campbell (2000: 104-107): (adult cattle for beef and milk x 1.2) + (immature
cattle x 0.8) + (sheep and swine x 0.1).
33
FIGURE 3: Non-working livestock in England in Millions (5-year Average)
0
0.5
1
1.5
2
2.5
3
1250 1300 1350 1400 1450 1500 1550 1600 1650 1700 1750 1800 1850
Cattle & Pigs
0
5
10
15
20
25
30
Sheep
Cattle
Pigs
Sheep
Sources: Derived from the Medieval Accounts Database; Early Modern Probate
Inventories Database; Allen (2005); John (1989); Mitchell (1988).
TABLE 5: Percentages of English animals producing specific products
Milk Beef Veal Mutton Pork Wool
1300 100 25 15.18 26 49 100
1420 100 25 17.54 26 49 100
1600 100 25 21.07 25 76.86 100
1830 100 25 25 25 100 100
Sources: Holderness (1989: 147); Clark (1991); Ecclestone (1996).
34
TABLE 6: English yields per animal
Years Milk
(gallons)
Beef
(lb)
Veal
(lb)
Mutton
(lb)
Pork
(lb)
Wool (lb)
1250-1299 100.00 168.00 29.00 22.00 64.00 1.53
1300-1349 107.01 177.90 30.73 23.17 65.29 1.77
1350-1399 122.69 199.73 34.54 25.75 67.99 1.62
1400-1449 140.67 224.23 38.83 28.60 70.81 1.38
1450-1499 161.28 251.74 43.65 31.78 73.74 1.32
1550-1599 212.01 317.30 55.15 39.22 79.97 1.79
1600-1649 243.07 356.23 61.99 43.57 83.28 2.08
1650-1699 278.69 399.93 69.68 48.41 86.73 2.42
1700-1749 319.52 449.00 78.33 53.78 90.32 2.81
1750-1799 366.34 504.08 88.05 59.74 94.06 3.27
1800-1849 420.02 565.93 98.98 66.37 97.96 3.80
Sources and notes: Beef, pork, milk, and mutton are obtained from Clark (1991: 216),
while veal is taken from Allen (2005: Table 6). Wool yield index from Stephenson (1988:
Table 3), with the benchmark of 1.4 lb in 1300 from Britnell (2004: 416). The missing
years were interpolated log-linearly.
TABLE 7: Output in English pastoral farming
Years Milk
(m. gals)
Beef
(m. lb)
Veal
(m. lb)
Mutton
(m. lb)
Pork
(m. lb)
Wool
(m. lb)
1250-1299 77.30 29.11 3.29 62.21 32.25 16.84
1300-1349 62.77 23.42 2.82 82.15 29.27 23.92
1350-1399 55.36 20.25 2.59 98.04 12.93 24.00
1400-1449 37.21 13.32 1.81 112.75 11.97 20.88
1450-1499 58.13 20.41 2.93 110.06 13.35 17.57
1550-1599 136.59 46.10 7.30 140.52 49.72 25.68
1600-1649 170.49 56.41 9.36 174.72 71.40 33.32
1650-1699 235.75 76.44 13.27 209.50 105.92 41.85
1700-1749 280.86 89.02 16.22 189.35 97.69 39.64
1750-1799 400.60 124.29 23.60 240.11 144.42 52.54
1800-1849 497.00 150.95 29.27 257.66 172.13 59.00
Sources: Total output estimates are derived by multiplying animal numbers from Table 4
with the percentage of animals producing in Table 5. The resulting numbers of producing
animals are then multiplied with the animal yields from Table 6.

35
36
FIGURE 4: Indexed output in English arable and pastoral agriculture (1700=100,
log scale)
1
10
100
1000
1250 1350 1450 1550 1650 1750 1850
Pasture
Arable
Total
Sources: See text.
TABLE 8: Output growth in English agriculture in constant 1700 prices (5-year
moving averages)
Years Arable sector
(% per annum)
Pastoral sector
(% per annum)
Total agriculture
(% per annum)
1265-1300 -0.14 0.12 -0.04
1300-1348 -1.05 -0.26 -0.68
1348-1400 -0.08 -0.52 -0.29
1400-1450 -0.22 0.27 0.02
1450-1475 0.76 0.09 0.42
1475-1555 0.04 0.39 0.22
1555-1600 0.44 0.48 0.47
1600-1650 -0.55 0.56 0.14
1650-1700 0.90 0.02 0.32
1700-1750 0.66 0.51 0.57
1750-1800 0.85 0.65 0.73
1800-1850 1.05 0.51 0.76
1250-1348 -0.56 -0.02 -0.32
1250-1700 0.03 0.24 0.13
1250-1850 0.23 0.32 0.27
1700-1850 0.86 0.58 0.70

37
Sources: Derived from Medieval Accounts Database; Early Modern Probate Inventories
Database; Modern Farm Accounts Database.
38
TABLE 9: Output shares in English agriculture, in current prices, 20-year averages
(%)
A. Arable products
Year Wheat Rye Barley Oats Pulses Potatoes Total arable
products
1300 20.1 2.5 6.7 6.1 1.1 0.0 36.4
1380 17.7 2.0 13.2 5.8 1.5 0.0 40.2
1420 11.8 1.8 8.3 2.9 1.1 0.0 25.9
1600 12.9 4.6 6.4 2.1 2.2 0.0 28.2
1700 22.5 3.4 11.2 1.0 3.6 0.0 41.8
1800 24.9 0.4 9.0 4.8 3.0 2.8 44.8
1850 28.6 0.3 9.6 2.9 2.5 6.7 50.6
B. Pastoral products
Year
Dairy Beef Pork Mutton Hay Wool Hides
Total
pastoral
products
1300 8.1 2.2 21.4 13.9 0.7 15.8 1.3 63.6
1380 6.4 2.0 11.9 19.4 0.9 18.6 0.7 59.8
1420 4.6 1.3 14.9 29.1 1.6 20.7 1.9 74.1
1600 12.5 3.4 31.9 10.6 1.2 10.3 1.9 71.8
1700 13.9 3.8 19.0 10.6 3.1 6.5 1.4 58.2
1800 18.5 5.8 10.4 8.0 8.3 3.4 0.8 55.2
1850 19.4 4.2 9.8 5.4 7.4 2.7 0.5 49.4
Sources: Derived from Medieval Accounts Database; Early Modern Probate Inventories
Database; Modern Farm Accounts Database.
TABLE 10: English industrial output weights, circa 1700
%
Tin 0.9
Iron 5.6
Books 4.4
Coal 4.0
Woollens 64.5
Food 10.7
Building 9.9
Total 100.0
Sources: Derived from Hoffmann (1955).
39
TABLE 11: Growth of English industrial production, 1300-1700
% per annum
1300-1350 0.16
1350-1400 0.00
1400-1450 0.14
1450-1490 0.09
1490-1560 0.48
1560-1600 0.69
1600-1650 0.45
1650-1700 0.14
1300-1700 0.27
Sources and notes: See text. Growth rates calculated using 5-year averages.
FIGURE 5: English industrial production index, 1300-1700 (1700=100, log scale)
10.00
100.00
1300 1325 1350 1375 1400 1425 1450 1475 1500 1525 1550 1575 1600 1625 1650 1675 1700
Sources: See text.
40
TABLE 12: Output growth in British industry, 1700-1850 (% per annum)
Crafts-
Harley
Present
estimates
(annual
data)
Present
estimates
(5-year
averages)
1700-1760 0.71 0.49 0.42
1760-1780 1.29 1.00 0.95
1780-1801 1.96 2.18 2.28
1801-1830 2.78 2.68 2.57
1830-1850 -- 2.78 2.76
Sources: Crafts (1985: 32); Crafts and Harley (1992: 715); see text.
FIGURE 6: British industrial output in real terms, 1700-1850 (1850=100, log scale)
Sources: Crafts and Harley (1992); Hoffmann (1955); see text.
41
FIGURE 7: British industrial output by sub-sector, 1700-1850 (1850=100, log scale)
A. Mining, building and manufacturing
B. Metals, textiles, FDT, other manufacturing
Sourcec: see text.
42
TABLE 13: English service sector weights, circa 1700
(%)
Commerce 37.2
Housing and domestic 46.5
Government 16.3
Total 100.0
Sources: Crafts (1985: 16).
TABLE 14: Growth of English service sector output, 1300-1700
% per annum
1300-1350 -0.28
1350-1400 -0.35
1400-1450 -0.04
1450-1490 0.03
1490-1560 0.42
1560-1600 0.68
1600-1650 0.62
1650-1700 0.42
1300-1700 0.19
Sources and notes: See text. Growth rates calculated using 5-year averages.
FIGURE 8: English service sector output, 1300-1700 (1700=100, log scale)
10.00
100.00
1300 1350 1400 1450 1500 1550 1600 1650 1700
Sources: See text.
43
TABLE 15: Output growth in British services, 1700-1850 (% per annum)
Crafts-
Harley
Present
estimates
(annual
data)
Present
estimates
(5-year
averages)
1700-1760 0.74 0.71 0.63
1760-1780 0.77 0.69 0.71
1780-1801 1.31 1.41 1.62
1801-1830 1.68 1.87 1.71
1830-1850 -- 2.46 2.21
Sources: Derived from Crafts (1985: 16-17, 32, 37); Crafts and Harley (1992: 715); see
text.
FIGURE 9: British service sector output in real terms, 1700-1850 (1850=100, log
scale)
Sources: See text.
44
FIGURE 10: British services output by sub-sector (1850=100, log scale)
A. Commerce, government, housing and domestic service
B. Transport, distribution, finance and other commerce
Source: See text.
45
TABLE 16: Sectoral shares in English GDP, circa 1700 (%)
(%)
Agriculture 37
Industry 20
Services 43
Total 100
Sources: Crafts (1985: 16).
TABLE 17: Growth of English GDP, 1300-1700
% per annum
1300-1348 -0.16
1300-1350 -0.29
1350-1400 -0.32
1400-1450 0.03
1450-1490 0.09
1490-1560 0.51
1560-1600 0.56
1600-1650 0.50
1650-1700 0.31
1300-1700 0.18
Sources: See text. Growth rates calculated using 5-year averages.
FIGURE 11: English real GDP, 1300-1700 (1700=100, log scale)
10
100
1300 1350 1400 1450 1500 1550 1600 1650 1700

46
Sources: See text
47
TABLE 18: English population, 1300-1700
A. Levels of total and agricultural population (millions)
Total
population
Agricultural
population
1300 4.25 3.34
1348 3.83 3.01
1351 2.56 2.01
1380 2.37 1.79
1520 2.20 1.65
1600 4.12 2.87
1700 5.20 2.78
B. Growth rates of total and agricultural population (% per annum)
Total
population
Agricultural
population
1300-1348 -0.22 -0.22
1300-1350 -0.74 -0.74
1350-1400 -0.44 -0.53
1400-1450 -0.05 -0.06
1450-1490 -0.05 -0.06
1490-1550 0.43 0.37
1550-1600 0.78 0.69
1600-1650 0.51 0.25
1650-1700 -0.04 -0.31
1300-1700 0.05 -0.05
Sources: Derived from Overton and Campbell (1996); Wrigley et al. (1997), interpolated
using Wrigley and Schofield (1989).
48
TABLE 19: Growth of English GDP per capita, 1300-1700
% per annum
1300-1348 -0.01
1300-1350 0.58
1350-1400 0.19
1400-1450 0.09
1450-1490 0.14
1490-1560 0.08
1550-1600 -0.22
1600-1650 -0.01
1650-1700 0.35
1300-1700 0.13
Sources and notes: See text. Growth rates calculated using 5-year averages. Note that
1300-1350 is an outlier because of the sharp drop in population during the Black Death.
49
FIGURE 12: English real GDP per capita, 1300-1700
A. 1700=100, linear scale
0
20
40
60
80
100
120
1300 1350 1400 1450 1500 1550 1600 1650 1700
B. 1700=100, log scale
10
100
1000
1300 1350 1400 1450 1500 1550 1600 1650 1700
Sources: See text.
50
TABLE 20: British sectoral weights, 1700-1850 (%)
1688 & 1759 1801/3
Agriculture 37 26
Industry 20 32
Services 43 42
GDP 100 100
Sources: Crafts (1985: 16-17).
TABLE 21: British GDP growth, 1700-1850 (% per annum)
Crafts-
Harley
Present
estimates
(annual
data)
Present
estimates
(5-year
averages)
1700-1760 0.69 0.58 0.52
1760-1780 0.64 0.58 0.57
1780-1801 1.38 1.42 1.36
1801-1830 1.90 1.43 1.49
1830-1850 -- 2.08 1.99
Sources: Crafts (1985: 45); Crafts and Harley (1992: 715); derived from Appendix 1.
FIGURE 13: British GDP in real terms, 1700-1850 (1850=100, log scale)
1
10
100
1000
1700 1710 1720 1730 1740 1750 1760 1770 1780 1790 1800 1810 1820 1830 1840 1850
GDP
Agriculture
Industry
Services
Sources: See text.
51
TABLE 22: Average annual growth rate of British population and per capita
income, 1700-1850 (% per annum)
Population
growth
Per capita GDP
growth
(annual data)
Per capita GDP
growth (5-year
averages)
1700-1760 0.32 0.25 0.19
1760-1780 0.62 -0.04 -0.05
1780-1801 0.97 0.45 0.38
1801-1830 1.43 -0.01 0.05
1830-1850 1.24 0.83 0.91
1700-1850 0.79 0.42 0.25
Sources: Mitchell (1988), Wrigley and Schofield (1989), Schofield (1994) and Wrigley et
al. (1997); see text.
FIGURE 14: British real GDP per capita, 1700-1850 (1850 = 100)
0
20
40
60
80
100
120
1700 1710 1720 1730 1740 1750 1760 1770 1780 1790 1800 1810 1820 1830 1840 1850
Sources: See text.
52
TABLE 23: English GDP in current prices, 1300-1700 (£m)
A. Clark price deflator
GDP Snooks Mayhew
1300 5.57 4.07 4.66
1380 4.62
1490 4.70
1600 30.70
1688 50.80 50.80
1700 70.01
B. Phelps Brown/Hopkins price deflator
GDP
1300 4.36
1380 3.65
1490 3.83
1600 31.84
1688 50.80
1700 68.26
Sources: See text; Price deflators from Clark (2006) and Phelps Brown and Hopkins
(1981); Other benchmark estimates from Snooks (1995: 50) and Mayhew (1995: 58).
FIGURE 15: British GDP in current prices, 1700-1850 (£m, log scale)
10.00
100.00
1,000.00
1700 1710 1720 1730 1740 1750 1760 1770 1780 1790 1800 1810 1820 1830 1840 1850
this text
Deane & Cole
Lindert & Williamson
Sources: See text; Deane and Cole (1967: 166); Lindert and Williamson (1992: 393).
53
FIGURE 16: Indexed daily real wage of an unskilled farm worker and agricultural
output per agricultural worker (11-year moving averages; 1700=100)
0
50
100
150
200
250
1250 1300 1350 1400 1450 1500 1550 1600 1650 1700 1750 1800 1850
index farm wage (11-year MA)
index output per agricultural worker
(11-year MA)
Sources: Clark (2007b); see text.
54
TABLE 24: Income and output values in agriculture (5 year averages)
A. Annual wage bill:
Years Agricultural
families
(millions)
Days
worked per
family
Total days
worked
(millions)
Wage
(d. per day)
Wage bill
(£m.)
1250 0.68 315 213 1.13 1.00
1300 0.74 381 282 1.26 1.48
1380 0.40 331 132 2.93 1.61
1450 0.38 266 102 3.40 1.44
1600 0.64 404 258 6.22 6.68
1700 0.62 405 249 8.94 9.29
1800 0.69 473 327 16.04 21.89
1850 0.73 539 396 18.07 29.83
B. Rents and other non-wage incomes:
Years Rent
(s. per acre)
Acres
(millions)
Total rent
(£m.)
Capital costs
(£m.)
Tithes and
taxes (£m.)
1250 0.945 12.30 0.58 0.22 0.32
1300 0.941 12.53 0.59 0.30 0.45
1380 0.931 10.73 0.50 0.30 0.30
1450 0.922 11.09 0.51 0.27 0.20
1600 6.588 15.21 5.01 2.17 1.05
1700 11.731 18.98 11.13 2.88 2.13
1800 22.579 28.13 31.76 10.46 5.44
1850 31.292 30.03 46.99 17.62 3.97
C. Income and output values (£m.):
Years Total incomes Value of output
1250 2.13 2.06
1300 2.82 2.99
1380 2.71 2.74
1450 2.42 2.26
1600 14.91 15.50
1700 25.43 25.87
1800 69.54 69.75
1850 98.41 98.76
Sources and notes: Wage per day is taken from Clark (2007b). Following Burnett (2004),
we assume that the female wage was 45% of the male wage. Women worked 13.6 per
cent of total hours worked. Hence the average male and female wage should be
0.864*male wage+0.136*0.45*male wage. Rents from Clark (2001), and after 1750 from
Turner et al. (1997), capital costs and tithes and taxes from Allen (2005).
55
TABLE 25: Per capita daily kilocalorie consumption of wheat, rye, barley, oats and
potatoes
Years Kcal. net of seed Kcal. net of seed,
losses, & fodder
% food extraction
rate
1300 2,241 1,298 58
1380 3,192 1,715 54
1450 2,356 1,271 52
1600 2,236 1,153 52
1700 *2,526 *1,202 48
1800 *3,361 *1,627 48
1830 *3,365 *1,679 52
1850 *3,474 *1,713 49
Sources and notes: This Table is based on 20-year averages. Kilocalories per bushel for
the medieval period are taken from Campbell et al. (1993: 41). Following Overton and
Campbell (1996: Table XIII), storage losses are assumed to have been 10%, with food
conversion losses of 20% for wheat and rye, 22% for barley, and 44% for oats when
processed into bread, and 70% for barley and oats when malted and brewed into ale/beer.
For the post Black Death period (1380 and 1420) patterns of grain consumption are
assumed to have been equivalent to those for 1600 given by Overton and Campbell
(1996: Table XII): 98% of wheat and rye and all oats not fed to livestock were eaten.
However, we assumed that 50% of barley was eaten and the remainder brewed. For the
pre-Black Death period it is assumed that 60% of barley was eaten and only 40% brewed.
For 1600-1850 the estimates of Overton and Campbell (1996: Tables XII and XIII) were
followed.
*Includes net grain imports and potatoes.
56
REFERENCES
Allen, R.C. (2005) “English and Welsh Agriculture 1300-1850: Output, Inputs and
Income”, Nuffield College, Oxford,
http://www.nuffield.ox.ac.uk/users/allen/unpublished/AllenE&W.pdf.
Beveridge, W. (1939), Prices and Wages in England from the Twelfth to the Nineteenth
Century, Vol. I, Price Tables: Mercantile Era, London: Longmans, Green.
Biddick, K. (1989), The Other Economy: Pastoral Husbandry on a Medieval Estate,
Berkeley: University of California Press.
Bowden, P. (1967), “Agricultural Prices, Farm Profits, and Rents”, in Thirsk, J. (ed.), The
Agrarian History of England and Wales, Volume IV: 1500-1640, Cambridge:
Cambridge University Press, 593-695.
Britnell R. H. (2004), Britain and Ireland 1050-1530: Economy and Society, Oxford:
Oxford University Press.
Burnett, J. (2004), “The Wages and Employment of Female Day-Labourers in English
Agriculture, 1740-1850”, Economic History Review, 57, 664-690.
Campbell, B.M.S. (2000), English Seigniorial Agriculture, 1250-1450, Cambridge:
Cambridge University Press.
Campbell, B.M.S. (2007), Three centuries of English crop yields, 1211-1491 [WWW
document]. URL http://www.cropyields.ac.uk.
Campbell, B. M. S., Bartley, K.C. and Power, J. P. (1996), “The Demesne-Farming
Systems of Post Black Death England: A Classification”, Agricultural History
Review, 44, 131-79.
Carus-Wilson, E.M. and Coleman, O. (1963), England’s Export Trade, 1275-1547,
Oxford: Clarendon.
Clark. G. (1991), “Labour Productivity in English Agriculture, 1300-1860”, in Campbell
B.M.S and Overton, M. (eds.), Land, Labour and Livestock: Historical Studies in
European Agricultural Productivity, Manchester: Manchester University Press,
211-235.
Clark, G. (2001), “Microbes and Markets: Was the Black Death an Economic
Revolution?”, University of California, Davis,
http://www.econ.ucdavis.edu/faculty/gclark/research.html.
Clark, G. (2004), “The Price History of English Agriculture, 1209-1914”, Research in
Economic History, 22, 41-125.
57
Clark, G. (2005), “The Condition of the Working-Class in England, 1209-2004”, Journal
of Political Economy, 113, 1307-1340.
Clark, G. (2007a), A Farewell to Alms: A Brief Economic History of the World,
Princeton: Princeton University Press.
Clark, G. (2007b), “The Long March of History: Farm Wages, Population and Economic
Growth, England 1209-1869”, Economic History Review, 60, 97-135.
Clarkson, L.A. (1989), “The Manufacture of Leather”, in Mingay, G.E. (ed.), The
Agrarian History of England and Wales, Volume VI: 1750-1850, Cambridge:
Cambridge University Press, 466-485.
Crafts, N.F.R. (1985), British Economic Growth during the Industrial Revolution,
Oxford: Oxford University Press.
Crafts, N.F.R. and Harley, C.K. (1992), “Output Growth and the Industrial Revolution: A
Restatement of the Crafts-Harley View”, Economic History Review, 45, 703-730.
Crafts, N.F.R., Leybourne, S.J. and Mills, T.C. (1989), “Trends and Cycles in British
Industrial Production, 1700-1913”, Journal of the Royal Statistical Society, Series
A, 152, 43-60.
Deane, P. and Cole, W.A. (1967), British Economic Growth, 1688-1959: Trends and
Structure, 2nd
edition, Cambridge: Cambridge University Press.
Dodds, B. (2007), Peasants and Production in the Medieval North-East: The Evidence
from Tithes 1270-1536, Woodbridge: Boydell & Brewer.
Ecclestone, M. J. (1996), “Dairy Production on the Glastonbury Abbey Demesnes 1258-
1334”, unpublished M.A. dissertation, University of Bristol.
Farmer, D. L. (1988), “Prices and Wages”, in Hallam, H.E. (ed.), The Agrarian History of
England and Wales, Volume II: 1042-1350, Cambridge: Cambridge University
Press, 715-817.
Farmer, D. L. (1991), “Prices and Wages, 1350-1500”, in Miller, E. (ed.), The Agrarian
History of England and Wales, Volume III: 1348-1500, Cambridge: Cambridge
University Press, 431-525.
Feinstein, C.H. (1988), “National Statistics, 1760-1920: Sources and Methods of
Estimation for Domestic Reproducible Fixed Assets, Stocks and Works in
Progress, Overseas Assets, and Land”, in Feinstein, C.H. and Pollard, S. (eds.),
Studies in Capital Formation in the United Kingdom, 1750-1920, Oxford: Oxford
University Press, 257-471.
58
Harley, C. K. (1982) “British Industrialization Before 1841: Evidence of Slower Growth
During the Industrial Revolution”, Journal of Economic History, 42, 267-289.
Hatcher, J. (1973), English Tin Production and Trade before 1550, Oxford: Clarendon
Press.
Hatcher, J. (1977), Plague, Population and the English Economy, 1348-1530, London:
Macmillan.
Hatcher, J. (1993), The History of the British Coal Industry, Volume 1, Before 1700:
Towards the Age of Coal, Oxford; Oxford University Press.
Hoffmann, W.G. (1955), British Industry 1700-1950, Oxford: Blackwell.
Holderness, B.A. (1989), “Prices, Productivity, and Output”, in Mingay, G.E. (ed.), The
Agrarian History of England and Wales, Volume VI: 1750-1850, Cambridge:
Cambridge University Press, 84-189.
John A.H. (1989), “Statistical Appendix”, in Mingay G. E. (ed.), The Agrarian History of
England and Wales, Volume VI: 1750-1850, Cambridge, Cambridge University
Press, 972-1155.
King, G. [1696] (1936), “Natural and Political Observations and Conclusions upon the
State and Condition of England”, in Barnett, G.E. (ed.), Two Tracts by Gregory
King, Baltimore: Johns Hopkins Press.
King, P. (2005), “The Production and Consumption of Bar Iron in Early Modern England
and Wales”, Economic History Review, 58, 1-33.
Lee, C.H. (1986), The British Economy since 1700: A Macroeconomic Perspective,
Cambridge: Cambridge University Press.
Lindert, P.H. and Williamson, J.G. (1982), Revising England’s Social Tables 1688-
1913”, Explorations in Economic History, 19, 385-408.
Livi-Bacci, M. (1991), Population and Nutrition, Cambridge: Cambridge University
Press.
Mayhew, N. (1995), “Modelling Medieval Monetisation”, in Britnell, R. and Campbell,
B.M.S. (eds.), A Commercialising Economy: England 1086 to c. 1300,
Manchester, Manchester University Press, 55-77.
Mitchell, B.R. (1988), British Historical Statistics, Cambridge: Cambridge University
Press.
59
Nef, J.U. (1932), The Rise of the British Coal Industry, Volume II, London: Routledge.
O'Brien, P. K. (1985), “Agriculture and the Home Market for English Industry, 1660-
1820”, English Historical Review, 100, 773-800.
O’Brien, P.K. and Hunt, P.A. (1999), “England, 1485-1815”, in Bonney, R. (ed.), The
Rise of the Fiscal State in Europe, c.1200-1850, Oxford: Oxford University Press,
53-100.
Overton, M. (1996), Agricultural Revolution in England: The Transformation of the
Agrarian Economy 1500-1850, Cambridge: Cambridge University Press.
Overton, M. (2000), “Prices from Probate Inventories”, in Arkell, T., Evans, N. and
Goose, N. (eds.), When Death Do Us Part: Understanding and Interpreting the
Probate Records of Early Modern England, Oxford: Leopard’s Head.
Overton, M. and Campbell, B.M.S. (1996), “Production et productivité dans l’agriculture
anglais, 1086-1871”, Histoire et Mesure, 11, 255-297.
Overton, M., Whittle, J., Dean, D. and Haan, A. (2004), Production and Consumption in
English Households, 1600-1750, London: Routledge.
Phelps Brown, H. and Hopkins, S.V. (1981), A Perspective of Wages and Prices,
London: Methuen.
Postan, M.M. (1966), “Medieval Agrarian Society in its Prime: England”, in Postan,
M.M. (ed.), The Cambridge Economic History of Europe, Vol. I: The Agrarian
Life of the Middle Ages, second edition, Cambridge: Cambridge University Press,
549-632.
Sapoznik, A. (2008), “Using Tithes to Compare Landlord and Peasant Cropping Patterns
at Fourteenth-Century Oakington”, Economic History Society Annual
Conference, Nottingham.
Schofield, R. (1994), “British population change, 1700-1871”, in Floud, R. and
McClosky, D.N. (eds.), The Economic History of Britain since 1700, Second
Edition: Volume 1: 1700-1860, Cambridge: Cambridge University Press, 60-95.
Smith, R.M. (1991), “Demographic Developments in Rural England, 1300-1348: A
Survey”, in Campbell, B.M.S. (ed.), Before the Black Death: Studies in the
“Crisis” of the Early Fourteenth Century, Manchester: Manchester University
Press, 25-77.
Snooks, G.D. (1995), “The Dynamic Role of the Market in the Anglo-Norman Economy
and beyond, 1086-1300”, in Britnell, R. and Campbell, B.M.S. (eds.), A
60
Commercialising Economy: England 1086 to c. 1300, Manchester, Manchester
University Press, 27-54.
Stephenson, M. J. (1988), “Wool Yields in the Medieval Economy”, Economic History
Review, 61, 368-91.
Stone, D. J. (2006), “The Consumption of Field Crops in Late Medieval England”, in
Woolgar, C.M., Serjeantson, D. and Waldron, T. (eds.), Food in Medieval
England: Diet and Nutrition, Oxford: Oxford University Press.
Thorold Rogers, J.E. (1866-1902), A History of Agriculture and Prices in England,
Volumes 1-6, Oxford: Clarendon Press.
Turner, M.E., J.V. Beckett, and B. Afton (1997), Agricultural Rent in England, 1690-
1914, Cambridge: Cambridge University Press.
Turner, M.E., J.V. Beckett, and B. Afton (2001), Farm Production in England 1700-
1914, Oxford: Oxford University Press.
de Vries, J. (1994), “The Industrial Revolution and the Industrious Revolution”, Journal
of Economic History, 54, 249-270.
Wrigley, E.A. (2006), “The Transition to an Advanced Organic Economy: Half a
Millennium of English Agriculture”, Economic History Review, 59, 435-480.
Wrigley, E.A. and Schofield, R.S. (1989), The Population History of England, 1541-
1871: A Reconstruction, Cambridge: Cambridge University Press.
Wrigley, E.A., Davies, R.S., Oeppen, J.E. and Schofield, R.S. (1997), English Population
History from Family Reconstitution, 1580-1837, Cambridge: Cambridge
University Press.