Embed Size (px)
Citation preview

HISTORICAL RESEARCH REPORTResearch Report TM/97/05
1997
A community-based case-control study of asthma and chronic bronchitis in relation to occupation Buchanan D, Donnan PT, Cowie HA, Miller BG, Soutar CA

Copyright © 2006 Institute of Occupational Medicine. INSTITUTE OF OCCUPATIONAL MEDICINE No part of this publication may be reproduced, stored Research Avenue North, Riccarton, Edinburgh, EH14 4AP or transmitted in any form or by any means without Tel: +44 (0)870 850 5131 Fax: +44 (0)870 850 5132 written permission from the IOM e-mail [email protected]
A community-based case-control study of asthma and chronic bronchitis in relation to occupation
Buchanan D, Donnan PT, Cowie HA, Miller BG, Soutar CA This document is a facsimile of an original copy of the report, which has been scanned as an image, with searchable text. Because the quality of this scanned image is determined by the clarity of the original text pages, there may be variations in the overall appearance of pages within the report. The scanning of this and the other historical reports in the Research Reports series was funded by a grant from the Wellcome Trust. The IOM’s research reports are freely available for download as PDF files from our web site: http://www.iom-world.org/research/libraryentry.php
HISTORICAL RESEARCH REPORTResearch Report TM/97/05
1997

ii Research Report TM/97/05
Report No. TM/97/05
INSTITUTE OF OCCUPATIONAL MEDICINE
A COMMUNITY-BASED CASE-CONTROL STUDY OF ASTHMA AND CHRONICBRONCHITIS IN RELATION TO OCCUPATION
by
D Buchanan, PT Donnan, HA Cowie, BG Miller, CA Soutar
Final Report on HSE contract no. 3149/R58.053
Institute of Occupational Medicine8 Roxburgh PlaceEdinburgh EH8 9SU
Tel: 0131 667 5131Fax: 0131 667 0136
Price: £ 95.00 (UK)£100.00 (Overseas) October 1997


Report No. TM/97/05
INSTITUTE OF OCCUPATIONAL MEDICINE
A COMMUNITY-BASED CASE-CONTROL STUDY OF ASTHMA AND CHRONICBRONCHITIS IN RELATION TO OCCUPATION
by
D Buchanan, PT Donnan, HA Cowie, BG Miller, CA Soutar
Final Report on HSE contract no. 3149/R58.053
Institute of Occupational Medicine8 Roxburgh PlaceEdinburgh EH8 9SU
Tel: 0131 667 5131Fax: 0131 667 0136 October 1997

This report is one of a series of Technical Memoranda (TM) distributed by the Institute ofOccupational Medicine. Current and earlier lists of these reports and of other Institute publications,are available from the Technical Information Officer/Librarian.
CONTENTS
Page
SUMMARY iii
1. INTRODUCTION 1
1.1 Background 11.2 Aims and objectives 3
2. MATERIALS AND METHODS 5
2.1 Introduction 52.2 The postal survey 52.3 Selection of case and control subjects 6
2.3.1 Selection of cases of asthma and chronic bronchitis 62.3.2 Selection of controls 7
2.4 Coding of occupations 72.5 Data processing 82.6 Statistical methods 9
2.6.1 Occupational histories 92.6.2 Relationship between occupation and respiratory symptoms 92.6.3 Relationship between asthma and career progression 11
3. RESULTS 13
3.1 Study sample 133.1.1 Coding of occupations 133.1.2 Characteristics of study sample 133.1.3 Summary of industries 14
3.2 Relationship between occupation and respiratory symptoms 153.2.1 Overview 153.2.2 Asthma 163.2.3 Chronic bronchitis 18
3.3 Relationship between asthma and career progression 193.3.1 Rate of change of j obs 193.3.2 Time spent in employment 193.3.3 Social class 20
3.4 Summary of results 213.4.1 Asthma and occupation 213.4.2 Chronic bronchitis and occupation 213.4.3 Asthma and career progression 22
4. DISCUSSION 23
4.1 Relationship between occupation and respiratory symptoms 234.2 Relationship between asthma and career progression 27
Page
5. CONCLUSIONS 29
6. FURTHER WORK 31
7. ACKNOWLEDGEMENTS 33
8. REFERENCES 35
TABLES 37
FIGURES 61
Ill
INSTITUTE OF OCCUPATIONAL MEDICINE
A Community-based case-control study of asthma and chronic bronchitis in relationto occupation
by
D Buchanan, PT Donnan, HA Cowie, BG Miller, CA Soutar
SUMMARY
Background
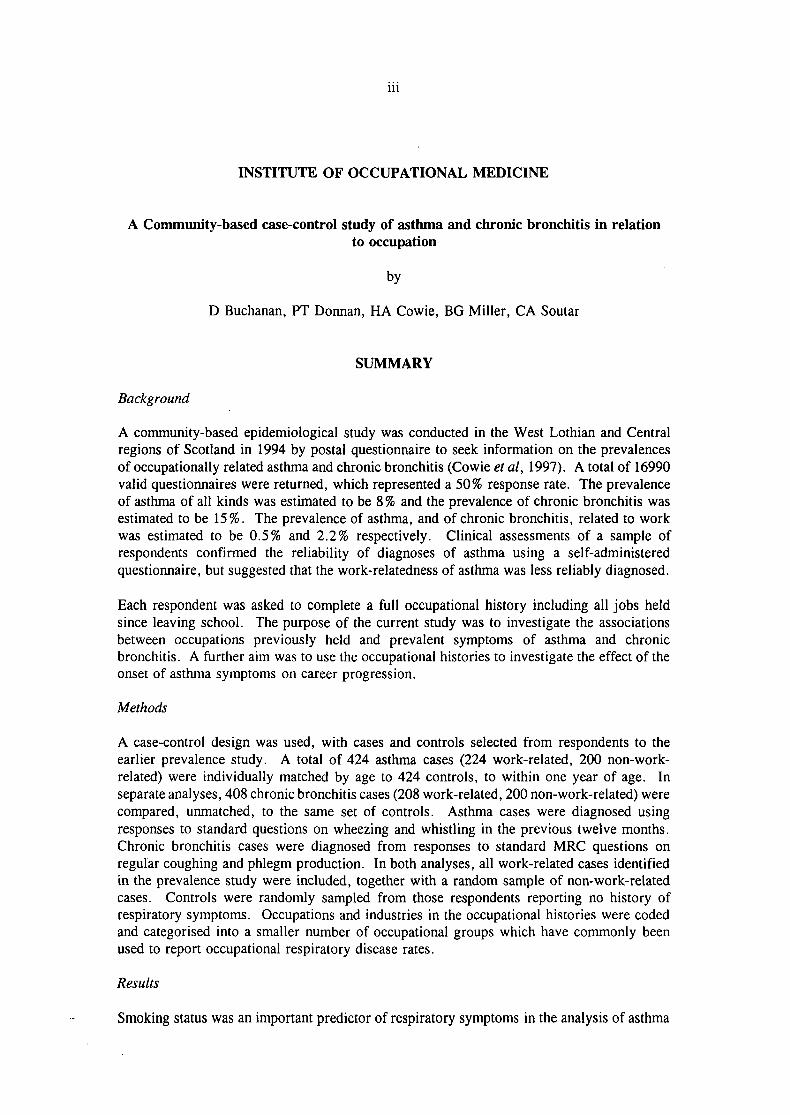
A community-based epidemiological study was conducted in the West Lothian and Centralregions of Scotland in 1994 by postal questionnaire to seek information on the prevalencesof occupationally related asthma and chronic bronchitis (Cowie et al, 1997). A total of 16990valid questionnaires were returned, which represented a 50% response rate. The prevalenceof asthma of all kinds was estimated to be 8% and the prevalence of chronic bronchitis wasestimated to be 15%. The prevalence of asthma, and of chronic bronchitis, related to workwas estimated to be 0.5% and 2.2% respectively. Clinical assessments of a sample ofrespondents confirmed the reliability of diagnoses of asthma using a self-administeredquestionnaire, but suggested that the work-relatedness of asthma was less reliably diagnosed.
Each respondent was asked to complete a full occupational history including all jobs heldsince leaving school. The purpose of the current study was to investigate the associationsbetween occupations previously held and prevalent symptoms of asthma and chronicbronchitis. A further aim was to use the occupational histories to investigate the effect of theonset of asthma symptoms on career progression.
Methods
A case-control design was used, with cases and controls selected from respondents to theearlier prevalence study. A total of 424 asthma cases (224 work-related, 200 non-work-related) were individually matched by age to 424 controls, to within one year of age. Inseparate analyses, 408 chronic bronchitis cases (208 work-related, 200 non-work-related) werecompared, unmatched, to the same set of controls. Asthma cases were diagnosed usingresponses to standard questions on wheezing and whistling in the previous twelve months.Chronic bronchitis cases were diagnosed from responses to standard MRC questions onregular coughing and phlegm production. In both analyses, all work-related cases identifiedin the prevalence study were included, together with a random sample of non-work-relatedcases. Controls were randomly sampled from those respondents reporting no history ofrespiratory symptoms. Occupations and industries in the occupational histories were codedand categorised into a smaller number of occupational groups which have commonly beenused to report occupational respiratory disease rates.
Results
Smoking status was an important predictor of respiratory symptoms in the analysis of asthma

IV
and, in particular, chronic bronchitis. Those reporting symptoms of asthma or chronicbronchitis were more likely to be smokers than non-smokers or ex-smokers. Those reportingsymptoms of chronic bronchitis were more likely to be male than female, but the proportionswere similar among cases of asthma.
After adjustment for smoking, significantly raised odds of asthma symptoms were reportedamong those who had previously been employed in food processing, particularly bakers, andas caterers, cleaners, textiles processors and general labourers. In part due to the profile oflocal industries, those employed as food processors were commonly involved in theprocessing of meat products, in particular poultry meat, while textiles processors were mostoften employed in the manufacture of clothing. Also associated with raised odds of asthmasymptoms were print workers, metal treatment workers and spray painters, but estimates wereimprecise due to the small numbers involved.
After adjustment for smoking, raised odds of chronic bronchitis symptoms were associatedwith a wider range of occupations than were asthma symptoms. These occupations includedbakers, farmers, coalminers, construction workers, painters and chemical industry processors.A wide variety of occupations in the processing of metal and electrical products wereassociated with raised odds of chronic bronchitis, in particular welding, metal treatment andthe motor vehicle trades.
Most of those who reported symptoms of asthma generally reported that those symptoms firstoccurred in the few years prior to the postal survey. Therefore, very few cases or theirmatched controls started new jobs in the short period after the onset of symptoms untilquestionnaire completion. There was no evidence that cases started a greater number of jobsafter the onset of symptoms compared to their age-matched controls over the same period.Cases who did start a new job after the onset of symptoms generally did not experience achange in the Social Class of the occupation, and there was no strong evidence, given thesmall numbers involved, that the movements between Social Classes was different comparedto the controls. The time spent in employment after the onset of symptoms was only slightlylower for asthma cases than for their matched controls over the same period. The differenceamounted to 1 year less for male case-control pairs and 2 years less for female case-controlpairs, when only pairs with a minimum of 10 years follow-up (mean 19 years) were used inanalysis. Neither of these differences was large in relation to the degree of variation amongcase-control pairs.
Conclusions
The reporting of symptoms of asthma, and of chronic bronchitis, was associated withemployment in a number of occupations held previously, even after allowing for differentsmoking habits. There was overlap between the occupations associated with symptoms ofasthma and with symptoms of chronic bronchitis due to the difficulty in diagnosing the twoconditions using a self-administered questionnaire. However, asthma symptoms wereparticularly implicated with employment in the food processing, catering and textilesmanufacturing industries. Chronic bronchitis symptoms were associated with a wider rangeof occupations than were asthma symptoms, and, in particular, with employment in knowndusty jobs such as coalmining, and occupations in the metal processing industries andmanufacturing of electrical products. Both work-related and non-work-related asthma casesseparately showed similar associations with occupations. Therefore, given also the generallypoor agreement with clinical assessments in the earlier prevalence study, the use of the self-

administered questionnaire by itself may not have been a reliable method of determining thework-relatedness of asthma symptoms. Based on a paired comparison of career progressionin prevalent cases and controls with limited follow up, there was no strong evidence that theonset of asthma symptoms had later adverse effects on employment prospects.

VI
1. INTRODUCTION
1.1 Background
Occupational asthma has become increasingly prevalent in the past two decades, partly dueto the increasing number of new chemicals used in the workplace which can cause asthma.Chan-Yeung and Malo (1994) reported around 200 agents which have been implicated incausing occupational asthma across a wide range of occupations. In the U.K. and othercountries, better recognition and surveillance are also responsible for the increase in reportedprevalence. A scheme for the surveillance of work-related occupational respiratory disease(SWORD) set up in the U.K. in 1989, has consistently found asthma to be the most commonoccupational respiratory disorder (Meredith et al, 1991). The true prevalence of work-relatedrespiratory diseases such as asthma and chronic bronchitis in the working population isuncertain and appears to depend a great deal on the diagnostic method. It is known, though,that incidence rates for these disorders vary a great deal by occupation and industry and arecaused by exposure to a wide variety of agents found in the workplace (Meredith, 1993).
In recent years two population-based studies of the relationship between occupation andasthma have been reported in the literature. Ng etal (1994) reported a community-based case-control study in Singapore using adult cases who reported to government-run clinics fortreatment, and controls who were being treated for conditions other than asthma. Comparingthose who had been employed in each occupational group to those remaining, the highestrelative risks were associated with manufacturing occupations particularly textile workers,cleaners, electrical production workers, printers and construction workers. Mastrangelo etal (1997) compared the results of repeated case-control studies which used incident cases andcontrols referred over two different time periods (from 1974 to 1978 and from 1989 to 1993).Coding only the occupation at the time of referral, they found more occupations associatedwith a high relative risk of asthma in the later time period. The highest risks were associatedwith isocyanate painters and polyurethane foam industry workers. Other occupations withhigh relative risks of asthma were farmers, bakers, workers in the textile, wood furniture,leather, food and chemical industries, painters, hairdressers and welders. The estimatedrelative risks were higher than those reported by Ng et al (1994), and one reason given wasthat, unlike in Ng et al (1994), comparison was with a specific low-risk control group ofoccupations.
Follow-up studies of those diagnosed with occupational asthma indicate that, for many, thedevelopment of the disease means that they become asthmatic and continue to have episodesof bronchoconstriction even when no longer exposed to the sensitising agent (Meredith andNordman, 1996). A study of 112 workers previously diagnosed with occupational asthma,identified from the records of a specialist lung disease clinic, found 32% remained exposedto the causative agent (Gannon et al, 1993). The authors concluded that while removal fromexposure had a beneficial effect on lung function, it was also associated with a loss of income,and suggested that this was a reason for workers remaining exposed after diagnosis. Cannonet al (1995) reported a follow-up study of 225 asthma cases, 66% of whom had occupationalasthma or asthma exacerbated by work, with the remainder having non-work-related asthma.They found that, since diagnosis, earnings had been adversely affected, more so foroccupational and work-exacerbated asthma cases. These cases also reported more disruptionto their jobs due to asthma and greater difficulty in finding new work, particularly among
those in the lower socioeconomic groups.
Chronic bronchitis is, like asthma, a disease which is known to be more prevalent in dustyoccupations. Chronic bronchitis is generally characterised by a persistent cough with sputumproduction. The symptoms can be very similar to asthma and, indeed, bronchitis is both acause and an effect of asthma. The most important causative factor is tobacco smoke, andthis must be taken account of in any epidemiological study of occupational factors. Variousoccupations have been associated with a high incidence of chronic bronchitis, most notablyin the coalmining industry (Soutar et al, 1989). Niven et al (1997), in a study of textileworkers, reported that chronic bronchitis was more prevalent in cotton workers due to cottondust, in comparison with man-made fibre workers. Other studies have shown a highincidence of bronchitis among both foundry workers (Karava et al, 1976) and steel workers(Hunting and Welch, 1993).
A large cross-sectional study of the prevalence of asthma and chronic bronchitis in theworking-age population has recently been completed in districts of West Lothian and CentralRegions (Cowie et al, 1997). The survey was by postal questionnaire which includedquestions on the work-relatedness of the respiratory symptoms and, for the first two of threemailings, a full occupational history. The prevalence of asthma, diagnosed by wheezing andwhistling, was 8%. The prevalence of chronic bronchitis, diagnosed using standard MRCquestions on coughing and phlegm, was 15%. The response rate, at around 50%, was lowerthan that for an earlier pilot study with a similar, but shorter, questionnaire (Love et al, 1990)which included fewer occupation-related questions. The estimated prevalence of work-relatedasthma in the study population was 0.5%. The estimated prevalence of work-related chronicbronchitis was higher at 2.2%.
The West Lothian and Central regions of Scotland were chosen for study because of the broadrange of occupations and industries based there. This study included a preliminaryinvestigation of the association between symptoms of asthma and occupation at the date offirst symptoms. The authors compared the proportion of work-related cases with theproportion of non-work-related cases within industries and occupations but were unable toarrive at any firm conclusions due to the small numbers on which the comparisons were basedand the lack of consideration of potential confounding variables.
The current study was set up specifically to use all past employment information to identifyoccupations and industries which were common to those reporting prevalent symptoms ofasthma and chronic bronchitis. This was designed to allow for a possible latent periodbetween first exposure to the causative agent and the appearance of full respiratory symptoms.It was also necessary to analyse full occupational histories rather than depend on self-reporteddates and occupations at the onset of first symptoms. Identifying occupations associated witha high prevalence of respiratory symptoms in a community-based study such as this will directfuture efforts to update the growing list of causative agents in the workplace by highlightingthe occupations and industries where the collecting of detailed exposure histories would beinformative.
Data on the questionnaire responses of all 16990 valid respondents from the prevalence studyhad already been processed and entered into computer files ready for analysis. This includeddata on personal details such as sex, age and smoking status as well as data on the occurrenceof respiratory symptoms and whether these were related to work. A full occupational historywas included in the majority of the questionnaires sent out by Cowie et al (1997) but these
data had not been processed since they were not required for the statistical analyses. Giventhe relatively low prevalence of asthma in the population, and the focus on identifyingassociations between occupations and symptoms, a case-control design was an efficient useof resources and meant that only a subset of the total returned occupational histories requireddata processing.
The availability of full occupational histories also allowed a comparison to be made betweenthe career progression of asthmatic and non-asthmatic individuals, with particular attentionto how career was affected among asthmatics after the onset of symptoms. Although nodirect questions were asked in the questionnaire about periods of unemployment, these couldbe inferred indirectly from gaps in the occupational histories.
1.2 Aims and objectives
The overall aims of the study were:
(i) to assess the reliability of self-reports of occupational asthma and chronic bronchitisattributable to occupation;
(ii) to assess the approximate frequency of clinically verifiable occupational asthma andchronic bronchitis attributed to occupation in the general population in an industrialarea;
(iii) to identify, for possible subsequent studies, specific occupations, industry sectors andemployers where study of exposures and exposure histories might provide helpfulinformation relevant to relationships between exposure and the occurrence of asthmaand chronic bronchitis.
The report of Cowie et al (1997) addressed aims (i) and (ii) above. The work described inthis report addressed aim (iii), together with some further work which was agreed to provideadditional information on the socioeconomic effects of asthma in the context of work.
In full, the objectives were to examine the following aspects of occupation and to compare,with asymptomatic individuals, (a) in individuals with symptoms of asthma and, (b) inindividuals with symptoms of chronic bronchitis:
(i) the distributions of time spent, up to the onset of symptoms, in occupations andindustry sectors generally,
(ii) the distributions of time spent, up to the onset of symptoms, in specific occupationsand industries previously reported to be hazardous to respiratory health,
(iii) the rate of change of occupation (including seniority) following the onset ofrespiratory symptoms,
(iv) the proportion of individuals leaving employment to become unemployed or on sickleave following the onset of respiratory symptoms.


2. MATERIALS AND METHODS
2.1 Introduction
The current study followed on from the community-based epidemiological study of Cowie etal (1997) and much of the data from the respiratory symptoms questionnaire necessary forthe current study had already been processed and were ready for statistical analysis. Themain component remaining to be processed was the data from the full occupational historieswhich required coding and transcription to computer files. Full details of the study designand survey methods of the community-based epidemiological study are described in the reportof that study (Cowie et al, 1997), which will be referred to throughout this report as 'theprevalence study'. A summary only is given here and this report concentrates on theadditional work that was carried out as part of this follow-on study.
Individuals were selected for inclusion in this study as cases of asthma, cases of chronicbronchitis or as controls who reported symptoms of neither condition. Cases and controlswere diagnosed on the basis of their responses to questions on respiratory symptoms in thepostal questionnaire sent out during the prevalence study. Cases of asthma and chronicbronchitis were compared to the single control set in separate statistical analyses. Thischapter describes the conduct of the postal questionnaire and the criteria for the selection ofthe cases and controls for inclusion in this study. This is followed by details on theprocessing of the occupational histories and the methods by which the occupationalinformation was used to investigate associations with respiratory symptoms.
2.2 The postal survey
The prevalence study took the form of a cross-sectional survey, by postal questionnaire, ofa sample of the working-age population in the contiguous districts of Livingston, Bathgate,Broxburn and Linlithgow in West Lothian and Grangemouth and Bo'ness in Central Region,Scotland. The full questionnaire that was sent out in the first two mailings (Cowie et al,1997: Appendix 1) was designed to gather information on personal details, including smokinghabits, and information on the occurrence of respiratory symptoms. In addition, a fulloccupational history was requested to record each job held since leaving school. LabourForce Survey (LFS) questions on self-reported work-related illness were included, modifiedfor self-administration. International Union against Tuberculosis and Lung Disease(IUATLD, 1986) bronchial symptoms questionnaire questions on asthma symptoms in the lasttwelve months were included to establish whether the symptoms were perceived to bework-related, and to identify when the symptoms first began. Direct questions were askedconcerning medical diagnoses of asthma. MRC (1986) respiratory symptoms questionnairequestions on cough and phlegm production were included, abbreviated and adapted forself-administration. Smoking questions were included, at least sufficient to categorise subjectsas current smokers, ex-smokers or non-smokers.
Eligible individuals were aged 16-64 and resident in one of 18 postcode sectors at 31 March1994. Data on all 92715 eligible individuals were forwarded to the IOM on floppy disk fromthe combined Community Health Indices of Lothian Health and Forth Valley Health Board.A simple random sample of 40000 individuals was extracted from this database for mailing
of the questionnaire.
After two mailings of the full questionnaire, the questionnaire was shortened and mailed athird and final time to non-responders in an attempt to encourage greater participation. Themajor change from the first two mailed questionnaires was to omit the occupational history(Cowie et al, 1997: Appendix 2.3).
Overall the response rate for the prevalence study was 50% of those questionnaires delivered,with a total of 17487 questionnaires returned. There was a low response among youngerrecipients and, in particular, younger males. After exclusions based on a series ofcomputerised validation checks, a study group of 16990 responders remained. Theseresponders formed the pool of potential case and control subjects for inclusion in the currentstudy.
2.3 Selection of case and control subjects
2.3.1 Selection of cases of asthma and chronic bronchitis
In the prevalence study, diagnosis of cases was on the basis of responses to questions onrespiratory symptoms. Symptoms of asthma were diagnosed if, in the last 12 months,individuals admitted to wheezing and whistling in their chest, and at least two from thefollowing complaints: tightness in the chest first thing in the morning, shortness of breathduring the day when not doing anything strenuous, and being woken at night by shortness ofbreath.
Further questions were used to determine whether the symptoms of asthma were likely to bework-related or not. Individuals whose symptoms improved when they were away from workfor a week or more and got worse on working days compared to non-working days weredefined to have symptoms of work-related asthma. If their symptoms improved when awayfrom work for a week or more and stayed the same on work days compared to non-workdays, individuals were defined to have "possible work-related" asthma. This latter categorywas also used for individuals who did not fulfil either of the above conditions but describeda work-related activity or place which brought on their symptoms.
Individuals were classified as having symptoms of chronic bronchitis if they answeredpositively to at least one of (a), usually coughing up phlegm from their chest first thing in themorning and doing so on most days for at least three months each year, or (b), usuallycoughing up phlegm from their chest during the rest of the day or at night and doing so onmost days for at least three months each year.
For each individual with symptoms of chronic bronchitis, the replies to questions 'Do youthink that your cough and phlegm have been caused by something you breathed in at work',and (if YES), 'What do you think caused your cough' were examined. Individuals weredefined to have work-related chronic bronchitis if they answered positively to the former, orif they left the former blank and gave a work-related answer to the latter. Up to three causesof cough were coded. Some individuals thought that their cough was caused by somethingthey breathed in at work, but, when asked to specify what caused it, gave a clearly non-work-related answer (usually their own smoking habits). These individuals were not classified ashaving work-related bronchitis.

In the prevalence study 261 individuals with work-related or "possible work-related" asthmawere identified, and all of these were selected for inclusion in the current study as cases ofwork-related asthma. Additionally, 200 non-work-related asthma cases were selected forinclusion. Since a far greater number of non-work-related cases were identified in theprevalence study, these cases were randomly selected from among all those eligible. A totalof 1171 non-work-related asthma cases were identified in the prevalence study. Of these, the200 cases were selected from 849 eligible cases who had returned a long questionnaire (i.e.including occupational history), completed the questions on chronic bronchitis symptoms, andreported a date for the onset of first symptoms.
Among the 261 work-related asthma cases, 47 had responded to the shortened questionnairein the third mailing and therefore had not returned an occupational history. These individualswere mailed again and asked to complete and return an occupational history identical to thatincluded in the original (long) questionnaire.
Although 360 cases of work-related chronic bronchitis were identified in the prevalence study,a number of these individuals also described symptoms of work-related asthma and so werealready selected as asthma cases. After discounting the work-related asthma cases, and thosefor whom no occupational history was available, the remaining 209 cases of work-relatedchronic bronchitis were selected for inclusion. The prevalence study identified 2068 non-work-related chronic bronchitis cases, of whom 1217 had no symptoms of asthma and hadreturned a long questionnaire. From this subset, a random sample of 200 cases was selectedfor inclusion in this study.
2.3.2 Selection of controls
A single control was individually matched by age to each asthma case, to within one year oneither side. Controls were selected at random from all eligible individuals identified as beingfree of any respiratory symptoms in the prevalence study. Specifically, an eligible controlresponded 'No' to all the IUATLD questions on chest symptoms and to the all the MRCquestions on coughing and phlegm, and 'No' and 'Never' to the direct questions on asthma.Additionally, an eligible control responded 'No' to having had a work-related illness, or, if'Yes', gave non-respiratory conditions for the doctor's diagnosis, or for their own diagnosisif a doctor was not consulted. According to the above criteria, 7893 eligible controls, whoreturned long questionnaires, were identified in the prevalence study. Eligible controls, andasthma cases, were stratified into single-year age bands and controls selected at random withineach stratum to match the number of asthma cases.
Matching asthma cases and controls in this way allowed valid paired comparisons of careerprogression to be made with reference to the age of onset of asthma symptoms given by thecase. The sample of controls matched to the asthma cases were also compared, unmatched,with the chronic bronchitis cases in separate statistical analyses.
2.4 Coding of occupations
Occupational histories for the selected cases and controls were coded blind by an experiencedcoding clerk. For each job, the job sequence number, start and end dates, occupation andemployer's industry were coded as a single record in the job history data sheets. Dates were
coded as reported, as combinations of day, month and year. Occupations were coded usingthe Standard occupational classification (OPCS, 1990), which, consists of three-digit codesfor 371 occupational groups (OG), based on the comparability of skills required for eachoccupation. The Standard occupational classification (SOC) has an hierarchical structure withsimilar OGs grouped into 77 minor groups based on the first two digits. These minor groupsare grouped further into 9 major groups. The employer's industry was coded with referenceto the Standard industrial classification of economic activities (CSO, 1992) The Standardindustrial classification (SIC) is an hierarchical classification of industries into 60 divisions,222 groups and 503 classes. Coding was based, where possible, on the four-digit codes forclasses.
Respondents were asked for all jobs held, both part-time and full-time, since leaving school.Jobs were coded as they were reported, with no attempt to interpolate missing information.Where a respondent indicated that they were still employed in a particular job, the date ofquestionnaire completion was inserted as the end date. Where entries for occupation orindustry did not fall within the SOC or SIC classifications, additional codes were created.These codes covered periods of unemployment, sickness, retirement and full-time education.
When a series of jobs were indicated within a single box referring to a single employer, eachjob was coded as a separate job history record in the sequence in which they were given. Theoverall start date for the employer was taken as the start date for the first job in sequence,and the overall end date taken as the end date of the final job. Dates for intermediate jobswere coded as missing. Where a respondent indicated that, for a single time period, he/shehad held a number of jobs of the same occupation (but possibly different employers), theseries of jobs was coded as if a single job but was flagged with a code to indicate multiplejobs.
The SOC classifies occupations purely on the skills and qualifications required to carry outthe occupation and not on the rank or status of the person within the occupation. Separatecodes exist for managerial jobs, where management is viewed as the principal function of thejob. Also coded was an additional suffix to the three-digit code which is used to distinguishjobs with managerial ('M') and foreman ('F') status, and which is necessary to determinesocio-economic status based on occupation.
Any job history which was left blank or contained large gaps was omitted from the study anda replacement drawn at random from the remaining eligible cases and controls. Work-relatedcases were not replaced in this way since all eligible cases from the prevalence study wereoriginally selected for inclusion.
2.5 Data processing
The coded occupational history data of the selected cases and controls were entered intocomputer data files and checked for consistency. All other relevant information on cases andcontrols that could be extracted from the questionnaires had already been processed duringthe prevalence study. This information included details on the sex, date of birth and smokingstatus of all individuals, and the responses to questions on respiratory symptoms and thecorresponding diagnosis based on these, including the work-relatedness of symptoms. Thecoded occupational history data were entered into a computer database by an experienced dataentry operator using Key Entry III on a PC. All those sent a questionnaire in the prevalence
study were assigned an identity number, printed on the questionnaire, and this was enteredwith each occupational history record to allow this information to be linked with the dataalready entered against individuals during the prevalence study. Simple range checks andchecks on valid codes were carried out as data were entered. The job sequence number waschecked for correspondence with the starting date of jobs to allow jobs to be rankedchronologically with regard to the starting date.
2.6 Statistical methods
2.6.1 Occupational histories
Cases and controls were compared on the basis of whether or not they had ever beenemployed in each of a number of occupations. Before any comparison was made, it wasnecessary to group the occupations in the SOC to give adequate numbers of cases and controlsin each group, while ensuring occupations within groups were, to a certain extent, exposedto the same potential agents of asthma or chronic bronchitis. In keeping with the statedobjectives of the study, two groupings of occupations were used. The first corresponded tothe two-digit minor groups as defined in the SOC. These minor groups were used for ageneral sweep through all occupations in an attempt to find any with evidence of an increasedrisk of asthma and/or chronic bronchitis. The second grouping was based on the reportingof new cases of occupational asthma within the SWORD project. This grouped occupationsinto occupational sets based on prior associations with increased risks of occupationalrespiratory problems, particularly asthma. Meredith (1993) defined 20 occupational setsbased on the Classification of occupations (OPCS, 1980), which was the predecessor of theSOC used in this study. For this study, the number of occupational sets was expanded toinclude additional groups for textile workers and print workers, and previously-combinedgroups like construction and mining, and transport and storage were separated. Thecorrespondence between the SOC OG codes and these modified occupational sets is shownin Table 2.1. Several extra codes were required to cover periods of unemployment,retirement, full-time education and unknown jobs, and these are shown under major group0.
All jobs for each asthma case were labelled into one of three categories which related to thedate of onset of asthma. A job was labelled as definitely starting before onset if the startdate or end date were prior to the date of onset, or if the job sequence number was less thanthe maximum job sequence number of all jobs with start date prior to onset. A job waslabelled as definitely starting after onset if the start date was after the date of onset, or if thejob sequence number was greater than the minimum job sequence number of all jobs withstart date after onset. : Jobs were labelled as indeterminate.in-relation to onset if, due tomissing start or end dates or missing date of onset, they were not known to have definitelystarted before or after the date of onset. This categorisation of jobs was also carried out forthe individually-matched controls in relation to the age of onset of symptoms of the case towhich they were matched. Since the date of onset of symptoms was only available for asthmasymptoms, jobs were not distinguished in this way for chronic bronchitis cases.
2.6.2 Relationship between occupation and respiratory symptoms
The statistical analysis of relationships between occupations and respiratory symptoms was

10
based on the case-control design of this study (Schlesselman, 1982). For the analysis ofasthma symptoms, this took the form of a matched-pairs design, with a single controlmatched, by age (within ± 1 year), to each of the 461 cases. For the analysis of chronicbronchitis symptoms, this took the form of an unmatched design, with 409 cases and the same461 controls as used in the asthma analysis.
Occupations that were previously associated with respiratory symptoms were investigatedusing the SWORD-based classification of occupational sets. A more general scan of alloccupations was made using the minor groups classification within the SOC. Thequestionnaire asked about chest symptoms relating to asthma occurring in the previous 12months. To include all possible occupations which might have aggravated these symptoms,and to increase the power of the investigation given the wide range of jobs which may havebeen held over a working lifetime, all jobs notified in the returned occupational histories wereincluded in the analysis of associations.
Basic measures of the degree of association between each occupation and symptoms of asthmawere calculated from the number of case-control pairs where the case, but not the control,had been employed in an occupation, and the number of pairs where the control, but not thecase, had been employed in the same occupation. The ratio of these numbers of discordantpairs gave an estimate of the crude odds ratio (OR) for an occupation. Each OR was the oddsof the prevalence of asthma among those ever employed in an occupation, relative to the sameodds among those never employed in that occupation. An OR greater than 1 indicated raisedodds of asthma associated with employment in an occupation. The numbers of discordantmatched pairs was also used to calculate a standard error for the OR. An approximate 95 %confidence interval was calculated on the log scale (log OR ± 1.96SE) and back-transformedto the original scale.
The association between occupation and prevalence of asthma symptoms was investigated byfitting, for each occupational group, a conditional logistic regression model (Collect, 1991)which included terms for potential confounding variables like sex and smoking status.Current smoking status was determined using the questionnaire and categorised as eithercurrent smoker, ex-smoker or non-smoker. To each model including confounders, occupationwas added as a binary variable distinguishing those who had been employed, from those whohad never been employed in an occupation. Therefore, each model produced an estimate ofthe prevalence odds of asthma among those who had been employed in a specific occupationrelative to the same odds among those who had never been employed in that occupationalgroup, adjusted for potential confounders. These conditional logistic regression models werefitted using the statistical computer package BMDP (Dixon, 1992).
Basic measures of the degree of association between occupations and symptoms of chronicbronchitis were calculated from the number who had been employed in each occupationrelative to the number who had not, separately for cases and for controls. The ratio of theodds for cases relative to the odds for controls gave an estimate of the crude OR. Using thestandard error, an approximate 95% confidence interval could be calculated.
Adjustment for the potential confounding variables of age (at 31/3/94, just prior to the firstmailing), smoking status and sex was carried out using (unconditional) logistic regression.Each regression model produced an estimate of the adjusted odds ratio of chronic bronchitissymptoms for each occupation along with their 95% confidence intervals, similar to theconditional analysis of asthma cases. These logistic regression models were fitted using the

11
generalised linear modelling facilities within the Genstat statistical package (Genstat 5Committee, 1993).
2.6.3 Relationship between asthma and career progression
To determine the effect of the onset of asthma on employment prospects, paired comparisonswere made between asthma cases and their age-matched controls based on the number of jobsheld, and the time spent in full- or part-time employment. Within-pair comparisons weremade of these variables after the age of onset of symptoms in the case and after the same agein the matched control. To avoid bias, analysis of the number of jobs held after onset wasrestricted to cases-control pairs with enough information on job dates to rank all jobs inrelation to the age of onset symptoms, and with no coded multiple jobs. For time spent inemployment, analysis was restricted to cases and controls with a complete set of job historydates.
Comparison of career progression before and after the onset of asthma symptoms was alsocarried out using the socio-economic status derived from the final job held prior to the onsetof symptoms and the first new job started after onset. There are two commonly-usedclassifications of socio-economic status in the U.K., the six-category social class (SC) scaleand the socio-economic group (SEG) scale with 17 categories. Both can be derived from atwo-way breakdown of occupation (based on SOC) and employment status, where the latterdistinguishes the self-employed (with or without employees), managers (in large or smallestablishments) and foremen, from all other employees. Since employment status has lesseffect on social class, which consists of broad divisions based on skills, and given that thelarge number of SEG categories would result in sparse tables of distributions of case-controlpairs, the SC scale was used to compare the status (or seniority) of occupations. Adescription of the SC scale is given in Table 2.2. It was necessary to include an additionalcategory labelled 'Other' to cover periods of unemployment and for members of the ArmedForces who are not assigned to a social class. No accurate knowledge of the self-employedor the size of the employer's establishment was available, so jobs were allocated to the socialclass of the occupation corresponding to other employees, unless managerial or foreman statuswas indicated, in which case the relevant class was assigned.

12
13
3. RESULTS
3.1 Study sample
3.1.1 Coding of occupations
The re-mailing of 47 work-related asthma cases without an occupational history from theprevalence study resulted in 10 completed histories being returned and 2 histories returnedundelivered due to the addressees having moved away. Therefore, 224 work-related asthmacases were available for inclusion in the study sample for analysis. Among the completedquestionnaires of the 209 work-related chronic bronchitics selected, one had been filed outof sequence and was not readily available for data entry. This left 208 available work-relatedchronic bronchitis cases for inclusion in the study sample.
Of the 200 randomly-selected non-work-related asthma cases, 14 had blank or largelyincomplete occupational histories and so were replaced by additional cases drawn from thepool of eligible cases. Of these replacements, a further 2 had to be replaced for the samereason. Likewise, of the 200 randomly-selected non-work-related chronic bronchitis cases,8 were replaced when they were found to have blank or largely incomplete occupationalhistories. Among the control sample age-matched replacements were required for 19 controlswith missing occupational histories.
The total study sample for statistical analysis therefore comprised 1256 individuals, consistingof 424 asthma cases (224 work-related, 200 non-work-related), their 424 individually-matchedcontrols, and 408 chronic bronchitis cases (208 work-related, 200 non-work-related).
A total of 5507 occupational history records were coded for the 1256 individuals in the studysample, resulting in an average of 4.4 jobs per individual. Of these records, 10 were codedas unknown occupation, while 39 were flagged as multiple jobs of the same occupation (thatoccupation being most often in the construction industry). The start and end dates of jobs inthe job history were not always given: 78% of all jobs coded had both dates given, 4% hadonly the end date, 10% only the start date and 8% had neither date. These relativeproportions did not differ among jobs held by cases and controls separately.
3.1.2 Characteristics of study sample
A breakdown of the 1256 cases and controls in the study sample by sex, age and smokingstatus is shown in Table 3.1. Within the control group, there were marginally more females(58%) than males, while among asthma cases, males and females were in roughly equalproportions. Among chronic bronchitis cases as a whole, males (66%) were more prevalentthan females. Within both conditions, males were relatively more common among work-related cases than among non-work-related cases.
Current smokers were much more common among chronic bronchitics (51 %) and asthmatics(35%) than among controls (17%). A low proportion of smokers among the controls wasexpected since these individuals had been selected on the basis that they had respondedpositively to having had no respiratory symptoms at all in the 12 months prior to the
14
questionnaire. On the other hand, a high proportion of smokers among bronchitic cases wasexpected since smoking is commonly associated with symptoms of chronic bronchitis, moreso in relation to current smoking status than to past smoking history.
All individuals were between ages 15 and 65 years, and, since they were age matched withinone year, the mean ages of asthma cases and controls were the same at 39 years. The meanage of chronic bronchitis cases was slightly older at 42 years. There was an almost uniformdistribution of cases and controls spread across the 10-year age groups.
Those who reported symptoms of asthma were asked for the date when those symptoms firstoccurred. Of the 424 asthma cases, 31 did not give a date of first symptoms. Figure 3.1shows the distribution of calendar year of the date of onset of symptoms for those that didgive a date. Clearly, symptoms were most likely to have been reported to first appear in theyears immediately preceding the mailing of the questionnaire, i.e. the years leading up to1994. In fact, 205 cases (52%) reported first symptoms in the years since 1990, and 323(82%) since 1980, although dates of first symptoms are reported going back to the 1940's.There were small peaks at 1985 and, particularly, at 1980, which suggest that some of thosewith symptoms may have been crudely approximating the date of first symptoms. The shortfollow-up time since the onset of asthma for the majority of cases limited the investigationof how employment status had changed since first symptoms.
Figure 3.2 shows the distribution of age at first symptoms for asthma cases. This distributionwas evenly spread across all age groups, and included 58 cases who reported first symptomsbetween birth and age 15 years. The pattern indicates that asthma commonly first occurs inyounger rather than older people and, therefore, in this cross-sectional population, there wasa preponderance of recent starts.
3.1.3 Summary of industries
Table 3.2 shows, for each industry sector, the numbers of both cases and controls who hadever been employed in that industry. Industries were grouped based on the divisions withinthe SIC classification to produce tabulated numbers large enough to allow meaningfulcomparisons. Since each distinct occupation in an individual's occupational history wascounted, the same individuals may appear in the counts for different industries, and so thepercentages will not necessarily sum to 100% among cases or controls.
It can be seen that around a quarter of all study sample members had been employed in publicadministration and a similar proportion in the retail trade. Other industries well representedin the sample were construction, manufacture of food products, and health and social work.The ratio of the percent of cases relative to the percent of controls in each industry gives asimple measure of the relative risk (RR) associated with past employment in each industry.With regard to asthma, there were proportionally more cases than controls in the hotel andrestaurant industry (RR=2.0), and the food processing industry (RR=1.7). Equally therewere noticeably proportionally more chronic bronchitis cases than controls in the landtransport (RR = 3.0), metal manufacturing (RR=2.0) and construction (RR=1.7) industries.
These crude measures of risk based on the SIC classification of industry did not take intoaccount the matching of asthma cases to controls, nor the wide variety of occupations possiblewithin each industry. Since, for many skilled and unskilled jobs, the SOC classification of

15
occupation also inherently took account of the nature of the employer's business, more preciseand meaningful comparisons between cases and controls were carried out using groupings ofoccupations rather than industries.
3.2 Relationship between occupation and respiratory symptoms
3.2.1 Overview
As mentioned in Section 2.6.2, both crude ORs and ORs adjusted for potential confoundingvariables were calculated for each occupation of interest. Adjustment for confoundersrequired a model-fitting approach that allowed for the matched pairs design of the asthmaanalysis and the unmatched design of the chronic bronchitis analysis. It is common inexposure-response studies to include all potential confounders in a model before adding theexposure variable, which, in these analyses, was a simple binary variable indicating whetheran occupation had been held. To be defined as a confounder, a variable should be associatedwith the exposure variable and, independently, with the response variable, which, in theseanalyses, was a binary variable indicating the presence or absence of prevalent symptoms ofeither asthma or chronic bronchitis. Due to the large number of occupational groups ofinterest in these analyses, and therefore the large number of models to be fitted, a standardmodel-fitting procedure was required to produce ORs for each occupation adjusted for thesame relevant confounders across all occupations.
As an example of model fitting using a single occupation, Table 3.3 shows the output of fourregression models which could be used to analyse the effect of employment as a foodprocessor on the prevalence of asthma. Terms were included for smoking status (current orex-smokers versus non-smokers), sex and employment (ever versus never), with automaticadjustment for age due to it being the matching variable. Each coefficient is an estimate ofthe log odds ratio of asthma adjusted for all other variables with terms in the model.Confidence intervals were calculated from the log OR plus and minus 1.96 standard errors,which were then back-transformed to the original scale using the exponential transformation.Equivalently, the ratio of coefficient to standard error, as given in Table 3.3, could be usedto test whether, with a value greater than 1.96 or less than -1.96, the confidence intervalapproach indicated that the estimated OR was significantly greater than, or less than, 1respectively. In Table 3.3, the coefficient for smoking status was not greatly affected by theinclusion or exclusion of the other terms, which suggested that the confounding betweensmoking and the other variables was negligible. In model A, with no other terms, thesecoefficients translated to ORs of 3.1 for current smokers and 1.4 for ex-smokers, both inrelation to non-smokers. The inclusion of sex in model B confirmed a slightly higherproportion of males among cases than among controls, although not statistically significantbased on the 95% confidence interval; The addition of a term for employment in foodprocessing, both before (model C) and after (model D) the inclusion of sex was significant,and in both instances predicted an odds ratio of 2.2 associated with employment in thisoccupation.
As for the asthma example above, Table 3.4 shows the output of four regression modelswhich could be used to analyse the effect of employment as a construction worker on theprevalence of chronic bronchitis. As age was no longer a matching variable, it was includedas a potential confounder. Smoking status was highly significant, with current smokers muchmore common among cases than controls. In model A, with terms for age and smoking
16
status, the odds ratio for current smokers relative to non-smokers was 6.7, and for ex-smokers the odds ratio was 1.8. The linear term for age was also significant in model A, butthe size of the effect was reduced with the inclusion of sex suggesting association betweenthese two variables. The term for sex, included after smoking and age was significant (modelB) and indicated that cases were more likely to be male than controls. This was expected,since the prevalence study found that work-related chronic bronchitis, which accounted foraround half of the cases selected for this analysis, was four times more prevalent amongmales than females, whereas the control set was more approximately evenly split between thesexes. The term for employment as a construction worker was significant when included aftersmoking and age (model C) but not after sex also (model D), a consequence of constructionbeing an almost exclusively male occupation.
For several occupations sex was strongly associated with employment in that occupation. Forexample, cleaners and nurses were mostly female occupations, and wood workers andconstruction workers were almost exclusively male occupations. Because these strongassociations may have lead to spurious results, and because there was no strong evidence inthe earlier study of a difference between the sexes in the prevalence of non-work-relatedrespiratory symptoms, it was decided not to adjust for sex when analysing the effect of eachoccupation.
Statistical inference was based on 95 % confidence intervals within each model fitted using aspecific occupation. The problem of multiple significance testing, due to the large numberof occupations analysed, is discussed in Section 4.1.
3.2.2 Asthma
Table 3.5 shows, for each occupational set in the SWORD classification, estimates of thecrude unadjusted odds ratios, calculated from the numbers of discordant matched pairs wherethe case, but not the control, had been employed in each occupation (denoted b), relative tothe number of pairs where the control, but not the case, had been employed in that occupation(denoted c). A series of regression models similar to model C in Table 3.3 were fitted, eachadjusting for smoking status, and each including a term for a different occupational set.Table 3.5 shows, for each occupation, the adjusted odds ratios and 95% confidence intervalscalculated from the coefficients and standard errors of these fitted models.
Several occupational sets showed high unadjusted odds ratios of greater than 2.0. In general,the same occupational sets had significantly raised odds after adjustment for smoking, basedon individual 95% confidence intervals. The relatively small reductions in the ORs afteradjustment for smoking in most occupational sets indicated that smoking was only weaklyassociated with these occupations and could not explain the significantly raised odds in manyoccupations. By far the highest prevalence odds were associated with bakers, with adjustedOR 7.34 (95% CI from 1.63 to 33.20). They were followed by general labourers, adjustedOR 3.00 (95% CI from 1.14 to 7.92), and food processors, adjusted OR 2.19 (95% CI from1.04 to 4.61). Cleaners, textiles workers and construction workers had significantly raisedORs of around 1.8 (although the lower confidence limit for construction workers wasmarginally less than 1.0). Some occupations were associated with high ORs, but, due tosmall numbers, were very imprecisely estimated. These included spray painters, adjusted OR3.34 (95% CI from 0.61 to 18.30), and also metal treatment workers and print workers bothwith estimated ORs of around 2.4.
17
Of those employed in food processing, more than half had worked in the production andprocessing of meat products, with a significant number specifically processing poultry meat.Most of those who had worked in textiles processing, had been employed as machinists in themanufacture of clothing. The category for labourers and general workers was a catch-allgroup of occupations within a variety of mostly dusty and dirty industries. The cleanerscategory contained mostly domestic and office cleaners, while construction workers consistedof a variety of manual jobs in the building trade.
The last four occupational sets in Table 3.5 (numbers 50,60,70,80) were included forcompleteness but, since information on these periods of unemployment was volunteered andnot requested, estimates of odds ratios were unreliable.
Table 3.6 shows another series of unadjusted ORs, estimated separately for each occupationas in Table 3.5, with occupations classified by SOC minor groups. Since there are almost80 minor groups, many comprised very small numbers of cases and controls. Because ofthis, and because adjustment for smoking in the main reduced the estimated ORs onlyslightly, this table was used to scan for additional occupations, not distinguished in theSWORD classification, which were associated with high odds of asthma symptoms.However, it was not possible to aggregate the results of these minor groups to exactlycorrespond with the SWORD classification since, like the occupational sets, membership ofeach minor group was not mutually exclusive.
Catering occupations (Minor Group 62) had an unadjusted OR of 2.62 which dropped to 2.30(95% CI from 1.26 to 4.22) after adjustment for smoking. In this study sample this groupcomprised chefs, waiters and bar staff in roughly equal numbers. Armed Forces NCOs alsoappeared to be associated with raised odds of asthma symptoms after adjustment for smoking.This group included both regular soldiers and, particularly among older males, those who hadexperienced periods of national service. Electrical and electronic trades (Minor Group 52),in this study almost exclusively electricians, had an OR of 2.37 which fell to 1.93 (95% CIfrom 0.82 to 4.55), which was not significantly greater than one, after adjustment forsmoking. No other occupations were associated with high odds ratios that had not alreadybeen identified as such using the SWORD-based classification of occupational sets.
The odds ratios associated with the occupations in Tables 3.5 and 3.6 were estimated usingasthma cases, regardless of their being diagnosed as work related or not related to work basedon questionnaire responses. Table 3.7 shows the results of fitting regression models, eachincluding an occupational set associated with a raised odds of asthma, that allow for adifferent associations between the prevalence of asthma and occupation among work-relatedcases and non-work-related cases. The structure of the model includes a term for the effectof occupation among non-work-related cases, and a term for the difference in effect ofoccupation between non-work-related and work-related cases. The coefficients of these termscan then be used to estimate the log OR for non-work-related cases (coeffNW) and, separately,work-related cases (coeffNW + coeffDIF). The difference in degree of association betweenoccupation and asthma was tested based on the size of the difference coefficient (coeffDIF)relative to its standard error (SE).
Only among wood workers was there strong evidence that work-related cases had a higherOR than non-work-related cases (1.72 and 0.38 respectively). There was less conclusiveevidence of a similar pattern among other metal and electrical processors (OR 1.83 for work-related cases and 0.87 for non-work-related cases). Among textiles processors there was
18
evidence that the OR for non-work-related cases was significantly higher than that for work-related cases (3.89 and 0.94 respectively). Among the other occupations there was noevidence that the association between asthma symptoms and occupation was different for non-work-related cases compared to work-related cases.
3.2.3 Chronic bronchitis
Chronic bronchitis cases were analysed in relation to occupation similarly to asthma casesexcept that the regression models fitted took account of the unmatched structure of the design.A series of models similar to model C in Table 3.4 was fitted, each adjusting for age andsmoking, and each including a term for a different occupational set from the SWORD-basedclassification. The resulting estimated odds ratios for each occupation, adjusted for smokingand age, are shown in Table 3.8 with 95% confidence intervals. Also shown are estimatesof the unadjusted odds ratios calculated using the number of cases (n,) and controls (n2)employed in each occupational group.
In comparison with asthma, a larger number of occupations showed raised unadjusted oddsratios, in particular, ORs greater than 2.0. Smoking patterns within these occupations did notgenerally account for these raised odds, although ORs were generally reduced afteradjustment for smoking status and age. Bakers were again associated with the highestprevalence odds ratio, despite the small number involved, with adjusted OR 5.28 (95% CIfrom 1.11 to 25.20). The next highest prevalence odds ratios were associated with painters,adjusted OR 4.88 (95% CI from 1.58 to 15.03), and mining, adjusted OR 4.68 (95% CI from1.58 to 13.86). Other occupations with significantly raised ORs, which were greater than2.0, were metal treatment workers, welders and other metal/electrical processors, chemicalprocessors and farmers. Construction workers and non-road transport and storage workershad estimated ORs marginally less than 2.0. Nurses and other professional workers wereassociated with ORs significantly below 1.0, when compared separately against those in allother occupations.
Chemical processors were generally represented by plant operatives in oil refineries or basicchemical manufacturers, while metal treatment workers consisted of a mixture of moulders,furnace workers and electroplaters. Those classed under farmers were mostly farm workers,but the type of farm was often not indicated. Other metal/electrical processors covered agreat variety of occupations, although metal workers, motor mechanics, electricians andplumbers accounted for over half the individuals in this category. Almost half of those in thenon-road transport and storage worked as warehousemen or storekeepers. Those employedin mining and quarrying were almost exclusively mining underground for hard coal.
Table 3.6 shows the unadjusted oddsrratios for chronic bronchitis associated with each minorgroup in the SOC classification. Aside from those occupational groups already identified withraised ORs, workers in the electrical and electronic trades (Minor Group 52), who weremostly electricians, and vehicle trades (Minor Group 54), mostly motor mechanics, had highunadjusted odds ratios. Adjusted for smoking, the ORs for these two groups were stillsignificantly raised, being 2.84 (95% CI from 1.19 to 6.78) and 5.26 (95% CI from 1.68 to16.47) respectively. Other craft and related occupations (Minor Group 59), consisted of amixture of occupations previously associated with high ORs. As with asthma symptoms,Armed Forces NCOs (Minor Group 60) were associated with a high unadjusted OR, althoughthis was reduced considerably after adjustment for smoking and age. Road transport
19
operatives (Minor Group 87) had an unadjusted OR of 2.15, but this was reduced to 1.56(95% CI from 0.88 to 2.78) after adjustment for smoking and age.
3.3 Relationship between asthma and career progression
3.3.1 Rate of change of j obs
Case-control paired comparisons were made of the number of new jobs taken up after the ageof onset of asthma symptoms reported by the case, to look for evidence that those whosuffered from asthma may have found it more difficult to hold down jobs and therefore havea higher rate of new jobs started. Analysis was restricted to a subset of 329 asthma case-control pairs for whom all jobs could be dated in relation to the reported date of firstsymptoms and who had no multiple jobs. This subset had comparable sex and agedistribution to the full set of cases and controls.
Figures 3.3(a) and 3.3(b) show the distributions, for cases and controls, of the number of newjobs started after the date of onset of asthma. The horizontal axes in both these figures havebeen truncated at 13 jobs to the exclusion of single values of 21 and 16 jobs in the case andcontrol distributions respectively. It is clear that very few cases or controls started new jobsafter the date of onset, which may have been a consequence of many reporting first symptomsoccurring just prior to receiving the postal questionnaire. Figure 3.3(c) shows the paireddifferences in the number of jobs started (case minus control) and, not surprisingly, there isa large peak at zero. Overall, the distribution of differences was approximately symmetric,suggesting no tendency for cases to start more or less jobs than controls. Table 3.9(a) showssummary statistics for these paired differences tabulated by the sex combination of the case-control pair and the work-relatedness of the asthma symptoms of the case. The standard errorof any mean difference was useful for testing the size of the difference and was calculatedfrom the standard deviation (SD) divided by the square root of the number of pairs (n).Overall, for the 329 pairs, the mean difference was only 0.1 jobs, close to zero, andequivalent in size to one standard error. To allow for different working practices amongmales and females, same-sex comparisons were more valid, but these showed a similar picturewith the mean differences very close to zero. To allow for the effects of a longer follow upperiod from the date of onset, Tables 3.9(b) and 3.9(c) show the same summary statistics butfor further subsets of pairs within which the date of onset of the case was prior to 1990 andprior to 1985 respectively. Table 3.9(c) shows that, even with at least ten years follow up,there was no discernible difference in the number of new jobs started between cases andcontrols.
3.3.2 Time spent in employment
A paired comparison of the time spent in employment after the reported date of firstsymptoms of asthma was carried out to investigate whether the onset of asthma resulted inmore and longer periods of unemployment compared with zero-symptom controls. The basicstructure of the analysis was similar to that used to compare the number of jobs in Section3.3.1. Analysis was restricted to a subset of 181 case-control pairs with full job histories,that contained no missing dates, unknown or multiple jobs. This subset had comparable sexand age distributions to the full set of cases and controls.
20
Figures 3.4(a) and 3.4(b) show the distributions, for cases and controls, of time spent inemployment after the date of onset of asthma of the case. The time axes in both these figureshave been truncated at 32 years for presentation, to the exclusion of 4 cases and 3 controlsall with values between 32 and 40 years. It was clear that the majority of cases and controlshad at most only a few years of follow up within which a comparison can be made, althoughthe tails of both distributions were very long. Figure 3.4(c) shows the distribution of paireddifferences (case minus control). As with the analysis of new jobs started, there was a largepeak at around zero difference. There was slight evidence of a longer negative tail to thedistribution than positive one, representing more cases having less time in employment thancontrols. Table 3.10(a) shows summary statistics for these paired differences for all 181 validpairs by the paired sex combination and work-relatedness of the case. From the mixed sexpairs there was evidence of females spending less time in employment generally than males.Across all case-control pairs, the mean difference was 6 fewer working months for casescompared to controls. Among male-male pairs the difference was greater at 10 fewerworking months for cases. Both these mean differences were approximately 1.5 standarderrors below zero, which represents no difference. Mean differences were greater, in anegative direction, for non-work-related pairs than for work-related pairs, which was expectedsince cases diagnosed as not related to work were more likely to contain those not inemployment compared with work-related cases. Mean differences became more increasinglynegative as the date of onset was restricted back in time to before 1990 (Table 3.10(b)) andto before 1985 (Table 3.10(c)). Comparison of work-related pairs with date of onset priorto 1985 (Table 3.10(c)) gave a male-male mean difference of about 1 year less for cases, andfemale-female mean difference of about 2 years less for cases. Neither of these meandifferences was large in relation to the variation among paired differences, both less than onestandard error below zero mean difference. To further place these differences in context,mean follow-up time, from date of onset to 31/3/94, was 7, 14 and 19 years for the case-control pairs used in Tables 3.10(a)-(c) respectively.
3.3.3 Social class
The effect of the onset of asthma symptoms on employment status was investigated by cross-tabulating the social class of the last known job prior to the age of onset, against the socialclass of the first job started after onset, for cases and controls separately. For controls, theage of onset of the matched asthma case was used. Table 3.11 (a) shows the cross-tabulationof the social class (SC) for asthma cases, and Table 3.11(b) for controls.
Almost half of all asthma cases, and a similar proportion of controls, did not start a new jobafter the date of onset of asthma, a result already highlighted in the paired comparison of newjobs started after onset in Section 3.3.1. For 17% of cases and 13% of controls, there wereinsufficient dates given in the occupational histories to determine whether any job did in factcommence after the date of onset. Also, 15% of cases and 17% of controls had no job forcomparison prior to the date of onset.
Of the 94 cases and 91 controls with known jobs before and after the date of onset, 50 cases(53%) and 53 controls (58%) started a job of the same social class after the age of onset asthe last known job before onset. Of the 94 cases, 40 were work-related cases of which 65%started a job of the same social class. The remaining 54 were non-work-related cases, ofwhich 44 % started a job of the same social class. Precise comparisons of the change in socialclass among cases and controls was made difficult by the small numbers present in the cells

21
of Tables 3.11 (a) and 3.11(b), even when work-related and non-work-related cases wereanalysed together.
Among the 25 SC IV or V cases pre-onset who started new jobs after onset, 6 (24%) movedto SC III jobs and 2 (8%) moved to SC II jobs. Proportional changes were similar for thecorresponding 20 SC IV or V controls pre-onset, with 5 (25%) moving to SC III jobs and 2(10%) moving to SC II jobs. Of the 55 SC III cases pre-onset, 4 (7%) moved to SC II jobsand 13 (24%) moved to SC IV or V. In comparison, movements among the 43 SC IIIcontrols pre-onset suggested more upward mobility, with 8 (19%) moving to SC II jobs and8 (19%) to SC IV or V jobs. Given the small numbers involved though, it would be difficultto argue that there were marked differences between cases and controls.
There was a difference in the comparison of the 64 cases and 72 controls with no job priorto the reported date of onset, who were, not surprisingly, on average younger than theremainder, with mean age about 30 years for cases and controls. The proportion enteringskilled (SC III) jobs after onset was higher among controls (67%) than among cases (47%),more of whom started unskilled (SC V) or partly-skilled (SC IV) occupations. Furtheranalysis revealed that of these 64 cases, exactly 50% were work-related cases, whichsuggested that for a significant number of the 224 work-related cases, their symptoms wereexacerbated by work rather than caused by it.
3.4 Summary of results
3.4.1 Asthma and occupation
Those who were current smokers at the time of the questionnaire were more likely to reportsymptoms of asthma than non-smokers, with a relative risk of approximately 3, while for ex-smokers the relative risk was about half this value. The following occupations were foundto be associated with raised odds of prevalent symptoms of asthma, greater than expected bychance, and not explained by smoking habits (adjusted ORs in brackets): bakers (7.3), foodprocessors (2.2), textiles processors (1.8), cleaners (1.8), labourers and other general workers(3.0) and caterers (2.3). Food processors consisted, in the main, of workers in the meat andpoultry meat processing industries, while textiles workers were most often machinists in themanufacturing of clothing. Caterers were a mixed group consisting of chefs, waiting and barstaff. The following occupations were also associated with raised odds ratios although, dueto small numbers in the sample, not significantly raised when compared to those in all otheroccupations: print workers (2.4), metal treatment workers (2.4) and spray painters (3.3). Inthe majority of these occupations, the degree of association with asthma did not depend onthe work-relatedness of the symptoms as they were reported in the questionnaire.
3.4.2 Chronic bronchitis and occupation
Current smokers were far more likely to report symptoms of chronic bronchitis than non-smokers, with a relative risk of almost 7. Ex-smokers were only slightly more likely toreport symptoms compared to non-smokers, with a relative risk of less than 2. Theprevalence of chronic bronchitis symptoms was associated with a greater number ofoccupations than was asthma symptoms. The following had high prevalence odds ratios,greater than expected by chance, and taking smoking habits into account (adjusted ORs in

22
brackets): farmers (3.1), bakers (5.3), chemical processors (3.2), welding and electronicassembly (2.4), metal treatment workers (3.8), various other metal and electrical processors(2.2), painters (4.9), construction workers (2.0), coal-miners (4.7), various storageoccupations (1.8), labourers and general workers (4.1), electricians (2.8) and vehicle repairers(5.3). With raised ORs for chronic bronchitis, similar to the corresponding ORs for asthma,but not significantly raised when compared to those in all other occupations were: foodprocessors (1.7) and cleaners (1.6).
3.4.3 Asthma and career progression
Three characteristics of career progression were compared between asthma cases and controlsin relation to the age of onset of asthma symptoms among the cases: the number of new jobsstarted after onset, the time spent in employment after onset, and the change in social classof jobs from pre- to post-onset. A large proportion of both cases and controls did not startnew jobs after the date of onset so the overall mean difference was negligible. Even withinsame-sex pairs of work-related cases with a minimum of 10 years follow up, the meandifferences were no greater than around 1 job and not significantly different from zero giventhe variation among case-control pairs.
Of those that did start new jobs, the majority started jobs of the same social class as the lastjob held before onset. There was a suggestion that skilled controls were more likely thancases to move to managerial jobs and less likely to move to unskilled jobs. There was alsoslight evidence that controls without a job prior to the date of onset were more likely to starta skilled job and less likely to start an unskilled job in comparison with cases without a jobprior to the date of onset. Neither of these differences were large though and, given the smallnumbers involved, the evidence was not at all conclusive.
Differences in time spent in employment after the onset of symptoms in the case were, onaverage, very low due to the relatively short follow-up periods from date of onset of asthma.Cases did, on average, spend less time in employment than controls but the difference onlyamounted to 6 months among all case-control pairs. Among same-sex pairs, this differencedid increase with lengthening follow up resulting in mean differences of 1 year and 2 yearsfor male pairs and female pairs respectively, all with a minimum of 10 years follow up.However, the mean follow-up time was 19 years for these pairs and this, plus the largevariation among case-control pairs meant that these differences were practically andstatistically insignificant.

23
4. DISCUSSION
4.1 Relationship between occupation and respiratory symptoms
Diagnosis of cases and controls
The diagnosis of cases and controls in this study was based on responses to the standardquestions on respiratory symptoms included in the questionnaire for the prevalence study(Cowie et al, 1997). Asthma and chronic bronchitis are closely related diseases and candisplay very similar symptoms making it difficult to make a correct diagnosis. The diagnosesbased on the respiratory symptoms questionnaire were not mutually exclusive so individualscould be classed as potential cases of either or both diseases. In fact, due to the inclusion ofall work-related cases identified in the prevalence study, almost half of the asthma cases usedin the matched-pairs analysis of occupations were also diagnosed with symptoms of chronicbronchitis. Only a small proportion of chronic bronchitis cases however were also diagnosedwith symptoms of asthma.
An attempt was made in the prevalence study to check the reliability of the diagnoses basedon self-reports, for both the symptoms and LFS questionnaire responses. A clinicalassessment was made by a consultant chest physician on a sample of those reportingrespiratory symptoms of asthma or chronic bronchitis.
There was good agreement between the diagnoses of asthma by physician and by symptomsquestionnaire responses. Of the 72 cases of self-reported asthma presented, 75% wereclinically diagnosed as having asthma, 10% chronic bronchitis, and 15% other respiratorydisease. However, the identification of work-related asthma was not so reliable; only 35%of the 54 self-reported cases of work-related asthma were clinically diagnosed to haveoccupational asthma or asthma aggravated by work. Similarly, only 50% of the 18 self-reported cases with non-work-related asthma were clinically diagnosed as having a respiratorydisease that was not related to work. This misclassification of the work-relatedness ofrespiratory symptoms using only the symptoms questionnaire responses helps to explain why,in the present study, apparent associations between occupations and asthma symptoms differedlittle according to whether cases were work-related or not related to work.
There was less information on the reliability of diagnoses of chronic bronchitis cases basedon self-reports. However, of the 14 cases with self-reported chronic bronchitis who attendedthe clinic, only 5 (36%) were diagnosed with clinical chronic bronchitis and 5 (36%) withclinical asthma.
Since controls were selected from among those responding positively to having no respiratorysymptoms, it is unlikely that any cases of asthma or chronic bronchitis have beenmisclassified as controls, or controls as cases of either condition.
Due to the difficulty in diagnosis from self-reports, some of those included in the analysis asasthma cases may in fact have been cases of chronic bronchitis and vice versa. There will alsohave been some who genuinely suffered from both conditions. If this was true, this blurringof the distinction between the two diseases will have weakened the power of the statisticalanalyses to detect true associations with occupations where they exist. This may also explain

24
the appearance of some occupations with raised odds ratios for both diseases. Most notableamong these were bakers, who are known to suffer from occupational asthma throughexposure to flour dust, but who were associated with very high odds of chronic bronchitis.Also, this diagnostic uncertainty may explain why some occupations like farmers, paintersand, possibly, chemical industry processors were associated with raised odds of chronicbronchitis when asthma would have been expected.
Selection of cases and controls
The sampling frame for the selection of cases and controls in the current study was the 16990individuals who returned validated respiratory symptoms questionnaires in the prevalencestudy. This represented around 50% of the total number who were sent out a postalquestionnaire, which itself was almost a 50% random sample of those registered in a selectionof postcode districts within the databases of Lothian and Forth Valley Health Boards. Forinclusion in the study sample, all work-related cases, and a random sample of non-work-related cases, of both asthma and chronic bronchitis, were selected. Additionally, a randomsample of controls, from among those with zero respiratory symptoms, was selected.
The target population in this study comprised all those of working age living in the districtsfrom which samples were taken at the time of the questionnaire. Inevitably, the same biaseswhich existed for the prevalence study in relation to this target population will also exist here.In that study, the young and males, for example, were under-represented among responders.However, in a case-control study, the analysis is conditional on those cases and controlsselected, and even differential response rates between potential cases and controls in the targetpopulation do not necessarily lead to biased results. As long as response rates are the samefor those exposed and those unexposed within the populations of potential cases and potentialcontrols, response rates can be different between potential cases and controls withoutintroducing a bias into the estimation of odds ratios. In this study, there was anecdotalevidence from comments written on returned questionnaires with missing occupational historyinformation that some who believed their respiratory symptoms were occupationally related,did not want to disclose information on their past or present employers. However, we seeno reason why response rates would have differed greatly, across occupations among potentialcases and or among controls.
Exposure estimation
Since occupational histories were self-administered, there was inevitably the potential forrecall bias resulting in unreliable data. In the prevalence study, one suggestion for the lowresponse rate (at least in comparison with an earlier pilot study which had an 80% response),was that some individuals were.unwilling .to.;give occupational .details in conjunction withinformation on health. In general, the occupational histories of those selected for the studysample, and hence coded and processed, appeared to be relatively complete, althoughinformation on dates was patchy, probably because of difficulty in recalling precise dates forjobs held up to several decades in the past. The large proportion of asthma cases whoreported a date of onset of asthma symptoms in the few years just prior to the first mailingmight suggest that there was difficulty in recalling reliably when symptoms first occurred.Low and comparable proportions of non-work-related cases and controls were rejected andreplaced at random because occupational histories had been left blank or appeared to containlarge gaps. By the same criteria, only a small number of work-related cases would have beenreplaced had replacements been available. All except one of these cases reported information
25
on at least one job held. A potential source of bias in the statistical analyses could havearisen from a difference in the reliability of recall of occupations between cases and controls,but there was little evidence for this among the completed occupational histories.
Interpretation of results
The odds ratios (ORs) quoted in this study are estimates of the odds of prevalent symptomsamong those who have been employed in each occupation relative to the odds among thosewho have never been employed in that occupation. These ORs are not estimates of therelative risks in each occupation, since they were not based on incident cases and controlswithin a well-defined population during a follow-up period. Nor are these odds ratiosnecessarily comparable across occupations. This is because prevalence is a function of bothincidence and the average duration that incident cases remain prevalent and within thesampling frame. Therefore, differences in prevalence could reflect differences in incidenceor differences in the durations that incident cases remain prevalent. The latter might occur,for example, if asthma caused by different agents resulted in different temporal patterns ofsymptoms, or if cases of occupational asthma were more likely to remain exposed to thesensitising agent in some occupations compared with others. The use of prevalent cases alsoignores the potentially complex movements of individuals into and out of the study area, andalso the effect of mortality. However, since the study was community based, there shouldhave been no healthy worker effect to influence the estimated risks.
Some individuals will have been employed in more than one occupation and so the regressionmodels fitted to each occupation separately were not statistically independent. No attemptwas made to model jointly how the risks associated with each occupation combined to explainthe overall prevalence of respiratory symptoms. One problem with this multiple model-fittingapproach was that the number of models fitted was dictated by the number of occupationalgroups analysed. Therefore, inference based on a fixed significance level, or, as here, a fixedconfidence level for each model, suffers from the problem of multiple significance testingwhen applied to a large number of fitted models. This means that the overall probability ofat least one false positive (Type I) result among all occupations analysed will be considerablyhigher than the probability of a false positive conclusion for any specific occupation. Usingsignificance tests based on 95 % confidence intervals as we have here, by definition, we wouldexpect to find 1 false positive result for every 20 occupations analysed.
Neither of the two limitations mentioned above, lack of independence among occupations andmultiple testing, was foreseen to be a problem, since this study was concerned withidentifying as wide as possible a range of candidates for occupations that would warrantfurther investigation for causative agents of asthma. It was less important to produce a falsepositive result than to produce a false negative result and therefore fail to find an associationbetween occupation and asthma which in fact may have been real.
Since all jobs held on or before the date of questionnaire completion were analysed, if therewas a tendency for cases to move to certain occupations after first symptoms this might resultin an unexpectedly high OR for these occupations. But, since very few cases reported achange of job after the date of first symptoms, this is unlikely to account for any of the strongassociations that were found for many occupations.
Comparison with other studies

26
There have been few community-based studies that report the risk of asthma related tooccupations, although there have been many studies reporting the incidence rates ofoccupational asthma based on surveillance schemes in various countries. Two recentexamples of community-based studies are Mastrangelo et al (1997) and Ng et al (1994). InMastrangelo et al (1997) the authors reported much higher risks for many occupations thanthe latter study and suggested that this was because they had used incident cases rather thanprevalent cases and had calculated the odds of asthma for the occupation held at firstsymptoms relative to the odds in a pre-defined low-risk group of occupations. As expected,the ORs estimated in the present study were closer to those reported by Ng et al (1997) sincewe also used prevalent cases and calculated the odds of asthma among those who had heldeach occupation ever held relative to the odds among those who had not. This latter methodmay underestimate ORs because the comparison group of occupations will include occupationswith a high risk of asthma.
Any comparison between the results of community-based studies needs to take account of thedifferent occupational profile of the target population, since certain locally-based occupationsand industries which can be responsible for a large proportion of prevalent cases may giverise to associations which are not apparent in regions where these occupations and industriesare not common, or are absent. Isocyanates, which cause asthma in spray painters, forexample, accounted for 22% of all cases reported to the SWORD scheme in 1989 and 1990(Meredith, 1993). In the current study however we found very few individuals with past orpresent exposure as coach or spray painters, and so no firm conclusions could be drawn.
Baker's asthma, due to exposure to flour and grain, is a common type of occupational asthmaand we found strong evidence of higher prevalence of asthma cases in bakers compared withthose in other occupations. Food processors and textiles processors, with raised odds ratiosin the current study, were also associated with raised odds of asthma in Mastrangelo et al(1997) and Ng et al (1994), although in the former the main source of the food-related caseswas due to fish and eggs, while in this study the dominant occupations were in the meat andpoultry meat processing industries. Occupational asthma has been previously associated withpoultry workers (Bar-Sela et al, 1984), and also with exposure to PVC packaging (shrink-wrap) common in the meat-packing industry. Cleaners were also associated with a high oddsof asthma in Ng et al (1994) as in the present study, although Meredith (1993) reported a lowincidence from the SWORD scheme. As here, Ng et al (1994) also report high odds ratiosfor print workers and motor mechanics, while Meredith (1993) found metal treatment workersto have the fifth highest incidence rate, attributing the source to various metal fumes fromsmelting and foundry work.
Similar and comparable community-based studies of chronic bronchitis have not been reportedin the literature, probably because bronchitis accounts for far fewer cases, of work-relatedrespiratory disease reported by the SWORD scheme each year. Nevertheless, a commonlycited causative agent is welding fumes, a finding that is backed up by the high estimated ORsfor welders in this study. Others have found evidence of an excess of chronic bronchiticsamong steel workers (Hunting and Welch, 1993) and foundry workers (Karava et al, 1976),and the current study also found high ORs associated with metal treatment and processingoccupations. Dusty jobs have been associated with high incidence of chronic bronchitis, mostnotably coalmining, which the current study also found to be strongly associated withsymptoms of chronic bronchitis. Exposure to dust may also explain the raised odds ofsymptoms in construction workers found in this study.
27
4.2 Relationship between asthma and career progression
Previous studies have implicated the onset of asthma with substantial loss of earnings anddifficulty in finding new work (Cannon et al, 1995; Gannon et al, 1993; Venables et al,1989). These studies, unlike the present study, used direct questions on changes inemployment, in follow-up surveys of workers who had previously been confirmed withdiagnoses of asthma.
In the current study we compared three characteristics of career progression between asthmacases and their paired controls with zero symptoms, with reference to the age of onset ofasthma symptoms of the case: the number of new jobs started after onset, the time spent inemployment after onset, and the change in Social Class of jobs before and after onset. Innone did we find evidence of a large overall difference between cases and controls, andindeed we found a large degree of variation between case-control pairs. Taken together, therewas no compelling evidence that the onset of asthma, whether work-related or not, wasdetrimental to employment prospects as a whole, although much of this may have been dueto a general lack of a long follow-up period among case-control pairs.
The major limitation of these analyses was the use of prevalent cases, which necessitated aretrospectively-defined follow-up period (i.e. from prevalence of symptoms back to onset ofsymptoms). Thus it was not possible to take account fully of the effects through time ofmortality and migration of workers in and out of the study area. It may be that part of thereason for the small number starting new jobs after onset, apart from lack of follow-up time,was because we could not include those who once lived in the study area but who moved outof the area to find new work.
These analyses were prone to the same potential biases as the analyses of occupation andrespiratory symptoms. A substantial misclassification of work-related cases will haveweakened the power of the analyses to find differences between cases and controls if, asreported in Cannon et al (1995), the effect of asthma is more likely to be detrimental to thecareers of work-exacerbated cases than to non-work-related cases. However, restriction ofcases and controls would have introduced a hidden bias only if career progression and thecompleteness of information in the occupational history were related differently for cases andcontrols, and this is unlikely to have happened.

28

29
5. CONCLUSIONS
The principal conclusions which result from this study are summarised below.
(i) Symptoms of asthma and, in particular, of chronic bronchitis were more likely tohave been reported by smokers compared to non-smokers or ex-smokers. Symptomsof chronic bronchitis were more commonly reported among males than amongfemales.
(ii) The reporting of symptoms of asthma was associated with previous occupations held,even after allowing for different smoking habits within occupations. Symptoms ofasthma were particularly implicated with occupations in food processing, catering andtextiles manufacturing industries.
(iii) The reporting of symptoms of chronic bronchitis was associated with a wider rangeof occupations than for symptoms of asthma. After adjusting for smoking status,chronic bronchitis symptoms were associated, in particular, with occupations in dustyenvironments, such as coalmining, and occupations exposed to chemical and metalfumes, such as welding.
(iv) Some occupations were associated with symptoms of both conditions, most notablybakery workers. Other occupations, such as farmers, had raised odds of chronicbronchitis when asthma might have been expected. This indicated that there was adegree of misclassification between cases of asthma and chronic bronchitis due to thedifficulty in diagnosing the two conditions from self-reports.
(v) The relationship between occupations and the prevalence of asthma symptoms did notdepend on the work-relatedness of symptoms as diagnosed using the postalquestionnaire. In light of this, and the generally poor agreement with the clinicaldiagnoses in the prevalence study, the use of the self-administered questionnaire byitself may not have been a reliable method of distinguishing work-related asthma fromnon-work-related asthma.
(vi) From the information that could be inferred from the occupational histories on careerprogression, there was no strong evidence that the occurrence of asthma symptomshad later adverse effects on employment prospects. However, without a longerperiod of follow-up, it has not been possible to investigate this aspect fully.

30

31
6. FURTHER WORK
One area of further work resulting from this study would be to examine in more detail theinformation given on the occupational histories to help identify, within specific high-riskoccupations, the types of workplace which contribute most to the raised risks. Additionalinformation on employers that is available in the public domain could be incorporated, suchas size of company and methods of manufacturing. Separate studies of typical types of workplaces could than lead to a better understanding of the sensitising agents and how exposuresin the workplace lead to symptoms of asthma among employees.
Another area for future work is to investigate further how questionnaire responses could beused to give improved diagnosis of cases of asthma and chronic bronchitis. There is thepotential, using the results of the clinical assessments from the prevalence study, to investigatethe combinations of responses that best discriminate between the two conditions, and betweenthose with and without either of these conditions, while minimising the likelihood ofmisclassification. To this end it may be of value to conduct clinical examinations of morequestionnaire respondents with symptoms of chronic bronchitis, to clarify any diagnosticconfusion between chronic bronchitis and asthma.

32

33
7. ACKNOWLEDGEMENTS
The authors would like to thank the U.K. Health and Safety Executive for their financialsupport for this study. The authors would also like to acknowledge the work of TomCampbelton, who interpreted and coded the occupational histories, and Margaret Burnett, whoentered the coded histories into computer files.

34
35
8. REFERENCES
Bar-Sela S, Teichtahl H, Lutsky I. (1984). Occupational asthma in poultry workers. Journalof Allergy and Clinical Immunology; 73: 271-275.
Cannon J, Cullinan P, Taylor AN. (1995). Consequences of occupational asthma. BritishMedical Journal; 311: 602-603.
Central Statistical Office. (1992). Standard industrial classification of economic activities1992. London: HMSO.
Chang-Yeung M, Malo J-L. (1994). Aetiological agents in occupational asthma. EuropeanRespiratory Journal; 7: 346-371.
Collett D. (1991). Modelling binary data. London: Chapman and Hall.
Cowie HA, Prescott GJ, Beck J, Hutchison PA, Middleton WG, Miller BG, Ritchie PJ,Soutar CA, Wright SC. (1997). Community-based epidemiological study of the relations ofasthma and chronic bronchitis with occupation. Edinburgh: Institute of OccupationalMedicine. (IOM Report TM/97/01).
Dixon WJ. (1992). BMDP Statistical software manual. Berkeley (CA): University ofCalifornia Press.
Gannon PFG, Weir DC, Robertson AS, Burge PS. (1993). Health, employment, and financialoutcomes in workers with occupational asthma. British Journal of Industrial Medicine; 50:491-496.
Genstat 5 Committee. (1993). Genstat 5 release 3 reference manual. Oxford: ClarendonPress.
Hunting KL, Welch LS. (1993). Occupational exposure to dust and lung disease among sheetmetal workers. British Journal of Industrial Medicine; 50: 432-442.
International Union Against Tuberculosis and Lung Disease. (1986). Bronchial symptomsquestionnaire. Paris: IUATLD.
Karava R, Hernberg S, Koskela RS, Luoma K. (1976). Prevalence of pneumoconiosis andchronic bronchitis in foundry workers. Scandinavian Journal of Workplace and EnvironmentalHealth; 2: 64-72.
Love RG, Murdoch RM, Campbell SJ, Soutar CA. (1990). Epidemiological study of therelations between asthma and occupation: pilot study of a postal questionnaire. Final Reporton Asthma Research Council grant no. 126. Edinburgh: Institute of Occupational Medicine.(IOM Report TM/90/04).
Mastrangelo G, Bombana S, Priante E, Gallo A, Saia B. (1997). Repeated case-controlstudies as a method of surveillance for asthma in occupations. Journal of Occupational and
36
Environmental Medicine; 39: 51-57.
Medical Research Council, Committee on Environmental and Occupational Health. (1986).Questionnaire on respiratory symptoms (1986); with instructions to interviewers. London:HMSO.
Meredith SK, Taylor VM, McDonald JC. (1991). Occupational respiratory disease in theUnited Kingdom 1989: a report to the British Thoracic Society and the Society ofOccupational Medicine by the SWORD project group. British Journal of Industrial Medicine;48: 292-298.
Meredith SK. (1993). Reported incidence of occupational asthma in the United Kingdom,1989-1990. Journal of Epidemiology and Community Health; 47: 459-463.
Meredith SK, Nordman H. (1996). Occupational asthma: measures of frequency from fourcountries. Thorax; 51: 435-440.
Ng TP, Hong CY, Goh LG, Wong ML, Koh KTC, Ling SL. (1994). Risks of asthmaassociated with occupations in a community-based case-control study. American Journal ofIndustrial Medicine; 25: 709-718.
Niven RM, Fletcher AM, Pickering CAC, Fishwick D, Warburton CJ, Simpson JCG, FrancisH, Oldham LA. (1997). Chronic bronchitis in textile workers. Thorax; 52: 22-27.
Office of Population Censuses and Surveys. (1980). Classification of occupations 1980.London: HMSO.
Office of Population Censuses and Surveys. (1990). Standard occupational classification.Vol.1: Structure and definition of major, minor and unit groups. London: HMSO.
Sallie BA, Ross DJ, Meredith SK, McDonald JC. (1994). SWORD '93. Surveillance of work-related and occupational respiratory disease in the UK. Occupational Medicine; 44: 177-182.
Schlesselman JJ. (1982). Case-control studies. Oxford: Oxford University Press.
Soutar CA, Campbell SJ, Gurr DC, Lloyd MH, Love RG, Cowie HA, Cowie AJ, Seaton A.(1989). Cross-sectional studies of respiratory disease in British coalminers. Final report onCEC Contract 7248-31/009. Edinburgh: Institute of Occupational Medicine. (IOM ReportTM/88/06).
Venables KM, Davison AG, Newman Taylor AJ. (1989). Consequences of occupationalasthma. Respiratory Medicine; 83: 437-440.

37
Table 2.1 Correspondence between the SOG occupational group (OG) codes and themodified SWORD-based classification of occupational sets
Major Group
1 Managerial and AdministratorsFarm owners/managers, horticulturistsOther managers in farming, hort. and fishingRemainder
2 Professional OccupationsNatural scientistsEngineers and technologistsHealth ProfessionalsRemainder
3 Associate professional and technical occs.Laboratory techniciansScientific techniciansNursesHealth associate professionalsRemainder
4 Clerical and secretarial occupationsStorekeepers and warehousemenRemainder
5 Craft and related occupationsPainter and decoratorsConstruction tradesMetal machining tradesElectrical/electronic tradesSmiths and forge workersMoulders, coremakers, die castersWelding tradesMetal forming, welding and related tradesVehicle tradesTextiles, garments and related tradesPrinting and related tradesWoodworking tradesBakers, flour confectionersFood preparation tradesGardeners/groundsmenHorticultural tradesCoach painters, other spray paintersFace-trained coalmining workersOffice machinery mechanicsRemainder
6 Personal and protective service occupationsAssistant nurses and auxiliariesHairdressers, barbersCaretakersRemainder
7 Sales Occupations
SOC OG Codes
100-199160169Remainder
200-293200-209210-219220-224Remainder
300-399300300-309 (ex 300)340340-349 (ex 340)Remainder
400-491441Remainder
500-599507500-509 (ex 507)510-519520-529530531537532-536540-544550-559560-569570-579580580-582 (ex 580)594595596597598Remainder
600-699640660672Remainder
700-792
Occupational Set
6. Farmers7. Other agric., forestry & fishing9. Other prof., clerical & service
2. Other science & technology2. Other science & technology5. Other health prof, and assoc.9. Other prof, clerical & service
1 . Laboratory technicians2. Other science & technology4. Nurses5. Other health prof, and assoc.9. Other prof., clerical & service
31. Other transport & storage9. Other prof., clerical & service
24. Other painters27. Construction22. Other metal & electrical proc.22. Other metal & electrical proc.21. Metal treatment21. Metal treatment20. Welding & electronic assembly22. Other metal & electrical proc.22. Other metal & electrical proc.16. Textiles proc.17. Print workers1 1 . Wood workers13. Bakers12. Other food proc.7. Other agric., forestry & fishing6. Farmers
25. Spray painters28. Mining & quarrying22. Other metal & electrical proc.18. Other materials proc.
4. Nurses8. Hairdressers3. Cleaners9. Other prof, clerical & service
9. Other prof., clerical & service

38
Table 2.1 (Continued)
Major Group
8 Plant and machine operativesBakery and confectionery process oper.Other food, drink, tobacco process oper.Textiles and tannery process oper.Chemical, gas, petroleum process plant oper.Plastics process oper., moulders & extrudersMetal making and treating process oper.Metal working process oper.Assemblers/lineworkers (electrical goods)Assemblers/lineworkers (metal goods)Routine laboratory testers -Road transport oper.Other transport and machinery oper.Printing machine mindersWater and sewerage plant attendantsElectrical, energy and boiler plant oper.Oilers, greasers, lubricatorsMains and service pipe layers and jointersConstruction and related oper.Woodworking machine oper.Mine (ex coal) and quarry workersRemainder
9 Other occupationsFarm workersOther occs. in agric., forestry and fishingCoal mine labourersLabourers in foundriesLabourers in engineering and allied tradesMates to metal/electrical and related fittersOther labourers in processing industriesMates to woodworking trades workersOther occupations in constructionDriver's matesOther occupations in transportWindow cleaners/Road sweepers/CleanersAll other labourers and related workersAll other miscellaneous workersRemainder
0 Non-SOC codesStudent (tertiary)Student (secondary)Resident abroad (occupation unknown)Unknown occupation .UnemployedSick leave/ InvalidityMaternity leaveRetiredTraining schemes
SOC OG Codes
800-899800809810-814820825830-839840-844850851864870-875880-889891892893894895896897898Remainder
900-999900900-904 (ex 900)910911912913919920920-929 (ex 920)934930-934 (ex 934)956-958990999Remainder
960961962970980981982983984
Occupational Set
13. Bakers12. Other food proc.16. Textiles proc.15. Chemicals proc.14. Plastics proc.21. Metal treatment22. Other metal & electrical proc.20. Welding & electronic assembly22. Other metal & electrical proc.
1 . Laboratory technicians30. Road transport3 1 . Other transport & storage17. Print workers27. Construction22. Other metal & electrical proc.22. Other metal & electrical proc.27. Construction27. Construction1 1 . Wood workers28. Mining & quarrying18. Other materials proc.
6. Farmers7. Other agric., forestry & fishing
28. Mining & quarrying21. Metal treatment22. Other metal & electrical proc.22. Other metal & electrical proc.40. Labourers & general workers1 1 . Wood workers27. Construction30. Road transport3 1 . Other transport & storage3. Cleaners
40. Labourers & general workers18. Other materials proc.9. Other prof., clerical & service
50. Students50. Students80. Unknown occupation80. Unknown occupation60. Unemployed60. Unemployed60. Unemployed60. Unemployed70. Training schemes
Abbreviations:agric. agriculturehort. horticultureproc. processors
assoc. associatesoccs. occupationsprof. professionals
exoper.
excludingoperatives
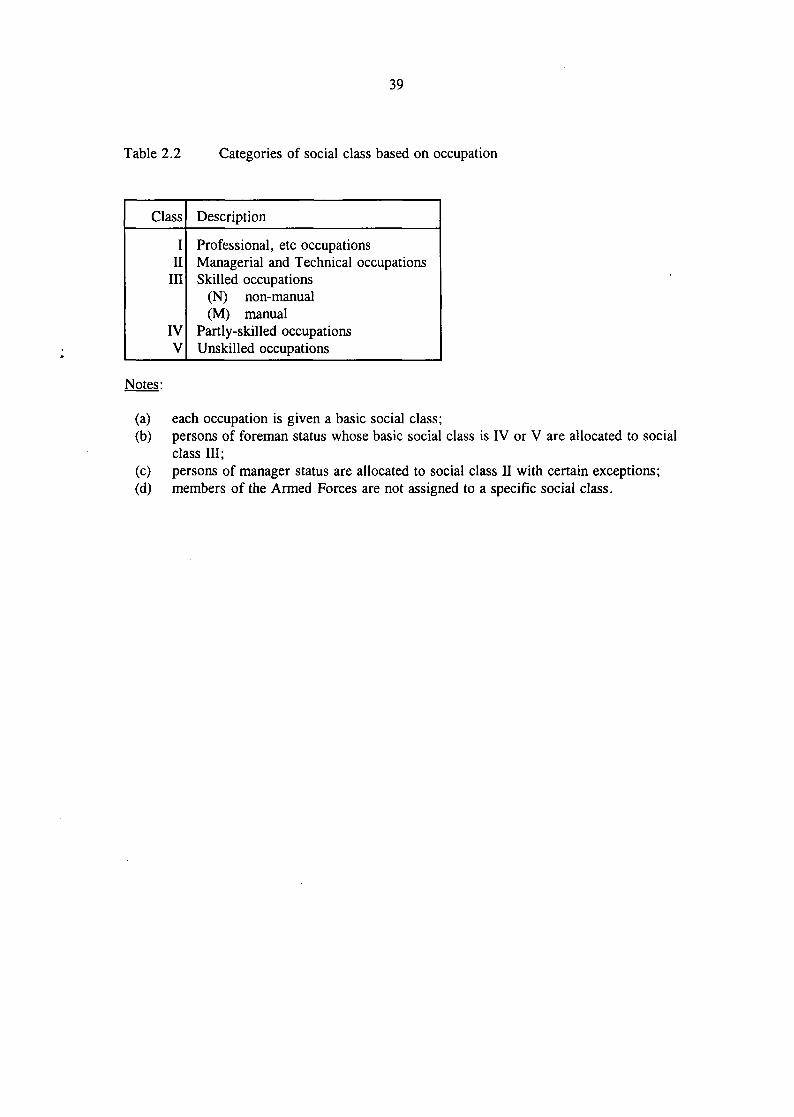
39
Table 2.2 Categories of social class based on occupation
Class
III
III
IVV
Description
Professional, etc occupationsManagerial and Technical occupationsSkilled occupations
(N) non-manual(M) manual
Partly-skilled occupationsUnskilled occupations
Notes:
(a)(b)
(c)(d)
each occupation is given a basic social class;persons of foreman status whose basic social class is IV or V are allocated to socialclass III;persons of manager status are allocated to social class II with certain exceptions;members of the Armed Forces are not assigned to a specific social class.
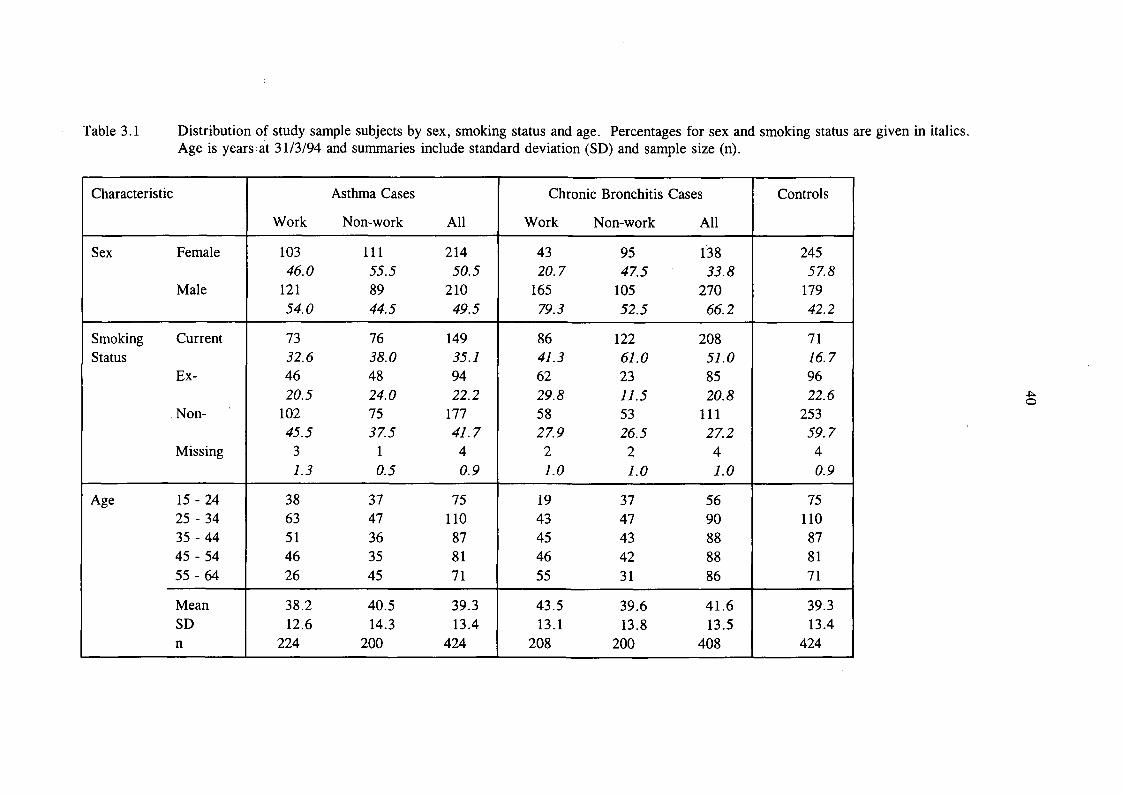
Table 3.1 Distribution of study sample subjects by sex, smoking status and age. Percentages for sex and smoking status are given in italics.Age is years at 31/3/94 and summaries include standard deviation (SD) and sample size (n).
Characteristic
Sex Female
Male
Smoking CurrentStatus
Ex-
. Non-
Missing
Age 15 - 2425 - 3435-4445 -5455-64
MeanSDn
Asthma Cases
Work Non-work All
103 111 21446.0 55.5 50.5
121 89 21054.0 44.5 49.5
73 76 14932.6 38.0 35.146 48 9420.5 24.0 22.2
102 75 17745.5 37.5 41.73 1 41.3 0.5 0.9
38 37 7563 47 11051 36 8746 35 8126 45 71
38.2 40.5 39.312.6 14.3 13.4
224 200 424
Chronic Bronchitis Cases
Work Non-work All
43 95 13820.7 47.5 33.8
165 105 27079. 3 52.5 66.2
86 122 20841.3 61.0 51.062 23 8529.8 11.5 20.858 53 11127.9 26.5 27.22 2 41.0 1.0 1.0
19 37 5643 47 9045 43 8846 42 8855 31 86
43.5 39.6 41.613.1 13.8 13.5
208 200 408
Controls
24557.8
17942.2
7176.79622.6
25359.740.9
75110878171
39.313.4
424
-p..o

Table 3.2 Summary of the numbers (n) of cases and controls ever employed in each industry. The percentage of the total number (N) in eachcomparison group is shown in italics.
12
5
10-12
13-14
15-16
17-18
19
20
21-22
23
24
25
26
Industry Division
Agriculture and related service activities
Forestry, logging
Fishing
Mining of energy producing materials
Mining of non-energy producing materials
Manufacturing:
food products, beverages and tobacco
textiles and textiles products
leather products
wood products
pulp and paper products; publishing
coke and refined petroleum products
chemical products
rubber and plastic products
other non-metallic mineral products
asthma cases
n
10
0
1
20
2
87
52
2
8
30
9
22
9
23
(N=424)
%
2.4
0.0
0.2
4.7
0.5
20.5
12.3
0.5
1.9
7.1
2.1
5.2
2.1
5.4
chronic bronchitis cases
n
20
0
2
38
15
59
38
0
10
27
14
34
23
28
(N=408)
%
4.9
0.0
0.5
9.3
3.7
14.5
9.3
0.0
2.5
6.6
3.4
8.3
5.6
6.9
n
10
1
0
13
1
51
37
0
14
23
19
26
11
17
controls(N=424)
%
2.4
0.2
0.0
3.1
0.2
12.0
8.7
0.0
3.3
5.4
4.5
6.1
2.6
4.0
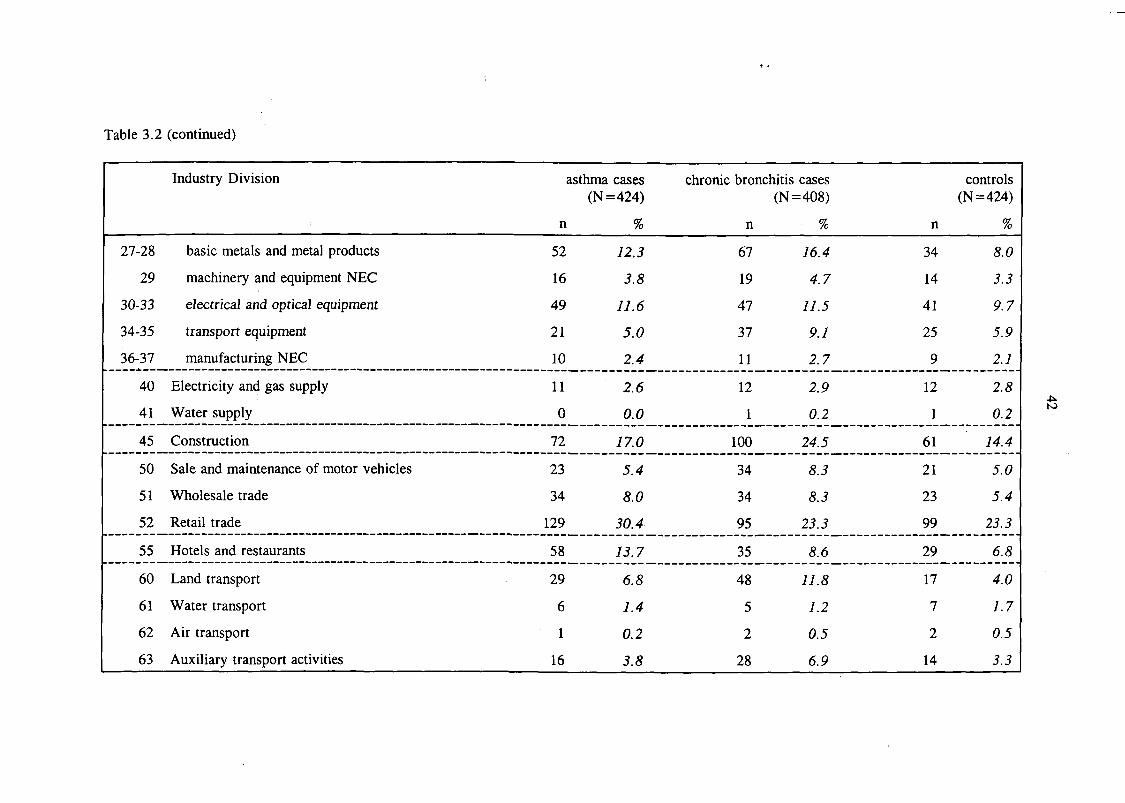
Table 3.2 (continued)
27-28
29
30-33
34-35
36-37
40
41
45
50
51
52
55
60
61
62
63
Industry Division
basic metals and metal products
machinery and equipment NEC
electrical and optical equipment
transport equipment
manufacturing NEC
Electricity and gas supply
Water supply
Construction
Sale and maintenance of motor vehicles
Wholesale trade
Retail trade
Hotels and restaurants
Land transport
Water transport
Air transport
Auxiliary transport activities
asthma cases
n
52
16
49
21
10
11
0
72
23
34
129
58
29
6
1
16
(N=424)
%
12.3
3.8
11.6
5.0
2.4
2.6
0.0
17.0
5.4
8.0
30.4
13.7
6.8
1.4
0.2
3.8
chronic bronchitis cases
n
67
19
47
37
11
12
1
100
34
34
95
35
48
5
2
28
(N=408)
%
16.4
4.7
11.5
9.1
2.7
2.9
0.2
24.5
8.3
8.3
23.3
8.6
11.8
1.2
0.5
6.9
n
34
14
41
25
9
12
1
61
21
23
99
29
17
7
2
14
controls(N=424)
%
8.0
3.3
9.7
5.9
2.1
2.8
0.2
14.4
5.0
5.4
23.3
6.8
4.0
1.7
0.5
3.3
to
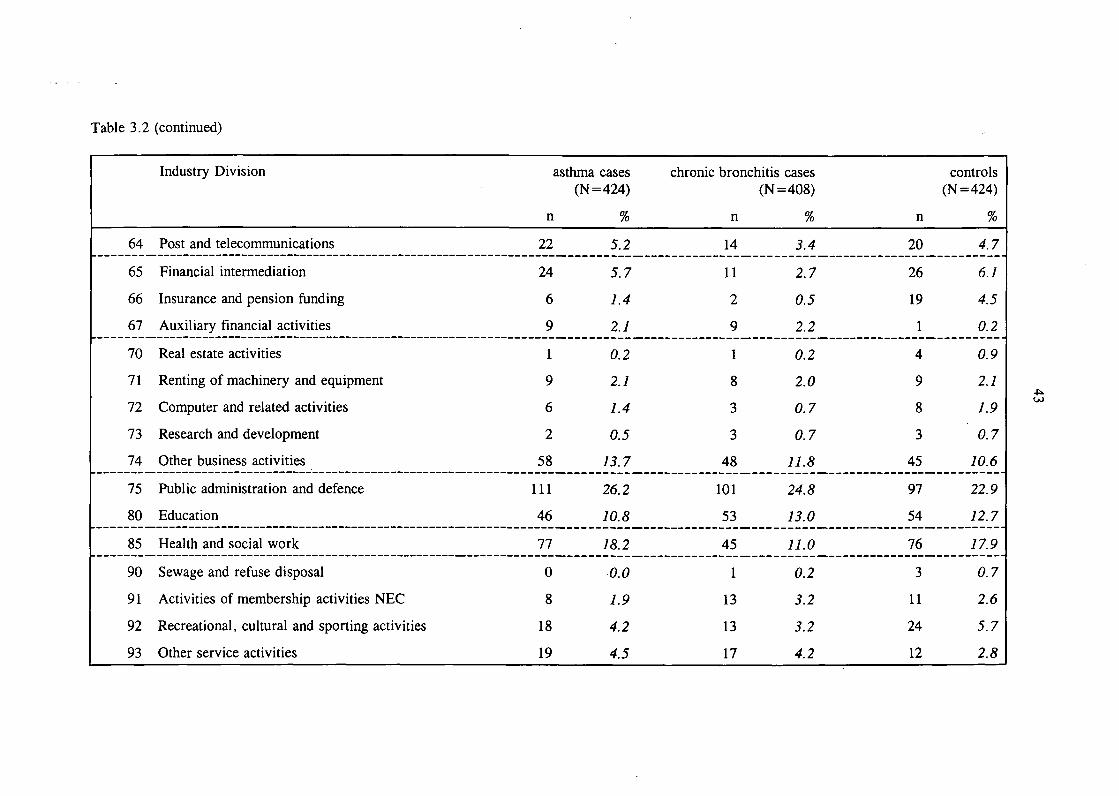
Table 3.2 (continued)
Industry Division asthma cases(N=424)
n %
64
65
66
67
70
71
72
73
74
75
80
85
90
91
92
93
Post and telecommunications
Financial intermediation
Insurance and pension funding
Auxiliary financial activities
Real estate activities
Renting of machinery and equipment
Computer and related activities
Research and development
Other business activities
Public administration and defence
Education
Health and social work
Sewage and refuse disposal
Activities of membership activities NEC
Recreational, cultural and sporting activities
Other service activities
22
24
6
9
1
9
6
2
58
111
46
77
0
8
18
19
5.2
5.7
1.4
2.1
0.2
2.1
1.4
0.5
13.7
26.2
10.8
18.2
0.0
1.9
4.2
4.5
chronic bronchitis cases
n
14
11
2
9
1
8
3
3
48
101
53
45
1
13
13
17
(N=408)
%
3.4
2.7
0.5
2.2
0.2
2.0
0.7
0.7
11.8
24.8
13.0
11.0
0.2
3.2
3.2
4.2
n
20
26
19
1
4
9
8
3
45
97
54
76
3
11
24
12
controls(N=424)
%
4.7
6.1
4.5
0.2
0.9
2.1
1.9
0.7
10.6
22.9
12.7
17.9
0.7
2.6
5.7
2.8
U)
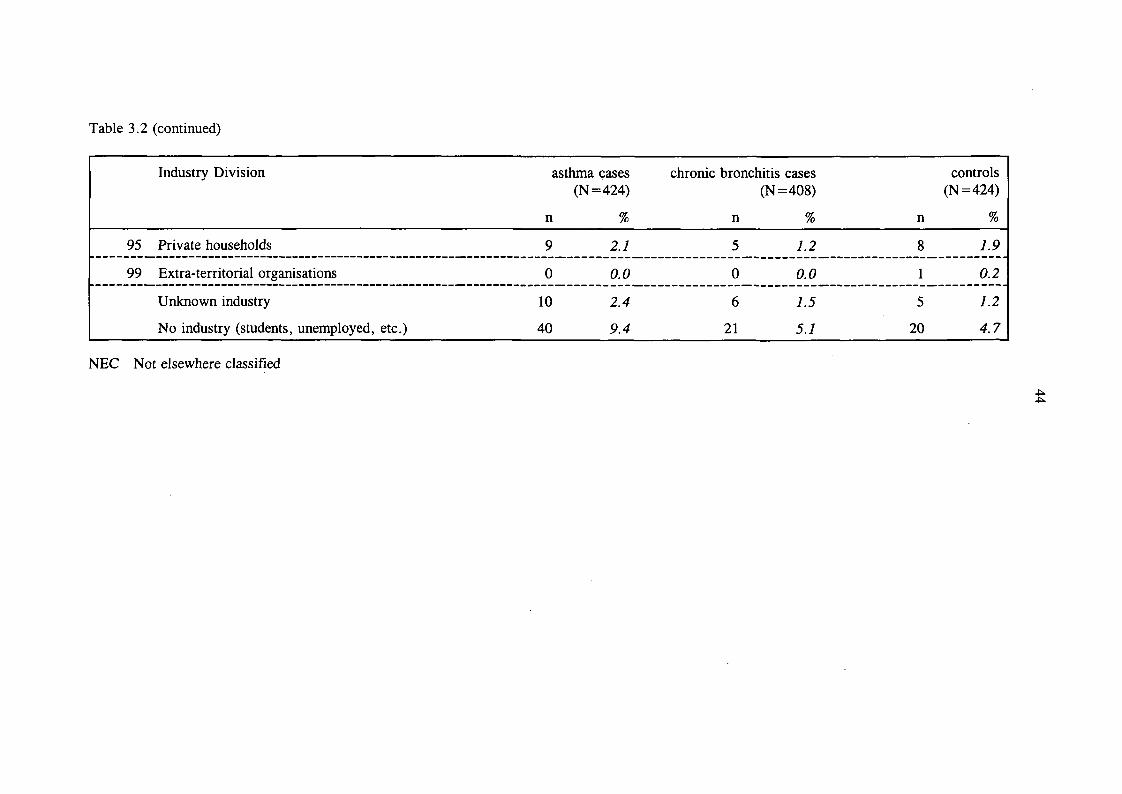
Table 3.2 (continued)
Industry Division
95 Private households
99 Extra-territorial organisations
Unknown industry
No industry (students, unemployed, etc.)
asthma cases chronic bronchitis cases(N=424) (N=408)
n
9
0
10
40
%
2.1
0.0
2.4
9.4
n
5
0
6
21
%
1.2
0.0
1.5
5.1
controls(N=424)
n
8
1
5
20
%
1.9
0.2
1.2
4.7
NEC Not elsewhere classified
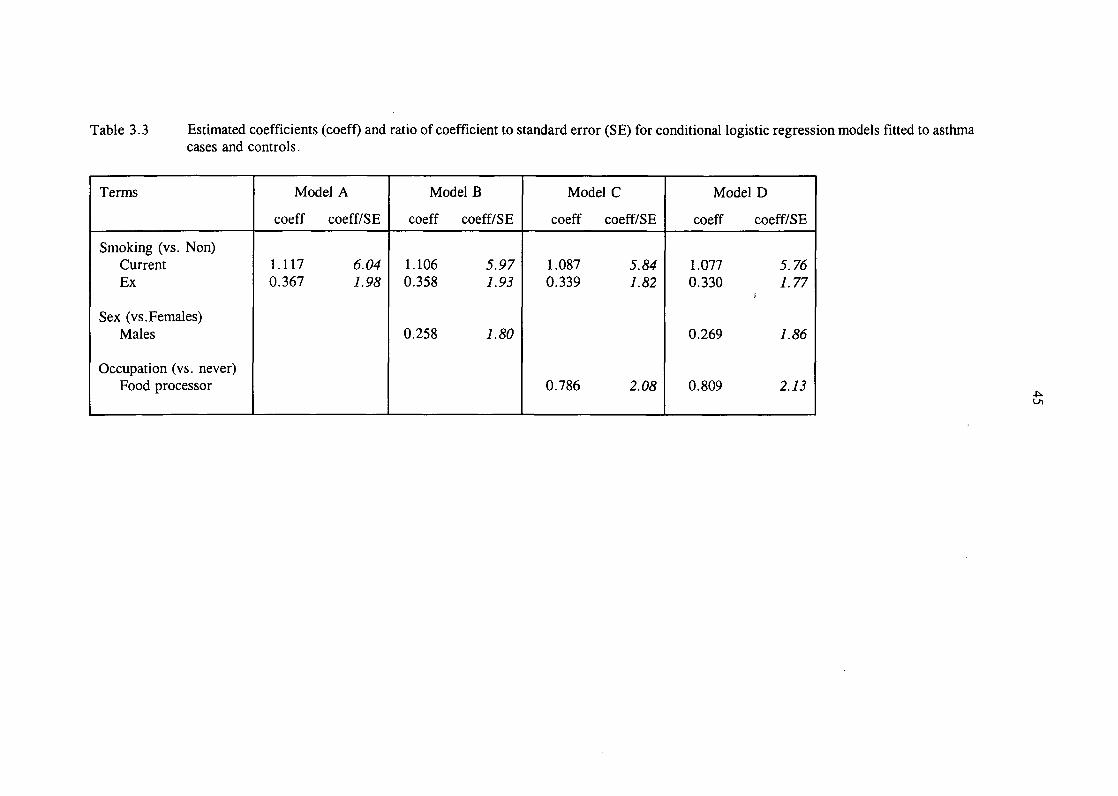
Table 3.3 Estimated coefficients (coeff) and ratio of coefficient to standard error (SE) for conditional logistic regression models fitted to asthmacases and controls.
Terms
Smoking (vs. Non)CurrentEx
Sex (vs. Females)Males
Occupation (vs. never)Food processor
Model A
coeff coeff/SE
1.117 6.040.367 1.98
Model B
coeff coeff/SE
1.106 5.970.358 1.93
0.258 1. 80
Model C
coeff coeff/SE
1.087 5.840.339 1.82
0.786 2.08
Model D
coeff coeff/SE
1.077 5.760.330 7.77
J
0.269 1.86
0.809 2.13
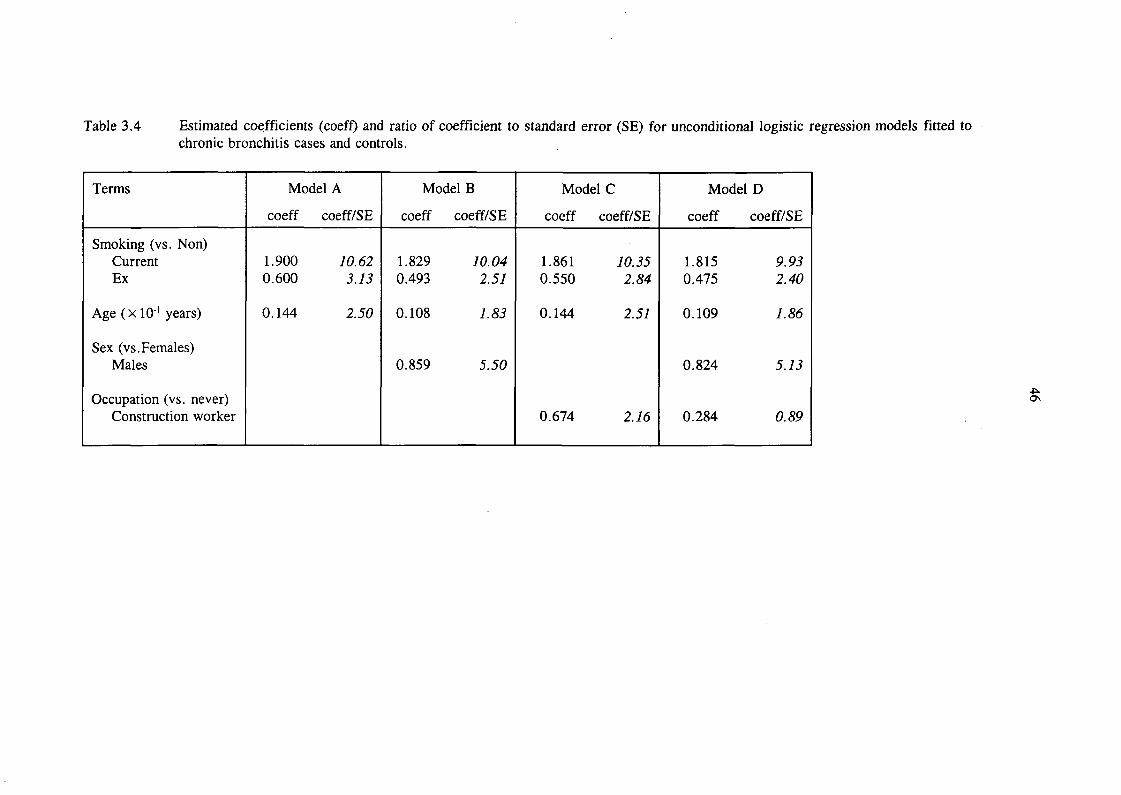
Table 3.4 Estimated coefficients (coeff) and ratio of coefficient to standard error (SE) for unconditional logistic regression models fitted tochronic bronchitis cases and controls.
Terms
Smoking (vs. Non)CurrentEx
Age (xlO'1 years)
Sex (vs. Females)Males
Occupation (vs. never)Construction worker
Model A
coeff coeff/SE
1.900 10.620.600 3.13
0.144 2.50
Model B
coeff coeff/SE
1.829 10.040.493 2.57
0.108 1.83
0.859 5.50
Model C
coeff coeff/SE
1.861 10.350.550 2.84
0.144 2.57
0.674 2.16
Model D
coeff coeff/SE
1.815 9.950.475 2.40
0.109 1.86
0.824 5.73
0.284 0.89

Table 3.5 Estimated asthma odds ratios (OR) for SWORD-based occupational sets, adjusted for smoking status, with approximate 95%confidence limits. Numbers of discordant matched pairs are denoted b (case employed, control not) and c (control employed, casenot).
Occupational Set
1 Lab. technicians2 Other science & technology3 Cleaners
4 Nurses5 Other health professionals6 Farmers7 Other agric., forestry and fishing8 Hairdressers9 Other prof. , clerical and service
1 1 Wood workers12 Food processors
13 Bakers14 Plastics processors15 Chemical processors
16 Textiles processors17 Print workers18 Other materials processors
20 Welding and electronic assembly21 Metal treatment
b c
12 1423 2337 17
22 265 128 5
11 9
10 1168 89
20 2328 1116 22 1
3 3
40 2215 660 39
18 11
10 4
UnadjustedOR Lower Limit Upper Limit
0.86 0.40 1.851.00 0.56 1.782.18 1.23 3.870.85 0.48 1.490.42 0.15 1.181.60 0.52 4.891.22 0.51 2.950.91 0.39 2.140.76 0.56 1.05
0.87 0.48 1.582.55 1.27 5.118.00 1.84 34.792.00 0.18 22.061.00 0.20 4.95
1.82 1.08 3.062.50 0.97 6.441.54 1.03 2.30
1.64 0.77 3.462.50 0.78 7.97
AdjustedOR Lower limit Upper limit
0.86 0.38 1.941.04 0.57 1.901.85 1.02 3.370.94 0.51 1.71
0.59 0.20 1.731.99 0.60 6.53
1.11 0.43 2.860.67 0.27 1.680.88 0.63 1.23
0.83 0.44 1.572.19 1.04 4.617.34 1.63 33.201.78 0.16 20.001.16 0.19 6.89
1.79 1.03 3.112.43 0.90 6.581.33 0.87 2.05
1.39 0.62 3.112.44 0.71 8.38
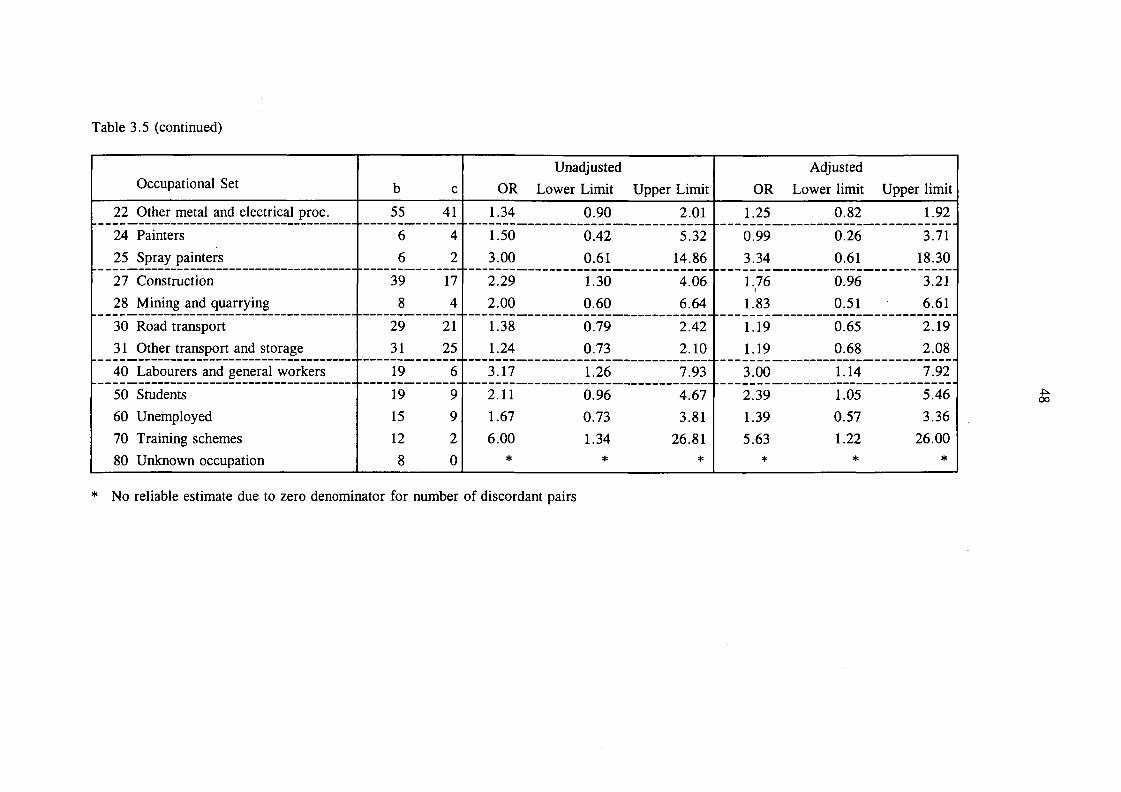
Table 3.5 (continued)
Occupational Set
22 Other metal and electrical proc.
24 Painters
25 Spray painters
27 Construction
28 Mining and quarrying
30 Road transport31 Other transport and storage
40 Labourers and general workers
50 Students60 Unemployed70 Training schemes80 Unknown occupation
b c
55 41
6 46 2
39 17
8 4
29 2131 25
19 6
19 915 912 2
8 0
UnadjustedOR Lower Limit Upper Limit
1.34 0.90 2.01
1.50 0.42 5.323.00 0.61 14.86
2.29 1.30 4.062.00 0.60 6.64
1.38 0.79 2.421.24 0.73 2.10
3.17 1.26 7.93
r 2.11 0.96 4.671.67 0.73 3.816.00 1.34 26.81
* * *
AdjustedOR Lower limit Upper limit
1.25 0.82 1.92
0.99 0.26 3.713.34 0.61 18.30
1.76 0.96 3.21!
1.83 0.51 6.61
1.19 0.65 2.191.19 0.68 2.08
3.00 1.14 7.92
2.39 1.05 5.461.39 0.57 3.365.63 1.22 26.00
* * *
* No reliable estimate due to zero denominator for number of discordant pairs
oo
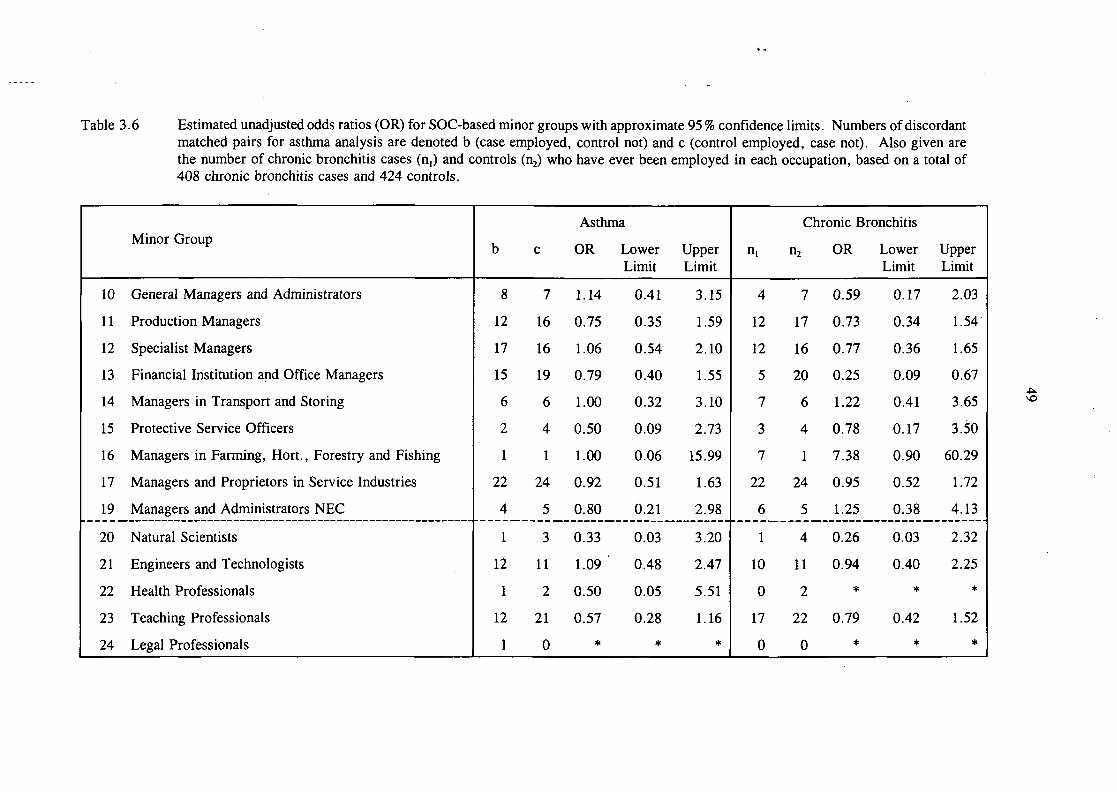
Table 3.6 Estimated unadjusted odds ratios (OR) for SOC-based minor groups with approximate 95 % confidence limits. Numbers of discordantmatched pairs for asthma analysis are denoted b (case employed, control not) and c (control employed, case not). Also given arethe number of chronic bronchitis cases (n,) and controls (n2) who have ever been employed in each occupation, based on a total of408 chronic bronchitis cases and 424 controls.
Minor Group
10
11
12
13
14
15
16
17
19
20
21
22
23
24
General Managers and Administrators
Production Managers
Specialist Managers
Financial Institution and Office Managers
Managers in Transport and Storing
Protective Service Officers
Managers in Farming, Hort., Forestry and Fishing
Managers and Proprietors in Service Industries
Managers and Administrators NEC
Natural Scientists
Engineers and Technologists
Health Professionals
Teaching Professionals
Legal Professionals
Asthma
b
8
12
17
15
6
2
1
22
4
1
12
1
12
1
c
7
16
16
19
6
4
1
24
5
3
11
2
21
0
OR
1.14
0.75
1.06
0.79
1.00
0.50
1.00
0.92
0.80
0.33
1.09
0.50
0.57
*
LowerLimit
0.41
0.35
0.54
0.40
0.32
0.09
0.06
0.51
0.21
0.03
0.48
0.05
0.28
*
UpperLimit
3.15
1.59
2.10
1.55
3.10
2.73
15.99
1.63
2.98
3.20
2.47
5.51
1.16
*
Chronic Bronchitis
HI
4
12
12
5
7
3
7
22
6
1
10
0
17
0
n2
7
17
16
20
6
4
1
24
5
4
11
2
22
0
OR
0.59
0.73
0.77
0.25
1.22
0.78
7.38
0.95
1.25
0.26
0.94
*
0.79
*
LowerLimit
0.17
0.34
0.36
0.09
0.41
0.17
0.90
0.52
0.38
0.03
0.40
*
0.42
*
UpperLimit
2.03
1.54
1.65
0.67
3.65
3.50
60.29
1.72
4.13
2.32
2.25
*
1.52
*

Table 3.6 (continued)
Minor Group
25
26
27
29
30
31
32
34
33
35
36
37
38
39
40
41
Business and Financial Professionals
Architects, Town Planners and Surveyors
Librarians
Professional Occupations NEC
Scientific Technicians
Draughtspersons, Quantity and other Surveyors
Computer Analyst/Programmers
Ship and Aircraft Officers
Health Associate Professionals
Legal Associate Professionals
Business and Financial Associate Professionals
Social Welfare Associate Professionals
Literary, Artistic and Sports Professionals
Assoc. Professional and Technical Occupations NEC
Administrative/Clerical Officers
Numerical Clerks and Cashiers
Asthma
b
2
2
0
1
17
6
2
19
1
1
6
5
5
7
27
52
c
6
5
0
2
20
8
6
27
3
0
4
4
11
6
36
47
OR
0.33
0.40
*
0.50
0.85
0.75
0.33
0.70
0.33
*
1.50
1.25
0.45
1.17
0.75
1.11
LowerLimit
0.07
0.08
*
0.05
0.45
0.26
0.07
0.39
0.03
*
0.42
0.34
0.16
0.39
0.46
0.75
UpperLimit
1.65
2.06
*
5.51
1.62
2.16
1.65
1.27
3.20
*
5.32
4.66
1.31
3.47
1.24
1.64
Chronic Bronchitis
HI
3
2
1
0
13
4
3
13
3
0
5
4
6
8
13
23
n2
6
5
0
2
22
8
6
29
3
0
4
4
11
6
39
53
OR
0.52
0.41
*
*
0.60
0.51
0.52
0.45
1.04
*
1.30
1.04
0.56
1.39
0.32
0.42
LowerLimit
0.13
0.08
*
*
0.30
0.15
0.13
0.23
0.21
*
0.35
0.26
0.21
0.48
0.17
0.25
UpperLimit
2.08
2.14
*
*
1.21
1.72
2.08
0.88
5.18
*
4.89
4.18
1.53
4.05
0.62
0.70

Table 3.6 (continued)
Minor Group
42
43
44
45
46
49
50
51
52
53
54
55
56
57
58
59
Filing and Records Clerks
Clerks (not otherwise specified)
Stores and Despatch Clerks, Storekeepers
Secretaries
Receptionists
Clerical and secretarial NEC
Construction Trades
Metal Machining and Instrument Making Trades
Electrical/Electronic Trades
Metal Forming/Welding Trades
Vehicle Trades
Textiles/Garments Trades
Printing Trades
Woodworking Trades
Food Preparation Trades
Other Craft NEC
Asthma
b
18
37
16
19
20
17
20
19
19
19
10
34
13
15
17
27
c
19
56
18
35
13
15
12
23
8
11
4
21
5
20
0
15
OR
0.95
0.66
0.89
0.54
1.54
1.13
1.67
0.83
2.37
1.73
2.50
1.62
2.60
0.75
*
1.80
LowerLimit
0.50
0.44
0.45
0.31
0.77
0.57
0.81
0.45
1.04
0.82
0.78
0.94
0.93
0.38
*
0.96
UpperLimit
1.81
1.00
1.74
0.95
3.09
2.27
3.41
1.52
5.43
3.63
7.97
2.79
7.29
1.46
*
3.38
Chronic Bronchitis
HI
9
31
24
15
10
11
33
41
22
42
17
26
8
24
19
40
n2
20
61
18
38
14
15
12
26
8
12
4
25
6
20
0
15
OR
0.46
0.49
1.41
0.39
0.74
0.76
3.02
1.71
2.96
3.94
4.57
1.09
1.39
1.26*
2.96
LowerLimit
0.20
0.31
0.75
0.21
0.32
0.34
1.54
1.03
1.30
2.04
1.52
0.62
0.48
0.69
*
1.61
UpperLimit
1.01
0.77
2.64
0.72
1.68
1.66
5.94
2.85
6.74
7.60
13.69
1.91
4.05
2.32
*
5.45
I/I

Table 3.6 (continued)
Minor Group
60
61
62
63
64
65
66
67
69
70
71
72
73
79
80
81
NCOs and other ranks, Armed Forces
Security and Protective Service
Catering
Travel Attendants
Health
Childcare
Hairdressers/Beauticians
Domestic Staff
Personal and Protective Service NEC
Buyers/Brokers
Sales Representatives
Sales Assistants
Mobile/Market Salespersons
Sales Occupations NEC
Food, Drink and Tobacco Process Operatives
Textiles and Tannery Process Operatives
Asthma
b
38
14
42
1
27
10
10
13
2
3
12
77
9
7
31
8
c
16
9
16
7
20
18
12
6
2
2
14
59
7
4
17
2
OR
2.37
1.56
2.62
0.14
1.35
0.56
0.83
2.17
1.00
1.50
0.86
1.31
1.29
1.75
1.82
4.00
LowerLimit
1.32
0.67
1.48
0.02
0.76
0.26
0.36
0.82
0.14
0.25
0.40
0.93
0.48
0.51
1.01
0.85
UpperLimit
4.26
3.59
4.67
1.16
2.41
1.20
1.93
5.70
7.10
8.98
1.85
1.83
3.45
5.98
3.29
18.84
Chronic Bronchitis
n,
40
19
28
5
12
9
11
10
0
1
17
59
5
2
19
7
n2
18
10
20
7
22
19
12
6
2
2
14
74
7
4
19
2
OR
2.45
2.02
1.49
0.74
0.55
0.48
0.95
1.75
0.00
0.52
1.27
0.80
0.74
0.52
1.04
3.68
LowerLimit
1.38
0.93
0.82
0.23
0.27
0.21
0.41
0.63
*
0.05
0.62
0.55
0.23
0.09
0.54
0.76
UpperLimit
4.35
4.40
2.69
2.35
1.13
1.08
2.18
4^86
*
5.74
2.62
1.16
2.35
2.84
2.00
17.84
to

Table 3.6 (continued)
Minor Group
82
83
84
85
86
87
88
89
90
91
92
93
94
95
99
Chemicals/Paper/Plastics Process Operatives
Metal Making and Treating Process Operatives
Metal Working Process Operatives
Assemblers/Lineworkers
Other Routine Process Operatives
Road Transport Operatives
Other Transport and Machine Operatives
Plant and Machine Operatives NEC
Other Occupations in Agric., Forestry and Fishing
Other Occupations in Mining and Manufacturing
Other Occupations in Construction
Other Occupations in Transport
Other Occupations in Communication
Other Occupations in Sales and Services
Other Occupations NEC
Asthma
b
13
7
8
19
40
28
13
22
11
14
21
5
8
52
20
c
8
2
2
14
32
20
10
10
8
8
8
5
2
22
5
OR
1.62
3.50
4.00
1.36
1.25
1.40
1.30
2.20
1.37
1.75
2.62
1.00
4.00
2.36
4.00
LowerLimit
0.67
0.73
0.85
0.68
0.79
0.79
0.57
1.04
0.55
0.73
1.16
0.29
0.85
1.44
1.50
UpperLimit
3.92
16.85
18.84
2.71
1.99
2.49
2.96
4.65
3.42
.4.17
5.93
3.45
18.84
3.89
10.66
Chronic Bronchitis
n,
31
7
9
25
39
43
20
30
14
26
26
17
2
40
27
n2
9
3
2
14
36
22
10
10
8
9
9
5
2
27
5
OR
3.79
2.45
4.76
1.91
1.14
2.15
2.13
3.29
1.85
3.14
3.14
3.64
1.04
1.60
5.94
LowerLimit
1.78
0.63
1.02
0.98
0.71
1.26
0.99
1.58
0.77
1.45
1.45
1.33
0.15
0.96
2.26
UpperLimit
8.07
9.54
22.16
3.73
1.83
3.67
4.62
6.81
4.45
6.78
6.78
9.97
7.41
2.66
15.58
No reliable estimate due to zero number of discordant pairs NEC Not elsewhere classified
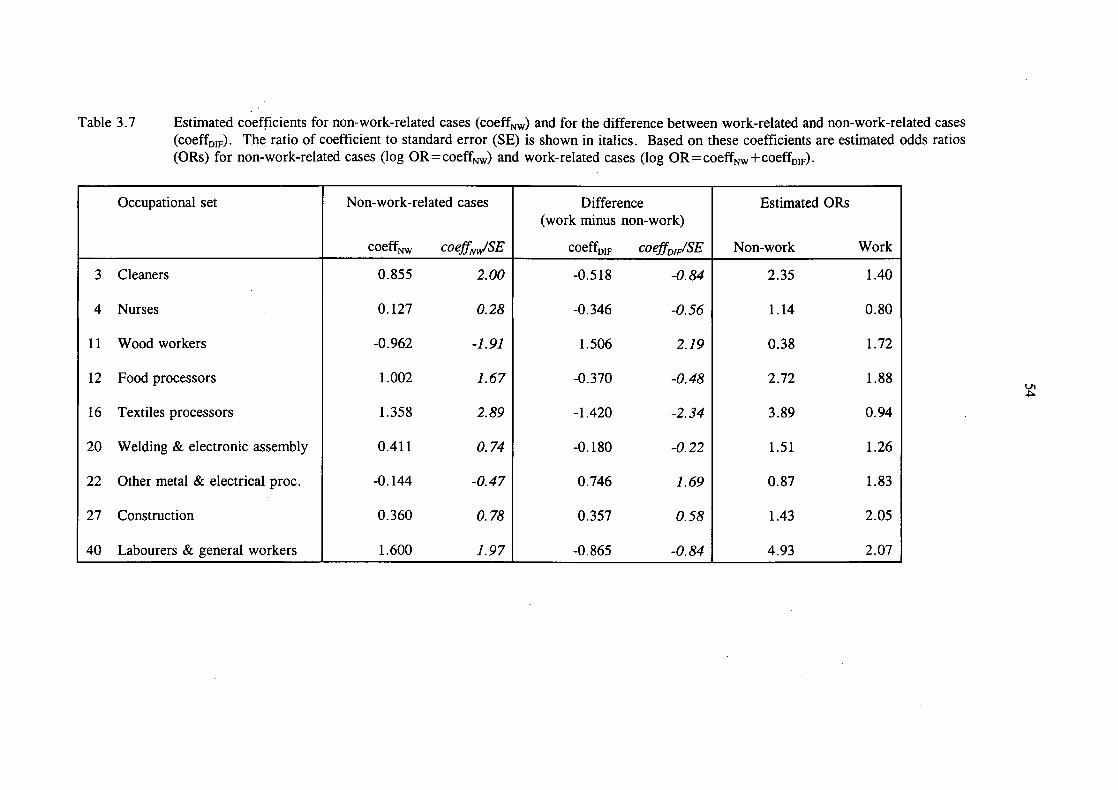
Table 3.7 Estimated coefficients for non-work-related cases (coeffNW) and for the difference between work-related and non-work-related cases(coeffDIF). The ratio of coefficient to standard error (SE) is shown in italics. Based on these coefficients are estimated odds ratios(ORs) for non-work-related cases (log OR=coeffNW) and work-related cases (log OR=coeffNW+coeffDIF).
Occupational set
3 Cleaners
4 Nurses
1 1 Wood workers
12 Food processors
16 Textiles processors
20 Welding & electronic assembly
22 Other metal & electrical proc.
27 Construction
40 Labourers & general workers
Non-work-related cases
coeffNW coefftJSE
0.855 2.00
0.127 0.28
-0.962 -1.91
1.002 7.67
1.358 2.89
0.411 0.74
-0.144 -0.47
0.360 0.78
1.600 1.97
Difference(work minus non-work)
coeffDIF coeffDIF/SE
-0.518 -0.84
-0.346 -0.56
1.506 2.79
-0.370 -0.48
-1. 420 -2.34
-0.180 -0.22
0.746 7.69
0.357 0.58
-0.865 -0.84
Estimated ORs
Non-work Work
2.35 1.40
1.14 0.80
0.38 1.72
2.72 1.88
3.89 0.94
1.51 1.26
0.87 1.83
1.43 2.05
4.93 2.07
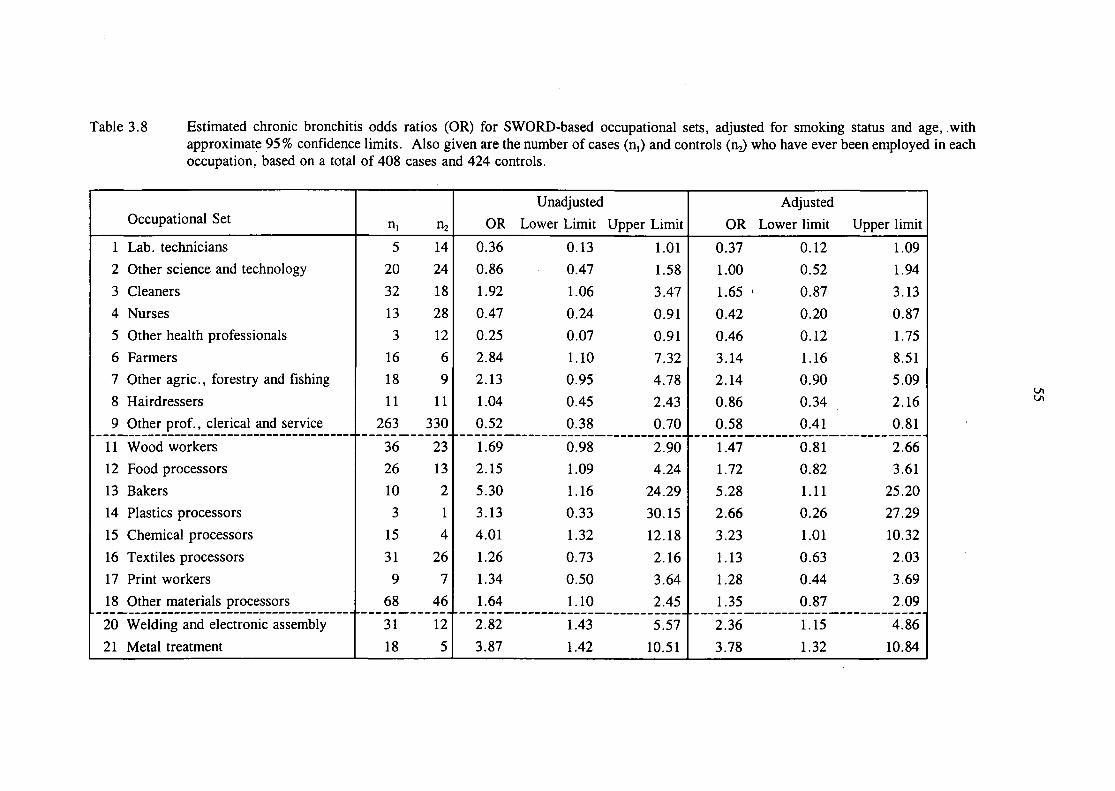
Table 3.8 Estimated chronic bronchitis odds ratios (OR) for SWORD-based occupational sets, adjusted for smoking status and age, withapproximate 95 % confidence limits. Also given are the number of cases (n,) and controls (n^ who have ever been employed in eachoccupation, based on a total of 408 cases and 424 controls.
Occupational Set
1 Lab. technicians2 Other science and technology
3 Cleaners4 Nurses5 Other health professionals
6 Farmers7 Other agric., forestry and fishing8 Hairdressers9 Other prof. , clerical and service
1 1 Wood workers12 Food processors
13 Bakers14 Plastics processors
15 Chemical processors
16 Textiles processors17 Print workers18 Other materials processors
20 Welding and electronic assembly
21 Metal treatment
n, n2
5 1420 24
32 1813 283 12
16 618 911 11
263 330
36 2326 1310 23 1
15 431 269 7
68 46
31 12
18 5
UnadjustedOR Lower Limit Upper Limit
0.36 0.13 1.010.86 0.47 1.581.92 1.06 3.470.47 0.24 0.910.25 0.07 0.912.84 1.10 7.322.13 0.95 4.781.04 0.45 2.430.52 0.38 0.70
1.69 0.98 2.902.15 1.09 4.245.30 1.16 24.293.13 0.33 30.154.01 1.32 12.181.26 0.73 2.161.34 0.50 3.64
1.64 1.10 2.45
2.82 1.43 5.57
3.87 1.42 10.51
AdjustedOR Lower limit Upper limit
0.37 0.12 1.091.00 0.52 1.94
1.65 > 0.87 3.130.42 0.20 0.870.46 0.12 1.753.14 1.16 8.512.14 0.90 5.090.86 0.34 2.160.58 0.41 0.81
1.47 0.81 2.661.72 0.82 3.61
5.28 1.11 25.202.66 0.26 27.293.23 1.01 10.321.13 0.63 2.031.28 0.44 3.69
1.35 0.87 2.09
2.36 1.15 4.863.78 1.32 10.84
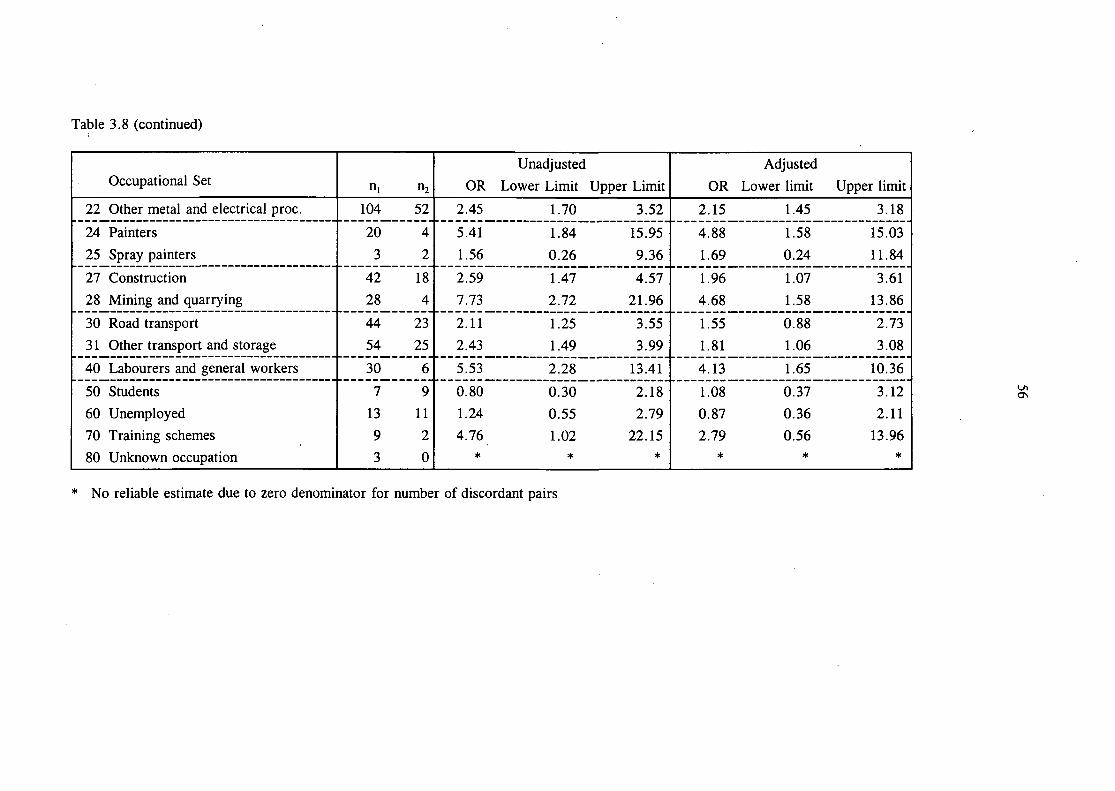
Table 3.8 (continued)
Occupational Set
22 Other metal and electrical proc.
24 Painters25 Spray painters
27 Construction28 Mining and quarrying
30 Road transport3 1 Other transport and storage
40 Labourers and general workers
50 Students60 Unemployed70 Training schemes80 Unknown occupation
n, n2
104 52
20 43 2
42 1828 4
44 2354 25
30 6
7 913 119 23 0
UnadjustedOR Lower Limit Upper Limit
2.45 1.70 3.52
5.41 1.84 15.95
1.56 0.26 9.36
2.59 1.47 4.577.73 2.72 21.96
2.11 1.25 3.552.43 1.49 3.99
5.53 2.28 13.41
0.80 0.30 2.181.24 0.55 2.79
4.76 1.02 22.15* * *
AdjustedOR Lower limit Upper limit
2.15 1.45 3.18
4.88 1.58 15.031.69 0.24 11.84
1.96 1.07 3.614.68 1.58 13.86
1.55 0.88 2.73
1.81 1.06 3.08
4.13 1.65 10.36
1.08 0.37 3.120.87 0.36 2.112.79 0.56 13.96
* * *
OS
No reliable estimate due to zero denominator for number of discordant pairs

57
Table 3.9 Paired differences in number of jobs held after the date of onset of asthmasymptoms, expressed as case minus control, showing mean, standarddeviation (SD) and number of pairs (n).
(a) All cases
Sex
Case Cont
M MF M
M FF F
Margin
mean
0.40.4
-0.20.2
0.2
Work
SD
2.61.41.81.6
1.9
n
32284849
157
mean
-0.10.4
-0.40.1
0.0
Non-work
SD
1.72.52.41.3
2.1
n
29444752
172
mean
0.20.4
-0.30.2
0.1
All
SD
2.22.22.21.5
2.0
n
617295
101
329
(b) Cases with date of onset prior to 1990
Sex
Case Cont
M M
F MM FF F
Margin
mean
0.61.0
-0.20.4
0.3
Work
SD
3.52.52.52.3
2.7
n
167
2623
72
mean
-0.50.7
-0.80.1
-0.2
Non-work
SD
2.13.83.01.9
2.8
n
17192920
85
mean
0.00.8
-0.50.2
0.0
All
SD
2.93.42.72.1
2.7
n
33265543
157
(c) Cases with date of onset prior to 1985
Sex
Case Cont
M M
F MM FF F
Margin
mean
1.22.0
-1.00.0
0.2
Work
SD
3.73.62.72.4
3.0
n
n3
1314
41
mean
-0.60.9
-1.00.3
-0.2
Non-work
SD
2.54.33.72.5
3.4
n
12141611
53
mean
0.31.1
-1.00.1
0.0
All
SD
3.24.13.32.4
3.2
n
23172925
94
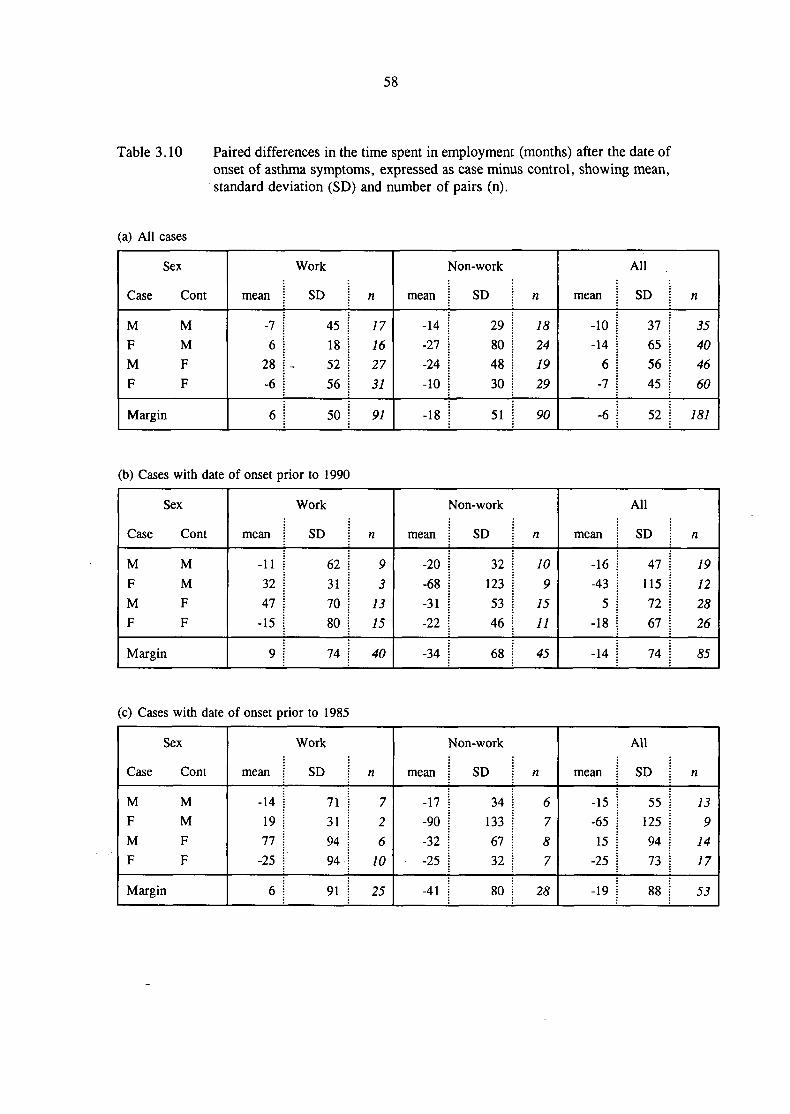
58
Table 3.10 Paired differences in the time spent in employment (months) after the date ofonset of asthma symptoms, expressed as case minus control, showing mean,standard deviation (SD) and number of pairs (n).
(a) All cases
Sex
Case Cont
M M
F M
M F
F F
Margin
mean
-76
28-6
6
Work
SD
45185256
50
n
17162731
91
mean
-14-27-24-10
-18
^on-work
SD
29804830
51
n
18241929
90
mean
-10-14
6-7
-6
All
SD
37655645
52
n
35404660
181
(b) Cases with date of onset prior to 1990
Sex
Case Cont
M M
F M
M F
F F
Margin
mean
-113247
-15
9
Work
SD
62317080
74
«
93
1315
40
mean
-20-68-31-22
-34
Mon-work
SD
321235346
68
n
109
1511
45
mean
-16-43
5-18
-14
All
SD
471157267
74
n
19122826
85
(c) Cases with date of onset prior to 1985
Sex
Case Cont
M M
F M
M F
F F
Margin
mean
-141977
-25
6
Work
SD
71319494
91
n
72
610
25
mean
-17-90-32-25
-41
Mon-work
SD
341336732
80
n
6787
28
mean
-15-6515
-25
-19
All
SD
551259473
88
n
139
1417
53
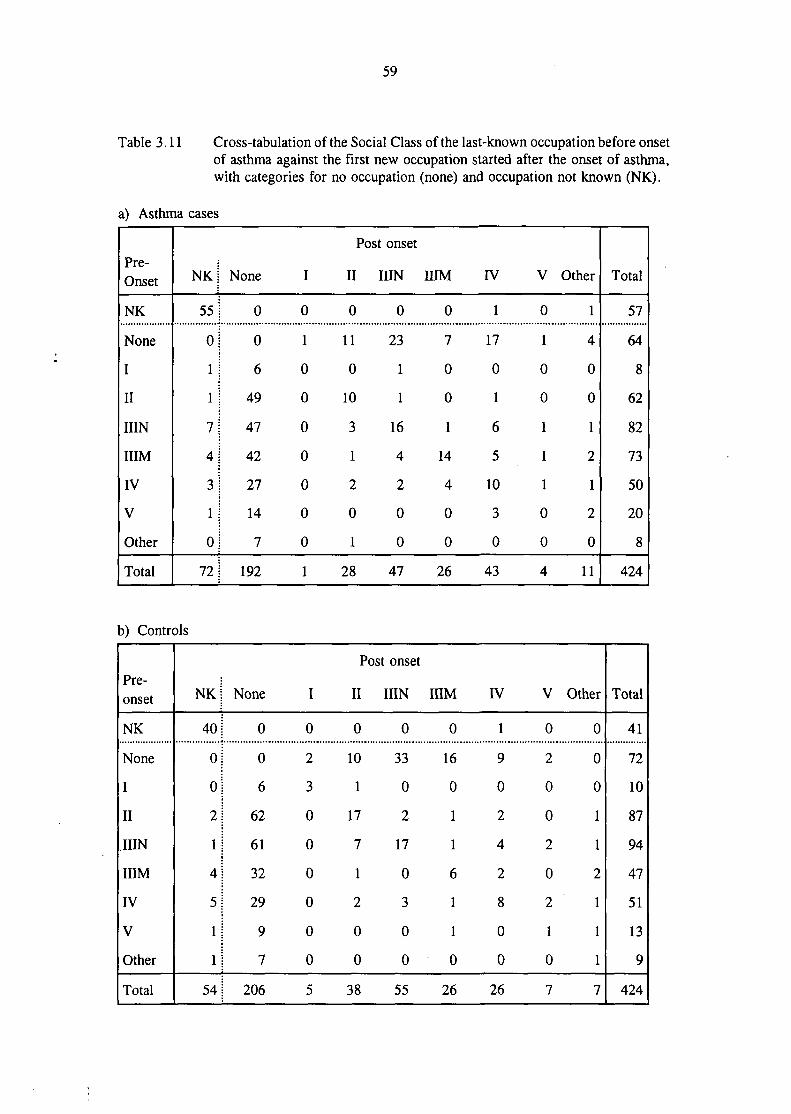
59
Table 3.11 Cross-tabulation of the Social Class of the last-known occupation before onsetof asthma against the first new occupation started after the onset of asthma,with categories for no occupation (none) and occupation not known (NK).
a) Asthma cases
Pre-Onset
NK
None
I
II
IIIN
HIM
IV
V
Other
Total
NK
55
0
1
1
7
4
3
1
0
72
None
0
0
6
49
47
42
27
14
7
192
I
0
1
0
0
0
0
0
0
0
1
Post
II I
0
110
10
3
1
2
0
1
28
onset
UN
0
23
1
1
16
4
2
0
0
47
HIM
0
7
0
0
1
14
4
0
0
26
IV
1
17
0
1
6
5
10
3
0
43
V
0
1
0
0
1
1
1
0
0
4
Other
1
4
0
0
1
2
1
2
0
11
Total
57
64
8
62
82
73
50
20
8
424
b) Controls
Pre-onset
NK
None
I
II
IIIN
HIMIV
V
Other
Total
N K j
40 1
o;o j2 J
1 j
4 J
5 j
1 j
1 j
54|
None
0
0
6
62
61
32
29
9
7
206
I
0
2
3
0
0
0
0
0
0
5
PC
II
0
10
1
17
7
1
2
0
0
38
st onset
IIIN
0
33
0
2
17
0
3
0
0
55
HIM
0
16
0
1
1
6
1
1
0
26
IV
1
9
0
2
4
2
8
0
0
26
V
0
2
0
0
2
0
2
1
0
7
Other
0
0
0
1
1
2
1
1
1
7
Total
41
72
10
87
94
47
51
13
9
424

60
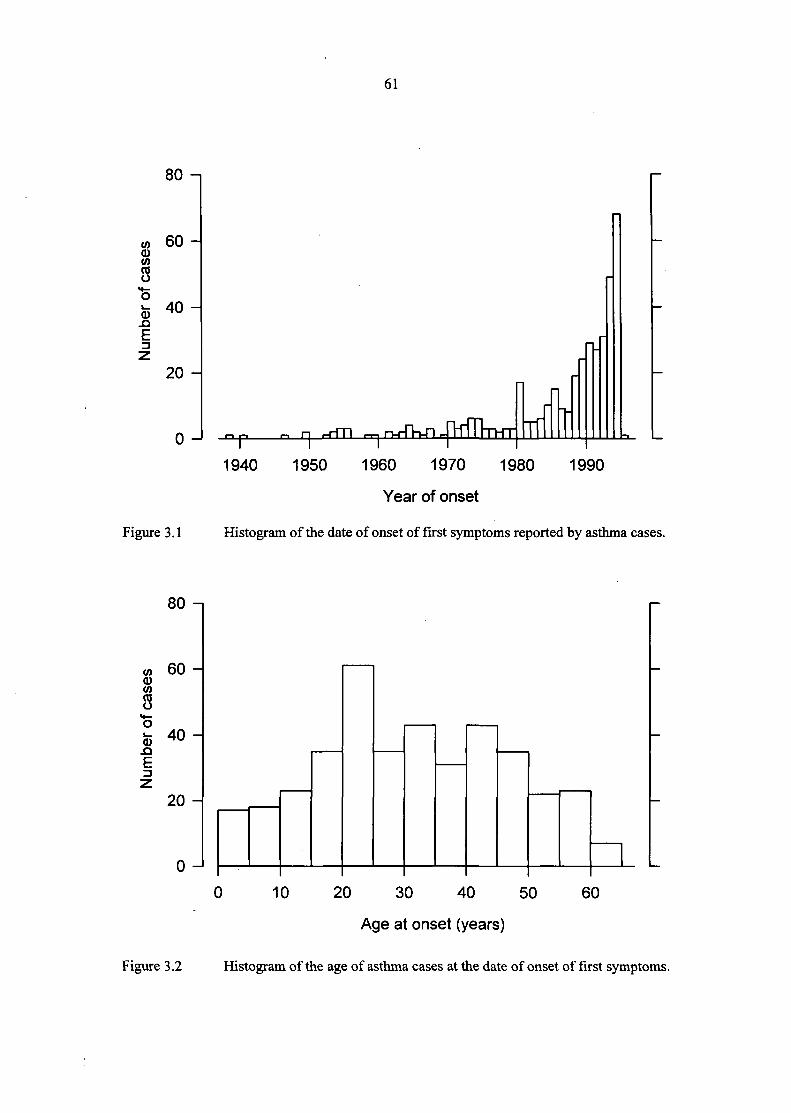
61
8CO
8
<D-QE
80 -i
60 -
40 -
20 -
0 - _p .-. ri i-rfTI r-i-i n-rTn-Tl
Figure 3.1
1940 1950 1960 1970 1980 1990
Year of onset
Histogram of the date of onset of first symptoms reported by asthma cases.
ou -
w 60 -0)
8"5fc 40-
E
20 -
n
0 10 20 30 40 50 60
Age at onset (years)
Figure 3.2 Histogram of the age of asthma cases at the date of onset of first symptoms.
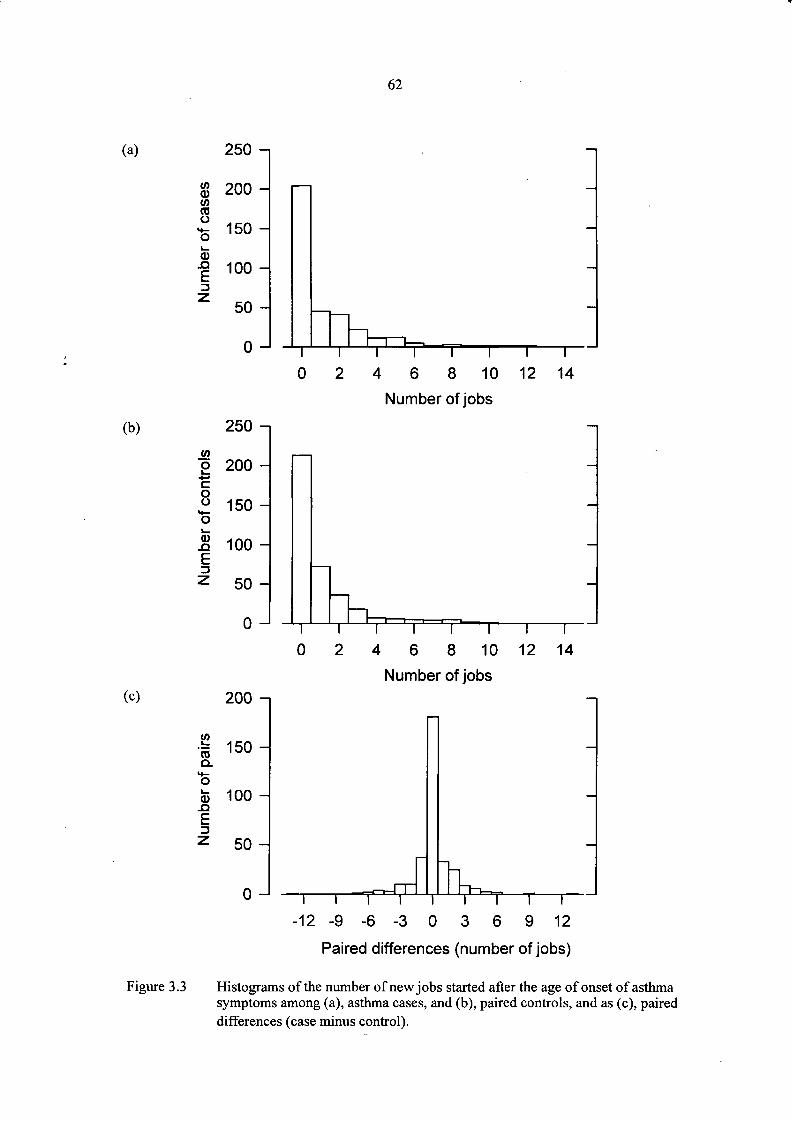
62
(a)
$ 200
8*£0)
150 -
E13
100 -
50 -
0 - I
0 4 6 8 10 12 14
Number of jobs
(b)
2•+-»oo^
t_0).QE13z
zou -
200 -
150 -
100 -
50 -
0 - I
-
_
i i I I I i I0 2 4 6 8 10 12 14
Number of jobs(c) zuu -
(0Q.
'oft 100 -J3
EDz 50 -
0 - i I I I I
—
—
I I T I-12 - 9 - 6 - 3 0 3 6 9 12
Figure 3.3
Paired differences (number of jobs)
Histograms of the number of new jobs started after the age of onset of asthmasymptoms among (a), asthma cases, and (b), paired controls, and as (c), paireddifferences (case minus control).
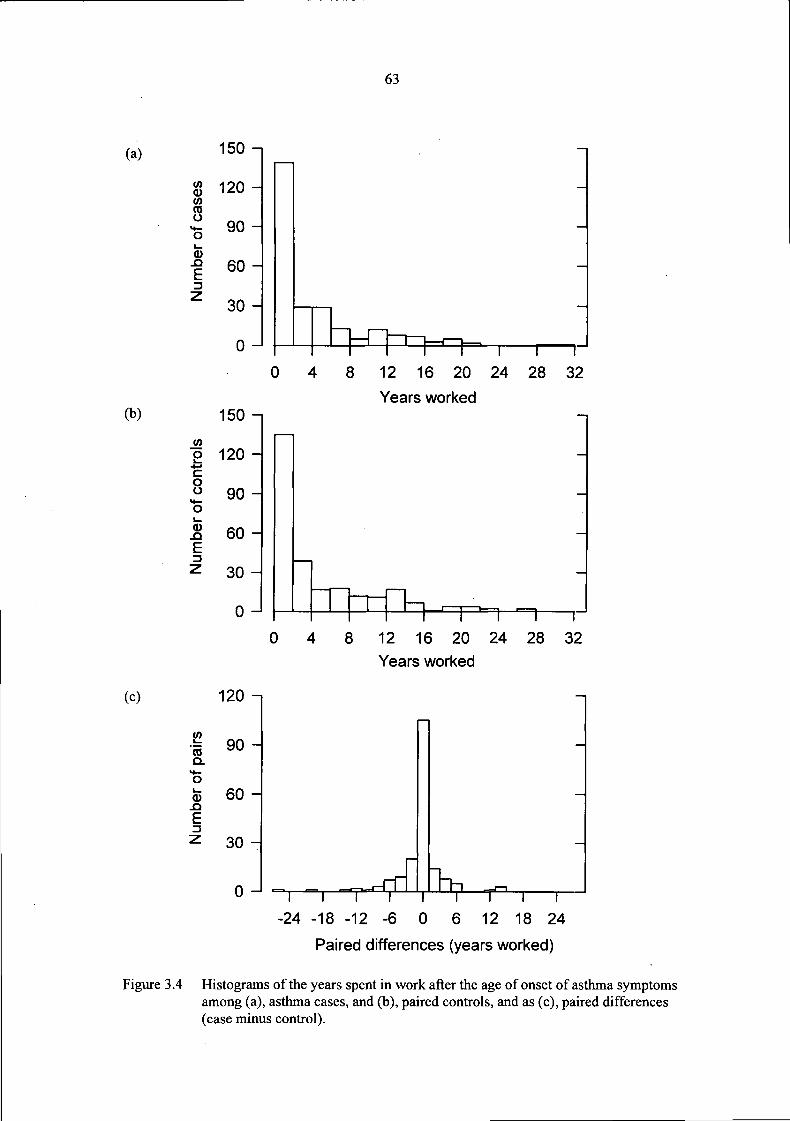
63
(a)
(b)
(c)
150 -,
120 -
•5 90 H
f 60 H
^ 30 ^
0 J
0 8 12 16 20 24 28 32
Years worked150 -i
| 120 -«*-•
S. 90-o
5 60 -E
z 30 -
0 - PTrTh n i -n r0 8 12 16 20 24 28 32
Years worked
120 -,
1 90 HQ.
0)_QE
60 -
30 -
I I T-24 -18 -12
1-6
I0
i186 12 18 24
Paired differences (years worked)
Figure 3.4 Histograms of the years spent in work after the age of onset of asthma symptomsamong (a), asthma cases, and (b), paired controls, and as (c), paired differences(case minus control).

64

HEAD OFFICE:
Research Avenue North,Riccarton,Edinburgh, EH14 4AP, United KingdomTelephone: +44 (0)870 850 5131Facsimile: +44 (0)870 850 5132
Email: [email protected]
Tapton Park Innovation Centre,Brimington Road, Tapton,Chesterfield, Derbyshire, S41 0TZ, United KingdomTelephone: +44 (0)1246 557866Facsimile: +44 (0)1246 551212
Research House Business Centre,Fraser Road, Perivale, Middlesex, UB6 7AQ,United KingdomTelephone: +44 (0)208 537 3491/2Facsimile: +44 (0)208 537 3493
Brookside Business Park, Cold Meece, Stone, Staffs, ST15 0RZ,United KingdomTelephone: +44 (0)1785 764810Facsimile: +44 (0)1785 764811
(A20115) IOM (R) ReportCov art 3/15/06 12:32 PM Page 2