Embed Size (px)
Citation preview

This is an alternative text version of Historical time series of apprenticeships and traineeships in Australia — infographic. It is designed to be read via a screen reader and consequently has had all visual elements removed. Please see the online version available at <http://www.ncver.edu.au/infographics> if you wish to view the full version.
Historical time series of apprenticeships and traineeships in Australia This infographic presents a summary of training activity in apprenticeships and traineeships in Australia for the period 1963—2016. These data are presented alongside economic and labour market data for the same period in order to put the training activity into context. They are also supplemented by a timeline of major policy changes affecting apprenticeships and traineeships in Australia from 1901 to 2016.
Data on training activity come from Historical time series of apprenticeships and traineeships in Australia, from 1963 to 2016 (NCVER, 2016) <https://www.ncver.edu.au/data/data/all-data/historical-time-series-of-apprenticeships-and-traineeships-in-australia-from-1963-to-2016>. Please refer to this publication for notes regarding breaks in series and other caveats associated with the information presented.
Tips for using this infographic
Key points about training activity, economic and labour market context and policy changes have been added to the figures as interactive tooltips. The exact number for each data point and any notes can be seen by placing the mouse cursor over the relevant data point. More information about the policy changes is available in the table at the bottom of the infographic.
The tabs at the top of figures allow you to change figures to enable you to further examine the data. The tabs allow you to change the time period (e.g. 1960s) or the occupations (e.g. trade or non-trade) that you see.

Commencements in 12 months ending 30 June, 1963–2016 ('000)
Year Commencements Commentary1963 22.6 Fewest commencements and completions for 1963–2016.1964 29.31965 29.81966 28.91967 28.01968 28.21969 28.31970 32.1 Peak GDP growth for 1970–2016.1971 34.71972 32.81973 35.4 Employer subsidies extended (see table below).1974 44.81975 40.4 Low GDP growth.1976 39.01977 38.7 Commonwealth Rebate for Apprentice Full-time Training (CRAFT) introduced
(see table below).1978 45.3 Low GDP growth.1979 42.61980 46.41981 48.8 Lowest unemployment until 2004.1982 47.81983 34.8 Fewest commencements since 1972; peak unemployment for 1978–1991;
begins six year period of falling unemployment; negative GDP growth.1984 38.01985 49.3 Highest GDP growth since 1970; Australian Traineeship System established
(see table below).1986 51.8 Most completions for 1963–1992.1987 52.1 Fewest completions since 1976.1988 55.0 Second highest GDP growth for 1970–2016.1989 62.7 Most commencements for 1963–1995; equal lowest unemployment for 1982–
2002; begins four years of rising unemployment.1990 62.31991 45.0 Negative GDP growth.1992 40.5 Highest unemployment since 1983; low GDP growth; ANTA established; age
restrictions on apprenticeships removed (see table below).1993 46.1 Most completions for 1963–1996; peak unemployment for 1978–2016.1994 50.51995 60.0 NETTFORCE established to encourage employer take-up of traineeships (see
table below).1996 76.21997 96.01998 126.1 Fewest commencements for 1998–2016; New Apprenticeship System and
'user choice' principles introduced (see table below).1999 197.2 Highest GDP growth since 1988.2000 201.6 Equal lowest unemployment for 1982–2002; ends four years of falling
unemployment.2001 215.3 Begins seven years of falling unemployment; lowest GDP growth since 1992.2002 244.3 Fewest completions for 2002–2016.2003 288.0 Most commencements for 1963–2007; ends 11 years of increasing
commencements; lowest unemployment since 1981.2004 254.72005 260.82006 265.8 New Apprenticeships re-launched as Australian Apprenticeships;
establishment of Australian Technical Colleges (see table below).2007 271.5 Announcement of winding back of Australian Technical Colleges (see table
below).2008 289.1 Lowest unemployment for 1978–2016; ends seven years of falling
unemployment; targeted funding in areas of skills shortages introduced (see table below).
2009 269.4 Highest unemployment since 2003; lowest GDP growth for 1993–2016; initiative to increase trade commencement by young people introduced (see table below).
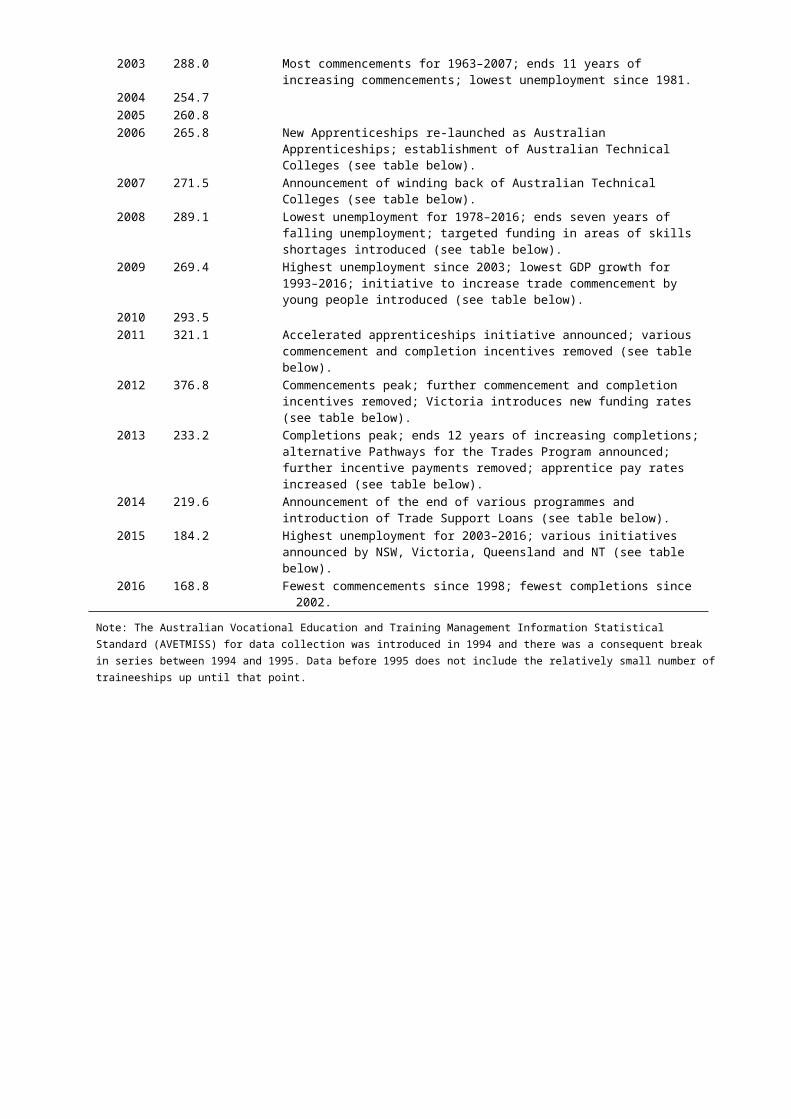
2010 293.52011 321.1 Accelerated apprenticeships initiative announced; various commencement and
completion incentives removed (see table below).2012 376.8 Commencements peak; further commencement and completion incentives
removed; Victoria introduces new funding rates (see table below).2013 233.2 Completions peak; ends 12 years of increasing completions; alternative
Pathways for the Trades Program announced; further incentive payments removed; apprentice pay rates increased (see table below).
2014 219.6 Announcement of the end of various programmes and introduction of Trade Support Loans (see table below).
2015 184.2 Highest unemployment for 2003–2016; various initiatives announced by NSW, Victoria, Queensland and NT (see table below).
2016 168.8 Fewest commencements since 1998; fewest completions since 2002.
Note: The Australian Vocational Education and Training Management Information Statistical Standard (AVETMISS) for data collection was introduced in 1994 and there was a consequent break in series between 1994 and 1995. Data before 1995 does not include the relatively small number of traineeships up until that point.
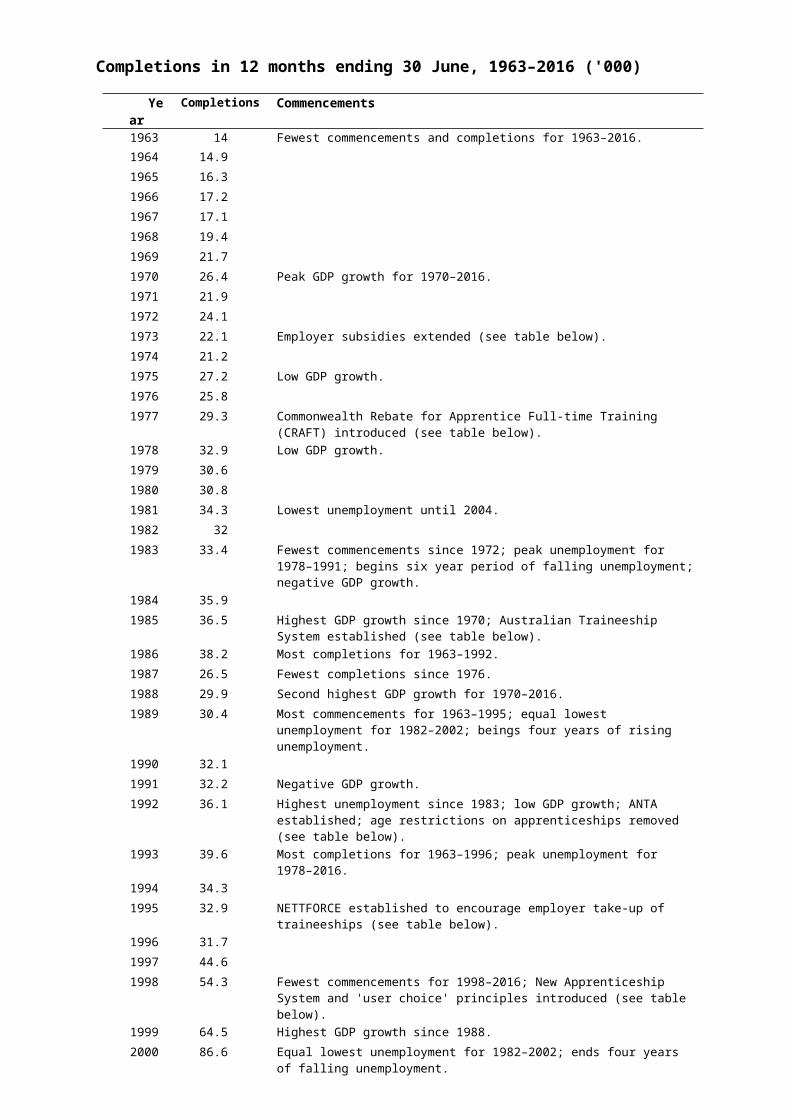
Completions in 12 months ending 30 June, 1963–2016 ('000)
Year Completions Commencements1963 14 Fewest commencements and completions for 1963–2016.
1964 14.9
1965 16.3
1966 17.2
1967 17.1
1968 19.4
1969 21.7
1970 26.4 Peak GDP growth for 1970–2016.
1971 21.9
1972 24.1
1973 22.1 Employer subsidies extended (see table below).
1974 21.2
1975 27.2 Low GDP growth.
1976 25.8
1977 29.3 Commonwealth Rebate for Apprentice Full-time Training (CRAFT) introduced (see table below).
1978 32.9 Low GDP growth.
1979 30.6
1980 30.8
1981 34.3 Lowest unemployment until 2004.
1982 32
1983 33.4 Fewest commencements since 1972; peak unemployment for 1978–1991; begins six year period of falling unemployment; negative GDP growth.
1984 35.9
1985 36.5 Highest GDP growth since 1970; Australian Traineeship System established (see table below).
1986 38.2 Most completions for 1963–1992.
1987 26.5 Fewest completions since 1976.
1988 29.9 Second highest GDP growth for 1970–2016.
1989 30.4 Most commencements for 1963–1995; equal lowest unemployment for 1982–2002; beings four years of rising unemployment.
1990 32.1
1991 32.2 Negative GDP growth.
1992 36.1 Highest unemployment since 1983; low GDP growth; ANTA established; age restrictions on apprenticeships removed (see table below).
1993 39.6 Most completions for 1963–1996; peak unemployment for 1978–2016.
1994 34.3
1995 32.9 NETTFORCE established to encourage employer take-up of traineeships (see table below).
1996 31.7
1997 44.6
1998 54.3 Fewest commencements for 1998–2016; New Apprenticeship System and 'user choice' principles introduced (see table below).
1999 64.5 Highest GDP growth since 1988.
2000 86.6 Equal lowest unemployment for 1982–2002; ends four years of falling unemployment.
2001 85.6 Begins seven years of falling unemployment; lowest GDP growth since 1992.
2002 105.5 Fewest completions for 2002–2016.
2003 121.3 Most commencements for 1963–2007; ends 11 years of increasing commencements; lowest unemployment since 1981.
2004 133.7
2005 136.4
2006 138.7 New Apprenticeships re-launched as Australian Apprenticeships; establishment of Australian Technical Colleges (see table below).
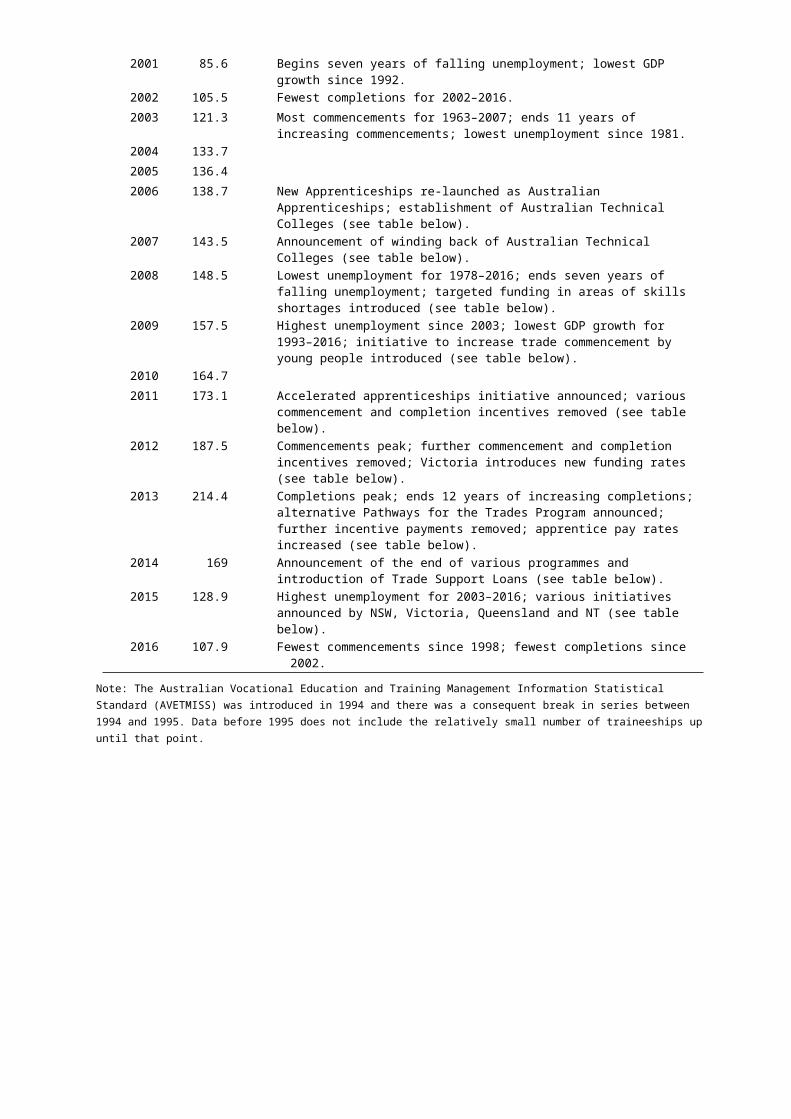
2007 143.5 Announcement of winding back of Australian Technical Colleges (see table below).
2008 148.5 Lowest unemployment for 1978–2016; ends seven years of falling unemployment; targeted funding in areas of skills shortages introduced (see table below).
2009 157.5 Highest unemployment since 2003; lowest GDP growth for 1993–2016; initiative to increase trade commencement by young people introduced (see table below).
2010 164.7
2011 173.1 Accelerated apprenticeships initiative announced; various commencement and completion incentives removed (see table below).
2012 187.5 Commencements peak; further commencement and completion incentives removed; Victoria introduces new funding rates (see table below).
2013 214.4 Completions peak; ends 12 years of increasing completions; alternative Pathways for the Trades Program announced; further incentive payments removed; apprentice pay rates increased (see table below).
2014 169 Announcement of the end of various programmes and introduction of Trade Support Loans (see table below).
2015 128.9 Highest unemployment for 2003–2016; various initiatives announced by NSW, Victoria, Queensland and NT (see table below).
2016 107.9 Fewest commencements since 1998; fewest completions since 2002.
Note: The Australian Vocational Education and Training Management Information Statistical Standard (AVETMISS) was introduced in 1994 and there was a consequent break in series between 1994 and 1995. Data before 1995 does not include the relatively small number of traineeships up until that point.
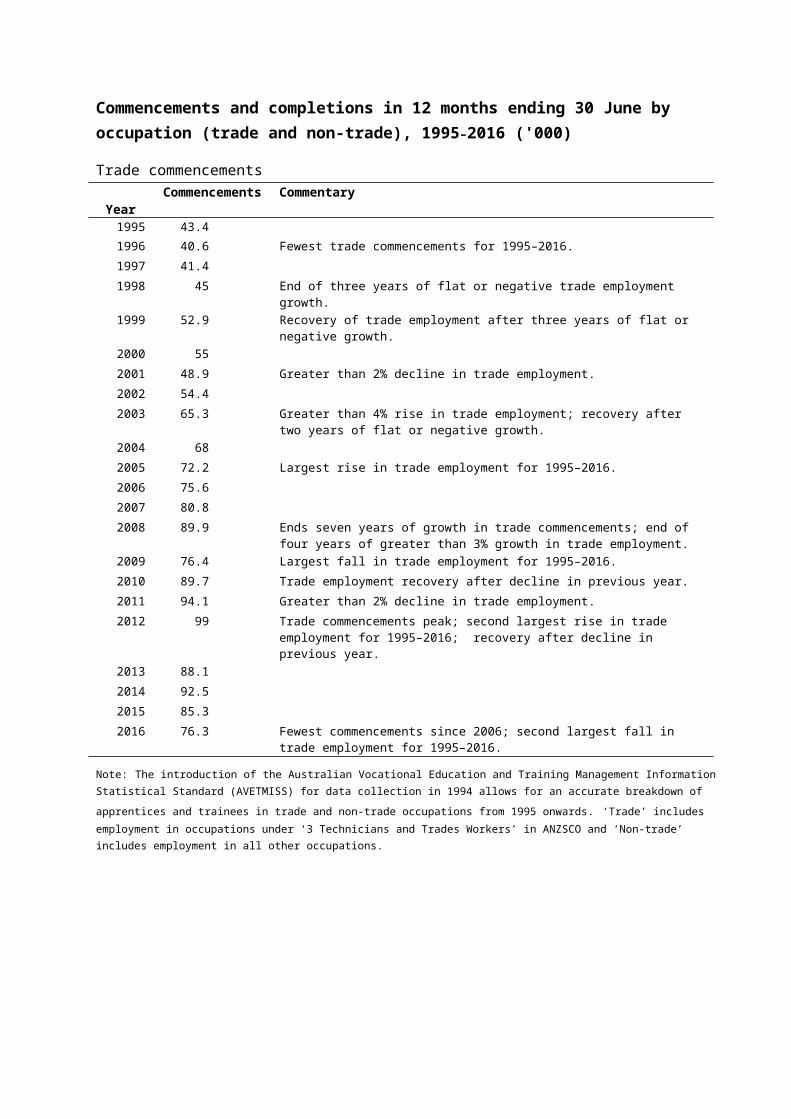
Commencements and completions in 12 months ending 30 June by occupation (trade and non-trade), 1995–2016 ('000)
Trade commencements Year Commencements Commentary
1995 43.4
1996 40.6 Fewest trade commencements for 1995–2016.
1997 41.4
1998 45 End of three years of flat or negative trade employment growth.
1999 52.9 Recovery of trade employment after three years of flat or negative growth.
2000 55
2001 48.9 Greater than 2% decline in trade employment.
2002 54.4
2003 65.3 Greater than 4% rise in trade employment; recovery after two years of flat or negative growth.
2004 68
2005 72.2 Largest rise in trade employment for 1995–2016.
2006 75.6
2007 80.8
2008 89.9 Ends seven years of growth in trade commencements; end of four years of greater than 3% growth in trade employment.
2009 76.4 Largest fall in trade employment for 1995–2016.
2010 89.7 Trade employment recovery after decline in previous year.
2011 94.1 Greater than 2% decline in trade employment.
2012 99 Trade commencements peak; second largest rise in trade employment for 1995–2016; recovery after decline in previous year.
2013 88.1
2014 92.5
2015 85.3
2016 76.3 Fewest commencements since 2006; second largest fall in trade employment for 1995–2016.
Note: The introduction of the Australian Vocational Education and Training Management Information Statistical Standard (AVETMISS) for data collection in 1994 allows for an accurate breakdown of apprentices and trainees in trade and non-trade occupations from 1995 onwards. ‘Trade’ includes employment in occupations under ‘3 Technicians and Trades Workers’ in ANZSCO and ‘Non-trade’ includes employment in all other occupations.
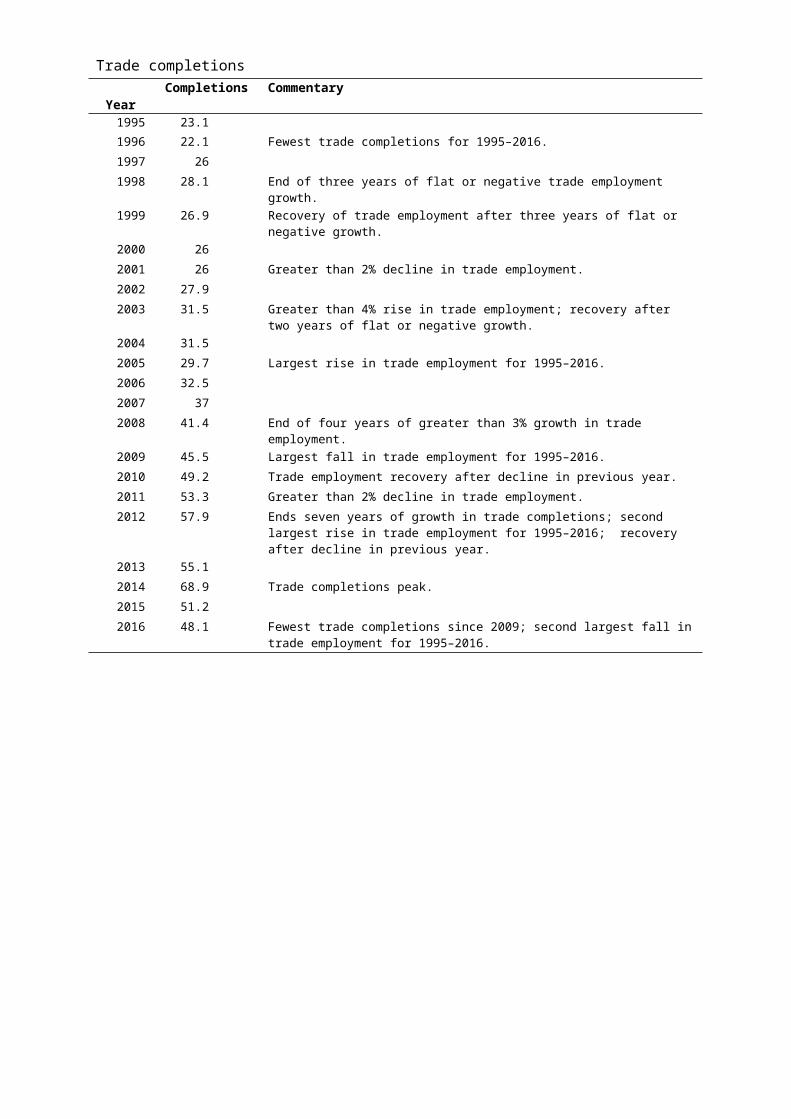
Trade completions Year Completions Commentary
1995 23.1
1996 22.1 Fewest trade completions for 1995–2016.
1997 26
1998 28.1 End of three years of flat or negative trade employment growth.
1999 26.9 Recovery of trade employment after three years of flat or negative growth.
2000 26
2001 26 Greater than 2% decline in trade employment.
2002 27.9
2003 31.5 Greater than 4% rise in trade employment; recovery after two years of flat or negative growth.
2004 31.5
2005 29.7 Largest rise in trade employment for 1995–2016.
2006 32.5
2007 37
2008 41.4 End of four years of greater than 3% growth in trade employment.
2009 45.5 Largest fall in trade employment for 1995–2016.
2010 49.2 Trade employment recovery after decline in previous year.
2011 53.3 Greater than 2% decline in trade employment.
2012 57.9 Ends seven years of growth in trade completions; second largest rise in trade employment for 1995–2016; recovery after decline in previous year.
2013 55.1
2014 68.9 Trade completions peak.
2015 51.2
2016 48.1 Fewest trade completions since 2009; second largest fall in trade employment for 1995–2016.
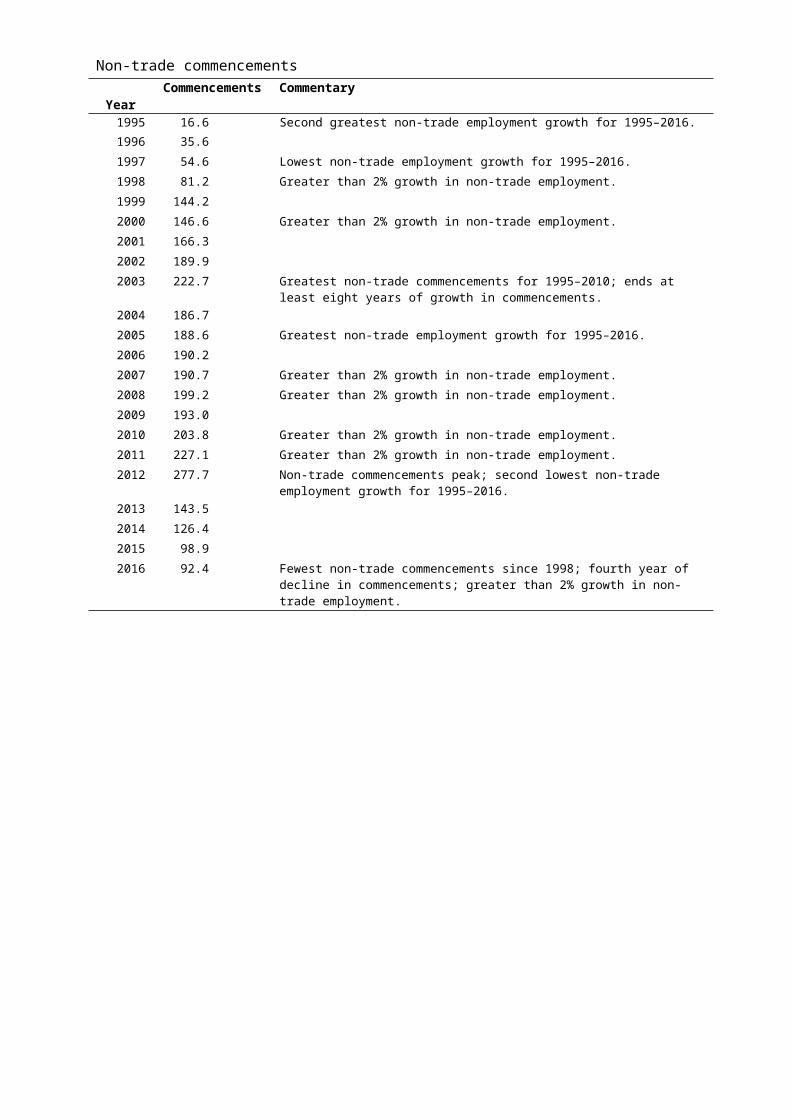
Non-trade commencements Year Commencements Commentary
1995 16.6 Second greatest non-trade employment growth for 1995–2016.
1996 35.6
1997 54.6 Lowest non-trade employment growth for 1995–2016.
1998 81.2 Greater than 2% growth in non-trade employment.
1999 144.2
2000 146.6 Greater than 2% growth in non-trade employment.
2001 166.3
2002 189.9
2003 222.7 Greatest non-trade commencements for 1995–2010; ends at least eight years of growth in commencements.
2004 186.7
2005 188.6 Greatest non-trade employment growth for 1995–2016.
2006 190.2
2007 190.7 Greater than 2% growth in non-trade employment.
2008 199.2 Greater than 2% growth in non-trade employment.
2009 193.0
2010 203.8 Greater than 2% growth in non-trade employment.
2011 227.1 Greater than 2% growth in non-trade employment.
2012 277.7 Non-trade commencements peak; second lowest non-trade employment growth for 1995–2016.
2013 143.5
2014 126.4
2015 98.9
2016 92.4 Fewest non-trade commencements since 1998; fourth year of decline in commencements; greater than 2% growth in non-trade employment.
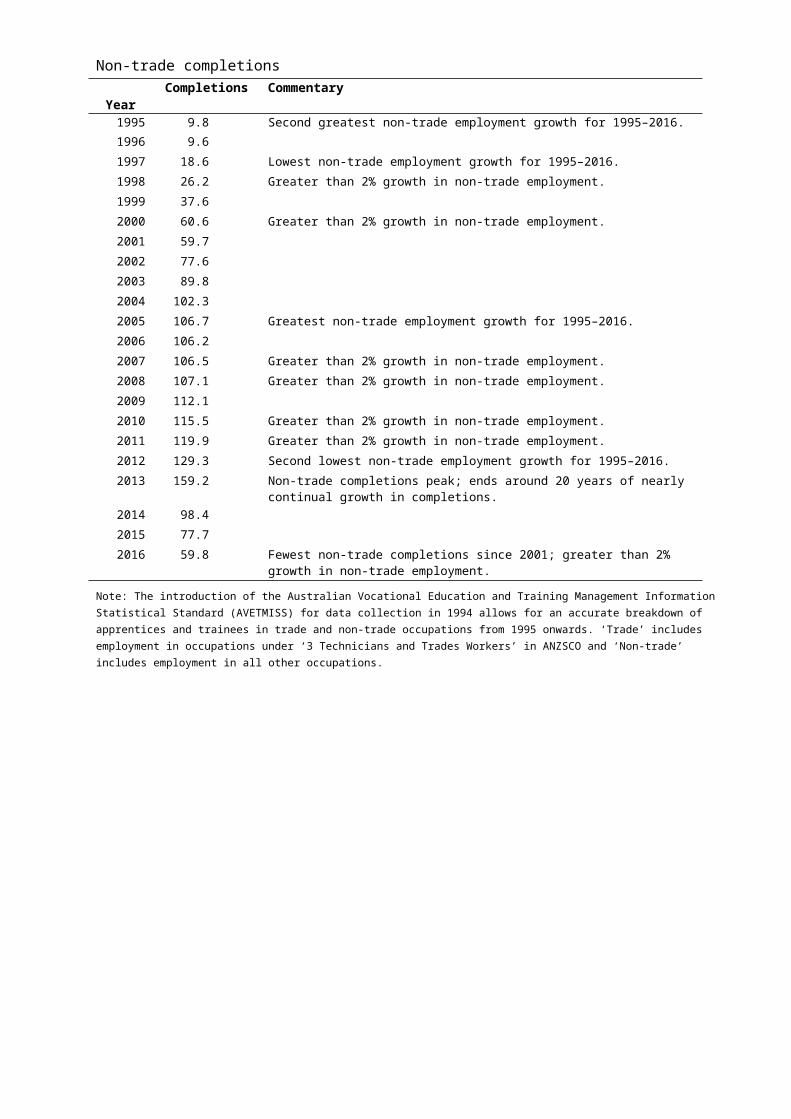
Non-trade completions Year Completions Commentary
1995 9.8 Second greatest non-trade employment growth for 1995–2016.
1996 9.6
1997 18.6 Lowest non-trade employment growth for 1995–2016.
1998 26.2 Greater than 2% growth in non-trade employment.
1999 37.6
2000 60.6 Greater than 2% growth in non-trade employment.
2001 59.7
2002 77.6
2003 89.8
2004 102.3
2005 106.7 Greatest non-trade employment growth for 1995–2016.
2006 106.2
2007 106.5 Greater than 2% growth in non-trade employment.
2008 107.1 Greater than 2% growth in non-trade employment.
2009 112.1
2010 115.5 Greater than 2% growth in non-trade employment.
2011 119.9 Greater than 2% growth in non-trade employment.
2012 129.3 Second lowest non-trade employment growth for 1995–2016.
2013 159.2 Non-trade completions peak; ends around 20 years of nearly continual growth in completions.
2014 98.4
2015 77.7
2016 59.8 Fewest non-trade completions since 2001; greater than 2% growth in non-trade employment.
Note: The introduction of the Australian Vocational Education and Training Management Information Statistical Standard (AVETMISS) for data collection in 1994 allows for an accurate breakdown of apprentices and trainees in trade and non-trade occupations from 1995 onwards. ‘Trade’ includes employment in occupations under ‘3 Technicians and Trades Workers’ in ANZSCO and ‘Non-trade’ includes employment in all other occupations.
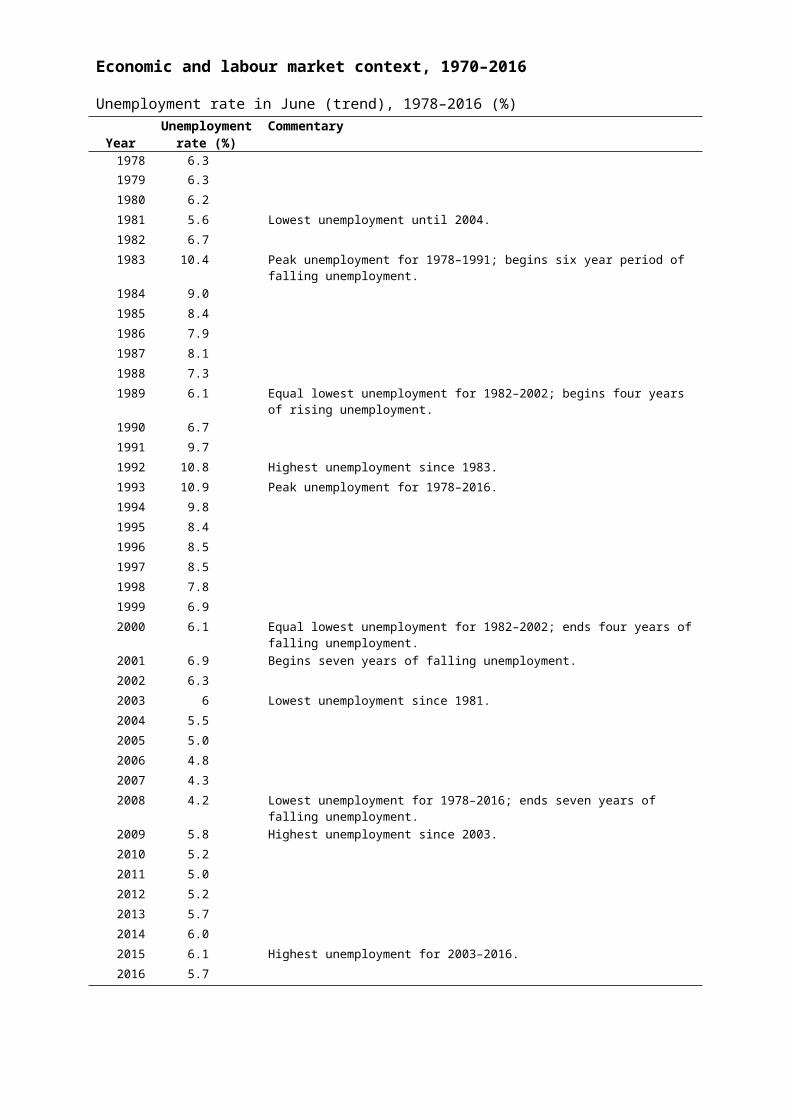
Economic and labour market context, 1970–2016
Unemployment rate in June (trend), 1978–2016 (%) Year Unemployment
rate (%)Commentary
1978 6.3
1979 6.3
1980 6.2
1981 5.6 Lowest unemployment until 2004.
1982 6.7
1983 10.4 Peak unemployment for 1978–1991; begins six year period of falling unemployment.
1984 9.0
1985 8.4
1986 7.9
1987 8.1
1988 7.3
1989 6.1 Equal lowest unemployment for 1982–2002; begins four years of rising unemployment.
1990 6.7
1991 9.7
1992 10.8 Highest unemployment since 1983.
1993 10.9 Peak unemployment for 1978–2016.
1994 9.8
1995 8.4
1996 8.5
1997 8.5
1998 7.8
1999 6.9
2000 6.1 Equal lowest unemployment for 1982–2002; ends four years of falling unemployment.
2001 6.9 Begins seven years of falling unemployment.
2002 6.3
2003 6 Lowest unemployment since 1981.
2004 5.5
2005 5.0
2006 4.8
2007 4.3
2008 4.2 Lowest unemployment for 1978–2016; ends seven years of falling unemployment.
2009 5.8 Highest unemployment since 2003.
2010 5.2
2011 5.0
2012 5.2
2013 5.7
2014 6.0
2015 6.1 Highest unemployment for 2003–2016.
2016 5.7
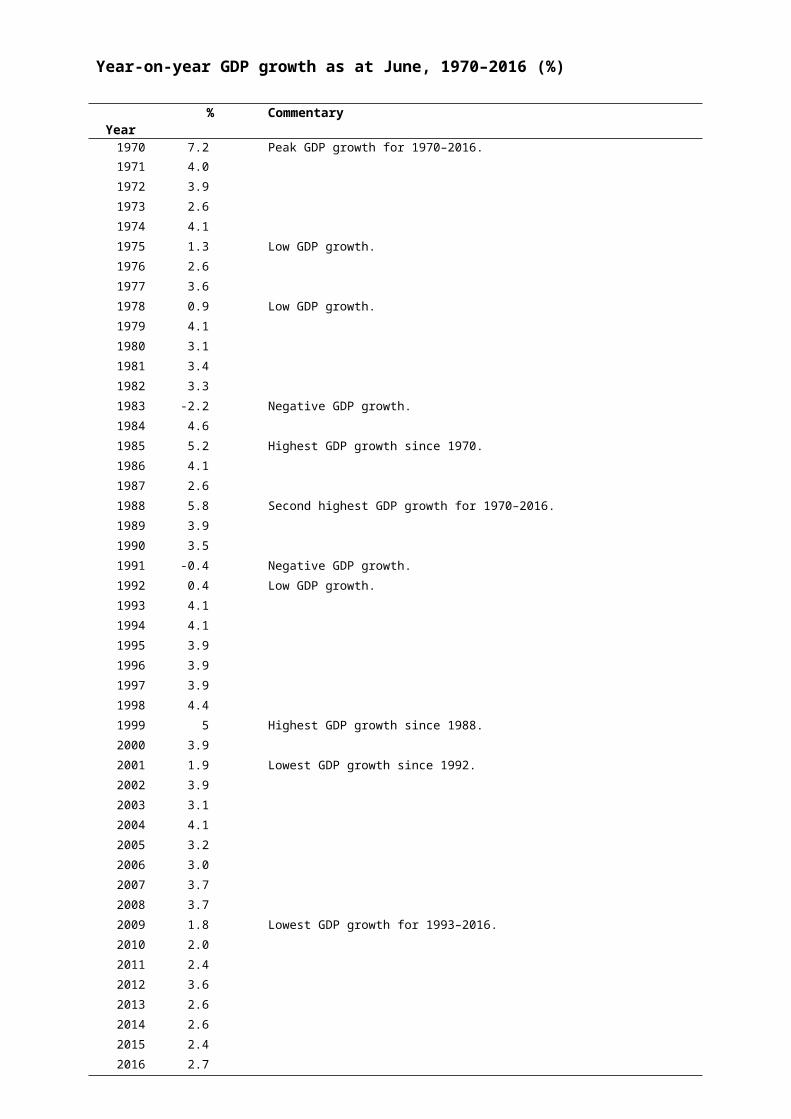
Year-on-year GDP growth as at June, 1970–2016 (%)
Year % Commentary1970 7.2 Peak GDP growth for 1970–2016.
1971 4.0
1972 3.9
1973 2.6
1974 4.1
1975 1.3 Low GDP growth.
1976 2.6
1977 3.6
1978 0.9 Low GDP growth.
1979 4.1
1980 3.1
1981 3.4
1982 3.3
1983 -2.2 Negative GDP growth.
1984 4.6
1985 5.2 Highest GDP growth since 1970.
1986 4.1
1987 2.6
1988 5.8 Second highest GDP growth for 1970–2016.
1989 3.9
1990 3.5
1991 -0.4 Negative GDP growth.
1992 0.4 Low GDP growth.
1993 4.1
1994 4.1
1995 3.9
1996 3.9
1997 3.9
1998 4.4
1999 5 Highest GDP growth since 1988.
2000 3.9
2001 1.9 Lowest GDP growth since 1992.
2002 3.9
2003 3.1
2004 4.1
2005 3.2
2006 3.0
2007 3.7
2008 3.7
2009 1.8 Lowest GDP growth for 1993–2016.
2010 2.0
2011 2.4
2012 3.6
2013 2.6
2014 2.6
2015 2.4
2016 2.7

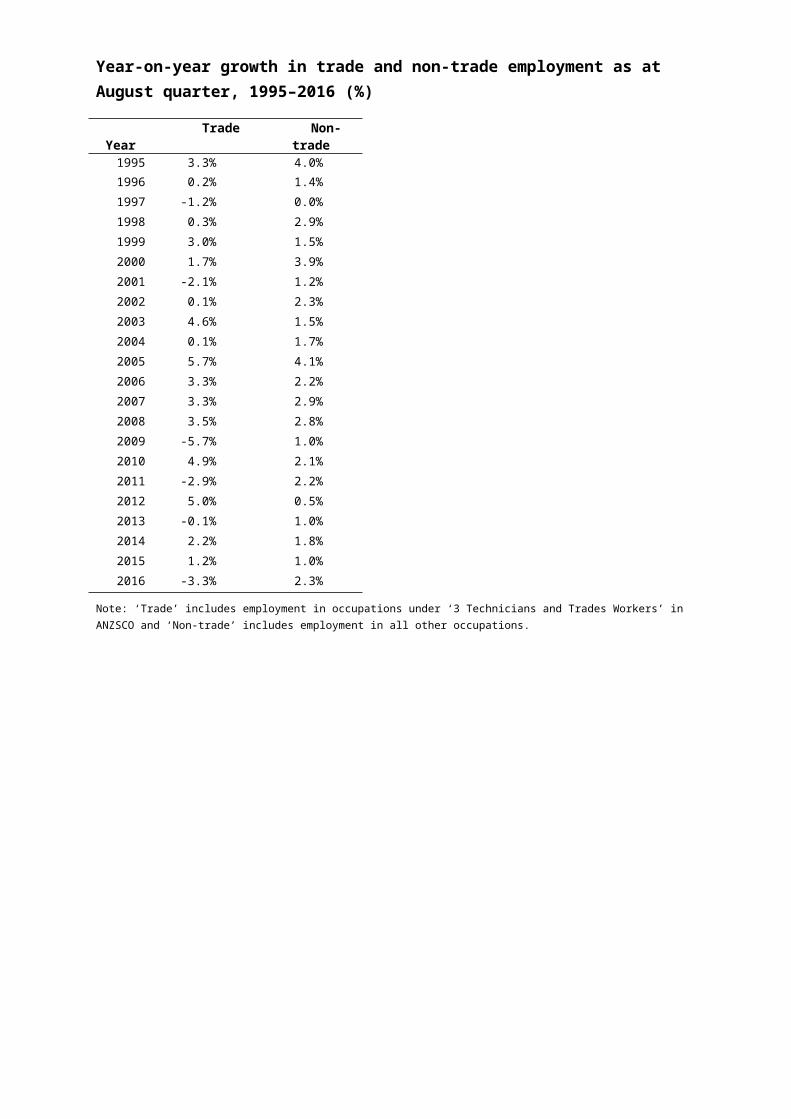
Year-on-year growth in trade and non-trade employment as at August quarter, 1995–2016 (%)
Year Trade Non-trade1995 3.3% 4.0%
1996 0.2% 1.4%
1997 -1.2% 0.0%
1998 0.3% 2.9%
1999 3.0% 1.5%
2000 1.7% 3.9%
2001 -2.1% 1.2%
2002 0.1% 2.3%
2003 4.6% 1.5%
2004 0.1% 1.7%
2005 5.7% 4.1%
2006 3.3% 2.2%
2007 3.3% 2.9%
2008 3.5% 2.8%
2009 -5.7% 1.0%
2010 4.9% 2.1%
2011 -2.9% 2.2%
2012 5.0% 0.5%
2013 -0.1% 1.0%
2014 2.2% 1.8%
2015 1.2% 1.0%
2016 -3.3% 2.3%
Note: ‘Trade’ includes employment in occupations under ‘3 Technicians and Trades Workers’ in ANZSCO and ‘Non-trade’ includes employment in all other occupations.
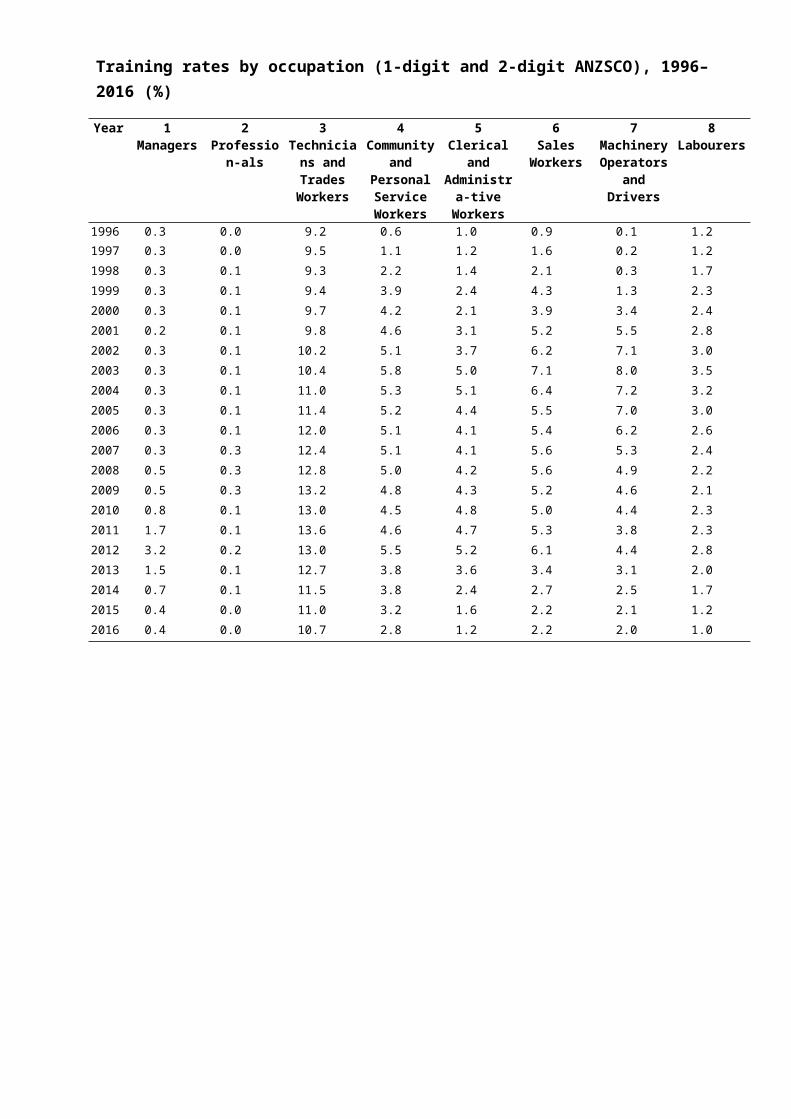
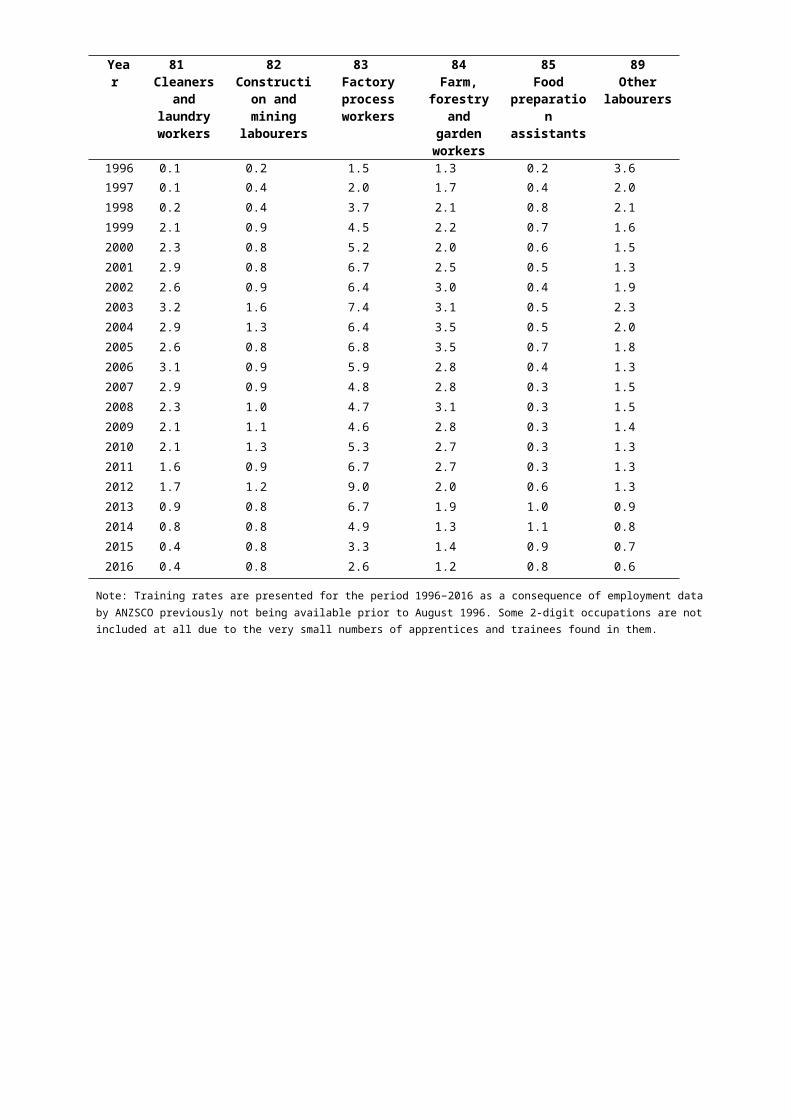
Training rates by occupation (1-digit and 2-digit ANZSCO), 1996–2016 (%)
Year 1Managers
2 Profession-
als
3 Technicians and Trades
Workers
4 Community
and Personal Service Workers
5 Clerical and Administra-
tive Workers
6 Sales
Workers
7 Machinery Operators
and Drivers
8 Labourers
1996 0.3 0.0 9.2 0.6 1.0 0.9 0.1 1.2
1997 0.3 0.0 9.5 1.1 1.2 1.6 0.2 1.2
1998 0.3 0.1 9.3 2.2 1.4 2.1 0.3 1.7
1999 0.3 0.1 9.4 3.9 2.4 4.3 1.3 2.3
2000 0.3 0.1 9.7 4.2 2.1 3.9 3.4 2.4
2001 0.2 0.1 9.8 4.6 3.1 5.2 5.5 2.8
2002 0.3 0.1 10.2 5.1 3.7 6.2 7.1 3.0
2003 0.3 0.1 10.4 5.8 5.0 7.1 8.0 3.5
2004 0.3 0.1 11.0 5.3 5.1 6.4 7.2 3.2
2005 0.3 0.1 11.4 5.2 4.4 5.5 7.0 3.0
2006 0.3 0.1 12.0 5.1 4.1 5.4 6.2 2.6
2007 0.3 0.3 12.4 5.1 4.1 5.6 5.3 2.4
2008 0.5 0.3 12.8 5.0 4.2 5.6 4.9 2.2
2009 0.5 0.3 13.2 4.8 4.3 5.2 4.6 2.1
2010 0.8 0.1 13.0 4.5 4.8 5.0 4.4 2.3
2011 1.7 0.1 13.6 4.6 4.7 5.3 3.8 2.3
2012 3.2 0.2 13.0 5.5 5.2 6.1 4.4 2.8
2013 1.5 0.1 12.7 3.8 3.6 3.4 3.1 2.0
2014 0.7 0.1 11.5 3.8 2.4 2.7 2.5 1.7
2015 0.4 0.0 11.0 3.2 1.6 2.2 2.1 1.2
2016 0.4 0.0 10.7 2.8 1.2 2.2 2.0 1.0
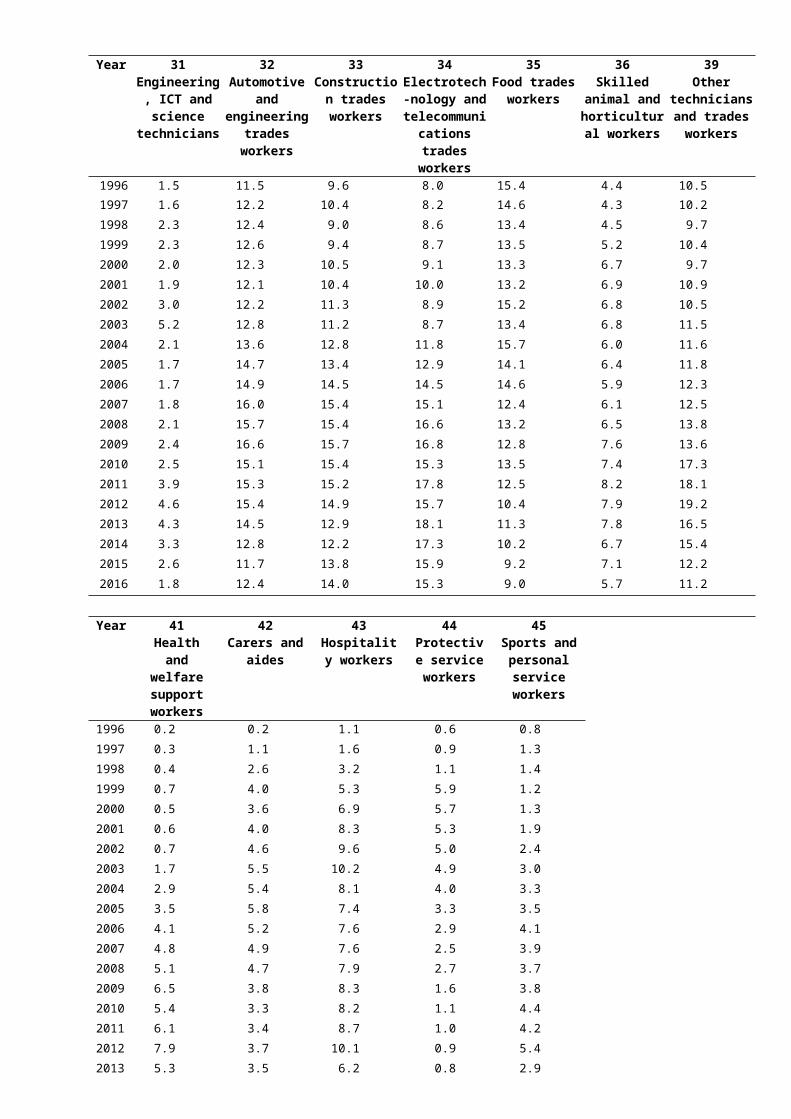
Year 31 Engineering,
ICT and science
technicians
32 Automotive
and engineering
trades workers
33 Construction
trades workers
34 Electrotech-nology and
telecommunications trades
workers
35 Food trades
workers
36Skilled animal
and horticultural
workers
39Other
technicians and trades
workers
1996 1.5 11.5 9.6 8.0 15.4 4.4 10.5
1997 1.6 12.2 10.4 8.2 14.6 4.3 10.2
1998 2.3 12.4 9.0 8.6 13.4 4.5 9.7
1999 2.3 12.6 9.4 8.7 13.5 5.2 10.4
2000 2.0 12.3 10.5 9.1 13.3 6.7 9.7
2001 1.9 12.1 10.4 10.0 13.2 6.9 10.9
2002 3.0 12.2 11.3 8.9 15.2 6.8 10.5
2003 5.2 12.8 11.2 8.7 13.4 6.8 11.5
2004 2.1 13.6 12.8 11.8 15.7 6.0 11.6
2005 1.7 14.7 13.4 12.9 14.1 6.4 11.8
2006 1.7 14.9 14.5 14.5 14.6 5.9 12.3
2007 1.8 16.0 15.4 15.1 12.4 6.1 12.5
2008 2.1 15.7 15.4 16.6 13.2 6.5 13.8
2009 2.4 16.6 15.7 16.8 12.8 7.6 13.6
2010 2.5 15.1 15.4 15.3 13.5 7.4 17.3
2011 3.9 15.3 15.2 17.8 12.5 8.2 18.1
2012 4.6 15.4 14.9 15.7 10.4 7.9 19.2
2013 4.3 14.5 12.9 18.1 11.3 7.8 16.5
2014 3.3 12.8 12.2 17.3 10.2 6.7 15.4
2015 2.6 11.7 13.8 15.9 9.2 7.1 12.2
2016 1.8 12.4 14.0 15.3 9.0 5.7 11.2
Year 41 Health and
welfare support workers
42 Carers and
aides
43 Hospitality
workers
44 Protective
service workers
45 Sports and personal service workers
1996 0.2 0.2 1.1 0.6 0.8
1997 0.3 1.1 1.6 0.9 1.3
1998 0.4 2.6 3.2 1.1 1.4
1999 0.7 4.0 5.3 5.9 1.2
2000 0.5 3.6 6.9 5.7 1.3
2001 0.6 4.0 8.3 5.3 1.9
2002 0.7 4.6 9.6 5.0 2.4
2003 1.7 5.5 10.2 4.9 3.0
2004 2.9 5.4 8.1 4.0 3.3
2005 3.5 5.8 7.4 3.3 3.5
2006 4.1 5.2 7.6 2.9 4.1
2007 4.8 4.9 7.6 2.5 3.9
2008 5.1 4.7 7.9 2.7 3.7
2009 6.5 3.8 8.3 1.6 3.8
2010 5.4 3.3 8.2 1.1 4.4
2011 6.1 3.4 8.7 1.0 4.2
2012 7.9 3.7 10.1 0.9 5.4
2013 5.3 3.5 6.2 0.8 2.9
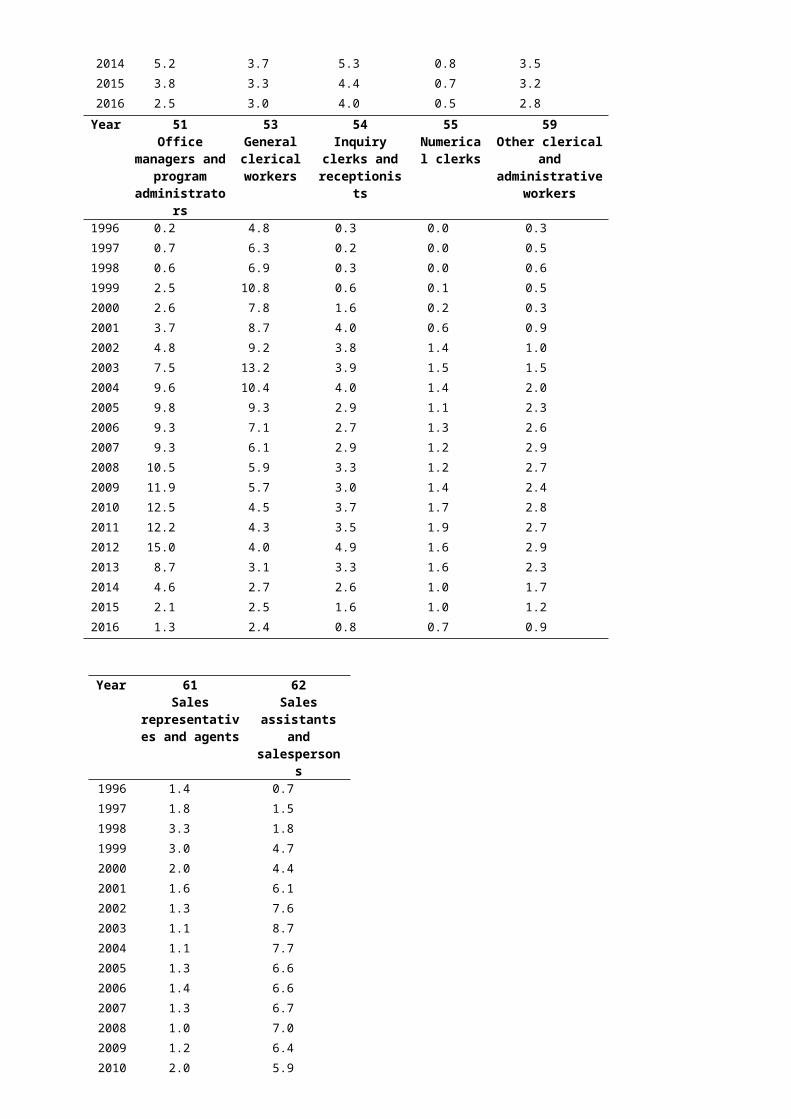
2014 5.2 3.7 5.3 0.8 3.5
2015 3.8 3.3 4.4 0.7 3.2
2016 2.5 3.0 4.0 0.5 2.8
Year 51Office
managers and program
administrators
53 General clerical workers
54Inquiry clerks
and receptionists
55 Numerical
clerks
59Other clerical and
administrative workers
1996 0.2 4.8 0.3 0.0 0.3
1997 0.7 6.3 0.2 0.0 0.5
1998 0.6 6.9 0.3 0.0 0.6
1999 2.5 10.8 0.6 0.1 0.5
2000 2.6 7.8 1.6 0.2 0.3
2001 3.7 8.7 4.0 0.6 0.9
2002 4.8 9.2 3.8 1.4 1.0
2003 7.5 13.2 3.9 1.5 1.5
2004 9.6 10.4 4.0 1.4 2.0
2005 9.8 9.3 2.9 1.1 2.3
2006 9.3 7.1 2.7 1.3 2.6
2007 9.3 6.1 2.9 1.2 2.9
2008 10.5 5.9 3.3 1.2 2.7
2009 11.9 5.7 3.0 1.4 2.4
2010 12.5 4.5 3.7 1.7 2.8
2011 12.2 4.3 3.5 1.9 2.7
2012 15.0 4.0 4.9 1.6 2.9
2013 8.7 3.1 3.3 1.6 2.3
2014 4.6 2.7 2.6 1.0 1.7
2015 2.1 2.5 1.6 1.0 1.2
2016 1.3 2.4 0.8 0.7 0.9
Year 61Sales
representatives and agents
62Sales
assistants and salespersons
1996 1.4 0.7
1997 1.8 1.5
1998 3.3 1.8
1999 3.0 4.7
2000 2.0 4.4
2001 1.6 6.1
2002 1.3 7.6
2003 1.1 8.7
2004 1.1 7.7
2005 1.3 6.6
2006 1.4 6.6
2007 1.3 6.7
2008 1.0 7.0
2009 1.2 6.4
2010 2.0 5.9
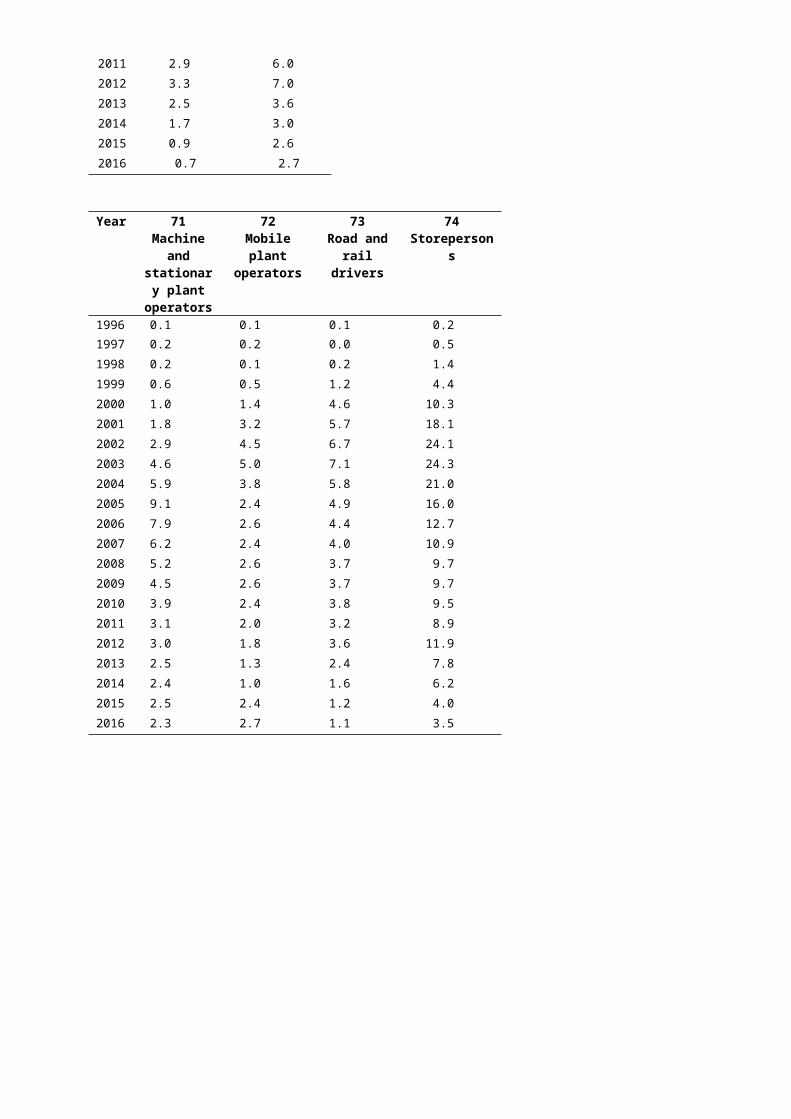
2011 2.9 6.0
2012 3.3 7.0
2013 2.5 3.6
2014 1.7 3.0
2015 0.9 2.6
2016 0.7 2.7
Year 71 Machine
and stationary
plant operators
72 Mobile plant
operators
73 Road and
rail drivers
74 Storepersons
1996 0.1 0.1 0.1 0.2
1997 0.2 0.2 0.0 0.5
1998 0.2 0.1 0.2 1.4
1999 0.6 0.5 1.2 4.4
2000 1.0 1.4 4.6 10.3
2001 1.8 3.2 5.7 18.1
2002 2.9 4.5 6.7 24.1
2003 4.6 5.0 7.1 24.3
2004 5.9 3.8 5.8 21.0
2005 9.1 2.4 4.9 16.0
2006 7.9 2.6 4.4 12.7
2007 6.2 2.4 4.0 10.9
2008 5.2 2.6 3.7 9.7
2009 4.5 2.6 3.7 9.7
2010 3.9 2.4 3.8 9.5
2011 3.1 2.0 3.2 8.9
2012 3.0 1.8 3.6 11.9
2013 2.5 1.3 2.4 7.8
2014 2.4 1.0 1.6 6.2
2015 2.5 2.4 1.2 4.0
2016 2.3 2.7 1.1 3.5
Year 81 Cleaners
and laundry workers
82 Construction and mining labourers
83 Factory process workers
84Farm,
forestry and garden
workers
85Food
preparation assistants
89Other
labourers
1996 0.1 0.2 1.5 1.3 0.2 3.6
1997 0.1 0.4 2.0 1.7 0.4 2.0
1998 0.2 0.4 3.7 2.1 0.8 2.1
1999 2.1 0.9 4.5 2.2 0.7 1.6
2000 2.3 0.8 5.2 2.0 0.6 1.5
2001 2.9 0.8 6.7 2.5 0.5 1.3
2002 2.6 0.9 6.4 3.0 0.4 1.9
2003 3.2 1.6 7.4 3.1 0.5 2.3
2004 2.9 1.3 6.4 3.5 0.5 2.0
2005 2.6 0.8 6.8 3.5 0.7 1.8
2006 3.1 0.9 5.9 2.8 0.4 1.3
2007 2.9 0.9 4.8 2.8 0.3 1.5
2008 2.3 1.0 4.7 3.1 0.3 1.5
2009 2.1 1.1 4.6 2.8 0.3 1.4
2010 2.1 1.3 5.3 2.7 0.3 1.3
2011 1.6 0.9 6.7 2.7 0.3 1.3
2012 1.7 1.2 9.0 2.0 0.6 1.3
2013 0.9 0.8 6.7 1.9 1.0 0.9
2014 0.8 0.8 4.9 1.3 1.1 0.8
2015 0.4 0.8 3.3 1.4 0.9 0.7
2016 0.4 0.8 2.6 1.2 0.8 0.6
Note: Training rates are presented for the period 1996–2016 as a consequence of employment data by ANZSCO previously not being available prior to August 1996. Some 2-digit occupations are not included at all due to the very small numbers of apprentices and trainees found in them.
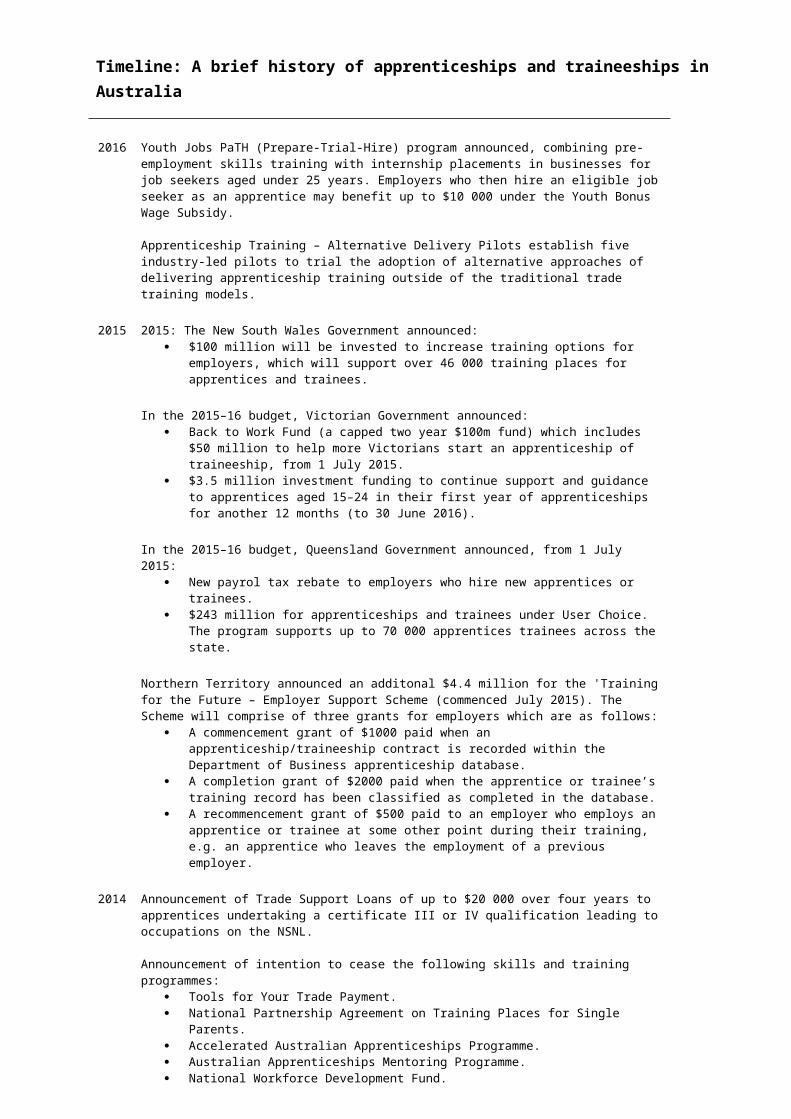
Timeline: A brief history of apprenticeships and traineeships in Australia
2016 Youth Jobs PaTH (Prepare-Trial-Hire) program announced, combining pre-employment skills training with internship placements in businesses for job seekers aged under 25 years. Employers who then hire an eligible job seeker as an apprentice may benefit up to $10 000 under the Youth Bonus Wage Subsidy.
Apprenticeship Training – Alternative Delivery Pilots establish five industry-led pilots to trial the adoption of alternative approaches of delivering apprenticeship training outside of the traditional trade training models.
2015 2015: The New South Wales Government announced: $100 million will be invested to increase training options for employers, which will support
over 46 000 training places for apprentices and trainees.
In the 2015–16 budget, Victorian Government announced: Back to Work Fund (a capped two year $100m fund) which includes $50 million to help
more Victorians start an apprenticeship of traineeship, from 1 July 2015. $3.5 million investment funding to continue support and guidance to apprentices aged
15–24 in their first year of apprenticeships for another 12 months (to 30 June 2016).
In the 2015–16 budget, Queensland Government announced, from 1 July 2015: New payrol tax rebate to employers who hire new apprentices or trainees. $243 million for apprenticeships and trainees under User Choice. The program supports
up to 70 000 apprentices trainees across the state.
Northern Territory announced an additonal $4.4 million for the 'Training for the Future – Employer Support Scheme (commenced July 2015). The Scheme will comprise of three grants for employers which are as follows:
A commencement grant of $1000 paid when an apprenticeship/traineeship contract is recorded within the Department of Business apprenticeship database.
A completion grant of $2000 paid when the apprentice or trainee’s training record has been classified as completed in the database.
A recommencement grant of $500 paid to an employer who employs an apprentice or trainee at some other point during their training, e.g. an apprentice who leaves the employment of a previous employer.
2014 Announcement of Trade Support Loans of up to $20 000 over four years to apprentices undertaking a certificate III or IV qualification leading to occupations on the NSNL.
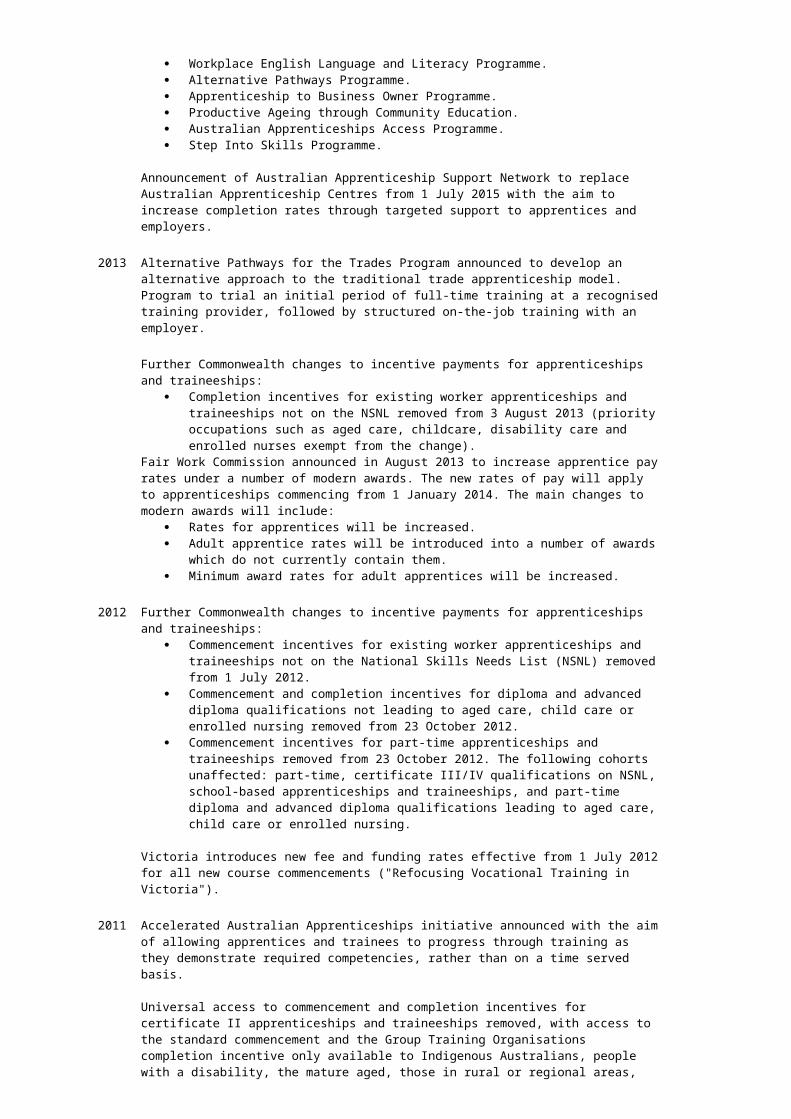
Announcement of intention to cease the following skills and training programmes: Tools for Your Trade Payment. National Partnership Agreement on Training Places for Single Parents. Accelerated Australian Apprenticeships Programme. Australian Apprenticeships Mentoring Programme. National Workforce Development Fund. Workplace English Language and Literacy Programme. Alternative Pathways Programme. Apprenticeship to Business Owner Programme. Productive Ageing through Community Education. Australian Apprenticeships Access Programme. Step Into Skills Programme.
Announcement of Australian Apprenticeship Support Network to replace Australian Apprenticeship Centres from 1 July 2015 with the aim to increase completion rates through targeted support to apprentices and employers.
2013 Alternative Pathways for the Trades Program announced to develop an alternative approach to the traditional trade apprenticeship model. Program to trial an initial period of full-time training at a recognised training provider, followed by structured on-the-job training with an employer.
Further Commonwealth changes to incentive payments for apprenticeships and traineeships: Completion incentives for existing worker apprenticeships and traineeships not on the
NSNL removed from 3 August 2013 (priority occupations such as aged care, childcare, disability care and enrolled nurses exempt from the change).
Fair Work Commission announced in August 2013 to increase apprentice pay rates under a number of modern awards. The new rates of pay will apply to apprenticeships commencing from 1 January 2014. The main changes to modern awards will include:
Rates for apprentices will be increased. Adult apprentice rates will be introduced into a number of awards which do not currently
contain them. Minimum award rates for adult apprentices will be increased.
2012 Further Commonwealth changes to incentive payments for apprenticeships and traineeships: Commencement incentives for existing worker apprenticeships and traineeships not on
the National Skills Needs List (NSNL) removed from 1 July 2012. Commencement and completion incentives for diploma and advanced diploma
qualifications not leading to aged care, child care or enrolled nursing removed from 23 October 2012.
Commencement incentives for part-time apprenticeships and traineeships removed from 23 October 2012. The following cohorts unaffected: part-time, certificate III/IV qualifications on NSNL, school-based apprenticeships and traineeships, and part-time diploma and advanced diploma qualifications leading to aged care, child care or enrolled nursing.
Victoria introduces new fee and funding rates effective from 1 July 2012 for all new course commencements ("Refocusing Vocational Training in Victoria").
2011 Accelerated Australian Apprenticeships initiative announced with the aim of allowing apprentices and trainees to progress through training as they demonstrate required competencies, rather than on a time served basis.
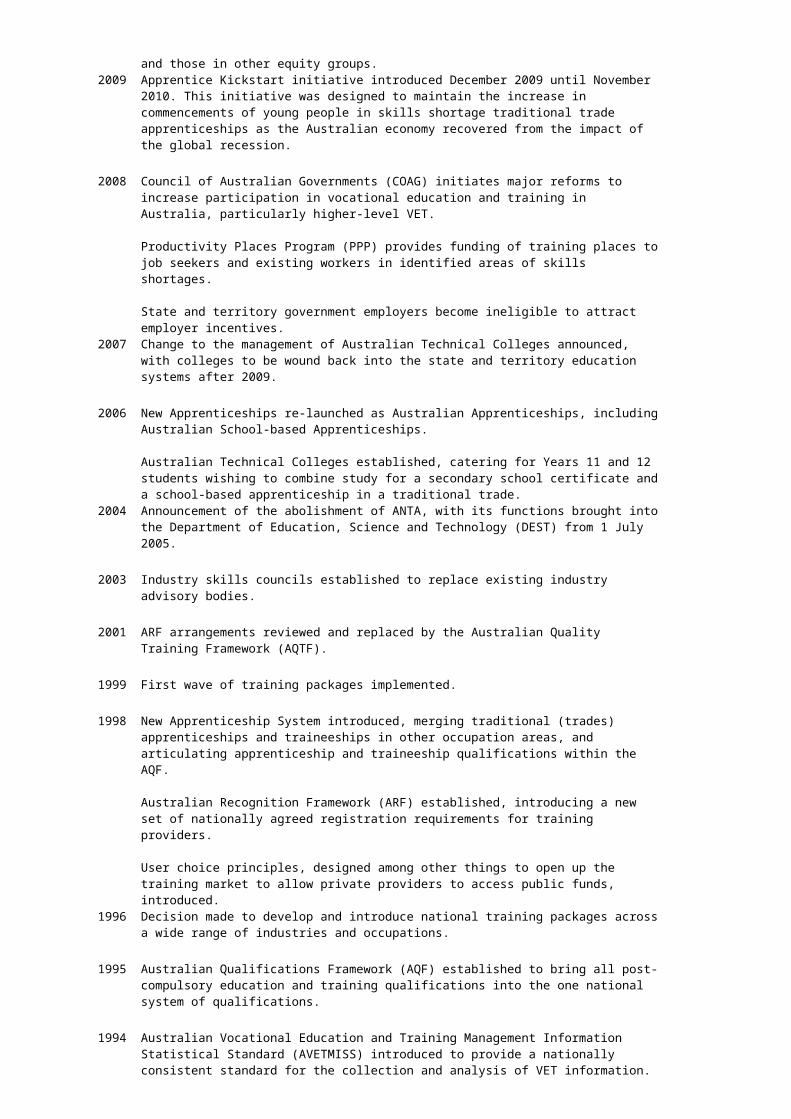
Universal access to commencement and completion incentives for certificate II apprenticeships and traineeships removed, with access to the standard commencement and the Group Training Organisations completion incentive only available to Indigenous Australians, people with a disability, the mature aged, those in rural or regional areas, and those in other equity groups.
2009 Apprentice Kickstart initiative introduced December 2009 until November 2010. This initiative was designed to maintain the increase in commencements of young people in skills shortage traditional trade apprenticeships as the Australian economy recovered from the impact of the global recession.
2008 Council of Australian Governments (COAG) initiates major reforms to increase participation in vocational education and training in Australia, particularly higher-level VET.
Productivity Places Program (PPP) provides funding of training places to job seekers and existing workers in identified areas of skills shortages.
State and territory government employers become ineligible to attract employer incentives.
2007 Change to the management of Australian Technical Colleges announced, with colleges to be wound back into the state and territory education systems after 2009.
2006 New Apprenticeships re-launched as Australian Apprenticeships, including Australian School-based Apprenticeships.
Australian Technical Colleges established, catering for Years 11 and 12 students wishing to combine study for a secondary school certificate and a school-based apprenticeship in a traditional trade.
2004 Announcement of the abolishment of ANTA, with its functions brought into the Department of Education, Science and Technology (DEST) from 1 July 2005.
2003 Industry skills councils established to replace existing industry advisory bodies.
2001 ARF arrangements reviewed and replaced by the Australian Quality Training Framework (AQTF).
1999 First wave of training packages implemented.
1998 New Apprenticeship System introduced, merging traditional (trades) apprenticeships and traineeships in other occupation areas, and articulating apprenticeship and traineeship qualifications within the AQF.
Australian Recognition Framework (ARF) established, introducing a new set of nationally agreed registration requirements for training providers.
User choice principles, designed among other things to open up the training market to allow private providers to access public funds, introduced.
1996 Decision made to develop and introduce national training packages across a wide range of industries and occupations.
1995 Australian Qualifications Framework (AQF) established to bring all post-compulsory education and training qualifications into the one national system of qualifications.
1994 Australian Vocational Education and Training Management Information Statistical Standard (AVETMISS) introduced to provide a nationally consistent standard for the collection and analysis of VET information.
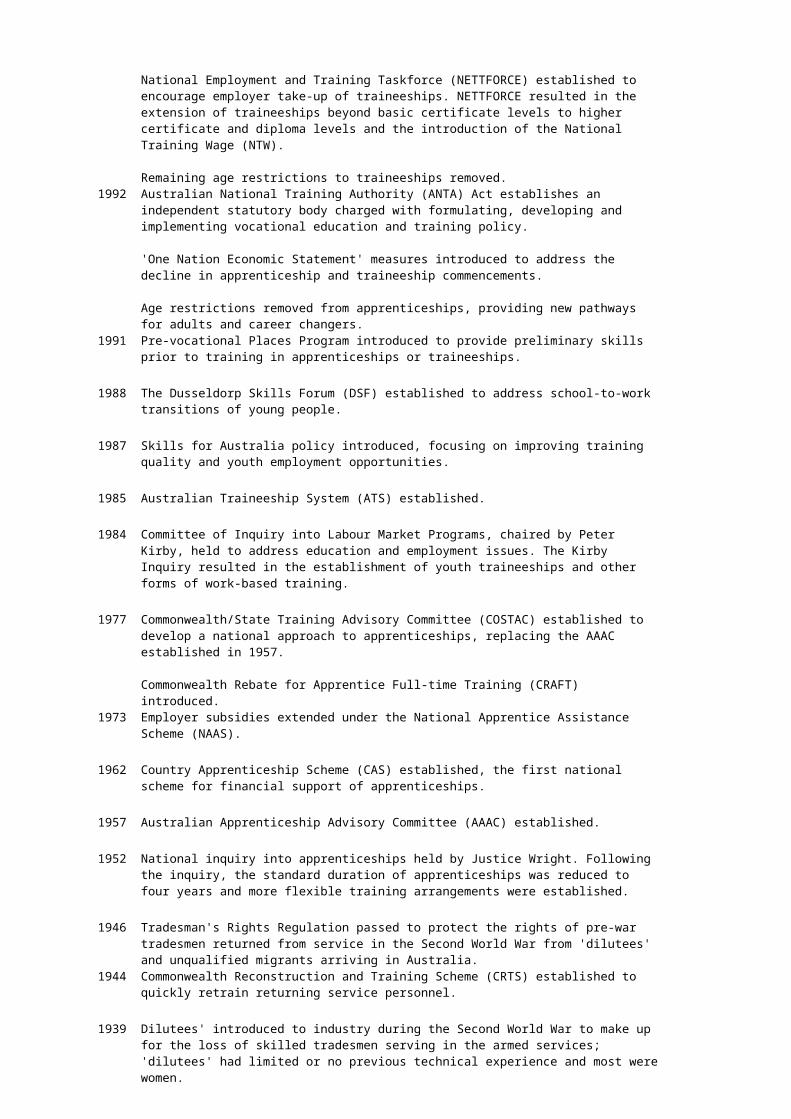
National Employment and Training Taskforce (NETTFORCE) established to encourage employer take-up of traineeships. NETTFORCE resulted in the extension of traineeships beyond basic certificate levels to higher certificate and diploma levels and the introduction of the National Training Wage (NTW).
Remaining age restrictions to traineeships removed.
1992 Australian National Training Authority (ANTA) Act establishes an independent statutory body charged with formulating, developing and implementing vocational education and training policy.
'One Nation Economic Statement' measures introduced to address the decline in apprenticeship and traineeship commencements.
Age restrictions removed from apprenticeships, providing new pathways for adults and career changers.
1991 Pre-vocational Places Program introduced to provide preliminary skills prior to training in apprenticeships or traineeships.
1988 The Dusseldorp Skills Forum (DSF) established to address school-to-work transitions of young people.
1987 Skills for Australia policy introduced, focusing on improving training quality and youth employment opportunities.
1985 Australian Traineeship System (ATS) established.
1984 Committee of Inquiry into Labour Market Programs, chaired by Peter Kirby, held to address education and employment issues. The Kirby Inquiry resulted in the establishment of youth traineeships and other forms of work-based training.
1977 Commonwealth/State Training Advisory Committee (COSTAC) established to develop a national approach to apprenticeships, replacing the AAAC established in 1957.
Commonwealth Rebate for Apprentice Full-time Training (CRAFT) introduced.
1973 Employer subsidies extended under the National Apprentice Assistance Scheme (NAAS).
1962 Country Apprenticeship Scheme (CAS) established, the first national scheme for financial support of apprenticeships.
1957 Australian Apprenticeship Advisory Committee (AAAC) established.
1952 National inquiry into apprenticeships held by Justice Wright. Following the inquiry, the standard duration of apprenticeships was reduced to four years and more flexible training arrangements were established.
1946 Tradesman's Rights Regulation passed to protect the rights of pre-war tradesmen returned from service in the Second World War from 'dilutees' and unqualified migrants arriving in Australia.
1944 Commonwealth Reconstruction and Training Scheme (CRTS) established to quickly retrain returning service personnel.
1939 Dilutees' introduced to industry during the Second World War to make up for the loss of skilled tradesmen serving in the armed services; 'dilutees' had limited or no previous technical experience and most were women.
1901 NSW Apprentices Act 1901 enacted, setting new regulatory arrangements later followed in the other states of the newly created Australian federation; the new regulatory arrangements included raising the minimum age for apprentices from 12 to 14 years, introducing the model form of indenture, and setting the maximum term of apprenticeships to seven years.
Data sources
NCVER 2016, Historical time series of apprenticeships and traineeships in Australia, from 1963 , NCVER, Adelaide.
ABS 2016, Australian national accounts: National income, expenditure and product, September 2016 , cat. 5206.0, ABS, Canberra.
ABS 2016, Labour force, Australia, December 2016 , cat. 6202.0, ABS, Canberra.
ABS 2016, Labour force, Australia, detailed, quarterly, November 2016 , cat. 6291.0.55.003, ABS, Canberra.
For more information, see the full publication Historical time series of apprenticeships and traineeships in Australia, from 1963 to 2016 at https://www.ncver.edu.au/data/data/all-data/historical-time-series-of-apprenticeships-and-traineeships-in-australia-from-1963-to-2016.
Created by National Centre for Vocational Education Research (NCVER)
© National Centre for Vocational Education Research, 2017
For details and exceptions visit http://www.ncver.edu.au/wps/portal/vetdataportal/restricted/copyright.