Embed Size (px)
Citation preview

History of WTCPUA and
Comparison to Alternatives
West Travis County Public Utility Agency
December 8, 2017
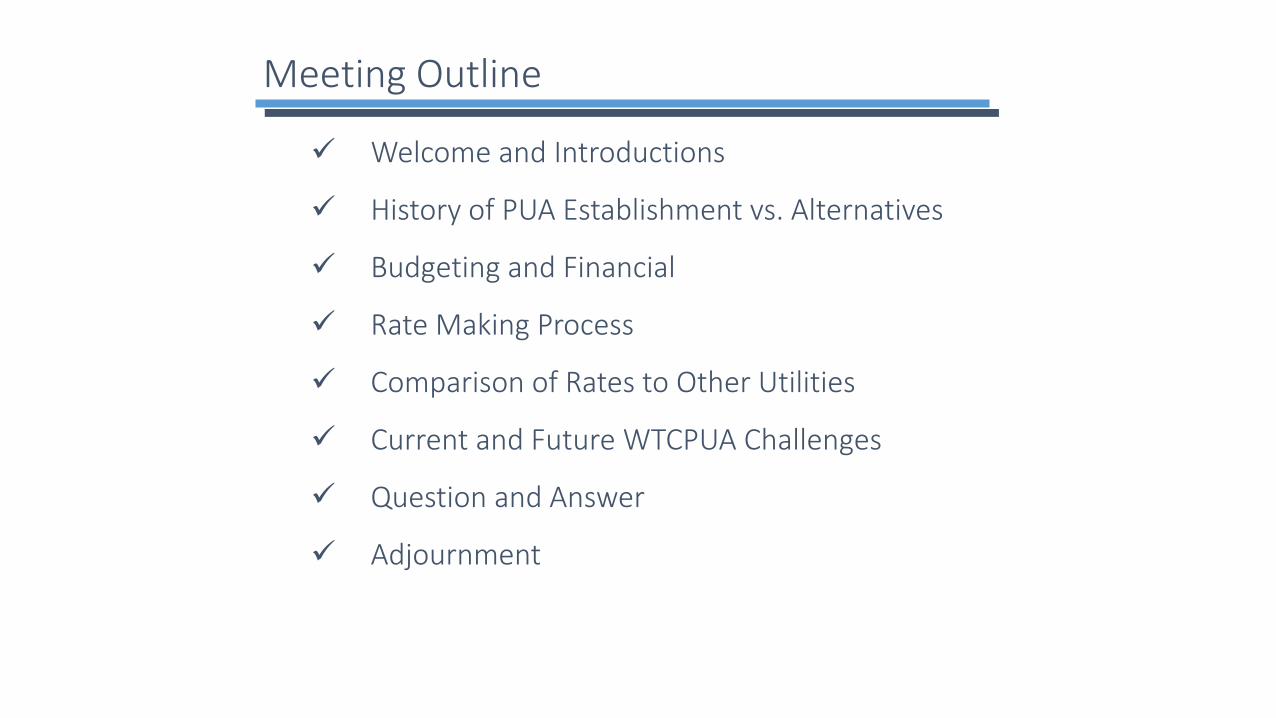
Meeting Outline
✓ Welcome and Introductions
✓ History of PUA Establishment vs. Alternatives
✓ Budgeting and Financial
✓ Rate Making Process
✓ Comparison of Rates to Other Utilities
✓ Current and Future WTCPUA Challenges
✓ Question and Answer
✓ Adjournment
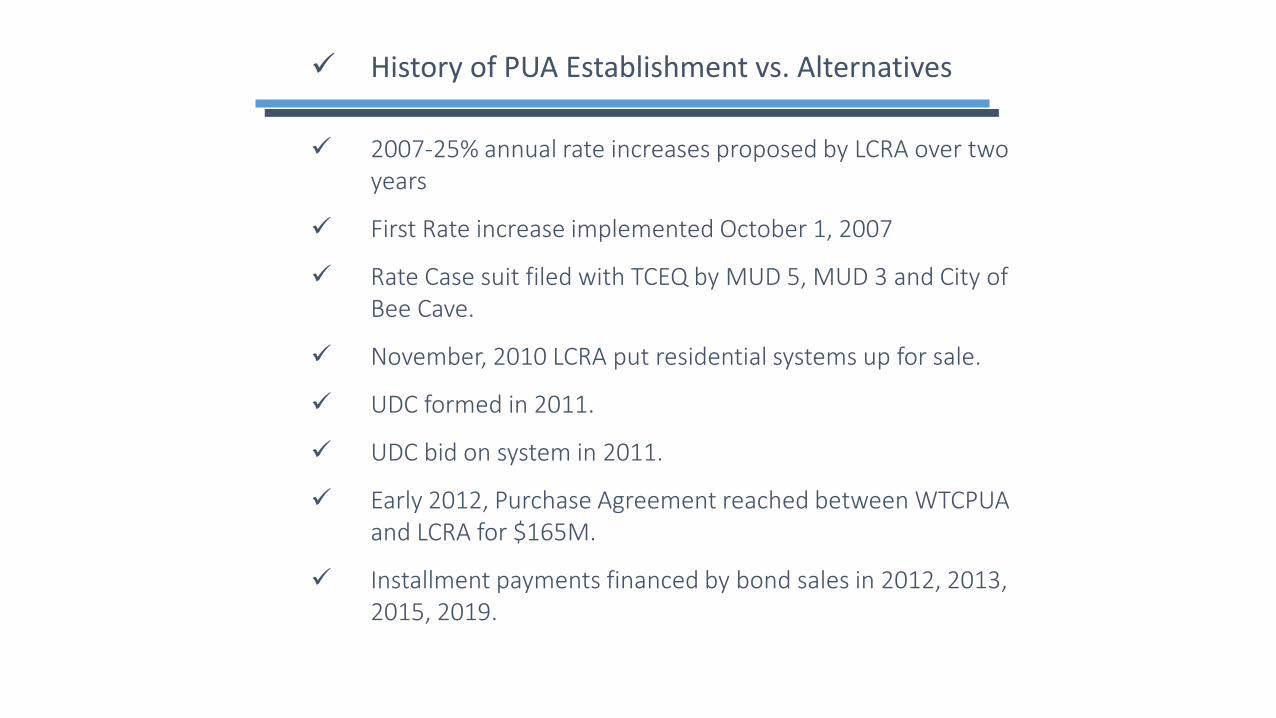
✓ History of PUA Establishment vs. Alternatives
✓ 2007-25% annual rate increases proposed by LCRA over two years
✓ First Rate increase implemented October 1, 2007
✓ Rate Case suit filed with TCEQ by MUD 5, MUD 3 and City of Bee Cave.
✓ November, 2010 LCRA put residential systems up for sale.
✓ UDC formed in 2011.
✓ UDC bid on system in 2011.
✓ Early 2012, Purchase Agreement reached between WTCPUA and LCRA for $165M.
✓ Installment payments financed by bond sales in 2012, 2013, 2015, 2019.

✓ History of PUA Establishment vs. Alternatives
✓ Alternatives
✓ LCRA continued to own system with large (double digit) annual rate increases.
✓ Private investor owned utility
✓ National Study showed that private utilities raised rates much more frequently and significantly than public utilities.
✓ Personal property taxes
✓ Franchise taxes
✓ Texas being the most severe state.
✓ 50%-75% increases over two year period.
Budgeting and Financial
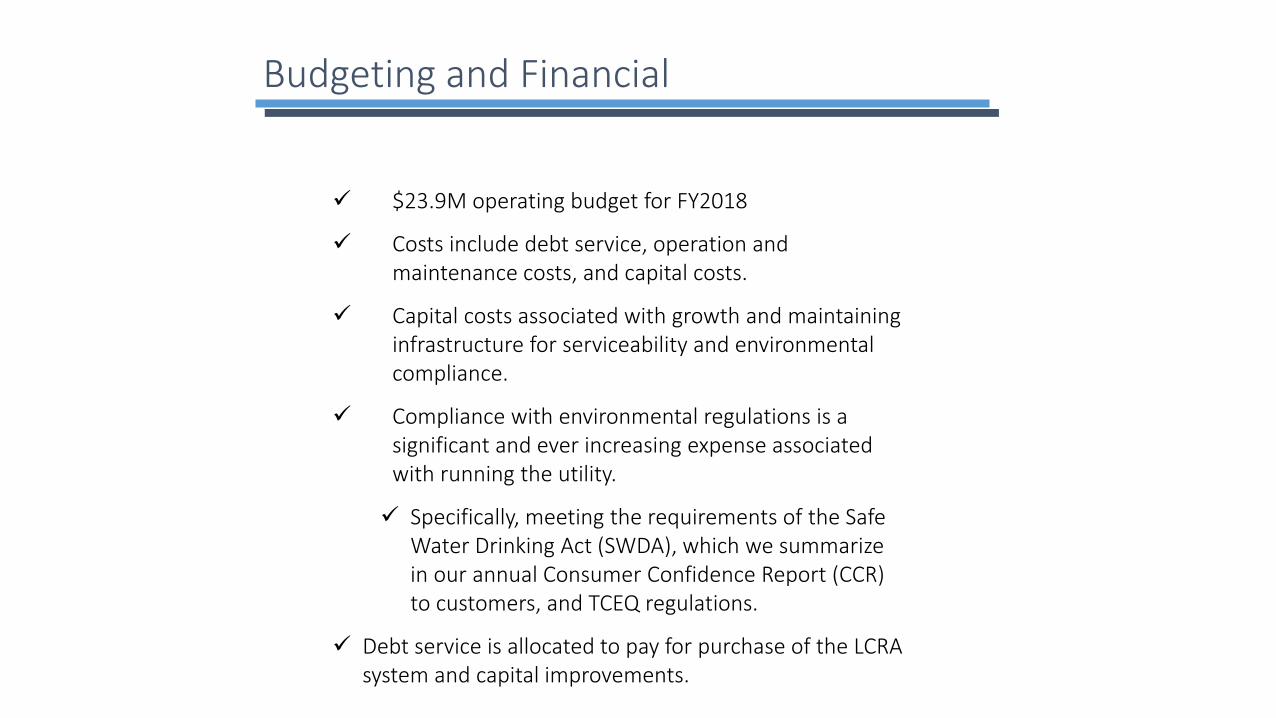
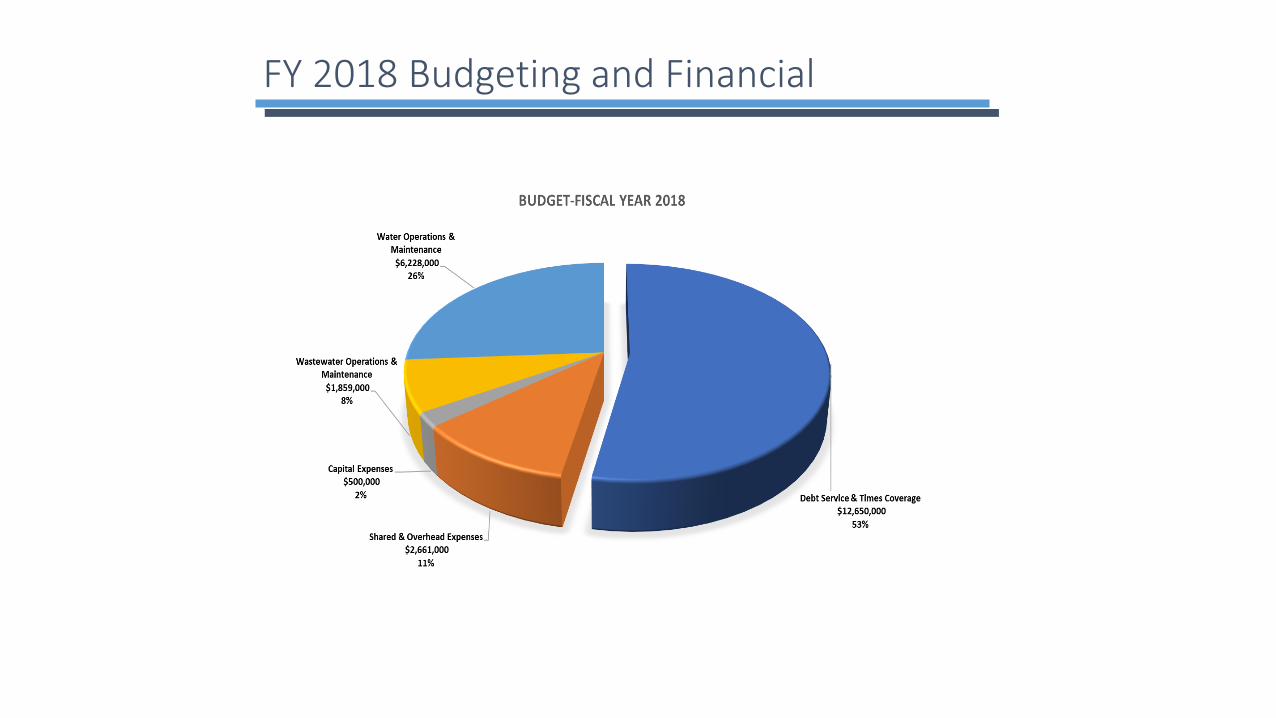
✓ $23.9M operating budget for FY2018
✓ Costs include debt service, operation and maintenance costs, and capital costs.
✓ Capital costs associated with growth and maintaining infrastructure for serviceability and environmental compliance.
✓ Compliance with environmental regulations is a significant and ever increasing expense associated with running the utility.
✓ Specifically, meeting the requirements of the Safe Water Drinking Act (SWDA), which we summarize in our annual Consumer Confidence Report (CCR) to customers, and TCEQ regulations.
✓ Debt service is allocated to pay for purchase of the LCRA system and capital improvements.
FY 2018 Budgeting and Financial
Rate Making Process
✓ Cost of Service study based on industry standard methods
✓ Equitably allocate the costs of the utility across all customer classes
✓ Revenue requirements are then determined to cover those costs and final rates are calculated to ensure adequate end of year cash balances for the utility
✓ Base fee covers debt service
✓ Volumetric fees cover operational costs
✓ PUA only has rates to pay for costs. No taxing authority.
Rate Making Process - Water
✓ For FY2017, a typical residential customer using 10,000 gallons of water per month only saw an increase of $3.00 in their monthly water bill (3.3%).
✓ This monthly bill represents a cost of less than a penny a gallon. A very good value for providing an engineered product to the customer, and also in comparison to the cost of bottled water.
✓ Engineering involves designing and constructing the water treatment plant and distribution system, operating the plant to provide water that meets the SWDA, and distributing treated water to the system so that serviceability, pressure, flow and environmental compliance are achieved.
✓ No rate increase in FY2018 due to improved operating efficiencies.
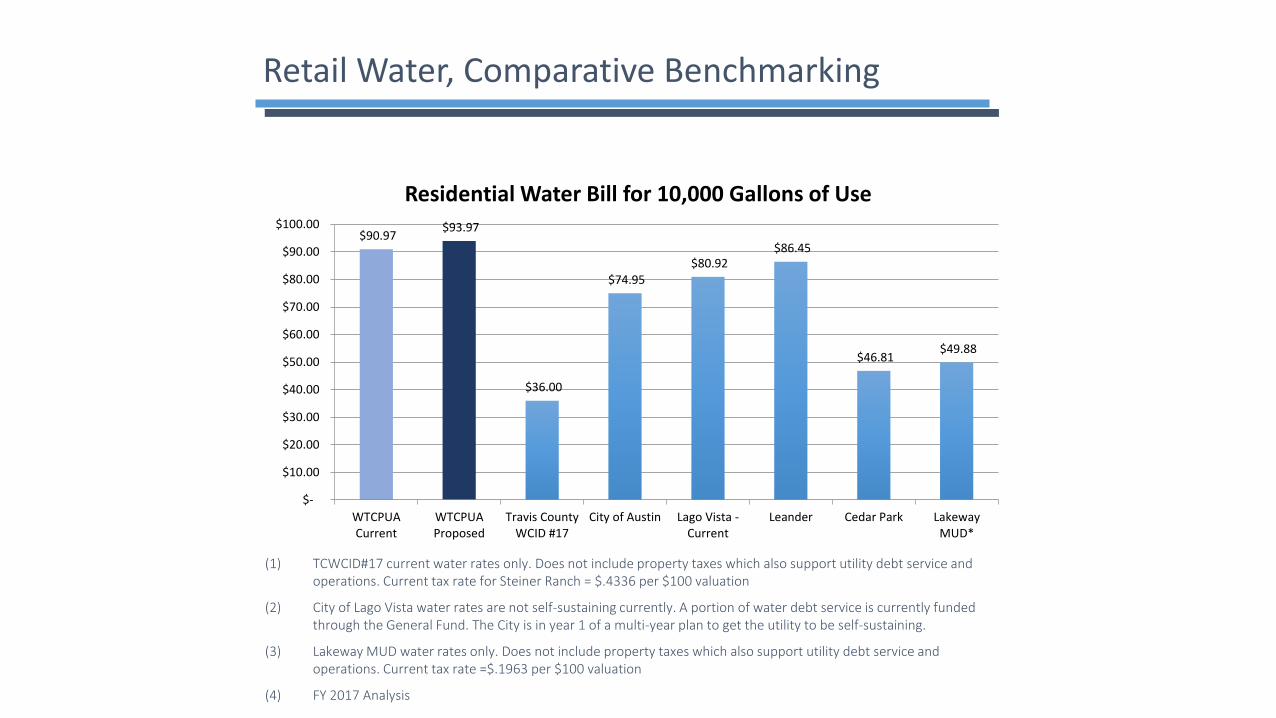
Retail Water, Comparative Benchmarking
(1) TCWCID#17 current water rates only. Does not include property taxes which also support utility debt service and operations. Current tax rate for Steiner Ranch = $.4336 per $100 valuation
(2) City of Lago Vista water rates are not self-sustaining currently. A portion of water debt service is currently funded through the General Fund. The City is in year 1 of a multi-year plan to get the utility to be self-sustaining.
(3) Lakeway MUD water rates only. Does not include property taxes which also support utility debt service and operations. Current tax rate =$.1963 per $100 valuation
(4) FY 2017 Analysis
$90.97 $93.97
$36.00
$74.95 $80.92
$86.45
$46.81 $49.88
$-
$10.00
$20.00
$30.00
$40.00
$50.00
$60.00
$70.00
$80.00
$90.00
$100.00
WTCPUACurrent
WTCPUAProposed
Travis CountyWCID #17
City of Austin Lago Vista -Current
Leander Cedar Park LakewayMUD*
Residential Water Bill for 10,000 Gallons of Use
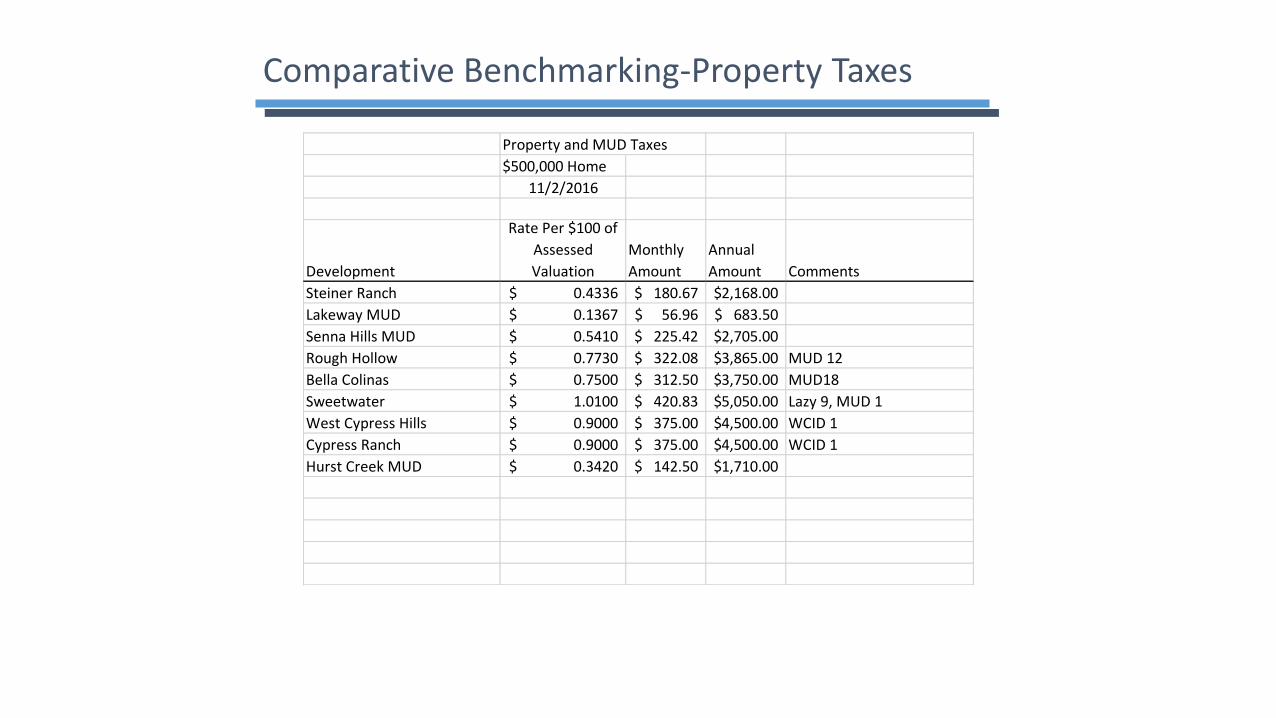
Comparative Benchmarking-Property Taxes
Property and MUD Taxes
$500,000 Home
11/2/2016
Development
Rate Per $100 of
Assessed
Valuation
Monthly
Amount
Annual
Amount Comments
Steiner Ranch 0.4336$ 180.67$ 2,168.00$
Lakeway MUD 0.1367$ 56.96$ 683.50$
Senna Hills MUD 0.5410$ 225.42$ 2,705.00$
Rough Hollow 0.7730$ 322.08$ 3,865.00$ MUD 12
Bella Colinas 0.7500$ 312.50$ 3,750.00$ MUD18
Sweetwater 1.0100$ 420.83$ 5,050.00$ Lazy 9, MUD 1
West Cypress Hills 0.9000$ 375.00$ 4,500.00$ WCID 1
Cypress Ranch 0.9000$ 375.00$ 4,500.00$ WCID 1
Hurst Creek MUD 0.3420$ 142.50$ 1,710.00$
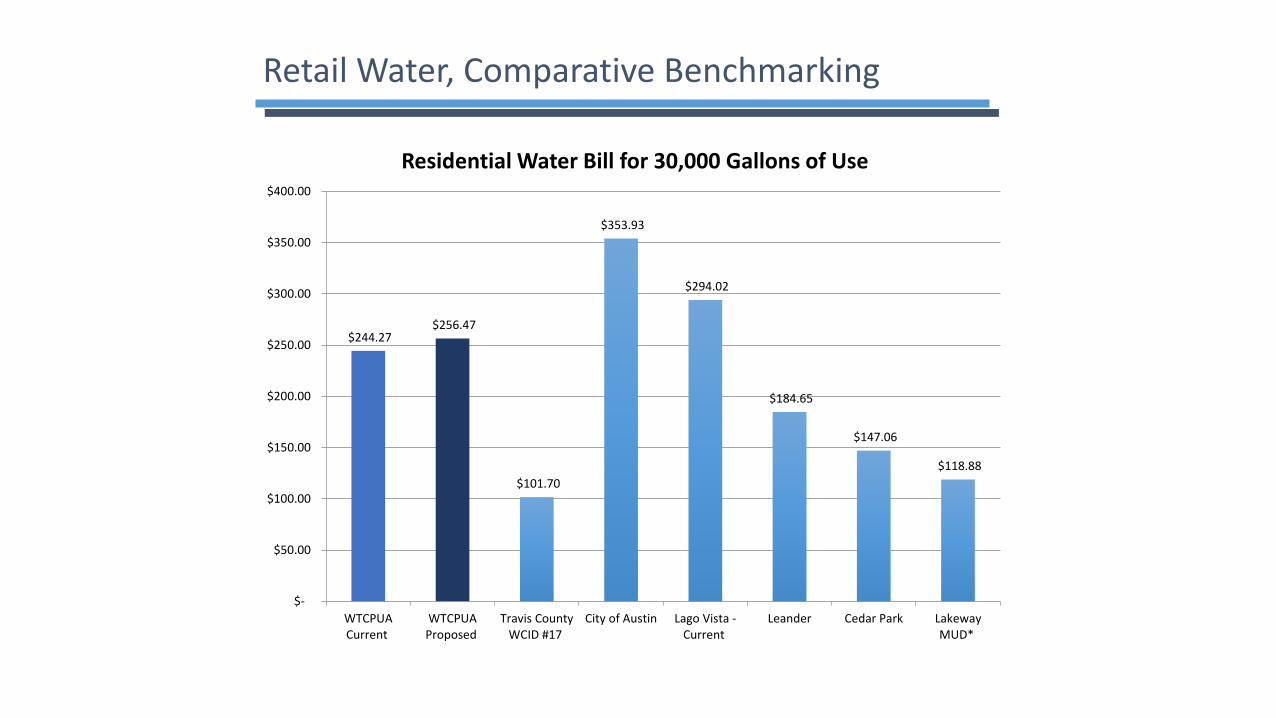
Retail Water, Comparative Benchmarking
$244.27 $256.47
$101.70
$353.93
$294.02
$184.65
$147.06
$118.88
$-
$50.00
$100.00
$150.00
$200.00
$250.00
$300.00
$350.00
$400.00
WTCPUACurrent
WTCPUAProposed
Travis CountyWCID #17
City of Austin Lago Vista -Current
Leander Cedar Park LakewayMUD*
Residential Water Bill for 30,000 Gallons of Use
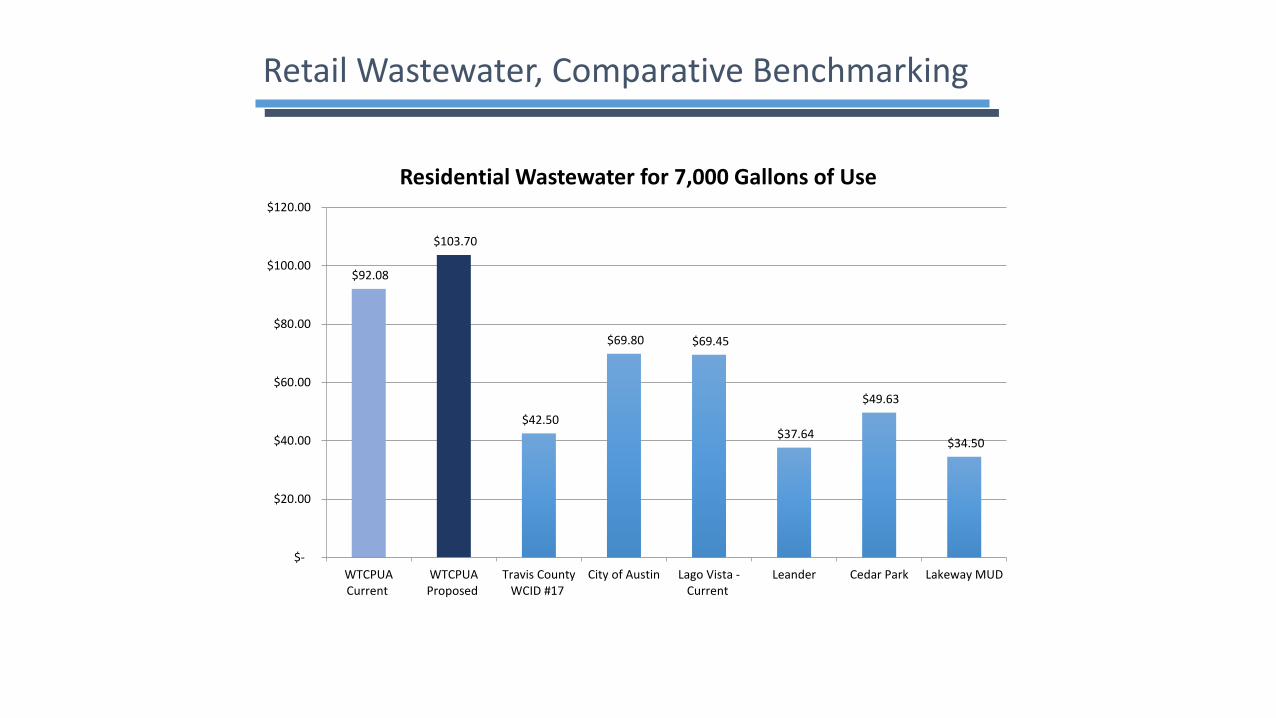
Retail Wastewater, Comparative Benchmarking
$92.08
$103.70
$42.50
$69.80 $69.45
$37.64
$49.63
$34.50
$-
$20.00
$40.00
$60.00
$80.00
$100.00
$120.00
WTCPUACurrent
WTCPUAProposed
Travis CountyWCID #17
City of Austin Lago Vista -Current
Leander Cedar Park Lakeway MUD
Residential Wastewater for 7,000 Gallons of Use

Rate Increase History-Water
LCRA 2007 LCRA 2008 LCRA 2009 LCRA 2010
ADOPTED ADOPTED ADOPTED NOT ADOPTED 2012 2013 2014 2015 2016 2017
Base Fee 27.50$ 30.00$ 31.65$ 31.65$ 31.65$ 31.39$ 32.65$ 41.97$ 41.97$ 41.97$
Volumetric Fee
0-10000 2.80$ 3.30$ 3.80$ 5.10$ 3.80$ 4.27$ 4.44$ 4.90$ 5.20$ 5.20$
10-20000 3.50$ 4.10$ 5.00$ 6.30$ 5.00$ 5.71$ 5.94$ 6.13$ 6.50$ 6.50$
20-25000 3.50$ 4.60$ 6.00$ 8.60$ 6.00$ 8.11$ 8.43$ 9.20$ 9.75$ 9.75$
25000-35000 5.75$ 6.70$ 8.10$ 10.30$ 8.10$ 8.11$ 8.43$ 9.20$ 9.75$ 9.75$
Water Bill - 10,000 Gallons 55.50$ 63.00$ 69.65$ 82.65$ 69.65$ 74.09$ 77.05$ 90.97$ 93.97$ 93.97$
Water Bill - 15,000 Gallons 73.00$ 83.50$ 94.65$ 114.15$ 94.65$ 102.64$ 106.75$ 121.62$ 126.47$ 126.47$
Water Bill - 30,000 Gallons 136.75$ 160.50$ 190.15$ 240.15$ 190.15$ 212.29$ 220.75$ 244.27$ 256.47$ 256.47$
Percent Increase
Cumulative-
3 Yrs
Cumulative-
6-yrs
Water Bill - 10,000 Gallons 14% 11% 19% 43% 0% 6% 4% 18% 3% 0% 32%
Water Bill - 15,000 Gallons 14% 13% 21% 48% 0% 8% 4% 14% 4% 0% 30%
Water Bill - 30,000 Gallons 17% 18% 26% 62% 0% 12% 4% 11% 5% 0% 31%
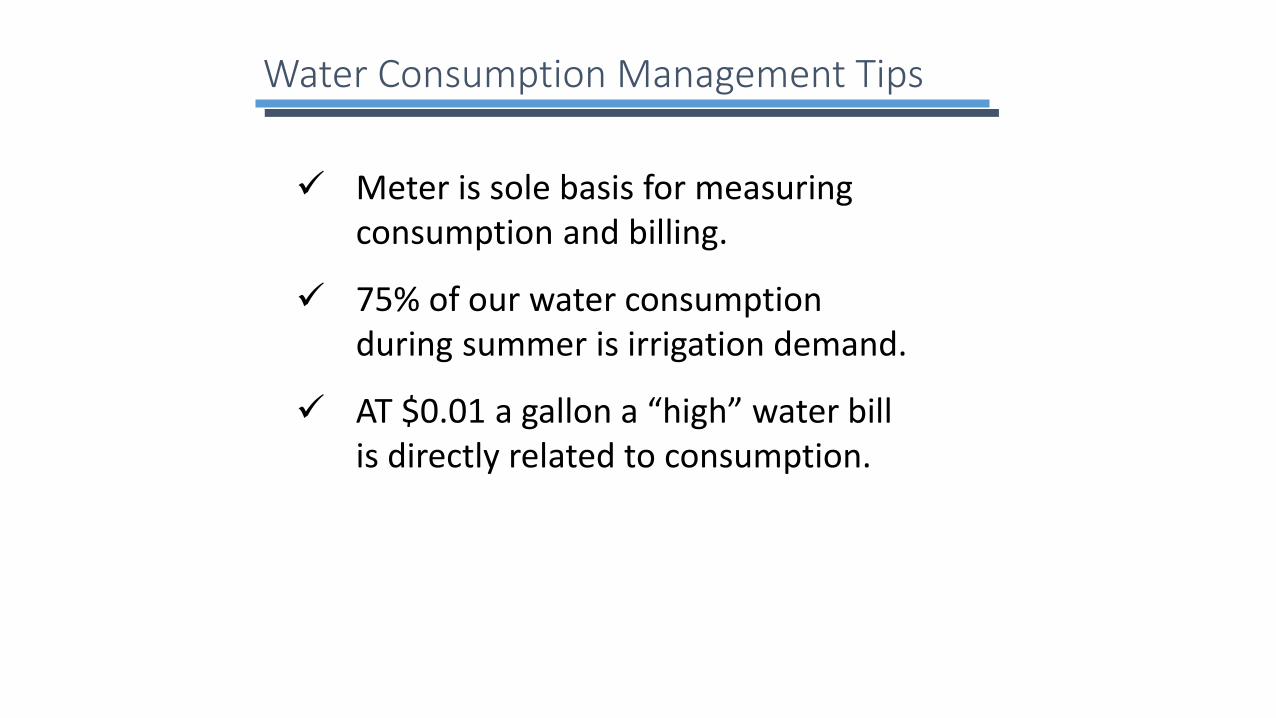
Water Consumption Management Tips
✓ Meter is sole basis for measuring consumption and billing.
✓ 75% of our water consumption during summer is irrigation demand.
✓ AT $0.01 a gallon a “high” water bill is directly related to consumption.
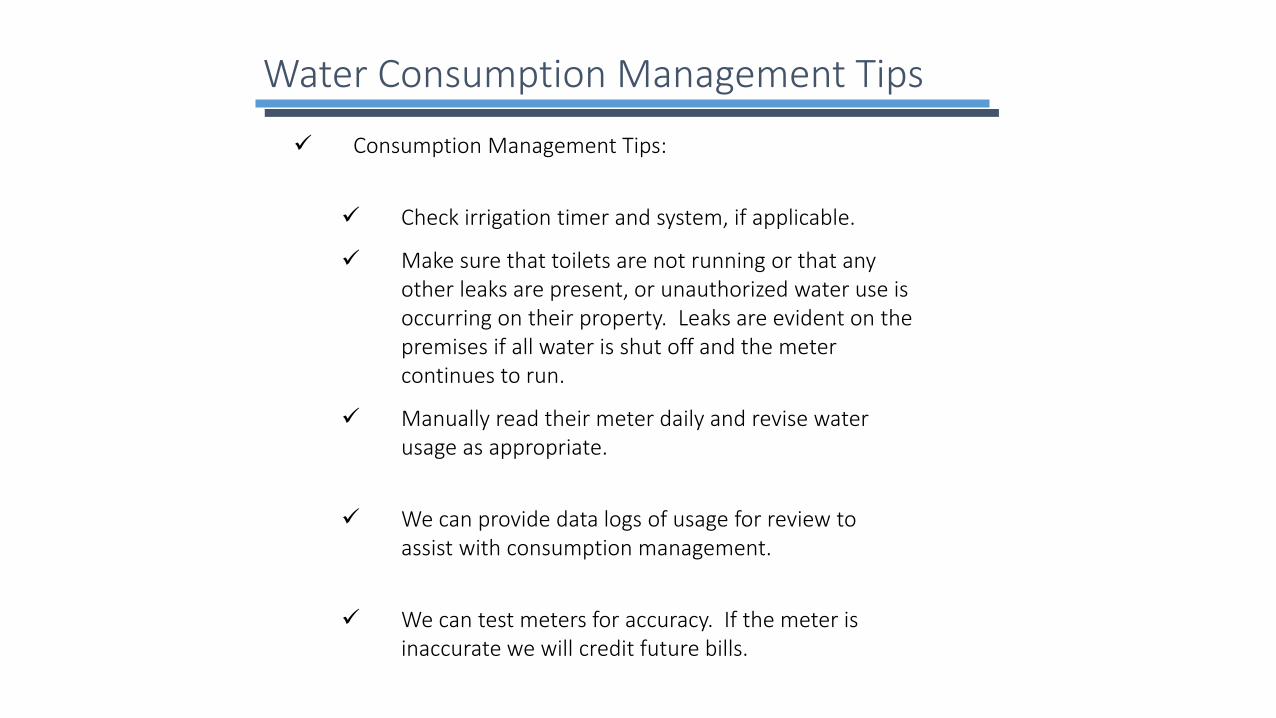
Water Consumption Management Tips
✓ Consumption Management Tips:
✓ Check irrigation timer and system, if applicable.
✓ Make sure that toilets are not running or that any other leaks are present, or unauthorized water use is occurring on their property. Leaks are evident on the premises if all water is shut off and the meter continues to run.
✓ Manually read their meter daily and revise water usage as appropriate.
✓ We can provide data logs of usage for review to assist with consumption management.
✓ We can test meters for accuracy. If the meter is inaccurate we will credit future bills.
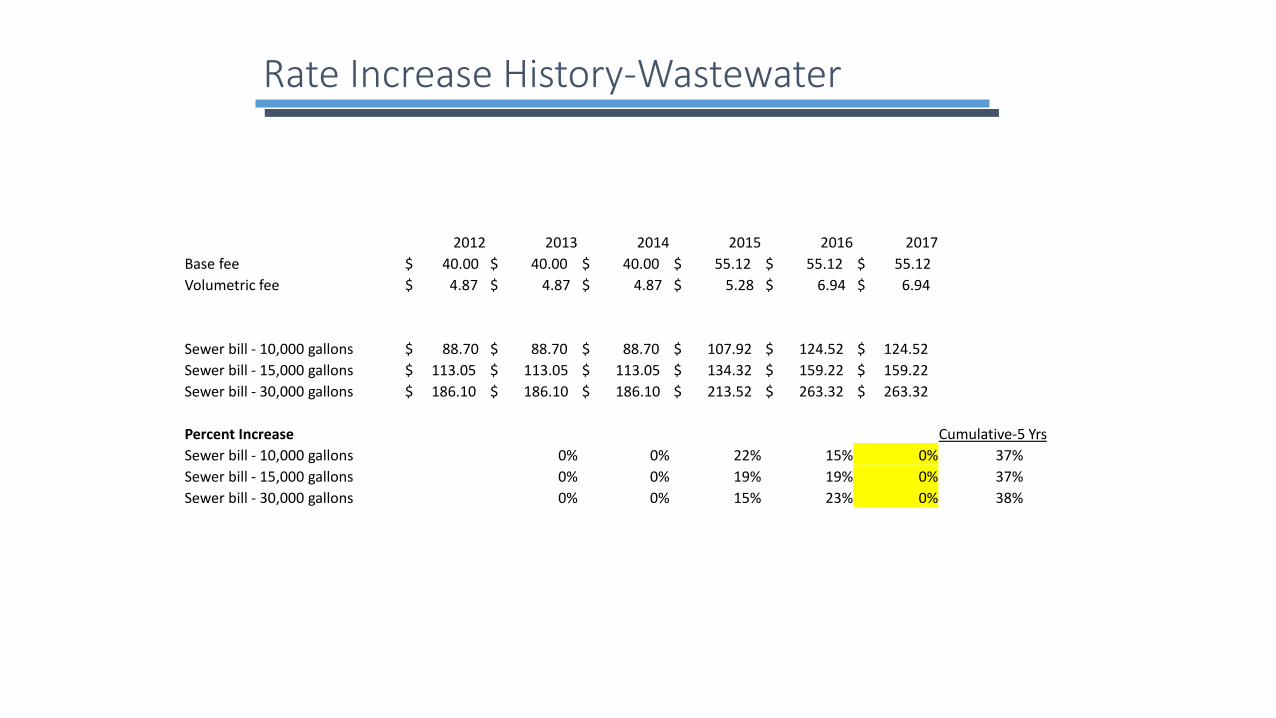
Rate Increase History-Wastewater
2012 2013 2014 2015 2016 2017
Base fee $ 40.00 $ 40.00 $ 40.00 $ 55.12 $ 55.12 $ 55.12
Volumetric fee $ 4.87 $ 4.87 $ 4.87 $ 5.28 $ 6.94 $ 6.94
Sewer bill - 10,000 gallons $ 88.70 $ 88.70 $ 88.70 $ 107.92 $ 124.52 $ 124.52
Sewer bill - 15,000 gallons $ 113.05 $ 113.05 $ 113.05 $ 134.32 $ 159.22 $ 159.22
Sewer bill - 30,000 gallons $ 186.10 $ 186.10 $ 186.10 $ 213.52 $ 263.32 $ 263.32
Percent Increase Cumulative-5 Yrs
Sewer bill - 10,000 gallons 0% 0% 22% 15% 0% 37%
Sewer bill - 15,000 gallons 0% 0% 19% 19% 0% 37%
Sewer bill - 30,000 gallons 0% 0% 15% 23% 0% 38%
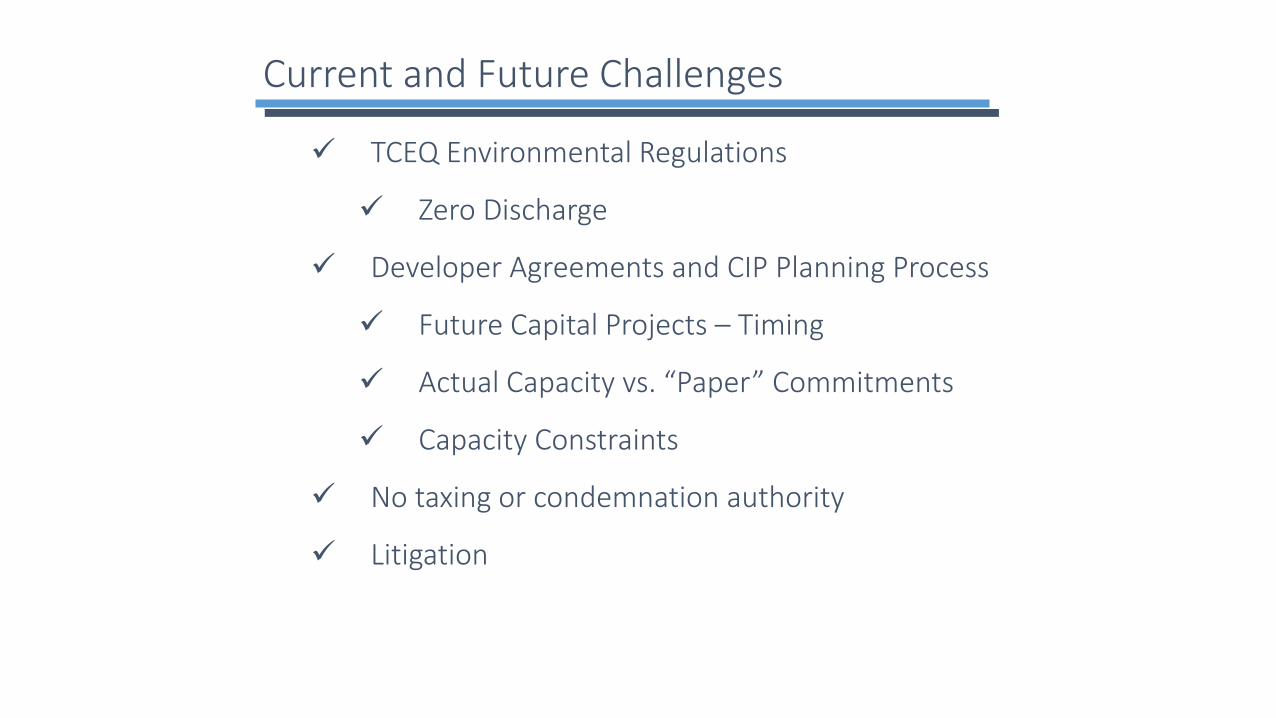
Current and Future Challenges
✓ TCEQ Environmental Regulations
✓ Zero Discharge
✓ Developer Agreements and CIP Planning Process
✓ Future Capital Projects – Timing
✓ Actual Capacity vs. “Paper” Commitments
✓ Capacity Constraints
✓ No taxing or condemnation authority
✓ Litigation

Questions
✓ Questions?
✓ Thank you!