Embed Size (px)
Citation preview

HIT and Data Integration: Making Meaningful Users of HIT to Advance Equity in Care
Charting a Course for Quality Improvement:
Addressing Health Care Disparities
Brookings Conference, DCMarch 25, 2010
Brenda K. EdwardsSurveillance Research ProgramNational Cancer Institute, NIH

A National Framework for Cancer Surveillance
Wingo PA, Howe HL, Thun MJ, Ballard-Barbash R, Ward E, Brown ML, Sylvester J, Friedell GH, Alley L, Rowland JH, Edwards BK, Cancer Causes and Control 2005;16:151-170
Swan J, Wingo P, Clive R, West D, Miller D, Hutchison C, Sondik EJ, Edwards BK, Cancer 1998; 83:1282-1291
HEALTHYPOPULATIONS
NEW DIAGNOSISOF CANCER
TREATMENTOF CANCER
LIVING WITHCANCER
DYING FROMCANCER
Descriptions of the Cancer Burden Nationally, Regionally, and in States & Communities
Measurement of Race, Ethnicity, Socioeconomic Status & Culture; Costs;Individual, Social & Biologic Factors; and Provider Knowledge, Attitudes, & Practices
Monitoring the Impact of Cancer & Progress to Reduce Cancer
• Important for ongoing surveillance– All sites, common or rare– All populations, by age, sex, race &
ethnicity, geography
• Identifying unusual patterns– Rapid changes in incidence
• Relevance to etiology• Relevance to public health
– Planning– Evaluating the impact of public health
interventions 3

Annual Report to the Nationon the Status of Cancer
• Coordinated & shared responsibility since 1998– National Cancer Institute– Centers for Disease Control & Prevention– American Cancer Society– North American Association for Central Cancer Registries
• Latest data on cancer incidence & mortality• Requires data linkages, methods development• Special feature:
– Tobacco control & lung cancer– American Indian & Alaska Natives; Hispanics– Treatment patterns– Cancer control– Survival– Cancer and aging population 4
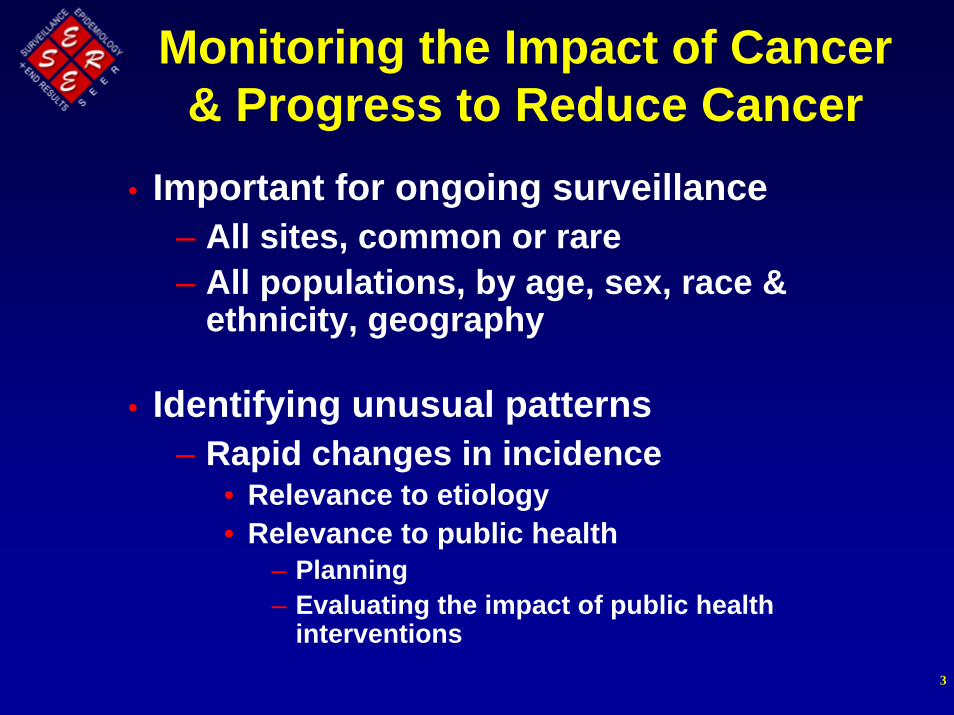
Commentary
Annual Report to the Nation on the Status Of Cancer, 1975-2006, Featuring Colorectal Cancer Trends and Impact of Interventions (Risk Factors, Screening, and Treatment) to Reduce Future Rates
Volume 116/Issue 3February 1, 2010Pages 544-573
Brenda K. Edwards, PhD1;Elizabeth Ward, PhD2;Betsy A. Kohler, MPH, CTR3;Christie Eheman, PhD4; Ann G. Zauber, PhD5;Robert N. Anderson, PhD6;Ahmedin Jemal, DVM, PhD2; Maria J. Schymura, PhD3’7;Iris Lansdorp-Vogelaar, MS, PhD8;Laura C. Seeff, MD4; Marjolein van Ballegooijen, MD, PhD8;S. Luuk Goede, MSc8;and Lynn A. G. Ries, MS1
Online print December 7, 2009
Rates of new diagnoses and rates of death from all cancers combined declined significantly in the most recent time period for men and women overall and for most racial & ethnic US populations
Incidence: - 0.7 % per year from 1999-2006Deaths: - 1.6% per year from 2001-2006

6
United Statesimproved
coverage for population-
based cancer incidence
SEER 1975- 200610%
1995
NAACCR 1997-200671%
NAACCR 2002-200686%
2006
2000
SEER 9: 1975-2006 (9.4%)SEER 13: 1992-2006 (14%)SEER 17: 2000-2006 (26%)NAACCR: 2002-2006 (86%)USCS: 2005 (01/08) (100%)

All Cancers, SEER Incidence and US Death RatesJoinpoint Analyses for Whites & Blacks 1975-2006
Asian/Pacific Islanders, American Indians/Alaska Natives & Hispanics 1992-2006
Mortality
Rate per 100,000
Black
Asian/Pacific Islander
White
Rate per 100,000
HispanicAmerican Indian/AK Native
Black
White
American Indian/AK NativeHispanic
Asian/Pacific Islander
Incidence
Rates are age-adjusted to the 2000 U.S. standard million population. Sources: Incidence data – NCI SEER Program; Mortality data – CDC NCHS NVSS

Female Lung & Bronchus CancerSEER Incidence (delay adjusted) & US Death Rates
1975-2006
Here is the textSecond level
Third levelFourth level
Next set
Blacks
Whites
Blacks
Whites
Incidence Mortality
HispanicAsian/Pacific Islander
HispanicAsian/Pacific Islander
Rates are age-adjusted to the 2000 U.S. standard million population. Sources: Incidence data – NCI SEER Program; Mortality data – CDC NCHS NVSS
8
American Indian/AK NativeAmerican Indian/AK Native

Both Sexes Colon & Rectum CancerSEER Incidence (delay adjusted) & US Death Rates
1975-2006
Here is the textSecond level
Third levelFourth level
Next setBlacks
Whites
Blacks
Whites
Incidence Mortality
Hispanic
Asian/Pacific Islander
HispanicAsian/Pacific Islander
Rates are age-adjusted to the 2000 U.S. standard million population. Sources: Incidence data – NCI SEER Program; Mortality data – CDC NCHS NVSS
9
American Indian/AK Native
American Indian/AK Native

Female Breast Cancer SEER Incidence (delay adjusted) & US Death Rates
1975-2006
Here is the textSecond level
Third levelFourth level
Next set
BlacksWhites
Blacks
Whites
Incidence Mortality
Hispanic
Asian/Pacific Islander
HispanicAsian/Pacific Islander
Rates are age-adjusted to the 2000 U.S. standard million population. Sources: Incidence data – NCI SEER Program; Mortality data – CDC NCHS NVSS
10
American Indian/AK Native
American Indian/AK Native
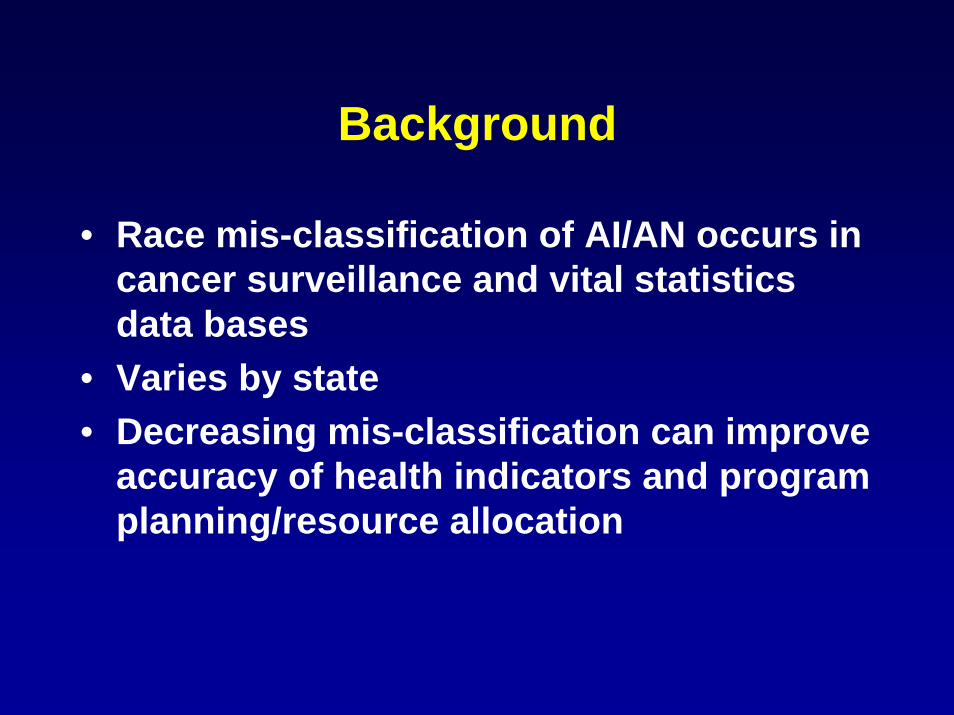
Background
• Race mis-classification of AI/AN occurs in cancer surveillance and vital statistics data bases
• Varies by state• Decreasing mis-classification can improve
accuracy of health indicators and program planning/resource allocation

Improving the quality of cancer surveillance data for AI/AN
• Link records from central cancer registries (NPCR and SEER) with administrative records from the IHS (NPIRS)
• Identify AI/AN cases misclassified as non-Native
• Use “improved” data to report cancer burden of AI/AN
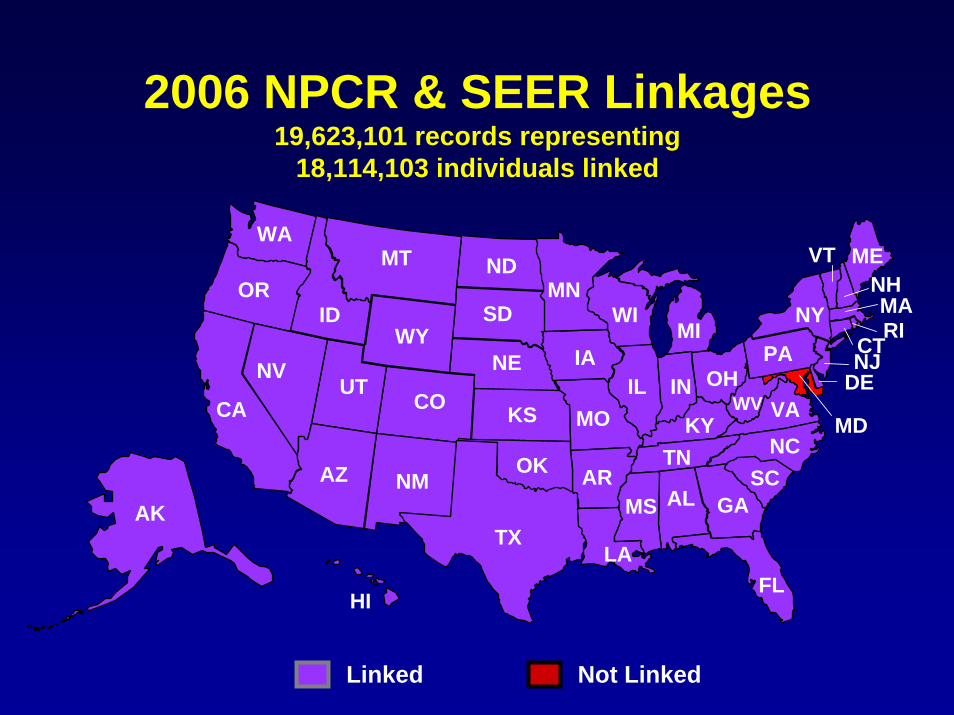
2006 NPCR & SEER Linkages19,623,101 records representing
18,114,103 individuals linked
NV
WA
ORID
MT ND
SDMN
WIMIWY
CAUT
CO
AZ NMAK
HI
TX
NE
KS
OK
LA
ALMS
MOIL IN
KYTN
GA
FL
SCNCVAWV
PA
NY
ME
NJCT
MD
OH DE
RI
NHVT
AR
IANV
MA
Not LinkedLinked

Registry linkages
• Linkage status captured in “IHS Link”variable that is part of NAACCR layout– Annual Report to the Nation on the Status of Cancer ,
1975-2004, Featuring Cancer in American Indians and Alaska Natives
– Cancer Supplement: An Update on Cancer in American Indians and Alaska Natives, 1999-2004

Cancer AI/AN Supplementwww3.interscience.wiley.com/journal/28741/home
David K. Espey, MD (CDC/IHS Albuquerque, NM)Melissa A. Jim, MPH (CDC/IHS Albuquerque, NM)
Collaborators: ACS, CDC, NCI, central cancer registries, academic centers, and tribal organizations

Alaska
Hawaii
PacificCoast
Northern Plains
East
Southern Plains
Southwest
State
Excluded
CHSDA* County
Included
*Contract Health Service Delivery Areas
Cancer AI/AN Supplement

Number of individuals identified by IHS linkage in 2006
0100020003000400050006000700080009000
Alaska East NorthernPlains
SouthernPlains
Pacific Coast Southwest
Pre-link Post-link
70
1,3801,129
3,310 2,402423

AI/AN cancer pre- and post- rates per 100,000 for All Sites, by region, both sexes, compared to
US NHW rate, 1999-2004
0
100
200
300
400
500
600
Alaska East NorthernPlains
SouthernPlains
PacificCoast
Southwest US NHW
Pre-link Post-link
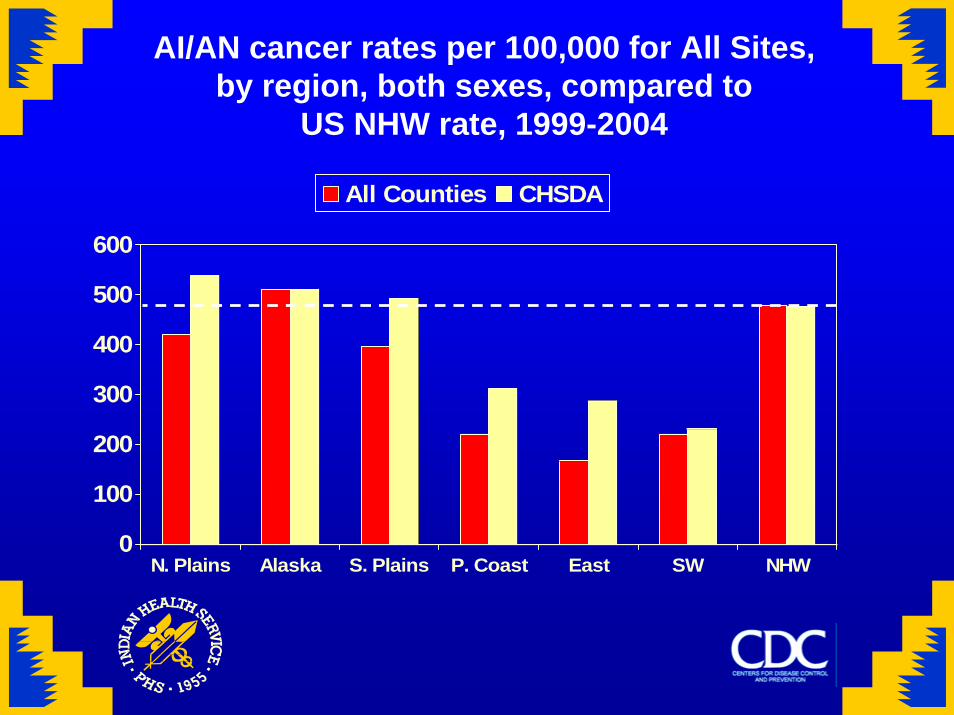
AI/AN cancer rates per 100,000 for All Sites, by region, both sexes, compared to
US NHW rate, 1999-2004
0
100
200
300
400
500
600
N. Plains Alaska S. Plains P. Coast East SW NHW
All Counties CHSDA

Incidence: CHSDA vs. Total AI/AN• IHS Contract Health Service Delivery Area counties contain or are adjacent to tribal lands– Compared to other counties, higher proportion of AI/AN and less AI/AN race misclassification
Gender Cancer Site CHSDA AI/AN Total AI/AN
Male All sites 406.9 297.4
Male Colon and rectum 51.5 36.8
Female Breast 84.7 62.9
Female Kidney and renal pelvis 13.9 9.3
Table. Incidence Rates in CHSDA and Total AI/AN, Diagnosis Years 1995‐2004 (cases per 100K).
Reference: Epsey DK et al. (2007). Annual Report to the Nation on the Status of Cancer, 1975‐2004, Featuring Cancer in American Indians and Alaska Natives. Cancer. 110(10):2119‐2152.

AI/AN colorectal cancer rates per 100,000, by region, both sexes, compared to
US NHW rates, 1999-2004
0
20
40
60
80
100
120
N. Plains Alaska S. Plains P. Coast East SW NHW
All Counties CHSDA

AI/AN breast cancer rates per 100,000, by region, females, compared to
US NHW rates, 1999-2004
0
20
40
60
80
100
120
140
N. Plains Alaska S. Plains P. Coast East SW NHW
All Counties CHSDA

AI/AN cervical cancer rates per 100,000, by region, females, compared to
US NHW rates, 1999-2004
02468
10121416
N. Plains Alaska S. Plains P. Coast East SW NHW
All Counties CHSDA

AI/AN renal cancer rates per 100,000, by region, both sexes, compared to
US NHW rates, 1999-2004
0
0.5
1
1.5
2
2.5
3
3.5
N. Plains Alaska S. Plains P. Coast East SW NHW
All Counties CHSDA

Limitations
• IHS only covers 57% of the AI/AN population• Linkage between a state cancer registry and
a Bemidji Area Tribe– 1995-2004 diagnosis years
• IHS identified 614 individuals that were not identified as AI/AN by the registry
• Bemidji Area Tribe identified 242 individuals that were not identified as AI/AN by the registry OR by linkage with IHS

National Longitudinal Mortality Survey

NCI: SEER Linkage(s)
SEER-Medicare• Annual linkage for follow-up status & survival statistics• Every 2-3 years linkage to yield a “research file” of SEER & CMS data
SEER-SSA• Annual linkage for follow-up status & survival statistics
SEER-NDI• Annual linkage for follow-up status (cause of death) & survival statistics
SEER-NLMS• Research file to investigate socio-economic determinants of cancer, racial/ethnic misclassification, and health disparities