Embed Size (px)
Citation preview
PRELIMINARY
Hit or Miss?* The Effect of Assassinations on Institutions and War
Benjamin F. Jones Northwestern University
and
Benjamin A. Olken Harvard University
December 2006
ABSTRACT
Assassinations are a persistent feature of the political landscape. Using a new data set of assassination attempts on all world leaders from 1875 to 2004, we exploit inherent randomness in the success or failure of assassination attempts to identify assassination’s effects. We find that, on average, successful assassinations of autocrats produce sustained moves toward democracy. We also find that assassinations affect the duration and intensity of small-scale conflicts. These results suggest that individual leaders play key roles in shaping institutions and conflict, and that small sources of randomness, such as perturbations in the path of a single bullet, can have a pronounced effect on history.
* The authors would like to thank Amy Finkelstein and Katerina Linos for helpful comments. Meghna Alladi, Nathaniel Kiechel, Ariana Kroshinky, Lauren Raouf, Pat Regan, and Atanas Stoyanov provided invaluable research assistance. Contact emails: [email protected], [email protected].

2
“Assassination has never changed the history of the world.” - Benjamin Disraeli, 1865, on the death of Abraham Lincoln
1. Introduction Assassinations of prominent political leaders have occurred throughout history. From
Julius Caesar to Abraham Lincoln, from John F. Kennedy to Yitzhak Rabin, many leaders have
met violent ends – and many others have escaped assassination narrowly. Had Hitler lingered 13
minutes longer in a Munich beer hall in 1939, he would likely have been killed by a waiting
bomb. Whether or not objectionable, or illegal,1 assassination and assassination attempts are a
persistent feature of the political landscape. In fact, as we will show below, a national leader has
been assassinated in approximately two of every three years since 1950.
The purpose of this paper is to examine assassination’s effects.2 To understand
assassination – as an influence in history, as a policy, even as a normative matter – one may first
ask whether assassinations actually change the course of events. Here there is considerable
debate. Disraeli suggested that assassination has little lasting effect, a view reflected in the
historical analysis of Hudson (2000) and captured more broadly in the historical theories of
Marx, Tolstoy, and others, which see individual leaders as incidental in the path of history. But
in some historical discourse political murders play central roles. In the 20th century, the murder
of Archduke Ferdinand is often described as the triggering event of World War I; more recently,
1 Moral and legal debates over assassination stretch through history. Dante condemned Brutus for the murder of Cesar, but Cicero and others have been more kind (Miola 1985). An ethical basis for “tyrannicide” was promulgated by John of Salisbury in the 12th century and further articulated by Milton in the late Renaissance (e.g. Nederman 1988). In the United States, government-sponsored assassination was not formally outlawed until 1976, and here only by Executive Orders that are themselves the subject of renewed debate. 2 Our objective therefore differs substantially from other papers in the small econometric literature on assassinations of political leaders, notably Feierabend et al. (1971) and Iqbal and Zorn (2003), which examine where assassinations occur rather than their impact. Of more relevance is Zussman and Zussman (2006), which studies the effect of assassinations of senior members of Palestinian organizations conducted by Israel on same-day returns in the Tel Aviv 25 stock index.
3
the murder of President Habyarimana may have unleashed the Rwandan genocide. Historians
have argued that the Vietnam War was prolonged by the assassination of President Kennedy
(Halberstam, 1972, Jones, 2003), and that halting steps toward democracy in South Korea came
through the assassination of Park Chung Hee (e.g. Fowler 1999).
Analyzing the effects of assassination is difficult. While some assassinations may appear
to be associated with historical turning points, the direction of causation is difficult to establish,
especially since assassination attempts often occur (as we will show) in times of crisis, such as
during war. Yet we can still make progress in understanding the causative effects of
assassinations. To do so, we employ a large set of assassination attempts and use the “failures”
as controls for the “successes”. In order to focus on the cases where the outcome was most
likely determined by chance, we consider only those attempts in which the weapon was actually
used – the gun fired, the bomb exploded, etc. We then compare the average effects of cases
where the leader was killed with the average effects in cases where the leader survived. The
basic identification assumption is that, although attempts on leaders’ lives may be driven by
historical circumstances, conditional on trying to kill a leader the success or failure of the attempt
can be treated as plausibly exogenous. For example, Hitler left the beer hall early in 1939 only
because bad weather prevented him flying back to Berlin, forcing him to leave early for the train.
To implement this strategy, we first collected data on all publicly-reported assassination
attempts for all national leaders since 1875. This produced 301 assassination attempts, of which
61 resulted in the leader’s death. We then use this data to examine the effects of assassination on
two important outcomes: (1) political institutions, measured primarily through the Polity IV
dataset (Marshall and Jaggers, 2004), and (2) military conflict, measured through the Gleditsch-
4
Correlates of War dataset (Sarkees, 2000, Gleditsch 2004) and the PRIO/Uppsala Armed
Conflict Database (Gleditsch et al. 2002).
We find that the assassination of an autocrat leads to substantial changes in the country’s
institutions, while the assassination of a democrat does not. In particular, transitions to
democracy in the Polity IV data are 15 percentage points more likely following the assassination
of an autocrat than following a failed attempt on an autocrat. Similarly, using independent data
on leadership transitions from Archigos (Goemans et al., 2006), we find that the probability that
subsequent leadership transitions occur through institutional means is 18 percentage points
higher following the assassination of an autocrat than following the failed assassination of an
autocrat. The effects on institutions extend over longer periods, with evidence that the impacts on
institutions are sustained at least 10 years later.
Looking at military conflict, the results show that assassinations affect conflict, but only
in limited contexts. In particular, we find little evidence that assassinations lead to the start of
new wars or affect the duration of high-intensity conflicts already underway. We do find,
however that low-intensity conflicts are more likely to continue or intensify following
successful assassinations than following failed assassination attempts. The results suggest that
the ability of assassinations to affect conflict is limited to cases in which the conflict is in an
intermediate stage.
These results tell us about the difference in outcomes following success and following
failure. Our method, which relies on inherent randomness in the outcome of attacks, does not
distinguish whether the effects are driven by successful assassination (e.g., killing an autocrat
leads to more democracy), failed assassination (e.g., trying but failing to kill an autocrat leads to
increased suppression), or both. To tease these different forces apart, we provide further analysis

5
at the end of the paper that uses propensity-score matching methods to estimate the separate
effects of success and failure. We find that most of the effects discussed above are driven by
successful assassinations, rather than failures. These estimates are informative but should also be
viewed as substantially more speculative than our main results, because the decomposition relies
on comparisons between years with assassination attempts and years without such attempts,
which are not randomly assigned.
In sum, the results clearly suggest that assassinations affect institutional change. The
results further emphasize the central role of national leaders in understanding national outcomes,
complementing our earlier work which showed the impact of individual leaders on economic
growth (Jones and Olken, 2005). Like that paper, the primary results here are found only in
autocracies. This finding is natural if autocrats are relatively unconstrained, with significant
authority to alter formal institutions and policies, as opposed to leaders in democracies whose
actions may be limited through electoral recall and institutions such as independent legislatures
and judiciaries (Schumpeter 1950; Downs 1957; Tsebelis 2002).
More broadly, the results point to the individual leader as a cornerstone of national
institutions in autocracies, which suggests mechanisms – through leader selection and leader
change – that can lead to institutional change. This paper thus speaks to the literature on the
origins of institutions (Moore, 1966; North 1990; Engerman and Sokoloff, 2000; Acemoglu et al,
2001; Glaeser and Shleifer 2002), but with an important difference. Much of the existing
literature emphasizes the historical origins of institutions, with distant historical events shown to
predict the emergence of differing institutional norms, which then persist, often over centuries.
In this paper, we focus on a different part of the variance in institutions, emphasizing
contemporary change rather than the early determinants of institutions. In such a view,
6
institutional transition can be understood through the role of individual leaders, from the
influence of Mao in China to Suharto in Indonesia and Lee Kwan Yew in Singapore, from Peron
in Argentina to Pinochet in Chile and Hugo Chavez in today’s Venezuela. Whether or not
individual leaders can produce effects that last for many decades, it appears that individual
leaders are useful objects of consideration for the more immediate and policy relevant questions
of how countries move from one institutional context to another in the medium term.
Lastly, this paper speaks to the role of chance in history. We provide a statistically
driven test for the capacity for small elements of luck to change national political systems and
other outcomes, an idea seen in some broad historical assessments (Merriman 1985, Boorstin
1995, Ferguson 1999) that stand in contrast to Whiggish or Marxist historical interpretation.
This aspect also shares some similarities with literatures that emphasize historical chance in the
initial shaping of institutions, whether it is the disease environment (Acemoglu et al. 2001), wind
patterns (Feyrer and Sacerdote 2006), or other features.
The remainder of the paper is organized as follows. Section 2 presents the data and
descriptive statistics. Section 3 describes the “hit or miss” methodology, presents the central
results regarding institutional change and military conflict, and considers a number of robustness
checks. Section 4 presents the propensity score results to separate out the effect of success from
the effect of failure. Section 5 concludes.
2. Data and Descriptive Statistics
2.1. Data The focus of this paper is on assassinations and assassination attempts directed at the
national leader, where the “leader” is defined as the most powerful political figure in each
country at each point in time – the head of state (usually under the title of President), the head of

7
government (usually under the title of Prime Minister), or perhaps some third figure. We use the
Archigos dataset, v2.5 (Goemans et al., 2006), which identifies these individuals from 1875 to
2004. Archigos provides a baseline data set of 2,440 leaders from 187 different countries.
To build the assassinations data set, we consulted the archives of three major newspapers:
The New York Times, The Washington Post, and The Wall Street Journal. We used a large set of
keyword searches (detailed in the Appendix) and placed several limitations on the returned
results. First, we excluded coup d’etats – cases in which the murder or attempted murder of the
leader was conducted by an individual or group in an attempt to seize power for themselves.
Second, we excluded “uncovered plots” to assassinate leaders, limiting ourselves to cases in
which the would-be assassins actually undertook the attempt. For the main specifications in the
paper, we further restrict our attention to “serious attempts,” which we define as those cases in
which the weapon (the gun, bomb, etc.) was actually discharged, as opposed to cases where the
attempt was thwarted prior to the weapon being used. As shown below, our results are broadly
robust to different restrictions on the nature of failed attempts.
For each assassination or attempted assassination found, we recorded the date and
location of the attack, the weapons used, and the result for the leader, as well as information
when available on other casualties and whether the attack was carried about by a group or solo
actor. The data includes 301 assassination attempts, of which 254 are “serious attempts” and 61
result in the leader’s death. A list of the successful assassinations is presented in Table 1.
To ensure that the data collection methodology captured all relevant assassinations, once
the newspaper searches were complete we cross-referenced the assassinations found by the
searches with all assassinations listed in da Graca (2000), Jones and Olken (2005), and the
8
Archigos data. This exercise showed that our keyword searches produced all relevant
assassinations.3
2.2. Summary Statistics Table 2 provides basic summary statistics. With regard to weapons, guns have been the
most common instrument, used in 52% of attempts, and explosive devices the second most
common, used in 29% of attempts. Guns have kill rates of about 30%, while explosive devices
are much less likely to kill the leader, with success in only 7% of cases. At the same time,
explosive devices produce the greatest number of casualties among bystanders, with the mean
number of dead and wounded seven times larger than for gun attacks. Explosive devices thus
appear to be both a particularly violent and particularly ineffective tool.4
Table 2 further shows that the vast majority of assassination attempts occur in the
leader’s home country, with only 5% occurring outside the national borders. Attempts are
slightly more likely to be carried out by solo assassins than by groups of assassins (58% to 42%).
Both solo and group attacks show a similar propensity to kill the leader, although group attacks
tend to be far bloodier for bystanders.
Figure 1 shows how the frequency of assassination events has evolved with time, plotting
the frequency of attempts and successful assassinations in each decade. Panel A indicates that
the annual rate of assassinations increased in the late 19th and early 20th century, decreased
3 It is more difficult to conclusively assess our effectiveness in capturing assassination attempts; however, there are several reasons to believe that our method was effective. First, we ran the keyword searches sequentially, first with the New York Times, which produced 266 attempts, then the Washington Post, which produced an additional 32 attempts, and then the Wall Street Journal, which produced only 3 additional attempts. The rapidly diminishing returns to further searches suggest that we are accurately capturing publicly-known assassination attempts. Second, as we will show below, the number of attempts produced by these searches turns out to closely track the number of successful assassinations through time. Third, we focus our results on “serious attempts”, where the attack was actually carried out. These attempts are more likely to be reported and thus harder to miss. 4 Yet we also find (in results not reported) that explosive devices are used with increasing regularity through time. This may reflect the fact that bombs can be triggered remotely so that, although less effective as a weapon, bombs put assassin(s) at lower risk of being caught.

9
substantially during the 1940s (perhaps as a result of heightened security during World War II),
and has been at relatively high levels since 1950. Currently, the world witnesses the
assassination of a national leader in approximately two of every three years. Interestingly, the
frequencies of attempts and successes closely track one another. In fact, the conditional
probability of killing a leader given a serious attempt is not trending, remaining at about 25%
through time.
Panel B of Figure 1 presents these frequency patterns again, but normalizes by the
number of countries (and hence the number of national leaders) that exist in a given year. The
rate of attempts and success now appear to fall after 1930, an effect driven by the increasing
number of independent countries in the world. This means that, although the annual rate of
assassinations is currently at historically high levels, the probability that a given leader is killed
in any given year has fallen over the 20th Century. At the peak in the 1910s, a given leader had a
1.2% chance of being assassinated in a given year; today, the probability is 0.4%.
3. Hit or Miss: Identifying the Effect of Assassination
3.1. Empirical approach In this section we investigate the causative effect of assassination. To identify this effect
we employ the inherent randomness in whether an attack is successful or not. For example, John
F. Kennedy did not escape the bullet that killed him, even though it was fired from 265 feet away
and the president was in a moving car (Warren et al., 1964). But Idi Amin did survive an attack
in 1976, when a thrown grenade bounced of his chest and killed several bystanders.
In our main specifications we examine OLS regressions of the form:
i i i iy SUCCESS Xβ γ ε= + + (1)
10
where i indexes a country-year in which there is an assassination attempt, yi is an outcome of
interest (primarily institutional change or change in war status), SUCCESS is a dummy equal to 1
if a leader is killed in that country and year and 0 if the leader survives any attempts, and Xi is a
vector of other regressors. The key identifying assumption is that we can treat SUCCESS as
exogenous conditional on observables. Then [ ]| , 0SUCCESS Xε =E , and we can write the
average treatment effect as
[ ] [ ]| 1, | 0,y SUCCESS X y SUCCESS Xβ = = − =E E (2)
This expression makes clear that estimates of (1) identify the difference between
successful assassinations and failed assassination attempts. We thus answer the precise question:
what is the effect of killing versus failing to kill the leader? If hypothesis tests reject that β is
zero, then the outcome of the attempt matters, and more broadly, we can reject the idea that
assassinations do not change the course of history. Note, however, that we cannot tell whether
the effect of assassinations we identify comes from the effects of killing the leader, failing to kill
the leader, or both. In Section 4 below, we use propensity-score matching methods to tease out
whether β is driven primarily by successful or failed assassinations, but since assassination
attempts are non-random, that analysis is necessarily more speculative than the analysis
presented here.5 We therefore focus first on the better-identified question of whether national
outcomes differ depending on the success or failure of assassination attempts.
3.2. Is Success Exogenous Conditional on Attempts? The key identification assumption for the main analysis is that, conditional on a serious
attempt taking place, the success of the attempt – i.e., where the bullet hits, where the target is
standing when the bomb explodes, etc. – is uncorrelated with the error term in (1). To investigate 5 As a preview, we find below that failed assassinations appear to have little effect on institutional change; hence, the results suggest that it is primarily the killing of leaders that appears to drive change.
11
this assumption, we first ask whether observable variables that might be related to the error term
in (1) predict SUCCESS conditional on attempt.
As discussed above, one variable that we know predicts success is the type of weapon
used in the attack. In particular, attempts that use explosive devices are much less likely to lead
to a leader’s death than attempts that use other weapons. For this reason, all specifications in the
analysis below will include weapon fixed effects, although it turns out that the inclusion or
exclusion of weapon fixed effects does not affect the results.
To investigate whether other variables predict successful assassinations, we present in
Panel A of Table 3 the mean values of a number of variables in the year prior to successful and
failed assassination attempts, as well as the result from two-sided t-tests for the equality of these
means. The table shows that the sample of successful and failed assassination attempts is
balanced across a wide variety of variables: a dummy for whether the country was democratic or
not (defined using the POLITY2 variable from Polity IV) and recent changes therein the status of
war or recent changes therein (from the Gleditsch-COW war data), the age of the leader, the
tenure of the leader, and log per-capita energy consumption, which serves as a proxy measure for
per-capita income.6 The only result in Table 3 where the difference between successes and
failures is statistically significant is the log of national population (p-value 0.06); however, given
that we have examined 8 variables, it is natural that one be statistically significant at the 10
percent level.
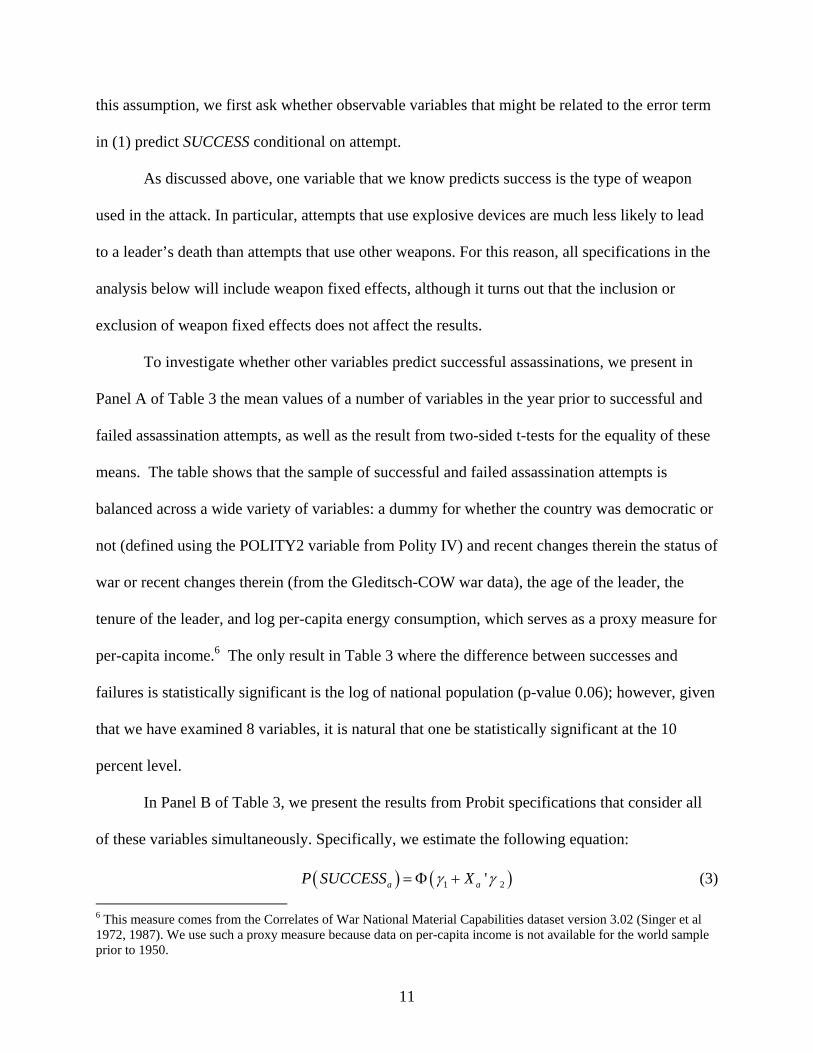
In Panel B of Table 3, we present the results from Probit specifications that consider all
of these variables simultaneously. Specifically, we estimate the following equation:
( ) ( )1 2'a aP SUCCESS Xγ γ= Φ + (3) 6 This measure comes from the Correlates of War National Material Capabilities dataset version 3.02 (Singer et al 1972, 1987). We use such a proxy measure because data on per-capita income is not available for the world sample prior to 1950.
12
where a is an assassination attempt and X are the same variables considered in Panel A. We
present specifications with and without weapon fixed effects, and also with and without fixed
effects for the region of the world where the attack takes place. When considering all of the
variables in Table 3 jointly, their joint p-value ranges from 0.30 to 0.69, depending on which
fixed effects are included.7 In the robustness analysis below (see Section 3.4), we show that the
inclusion or exclusion of all of these variables as controls leaves the results virtually unchanged.
Combined, the relative lack of predictability of SUCCESS, and the invariance of the results to
adding controls for SUCCESS, suggests that the identification assumption is plausible.
3.3. Main results In this section we present our main results. To test hypotheses, we consider both
parametric and non-parametric specifications. First, we estimate (1) using OLS with robust
standard errors, adjusted for clustering at the country level. Adjusting for clustering at the
country level helps account for potential serial correlation of the error term in the event that there
are multiple attempts in the same country. In the OLS specifications, we include fixed effects for
the weapon used, to take into account the differential success probabilities of different weapons,
as discussed above. We also include fixed effects for the number of attempts in a given country-
year. We do this because, even if the success or failure of a given attempt is exogenous, as the
evidence above suggests, the likelihood of success on an annual basis is increasing in the number
of attempts, so that the probability of success in a given year is only exogenous if we condition
on the number of attempts that took place.8
7 If we use the linear POLITY2 variable instead of the democracy dummy, the joint p-values range from 0.09 to 0.31, with the linear variable significant in some specifications. The results in the paper are also robust to including this linear POLITY2 variable as a control instead of the dummy version. 8 In any case, the inclusion or exclusion of weapon fixed effects or number-of-attempt fixed effects has no material effect on the results.

13
Second, we report the results of non-parametric tests. For cases where the dependent
variable takes a small number of potential outcomes, we report the results of the Fisher exact test
(Fisher 1935; Pagano and Halvorsen, 1981), which has exact small sample properties. This test
takes the marginal distribution of each variable as given and calculates the probability that the
actual association found, or a tighter association, could be produced by chance. This test is exact
because it calculates the exact probability of each permutation of the variables, which is a finite
set.9 For variables that take a large number of values, we calculate non-parametric p-values from
the Wilcoxon (1945) rank-sum test. In this test, the outcomes from successful and failed
assassinations are pooled and jointly ranked. The test-statistic is the sum of the ranks for the
successes. Wilcoxon shows that the sum of the ranks is normally distributed, and gives formulas
for the mean and variance of the sum of the ranks, under the null hypothesis that the two samples
are drawn from identical distributions.
3.3.1. Political Institutions To investigate the effect of assassination on political institutions, we consider two
measures of institutions. The first measure is a dummy variable for political institutions, where 1
indicates democracy and 0 indicates autocracy. This variable is a binary version of the
POLITY2 variable from the Polity IV dataset.10,11 The second measure, which is derived
9 For example, if success occurs in 61 of 254 cases, and an outcome variable changes in say 25 of 254 cases, one can calculate the probability for each possible permutation of these two variables in a 2x2 matrix (e.g. the probability that 22 of the successes correspond to 12 of the outcome changes). By considering every possible permutation of success and the outcome, one can calculate the cumulative probability that the actual association witnessed, or some even tighter association, was produced purely by chance. This is the reported P-value. 10 Specifically, we define autocracy as cases where the POLITY2 variable is less than or equal to zero and democracy as cases where the POLITY2 variable is greater than zero. The POLITY2 variable itself has 20 categories, 10 for autocracy and 10 for democracy, but it is not clear how meaningful the finer distinctions in this index are, especially since the POLITY2 index is not coded according to obvious objective criteria. For this reason, we focus on the clearer binary distinction of this measure for our main results. In results not reported, we find broadly similar results when using changes in the linear index as the outcome measure. 11 We have also considered other measures in the Polity IV data (in results not reported but available from the authors). These include the variable XCONST, which measure the degree of executive constraints on the leader, POLCOMP, which measures political competition – the extent to which alternative political preferences can be both

14
independently from the Archigos data set, records the percentage of leader transitions over the
following twenty years (excluding the leader in power at the time of the attempt) that are
“regular” – i.e. proceed lawfully -- as opposed to irregular transitions such as coups.12
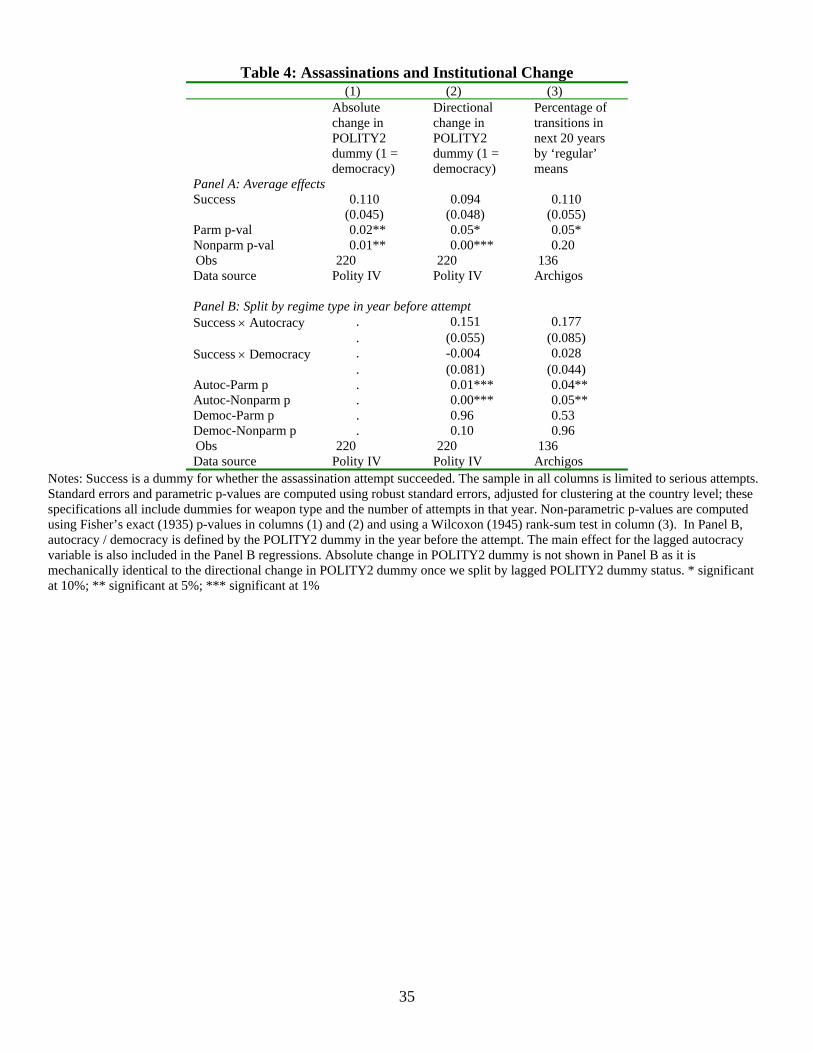
Table 4 presents the main results, comparing changes in the democracy measures from
the year before the assassination attempt to the year after. In column (1) we examine whether
there are changes in institutions (in one direction or another) following assassinations. The
dependent variable in column (1) takes the value 1 if the regime switched democracy/autocracy
status and 0 otherwise. We see that changes between regimes are 11 percentage points more
likely when the leader is killed than when the leader survives the attack. These results are
statistically significant using both the parametric and non-parametric hypothesis tests. In column
(2) we consider whether assassinations lead systematically in the direction of democracy or
autocracy. Here, the dependent variable takes the value 1 if a regime switched from autocracy to
democracy, -1 if the regime switched from democracy to autocracy, and 0 if no change occurred.
The results show that, on average, successful assassinations lead toward democracy. This result
is also statistically significant with both parametric and non-parametric tests. Lastly, column (3)
shows that successful assassinations raise the probability that future leader transitions occur
lawfully by 11 percentage points. This last measure operates on an objective criterion,
expressed and pursued, and the linear POLITY2 measure. POLCOMP is intended to refer to aspects of the political regime other than the power of the executive (which is captured by XCONST). We find that these measure produce broadly similar results to those presented in the tables. 12 Archigos defines a regular leader transition as one that occurs according to explicit rules or established conventions. Following Archigos, we exclude cases in which leader transitions occurred due to deaths in office due to natural causes or accidents, though including them as either ‘regular’ or ‘irregular’ does not substantively change the results. Calculating the percentage of regular transitions over all transitions 1-20 years after the attempt (as opposed to excluding the target of the attempt) produces stronger results than those reported in the table.

15
leadership transition, from a source entirely independent of the Polity IV data, and thus helps
validate the Polity IV results.13
Panel B of Table 4 presents the effect of assassination conditional on the initial nature of
the regime. Importantly, we find that the effects are limited to autocracies. The successful
assassination of an autocrat creates a highly significant 15% increase in the probability of
democratic transition, compared to the case where the assassination attempt failed. Meanwhile,
the successful assassination of democrats produces no change in institutions using the Polity IV
measure. Democratic institutions thus appear robust to the assassination of leaders, while
autocratic regimes are sensitive to changes in leadership. These results for autocrats are highly
significant using both parametric and non-parametric tests. Similar results are obtained using
future leadership transitions as the criterion – successful assassination of autocrats creates an 18
percentage point relative increase in the probability that future leadership transitions occur by
regular means.
Table 5 breaks down these effects by the tenure of the leader at the time of the attempt
and by the duration of the effect. Each cell reports the coefficient on SUCCESS from a separate
regression, where the sample is shown in the column and the duration of the change used to
calculate the dependent variable is shown in the row. The top panel indicates that the short-run
move to democracy is particularly large following the assassination of long-tenured autocrats, for
whom a successful assassination increases the probability of democratic transition in the next
year by 20 percentage points relative to a failed assassination. The distinction between tenure is
less clear with time however. The most interesting result in this table is that democratic
13 One potential critique of the Polity IV measures is that the Polity analysts may have used changes in leadership to demarcate underlying changes in institutions. This concern, however, does not apply to the percent of regular transitions variable from Archigos. The fact that we obtain similar results using the percent of regular transitions variable suggests that coding decisions are not driving the results.

16
transitions following assassinations of autocrats appear to be sustained 10 years later. The point
estimate suggests that initially autocratic regimes are 18 percentage points more likely to be
democracies 10 years after the attempt if the assassination succeeded rather than failed. Twenty
years into the future, however, the results are substantially attenuated using the binary Polity IV
measure.
Panel B of Table 5 considers the probability that future leader transitions are regular. Of
particular note is the last row, where we limit ourselves to leadership transitions that occur
between 11 and 20 years after the assassination attempt. These results show that, following a
successful assassination of an autocrat, leadership transitions 11 to 20 years after the attempt are
22 percentage points more like to be regular. Following a successful assassination of a long-
tenured autocrat, leadership transitions 11 to 20 years after the attempt are 39 percentage points
more likely to be regular, though this result is only statistically significant in the non-parametric
specification. Combined, these results suggest that assassinations have substantial and at least
somewhat prolonged effects on institutions.
3.2.2 War To investigate the effect of assassinations on war, we use two datasets on conflict: the
Gleditsch (2004) revision of the Correlates of War dataset (Sarkees 2000), and the PRIO/Uppsala
Armed Conflict dataset, version 4 (Gleditsch et al. 2002, PRIO 2006). The Gleditsch-COW
dataset contains data on all armed conflicts with over 1000 battle deaths per year from 1816-
2002, and to the best of our knowledge is the only dataset with worldwide coverage on conflicts
for the entire time period we consider. The data indicates whether a war exists for a given nation
in a given year and, if a war exists, the type of war (civil, inter-state, et cetera). The PRIO dataset
contains more information – it contains data on all armed conflicts with over 25 battle deaths per
17
year and further describes the conflict intensity, indicating whether a conflict had 25-999 battle
deaths or 1000 plus battle deaths in a given year.14 The coverage of the PRIO dataset, however,
only begins in 1946, which is why we examine both datasets.15
Table 6 examines the immediate effect of assassination on war status. The dependent
variable is the difference in war status of a country 1 year after assassination attempts compared
to 1 year before. We examine both all wars and civil wars. The first two columns present the
results for the full sample, using all attempts from 1875-2002 and the Gleditsch-COW data. The
second set of two columns presents the results again but restricting the Gleditsch-COW data to
the postwar period (1946-2002). The final set of two columns present the results using the PRIO
data for the same sample (1946-2002). Table 7 investigates longer run effects; here the
dependent variable is the difference in war status of a country 5 years after the attempt compared
with 1 year before.
In the Gleditsch-COW data, we find no evidence that successful assassinations lead to an
increase in conflict relative to failed assassinations. This is true in the short run (Table 6) and
longer run (Table 7). It is also true whether we consider the entire sample or focus on the post-
war period. The PRIO results, however, tell a very different story. Here the successes lead to an
increase in conflict relative to failures. The results are typically significant using both parametric
and non-parametric results. Moreover, the point estimates suggest large effects, with successful
assassination producing a 16% greater chance that war continues the following year compared to
failed assassination attempts. This effect is also seen over a five-year interval.
14 We define the PRIO variable to be 0.5 if a small conflict is taking place, 1 if a large conflict is taking place, and 0 otherwise. 15 Although in theory Gleditsch-COW and PRIO should agree on conflicts with over 1,000 battle deaths in a given year, Gleditsch (2004) notes that they do not. Although he makes some changes to the COW data to clarify the coding, the two datasets are still not identical.

18
The difference between these two sets of results is driven by the fact that PRIO captures
small, low-intensity conflicts whereas Gleditsch-COW does not. In particular, if we restrict the
sample to the 31 cases in 1946-2002 where a high-intensity conflict was in progress at the time
of the assassination attempt, the coefficient on success falls from a statistically significant 0.259
to a very insignificant 0.046. By contrast, if we restrict the sample to the 25 cases in 1946-2002
where a low-intensity conflict was in progress at the time of the assassination attempt, the
coefficient on success is 0.309, driven both by a higher probability the war intensifies and by a
lower probability the war ceases.
The net effect of both war intensification and the failure of war to cease can be seen in
Panel B of Tables 6 and 7. Here, conditional on being at war, the differential effect of success
and failure shifts nations substantially toward more conflict, with a 25% shift toward intense war
on average. At the same time, successful versus failed assassination appears to play little or no
role in starting conflicts.
In sum, these results suggest a broad pattern where assassination can affect the duration
and intensity of low-level conflicts. Yet assassination does not appear relevant to the outright
cessation of intense conflicts, judging by the Gleditsch-COW data. These are somewhat subtle
results, suggesting an important role of assassination for conflict, but in limited circumstances.
We will consider further interpretation of the conflict results in Section 4 below.
3.4. Robustness Checks and Additional Specifications Our main results feature both parametric and non-parametric tests, and thus confront
alternative specifications of the error process. In this section we further consider a number of
robustness checks based on alternative specifications of assassination events and the inclusion of
observable variables.
19
Table 8 reconsiders the main results for institutional change. For comparison, the top
panel summarizes the baseline results from Table 4, where we compared successful assassination
against failed ‘serious attempts,’ which are defined as those attempts in which the weapon was
actually used in an attempt to kill the leader. The next four panels consider different ways of
defining the comparison group of failed assassination attempts. We see that further limiting the
set of serious attempts to cases where there were casualties – i.e. where the target or a bystander
sustained wounds – produces similar results as the main specification. Further limiting the
control group to cases where the leader specifically was wounded (but not killed) reduces the set
of failed attempts by 70%, leaving only 40 failures. When we focus on this more limited sample,
the results tend to lose some significance, though some results remain statistically significant and
overall the point estimates do not change substantially. The next panel uses the full set of
attempts, as opposed to serious attempts, and produces similar results as the main specification.
Finally, we try limiting the observations to the first attempt on a given leader. While this cuts the
sample size down, most results remain significant and the point estimates do not change
substantially from the main specification.
The second to last panel of Table 8 tries a somewhat different specification. We return to
the baseline specification but add as controls all of the variables in Table 3, as well as time
(quarter-century) and region fixed effects. These results are similar and even slightly stronger
than our main specification.
In results not reported in the table (but available from the authors on request), we have
also conducted the same set of robustness checks on the war results. As with the results on
institutional change, we find that the war results are essentially similar to the results in the main
20
specifications if we consider alternate control groups (bystanders wounded, target wounded, or
all attempts), consider only first attempts, or add the full set of controls.
The last panel of Table 8 considers the effects of natural leader deaths, as opposed to
assassinations. We find no effect of natural leader deaths on institutional change using these
measures. The differences between assassinations and natural leader deaths – both of which
imply leadership change – suggests that there may be important heterogeneity between these two
types of leader transitions. In fact, in results not reported, we find that natural leader deaths do
lead to significant institutional changes when the leader is an extreme autocrat (a POLITY2 score
in the lowest 20th percentile), but appear to have no effect on institutions otherwise. By contrast,
successful assassinations, compared to failed assassinations, show particularly strong effects
when the target is a more moderate autocrat (a POLITY2 score between the 25th and 50th
percentile). One interpretation is that assassination has relatively strong effects when regimes
are within reach of democracy, suggesting an important interaction between assassination and
the social context. The results for natural leader deaths meanwhile suggest that leaders have
greater influence on institutions the greater the degree of autocracy, so that institutional change is
likely following the death of extreme autocrats, even without the aid of conditions that provoke
assassination attempts.
4. Distinguishing Between Success and Failure The results thus far suggest that assassinations have important effects. These effects are
identified using inherent randomness in whether an attack is successful, showing significant
differences in outcomes comparing successes and failures. It may be natural to presume that the
“successes” – where the leader dies – are more important drivers of change than the “failures”,
since success automatically produces changes in leadership while failure does not. However, it
21
is also possible that failed attempts change outcomes; for example, an autocrat who survives an
assassination attempt may impose crackdowns on opposition groups, leading a country further
from democracy.
In this section we consider the separate effects of success and failure. Identifying these
effects separately is necessarily more speculative than identifying the difference between them.
The challenge is that, while the path of a bullet may be driven largely by chance, attempts
themselves do not occur at random. As a result, the absolute effects of successes and the absolute
effect of failures may be conflated with changes that would have occurred anyway, and which
are correlated with the probability that an attempt took place. For example, if attempts on
autocrats are more likely in autocracies that are in the process of liberalizing, one might
erroneously attribute a subsequent democratization that would have happened anyway to the
effect of a successful or failed assassination.
That said, one can make some headway on this issue by employing a propensity-score
matching approach. We use observable features of the national context to predict when
assassination attempts will occur and then stratify the sample according to these features. We are
therefore making comparisons between years with assassination events and years without such
events within comparable contexts. While this approach is not perfect, and does not solve the
problem if assassination attempts are correlated with unobservable variables that also predict
subsequent outcomes, it does provide a flexible approach to dealing with selection on
observables.
To implement this approach, we first estimate equations of the form
( ) ( )'i iP ATTEMPT X ρ= Φ (4)
22
which allow us to predict attempts conditional on observables. Based on the predicted
probabilities from (4), we form blocks, denoted by b, for different levels of the propensity score,
and check that the covariates are all balanced between treatments and controls within each block.
We then estimate regressions of the form
'ib b s ib f ib ib iby SUCCESS FAILURE Xα β β γ ε= + + + + (5)
where αb indicates fixed effects for each propensity score block.
4.1. Predicting Assassination Attempts We start by considering whether assassination attempts are predictable and find that they
are – and in interesting ways. Table 9 shows the results of estimating (4). The annual rate of
assassination attempts is 0.7 percentage points higher in autocracies than in democracies. The
baseline probability of an attempt in a given country-year is 2.3%, so this implies that autocrats
are approximately 30% more likely to be the target of attacks in a given year. Attacks are also
2.6 percentage points more likely during wartime - more than twice the background probability –
which makes war a particularly powerful predictor of assassination attempts.
Interestingly, these results are consistent with the results in Section 3, which showed that
assassinations of autocrats had an impact on institutional change, and that assassinations had an
impact on wars that were in progress. The results here suggest that potential assassins may
understand that assassinations against autocrats or wartime leaders are more likely to have an
effect, and hence are more likely to attempt to kill precisely those leaders where it would make a
difference.16
16 These results are broadly consistent with the findings of Iqbal and Zorn (2003), who consider predictors of successful assassinations since World War II and find, as we do, that political institutions and war predict assassination. Their study is limited to the question of predicting assassination events, and considers a different set of events by including political leaders who are not the primary political leader and including coups that result in the leaders’ murder (they also focus on successful assassinations only, as opposed to assassination attempts). They find that assassinations occur most frequently in more intermediate regimes that are neither well established democracies
23
Another interesting result that emerges in Table 9 is that attempts are more common in
countries with larger populations; doubling the population increases the probability of an
assassination attempt each year by 0.28 percentage points. Though this may seem like a small
effect, this implies that the leader of a country the size of the United States (population 300
million) is 1.4 percentage points, or about 75 percent, more likely to be assassinated each year
than the leader of a country the size of Switzerland (population 7.5 million). This population
effect is sustained in a multivariate context, so that it does not appear to proxy for per-capita
income, institutions, or war status. One natural interpretation is that the number of would-be
assassins rises with a country’s population, whereas there is only one leader in each country. The
ratio of would-be assassins to leaders, and hence the probability of an attempt, therefore
increases with population. The results in Table 9 also indicate that assassination attempts are also
somewhat less likely in richer countries, as measured by energy intensity. Note that, in results
not reported in the table, both the population and the energy intensity results are unchanged when
we include decade fixed effects, so that these results are not being driven by growth in
population or income over time.
4.2. The Roles of Success and Failure Given these predictors of assassination attempts, Table 10 presents separate estimates for
the effects of success and failure, relative to comparable years in which there was no
assassination attempt, using equation (5). For each dependent variable, we present three
specifications. In the first column, we present the regression with no controls. In the second
column, we include all of the controls in Table 9, which we have seen have substantial predictive
or extreme autocracies. This distinction is only weakly reflected in our sample over the 1875-2004 period, although it appears somewhat more strongly over the 1946-2002 period, with the particular result that mild autocrats (those with POLITY2 scores between the 25th and 50th percentile) are unusually likely to be targets of attacks. This result may further suggest a rational understanding among would-be assassins that certain regimes are more likely to be influenced by assassination.

24
power for assassination attempts. In the third column, we include these controls again but
further stratify the sample using propensity score matching.17 As is evident in the table, adding
the controls and the propensity score matching has a negligible effect on the estimates.
We find several interesting results. Keeping in mind the caveats about identification in
this section discussed above, we see that most of the effects identified in Section 3 above appear
to be driven by successful assassinations, though there are some cases in which failures may
have effects. The first three columns on Table 10 investigate the absolute value of changes in the
POLITY2 dummy. The results here suggest that it is successful assassinations that are driving
the results. Similar insight is provided by the second set of columns, which consider moves
toward democracy. Successful assassination increases the probability of democratic transition in
the next year by 14 percentage points compared to years without assassination events, while
failed assassinations suggest a modest 1-2 percentage point fall in the probability of democratic
transition. If this is actually representing the true causal effect of a failed assassination (as
opposed, perhaps, to selection effects not controlled for perfectly with the propensity score
methodology), then this would suggest that autocrats do tighten their grip on power after failed
assassination attempts, as least slightly. These directional effects are reflected further when we
consider the percentage of “regular” leader changes in the ensuing 20 years. Here successful
assassinations of autocrats are associated with 16-21 percentage point increases in the percentage
of regular future leader transitions, while failure is associated with a statistically insignificant 3-6
percentage point declines in the percentage of such leader transitions.
In sum, the institutional changes identified in Section 3 appear to decompose into (a)
substantial roles for success and (b) smaller, and generally statistically insignificant, roles for
17In results not reported in the table, we find that alternate methods of propensity score estimation, such as kernel density matching and nearest-neighbor matching, produce qualitatively similar results in almost all cases.
25
failure. The results are quite consistent across specifications, so that controlling for observables,
and propensity score matching, do not appear critical to the results. This suggests that, to the
extent that the observable variables used in the propensity score form an important part of the
selection of when attempts take place, these selection effects are not driving the results. Of
course, it is impossible to know whether the effects of failures we pick up are driven by selection
on unobservables, but the fact that controlling flexibly for the observable predictors of attempts
makes no difference whatsoever provides at least suggestive evidence that the estimates are, in
fact, identifying the effect of failures rather than a pure selection effect.
Given that only 25% of assassination attempts are successful, if we take the point
estimates in Table 10 literally, they imply that the average effect of assassination attempts on
democracy is only modestly positive ex-ante, if positive at all. In particular, the results imply
that one would expect an 8 percentage point move toward democracy if the assassination
succeeds (approximately 25% of the time), and a 2.5 percentage point move towards autocracy
with failure (approximately 75% of the time), suggesting an approximately zero net effect on
average. Focusing on autocrats, meanwhile, suggests a modest, positive move to democracy in
expectation, with the point estimates implying a 2-3% ex-ante increased probability of
democratization from assassination – far smaller than the 15-20% average move to democracy
conditional on success. Thus, a policy of assassination attempts creates risk – it increases the
probability that there will be a change in a country’s institutions – but if the probability of an
attempt succeeding is 25%, there are at most modest gains in democracy on average.
The results on war, presented in Table 11, are more ambiguous. The first three columns
of Table 11 (based on the Gleditsch-COW data from 1875-2002) indicate that if a country is
already involved in a serious conflict, a successful assassination can hasten the end of that

26
conflict, with failed assassination attempts having little effect. By contrast, the last three columns
of Table 11 (based on the PRIO data from 1946-2002) indicate that if a country is already at war,
a failed assassination can hasten its end, with successful assassinations having relatively little
impact. Looking at cases where the country is not at war, the results – using both data sets –
suggest that both successes and failures lead to an increase in conflict. Taken literally, this
suggests that the act of an assassination attempt provokes conflict, regardless of the attempt’s
success. However, it is also possible that this result reflects the inability of the propensity score
matching techniques to adequately predict assassination attempts in the context of incipient war,
particularly if we view the assassination attempt as the opening shot of war.18
Overall, the war results make clear that assassinations can affect the outcomes of wars in
progress, and that there may be substantial heterogeneity in the nature of these effects both
across time and across types of conflicts. This heterogeneity may reflect the complex nature of
conflict – after all, it is unlikely that a structural model of conflict would yield a single
‘assassination’ parameter that would be constant across time and types of conflict. However,
unpacking the precise nature of this heterogeneity is difficult given the relatively small numbers
of assassination attempts involved here.
5. Conclusion This paper examines the effect of assassination on the evolution of political institutions
and military conflict. Using a novel data set of assassinations and assassination attempts against
national political leaders from 1875 to the 2004, we employ inherent randomness in the success
and failure of assassination attempt to identify whether these events affect national outcomes.
We find that the successful assassination of autocrats produces institutional change - 18 For example, on the eve of the current Iraq war the US government actively sought to kill Saddam Hussein through targeted bombing.
27
substantially raising the probability that a country transitions to democracy. This
democratization effect is sustained ten years later. The results for war are less systematic, with
some evidence that assassination influences the duration and intensity of existing, small-scale
conflict. There is little evidence that assassination produces intense conflict where none existed,
or that assassination brings intense conflict to a close.
In sum, these results show that assassinations affect political institutions and conflict.
Whether or not assassinations change “the history of the world” in Disraeli’s words, they
certainly appear to change the history of individual countries. Our tests provide evidence that
small elements of randomness - the path of a bullet, the timing of an explosion, small shifts in a
leader’s schedule - can result in substantial changes in national outcomes. Our findings further
suggest that individual autocrats appear to be cornerstones of national institutions,
complementing the literature on institutional origins by showing an important component of
institutional change that lies not in distant history but in contemporary hands.
28
References Acemoglu, Daron, Johnson, Simon, and Robinson, James A. “The Colonial Origins of
Comparative Development: An Empirical Investigation,” American Economic Review, December 2001, 91, 1369-1401.
Boorstin, Daniel L. Cleopatra’s Nose, Random House: New York, 1995. da Graca, John V. Heads of State and Government, 2nd Edition, St. Martin’s Press: New York,
2000. Downs, Anthony. An Economic Theory of Democracy, New York: Harper and Row, 1957. Engerman, Stanley L. and Kenneth L. Sokoloff. “History Lessons: Institutions, Factor
Endowments, and Paths of Development in the New World“, Journal of Economic Perspectives, 14 (3), 2000, 217-232.
Feierabend, Ivo K., Rosalind L. Feierabend, Betty A Nesvold, and Franz M. Jaggar. Political
Violence and Assassination: A Cross-National Assessment“ in William J. Crotty (ed.) Assassinations and the Political Order, Harper and Row: New York, 1971, 54-140.
Ferguson, Niall (ed.) Virtual History: Alternatives and Counterfactuals. New York: Basic
Books. 1999. Feyrer, James and Bruce Sacerdote. “Colonialism and Modern Income – Islands as Natural
Experiments,” NBER Working Paper #12546, 2006. Fisher, Ronald A. “The Logic of Inductive Inference”, Journal of the Royal Statistical Society,
98 (1), 1935, 39-82. Fowler, James. “The United States and South Korean Democratization”, Political Science
Quarterly, 114 (2), 1999, 265-89. Glaeser, Edward L. and Andrei Shleifer. “Legal Origins”, Quarterly Journal of Economics, 117
(4), 2002, 1193–1230. Goemans, Hein, Kristian Gleditsch and Giacomo Chiozza. “Archigos: A Database of Leaders
1875-2004”, http://mail.rochester.edu/~hgoemans/data, 2006. Gleditsch, Kristian S. “A Revised List of Wars Between and Within Independent States, 1816-
2002,” International Interactions, 30, 231-262, 2004. Data available at http://privatewww.essex.ac.uk/~ksg/expwar.html.
Gleditsch, Nils P.; Peter Wallensteen, Mikael Eriksson, Margareta Sollenberg & Håvard Strand.
“Armed Conflict 1946-2001: A New Dataset.” Journal of Peace Research, 39(5): 615-637, 2002.
29
Halberstam, David. The Best and the Brightest, Random House: New York, 1972. Hudson, Miles. Assassination. Sutton Publishing: Thrupp, 2000. Iqbal, Zaryab and Christopher Zorn. “The Political Economy of Assassination: 1946-2002”,
mimeo, Department of Political Science, Emory University, 2003. Jones, Howard. Death of a Generation: How the Assassinations of Diem and JFK Prolonged
the Vietnam War, Oxford University Press: Oxford, 2003. Jones, Benjamin F. and Benjamin A. Olken. “Do Leaders Matter? National Leadership and
Growth Since World War II”, Quarterly Journal of Economics, 120 (3), 2005, 835-864. Lentz, Harris M. III. Assassinations and executions : an encyclopedia of political violence, 1865
through 1986. Jefferson, NC: McFarland & Company, 1988. Lentz, Harris M. III. Heads of States and Governments: A Worldwide Encyclopedia of Over
2,300 Leaders, 1945 through 1992. Jefferson, NC: McFarland & Company, 1994. Lentz, Harris M. III. Encyclopedia of heads of States and Governments, 1900 through 1945.
Jefferson, NC: McFarland & Company, 1999. Lentz, Harris M. III. Assassinations and executions : an encyclopedia of political violence, 1900
through 2000. Jefferson, NC: McFarland & Company, 2002. Marshall, Monty G., and Jaggers, Keith. Polity IV Project, Integrated Network for Societal
Conflict Research Program and Center for International Development and Conflict Management, University of Maryland, 2004.
Merriman, John. For Want of a Horse: Choice and Chance in History. Lexington, MA : Stephen
Greene Press, 1985. Miola, Robert S. “Julius Cesar and the Tyrannicide Debate”, Renaissance Quarterly, 38 (2),
1985, 271-289. Moore, B. Jr. Social Origins of Dictatorship and Democracy: Lord and Peasant in the Making of
the Modern World, Beacon Press: Boston., 1966. Nederman, Carey J. “A Duty to Kill: John of Salisbury’s Theory of Tyrannicide”, The Review
of Politics, 50 (3), 1988, 365-389. North, Douglass C. Institutions, Institutional Change, and Economic Performance, Cambridge
University Press: Cambridge, 1990.

30
Pagano, Marcello and Katherine T. Halvorsen. “An Algorithm for Finding the Exact Significant Levels of r x c Contingency Tables”, Journal of the American Statistical Association, 76, 931-934.
PRIO, Armed Conflict Data Version 4-2006b. Available at http://new.prio.no/CSCW-
Datasets/Data-on-Armed-Conflict/UppsalaPRIO-Armed-Conflicts-Dataset/. Sarkees, Meredith R. “The Correlates of War Data on War: An Update to 1997,” Conflict
Management and Peace Science 18 (1), pp 123-144, 2000. Schumpeter, Joseph R. Capitalism, Socialism, and Democracy, New York: Harper and Row,
1950. Singer, J. David, Stuart Bremer, and John Stuckey, “Capability Distribution, Uncertainty, and
Major Power War, 1820-1965,” in Bruce Russett (ed.), Peace, War, and Numbers. Beverly Hills: Sage, pp. 19-48, 1972.
Singer, J. David. “Reconstructing the Correlates of War Dataset on Material Capabilities of
States, 1816-1985,” International Interactions 14, pp. 115-32, 1987. Tsebelis, George. Veto Players: How Political Institutions Work, New York: Russell Sage
Foundation, 2002. Warren, Earl, et al, Report of the President’s Commission on the Assassination of President John
F. Kennedy. Washington: United States Government Printing Office, 1964. Wilcoxon, F. “Individual Comparisons by Ranking Methods”, Biometrics 1, pp. 80-83, 1945.
Zussman, Asaf and Noah Zussman. “Assassinations: Evaluating the Effectiveness of an Israeli Counterterrorism Policy Using Stock Market Data”, Journal of Economic Perspectives, 20 (2), 2006, 193-206.

31
Data collection This appendix describes the method for collecting the assassinations data. For detailed
information about the Archigos, Polity IV, or Correlates of War datasets, and their construction, please see the resources listed in the references.
To find assassinations and assassination attempts, we used the list of primary national leaders from 1875 to 2004 provided by Archigos and ran extensive keyword searches on the archives of major newspapers. The searches examined whether words for assassination type events appeared in close proximity with particular leader and country identifiers. The keywords used to capture the events were:
• EVENT: {assassination, assassin, assassinated, wound, wounded, injure, injured, kill, killed, attack, attacked, attempt, attempted, bomb, bombed, murder, murdered, shot, shoot, stab, stabbed, assault, assaulted, escape, escaped, die, dies, died, perish, perishes, perished, slain}
while the country and leader identifiers were country specific. For example, for Afghanistan we used:
• LEADER: {emir, king, president, prime minister, premier, amir, leader, ruler} • COUNTRY: {Afghanistan, Afghan} Specific country and title names were taken from da Graca (2000), with the keywords
“leader” and “ruler” used in all searches. For some countries, where the generic LEADER keywords returned over 300 articles, we used the names of specific leaders in place of generic titles.
The search results (returned articles) were then examined to determine whether an assassination attempt or assassination had occurred. Information was then collected about the (a) date of the event, (b) outcome for the leader, (c) weapon(s) used, (d) location of the attack, (e) extent of other casualties, and also about (f) whether a solo assassin or group were responsible for the attack.
The searches were first run exclusively on archives of the New York Times and then sequentially on archives of the Washington Post and Wall Street Journal. For each country, different research assistants conducted the searches on each newspaper. Distinctions between assassinations and coup d’etats were determined as necessary through the newspaper articles and through historical resources, primarily Lentz (1988, 1994, 1999, 2002). Summary statistics are presented in Table 2. The codebook and detailed data are available from the authors.

32
Table 1: Assassinations of Primary National Leaders Since 1875
Country of Leader Year of
Assassination Name of Leader Weapon Used Afghanistan 1919 Habibullah gun Afghanistan 1933 Nadir Shah gun Algeria 1992 Boudiaf gun Austria 1934 Dollfuss gun Bulgaria 1943 Boris III gun Burundi 1994 Ntaryamira other Congo (Brazzaville) 1977 Ngouabi gun Congo (Kinshasa) 2001 Kabila gun Dominican Republic 1899 Heureaux gun Dominican Republic 1911 Caceres gun Dominican Republic 1961 Trujillo gun Ecuador 1875 Moreno other Egypt 1981 Sadat gun Greece 1913 George I gun Guatemala 1898 Reina Barrios unknown Guatemala 1957 Castillo Armas gun Haiti 1912 Leconte explosive device India 1984 Indira Gandhi gun Iran 1896 Nasir Ad-Din gun Ireland 1922 Collins gun Israel 1995 Rabin gun Japan 1921 Hara knife Japan 1932 Inukai gun Jordan 1951 Abdullah gun Korea 1979 Park gun Lebanon 1989 Moawad explosive device Madagascar 1975 Ratsimandrava unknown Mexico 1920 Carranza unknown Nepal 2001 Birendra gun Nicaragua 1956 Somoza gun Niger 1999 Mainassara unknown Pakistan 1951 Khan gun Pakistan 1988 Zia other Panama 1955 Remon gun Paraguay 1877 Gill unknown Peru 1933 Sanchez Cerro gun Poland 1922 Narutowicz gun Portugal 1908 Carlos I gun Portugal 1918 Paes gun Russia 1881 Alexander II explosive device Rwanda 1994 Habyarimana other Salvador 1913 Araujo gun Saudi Arabia 1975 Faisal gun Somalia 1969 Shermarke gun South Africa 1966 Verwoerd knife Spain 1897 Canovas gun Spain 1912 Canalejas gun Spain 1921 Dato gun Sri Lanka 1959 Bandaranaike gun Sri Lanka 1993 Premadasa explosive device Sweden 1986 Palme gun Togo 1963 Olympio gun United States 1881 Garfield Gun United States 1901 McKinley Gun United States 1963 Kennedy Gun Uruguay 1897 Idiarte Borda Gun Venezuela 1950 Delgado Gun Vietnam 1963 Diem Gun North Yemen 1977 Al-Hamdi Gun North Yemen 1978 Al-Ghashmi explosive device Yugoslavia 1934 Alexander gun

33
Table 2: Assassination Attempts: Summary Statistics
Probability Leader Killed Bystander Casualties
Obs Percentage All
Attempts Serious
Attempts Mean Killed
Mean Wounded
Type of Weapon Gun 155 52% 28% 32% 1.0 2.6 Explosive device 86 29% 6% 7% 6.9 19.6 Knife 22 7% 9% 15% 0.3 0.5 Other 20 7% 20% 22% 1.1 0.2 Unknown 27 9% 22% 25% 2.2 8.2 Location Abroad 16 5% 19% 21% 3.2 5.9 At home 285 95% 20% 24% 2.8 7.7 Number of Attackers Solo 126 58% 23% 28% 0.7 2.7 Group 92 42% 24% 28% 5.1 9.9 Total Attempts 301 n/a 20% 24% 2.9 7.7
Notes: There are 301 total assassination attempts observed and 254 serious attempts. Serious attempts are defined as cases where the weapon was actually used. Note that the location of the attack is observed in every case, but the type of weapon is observed in 274 cases and the number of attackers observed in 218 cases. For some attempts, multiple types of weapons were used, so that the weapon observation counts sum to 310. Also note that casualties among bystanders are skewed distributions so that the means are much larger than medians.

34
Table 3: Are successful and failed attempts similar? Panel A: Pairwise t-tests of sample balance
Variable Success Failure Difference Pval on Difference Democracy dummy 0.350 0.348 0.002 0.98 (0.062) (0.035) (0.071) Change in democracy -0.034 -0.029 -0.006 0.86 dummy (0.024) (0.021) (0.032) War dummy 0.271 0.316 -0.044 0.51 (0.058) (0.034) (0.068) Change in war 0.035 0.011 0.024 0.72 (0.056) (0.035) (0.066) Log energy use per capita -1.617 -1.724 0.107 0.78 (0.335) (0.183) (0.382) Log population 9.047 9.504 -0.457 0.06* (0.211) (0.119) (0.243) Age of leader 55.167 53.164 2.003 0.21 (1.313) (0.876) (1.579) Tenure of leader 9.217 7.795 1.422 0.35 (1.396) (0.556) (1.502) Num obs 61 190
Notes: This table reports the means of each listed variable for successes and failures, where each observation is a serious attempt. Standard errors in parentheses. P-values on differences in the mean are from two-sided unpaired t-tests. All variables are examined in the year before the attempt took place. Change variables represent the change from 3 years before the attempt occurred to one year before the attempt occurred. * significant at 10%; ** significant at 5%; *** significant at 1%
Panel B: Multivariate regressions (1) (2) (3) (4)
Democracy dummy 0.039 0.039 0.044 0.042 (0.070) (0.068) (0.071) (0.068)
Change in democracy 0.006 -0.020 0.022 0.015 dummy (0.099) (0.104) (0.102) (0.117) War dummy -0.021 -0.004 -0.021 0.004
(0.077) (0.082) (0.076) (0.082) Change in war 0.050 0.054 0.058 0.064
(0.067) (0.067) (0.067) (0.067) Log energy use per capita 0.001 0.000 0.010 0.013
(0.014) (0.014) (0.015) (0.015) Log population -0.024 -0.025 -0.031 -0.040*
(0.021) (0.021) (0.022) (0.020) Age of leader 0.003 0.003 0.002 0.002
(0.003) (0.003) (0.003) (0.003) Tenure of leader 0.003 0.003 0.004 0.004
(0.003) (0.003) (0.003) (0.003) Weapon FE NO YES NO YES Region FE NO NO YES YES Observations 205 205 205 205 P-val of all listed variables 0.69 0.58 0.57 0.30 P-val of all listed variables and fixed effects
0.69 0.03** 0.55 0.00***
Notes: This table reports marginal effects from a probit regression, where each observation is a serious attempt and the dependent variable equals 1 for successful assassinations. Robust standard errors in parentheses, adjusted for clustering on country. Weapon FE refers to dummies for each weapon type (gun, knife, explosive, poison, other, unknown), and region FE refers to dummies for each region of the world (Africa, Asia, Middle East / North Africa, Latin America, Eastern Europe, Western Europe / OECD). * significant at 10%; ** significant at 5%; *** significant at 1%
35
Table 4: Assassinations and Institutional Change
(1) (2) (3) Absolute
change in POLITY2 dummy (1 = democracy)
Directional change in POLITY2 dummy (1 = democracy)
Percentage of transitions in next 20 years by ‘regular’ means
Panel A: Average effects Success 0.110 0.094 0.110
(0.045) (0.048) (0.055) Parm p-val 0.02** 0.05* 0.05* Nonparm p-val 0.01** 0.00*** 0.20 Obs 220 220 136 Data source Polity IV Polity IV Archigos
Panel B: Split by regime type in year before attempt Success × Autocracy . 0.151 0.177
. (0.055) (0.085) Success × Democracy . -0.004 0.028
. (0.081) (0.044) Autoc-Parm p . 0.01*** 0.04** Autoc-Nonparm p . 0.00*** 0.05** Democ-Parm p . 0.96 0.53 Democ-Nonparm p . 0.10 0.96 Obs 220 220 136 Data source Polity IV Polity IV Archigos
Notes: Success is a dummy for whether the assassination attempt succeeded. The sample in all columns is limited to serious attempts. Standard errors and parametric p-values are computed using robust standard errors, adjusted for clustering at the country level; these specifications all include dummies for weapon type and the number of attempts in that year. Non-parametric p-values are computed using Fisher’s exact (1935) p-values in columns (1) and (2) and using a Wilcoxon (1945) rank-sum test in column (3). In Panel B, autocracy / democracy is defined by the POLITY2 dummy in the year before the attempt. The main effect for the lagged autocracy variable is also included in the Panel B regressions. Absolute change in POLITY2 dummy is not shown in Panel B as it is mechanically identical to the directional change in POLITY2 dummy once we split by lagged POLITY2 dummy status. * significant at 10%; ** significant at 5%; *** significant at 1%

36
Table 5: Tenure of leader and duration of effects
(1) (2) (3) (4) (5) (6) All leaders Autocrats only
All Tenure <= 10 Tenure > 10 All Tenure <= 10 Tenure > 10 Panel A: Directional change in POLITY2 dummy 1 year out 0.094 0.083 0.123 0.152 0.122 0.203 (0.048) (0.050) (0.119) (0.056) (0.067) (0.104) Parm p-val 0.05* 0.10* 0.31 0.01*** 0.07* 0.06* Nonparm p-val 0.00*** 0.07** 0.01*** 0.00*** 0.02** 0.01*** 10 years out 0.029 0.022 0.094 0.186 0.211 0.171 (0.056) (0.070) (0.145) (0.080) (0.111) (0.130) Parm p-val 0.60 0.76 0.52 0.02** 0.06* 0.20 Nonparm p-val 0.01*** 0.10* 0.02** 0.05** 0.21 0.04** 20 years out 0.004 0.029 0.000 0.049 0.08 0.008 (0.084) (0.099) (0.146) (0.091) (0.122) (0.149) Parm p-val 0.97 0.77 1.00 0.59 0.52 0.96 Nonparm p-val 0.85 0.88 0.71 0.58 0.75 0.43 Panel B: Percentage of transitions by ‘regular’ means 1-10 years out 0.057 0.059 0.087 0.117 0.111 0.102 (0.075) (0.086) (0.243) (0.109) (0.136) (0.255) Parm p-val 0.45 0.50 0.73 0.29 0.42 0.70 Nonparm p-val 0.70 0.45 0.53 0.46 0.66 0.28 1-20 years out 0.110 0.105 0.26 0.145 0.124 0.277 (0.055) (0.062) (0.156) (0.093) (0.116) (0.188) Parm p-val 0.05* 0.10* 0.12 0.13 0.29 0.16 Nonparm p-val 0.20 0.28 0.02** 0.05** 0.18 0.02** 11-20 years out 0.123 0.102 0.35 0.216 0.18 0.385 (0.068) (0.074) (0.223) (0.113) (0.113) (0.243) Parm p-val 0.08* 0.18 0.14 0.06* 0.12 0.14 Nonparm p-val 0.20 0.56 0.03** 0.02** 0.14 0.04**
Notes: Each cell reports the coefficient on “success” result from a separate regression. Columns (1) and (4) reports results for all leaders, columns (2) and (5) for those with tenure <= 10 years in year before assassination, and columns (3) and (6) for those with tenure > 10 years in year before year of attempt. For POLITY2 dummy, 1 year out compares the change in polity score 1 year after attempt to 1 year before attempt; 5 years out compares the change in polity score 5 years after attempt to 1 year before attempt, etc. For regular transitions, 1-10 years out calculates the average percentage of leadership transitions that are regular in years 1-10 after the attempt; etc. Standard errors and p-values are as in Table 4. * significant at 10%; ** significant at 5%; *** significant at 1%

37
Table 6: Assassinations and Conflict: Change 1 Year After Attempt
(1) (2) (3) (4) (5) (6) Gleditsch-COW Dataset
1875-2002 Gleditsch-COW Dataset
1946-2002 PRIO/Uppsala Dataset
1946-2002 All wars Civil wars All wars Civil wars All wars Civil wars
Panel A: Average effects Success -0.070 -0.020 0.034 0.010 0.161 0.110
(0.065) (0.049) (0.092) (0.077) (0.067) (0.045) Parm p-val 0.29 0.69 0.71 0.90 0.02** 0.02** Nonparm p-val 0.57 0.50 0.84 0.15 0.03** 0.12 Obs 222 222 117 117 117 117 Data source Gleditsch Gleditsch Gleditsch Gleditsch PRIO PRIO
Panel B: Split by war status in year before attempt Success × At War -0.202 -0.239 0.009 -0.161 0.259 0.351
(0.143) (0.175) (0.231) (0.221) (0.148) (0.158) Success × Not At War -0.015 0.030 0.020 0.070 0.050 0.012
(0.064) (0.041) (0.083) (0.072) (0.052) (0.035) At War-Parm p 0.16 0.18 0.97 0.47 0.08* 0.03** At War-Nonparm p 0.16 0.25 1.00 0.61 0.07* 0.06* Not At War-Parm p 0.82 0.46 0.81 0.33 0.34 0.74 Not At War –Nonparm p 0.80 0.70 0.71 0.12 0.28 0.72 Obs 222 222 117 117 117 117 Data source Gleditsch Gleditsch Gleditsch Gleditsch PRIO PRIO
Notes: See notes to Table 4. Non-parametric p-values are computed using Fisher’s exact tests. In Panel B, at war / not at war is defined by whether the relevant war concept (i.e., the concept used in the dependent variable) is positive in the year before the attempt. The main effect for the lagged war variable is also included in the regression in Panel B. * significant at 10%; ** significant at 5%; *** significant at 1%
Table 7: Assassinations and Conflict: Change 5 Years After Attempt
(1) (2) (3) (4) (5) (6) Gleditsch-COW Dataset
1875-2002 Gleditsch-COW Dataset
1946-2002 PRIO/Uppsala Dataset
1946-2002 All wars Civil wars All wars Civil wars All wars Civil wars
Panel A: Average effects Success -0.025 -0.038 -0.036 -0.117 0.159 0.154
(0.074) (0.068) (0.118) (0.115) (0.084) (0.056) Parm p-val 0.73 0.57 0.76 0.31 0.06* 0.01*** Nonparm p-val 0.27 0.74 0.21 0.75 0.09* 0.04** Obs 211 211 108 108 108 108 Data source Gleditsch Gleditsch Gleditsch Gleditsch PRIO PRIO
Panel B: Split by war status in year before attempt Success × At War 0.172 0.051 0.255 0.009 0.369 0.479
(0.116) (0.184) (0.243) (0.264) (0.154) (0.157) Success × Not At War -0.094 -0.041 -0.165 -0.104 -0.027 0.037
(0.064) (0.049) (0.101) (0.091) (0.064) (0.042) At War-Parm p 0.14 0.78 0.30 0.97 0.02** 0.00*** At War-Nonparm p 0.35 1.00 0.61 1.00 0.09* 0.23 Not At War-Parm p 0.14 0.40 0.11 0.25 0.68 0.38 Not At War –Nonparm p 0.22 0.41 0.16 0.54 0.54 0.03** Obs 211 211 108 108 108 108 Data source Gleditsch Gleditsch Gleditsch Gleditsch PRIO PRIO
Notes: See notes to Table 6.
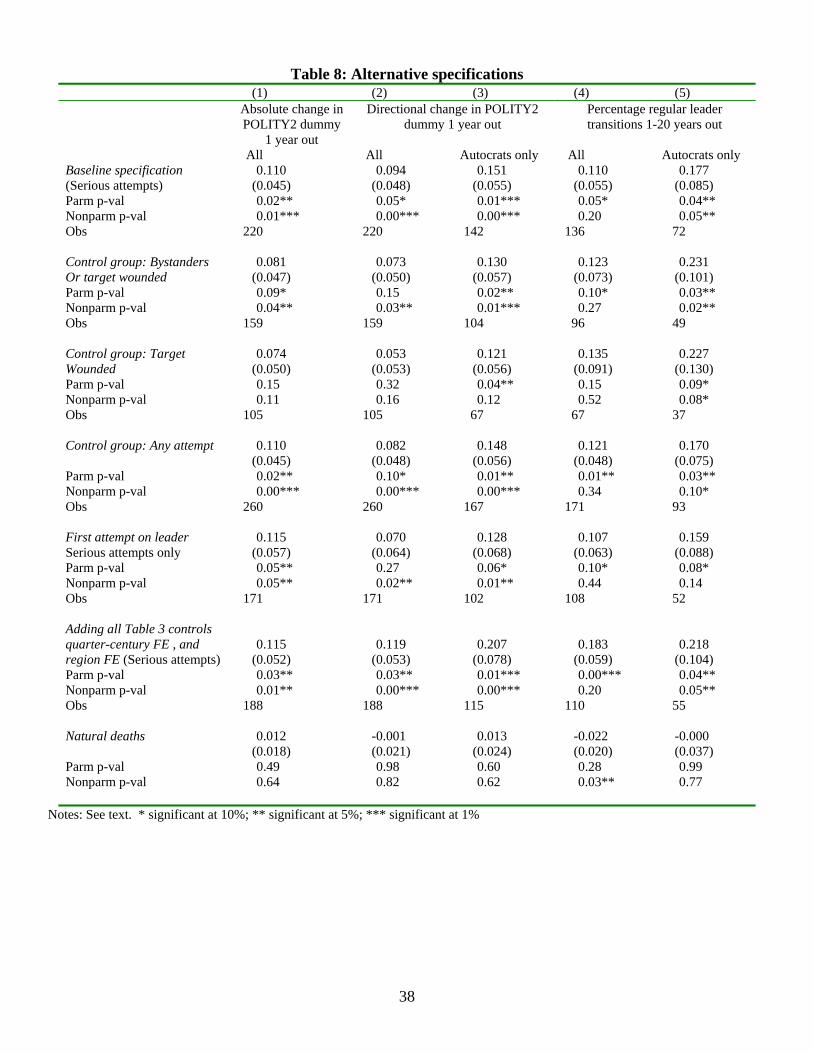
38
Table 8: Alternative specifications (1) (2) (3) (4) (5) Absolute change in
POLITY2 dummy 1 year out
Directional change in POLITY2 dummy 1 year out
Percentage regular leader transitions 1-20 years out
All All Autocrats only All Autocrats only Baseline specification 0.110 0.094 0.151 0.110 0.177 (Serious attempts) (0.045) (0.048) (0.055) (0.055) (0.085) Parm p-val 0.02** 0.05* 0.01*** 0.05* 0.04** Nonparm p-val 0.01*** 0.00*** 0.00*** 0.20 0.05** Obs 220 220 142 136 72
Control group: Bystanders 0.081 0.073 0.130 0.123 0.231 Or target wounded (0.047) (0.050) (0.057) (0.073) (0.101) Parm p-val 0.09* 0.15 0.02** 0.10* 0.03** Nonparm p-val 0.04** 0.03** 0.01*** 0.27 0.02** Obs 159 159 104 96 49
Control group: Target 0.074 0.053 0.121 0.135 0.227 Wounded (0.050) (0.053) (0.056) (0.091) (0.130) Parm p-val 0.15 0.32 0.04** 0.15 0.09* Nonparm p-val 0.11 0.16 0.12 0.52 0.08* Obs 105 105 67 67 37 Control group: Any attempt 0.110 0.082 0.148 0.121 0.170 (0.045) (0.048) (0.056) (0.048) (0.075) Parm p-val 0.02** 0.10* 0.01** 0.01** 0.03** Nonparm p-val 0.00*** 0.00*** 0.00*** 0.34 0.10* Obs 260 260 167 171 93 First attempt on leader 0.115 0.070 0.128 0.107 0.159 Serious attempts only (0.057) (0.064) (0.068) (0.063) (0.088) Parm p-val 0.05** 0.27 0.06* 0.10* 0.08* Nonparm p-val 0.05** 0.02** 0.01** 0.44 0.14 Obs 171 171 102 108 52 Adding all Table 3 controls quarter-century FE , and 0.115 0.119 0.207 0.183 0.218 region FE (Serious attempts) (0.052) (0.053) (0.078) (0.059) (0.104) Parm p-val 0.03** 0.03** 0.01*** 0.00*** 0.04** Nonparm p-val 0.01** 0.00*** 0.00*** 0.20 0.05** Obs 188 188 115 110 55
Natural deaths 0.012 -0.001 0.013 -0.022 -0.000
(0.018) (0.021) (0.024) (0.020) (0.037) Parm p-val 0.49 0.98 0.60 0.28 0.99 Nonparm p-val 0.64 0.82 0.62 0.03** 0.77
Notes: See text. * significant at 10%; ** significant at 5%; *** significant at 1%
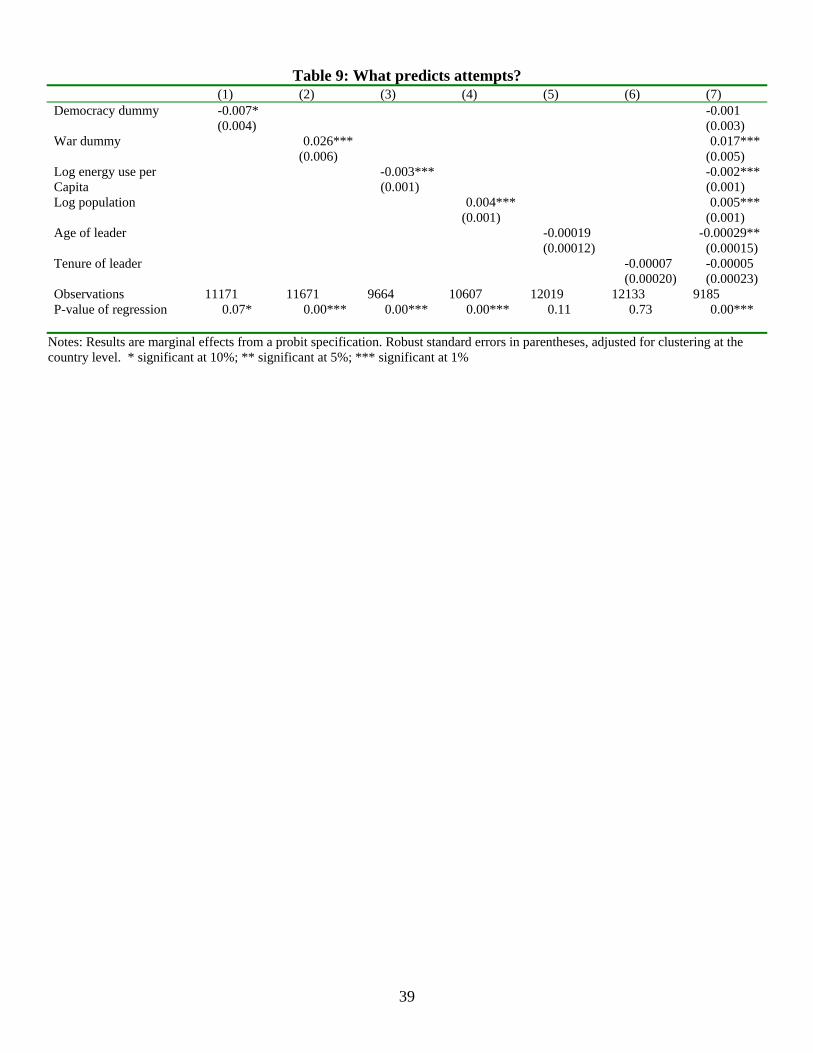
39
Table 9: What predicts attempts?
(1) (2) (3) (4) (5) (6) (7) Democracy dummy -0.007* -0.001 (0.004) (0.003) War dummy 0.026*** 0.017*** (0.006) (0.005) Log energy use per -0.003*** -0.002*** Capita (0.001) (0.001) Log population 0.004*** 0.005*** (0.001) (0.001) Age of leader -0.00019 -0.00029** (0.00012) (0.00015) Tenure of leader -0.00007 -0.00005 (0.00020) (0.00023) Observations 11171 11671 9664 10607 12019 12133 9185 P-value of regression 0.07* 0.00*** 0.00*** 0.00*** 0.11 0.73 0.00***
Notes: Results are marginal effects from a probit specification. Robust standard errors in parentheses, adjusted for clustering at the country level. * significant at 10%; ** significant at 5%; *** significant at 1%

40
Table 10: Impacts of failures on institutional change
(1) (2) (3) (4) (5) (6) (7) (8) (9) Absolute change in POLITY2 dummy Directional change in POLITY2 dummy Percent regular leader transitions 1-20 years out No controls Adding
controls Adding controls and propensity score stratification
No controls Adding controls
Adding controls and propensity score stratification
No controls Adding controls
Adding controls and propensity score stratification
Panel A: Average effects Success 0.110 0.112 0.111 0.080 0.076 0.077 0.072 0.110 0.107
(0.043) (0.043) (0.043) (0.048) (0.045) (0.045) (0.040) (0.044) (0.043) Failure 0.001 0.000 -0.001 -0.023 -0.025 -0.025 -0.058 -0.036 -0.038
(0.017) (0.016) (0.016) (0.019) (0.019) (0.018) (0.043) (0.027) (0.027) Success p-val 0.01** 0.01*** 0.01*** 0.10* 0.09* 0.09* 0.08* 0.01** 0.01** Failure p-val 0.95 0.99 0.97 0.22 0.18 0.17 0.17 0.18 0.16 Obs 10932 10932 10932 10932 10932 10932 5979 5979 5979 Data source Polity IV Polity IV Polity IV Polity IV Polity IV Polity IV Archigos Archigos Archigos
Panel B: Split by regime type in year before attempt Success × Autocracy . . . 0.143 0.144 0.144 0.155 0.210 0.208
. . . (0.058) (0.057) (0.057) (0.059) (0.056) (0.055) Failure × Autocracy . . . -0.022 -0.016 -0.017 -0.054 -0.041 -0.041
. . . (0.013) (0.014) (0.014) (0.058) (0.046) (0.046) Success × Democracy . . . -0.051 -0.048 -0.045 0.023 0.003 -0.002
. . . (0.066) (0.063) (0.063) (0.034) (0.044) (0.043) Failure × Democracy . . . -0.044 -0.043 -0.041 -0.025 -0.029 -0.034
. . . (0.043) (0.042) (0.042) (0.038) (0.033) (0.033) Autoc P-val– Success . . . 0.01** 0.01** 0.01** 0.01*** 0.00*** 0.00*** Autoc P-val– Failure . . . 0.10* 0.26 0.22 0.36 0.38 0.37 Democ P-val– Success . . . 0.44 0.45 0.47 0.50 0.94 0.97 Democ P-val– Failure . . . 0.31 0.31 0.33 0.51 0.38 0.30 Obs 10932 10932 10932 5573 5573 5573 Data source Polity IV Polity IV Polity IV Archigos Archigos Archigos
Notes: Controls includes lagged values of polity, leader’s tenure, war status, population, and energy; quarter-century fixed effects; and region fixed effects. * significant at 10%; ** significant at 5%; *** significant at 1%

41
Table 11: Impacts of failures on conflict
(1) (2) (3) (4) (5) (6) (7) (8) (9) Gleditsch-COW Dataset
1875-2002 All wars
Gleditsch-COW Dataset 1946-2002 All wars
PRIO/Uppsala Dataset 1946-2002
No controls Adding controls
Adding controls and propensity score stratification
No controls Adding controls
Adding controls and propensity score stratification
No controls Adding controls
Adding controls and propensity score stratification
Panel A: Average effects Success -0.067 -0.015 -0.019 0.033 0.032 0.031 0.074 0.076 0.076
(0.058) (0.048) (0.048) (0.070) (0.063) (0.062) (0.058) (0.057) (0.056) Failure 0.001 0.051 0.049 -0.022 -0.003 -0.002 -0.074 -0.067 -0.066
(0.035) (0.035) (0.035) (0.048) (0.045) (0.045) (0.038) (0.040) (0.040) Success p-val 0.25 0.76 0.69 0.64 0.61 0.62 0.20 0.18 0.18 Failure p-val 0.98 0.15 0.16 0.65 0.95 0.97 0.05* 0.09* 0.10* Obs 11286 11286 11286 7183 7183 7183 7183 7183 7183 Data source Gleditsch Gleditsch Gleditsch Gleditsch Gleditsch Gleditsch PRIO PRIO PRIO
Panel B: Split by regime type in year before attempt Success × At war -0.211 -0.213 -0.220 -0.028 -0.031 -0.023 0.049 0.034 0.036
(0.120) (0.119) (0.118) (0.191) (0.194) (0.190) (0.121) (0.122) (0.121) Failure × At war -0.002 -0.007 -0.005 -0.076 -0.081 -0.071 -0.190 -0.203 -0.201
(0.063) (0.060) (0.060) (0.092) (0.092) (0.093) (0.057) (0.058) (0.058) Success × Not at war 0.063 0.058 0.055 0.070 0.047 0.044 0.101 0.098 0.096
(0.050) (0.048) (0.049) (0.064) (0.063) (0.063) (0.056) (0.056) (0.056) Failure × Not at war 0.094 0.074 0.070 0.048 0.022 0.021 0.075 0.066 0.065
(0.039) (0.038) (0.038) (0.041) (0.042) (0.042) (0.038) (0.038) (0.038) At war P-val– Success 0.08* 0.07* 0.06* 0.88 0.87 0.90 0.69 0.78 0.77 At war P-val– Failure 0.97 0.90 0.93 0.41 0.38 0.45 0.00*** 0.00*** 0.00*** No war P-val– Success 0.21 0.23 0.26 0.28 0.46 0.49 0.07* 0.08* 0.09* No war P-val– Failure 0.02** 0.05* 0.06* 0.24 0.59 0.62 0.05** 0.09* 0.09* Obs 11286 11286 11286 7183 7183 7183 7183 7183 7183 Data source Gleditsch Gleditsch Gleditsch Gleditsch Gleditsch Gleditsch PRIO PRIO PRIO
Notes: Controls includes lagged values of polity, leader’s tenure, war status, population, and energy; quarter-century fixed effects; and region fixed effects. * significant at 10%; ** significant at 5%; *** significant at 1%
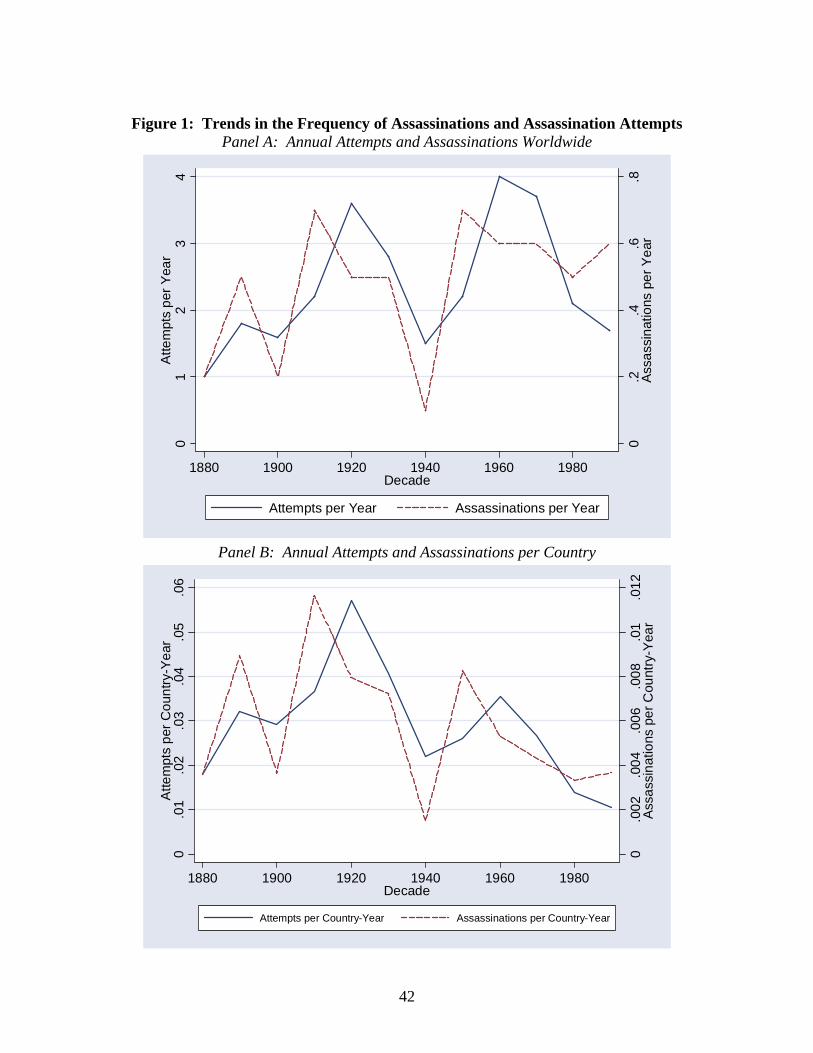
42
Figure 1: Trends in the Frequency of Assassinations and Assassination Attempts
Panel A: Annual Attempts and Assassinations Worldwide
0.2
.4.6
.8A
ssas
sina
tions
per
Yea
r
01
23
4A
ttem
pts
per Y
ear
1880 1900 1920 1940 1960 1980Decade
Attempts per Year Assassinations per Year
Panel B: Annual Attempts and Assassinations per Country
0.0
02.0
04.0
06.0
08.0
1.0
12A
ssas
sina
tions
per
Cou
ntry
-Yea
r
0.0
1.0
2.0
3.0
4.0
5.0
6A
ttem
pts
per C
ount
ry-Y
ear
1880 1900 1920 1940 1960 1980Decade
Attempts per Country-Year Assassinations per Country-Year


![[Edward Aspinall] Opposing Suharto Compromise, Re(BookFi.org)](https://img.pdfslide.net/doc/110x75/563db81b550346aa9a90a149/edward-aspinall-opposing-suharto-compromise-rebookfiorg.jpg)