Embed Size (px)
Citation preview

HIV and NYC Seniors HIV is Catching HAS Caught Up to Seniors
M. Monica Sweeney, MD, MPH Assistant Commissioner Bureau of HIV/AIDS Prevention & Control Red Ribbon, Silver Threads: Healthy Aging in the Era of HIV/AIDS
December 7, 2009

Mission of the Bureau of HIV/AIDS Prevention and Control
“To prevent new HIV infections and to reduce morbidity and mortality among HIV-infected persons”

New York City

NYC: Epicenter of the U.S. Epidemic
• NYC continues to be the epicenter of the HIV/AIDS epidemic in the U.S. – Among the highest AIDS case rates in U.S.
– <3% of U.S. population, but 17% of AIDS deaths
– More HIV/AIDS cases than Los Angeles, San Francisco, Miami & Washington, DC combined

New York City
Within the US, New York City has one of the highest AIDS
case rates
Healthy People 2010 Goal: 1.0 per 100,000 population
49
43
41
38
37
29
26
20
20
19
17
14
14
13
12
10
0 10 20 30 40 50 60
Miami
Fort Lauderdale
Baltimore
Washington, DC
Philadelphia
San Francisco
Houston
Atlanta
New ark, NJ
Detroit
Los Angeles
Chicago
US average
Albany
Boston
New York City
AIDS case rate per 100,000 population, 2006
The NYC AIDS case rate is more than 3 times the US average and 41 times the Healthy People 2010 target.
Based on metropolitan statistical area of residence. Source: CDC HIV/AIDS Surveillance Report, 2006, Table 15. http://www.cdc.gov/hiv/topics/surveillance/resources/reports/index.htm

New HIV Diagnoses in NYC, 2001-2007
New
HIV
dia
gnos
es (
N)
6,000
5,000
4,000
3,000
2,000
1,000
0
5,684
5,091
4,570
4,098 4,093 3,881 3,787
2001 2002 2003 2004 2005 2006 2007
The number of new HIV diagnoses declined by about 500 cases annually between 2001 and 2004. The decrease has slowed since then.
As reported to the New York City Department of Health and Mental Hygiene by September 30, 2008.

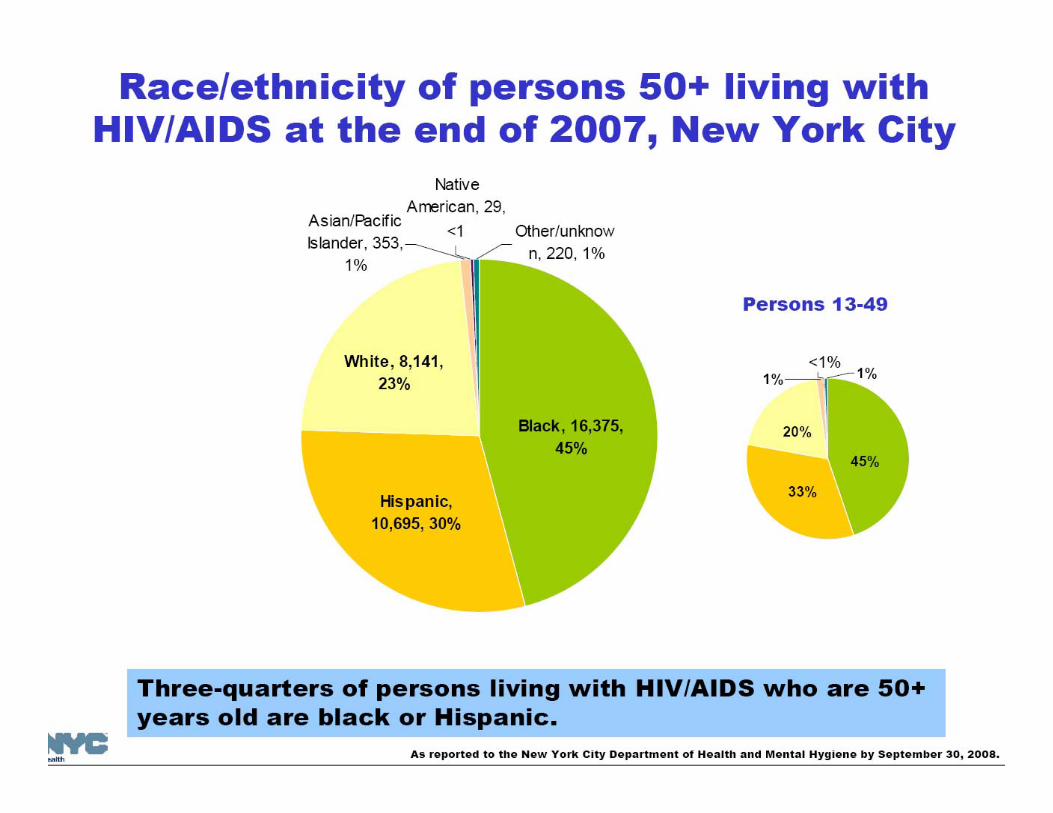
New HIV Diagnoses in NYC, 2007 Race/Ethnicity
• 80% of new HIV diagnoses are in blacks and Hispanics/Latinos – Blacks have a higher rate of new HIV
diagnoses, persons living with HIV/AIDS (PLWHA), and death
– The HIV diagnosis rate has declined more in blacks than in other racial/ethnic groups over the past 6 years
As reported to the NYC DOHMH by 9/30/2008

HIV/AIDS Among
Persons 50+
in New York City

Introductory Statistics for Persons 50+ HIV in NYC, 2007
• 35,813 persons living with HIV/AIDS are 50+ – This population comprises 35% of total persons of all
ages living with HIV/AIDS (PLWHA) – Many more do not know they are infected because
they have never been tested • 651 new HIV dx
– 17% of total new HIV dx – 403 HIV without AIDS – 248 HIV concurrent with AIDS (38%)
• 1,050 deaths among PLWHA – 52% of total deaths PLWHA


New Yorkers with HIV are aging
• People with HIV are surviving longer after infection
• An increasing proportion of PLWHA in
NYC (as well as nationwide) are 50+
• There is a complex, synergistic relationship between aging and HIV

What the NYC DOHMH is doing…
• Fund community organization run programs
• Currently developing materials – Health bulletin that focuses on
issues unique to PLWHA’s50+
• Distribute free condoms to a variety of venues frequented by seniors including local seniorcenters
• Scaling up testing so ALL NYers know their HIV status

Policy and Programmatic
Suggestions

Condoms, eat healthy, be physically active
Poverty, education,
Fluoridation, 0g trans fat, iodization, smoke-free laws, tobacco tax
Factors that Affect Health
Rx for high blood pressure, high cholesterol, depression
Immunizations, brief intervention, cessation treatment, colonoscopy
Examples
Smallest
Impact
Largest Impact
Socioeconomic Factors
Changing the Context to make individuals’ default
decisions healthy
Long-lasting Protective Interventions
Clinical Interventions
Counseling &
Education
housing
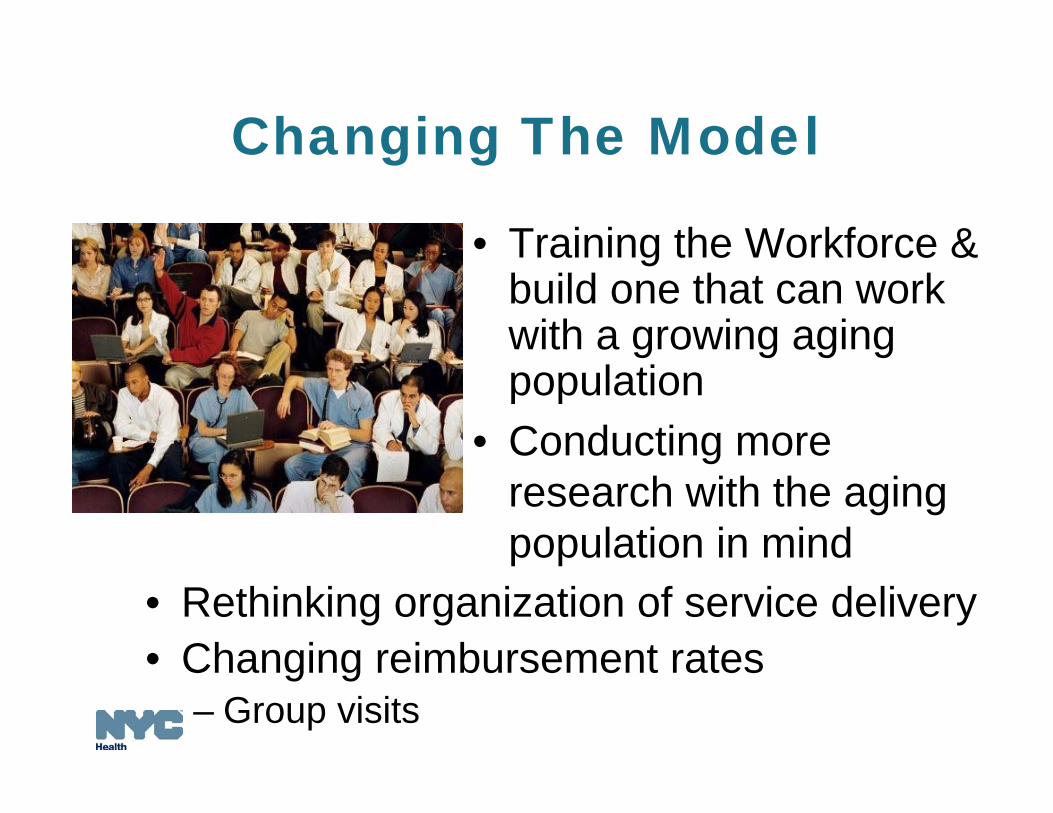
Changing The Model • Training the Workforce &
build one that can work with a growing agingpopulation
• Conducting more research with the aging population in mind
• Rethinking organization of service delivery
• Changing reimbursement rates – Group visits

THANK YOU!