Embed Size (px)
Citation preview

HIV Care in New York State, 2014:
Linkage, Retention and Viral Suppression
Among Persons Residing in New York State
AIDS Institute
New York State Department of Health
September, 2016

2
TABLE OF CONTENTS
Executive Summary ........................................................................................................................ 3
Changes to the 2014 Report ........................................................................................................ 5
Introduction ..................................................................................................................................... 6
New York State HIV Care Outcome Measures .............................................................................. 8
New York State and the NHAS Targets ....................................................................................... 10
The Cascade of HIV Care ............................................................................................................. 11
Technical Notes and Appendices .................................................................................................. 12
Table A: Entry to Care in 2014 Persons Newly Diagnosed with HIV, NYS, 2014 .................. 14
Table B: Continuity of Care in 2014 Persons Living with Diagnosed HIV Infection in Dec.
2013 and Alive in Dec. 2014, NYS ........................................................................................... 15
Table C: Viral Suppression in 2014 Persons Living with Diagnosed HIV Infection in Dec.
2013 and Alive in Dec. 2014, NYS ........................................................................................... 16
Updated September, 2016 3
Executive Summary
The attached report presents summary measures of linkage to HIV medical care, retention in care
and HIV viral suppression among persons living with diagnosed HIV infection (PLWDHI) in
New York State (NYS). HIV care measures were calculated using data from the New York State
Department of Health (NYSDOH) HIV Surveillance registry.
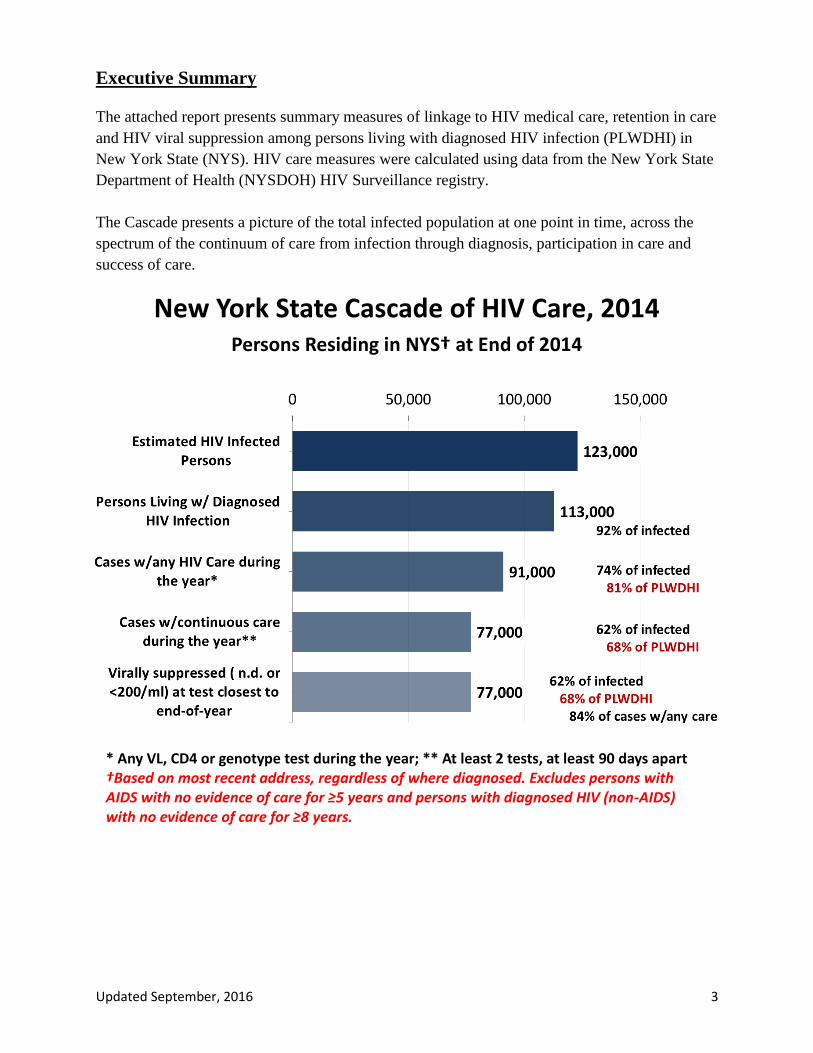
The Cascade presents a picture of the total infected population at one point in time, across the
spectrum of the continuum of care from infection through diagnosis, participation in care and
success of care.
* Any VL, CD4 or genotype test during the year; ** At least 2 tests, at least 90 days apart †Based on most recent address, regardless of where diagnosed. Excludes persons with AIDS with no evidence of care for ≥5 years and persons with diagnosed HIV (non-AIDS) with no evidence of care for ≥8 years.
New York State Cascade of HIV Care, 2014 Persons Residing in NYS† at End of 2014

Updated September, 2016 4
Major findings:
Linkage to Care 72% of newly diagnosed cases showed evidence of entry to care within 30 days of
diagnosis. This proportion is below the 2020 National HIV/AIDS Strategy (NHAS)
target of 85% but is comparable to the United States (U.S.) (75%) as a whole.1
85% of newly diagnosed cases showed evidence of entry to care within 90 days of
diagnosis. This compares well with the 2015 NHAS target (85%) and to the U.S.
(84%) as a whole.1
Evidence of HIV Care 81% of PLWDHI showed evidence of some care during the year. Continuous care
(≥2 visits/year, ≥90 days apart) was observed for 68% of PLWDHI. This
proportion is substantially lower than both the 2015 (80%) and 2020 (90%) NHAS
targets. In the U.S., 70% of PLWDHI had any evidence of care and 57% were in
continuous care.1
Viral Suppression 68% of PLWDHI in NYS appeared to be virally suppressed. This proportion is
slightly higher than the 2015 target (66%)2 but is below 2020 NHAS target (80%).
In the U.S., 55% of PLWDHI appeared to be virally suppressed.1
The 2020 NHAS target also sets a viral suppression target of 80% for youth (aged
13-24 years) and injection drug users. In NYS, 55% of youth and 67% of persons
with injection drug use as the HIV transmission risk were virally suppressed.
1Centers for Disease Control and Prevention. Monitoring selected national HIV prevention and care objectives by
using HIV surveillance data—United States and 6 dependent areas, 2014. HIV Surveillance Supplemental Report
2016;21(No. 4). http://www.cdc.gov/hiv/library/reports/surveillance/. Published July 2016. Accessed [08/2016]. 22015 target, adjusted based on presumed residence in NYS at the end of 2010

Updated September, 2016 5
Changes to the 2014 Report
The 2015 update to the National HIV/AIDS Strategy specified targets for HIV quality of care
indicators that are believed to be achievable by 2020. The update eliminated the national target
that 85% of newly diagnosed persons should enter care within 3 months of being diagnosed with
HIV infection. Instead, the revised target specifies that 85% of newly diagnosed persons should
enter care within 30 days of their diagnosis. To allow for comparison of 2014 HIV data to the
2015 NHAS targets, this report includes the NYS proportions for both the 30 day (2020) and 90
day (2015) linkage to care NHAS targets.
NYS uses methodology from the Centers for Disease Control and Prevention (CDC) to calculate
NHAS targets. In previous years, linkage to care was calculated as the difference between the
month of diagnosis and the month linked to care. In this report, linkage to care was calculated
based on the date of diagnosis and the date of linkage to care. Similarly, continuity of care was
previously calculated as ≥2 laboratory tests /year, ≥3 months apart. In this report, continuity of
care was calculated as ≥2 laboratory tests/year, ≥90 days apart. The percentages for calculations
based on date are lower than those based on month.
The NHAS targets are now inclusive of all people living with diagnosed HIV infection. The
previous focus on Ryan White program clients for the continuity of care measure was eliminated
with the 2015 update. Given this change, the continuity of care measure for Ryan White program
clients is no longer included in the NYS report; the focus is on all people living with diagnosed
HIV infection.
Finally, HIV genotype tests are now considered in the calculations of entry to care and evidence
of HIV care during the year. Persons with genotype tests, but no reports of CD4 or HIV viral
load tests to the HIV registry, represent a small fraction of persons with any care in 2014.

Updated September, 2016 6
Introduction
Need for Assessing Engagement in HIV Care
The provision of appropriate medical care for persons living with diagnosed HIV infection
(PLWDHI) is a key feature of New York State’s Ending the Epidemic initiative and the National
HIV/AIDS Strategy (NHAS) (White House Office of National AIDS Policy). In addition to the
immediate benefit to the infected individuals, persons retained in successful treatment for their
HIV infection have better virologic control and are less likely to transmit the virus to others. The
HIV care cascade is one tool for assessing the extent and effectiveness of HIV-related medical
care in NYS.
Measures for Assessing Engagement in Care
The NHAS, originally released in 2010, outlined a set of targets for the nation’s fight against
HIV/AIDS. The document called for an increase in the proportion of persons with timely linkage
to care, retention in care and HIV viral suppression. Retention in care and viral suppression
targets were defined for specific subpopulations and Ryan White program clients but were
applied to the total NYS population of PLWDHI. The targets were:
1. Increase the proportion of newly diagnosed patients linked to care within three
months of diagnosis to 85%.
2. Increase the proportion of persons living with diagnosed HIV infection (PLWDHI)
who are in continuous care, defined as ≥2 visits/year, separated by ≥3 months to 80%.
3. Increase the proportion of PLWDHI with undetectable viral load by 20%.
The 2015 revision of the NHAS updated the indicators and set targets for 2020. The 2020 targets
for linkage to care, retention in care and viral suppression are:
1. Increase the proportion of newly diagnosed persons linked to HIV medical care
within one month of HIV diagnosis to at least 85%.
2. Increase the proportion of persons with diagnosed HIV infection who are retained in
care to at least 90%.
3. Increase the proportion of persons with diagnosed HIV infection who are virally
suppressed to at least 80%.
4. Increase the proportion of youth and persons who inject drugs with diagnosed HIV
infection who are virally suppressed to at least 80%.
NYS values for linkage, retention and HIV viral suppression are presented in this report and
compared to the 2015 and 2020 NHAS targets. “Continuous care” is used synonymously with
“retained in care” in this report.
New York State Methods for Counting Persons with Diagnosed HIV Infection
Residence in NYS is based on the most recent address reported to the NYS HIV surveillance
system, regardless of the residency of the individual at diagnosis. Persons diagnosed while
resident outside NYS but whose most recent address reported to the HIV surveillance system is
Updated September, 2016 7
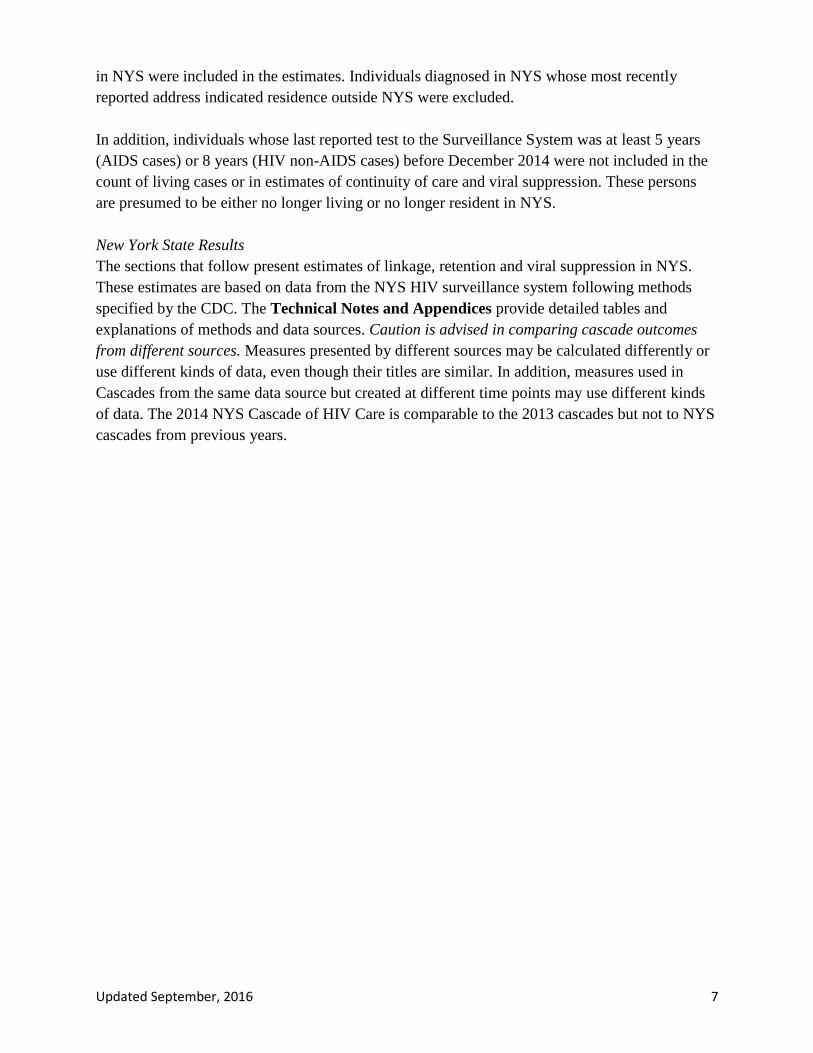
in NYS were included in the estimates. Individuals diagnosed in NYS whose most recently
reported address indicated residence outside NYS were excluded.
In addition, individuals whose last reported test to the Surveillance System was at least 5 years
(AIDS cases) or 8 years (HIV non-AIDS cases) before December 2014 were not included in the
count of living cases or in estimates of continuity of care and viral suppression. These persons
are presumed to be either no longer living or no longer resident in NYS.
New York State Results
The sections that follow present estimates of linkage, retention and viral suppression in NYS.
These estimates are based on data from the NYS HIV surveillance system following methods
specified by the CDC. The Technical Notes and Appendices provide detailed tables and
explanations of methods and data sources. Caution is advised in comparing cascade outcomes
from different sources. Measures presented by different sources may be calculated differently or
use different kinds of data, even though their titles are similar. In addition, measures used in
Cascades from the same data source but created at different time points may use different kinds
of data. The 2014 NYS Cascade of HIV Care is comparable to the 2013 cascades but not to NYS
cascades from previous years.
Updated September, 2016 8
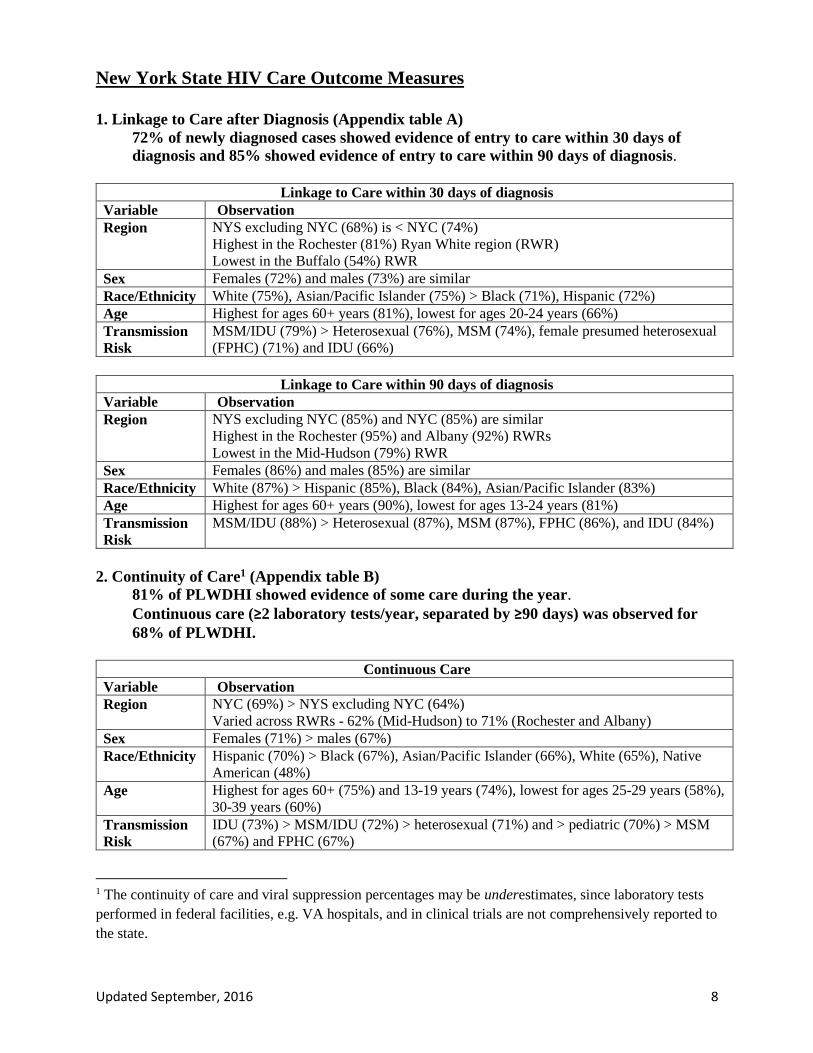
New York State HIV Care Outcome Measures
1. Linkage to Care after Diagnosis (Appendix table A)
72% of newly diagnosed cases showed evidence of entry to care within 30 days of
diagnosis and 85% showed evidence of entry to care within 90 days of diagnosis.
Linkage to Care within 30 days of diagnosis Variable Observation Region NYS excluding NYC (68%) is < NYC (74%)
Highest in the Rochester (81%) Ryan White region (RWR)
Lowest in the Buffalo (54%) RWR Sex Females (72%) and males (73%) are similar Race/Ethnicity White (75%), Asian/Pacific Islander (75%) > Black (71%), Hispanic (72%) Age Highest for ages 60+ years (81%), lowest for ages 20-24 years (66%) Transmission
Risk MSM/IDU (79%) > Heterosexual (76%), MSM (74%), female presumed heterosexual
(FPHC) (71%) and IDU (66%)
Linkage to Care within 90 days of diagnosis Variable Observation Region NYS excluding NYC (85%) and NYC (85%) are similar
Highest in the Rochester (95%) and Albany (92%) RWRs
Lowest in the Mid-Hudson (79%) RWR Sex Females (86%) and males (85%) are similar Race/Ethnicity White (87%) > Hispanic (85%), Black (84%), Asian/Pacific Islander (83%) Age Highest for ages 60+ years (90%), lowest for ages 13-24 years (81%) Transmission
Risk MSM/IDU (88%) > Heterosexual (87%), MSM (87%), FPHC (86%), and IDU (84%)
2. Continuity of Care1 (Appendix table B)
81% of PLWDHI showed evidence of some care during the year.
Continuous care (≥2 laboratory tests/year, separated by ≥90 days) was observed for
68% of PLWDHI.
Continuous Care Variable Observation Region NYC (69%) > NYS excluding NYC (64%)
Varied across RWRs - 62% (Mid-Hudson) to 71% (Rochester and Albany) Sex Females (71%) > males (67%) Race/Ethnicity Hispanic (70%) > Black (67%), Asian/Pacific Islander (66%), White (65%), Native
American (48%) Age Highest for ages 60+ (75%) and 13-19 years (74%), lowest for ages 25-29 years (58%),
30-39 years (60%) Transmission
Risk IDU (73%) > MSM/IDU (72%) > heterosexual (71%) and > pediatric (70%) > MSM
(67%) and FPHC (67%)
1 The continuity of care and viral suppression percentages may be underestimates, since laboratory tests
performed in federal facilities, e.g. VA hospitals, and in clinical trials are not comprehensively reported to
the state.

Updated September, 2016 9
3. Viral Suppression (Appendix table C)
About 68% of PLWDHI in NYS appeared to be virally suppressed, defined as having
non-detectable viral load or a viral load <200 copies/ml at the last test during the
year.
Viral Suppression Variable Observation Region NYS excluding NYC (69%) and NYC (68%) are similar
Lowest in the Mid-Hudson (69%), Lower Hudson (70%) and Nassau-Suffolk (70%)
RWRs; highest in the Buffalo (75%) RWR
Sex Similar among men and women (68%, respectively)
Race/Ethnicity White (74%) > Asian/Pacific Islanders (72%), > Hispanic (68%) > Black (64%) >
Native American (59%)
Age Lowest among 13-19 years (56%), 20-24 years (54%) and 25-29 years (56%) Highest
among those aged 30+ years (range: 60%-77%)
Transmission
Risk MSM (71%) > heterosexual (70%) > IDU (67%) and MSM/IDU (67%) > FPHC (66%)
> pediatric HIV transmission risk (54%)
10
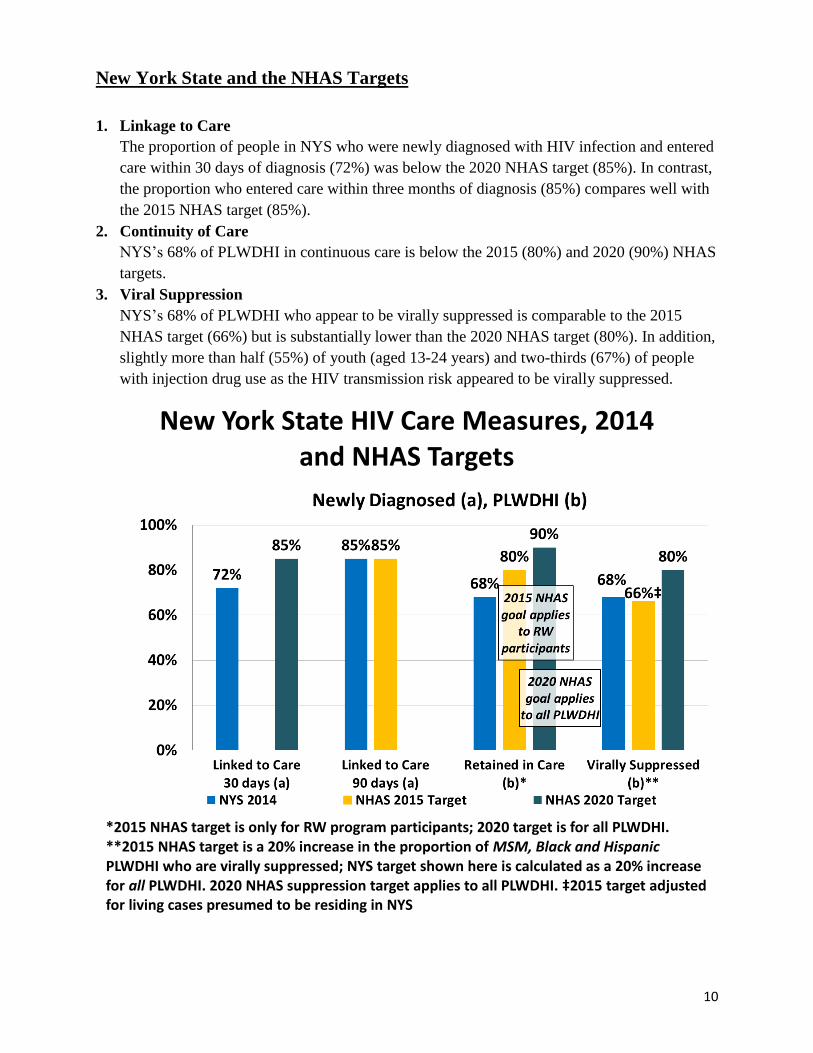
New York State and the NHAS Targets
1. Linkage to Care
The proportion of people in NYS who were newly diagnosed with HIV infection and entered
care within 30 days of diagnosis (72%) was below the 2020 NHAS target (85%). In contrast,
the proportion who entered care within three months of diagnosis (85%) compares well with
the 2015 NHAS target (85%).
2. Continuity of Care
NYS’s 68% of PLWDHI in continuous care is below the 2015 (80%) and 2020 (90%) NHAS
targets.
3. Viral Suppression
NYS’s 68% of PLWDHI who appear to be virally suppressed is comparable to the 2015
NHAS target (66%) but is substantially lower than the 2020 NHAS target (80%). In addition,
slightly more than half (55%) of youth (aged 13-24 years) and two-thirds (67%) of people
with injection drug use as the HIV transmission risk appeared to be virally suppressed.
New York State HIV Care Measures, 2014 and NHAS Targets
*2015 NHAS target is only for RW program participants; 2020 target is for all PLWDHI. **2015 NHAS target is a 20% increase in the proportion of MSM, Black and Hispanic PLWDHI who are virally suppressed; NYS target shown here is calculated as a 20% increase for all PLWDHI. 2020 NHAS suppression target applies to all PLWDHI. ‡2015 target adjusted for living cases presumed to be residing in NYS
Updated September, 2016 11
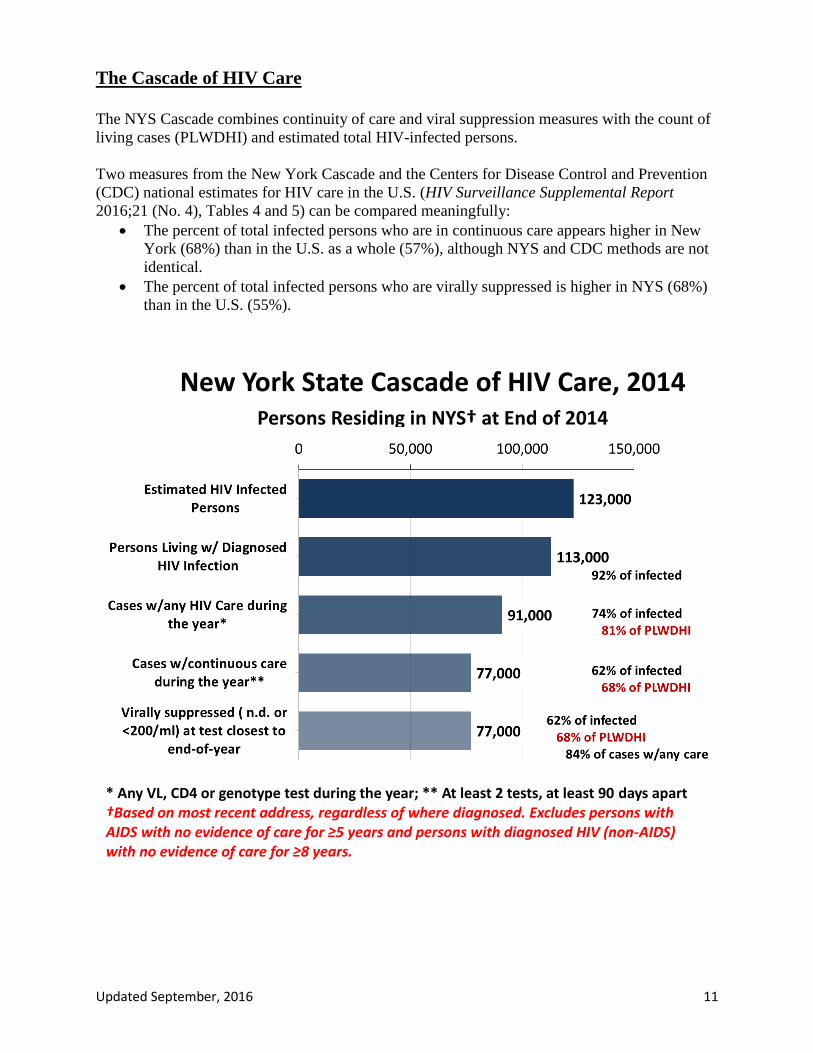
The Cascade of HIV Care
The NYS Cascade combines continuity of care and viral suppression measures with the count of
living cases (PLWDHI) and estimated total HIV-infected persons.
Two measures from the New York Cascade and the Centers for Disease Control and Prevention
(CDC) national estimates for HIV care in the U.S. (HIV Surveillance Supplemental Report
2016;21 (No. 4), Tables 4 and 5) can be compared meaningfully:
The percent of total infected persons who are in continuous care appears higher in New
York (68%) than in the U.S. as a whole (57%), although NYS and CDC methods are not
identical.
The percent of total infected persons who are virally suppressed is higher in NYS (68%)
than in the U.S. (55%).
New York State Cascade of HIV Care, 2014 Persons Residing in NYS† at End of 2014
* Any VL, CD4 or genotype test during the year; ** At least 2 tests, at least 90 days apart †Based on most recent address, regardless of where diagnosed. Excludes persons with AIDS with no evidence of care for ≥5 years and persons with diagnosed HIV (non-AIDS) with no evidence of care for ≥8 years.

Updated September, 2016 12
Technical Notes and Appendices
Contact Information Please direct inquiries about these measures of HIV health care in NYS to:
Bureau of HIV/AIDS Epidemiology
AIDS Institute, NYSDOH
Empire State Plaza
Albany New York 12237
518-474-4284
Data sources for calculation of HIV care measures Laboratory data used in these analyses are from the NYS HIV Surveillance System. NYS Public
Health law requires the electronic reporting to the NYSDOH any laboratory test, tests or series of
tests approved for the diagnosis or periodic monitoring of HIV infection. This includes reactive
initial HIV immunoassay results, all results (e.g. positive, negative, indeterminate) from
supplemental HIV immunoassays (HIV-1/2 antibody differentiation assay, HIV-1 Western blot,
HIV-2 Western blot or HIV-1 Immunofluorescent assay), all HIV nucleic acid (RNA or DNA)
detection test results (qualitative and quantitative; detectable and undetectable), CD4 lymphocyte
counts and percentages, positive HIV detection tests (culture, antigen), and HIV genotypic
resistance testing. Excepted from this rule are tests done for insurance purposes or in clinical
trials or in Federal facilities such as military sites or by the Veterans’ Administration, though
several exempted facilities report in “the spirit of cooperation”. Laboratory data are reported
electronically to NYSDOH, which receives around 1.3 million HIV laboratory reports annually.
Counts of PLWDHI were derived from the BHAE statewide analysis file of April, 2016.
Counts shown in tables and figures may differ. The percentages for PLWDHI shown in report
tables are based on persons who were diagnosed prior to the calendar year and survived to the
end of that year. Data shown in report figures are based on all persons living with diagnosed HIV
infection regardless of when diagnosed.
Persons Living with Diagnosed HIV Infection residing in NYS at the end of 2014
Residence in NYS is based on the most recent address reported to the NYS HIV surveillance
system, regardless of where the individual was diagnosed. Individuals diagnosed outside NYS
but presumed to be residing within the state (n=~6,100), based on the most recent address, were
included in the NYS calculations. Individuals diagnosed within NYS whose most recent address
indicated residence outside of NYS were excluded (n=~2,100).
Individuals whose last reported test to the Surveillance System was at least 5 years (AIDS cases)
or 8 years (HIV non-AIDS cases) before December 2014 were not included in the count of living
cases or in estimates of continuity of care and viral suppression. These persons are presumed to
be either no longer living or no longer residing in NYS (n=~25,900).
Updated September, 2016 13
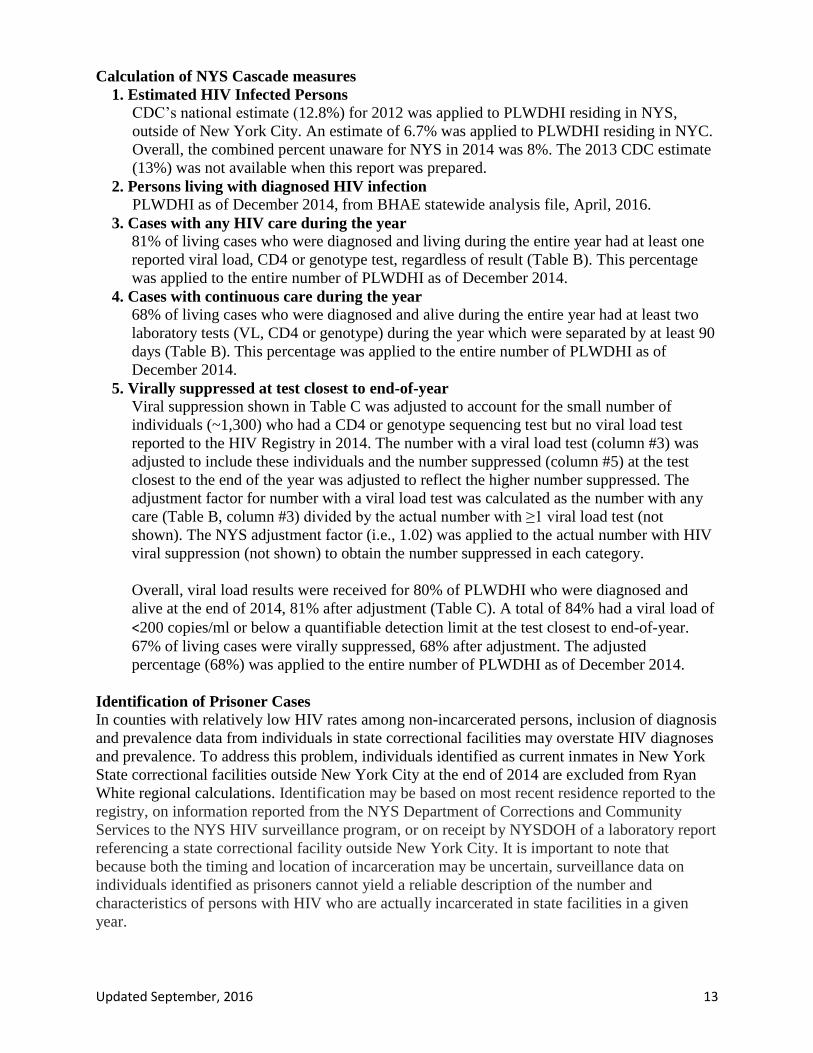
Calculation of NYS Cascade measures
1. Estimated HIV Infected Persons CDC’s national estimate (12.8%) for 2012 was applied to PLWDHI residing in NYS,
outside of New York City. An estimate of 6.7% was applied to PLWDHI residing in NYC.
Overall, the combined percent unaware for NYS in 2014 was 8%. The 2013 CDC estimate
(13%) was not available when this report was prepared.
2. Persons living with diagnosed HIV infection PLWDHI as of December 2014, from BHAE statewide analysis file, April, 2016.
3. Cases with any HIV care during the year
81% of living cases who were diagnosed and living during the entire year had at least one
reported viral load, CD4 or genotype test, regardless of result (Table B). This percentage
was applied to the entire number of PLWDHI as of December 2014.
4. Cases with continuous care during the year
68% of living cases who were diagnosed and alive during the entire year had at least two
laboratory tests (VL, CD4 or genotype) during the year which were separated by at least 90
days (Table B). This percentage was applied to the entire number of PLWDHI as of
December 2014.
5. Virally suppressed at test closest to end-of-year
Viral suppression shown in Table C was adjusted to account for the small number of
individuals (~1,300) who had a CD4 or genotype sequencing test but no viral load test
reported to the HIV Registry in 2014. The number with a viral load test (column #3) was
adjusted to include these individuals and the number suppressed (column #5) at the test
closest to the end of the year was adjusted to reflect the higher number suppressed. The
adjustment factor for number with a viral load test was calculated as the number with any
care (Table B, column #3) divided by the actual number with ≥1 viral load test (not
shown). The NYS adjustment factor (i.e., 1.02) was applied to the actual number with HIV
viral suppression (not shown) to obtain the number suppressed in each category.
Overall, viral load results were received for 80% of PLWDHI who were diagnosed and
alive at the end of 2014, 81% after adjustment (Table C). A total of 84% had a viral load of
<200 copies/ml or below a quantifiable detection limit at the test closest to end-of-year.
67% of living cases were virally suppressed, 68% after adjustment. The adjusted
percentage (68%) was applied to the entire number of PLWDHI as of December 2014.
Identification of Prisoner Cases
In counties with relatively low HIV rates among non-incarcerated persons, inclusion of diagnosis
and prevalence data from individuals in state correctional facilities may overstate HIV diagnoses
and prevalence. To address this problem, individuals identified as current inmates in New York
State correctional facilities outside New York City at the end of 2014 are excluded from Ryan
White regional calculations. Identification may be based on most recent residence reported to the
registry, on information reported from the NYS Department of Corrections and Community
Services to the NYS HIV surveillance program, or on receipt by NYSDOH of a laboratory report
referencing a state correctional facility outside New York City. It is important to note that
because both the timing and location of incarceration may be uncertain, surveillance data on
individuals identified as prisoners cannot yield a reliable description of the number and
characteristics of persons with HIV who are actually incarcerated in state facilities in a given
year.
Updated September, 2016 14
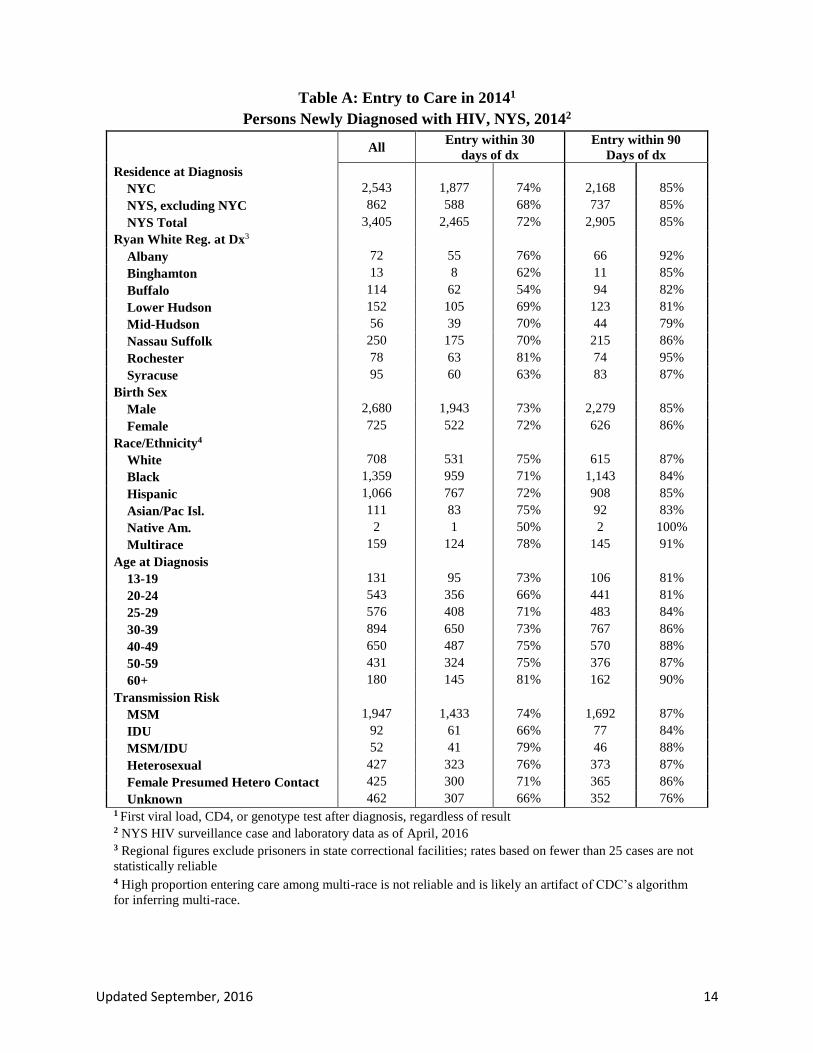
Table A: Entry to Care in 20141
Persons Newly Diagnosed with HIV, NYS, 20142
All
Entry within 30
days of dx
Entry within 90
Days of dx
Residence at Diagnosis
NYC 2,543 1,877 74% 2,168 85%
NYS, excluding NYC 862 588 68% 737 85%
NYS Total 3,405 2,465 72% 2,905 85%
Ryan White Reg. at Dx3
Albany 72 55 76% 66 92%
Binghamton 13 8 62% 11 85%
Buffalo 114 62 54% 94 82%
Lower Hudson 152 105 69% 123 81%
Mid-Hudson 56 39 70% 44 79%
Nassau Suffolk 250 175 70% 215 86%
Rochester 78 63 81% 74 95%
Syracuse 95 60 63% 83 87%
Birth Sex
Male 2,680 1,943 73% 2,279 85%
Female 725 522 72% 626 86%
Race/Ethnicity4
White 708 531 75% 615 87%
Black 1,359 959 71% 1,143 84%
Hispanic 1,066 767 72% 908 85%
Asian/Pac Isl. 111 83 75% 92 83%
Native Am. 2 1 50% 2 100%
Multirace 159 124 78% 145 91%
Age at Diagnosis
13-19 131 95 73% 106 81%
20-24 543 356 66% 441 81%
25-29 576 408 71% 483 84%
30-39 894 650 73% 767 86%
40-49 650 487 75% 570 88%
50-59 431 324 75% 376 87%
60+ 180 145 81% 162 90%
Transmission Risk
MSM 1,947 1,433 74% 1,692 87%
IDU 92 61 66% 77 84%
MSM/IDU 52 41 79% 46 88%
Heterosexual 427 323 76% 373 87%
Female Presumed Hetero Contact 425 300 71% 365 86%
Unknown 462 307 66% 352 76% 1 First viral load, CD4, or genotype test after diagnosis, regardless of result
2 NYS HIV surveillance case and laboratory data as of April, 2016
3 Regional figures exclude prisoners in state correctional facilities; rates based on fewer than 25 cases are not
statistically reliable
4 High proportion entering care among multi-race is not reliable and is likely an artifact of CDC’s algorithm
for inferring multi-race.
Updated September, 2016 15
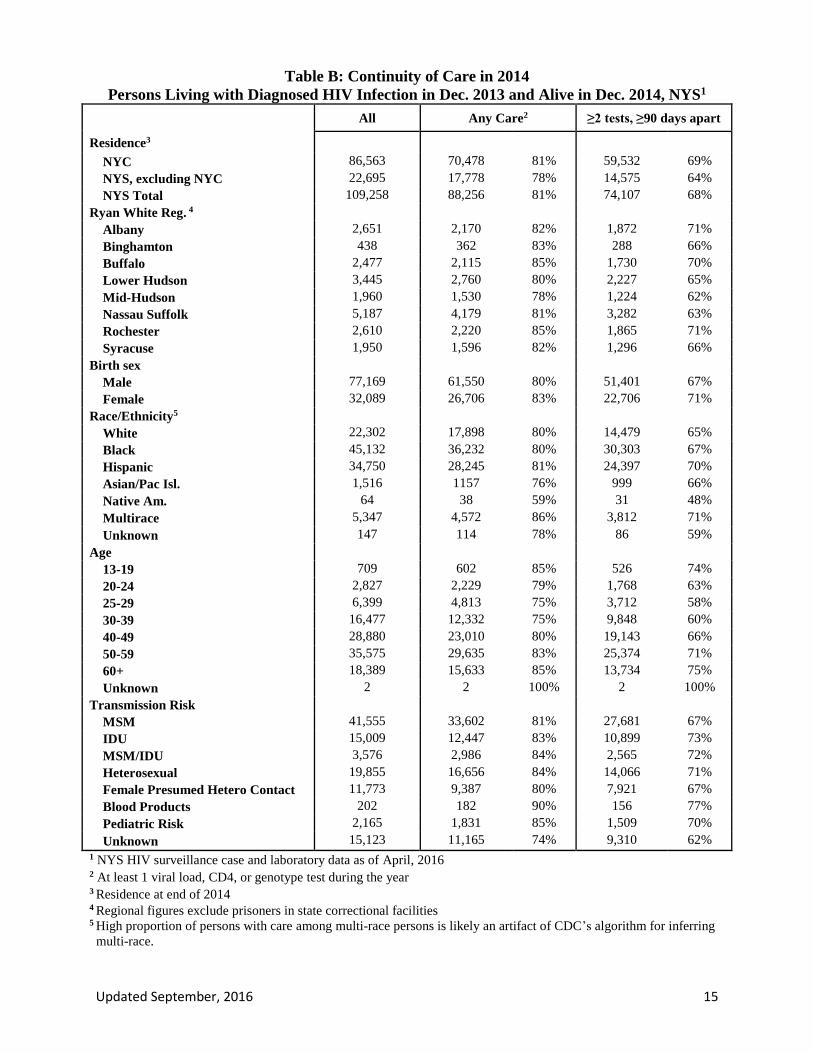
Table B: Continuity of Care in 2014
Persons Living with Diagnosed HIV Infection in Dec. 2013 and Alive in Dec. 2014, NYS1
All Any Care2 ≥2 tests, ≥90 days apart
Residence3
NYC 86,563 70,478 81% 59,532 69%
NYS, excluding NYC 22,695 17,778 78% 14,575 64%
NYS Total 109,258 88,256 81% 74,107 68%
Ryan White Reg. 4
Albany 2,651 2,170 82% 1,872 71%
Binghamton 438 362 83% 288 66%
Buffalo 2,477 2,115 85% 1,730 70%
Lower Hudson 3,445 2,760 80% 2,227 65%
Mid-Hudson 1,960 1,530 78% 1,224 62%
Nassau Suffolk 5,187 4,179 81% 3,282 63%
Rochester 2,610 2,220 85% 1,865 71%
Syracuse 1,950 1,596 82% 1,296 66%
Birth sex
Male 77,169 61,550 80% 51,401 67%
Female 32,089 26,706 83% 22,706 71%
Race/Ethnicity5
White 22,302 17,898 80% 14,479 65%
Black 45,132 36,232 80% 30,303 67%
Hispanic 34,750 28,245 81% 24,397 70%
Asian/Pac Isl. 1,516 1157 76% 999 66%
Native Am. 64 38 59% 31 48%
Multirace 5,347 4,572 86% 3,812 71%
Unknown 147 114 78% 86 59%
Age
13-19 709 602 85% 526 74%
20-24 2,827 2,229 79% 1,768 63%
25-29 6,399 4,813 75% 3,712 58%
30-39 16,477 12,332 75% 9,848 60%
40-49 28,880 23,010 80% 19,143 66%
50-59 35,575 29,635 83% 25,374 71%
60+ 18,389 15,633 85% 13,734 75%
Unknown 2 2 100% 2 100%
Transmission Risk
MSM 41,555 33,602 81% 27,681 67%
IDU 15,009 12,447 83% 10,899 73%
MSM/IDU 3,576 2,986 84% 2,565 72%
Heterosexual 19,855 16,656 84% 14,066 71%
Female Presumed Hetero Contact 11,773 9,387 80% 7,921 67%
Blood Products 202 182 90% 156 77%
Pediatric Risk 2,165 1,831 85% 1,509 70%
Unknown 15,123 11,165 74% 9,310 62%
1 NYS HIV surveillance case and laboratory data as of April, 2016 2 At least 1 viral load, CD4, or genotype test during the year 3 Residence at end of 2014 4 Regional figures exclude prisoners in state correctional facilities 5 High proportion of persons with care among multi-race persons is likely an artifact of CDC’s algorithm for inferring
multi-race.
16
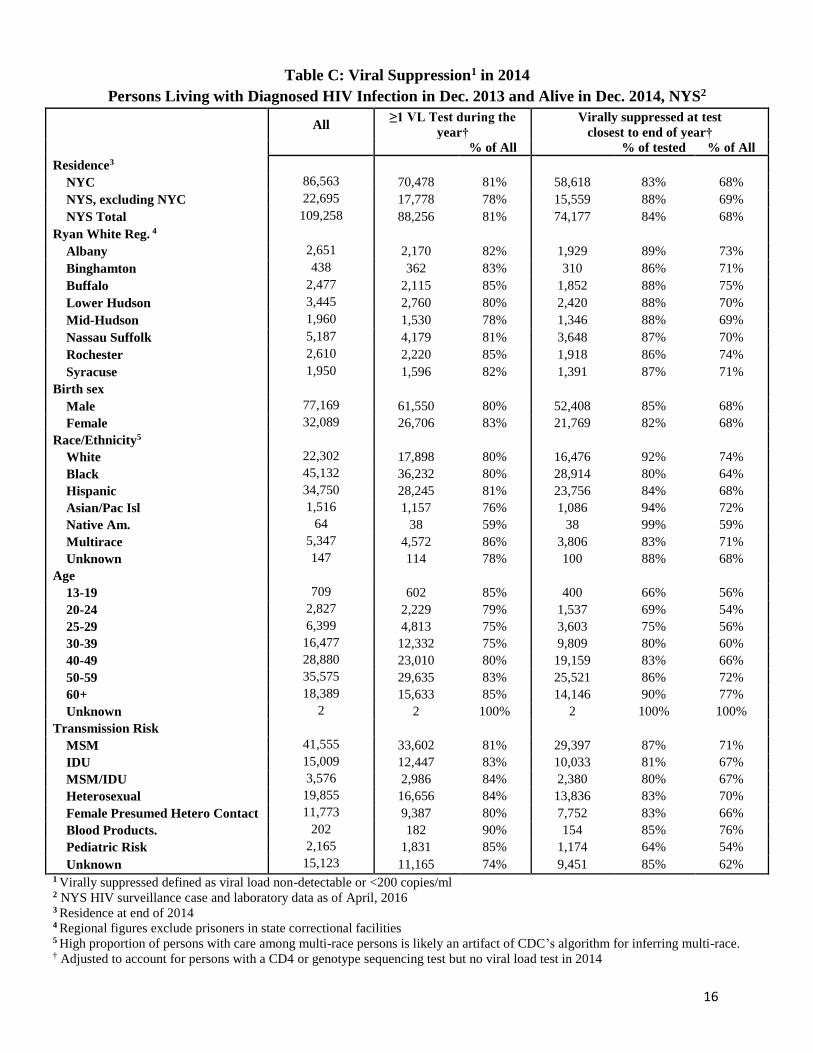
Table C: Viral Suppression1 in 2014
Persons Living with Diagnosed HIV Infection in Dec. 2013 and Alive in Dec. 2014, NYS2
All ≥1 VL Test during the
year†
Virally suppressed at test
closest to end of year†
% of All % of tested % of All
Residence3
NYC 86,563 70,478 81% 58,618 83% 68%
NYS, excluding NYC 22,695 17,778 78% 15,559 88% 69%
NYS Total 109,258 88,256 81% 74,177 84% 68%
Ryan White Reg. 4
Albany 2,651 2,170 82% 1,929 89% 73%
Binghamton 438 362 83% 310 86% 71%
Buffalo 2,477 2,115 85% 1,852 88% 75%
Lower Hudson 3,445 2,760 80% 2,420 88% 70%
Mid-Hudson 1,960 1,530 78% 1,346 88% 69%
Nassau Suffolk 5,187 4,179 81% 3,648 87% 70%
Rochester 2,610 2,220 85% 1,918 86% 74%
Syracuse 1,950 1,596 82% 1,391 87% 71%
Birth sex
Male 77,169 61,550 80% 52,408 85% 68%
Female 32,089 26,706 83% 21,769 82% 68%
Race/Ethnicity5
White 22,302 17,898 80% 16,476 92% 74%
Black 45,132 36,232 80% 28,914 80% 64%
Hispanic 34,750 28,245 81% 23,756 84% 68%
Asian/Pac Isl 1,516 1,157 76% 1,086 94% 72%
Native Am. 64 38 59% 38 99% 59%
Multirace 5,347 4,572 86% 3,806 83% 71%
Unknown 147 114 78% 100 88% 68%
Age
13-19 709 602 85% 400 66% 56%
20-24 2,827 2,229 79% 1,537 69% 54%
25-29 6,399 4,813 75% 3,603 75% 56%
30-39 16,477 12,332 75% 9,809 80% 60%
40-49 28,880 23,010 80% 19,159 83% 66%
50-59 35,575 29,635 83% 25,521 86% 72%
60+ 18,389 15,633 85% 14,146 90% 77%
Unknown 2 2 100% 2 100% 100%
Transmission Risk
MSM 41,555 33,602 81% 29,397 87% 71%
IDU 15,009 12,447 83% 10,033 81% 67%
MSM/IDU 3,576 2,986 84% 2,380 80% 67%
Heterosexual 19,855 16,656 84% 13,836 83% 70%
Female Presumed Hetero Contact 11,773 9,387 80% 7,752 83% 66%
Blood Products. 202 182 90% 154 85% 76%
Pediatric Risk 2,165 1,831 85% 1,174 64% 54%
Unknown 15,123 11,165 74% 9,451 85% 62% 1 Virally suppressed defined as viral load non-detectable or <200 copies/ml 2 NYS HIV surveillance case and laboratory data as of April, 2016 3 Residence at end of 2014 4 Regional figures exclude prisoners in state correctional facilities 5 High proportion of persons with care among multi-race persons is likely an artifact of CDC’s algorithm for inferring multi-race. † Adjusted to account for persons with a CD4 or genotype sequencing test but no viral load test in 2014