Embed Size (px)
Citation preview

Abt Associates Inc. 4800 Montgomery Lane, Suite 600 Bethesda, Maryland 20814 Tel: 301/913-0500 Fax: 301/652-3916
In collaboration with: Development Associates, Inc. Emory University Rollins School of Public Health Philoxenia International Travel, Inc. PATH Social Sectors Development Strategies, Inc. Training Resources Group Tulane University School of Public Health and Tropical Medicine University Research Co., LLC.
HIV/AIDS Home-Based Care Costing Guidelines August 2005 Prepared by: Natasha Hsi Abt Associates Inc. Stephen Musau Abt Associates Inc. Catherine Chanfreau Abt Associates Inc
Order No TK 019
This document was produced by PHRplus with funding from the US Agency forInternational Development (USAID) under Project No. 936-5974.13, Contract No.HRN-C-00-00-00019-00 and is in the public domain. The ideas and opinions in thisdocument are the authors’ and do not necessarily reflect those of USAID or itsemployees. Interested parties may use the report in part or whole, providing theymaintain the integrity of the report and do not misrepresent its findings or presentthe work as their own. This and other HFS, PHR, and PHRplus documents can beviewed and downloaded on the project website, www.PHRplus.org.
Partners for Health Reformplus

Mission
Partners for Health Reformplus is USAID’s flagship project for health policy and health system strengthening in developing and transitional countries. The five-year project (2000-2005) builds on the predecessor Partnerships for Health Reform Project, continuing PHR’s focus on health policy, financing, and organization, with new emphasis on community participation, infectious disease surveillance, and information systems that support the management and delivery of appropriate health services. PHRplus will focus on the following results:
Implementation of appropriate health system reform.
Generation of new financing for health care, as well as more effective use of existing funds.
Design and implementation of health information systems for disease surveillance.
Delivery of quality services by health workers.
Availability and appropriate use of health commodities.
August 2005
For additional copies of this report, contact the PHRplus Resource Center at [email protected] or visit our website at www.PHRplus.org. Contract/Project No.: HRN-C-00-00-00019-00 Submitted to: Karen Cavanaugh, CTO Health Systems Division Office of Health, Infectious Disease and Nutrition Center for Population, Health and Nutrition Bureau for Global Programs, Field Support and Research United States Agency for International Development
Recommended Citation His, Natasha, Stephen Musau, and Catherine Chanfreau August 2005. HIV/AIDS Home-Based Care Costing Guidelines. Bethesda, MD: The Partners for Health Reformplus Project, Abt Associates Inc.


Abstract
As the global HIV/AIDS community considers options to scale up caring for people living with HIV/AIDS (PLWHA) as well as providing treatment to those in need, understanding the cost of home-based care (HBC) is essential to guide the efficiency and reach of HIV/AIDS programs. Given the diversity of interventions that may constitute HBC, it is critical to define the services and clarify the inputs that drive costs. The guidelines present costing principles that can be applied to HBC interventions, particularly at community level, to allow for comparable determinations of the cost of diverse HBC approaches and better inform efficiency options based on credible and comparable cost information. They then take users through a 10-step process in which they define the boundaries of an existing, expanding, or proposed HBC program; identify and quantify the resource requirements of that program; collect needed cost and other data; analyze the data in terms of total and unit costs; and apply the results. The guidelines are intended for use by HBC program managers and planners; policymakers also will benefit from analysis results.


Table of Contents vii
Table of Contents
Acronyms .............................................................................................................................................. ix
Acknowledgments .................................................................................................................................xi
Introduction .........................................................................................................................................xiii
1. Overview and Guiding Principles................................................................................................... 1 1.1 Objective ...............................................................................................................................1 1.2 Target Audience ....................................................................................................................1 1.3 Defining Home-based Care ...................................................................................................2 1.4 Cost Analysis.........................................................................................................................4 1.5 Key Principles and Assumptions...........................................................................................5
2. Conducting the Cost Analysis ........................................................................................................ 9 2.1 Defining What is to be Costed as HBC .................................................................................9 2.2 Collecting the Data ..............................................................................................................11 2.3 Analyzing and interpreting the data ....................................................................................16
Annex A: Capital Costs Annualization Factors.................................................................................... 21
Annex B: References............................................................................................................................ 25
List of Tables
Table 1. Core HBC Activities ....................................................................................................................... 3 Table 2. Addendum HBC Activities ............................................................................................................. 4 Table 3. Direct versus Indirect Costs ............................................................................................................ 6 Table 4. Inputs to a HBC Service Package ................................................................................................. 11 Table 5. Sample Data Collection Plan ........................................................................................................ 12 Table 6. Calculating Worker Time per Home Visit .................................................................................... 13 Table 7. Estimating the Cost of Medical Supplies for Treating an Episode of Herpes............................... 14 Table 8. Breakdown of HBC Program Costs .............................................................................................. 17 Table 9. Unit Costs of a HBC Program ...................................................................................................... 18 Table 10. Examples of Efficiency............................................................................................................... 19

viii Table of Contents
List of Figures
Figure 1. Organizational Chart.................................................................................................................... 10 Figure 2. Breakdown of Costs..................................................................................................................... 17

Acronyms ix
Acronyms
AIDS Acquired Immunodeficiency Syndrome
ART Antiretroviral Therapy
HBC Home-based Care
HIV Human Immunodeficiency Virus
M&E Monitoring and Evaluation
PLWHA Persons Living with HIV/AIDS
WHO World Health Organization


Acknowledgments xi
Acknowledgments
The authors would like to thank the USAID office of HIV/AIDS for funding this work. These costing guidelines were field-tested in Uganda in March 2005. The PHRplus technical report entitled “Cost of home based care: a case of Uganda” by Stephen Musau, Catherine Chanfreau, and Lennie Bazira Kyomuhangi describes the field-test results. Susan Scribner, chief-of-party for the PHRplus project in Uganda, provided logistical support for the field-test.
Technical review of the report was provided by Marty Makinen, PHRplus/Abt Associates Inc. Gilbert Kombe and Paurvi Bhatt, also of Abt Associates, provided comments to the initial draft of the guidelines prior to the field test.


Introduction xiii
Introduction
As the global HIV/AIDS community considers options to scale up treatment and other aspects of care for people living with HIV/AIDS (PLWHA), providing care in the home of affected people is increasingly looked to as one option. Understanding the cost of home-based care (HBC) thus is essential to guide the efficiency and reach of organizations that care for PLWHA.
Although cost studies of providing HBC have been conducted (Chandler et al. 2004, Walker et al. 2003, International HIV/AIDS Alliance 2001), they have varied widely in their methodology and results, reflecting the diverse activities and inputs that constitute HBC. The costing exercises have used different cost “boundaries,” making it difficult to compare the results of the different studies and assess the efficiencies of the various programs.
These guidelines, therefore, present standard principles and steps of costing that can be applied to HBC interventions, particularly at the community level, to produce accurate and comparable cost estimates for the diverse HBC approaches and to better inform efficiency options.
The rest of this document is divided into two parts: the first is an overview of these HBC costing guidelines that outlines objectives and intended audiences, defines HBC, and describes the information that results from the cost analysis methodology and how it can benefit an organization providing HBC. The second part details the steps of the methodology.


1. Overview and Guiding Principles 1
1. Overview and Guiding Principles
1.1 Objective
Knowing the costs of an HBC program1 is critical to achieving its goals – products, services, and health outcomes – because goals shape the activities in which a program engages and these in turn determine the types and quantities of resources that are required. The value of these resources makes up the costs of the intervention.
These HBC guidelines takes users through a standardized methodology that helps define the activity boundaries of HBC and thus clarify the resources required by a program; it then quantifies the inputs. Results may be obtained in terms of total and average costs (also referred to as “unit costs”), direct and indirect costs, and fixed and variable costs. Results also inform the extent to which volume impacts the cost of delivering services through the HBC model. The results serve a number of purposes:
To increase understanding of the costs of an existing program,
To estimate the cost of expanding an existing program,
To project the cost of resources required to initiate a new HBC program.
Doing annual cost analyses also will, over time, allow an organization that delivers HBC to understand how their program costs – and related issues, such as efficiency – have evolved.
1.2 Target Audience
The primary audience for these costing guidelines is managers of HBC programs (or organizations that include HBC programs) or groups that contemplate establishing a program.
1 An HBC program may be stand-alone, or it may be a unit within a larger organization.
What questions do these HBC costing guidelines answer?
What defines the interventions in a HBC program? How can
one set the boundaries of HBC?
How much does it cost to deliver an existing HBC package of services? What are the total program costs and cost per patient or per home visit?
How much will it cost to deliver a particular HBC program with a specific package of services?
What are the key cost drivers of the HBC program?
How much of the HBC program costs are spent on direct client services (e.g., staff time, drugs, food), and indirect services – sometimes referred to as “overhead” (e.g., administration, training)?

2 HIV/AIDS Home-Based Care Costing Guidelines
HBC cost analysis is of benefit to policymakers as well as it demonstrates how the HBC intervention contributes to the overall strategy of providing care to HIV/AIDS patients. While this information may not be very useful when presented for only a few HBC programs, it can be very valuable when a representative sample of HBC programs is included in a nationwide study. Such a study would provide a good picture of the coverage and cost of the HBC strategy in the country. HBC eases the pressure on hospitals for inpatient care of terminally ill AIDS patients. The cost of delivering this care in the home setting can be compared to the associated benefits to decide whether it is worth investing in the strategy or not. While some of the benefits may be difficult to quantify, (e.g., improved staff morale in hospitals due to a lower workload, or the availability of hospital beds for other non-HIV-related illnesses), it is still important to obtain all evidence, quantifiable or anecdotal, on which policymakers should base decisions.
1.3 Defining Home-based Care
HBC is one of the models of care that deliver health care and other support to PLWHA and their families. The World Health Organization (WHO) defines HBC as the provision of services in support the HIV/AIDS care process that take place in the home of the HIV-infected person (WHO 1989). It includes physical, psychosocial, palliative, and spiritual activities (WHO 2002) such as clinical monitoring and management of opportunistic infections (prophylaxis and treatment), counseling, food supplementation/nutrition, and clean water. Services are provided by a mix of staff that usually includes community volunteers, community health workers, nurses, doctors, and other professionals.
Other models of care that deliver health and support services to PLWHA and their families may require the PLWHA to travel to a community center to obtain food and counseling, and to a health center for palliative care. Still other models of care provide anti-retroviral therapy (ART) only in specialized clinics and require the PLWHA to travel to the clinic for periodic monitoring.
It is important to distinguish home-based care from community-based HIV/AIDS care and support, which comprises all AIDS activities (not limited to in-home care) that:
Are based outside conventional health facilities (hospitals, clinics, health centers), but which may have linkages with the formal health and welfare sector; and
Address any aspect of the “continuum of care and support,” from time of infection through to death and impact on survivors (Rusell 2000).
The costing guidelines in this manual apply only to HBC models, and are not directed at community-based programs.
In addition to distinguishing between HBC and community-based care, it is important to distinguish between core elements of HBC from “addendum” elements.
Core elements of HBC Table 1 lists the core elements that an HBC service package may comprise, and the activities that
go into providing those services. The activities are related to the direct provision of care to the HIV/AIDS client and family in the home. When conducting a costing exercise, it is important to first identify all the core activities offered by the HBC program so as to clearly define the boundaries of what is to be costed.

1. Overview and Guiding Principles 3
Table 1. Core HBC Activities
Core Elements Core Activities Provision of care (Service package)
Basic physical care Palliative care Psychosocial support and counseling Treatment of tuberculosis and opportunistic infections Food supplementation
Administration
Network of services and resources Ensuring access to referral services
Transportation to referral services Payment waivers (ability to pay)
Coordination with facilities Discharge planning Written referral
Benefits to families: cash allowances, caregiver compensation (in-kind, honorarium) Supply and storage of HBC kits, necessary drugs and commodities, and equipment Staffing: supervision, recruitment, staff rotation between HBC and community clinic to avoid burn-out Budget and financial management including income-generating activities Monitoring and evaluation
Quality assurance Monitoring and supervision Evaluation
Education/Training (Target groups: PLWHA, family members, community health workers, community volunteers, administrative staff)
Curriculum development Educational management and curriculum delivery Outreach activities Education to reduce stigma Mass media involvement Evaluation of education
Source: WHO 2002
Addenda to core activities As Table 1 shows, the original (WHO) focus of most HBC programs was on the care of ill
people and family caregivers. However, as the AIDS epidemic continues to grow, HBC is evolving to accommodate additional needs of affected persons and families. For example, some programs provide care to children orphaned by the epidemic. Addendum items might include the following:
Care for orphans
Assistance to families to establish income-generating ventures
Community centers for AIDS patients, i.e., community support groups, funded by the HBC program
Vocational training activities for AIDS patients

4 HIV/AIDS Home-Based Care Costing Guidelines
Table 2 lists activities that are commonly included in orphan care.
Table 2. Addendum HBC Activities
Elements Activities Orphan care Identification of family member or surrogate mother for care of orphans after parents’ death
Support of child-headed household Placement with foster parents Fostering grants Ensuring basic necessities (food, rent, and clothes)
Due to the increasing importance of orphan support, it is included in the costing tables as an
“addendum.” To the extent possible, data needed to estimate its cost can be collected as part of the data collection effort for HBC costs. Nevertheless, this methodology focuses on costing the core elements of HBC, and data collectors should not lose this focus.
1.4 Cost Analysis
What is cost analysis? Costs represent the monetary value of all resources consumed in the implementation of an
activity undertaken to achieve a program’s goals. Cost analysis is the organization and investigation of cost data; results provide management with meaningful information on which to base its decisions. Cost analysis can involve a number of steps, among which are the following:
Comparing different pieces of data;
Relating cost and activity data;
Examining trends over time;
Examining relationships between different cost items;
Comparing similar cost items of different organizations.
How can cost analysis benefit HBC? As noted above, results of a cost analysis can benefit both existing HBC programs and those
under consideration.
Existing programs: By providing accurate and timely cost information, cost analysis helps implement and evaluate existing programs. It serves as an indicator of efficiency in service delivery and allows managers to see whether existing resources will allow them to achieve program goals.
Expanding or new programs: Cost analysis is an important tool to use when considering expansion of an existing program or planning a new one. A prospective study of costs and how they behave with changes in volume of activity and over time is important information that can assist managers in choosing from among different models of service delivery or between competing projects that seek to achieve the same objectives.

1. Overview and Guiding Principles 5
In addition, performing cost analyses on a regular basis (for example, annually) gives programs a picture of how their costs have evolved, and, therefore, a way to measure their level of efficiency, an important ingredient of program sustainability and success. For example, if a program provided services at $50/client in 2002 and at $60/client in 2003, program administrators should investigate whether costs increased because the package of services offered was expanded, the price of key inputs increased, the client volume decreased, the efficiency level of service delivery declined, or some other factor or combination of factors occurred.
What do the guidelines not cover? The guideline methodology is not a cost-effectiveness or cost-benefit analysis, though the costs
calculated can be used as a step towards such economic analyses. A cost-effectiveness analysis would examine different HBC models to determine which one(s) provide care at the lowest cost per unit of output (e.g., patients served). A cost-benefit analysis would compare the costs of the HBC program against the benefits realized to determine whether the benefits outweigh the costs; to do this, benefits would have to be quantified and valued so that they can be compared to the costs using a common currency. The costs that are calculated by this methodology also do not estimate savings (such as reductions in inpatient admissions of AIDS patients) that might result from delivery of care to the patient at home. All these economic analyses would be valuable to policymakers considering various HBC models, but they are beyond the scope of these guidelines.
1.5 Key Principles and Assumptions
Costing approach The cost analysis is presented from the perspective of the program manager of an organization
providing HBC. As a result, any costs that are borne by either the household or the patient are not included. Such costs might include the time that a member of the household spends taking care of the PLWHA or any money spent on drugs or transport and so on.
The primary “cost driver” for this costing is the patient; i.e. the volume of patients is what influences (“drives”) costs more than any other factor. For example, the cost of drugs and other medical supplies is closely related to the number of patients in the program. On some occasions, however, the volume of patients may not be the best approach to calculating the cost of resources used and it may be necessary to use the household as the cost driver. This applies particularly where certain inputs are targeted to an entire household rather than to the individual patient. Examples of this include the cost of food rations that are given to a household and staff time for home visits.
The guidelines follow the basic principles of activity-based costing by identifying all activities necessary to provide the HBC services and then calculating the costs of carrying out each activity. Costs for each activity comprise recurrent and capital costs, direct and indirect costs. Recurrent costs are the routine costs of resources that are consumed within a year, i.e., non-capital items such as labor and medical supplies. Capital costs represent the annual portion of the cost of durable assets (e.g., vehicles, equipment, and buildings).

6 HIV/AIDS Home-Based Care Costing Guidelines
Classifying total costs
Direct and indirect costs How costs are presented is important, as this will give different facets of the cost structure. Costs
can be presented in terms of their relation to the services of the HBC program. These can be either direct or indirect. Direct costs are those that can be linked directly to a service while indirect costs are shared by many services and cannot be directly linked; for example, administrative salaries relate to the program as a whole and not to a specific patient-related service. Indirect costs are also referred to as “overhead.” Table 3 lists costs typically incurred by a HBC program and classifies them as direct or indirect.
This classification provides a clear view of what costs are within the control of a program manager and therefore what he/she can be held accountable for.
Table 3. Direct versus Indirect Costs
Input Type of cost Community volunteer providing direct client services Direct Gloves Direct Administrator working half-time on HBC program Indirect Rent Indirect Motocycle for HBC program Direct
Fixed and variable costs Fixed costs are those costs that tend to stay unchanged, at least in the short run, despite changes
in volume of services delivered. For example, staff who are permanent employees will continue to be paid even if the patient volume is temporarily less than normal. (A long-term decline of course necessitates staff layoffs or reassignments.) Variable costs change with the volume of activity; for example, less food and drugs are needed if patient volume declines.
A presentation of total costs in terms of fixed and variable costs allows stakeholders to see the short-term commitments of the program’s fixed capacity. The proportion of fixed costs relative to variable costs also indicates the expected magnitude of impact of a change in the volume of activity. If program costs are predominantly fixed, a change in patient volume of patients will not greatly change total costs in the short-run; conversely, if the costs are predominantly variable, then a change in volume can be expected to have a corresponding impact on costs.
Data sources These guidelines primarily use historical data and hence rely on existing accounting and other
records. These are referred to as secondary data sources. By examining such records (for example, payroll data, past usage of drugs, or patient visitation records), one can determine what inputs were required for a certain number of home visits or clients served. When existing records do not provide sufficient data, it is necessary to either perform estimates based on what data are available or to conduct primary data collection. Primary data collection involves doing research to obtain data from the recipients or givers of care. For example, if the amount of time per home visit is not known, a sample of home visits can be observed to determine the amount of time spent in each home and the

1. Overview and Guiding Principles 7
activities conducted during the home visit. Depending on the maturity of the HBC program, many of the data may be available from secondary sources, although some information, such as the allocation of staff time to different activities, would still require primary data collection.
Determination of costs Many organizations that run HBC programs do not keep detailed records of their expenditures on
HBC-specific activities. In such situations it is necessary to calculate the relevant costs using a “bottom-up” approach. This approach starts by establishing the quantity (Q) of resources consumed by an activity and then multiplying this by the unit cost or price (P) of the resource. The cost of the activity is therefore the sum of (P x Q) for all the resources used. For example, to calculate the labor costs, the number of days worked by a health worker would be multiplied by the daily cost of the health worker. As noted in the preceding section, information on both the unit cost and the quantity of a resource used can be collected either from secondary sources (for example, by reviewing payroll records) or through primary data collection (for example, by administering questionnaires to obtain data from the health worker).


2. Conducting the Costing Analysis 9
2. Conducting the Cost Analysis
Using the principles described in chapter 1, these guidelines set out the costing exercise in 10 steps, which are grouped into three sections: defining what is to be costed, collecting the data, and analyzing and interpreting the data.
Defining what is to be costed as HBC Step 1: Prepare an organizational chart of the organization providing HBC
Step 2: Choose the reference period of time for which data will be collected
Step 3: Identify the package of services offered during home visits
Step 4: Determine the primary activities performed in the delivery of the service package
Step 5: Identify resource inputs for each service
Collecting the data Step 6: Design instruments for data collection and identify key informants
Step 7: Make a data collection plan
Step 8: Collect data sources (secondary and primary)
Analyzing and interpreting the data Step 9: Summarize cost and service data for analysis
Step 10: Apply results of cost analysis
2.1 Defining What is to be Costed as HBC
Step 1: Prepare an organizational chart A HBC program can exist as a stand-alone organization or it can be a unit of an organization that
provides other services (for example, a hospital or health center). The placement of the HBC services within a larger organization makes the costing analysis more involved as many organizational resources may be shared by different departments or programs.
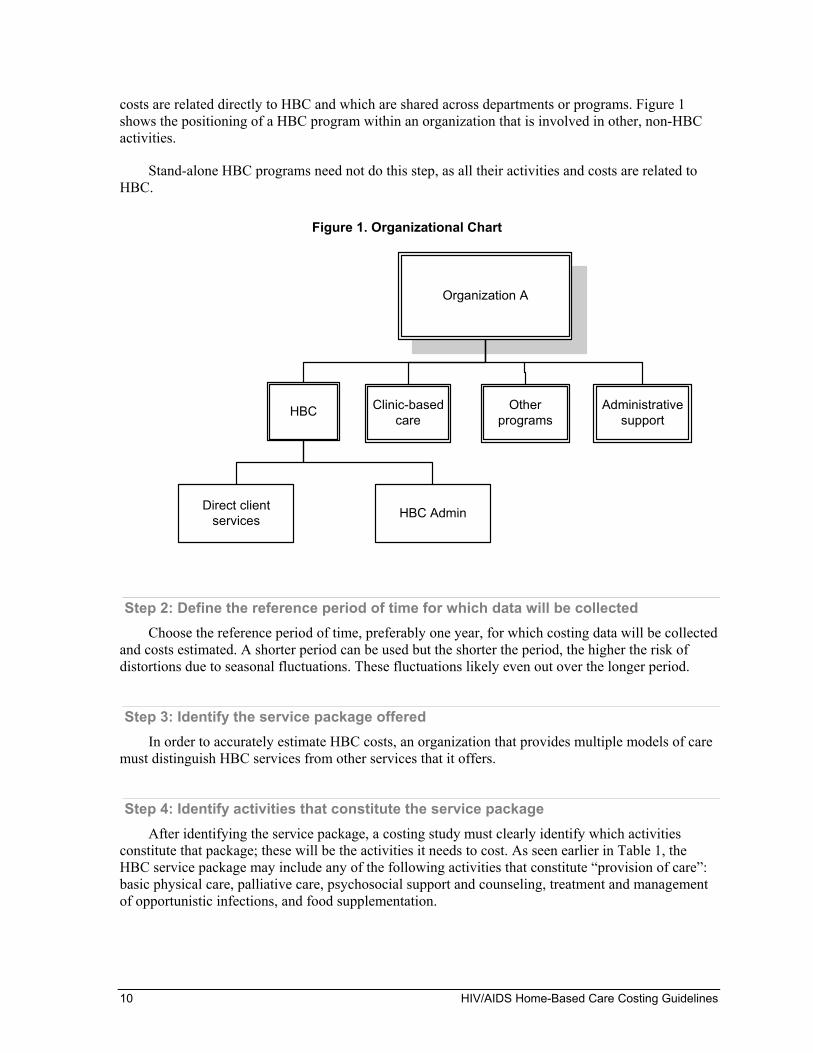
When beginning a HBC costing exercise, multi-program organizations should prepare an organizational chart that shows the full range of departments and programs in the organization, including those not directly involved in providing HBC services. This is will help in deciding which
10 HIV/AIDS Home-Based Care Costing Guidelines
Organization A
Clinic-basedcare
Administrativesupport
HBC
Direct clientservices HBC Admin
Otherprograms
costs are related directly to HBC and which are shared across departments or programs. Figure 1 shows the positioning of a HBC program within an organization that is involved in other, non-HBC activities.
Stand-alone HBC programs need not do this step, as all their activities and costs are related to HBC.
Figure 1. Organizational Chart
Step 2: Define the reference period of time for which data will be collected Choose the reference period of time, preferably one year, for which costing data will be collected
and costs estimated. A shorter period can be used but the shorter the period, the higher the risk of distortions due to seasonal fluctuations. These fluctuations likely even out over the longer period.
Step 3: Identify the service package offered In order to accurately estimate HBC costs, an organization that provides multiple models of care
must distinguish HBC services from other services that it offers.
Step 4: Identify activities that constitute the service package After identifying the service package, a costing study must clearly identify which activities
constitute that package; these will be the activities it needs to cost. As seen earlier in Table 1, the HBC service package may include any of the following activities that constitute “provision of care”: basic physical care, palliative care, psychosocial support and counseling, treatment and management of opportunistic infections, and food supplementation.

2. Conducting the Costing Analysis 11
Step 5. Identify resource inputs for each core element of the HBC program Each activity that constitutes the service package has inputs – staff time, transport, drugs and
supplies, etc. – that go into the implementation of the activity. This step then, is to break down each activity into its constituent inputs, as shown in Table 4 for direct provision of care activities, the major core element of a HBC program and thus the most costly. Some inputs, such as staff time and transport, may be shared by multiple activities; others, such as food, will be an input only to food supplementation.
Table 4. Inputs to a HBC Service Package
Care activities:
Inputs:
Basic physical
care
Palliative care
Psychosocial support and counseling
Treatment and management of opportunistic
infections
Food supplementation
Staff time (hours) 5 2 2 2 1 Drugs (type/amount) Paracetamol,
10 tablets Acyclovir,
25 tablets
Food (type/amount)
Maize, 5 kg
In addition to identifying inputs that are directly related to service package activities, this must be done for administrative activities, and for the other core elements of the HBC program.
2.2 Collecting the Data
Step 6. Determine sources for the data needed, and design instruments to collect primary data
For each resource input, you will need to collect data about the unit cost and the quantity or volume consumed. As discussed above, data come from secondary and primary sources. If the data are not available from secondary sources (program financial records, receipts, etc.), you must determine what primary data collection (staff interviews, observations visits, etc.) will take place. If primary data collection is needed, instruments such as interview questionnaires must be developed and key informants identified.
Step 7: Make a data collection plan A data collection plan is developed based on the resource inputs that must be costed. It lists
which data are needed and the sources of the data. The plan can take tabular form; Table 5 is an example of a plan.

12 HIV/AIDS Home-Based Care Costing Guidelines
Table 5. Sample Data Collection Plan
Data needed Data sources Data collection method Staff cost per year Payroll statements
Staff interviews Secondary Primary
Number of hours worked on home visits Staff interviews Primary Cost of fuel Fuel receipts Secondary Fuel consumed per year Review accounting records
Driver interviews Secondary Primary
Step 8. Collect data Collection of financial data starts in the finance office/department of the organization that
delivers HBC. Does the accounting system allow the costs of the HBC program to be shown separately from other costs? The following sections discuss data collection from secondary sources as well as what to do if data gaps exist or HBC data cannot be disaggregated from other data.
Direct Client Care Labor
Labor is any staff time used for the delivery of HBC services. It is usually one of the largest costs of a HBC program; it therefore is important that it is calculated as accurately as possible because even a small error can have a significant impact on the final cost estimate. In order to capture the full economic cost, all staff time – including volunteer time – must be valued.
Labor costs usually include gross salaries (i.e., before deductions) and benefits (such as health insurance, death benefits, housing allowances). Labor costs also include all allowances paid to staff when they go on home visits. This amount should be obtainable from the accounting records or estimated from the number of home visits that qualified for allowances multiplied by the allowance paid per day of home visits.
Labor costs for a home visit may be difficult to disaggregate by activity (palliative care, counseling and support, treatment of opportunistic infections, etc.), because it is likely that a single HBC worker2 provides all of those services during a home visit. (Conversely, the home visit may be conducted by a team of health workers and the cost of the home visit will include the time costs of the different categories of staff.) Nevertheless, labor costs can be estimated for a package of care delivered during an average home visit. To do this, a sample of (a worker’s) home visits is selected from home-visit records over a period of time (say, 2–3 months). The time (in hours) spent should include the worker’s transport time to and from the client’s home. An average time can be computed from the sampled home visits. The average time per home visit would be the sum of time it took to do all the home visits divided by the number of home visits in the sample. Table 6 illustrates this. The average time for a home visit is multiplied by the cost per hour for each staff member involved in the home visit to get the labor cost. Staff cost per hour is based on the salary and benefits that staffs earn in a year divided by the number of working hours in a year. Annual number of working hours can be calculated as the number of working days in a year (i.e., exclude vacations and holidays, non-working
2 The term HBC “worker” is used regardless of whether this person is paid or a volunteer.
2. Conducting the Costing Analysis 13
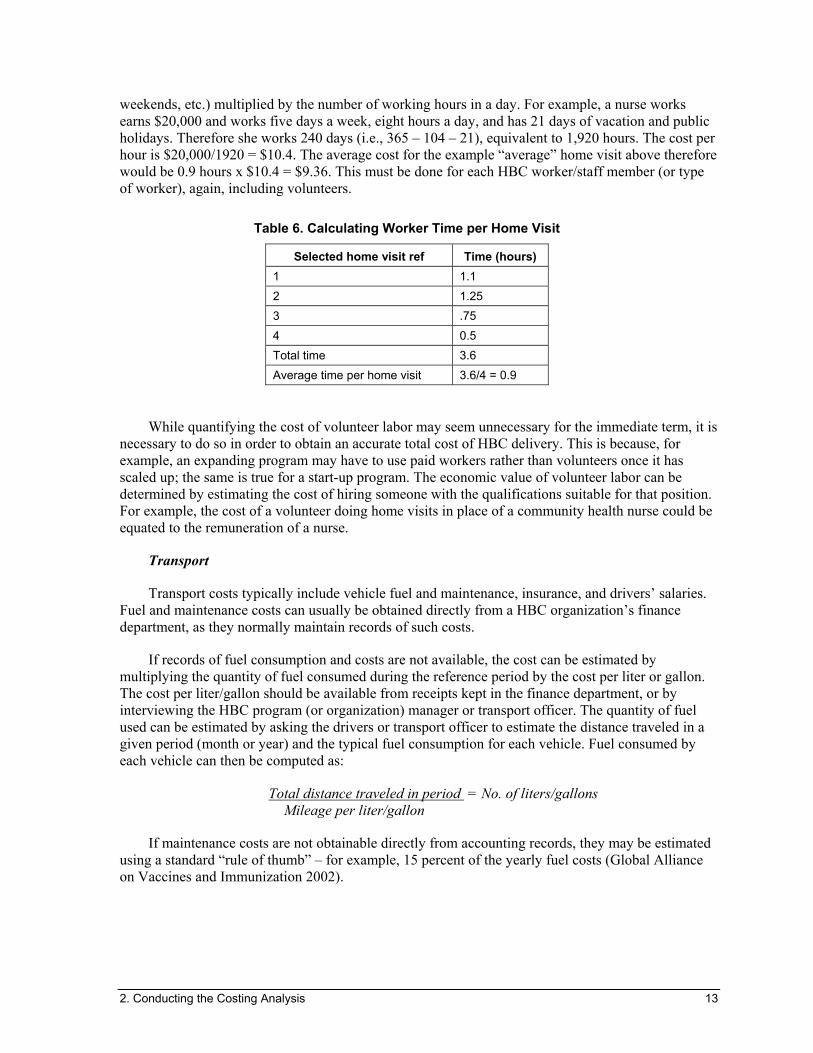
weekends, etc.) multiplied by the number of working hours in a day. For example, a nurse works earns $20,000 and works five days a week, eight hours a day, and has 21 days of vacation and public holidays. Therefore she works 240 days (i.e., 365 – 104 – 21), equivalent to 1,920 hours. The cost per hour is $20,000/1920 = $10.4. The average cost for the example “average” home visit above therefore would be 0.9 hours x $10.4 = $9.36. This must be done for each HBC worker/staff member (or type of worker), again, including volunteers.
Table 6. Calculating Worker Time per Home Visit
Selected home visit ref Time (hours) 1 1.1 2 1.25 3 .75 4 0.5 Total time 3.6 Average time per home visit 3.6/4 = 0.9
While quantifying the cost of volunteer labor may seem unnecessary for the immediate term, it is necessary to do so in order to obtain an accurate total cost of HBC delivery. This is because, for example, an expanding program may have to use paid workers rather than volunteers once it has scaled up; the same is true for a start-up program. The economic value of volunteer labor can be determined by estimating the cost of hiring someone with the qualifications suitable for that position. For example, the cost of a volunteer doing home visits in place of a community health nurse could be equated to the remuneration of a nurse.
Transport
Transport costs typically include vehicle fuel and maintenance, insurance, and drivers’ salaries. Fuel and maintenance costs can usually be obtained directly from a HBC organization’s finance department, as they normally maintain records of such costs.
If records of fuel consumption and costs are not available, the cost can be estimated by multiplying the quantity of fuel consumed during the reference period by the cost per liter or gallon. The cost per liter/gallon should be available from receipts kept in the finance department, or by interviewing the HBC program (or organization) manager or transport officer. The quantity of fuel used can be estimated by asking the drivers or transport officer to estimate the distance traveled in a given period (month or year) and the typical fuel consumption for each vehicle. Fuel consumed by each vehicle can then be computed as:
Total distance traveled in period = No. of liters/gallons Mileage per liter/gallon
If maintenance costs are not obtainable directly from accounting records, they may be estimated using a standard “rule of thumb” – for example, 15 percent of the yearly fuel costs (Global Alliance on Vaccines and Immunization 2002).
14 HIV/AIDS Home-Based Care Costing Guidelines
Drugs and supplies
Ideally, there are records of cost and quantity of drugs and medical supplies consumed by the HBC program. However, accounting records of large health service delivery organizations may not track the cost of drugs and medical supplies consumed by the HBC program separately from what is used by other departments or programs. For example, records of a clinic or hospital pharmacy may not show the value of issues to the HBC program; in many cases, they record only the quantities issued to the program.
Sometimes, even the quantities issued to individual departments or programs are not available. In this case, the program’s cost of medical supplies must be estimate. This is done by (1) identifying the types of services provided that involve medical supplies, (2) verifying the cost of each resource (supply) needed to deliver one unit of each service, and (3) multiplying that unit cost by the number of times the service is delivered, which gives a (sub)total medical supplies cost for each type of service, and (4) adding up all these (sub)totals for an aggregate total cost to the program of drugs and medical supplies.
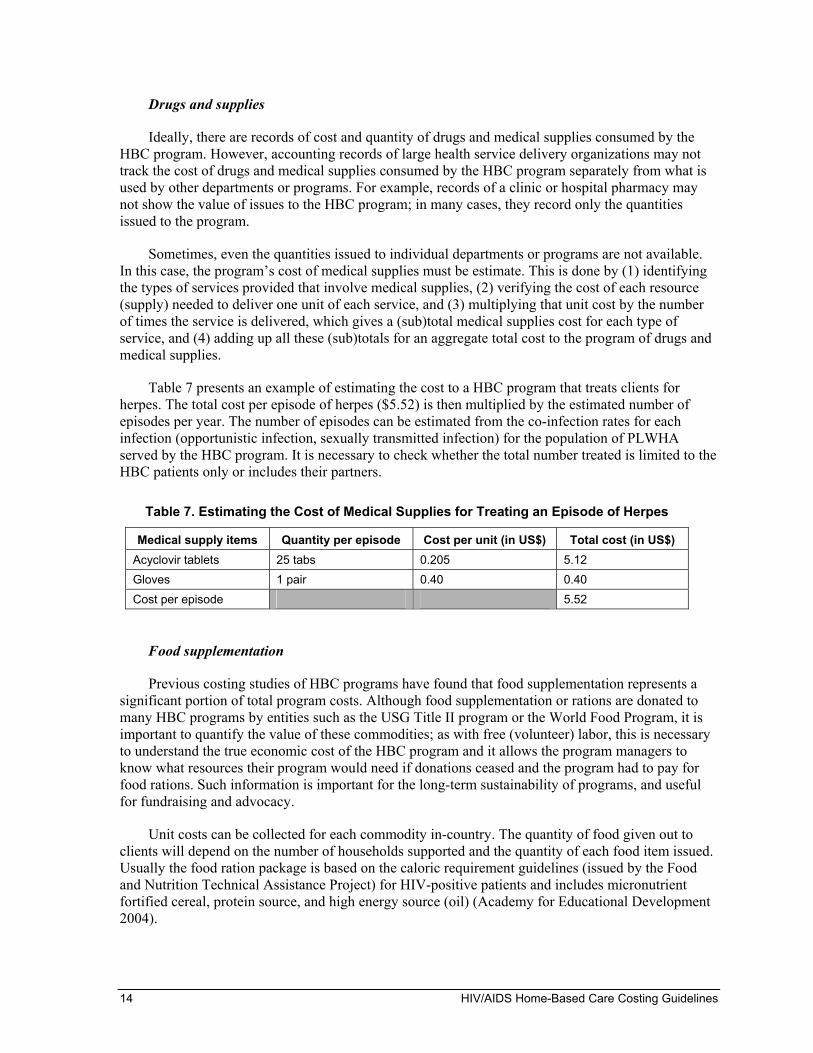
Table 7 presents an example of estimating the cost to a HBC program that treats clients for herpes. The total cost per episode of herpes ($5.52) is then multiplied by the estimated number of episodes per year. The number of episodes can be estimated from the co-infection rates for each infection (opportunistic infection, sexually transmitted infection) for the population of PLWHA served by the HBC program. It is necessary to check whether the total number treated is limited to the HBC patients only or includes their partners.
Table 7. Estimating the Cost of Medical Supplies for Treating an Episode of Herpes
Medical supply items Quantity per episode Cost per unit (in US$) Total cost (in US$) Acyclovir tablets 25 tabs 0.205 5.12 Gloves 1 pair 0.40 0.40 Cost per episode 5.52
Food supplementation
Previous costing studies of HBC programs have found that food supplementation represents a significant portion of total program costs. Although food supplementation or rations are donated to many HBC programs by entities such as the USG Title II program or the World Food Program, it is important to quantify the value of these commodities; as with free (volunteer) labor, this is necessary to understand the true economic cost of the HBC program and it allows the program managers to know what resources their program would need if donations ceased and the program had to pay for food rations. Such information is important for the long-term sustainability of programs, and useful for fundraising and advocacy.
Unit costs can be collected for each commodity in-country. The quantity of food given out to clients will depend on the number of households supported and the quantity of each food item issued. Usually the food ration package is based on the caloric requirement guidelines (issued by the Food and Nutrition Technical Assistance Project) for HIV-positive patients and includes micronutrient fortified cereal, protein source, and high energy source (oil) (Academy for Educational Development 2004).

2. Conducting the Costing Analysis 15
When an HBC program considers including food supplementation in its service package, it can estimate food costs using a default caloric and protein requirement regardless of age and sex; a minimum of 2,100 kcal of energy and 52.5g of protein per person per day are recommended (Academy for Educational Development 2004).
Workload
It is advisable to collect service and other workload statistics, for example, number of patients, number of households served, number of home visits for the reference costing period. Some of these data may be available from records in the office of the HBC program manager, but some may need to be collected through staff interviews or observation.
Administration The other major core element of a HBC program is administration. Many HBC programs that are
run by a general health care facility (hospital or health center) will designate a staff person to administer the HBC program, sometimes part-time. Stand-alone HBC programs could have full-time people dedicated to administration. The primary inputs for administration is staff time, which is devoted to activities such as the following: fundraising, coordinating home visit schedules, accounting, human resource management, and other office activities. It also includes capital costs and overhead.
Overhead
Overhead refers to items such as rent, utilities, and building insurance and maintenance. When a HBC program is part of a larger organization, the costs of these items are shared by the HBC program and other departments and programs. These shared (indirect) costs must be assigned to each program to the extent feasible.
Indirect costs are allocated across programs on any reasonable basis that recognizes the relative intensity of resource use by each program. Usual bases for allocating indirect costs, also called “cost drivers,” include the following: space occupied; number of staff; total direct costs. For example, the use of electricity or building maintenance may be assumed to be proportional to the amount of space occupied by each, and costs are allocated accordingly. When there is no obvious cost driver, the total direct costs for each program can be used as the basis for allocating indirect costs. This assumes that the higher the direct costs of the program, the higher should be its share of the overall indirect costs.
No allocation base is completely accurate. But these indirect costs likely are not be a large component of a HBC program’s total costs; it may not be worth the time and effort to look for greater accuracy when the impact on the final result will likely be negligible.
Capital
Capital costs are considered here as predominantly administrative, because they tend to cut across many activities. The capital costs of an HBC program are the costs of all fixed assets (items that have a life of one year or longer) used by the program. Fixed assets include: buildings, furniture, equipment, vehicles, motorcycles, and bicycles. A cost analysis annualizes capital costs, that is, it includes only the value of the fixed asset that is considered to have been used up in the provision of care in the period – usually one year – of the analysis. Some HBC programs will have calculated this capital cost as “depreciation” and included it in their income and expenditure statements. However, depreciation calculated by reference to the original cost of the asset may understate the real cost of

16 HIV/AIDS Home-Based Care Costing Guidelines
using the asset because it does not recognize the impact of inflation on the replacement cost of the asset.
The cost of using an asset for a year is calculated by dividing the replacement cost of the asset by the expected economic useful life of the asset. This can also be achieved by using annualization factors that combine the life of the asset and the inflation rate to give a number that, when applied to the historical purchase cost of the asset, is an adequate estimate of current cost. A table containing annualization factors is in Annex A. To use this table, look up the relevant factor at the row/column intersection for the number of years (row) and the interest rate (column). Divide the cost of the asset by this number to get the annual capital cost.
Monitoring and evaluation
Monitoring and evaluation (M&E) is included under this section on administrative costs because it tends to be applied mostly at a level higher than the service delivery level. Some aspects of monitoring are part of service delivery in that health care staff will keep the records that collect data for monitoring purposes. However, M&E is mostly carried out by senior management, who receive reports and analyze them for action to be taken.
Costs related to M&E involve mostly staff time and some stationery. These can estimated through interviews with the staffs involved to determine the amount of time devoted to HBC-specific M&E activities and the office supplies used up.
Education and Training Key costs incurred in education and training include labor (preparation of materials and
conducting the training); participant costs (per diems, transport, and stationery); transport and per diems for trainers; hire of venue. These costs tend to be quite easily obtainable because most programs prepare a separate budget and also keep records for audit and for planning future training events.
If records are not available, estimates can be made based on easily obtainable per diem and venue rental rates and usage of stationeries from past experience.
2.3 Analyzing and interpreting the data
Step 9: Summarize cost and service data for analysis Once all data are collected, they must be organized in a manner that is suitable for analysis, i.e.,
that answers the specific questions and needs of the target audience. Results also need to be presented in a way that is most useful to that audience.
These guidelines do basic analysis using Excel spreadsheets. If large amounts of data are collected and there is need to carry out various tests of significance or other more advanced statistical analyses, it is advisable to use specialized data analysis tools such as SPSS (Statistical Package for the Social Sciences).

2. Conducting the Costing Analysis 17
Calculating total costs A listing of all costs, by category (staff, transport, drugs and medical supplies, etc.) is a useful
first step in the cost analysis. Table 8 shows such a breakdown of costs for an HBC program. The list indicates which costs are significant by presenting the costs in order of percentage of total costs that they represent. If there are multiple cost items that are relatively small, these may be grouped into a single item called “other costs.” Reducing the amount of detail makes the information more quickly comprehensible, especially by stakeholders (program managers, policymakers, etc.) who are not financial analysts.
Table 8. Breakdown of HBC Program Costs
Cost Category Cost in US$ Percentage of total cost
Staff 98,771 28.20%
Transport 87,872 25.00% Capital costs 43,792 12.50% Other non-capital 35,041 10.00%
Food 31,798 0.90% Volunteer incentives 17,133 4.90%
Training 17,095 4.90% Other family support 15,342 4.30% Drugs and medical supplies 6,144 1.80% Sub-total patient care costs 324,368 92.50% Orphan support* 26,487 7.50% Total program costs 350,855 100.00%
* The costs of orphan support have been identified separately in order not to distort the direct patient care costs; orphan support is not a core HBC service, but it can be a significant cost.
Figure 2 illustrates the same cost breakdown as a pie chart, which is also a good way to present the information.
Figure 2. Breakdown of Costs
Staff costs
Transport
Capital
Other non-capital costs
Food
Volunteer incentives
Training
Drugs and medical supplies
Other family support Orphan
support

18 HIV/AIDS Home-Based Care Costing Guidelines
Total costs can be analyzed further, to identify direct and indirect costs. For example, looking at the numbers in Table 8, the line item “Staff” includes salaries of the staff involved inpatient care (direct costs) as well as those of the program administrator and other administrative staff (indirect costs). Some costs are easy to identify as direct, such as drugs and medical supplies and food.
Calculating unit costs In addition to knowing total costs, it is important to derive more specific costs. A unit (average)
cost captures the relationship between total cost and the related volume of services (output), and it sheds light on the intensity of resource use.
HBC program performance may be measured in many ways – each program may have specific indicators by which management measures output in terms of quantity of services delivered, for example:
Number of patients served
Number of households served
Number of home visits carried out
For each of these performance indicators, unit costs can be calculated. The cost per patient is total costs (numerator) divided by the volume of services delivered (denominator, e.g., number of patients cared for) in the reference period. The “total” costs used in the calculation may not necessarily be the total program costs but only those relevant to patient care. For example, a program that has a large orphan care component should not include orphan care costs when calculating the average cost of patient care; the cost of orphan care should be disclosed separately to avoid distorting direct care costs and to allow comparison of such costs to other programs. Table 9 presents unit costs of the HBC program whose total costs appear in Table 8.
Table 9. Unit Costs of a HBC Program
Costs Unit of
measurement Volume of services Total cost (US$) Cost per unit
Patient care Number of patients 750 324,368 $432.50 per patient Patient care No. of households 650 324,368 $499 per household Patient care No. of home visits 1,800 324,368 $180.20 per home visit Orphan care No. of orphans 140 26,487 $210.60 per orphan
Step 10. Apply Results of Cost Analysis
Using total costs The primary use of total costs is to show program managers the financial resources that must be
mobilized in order to deliver a specified package of services to a specified number of clients. They should not be used for cost-effectiveness purposes. As explained earlier, though total costs are important, they do not shed light on the efficiency of resource use; for this one must take know the volume of output a program produces.

2. Conducting the Costing Analysis 19
Using unit costs Unit costs serve a variety of purposes.
Monitoring efficiency of a single program
Unit cost calculations should be performed on a regular schedule; if needed by program management, they can be done more often. Over time, results can serve to monitoring program efficiency, and they can show trends that highlight service areas that need attention. Table 10 shows how fixed costs, variable costs, and the volume of services can affect the overall efficiency of a HBC program.
Table 10. Examples of Efficiency
Example A Example B Example C Example D Units (home visits) 500 450 500 400 Variable costs $7,000 $6,700 $8,000 $7,000 Fixed costs $3,000 $3,000 $3,000 $3,000 Total costs $10,000 $9,700 $11,000 $10,000 Cost per unit $ 20 $22 $22 $25
Unit costs increase if the program’s volume of services decreases but fixed costs (which do not immediately respond to changes in volume) remain the same and are spread over fewer units (Example B). Unit costs also increase when total costs rise (for example, due to expansion of services, inflation, or inefficiency or misuse of resources) and volume remains the same (Example C). For example, the unit cost of delivering care increases if there is a decrease in the number of HBC clients served (the volume of services decreases) and no immediate reduction in the HBC capacity (staff, equipment, building space, etc.), i.e., fixed costs are being spread over fewer units (Example D).
Comparing costs across programs
Unit costs provide a useful means of comparing programs to determine which one delivers care at a lower cost. However, comparisons should be done between like programs; differences between programs may not be due to inefficiencies but to factors such as the following:
Quality and quantity of services provided: differences in the quantity and quality of treatment provided to clients (for example, range of diseases covered for treatment, including ART for HIV/AIDS), food provided to clients and households, staff qualifications and remuneration, etc. affect costs.
Geographic location of program: some programs operate in areas that have less-developed infrastructure and this increases the cost of staff time and transportation involved in delivering services.
Location of patients: one program may serve patients in a small but densely populated area, while another program serves the same number of patients in a large, sparsely populated area. Costs of staff time and transportation will be significantly different between the two programs.

20 HIV/AIDS Home-Based Care Costing Guidelines
Budgeting
Unit costs calculated as fixed or variable are a valuable input into the budgeting process, especially to measure the impact that changes in the volume of services has on the budget. As noted above, in the short term, fixed costs remain unchanged despite changes in service volume, whereas variable costs change with volume. Therefore, the budget impact of a change in service volume will be the variable cost per unit multiplied by the service volume. Total fixed costs can be assumed to remain constant except for any inflationary or contractual (e.g. salaries) increases.
Making approximate cost estimates
Unit costs are a useful input when a rough estimate of total program costs will suffice. For example, unit costs from an existing program can be used to estimate likely total costs of a new, similar program that is under consideration; in this case, existing unit costs are multiplied by the expected new volume of patients. While these estimates are approximate, they may help planners to decide whether it is worth investing in more detailed calculations. The use of variable and fixed costs per unit from the existing program would give an even more accurate picture of the total costs of the planned program.
Setting fees for services
For a program to be sustainable, its average revenue must be equal to or more than its average cost. A program therefore may have to recover its costs by charging fees for the services it provides. Unit costs can help managers set fees. Again, knowing the variable cost component of the unit costs is especially informative. Fee levels may be set with a subsidy built in and the intention may be to only cover the variable costs or a given percentage of the total unit cost.
A final word on using of cost analysis results In conclusion, it bears repeating that, while cost analysis is an important tool that can help
managers and policymakers identify the consumption of resources by a HBC program, it is important to keep in mind that this looks primarily at the inputs by the program itself and does not address costs to the patients and their families. This analysis also does not fully address all the outputs and benefits that are external to the program, for example, making hospital beds available to other patients whose ailments cannot be managed at home. Decisions concerning the future of a HBC program would therefore need to go beyond looking at costs and basic outputs (such as numbers of patients treated or homes visited) and look at the broader benefits to the health sector and to society.

Annex A: Capital Costs Annualization Factors 21
Annex A: Capital Costs Annualization Factors


Useful life (years) 0% 1% 2% 3% 4% 5% 6% 7% 8% 9% 10% 11% 12% 13% 14% 15% 16% 17% 18% 19% 20%
1 1.000 0.990 0.980 0.971 0.962 0.952 0.943 0.935 0.926 0.917 0.909 0.901 0.893 0.885 0.877 0.870 0.862 0.855 0.847 0.840 0.833
2 2.000 1.970 1.942 1.913 1.886 1.859 1.833 1.808 1.783 1.759 1.736 1.713 1.690 1.668 1.647 1.626 1.605 1.585 1.566 1.547 1.528
3 3.000 2.941 2.884 2.829 2.775 2.723 2.673 2.624 2.577 2.531 2.487 2.444 2.402 2.361 2.322 2.283 2.246 2.210 2.174 2.140 2.106
4 4.000 3.902 3.808 3.717 3.630 3.546 3.465 3.387 3.312 3.240 3.170 3.102 3.037 2.974 2.914 2.855 2.798 2.743 2.690 2.639 2.589
5 5.000 4.853 4.713 4.580 4.452 4.329 4.212 4.100 3.993 3.890 3.791 3.696 3.605 3.517 3.433 3.352 3.274 3.199 3.127 3.058 2.991
6 6.000 5.795 5.601 5.417 5.242 5.076 4.917 4.767 4.623 4.486 4.355 4.231 4.111 3.998 3.889 3.784 3.685 3.589 3.498 3.410 3.326
7 7.000 6.728 6.472 6.230 6.002 5.786 5.582 5.389 5.206 5.033 4.868 4.712 4.564 4.423 4.288 4.160 4.039 3.922 3.812 3.706 3.605
8 8.000 7.652 7.325 7.020 6.733 6.463 6.210 5.971 5.747 5.535 5.335 5.146 4.968 4.799 4.639 4.487 4.344 4.207 4.078 3.954 3.837
9 9.000 8.566 8.162 7.786 7.435 7.108 6.802 6.515 6.247 5.995 5.759 5.537 5.328 5.132 4.946 4.772 4.607 4.451 4.303 4.163 4.031
10 10.000 9.471 8.983 8.530 8.111 7.722 7.360 7.024 6.710 6.418 6.145 5.889 5.650 5.426 5.216 5.019 4.833 4.659 4.494 4.339 4.192
11 11.000 10.368 9.787 9.253 8.760 8.306 7.887 7.499 7.139 6.805 6.495 6.207 5.938 5.687 5.453 5.234 5.029 4.836 4.656 4.486 4.327
12 12.000 11.255 10.575 9.954 9.385 8.863 8.384 7.943 7.536 7.161 6.814 6.492 6.194 5.918 5.660 5.421 5.197 4.988 4.793 4.611 4.439
13 13.000 12.134 11.348 10.635 9.986 9.394 8.853 8.358 7.904 7.487 7.103 6.750 6.424 6.122 5.842 5.583 5.342 5.118 4.910 4.715 4.533
14 14.000 13.004 12.106 11.296 10.563 9.899 9.295 8.745 8.244 7.786 7.367 6.982 6.628 6.302 6.002 5.724 5.468 5.229 5.008 4.802 4.611
15 15.000 13.865 12.849 11.938 11.118 10.380 9.712 9.108 8.559 8.061 7.606 7.191 6.811 6.462 6.142 5.847 5.575 5.324 5.092 4.876 4.675
16 16.000 14.718 13.578 12.561 11.652 10.838 10.106 9.447 8.851 8.313 7.824 7.379 6.974 6.604 6.265 5.954 5.668 5.405 5.162 4.938 4.730
17 17.000 15.562 14.292 13.166 12.166 11.274 10.477 9.763 9.122 8.544 8.022 7.549 7.120 6.729 6.373 6.047 5.749 5.475 5.222 4.990 4.775
18 18.000 16.398 14.992 13.754 12.659 11.690 10.828 10.059 9.372 8.756 8.201 7.702 7.250 6.840 6.467 6.128 5.818 5.534 5.273 5.033 4.812
19 19.000 17.226 15.678 14.324 13.134 12.085 11.158 10.336 9.604 8.950 8.365 7.839 7.366 6.938 6.550 6.198 5.877 5.584 5.316 5.070 4.843
20 20.000 18.046 16.351 14.877 13.590 12.462 11.470 10.594 9.818 9.129 8.514 7.963 7.469 7.025 6.623 6.259 5.929 5.628 5.353 5.101 4.870
21 21.000 18.857 17.011 15.415 14.029 12.821 11.764 10.836 10.017 9.292 8.649 8.075 7.562 7.102 6.687 6.312 5.973 5.665 5.384 5.127 4.891
22 22.000 19.660 17.658 15.937 14.451 13.163 12.042 11.061 10.201 9.442 8.772 8.176 7.645 7.170 6.743 6.359 6.011 5.696 5.410 5.149 4.909
23 23.000 20.456 18.292 16.444 14.857 13.489 12.303 11.272 10.371 9.580 8.883 8.266 7.718 7.230 6.792 6.399 6.044 5.723 5.432 5.167 4.925
24 24.000 21.243 18.914 16.936 15.247 13.799 12.550 11.469 10.529 9.707 8.985 8.348 7.784 7.283 6.835 6.434 6.073 5.746 5.451 5.182 4.937
25 25.000 22.023 19.523 17.413 15.622 14.094 12.783 11.654 10.675 9.823 9.077 8.422 7.843 7.330 6.873 6.464 6.097 5.766 5.467 5.195 4.948
26 26.000 22.795 20.121 17.877 15.983 14.375 13.003 11.826 10.810 9.929 9.161 8.488 7.896 7.372 6.906 6.491 6.118 5.783 5.480 5.206 4.956
27 27.000 23.560 20.707 18.327 16.330 14.643 13.211 11.987 10.935 10.027 9.237 8.548 7.943 7.409 6.935 6.514 6.136 5.798 5.492 5.215 4.964
28 28.000 24.316 21.281 18.764 16.663 14.898 13.406 12.137 11.051 10.116 9.307 8.602 7.984 7.441 6.961 6.534 6.152 5.810 5.502 5.223 4.970
29 29.000 25.066 21.844 19.188 16.984 15.141 13.591 12.278 11.158 10.198 9.370 8.650 8.022 7.470 6.983 6.551 6.166 5.820 5.510 5.229 4.975
30 30.000 25.808 22.396 19.600 17.292 15.372 13.765 12.409 11.258 10.274 9.427 8.694 8.055 7.496 7.003 6.566 6.177 5.829 5.517 5.235 4.979


Annex B: References 25
Annex B: References
Academy for Educational Development. 2004. HIV/AIDS: A Guide for Nutritional Care and Support. 2nd Edition. Washington, DC: AED, Food and Nutrition Technical Assistance Project.
Chandler, Rudolph, K. Decker, and B. Nziyige. June 2004. Estimating the cost of providing home-based care for HIV/AIDS in Rwanda. Bethesda MD: The Partners for Health Reformplus Project, Abt Associates Inc.
Global Alliance on Vaccines and Immunization. 2002. Annex I Baseline and Current Year Costing and Financing.
International HIV/AIDS Alliance. 2001. An evaluation of the MoH/NGO home care programme for people with HIV/AIDS in Cambodia.
Russell, Michele. 2000. Model of community-based HIV/AIDS care and support, Center for Health Policy, University of Witwatersrand
Walker, Mary Ebun, Esther Aceng, Denis Tindyebwa, Juliet Nabyonga, Peter Ogwang, and Paul Kiiza. June 2003. An assessment of home based care programs in Uganda: their strengths and weaknesses. World Health Organization/Uganda.
World Health Organization. 2002. Community home-based care in resource-limited settings. Geneva.
World Health Organization. 1989. Review of six HIV/AIDS programmes in Uganda and Zambia. Geneva: WHO, Global Programme on AIDS.