Embed Size (px)
Citation preview

1 23
Multimedia Tools and ApplicationsAn International Journal ISSN 1380-7501Volume 76Number 14 Multimed Tools Appl (2017)76:15817-15838DOI 10.1007/s11042-016-3871-7
Detecting digital image forgery in near-infrared image of CCTV
Jin-Seok Park, Dai-Kyung Hyun, Jong-Uk Hou, Do-Guk Kim & Heung-Kyu Lee
1 23
Your article is protected by copyright and all
rights are held exclusively by Springer Science
+Business Media New York. This e-offprint is
for personal use only and shall not be self-
archived in electronic repositories. If you wish
to self-archive your article, please use the
accepted manuscript version for posting on
your own website. You may further deposit
the accepted manuscript version in any
repository, provided it is only made publicly
available 12 months after official publication
or later and provided acknowledgement is
given to the original source of publication
and a link is inserted to the published article
on Springer's website. The link must be
accompanied by the following text: "The final
publication is available at link.springer.com”.

Detecting digital image forgery in near-infraredimage of CCTV
Jin-Seok Park1 & Dai-Kyung Hyun2 & Jong-Uk Hou1 &
Do-Guk Kim1 & Heung-Kyu Lee1
Received: 2 February 2016 /Revised: 5 July 2016 /Accepted: 15 August 2016 /Published online: 10 September 2016
Abstract The reliability of CCTV digital images is more important than the reliabilityof many other types of images. However, image editing tools such as Photoshop makethis unreliable. CCTV uses two photography modes, the RGB mode and the near-infrared mode. While near-infrared images have different properties, such as a con-stant level of source light intensity, and a constant direction of the source light, thereare no forensic techniques for near-infrared images. In this paper, we propose aforensic technique based on a constant direction of the source light. In order toexpose splicing forgery in near-infrared images, we create an ideal near-infrared imagemodel of a plane. We then calculate gradient vectors of the model and objects inimages. Depending on the similarity of two vectors, the image is determined forged ornot. This forensic technique helps to improve the reliability of near-infrared images.
Multimed Tools Appl (2017) 76:15817–15838DOI 10.1007/s11042-016-3871-7
* Heung-Kyu [email protected]
Jin-Seok [email protected]
Dai-Kyung [email protected]
Jong-Uk [email protected]
Do-Guk [email protected]
1 School of Computing, Korea Advanced Institute of Science and Technology 291 Daehak-roYuseong-gu, Daejeon 34141, Republic of Korea
2 Agency for Defense Development, Daejeon, Republic of Korea
# Springer Science+Business Media New York 2016
Author's personal copy
Keywords Imageforensics .Near-infrared image .CCTV. Imagesplicing .Forgednear-infraredimage
1 Introduction
Closed-circuit television (CCTV) is used to capture images at specific places, such asbanks, airports, stores and military installations in order to prevent or deter crime [4].The storing of images is used as evidence at the crime scene.
CCTV uses two photography modes, the RGB mode and the near-infrared mode.The RGB mode is identical to the mode type used in ordinary cameras, but the near-infrared mode is somewhat different. Because visible rays do not exist at night,CCTV captures near-infrared rays after first emitting these rays.
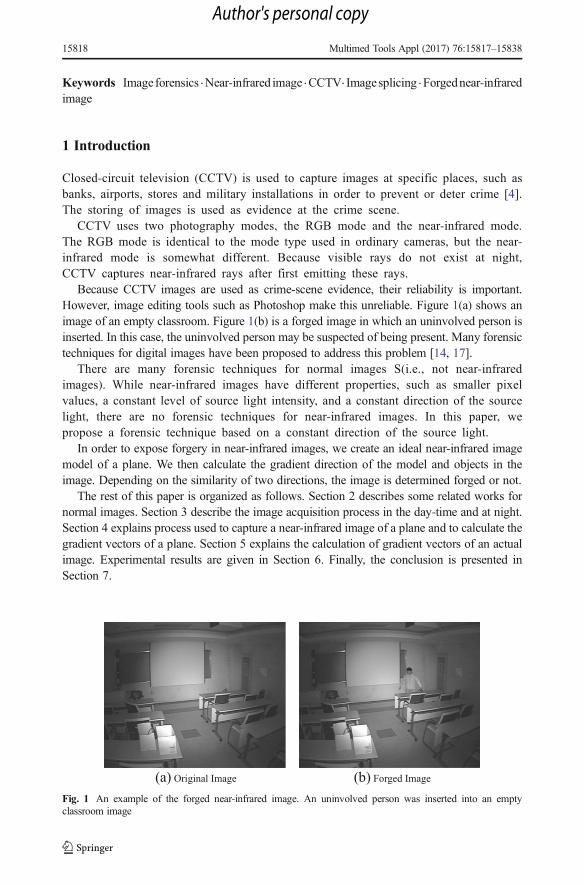
Because CCTV images are used as crime-scene evidence, their reliability is important.However, image editing tools such as Photoshop make this unreliable. Figure 1(a) shows animage of an empty classroom. Figure 1(b) is a forged image in which an uninvolved person isinserted. In this case, the uninvolved person may be suspected of being present. Many forensictechniques for digital images have been proposed to address this problem [14, 17].
There are many forensic techniques for normal images S(i.e., not near-infraredimages). While near-infrared images have different properties, such as smaller pixelvalues, a constant level of source light intensity, and a constant direction of the sourcelight, there are no forensic techniques for near-infrared images. In this paper, wepropose a forensic technique based on a constant direction of the source light.
In order to expose forgery in near-infrared images, we create an ideal near-infrared imagemodel of a plane. We then calculate the gradient direction of the model and objects in theimage. Depending on the similarity of two directions, the image is determined forged or not.
The rest of this paper is organized as follows. Section 2 describes some related works fornormal images. Section 3 describe the image acquisition process in the day-time and at night.Section 4 explains process used to capture a near-infrared image of a plane and to calculate thegradient vectors of a plane. Section 5 explains the calculation of gradient vectors of an actualimage. Experimental results are given in Section 6. Finally, the conclusion is presented inSection 7.
(a) Original Image (b) Forged Image
Fig. 1 An example of the forged near-infrared image. An uninvolved person was inserted into an emptyclassroom image
15818 Multimed Tools Appl (2017) 76:15817–15838
Author's personal copy

2 Related work
There are many forensic techniques for normal images. According to detection process,forensic techniques can be classified into four category [14].
The first technique is based on image acquisition. Many researchers focus onfinding special fingerprint which is created during image acquisition process. Lukaset al. proposed forensic technique using sensor pattern noise which is created duringimage acquisition process [13]. In [1], Choi et al. proposed forensic technique usingCFA pattern which is also created during image acquisition process. Yerushalmy et al.proposed a means of detecting forgery based on lens and sensor aberration [19]. Thereis a specific forensic technique for CCTV images. Hyun et al. proposed a means ofdetecting forgery in surveillance video based on the sensor pattern noise [6].
Secondly, there are techniques based on signal processing. These techniques detect imagemanipulation by revealing fingerprints left during the image editing process. Kirchner et al.established a method for detecting image resampling [11]. In [3], Fridrich et al. proposedmethod for detecting copy-move forgery. Stamm et al. introduced a different approach [16],which is based on statistical intrinsic fingerprints. Shi et al. proposed method for detectingsplicing by natural image model approach [15].
Also, there are techniques based on image file format. Many researchers focus on the JPEG,because JPEG is the most common and widespread format. Li et al. proposed method fordetecting doubly compressed JPEG image by using mode based first digit feature [12]. AlsoHe et al. proposed method for detecting forged JPEG images via DCT coefficient analysis [5].
Lastly, there are physics-based forensic techniques. Whereas many forensic tech-niques are weak to lossy compression, physics-based technique is strong to lossycompression. Also, physics-based forensic technique can be applied to low-resolutionand screen-capture images. Light, shadow and position of objects can be used in thephysics-based techniques. Johnson et al. proposed a means of exposing digital forg-eries in which the direction of the light source is detected [7] and, digital forgeries aredetected through a comparison of the position of a specular highlight in the eye [9]and by estimating complex lighting environments [8]. Recently, Kee et al. proposedmethod for exposing photo manipulation by analyzing object’s shadows and shading[10].
Although there are many image forensic techniques, no one thus far has proposed aforensic technique for near-infrared images. This paper firstly propose forensic tech-nique for near-infrared image and it can be classified physics-based forensics.
3 Image acquisition process
In this section, we briefly describe the image acquisition process in the day-time and at night.
3.1 Normal image acquisition process
In the day-time, visible rays coming from the sun or a lamp reach the object, and a camerasensor then captures the visible rays which are reflected from the object. Figure 2 shows theimage acquisition process in the day-time. I[W/sr] denotes the radiant intensity and γ denotesthe reflectance.
Multimed Tools Appl (2017) 76:15817–15838 15819
Author's personal copy

3.2 Near-infrared image acquisition process
On the other hand, there are no visible rays at night. Therefore, CCTV captures near-infrared rays after the system emits the near-infrared rays. Figure 3 shows the imageacquisition process at night. The distance between the near-infrared lamp and thecamera lens is much shorter than the distance between the camera and the object, asevery near-infrared lamp is located around the camera lens. Thus, we assume that thenear-infrared lamp is in the center of the camera lens.
However, if there is another strong source light such as streetlamp at night, then abovemodel is broken. This paper assumes that there is no another source light or intensity of sourcelight of the camera is much larger than other light. The assumption is reasonable for mostindoor images.
4 Near-infrared image of a plane
In this section, we describe why are gradient vectors in plane regions of a near-infrared imagealways oriented towards the center of the image.
4.1 Radiance reflected from a plane
Figure 4(a) describes a situation in which the camera emits near-infrared rays to a plane.Roughly, the irradiance of point p can be calculated using an inverse square law [18].
Ee ¼ I
d02¼ I ⋅cos2θ
d2¼
I ⋅cos2 tan−1 x0
d
� �� �d2
ð1Þ
Fig. 3 Near-infrared imageacquisition process at night. CCTVcaptures near-infrared rays afterthe system emits the near-infraredrays
Fig. 2 Image acquisition processin the day-time. A camera sensorcpatures the visible rays which arereflected from the object
15820 Multimed Tools Appl (2017) 76:15817–15838
Author's personal copy

Here, I[W/sr] denotes the radiant intensity, d ' [m] is the distance between the camera andplane, d[m] is the distance between the camera and point p and x ' [m] is the distance betweenpoint o(center of the plane) and point p.
Figure 4(b) describes point p in detail. Area S is projected into area S'. Therefore, theirradiance of point p on a plane is as follow:
E ¼ I ⋅cosθd02
¼ I ⋅cos3θd2
¼I ⋅cos3 tan−1 x
0
d
� �� �d2
ð2Þ
If the plane is a Lambertian surface, then the radiance L[W/m2/sr] of point p can bedescribed as shown below, where γ denote the surface reflectance [2].
L ¼ γπ*E ¼ γ*
I ⋅cos3 tan−1 x0
d
� �� �π⋅d2
ð3Þ
Equation (3) indicates that the radiance is calculated depending on x ' , I , d and γ.
L ¼ F x0; I; d;γ
� �ð4Þ
Fig. 5 The radiance value as x’. The radiance declines as x' become longer
(a) CCTV emits near-infrared rays to a plane (b) Point p is described in detail
Fig. 4 A situation in which the camera emits near-infrared rays to a plane
Multimed Tools Appl (2017) 76:15817–15838 15821
Author's personal copy

Figure 5 shows the radiance value as x', where the radiant intensity is 1W/sr, the distancebetween the camera and a plane is 5m, and the surface reflectance is 1. If I , d and γ areconstant, then F is a strictly monotonic decreasing function for x' .
F x1ð Þ > F x2ð Þ if x1 < x2ð Þ ð5Þ
4.2 Effect of camera response function
The radiance reflected from a surface is captured by the camera sensor, after which the camerasensor converts light into an electronic signal. The camera response function H shows therelationship between the incoming light and the image pixel value V.
V ¼ H F x0; I; d;γ
� �� �ð6Þ
The camera response function varies according to the camera model, but it isalways monotonic increasing function. Hence, if I, d and γ are constant thenH(F(x')) is monotonic decreasing function.
4.3 Gradient of a plane
Figure 6(a) shows a near-infrared image of a plane. x' is the distance between thecenter point and another point on the plane. Therefore, the radiance in the center ofimage is the strongest. The radiance become decreases with the distance from thecenter. The radiance gradient is calculated with the following equation.
lx ¼ ∂L∂x
; ly ¼ ∂L∂y
ð7Þ
The length and direction of the gradients can be calculated as follows.
ρ ¼ffiffiffiffiffiffiffiffiffiffiffiffiffil2x þ l2y
q; θ ¼ tan−1 lx; ly
� � ð8Þ
In Fig. 6(b), all gradient vectors are oriented towards the center of the plane.
(a) Near-infrared image of a plane (b) The gradient vectors
Fig. 6 Near-infrared image and the gradient vectors. All gradient vectors are oriented towards the center of theplane
15822 Multimed Tools Appl (2017) 76:15817–15838
Author's personal copy

5 Calculating the gradient vector
This section describes the process that calculating the gradient vectors of an actual image. Firstly,the curios near-infrared image is selected. Secondly, the image is divided into objects. Thirdly, theoutlier gradient is removed. Fourthly, the representative gradient vectors are calculated. Finally,the vector similarity is calculated.
5.1 Image segmentation
If the reflectance and distance between the camera and the plane differ, then the radiance at twopoints is as follows (Fig. 7).
Although x1 is longer than x2, L1 may be larger than L2 according to γ and d. In this case,the gradient vector is not oriented toward the center point of image. In order to fix γ and d, wedivide the image into objects.
L1 ¼ γ1⋅I ⋅cos2θ1π⋅d21
; L2 ¼ γ2⋅I ⋅cos2θ2π⋅d22
ð9Þ
5.2 Removal of the outlier gradient
Although we selected one object, γ and d of each point on the object differs depending on theobject’s material and shape. Since difference of γ and d make the edge, the gradient value of anedge is much greater than a nearby gradient value. If outlier gradient values are not removed,the property by which the gradient vector is oriented toward the center of the image does notapply. In order to maintain this property, we remove gradient values which exceed a certainthreshold.
5.3 Representative gradient vector
The actual object is not a Lambertian surface. Here γ differs in terms of the object surface, asbecause the surface consists of microfacets. For this reason, we calculate the representativegradient vector on the object surface. We calculate sum of v*x and v
*y after calculating vx and vy
, where V is the pixel value.
Fig. 7 Radiance as reflectance of objects and distance between the camera and the plane
Multimed Tools Appl (2017) 76:15817–15838 15823
Author's personal copy

vx ¼ ∂V∂x
; vy ¼ ∂V∂y
ð10Þ
v*x ¼1
N
XNx¼1
vx; v*y ¼1
M
XMy¼1
vy ð11Þ
We also calculate the length and the direction.
ρ* ¼ffiffiffiffiffiffiffiffiffiffiffiffiffiffiffiffiffiffiv*2x þ v*2y
q; θ* ¼ tan−1 v*x ; v
*y
� �ð12Þ
The calculated vector is normalized to the unit vector.
v ¼ v*xρ*
;v*yρ*
!ð13Þ
5.4 Vector similarity
The direction of gradient vectors differs with the position. We calculate unit vector �u towardthe center point of the image and then calculate the cosine similarity.
If a region is not forged, then the direction of �v and �u should be similar, because both �v and�u toward the center point of the image. In case, the similarity value of the region is large. Incontrast, if a region is forged, there is the high probability that �v doesn’t toward the center pointof the image. In case, the similarity value of the region is small.
similarity ¼ �u⋅�v�uj j �vj j ð14Þ
6 Experimental results
We have taken the 553 near-infrared images at various places such as classroom, corridor,sports center, recreation room, and lounge. The surveillance camera models used in theexperiments are as Table 1.
Table 1 The CCTV models usedin the experiments Brand Model
HUVIRON NT8C
IDIS 407BR
HUBIRON P461/M864 N
CNB XCL-20SKC3
15824 Multimed Tools Appl (2017) 76:15817–15838
Author's personal copy

Fig. 8 Histogram of the similarity value
Fig. 9 Original near-infrared im-age 1 taken in a classroom. Simi-larity values are calculated in fiveplane regions (Table 2 A-E)
Table 2 The similarity values of the Fig. 9 and Fig. 10. All similarity values are greater than threshold
Region�v �u
Similarity value
A (0.23,0.97) (0.56,0.82) 0.92
B (−0.44,0.89) (−0.31,0.94) 0.97
C (−0.94,-0.35) (−0.99,-0.11) 0.97
D (0.96,-0.27) (0.79,-0.60) 0.93
E (0.50,-0.86) (0.48,-0.87) 0.99
G (−0.96,-0.25) (−0.99,0.05) 0.95
H (0.93,-0.36) (0.98,-0.18) 0.98
Multimed Tools Appl (2017) 76:15817–15838 15825
Author's personal copy
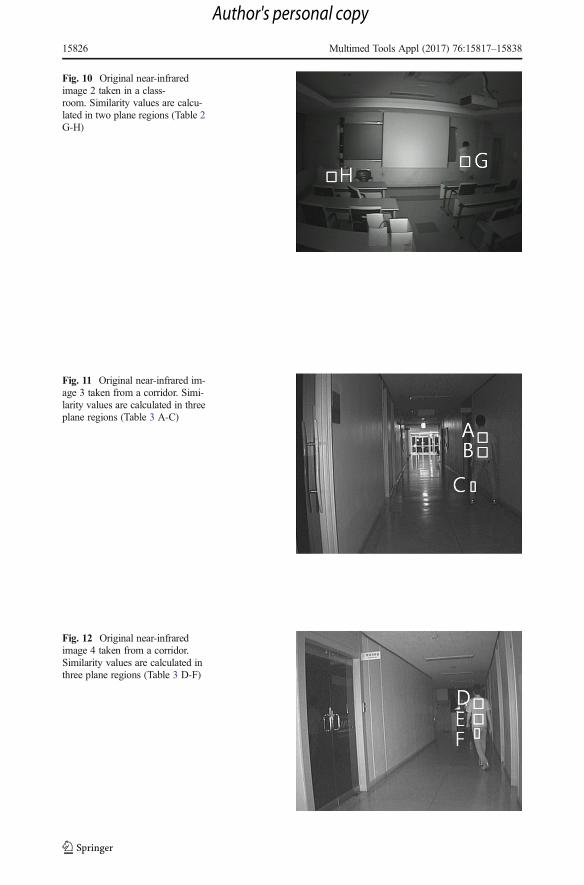
Fig. 10 Original near-infraredimage 2 taken in a class-room. Similarity values are calcu-lated in two plane regions (Table 2G-H)
Fig. 11 Original near-infrared im-age 3 taken from a corridor. Simi-larity values are calculated in threeplane regions (Table 3 A-C)
Fig. 12 Original near-infraredimage 4 taken from a corridor.Similarity values are calculated inthree plane regions (Table 3 D-F)
15826 Multimed Tools Appl (2017) 76:15817–15838
Author's personal copy

Fig. 13 Original near-infraredimage 5 taken in a sport room.Similarity values are calculated inthree plane regions (Table 4 A-C)
Fig. 14 Original near-infraredimage 6 taken in a sport room.Similarity values are calculated inthree plane regions (Table 4 D-F)
Fig. 15 Original near-infraredimage 7 taken in a lounge. Simi-larity values are calculated in threeplane regions (Table 5 A-C)
Multimed Tools Appl (2017) 76:15817–15838 15827
Author's personal copy

Fig. 16 Original near-infraredimage 8 taken in a lounge. Simi-larity values are calculated in threeplane regions (Table 5 D-F)
Fig. 17 Original near-infraredimage 9 taken in a classroom.Similarity values are calculated intwo plane regions (Table 6 A-B)
Fig. 18 Original near-infraredimage 10 taken in a classroom.Similarity values are calculated intwo plane regions (Table 6 C-D)
15828 Multimed Tools Appl (2017) 76:15817–15838
Author's personal copy

(a) Original image (b) Forged image
Fig. 19 Near-infrared image splicing 1. A person extracted from (a) was inserted into an empty classroom.Similarity values of regions A-B are shown in Table 7
(a) Original image (b) Forged image
Fig. 20 Near-infrared image splicing 2. A person extracted from (a) was inserted into four different regions in anempty classroom. Similarity values of regions C-G are shown in Table 7
(a) Original image (b) Forged image
Fig. 21 Near-infrared image splicing 3. A person extracted from (a) was inserted into a corridor. Similarityvalues of regions A-B are shown in Table 8
Multimed Tools Appl (2017) 76:15817–15838 15829
Author's personal copy

(a) Original image (b) Forged image
Fig. 22 Near-infrared image splicing 4. A person extracted from (a) was inserted into a corridor. Similarityvalues of regions C-D are shown in Table 8
(a) Original image (b) Forged image
Fig. 23 Near-infrared image splicing 5. A person extracted from (a) was inserted into an empty classroom.Similarity values of regions A-B are shown in Table 9
(a) Original image (b) Forged image
Fig. 24 Near-infrared image splicing 6. A person extracted from (a) was inserted into an empty classroom.Similarity values of regions C-D are shown in Table 9
15830 Multimed Tools Appl (2017) 76:15817–15838
Author's personal copy

(a) Original image (b) Forged image
Fig. 25 Near-infrared image splicing 7. A person extracted from (a) was inserted into an empty sport room.Similarity values of regions A-B are shown in Table 10
(a) Original image (b) Forged image
Fig. 26 Near-infrared image splicing 8. A person extracted from (a) was inserted into an empty sport room.Similarity values of regions C-D are shown in Table 10
Fig. 27 Normal color image taken by a pond
Multimed Tools Appl (2017) 76:15817–15838 15831
Author's personal copy

6.1 Original near-infrared image
The histogram shows similarity values of the plane region in the near-infrared images.In order to make the false positive value less than 0.015, we set the threshold valueto 0.65 (Fig. 8).
Fig. 28 Near-infrared imagesplicing 9. A person extracted fromcolor image (Fig. 27) was insertedinto an empty sport room.Similarity values of regions A-Bare shown in Table 11
Table 3 The similarity values of the Fig. 11 and Fig. 12. All similarity values are greater than threshold
Region�v �u
Similarity value
A (−0.86,0.49) (−0.95,0.30) 0.97
B (−0.93,-0.35) (−0.99,0.13) 0.87
C (−0.88,-0.45) (−0.93,-0.34) 0.99
D (−0.99,0.03) (−0.98,0.19) 0.98
E (−0.89,-0.43) (−1.00,0.00) 0.89
F (−0.64,-0.76) (−0.96,-0.24) 0.81
Table 4 The similarity values of the Fig. 13 and Fig. 14. All similarity values are greater than threshold
Region�v �u
Similarity value
A (0.69,0.71) (0.95,0.29) 0.87
B (0.99,-0.10) (0.99,0.02) 0.99
C (−0.99,-0.12) (−0.97,-0.21) 0.99
D (0.91,-0.41) (0.86,-0.49) 0.99
E (−0.99,0.11) (−1.00,0.00) 0.99
15832 Multimed Tools Appl (2017) 76:15817–15838
Author's personal copy

Figure 9 is an original near-infrared image in classroom. After selecting manyplane regions of the image, we calculate the �v,�u and similarity values in each regions.Table 2 shows the �v,�u and similarity values of the regions. Because direction of �v and�u are similar, all similarity values are greater than threshold. In the same way,similarity values of many regions in 10 original near-infrared images are calculated(Figs. 10, 11, 12, 13, 14, 15, 16, 17, and 18, Tables 2, 3, 4, 5, and 6).
6.2 Forged near-infrared images
Fig. 19 shows an example of near-infrared image splicing. We crop the person from theoriginal image and paste this part into a forged image. Comparing regions A and B, the �vvalues of Table 7 are similar because these represent the gradient of the same object. �u values
Table 5 The similarity values of the Fig. 15 and Fig. 16. All similarity values are greater than threshold
Region�v �u
Similarity value
A (0.57,0.82) (0.54,0.83) 0.99
B (−0.34,0.93) (−0.82,0.55) 0.80
C (−0.80,-0.58) (−0.85,-0.51) 0.99
D (−0.92,-0.38) (−0.91,-0.39) 0.99
E (0.72,0.68) (0.98,0.15) 0.82
F (0.22,-0.97) (0.00,-1.00) 0.97
Table 6 The similarity values of the Fig. 17 and Fig. 18. All similarity values are greater than threshold
Region�v �u
Similarity value
A (0.98,-0.18) (0.99,-0.08) 0.99
B (−0.95,-0.28) (−0.97,-0.24) 0.99
C (0.94,-0.33) (0.90,-0.43) 0.99
D (−0.91,-0.40) (−0.98,-0.14) 0.96
Table 7 The similarity values of the Fig. 19 and Fig. 20. The bold value indicates that it is less than thethreshold.
Region�v �u
Similarity value
A (0.57,0.81) (0.46,0.88) 0.99
B (0.45,0.89) (−0.85,0.52) 0.08
C (0.96,-0.27) (0.95,0.31) 0.83
D (0.92,-0.37) (0.80,0.58) 0.52
E (0.92,-0.37) (−0.85,0.52) -0.99
F (0.96,-0.27) (0.99,0.05) 0.94
G (0.96,-0.27) (−0.99,0.16) -0.99
Multimed Tools Appl (2017) 76:15817–15838 15833
Author's personal copy

are very different because regions A and B are located at different positions in the image.Therefore, the similarity value of region B is less than the threshold.
Fig. 20 also shows another example of near-infrared image splicing. The similarity valuesof the region D, E and G are less than the threshold, because �v and �u of are not similar.However, the similarity value of the region F is greater than the threshold nevertheless thisregion is forged, because �u values of the regions C and F are similar.
Also, Figs. 21, 22, 23, 24, 25, and 26 show examples of near-infrared imagesplicing and Tables 8, 9, and 10 show similarity values of these images.
Figures 27 and 28 show an example of RGB image splicing. We crop the person from theoriginal RGB image and paste this part of the image into a forged image after converting to agray level. In this case, the gradient direction of the object is determined depending on thelighting environment of the RGB image. The probability, that the lighting environment of theRGB images is identical to that of the near-infrared image, is very low. The similarity values ofregion A and B are less than threshold (Table 11).
Table 8 The similarity values of the Fig. 21 and Fig. 22. The bold value indicates that it is less than the threshold
Region�v �u
Similarity value
A (−0.27,0.96) (−0.78,0.61) 0.80
B (−0.83,0.55) (0.74,-0.66) -0.98
C (−0.99,0.05) (−0.96,0.26) 0.97
D (−0.99,-0.08) (0.32,0.94) -0.40
Table 9 The similarity values of the Fig. 23 and Fig. 24. The bold value indicates that it is less than the threshold
Region�v �u
Similarity value
A (−0.67,0.73) (−0.91,0.41) 0.91
B (−0.69,0.71) (−0.98,-0.17) 0.56
C (0.97,0.20) (0.99–0.09) 0.95
D (0.82,0.56) (−0.97,-0.23) -0.93
Table 10 The similarity values of the Fig. 25 and Fig. 26. The bold value indicates that it is less than thethreshold
Region�v �u
Similarity value
A (0.91,-0.39) (0.93,-0.34) 0.99
B (0.91,-0.39) (−0.66,-0.74) -0.31
C (0.96,0.26) (0.99,0.13) 0.99
D (0.97,0.20) (−0.60,0.79) -0.43
15834 Multimed Tools Appl (2017) 76:15817–15838
Author's personal copy

7 Conclusion
We have developed a forensic technique for near-infrared images. We described that thegradient vectors of the object in near-infrared images are always oriented toward center pointof the image. Using this property, we proposed a method for detecting digital image splicing.Experimental results showed that our method accurately detects forged near-infrared images.We expect this technique to improve the reliability of near-infrared images.
Acknowledgments This work was supported by Institute for Information & communications TechnologyPromotion(IITP) grant funded by the Korea government(MSIP) (No. B0717-16-0135, Fundamental Researchon Deep Learning based Complex Digital Image Forgery Detection).
References
1. Choi CH, Lee HY, Lee HK (2013) Estimation of color modification in digital images by cfa pattern change.Forensic Sci Int 226(1):94–105
2. Dorsey, J., Rushmeier, H., Sillion, F.X. (2007): Digital modeling of material appearance. The MorganKaufmann series in computer graphics. Morgan Kaufmann
3. Fridrich, A.J., Soukal, B.D., Lukas, A.J. (2003) Detection of copy-move forgery in digital images. In: inProceedings of Digital Forensic Research Workshop. Citeseer
4. Gill, M., Spriggs, A., Britain, G. (2005) Assessing the impact of CCTV. Home office research, developmentand statistics directorate London
5. He J, Lin Z, Wang L, Tang X (2006) Detecting doctored jpeg images via dct coefficient analysis. ComputerVision–ECCV:423–435 Springer (2006)
6. Hyun DK, Ryu SJ, Lee HY, Lee HK (2013) Detection of upscale-crop and partial manipulation insurveillance video based on sensor pattern noise. Sensors 13(9):12,605–12,631
7. Johnson, M.K., Farid, H. (2005) Exposing digital forgeries by detecting inconsistencies in lighting. In:Proceedings of the 7th workshop on Multimedia and security, pp. 1–10. ACM
8. Johnson MK, Farid H (2007a) Exposing digital forgeries in complex lighting environments. IEEE Trans InfForensics Secur 2(3):450–461
9. Johnson, M.K., Farid, H. (2007b) Exposing digital forgeries through specular highlights on the eye. In:Information Hiding, pp. 311–325. Springer
10. Kee, E., OBrien, J., Farid, H. (2014) Exposing photo manipulation from shading and shadows. ACM Trans.Graph. (in press 2014)
11. Kirchner, M., Gloe, T. (2009) On resampling detection in re-compressed images. In: information forensicsand security, 2009. WIFS 2009. First IEEE international workshop on, pp. 21–25. IEEE
12. Li, B., Shi, Y.Q., Huang, J. (2008) Detecting doubly compressed jpeg images by using mode based first digitfeatures. In: Multimedia Signal Processing, 2008 I.E. 10th Workshop on, pp. 730–735. IEEE
13. Lukas, J., Fridrich, J., Goljan, M. (2006) Detecting digital image forgeries using sensor pattern noise. In:electronic imaging 2006, pp. 60,720Y–60,720Y. International Society for Optics and Photonics
14. Piva, A. (2013) An overview on image forensics. ISRN Signal Process 201315. Shi, Y.Q., Chen, C., Chen, W. (2007) A natural image model approach to splicing detection. In: Proceedings
of the 9th workshop on Multimedia & security, pp. 51–62. ACM16. Stamm MC, Liu K (2010) Forensic detection of image manipulation using statistical intrinsic fingerprints.
IEEE Trans Inf Forensics Secur 5(3):492–506
Table 11 The similarity values of the Fig. 28. The bold value indicates that it is less than the threshold.
Region �v �u Similarity value
A (−1.00,0.00) (0.37,0.92) -0.37
B (0.26,-0.96) (0.70,0.70) -0.49
Multimed Tools Appl (2017) 76:15817–15838 15835
Author's personal copy

17. Stamm MC, Wu M, Liu K (2013) Information forensics: an overview of the first decade. Access, IEEE 1:167–200
18. Taylor, A.E., et al. (2000) Illumination fundamentals. Lighting research center, Rensselaer PolytechnicInstitute
19. Yerushalmy I, Hel-Or H (2011) Digital image forgery detection based on lens and sensor aberration. Int JComputVision 92(1):71–91
Jin-Seok Park received his B.S. degree in Information and Communication Engineering from Inha University,Republic of Korea, in 2013. He received his M.S. degree in School of Computing from Korea Advanced Instituteof Science and Technology (KAIST), Republic of Korea, in 2015. He is currently working toward his Ph.D.degree in Multimedia Computing Lab., School of Computing, KAIST. His major interests are digital forensics,and digital watermarking.
Dai-Kyung Hyun received his B.S. degree in School of Computer Science and Engineering from KyungpookNational University, Republic of Korea, in 2008. He received M.S. and Ph.D. degrees in Computer Science fromKorea Advanced Institute of Science and Technology (KAIST), Republic of Korea, in 2011 and 2015,respectively. He is currently working for Agency for Defense Development. His major interests are multimedia,image processing and digital forensics.
15836 Multimed Tools Appl (2017) 76:15817–15838
Author's personal copy

Jong-Uk Hou received his B.S. degree in Information and Computer Engineering from Ajou University,Republic of Korea, in 2012. He received his M.S. degree in Web Science and Technology from Korea AdvancedInstitute of Science and Technology (KAIST), Republic of Korea, in 2014. He is currently working toward hisPh.D. degree in Multimedia Computing Lab., School of Computing, KAIST. He was awarded a Global Ph.D.Fellowship from National Research Foundation of South Korea in 2015. His major interests include variousaspects of information hiding, multimedia signal processing, and computer vision.
Do-Guk Kim received his B.S. degree in Computer Science and M.S. degree in Information Security from KoreaAdvanced Institute of Science and Technology (KAIST), Republic of Korea, in 2012 and 2014 respectively. He iscurrently working toward his Ph.D. degree in Multimedia Computing Lab., School of Computing, KAIST. Hisresearch interests include digital image forensics, image watermarking, information security, and multimedia signalprocessing.
Multimed Tools Appl (2017) 76:15817–15838 15837
Author's personal copy

Heung-Kyu Lee received his B.S. degree in Electronics Engineering from Seoul National University, Republicof Korea, in 1978. He received his M.S. and Ph.D. degrees in Computer Science from Korea Advanced Instituteof Science and Technology (KAIST), Republic of Korea, in 1981 and 1984, respectively. Since 1986 he has beena professor in the School of Computing, KAIST. He has authored/coauthored over 100 international journal andconference papers. He has been a reviewer of many international journals, including Journal of ElectronicImaging, Real-Time Imaging, and IEEE Trans. on Circuits and Systems for Video Technology. His majorinterests are digital watermarking, digital fingerprinting, and digital rights management.
15838 Multimed Tools Appl (2017) 76:15817–15838
Author's personal copy