Embed Size (px)
Citation preview

HKSCC NEXT GENERATION (NG)
RISK MODELS
April 2018

2
1
3
4
Background
HKSCC NG Margin Model Framework
Market Impact (NG Margin Model)
Margin Calculation Flow
5 Margin Calculation Examples
Agenda
6 Operations under New Margin Model

BACKGROUND
BACKGROUND
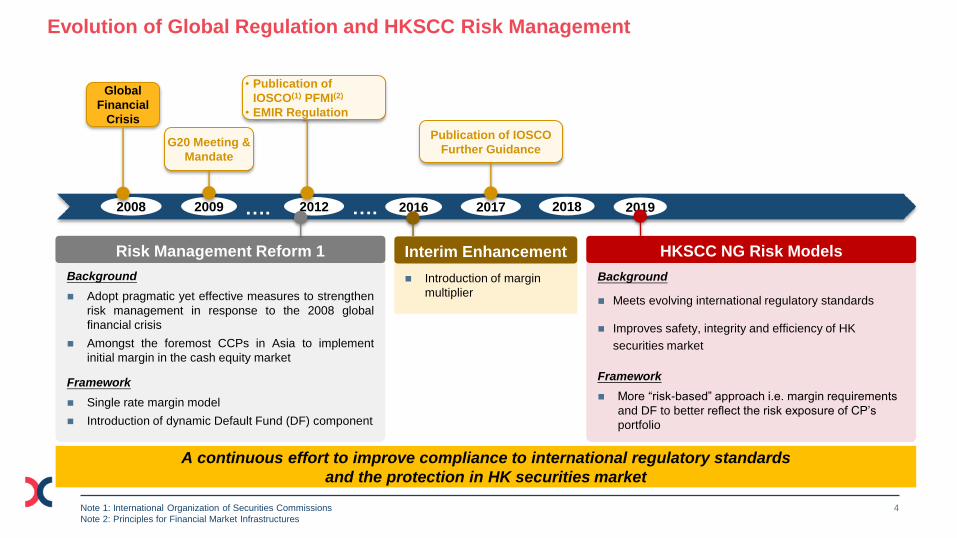
4
Background
Adopt pragmatic yet effective measures to strengthen
risk management in response to the 2008 global
financial crisis
Amongst the foremost CCPs in Asia to implement
initial margin in the cash equity market
Framework
Single rate margin model
Introduction of dynamic Default Fund (DF) component
Background
Meets evolving international regulatory standards
Improves safety, integrity and efficiency of HK
securities market
Framework
More “risk-based” approach i.e. margin requirements
and DF to better reflect the risk exposure of CP’s
portfolio
onwards……………
..…. Risk Management Reform 1 HKSCC NG Risk Models
A continuous effort to improve compliance to international regulatory standards
and the protection in HK securities market
2009 2008 2012 2019 2017 2018 2016 …. ….
Global
Financial
Crisis
G20 Meeting &
Mandate
• Publication of
IOSCO(1) PFMI(2)
• EMIR Regulation
Publication of IOSCO
Further Guidance
Introduction of margin
multiplier
Interim Enhancement
Note 1: International Organization of Securities Commissions
Note 2: Principles for Financial Market Infrastructures
Evolution of Global Regulation and HKSCC Risk Management
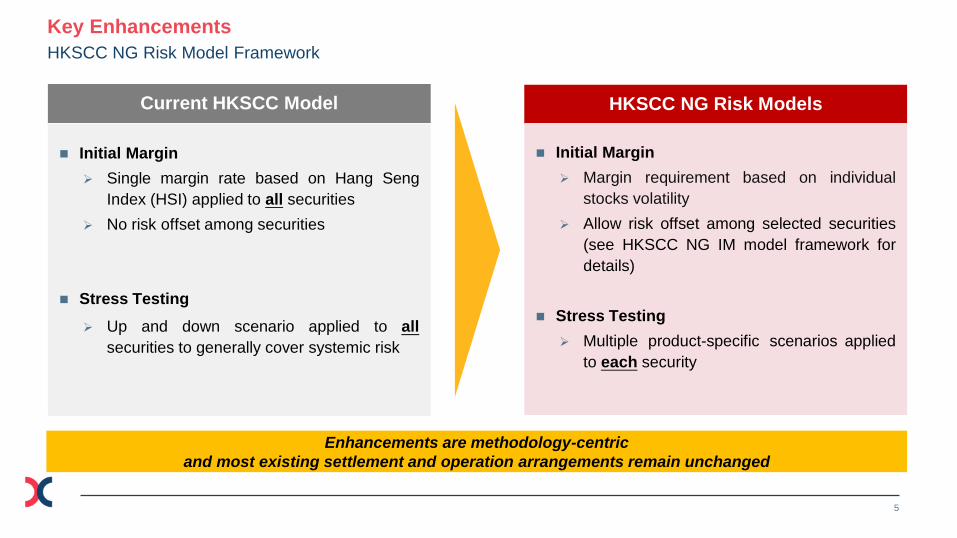
5
Enhancements are methodology-centric
and most existing settlement and operation arrangements remain unchanged
Initial Margin
Single margin rate based on Hang Seng
Index (HSI) applied to all securities
No risk offset among securities
Stress Testing
Up and down scenario applied to all
securities to generally cover systemic risk
Current HKSCC Model HKSCC NG Risk Models
Initial Margin
Margin requirement based on individual
stocks volatility
Allow risk offset among selected securities
(see HKSCC NG IM model framework for
details)
Stress Testing
Multiple product-specific scenarios applied
to each security
HKSCC NG Risk Model Framework
Key Enhancements

HKSCC NG MARGIN MODEL
FRAMEWORK
HKSCC NG MARGIN MODEL FRAMEWORK

7
Flat rate on higher of Long / Short CNS
positions (current HKSCC methodology)
Two-tier : Hang Seng Composite Index (HSCI)-based
Non-
Constituent
Tier
(Tier N)
Primary Tier
(Tier P)
HSCI Large Cap and Mid Cap constituent stocks
Covers securities which rank in the top 95% of the
total market capitalization
All Equity indices ETFs
As at Mar 2018 :
Includes ~450 instruments
Covers 74% of the total market turnover
Contains all instruments not in Tier P (e.g., GEM stocks,
small / micro cap stocks, etc.)
Operationally easier to adopt by CPs given the similarity
to current single margin rate model
As at Mar 2018:
Includes ~1,950 instruments
Cash Equities and
Structured Products (SP) Handling
Portfolio Margining and subject to minimum
margin level
Includes SP with Tier P underlying or HSI/
HHI Index
Two-Tier Initial Margin Model Approach
A hybrid approach consists of portfolio margining (for Tier P) and flat rate (for Tier N)
Subject to SFC’s final approval

8 (1) Uses Exponential Weighted Moving Average (EWMA) for calculation
Subject to SFC’s final approval
Initial Margin Model Summary
1. Scope
3. Margining
Position
5. Margin Period of
Risk (MPOR)
2. Margin
Calculation
4. Implied Volatility
Modelling
Tier P
Instrument specific
Results of 1,000 recent days(1) with the
weight of 75%
Results of identified stress dates with the
weight of 25%
All long and short Continuous Net
Settlement (CNS) positions
1 day with liquidation risk add-on for illiquid /
concentrated positions
Yes
Tier N
One margin rate based on a reference
market index for all non-Tier P instruments
Higher of long / short CNS positions
1 day with liquidation risk buffer
Nil
Current HKSCC approach

9
Liquidation Risk Add-On for Tier P Sub Portfolio
Achieve better compliance to international standards
Rationale • Additional margin in the margin model framework to cover the additional cost of portfolio handling in
the default management process
Mechanism
Liquidation Risk Add-On for Tier P
• Primarily reference the bid ask spread and daily trading volume of instruments
• Add-on will be triggered when CNS positions exceed the defined thresholds
Liquidation Risk buffer for Tier N
• Covered by the flat margin rate
MARKET IMPACT
(NG MARGIN MODEL)
MARKET IMPACT
(NG MARGIN MODEL)

11 Subject to SFC’s final approval
2015 Q1 - 2017 Q3 (Proposed vs. Current)
Market Impact (1): Margin Requirement of the Market
The proposed model effectively captures the risk in heightened volatility period
and in general provides margin savings for the market
(HK$, Million)
1Q15 2Q15 3Q15 4Q15 1Q16 2Q16 3Q16 4Q16 1Q17 2Q17 3Q17

12 Subject to SFC’s final approval
% Observations for all CPs during 2015 Q1 - 2017 Q3 (Proposed vs. Current)
Market Impact (2): Frequency and Magnitude of IM Change
In general, margin will decrease or remain unchanged; most of the margin increases are insignificant
Increase 8%
Saving 12%
No change 80%
14%
86%
36%
64%
Modest (< $10m)
Material (> $10m)

CALCULATION FLOW AND EXAMPLES
OF INITIAL MARGIN
MARGIN CALCULATION FLOW
14
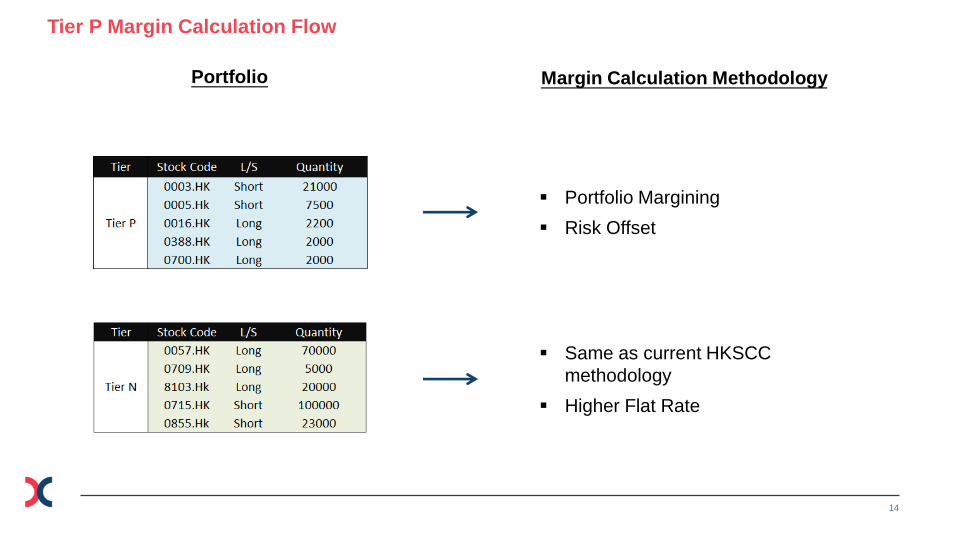
Tier P Margin Calculation Flow
Portfolio Margin Calculation Methodology
Portfolio Margining
Risk Offset
Same as current HKSCC
methodology
Higher Flat Rate

15 (1) Tier P margin is subject to minimum margin level
(2) Tier N portfolio IM is subject to margin multiplier and the multiplier is determined by the magnitude of a Clearing Participant’s back-testing deficit
Next Generation Margin Calculation Flow
Tier N
Margin Requirement for CP’s portfolio
Final Portfolio Margin
Margin Calculation Methodology
Final
Portfolio IM Tier P
Portfolio IM(1)
Tier P
Liquidation Risk
Add-On
Tier N
Portfolio IM
including
Liquidation Risk
Buffer(2)
Similar to current HKSCC methodology

16 (1) Tier P margin is subject to minimum margin level
Tier P Margin Calculation Flow
Margin Calculation Methodology
Step 1
Scenarios P&L
Security 1
Security 2
Portfolio
Security N
P&L 1 P&L 2 … P&L 1000
P&L 1 P&L 2 … P&L 1000
P&L 1 P&L 2 … P&L 1000
…
Aggregation of P&Ls per Scenario
Historical days
Day 1 Day 2 … Day 1000
…
Loss estimated
from historical
days
Step 3 Tier P
Portfolio IM(1)
Loss estimated
from historical
days 75%
Loss estimated
from identified
stress dates 25%
Step 2 Loss estimated
from identified
stress dates
Stress Scenarios P&L
Security 1
Security 2
Portfolio
Security N
P&L 1 P&L 2 … P&L x
P&L 1 P&L 2 … P&L x
P&L 1 P&L 2 … P&L x
…
Aggregation of P&Ls per Stress Scenario
Identified stress dates
Stress Date 1 Stress Date 2 … Stress Date 𝒙
…

CALCULATION FLOW AND EXAMPLES
OF INITIAL MARGIN
MARGIN CALCULATION EXAMPLES

18
Stock Code L/S Quantity Tier Market Value Stress Date 1 Stress Date 2 … Stress Date 𝒙
0003.HK Short 21000 P (364,980) (19,209) 9,121 … -
0005.HK Short 7500 P (503,250) (6,894) 4,534 … (2,794)
0016.HK Long 2200 P 262,460 13,634 (6,480) … (2,716)
0388.HK Long 2000 P 351,600 14,449 (1,157) … -
0700.HK Long 2000 P 261,400 31,457 (3,528) … 4,559
Aggregated Stress Scenario P&L for Tier P at Portfolio Level 33,437 2,490 … (950)
Stock Code L/S Quantity Tier Market Value Day 1 Day 2 … Day 1000
0003.HK Short 21000 P (364,980) 392 337 … 341
0005.HK Short 7500 P (503,250) 283 (5,496) … (6,452)
0016.HK Long 2200 P 262,460 (3,610) (2,367) … 4,553
0388.HK Long 2000 P 351,600 (3,129) 1,152 … 7,038
0700.HK Long 2000 P 261,400 (2,404) (108) … 2,672
Aggregated Scenario P&L for Tier P at Portfolio Level (8,468) (6,482) … 8,152
(1) Tier P margin is subject to minimum margin level
*All above figures are hypothetical for illustrative purpose only
Balanced Portfolio with 5 Tier P stocks and 5 Tier N stocks
Numerical Examples of Calculation of IM Requirement (1)
Tier P Margin Calculation Methodology
Step 1
Historical Days
Step 2
Identified Stress Dates
Step 3
Average loss of the worst 6 days
= HK$ 8,125
Tier P
Portfolio IM(1)
Loss estimated
from historical
days 75%
Loss estimated
from identified
stress dates 25%
HK$ 8,125 HK$ 10,000 HK$ 8,594
Average loss of the worst 2%
dates = HK$ 10,000
19 (1) Tier N portfolio IM is subject to margin multiplier
(2) Tier P margin is subject to minimum margin level
(3) Tier P liquidation risk add-on is not triggered in this example
*All above figures are hypothetical for illustrative purpose only
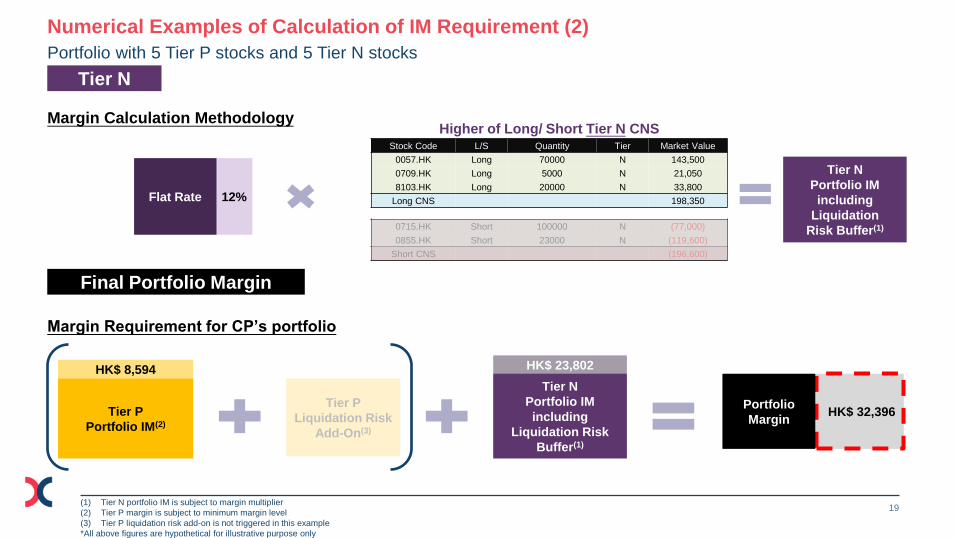
Portfolio with 5 Tier P stocks and 5 Tier N stocks
Numerical Examples of Calculation of IM Requirement (2)
Tier N
Margin Requirement for CP’s portfolio
Final Portfolio Margin
Tier N
Portfolio IM
including
Liquidation
Risk Buffer(1)
12% Flat Rate
Margin Calculation Methodology
Stock Code L/S Quantity Tier Market Value
0057.HK Long 70000 N 143,500
0709.HK Long 5000 N 21,050
8103.HK Long 20000 N 33,800
Long CNS 198,350
0715.HK Short 100000 N (77,000)
0855.HK Short 23000 N (119,600)
Short CNS (196,600)
Higher of Long/ Short Tier N CNS
Tier P
Portfolio IM(2)
Tier P
Liquidation Risk
Add-On(3)
Tier N
Portfolio IM
including
Liquidation Risk
Buffer(1)
HK$ 32,396 Portfolio
Margin
HK$ 8,594 HK$ 23,802

20 *All above figures are hypothetical for illustrative purpose only
General Relationship Between Portfolio Characteristics and IM Requirements
Characteristics
Directional Portfolio
Consists of net long or net short positions
Limited scope for risk netting at portfolio level resulting
in higher margin requirement
Concentrated Positions with Volatile Stocks
Lack of diversification in portfolio and concentrated in volatile stocks (e.g. small and mid-cap stocks)
Higher IM to reflect the riskier nature of high volatility
stocks
Examples
Directional Portfolio
IM Requirement
NG Risk Models: HK$ 132,658
Portfolio with 85% concentration in 1 volatile stock
IM Requirement
NG Risk Models: HK$ 40,770
Diversified Portfolio
Consists of balanced long / short positions or hedged positions (e.g. Structured Products (SP) vs. underlying, ETF vs. underlying)
Lower IM due to portfolio margining Portfolio with SP hedged against underlying
IM Requirement
NG Risk Models: HK$ 2,143
Balanced Portfolio
IM Requirement
NG Risk Models: HK$ 32,396

OVERVIEW OF OPERATION IMPACT
AND MITIGATION
OPERATIONS
UNDER NEW MARGIN MODEL

22
Operations under New Margin Model
Other Features
Mitigation of
Potential Impact
■ HK$5 million margin credit Margin credit of
HK$5M will continue
Collection and refund
process
Operational
Impact Funding
■ CP’s internal funding requirement could fluctuate as IM of the portfolio is
calculated based on the risk of the portfolio
■ Relevant settlement reports will still be available via existing CCASS
■ Timing of most existing operations remains unchanged
■ Excess margin is refunded on the following day
■ Default Fund (DF) collection/ refund period will follow current practice
■ Reports content and frequency will be adjusted to promote transparency
of new models Reports
Margin Simulation
Tools (see next slide
for details)
■ Facilitate CPs’ internal processes related to risk control and margin
payment / collection
Specific Stock
Collateral (SSC) or
Specific Cash
Collateral (SCC)
■ CNS stock positions covered by SSC or SCC are exempted from initial
margin calculation

23
Overview of Margin Simulation Tools
Features CPs input trades via a web-based Graphical User Interface (GUI) or spreadsheet upload
Results can be download from web portal for CP’s internal risk control purpose
■ Allow CPs to replicate and simulate margin requirement for existing portfolio and hypothetical trades
■ To facilitate CPs’ internal processes related to risk control and margin payment / collection under a
relatively sophisticated margin model Purpose
HKEX Web based GUI Input / upload hypothetical trades
or clients’ portfolio
Simulated margin requirement
Web Server
Calculate simulated margin
requirement
Option 1: Web Portal
The above proposed structure will be subject to discussion / confirmation with HKEX system vendor

24
Overview of Margin Simulation Tools
Features HKEX provides RPF (at granular risk parameter level) for each stock and structured product
CPs download and use the RPF for estimating margin requirement and risk management of house, affiliate
or client portfolios on the next day
Option 2: Risk Parameters File
Risk Parameters File
(Download from HKEX Website)
Simulated
Margin
requirement
The above proposed structure will be subject to discussion / confirmation with HKEX system vendor
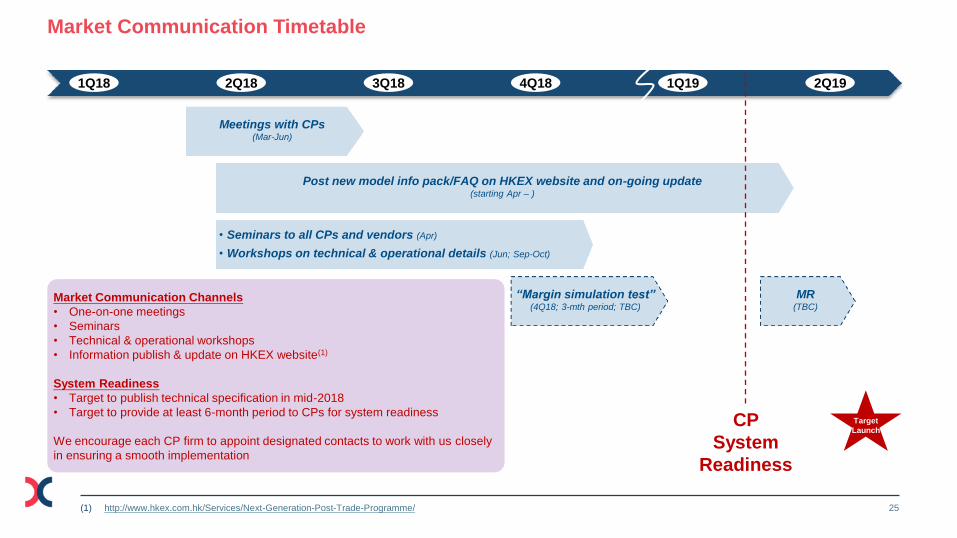
25 (1) http://www.hkex.com.hk/Services/Next-Generation-Post-Trade-Programme/
Market Communication Timetable
2Q18 1Q18 3Q18 4Q18 1Q19 2Q19
Meetings with CPs (Mar-Jun)
Post new model info pack/FAQ on HKEX website and on-going update (starting Apr – )
MR (TBC)
• Seminars to all CPs and vendors (Apr)
• Workshops on technical & operational details (Jun; Sep-Oct)
Target
Launch CP
System
Readiness
Market Communication Channels
• One-on-one meetings
• Seminars
• Technical & operational workshops
• Information publish & update on HKEX website(1)
System Readiness
• Target to publish technical specification in mid-2018
• Target to provide at least 6-month period to CPs for system readiness
We encourage each CP firm to appoint designated contacts to work with us closely
in ensuring a smooth implementation
“Margin simulation test” (4Q18; 3-mth period; TBC)

26
1. Go to https://www.hsi.com.hk/HSI-Net/
2. Click on “Benchmark Indexes” tab and then click on
Hang Seng Composite Size Indexes
3. Click on Constituents tab and select the LargeCap,
MidCap and SmallCap in the dropdown box
Two-tier : Hang Seng Composite Index (HSCI)-based
HKEX will update Tier P stocks list for margining on a regular basis and
notify CPs about the change beforehand


![Agenda Digitale - I Want You[ng] Marche for next generation](https://img.pdfslide.net/doc/110x75/547c6265b4af9f9b158b51b2/agenda-digitale-i-want-young-marche-for-next-generation.jpg)