Embed Size (px)
Citation preview
ORIGINAL ARTICLE
HLA class I molecular variation and peptide-binding propertiessuggest a model of joint divergent asymmetric selection
Stéphane Buhler1,2 & José Manuel Nunes1,3 & Alicia Sanchez-Mazas1,3
Received: 8 February 2016 /Accepted: 17 May 2016 /Published online: 27 May 2016# The Author(s) 2016. This article is published with open access at Springerlink.com
Abstract The main function of HLA class I molecules is topresent pathogen-derived peptides to cytotoxic T lympho-cytes. This function is assumed to drive the maintenance ofan extraordinary amount of polymorphism at each HLA locus,providing an immune advantage to heterozygote individualscapable to present larger repertories of peptides than homozy-gotes. This seems contradictory, however, with a reduced di-versity at individual HLA loci exhibited by some isolatedpopulations. This study shows that the level of functional di-versity predicted for the two HLA-A and HLA-B genes con-sidered simultaneously is similar (almost invariant) between46 human populations, evenwhen a reduced diversity exists ateach locus.We thus propose that HLA-A and HLA-B evolvedthrough a model of joint divergent asymmetric selection con-ferring all populations an equivalent immune potential. Thedistinct pattern observed for HLA-C is explained by its func-tional evolution towards killer cell immunoglobulin-like re-ceptor (KIR) activity regulation rather than peptidepresentation.
Keywords HLAclass Ipolymorphism .Functionalvariation .
Peptide-binding properties . Asymmetric balancing selection .
Heterozygous advantage . Immune protection
Introduction
Located in the 6p21.3 chromosomal region, HLA class I genesare among the most polymorphic of the human genome(Robinson et al. 2015; The MHC sequencing consortium1999). To some exceptions (e.g., erythrocytes), class I moleculesare expressed ubiquitously by every cellular type of the body.Their main function is to present small antigenic peptides(mostly nonamers) of intracellular origin to the receptors ofCD8+ cytotoxic T lymphocytes (TCR). During an infection bya pathogen (e.g., a virus), infected cells generally increase theirmembrane expression of class I molecules in order to be taggedfor destruction by the adaptive immune system (Parham 2009).
The peptide-binding region (PBR) of HLA class I mole-cules, which presents the antigenic peptides, is encoded byexons 2 and 3 of the corresponding genes, where most of thepolymorphism is observed (Little and Parham 1999). For thisreason, the huge HLA class I diversity observed in humanpopulations, now represented by more than ten thousands ofdifferent alleles (10,297 according to release 3.22.0 of theIMGT/HLA database (Robinson et al. 2015)) showing vari-able frequencies worldwide (Sanchez-Mazas et al. 2011,2013; Santos et al. 2015), is generally thought to be function-ally relevant and maintained by different forms of balancingselection (Di et al. 2015; Garrigan and Hedrick 2003; Meyeret al. 2006; Meyer and Thomson 2001; Solberg et al. 2008;Spurgin and Richardson 2010). Although allele frequency-dependent selection (Slade and McCallum 1992; Takahataand Nei 1990) and selection fluctuating in space and time(Hedrick 2002) may also be at work, the mechanism that is
Electronic supplementary material The online version of this article(doi:10.1007/s00251-016-0918-x) contains supplementary material,which is available to authorized users.
* Stéphane [email protected]
1 Laboratory of Anthropology, Genetics and Peopling History,Department of Genetics and Evolution, Anthropology Unit,University of Geneva, Geneva, Switzerland
2 Transplantation Immunology Unit & National Reference Laboratoryfor Histocompatibility, Department of Genetic and LaboratoryMedicine, Geneva University Hospital, Geneva, Switzerland
3 Institute of Genetics and Genomics in Geneva (iGE3), University ofGeneva, Geneva, Switzerland
Immunogenetics (2016) 68:401–416DOI 10.1007/s00251-016-0918-x
most often invoked to explain this huge diversity is heterozy-gote advantage (overdominance). This suggests that heterozy-gote individuals carrying different alleles at a given locus areable to present a larger range of antigenic peptides than homo-zygotes as HLA genes are co-dominantly expressed (Dohertyand Zinkernagel 1975; McClelland et al. 2003; Penn et al.2002; Thursz et al. 1997). Such individuals are, in this way,better protected against pathogens (Prugnolle et al. 2005;Qutob et al. 2011; Sanchez-Mazas et al. 2012). Taking intoaccount the remarkable sequence variation observed withinthe PBR (Bronson et al. 2013; Buhler and Sanchez-Mazas2011), some studies support the divergent allele advantage(DAA) hypothesis which assumes both asymmetric heterozy-gote advantage and high divergence of allele sequences.According to DAA (Wakeland et al. 1990), heterozygotescarrying divergent alleles would have an enhanced ability topresent larger sets of peptides than heterozygotes carryingmolecularly close alleles. On the other hand, based on thenumerous population studies that have been performed duringthe last decades (Buhler and Sanchez-Mazas 2011; Nuneset al. 2010; Riccio et al. 2013; Sanchez-Mazas et al. 2011;Solberg et al. 2008), one remarkable observation, which ap-pears contradictory with the abovementioned hypotheses, isthat large proportions of homozygotes at one or more loci areoften found in small-sized and isolated populations such asAmerindians, Taiwanese Aborigines, and Pacific islanders, asa likely result of rapid genetic drift during their migrations’history. In this context, the genetic homogeneity ofAmerindians has been related to their high rate of mortalityfollowing European colonization, which would have renderedthem particularly susceptible to newly introduced diseases(Black 1992). However, a very contrasting situation is ob-served in some Aboriginal populations from Taiwan, whichare numerically very large despite being among the most ho-mogeneous populations in the world according to HLA (Linet al. 2000). Indeed, recent demographic data on the Ami andPaiwan indicate census of 200,604 and 96,334 individuals,respectively, whereas the Ami and the Paiwan exhibit ahomozygozity of 43 and 76% at HLA-Awith one single allele(A*24:02) reaching a frequency of 64 and 86.3 %, respective-ly. Such numbers are not consistent with these tribes goingextinct. Thus, we may wonder whether additional mecha-nisms other than heterozygote advantage are involved toensure a sufficient immune protection in these popula-tions. Looking at other species, a decreased survival hasbeen associated to MHC homozygosity by some studies(Froeschke and Sommer 2005; Huchard et al. 2010;Worley et al. 2010), but not by others (Ilmonen et al.2007; Mainguy et al. 2006); this also leaves open thepossibility of additional selective forces at play.
One attractive approach to tackle this question is to inves-tigate the patterns of HLA genetic variation observed at thepopulation level in relation to the functionality of the HLA
molecules and in particular to their peptide-binding specific-ities. The identification of residues involved in peptide bind-ing was first assessed by crystallographic studies determiningthe three-dimensional structure of the HLA-A2 molecule(Bjorkman et al. 1987; Saper et al. 1991). They were followedby deeper investigations on class I molecules properties(Chelvanayagam 1996; Kangueane et al. 2001; Reche andReinherz 2003), further leading to the definition of class Isupertypes (i.e., groups of alleles sharing chemical propertiesat the B and F pocket-like structures of the PBR) (Franciscoet al. 2015; Sidney et al. 2008). As a crucial question was tocharacterize bothMHC ligands and peptide motifs involved inpeptide binding, diverse database resources like MHCPEP(Brusic et al. 1998), SYFPEITHI (Rammensee et al. 1999),and IEDB (Peters et al. 2005; Vita et al. 2010) were alsocreated. In addition, because the very high level of polymor-phism observed in the PBR makes the description of all pos-sible HLA-peptide combinations very challenging, severalcomputer methods taking into account the molecular informa-tion of both the PBR and the presented peptides were devel-oped to predict peptide binding even in the absence of exper-imental data (Hoof et al. 2008; Liao and Arthur 2011a;Lundegaard et al. 2008; Lundegaard et al. 2010; Rapin et al.2001; Roomp et al. 2010; Thomsen et al. 2013 and Liao andArthur 2011b for a review). Such developments, together withour recent study questioning the functional relevance of HLAclass I supertypes (Francisco et al. 2015), strongly motivatedus for investigating in more depth the relationship between theHLA polymorphism and its immune function in a molecularevolutionary framework.
In this study, we thus combine the use of the peptide-binding prediction tools described above (in particularMHCcluster 2.0; Thomsen et al. 2013) with an extensive anal-ysis of molecular diversity in a large set of HLA-typed popu-lation samples (6094 individuals from 46 populations world-wide, all of them tested at the second field level of resolutionfor three class I loci HLA-A, HLA-B, and HLA-C) to explorethe functional relevance of the HLA class I polymorphism inhuman populations. By analyzing the nucleotide diversity atexons 2 and 3 of the three classical HLA class I genes, we firstexplore the distribution and level of variability of the aminoacid residues in the PBR in relation to their involvement inpeptide binding in order to reassert previous observations andanalyses made on class I genes (Hedrick et al. 1991; Yanget al. 2005). Based on these confirmatory results, we thenestimate pairwise molecular distances and predict pairwisepeptide-binding distances between all alleles and correspond-ing molecules observed in our dataset and we use them toassess whether different populations exhibit similar amountsof molecular divergence and peptide-binding coverage, bothat individual class I loci and by considering groups of locitogether. By using this original approach taking into accountthe putative immune potential of different populations, our
402 Immunogenetics (2016) 68:401–416
aim is to identify on a thorough statistical basis whether andhow balancing selection—and more particularly DAA—mayexplain the evolution of the HLA class I polymorphism in allpopulations despite heterogeneous levels of HLA diversity atindividual loci due to contrasted demographic histories.
Material and methods
Population data
Population samples typed simultaneously at the threeclassical class I loci HLA-A, HLA-B, and HLA-C weretaken from the Gene[VA] database (Nunes et al. 2014).A total of 6094 individuals from 46 populations wereretained after filtering the data (e.g., for sufficient sam-ple size, adequate level of typing resolution, and more).A summary of the population data is given in Table 1and the details (including the filtering criteria) inSupplementary Material and Methods (Online Resource1). Two criteria were used to categorize the populations,(1) their geographic location in different continental(sub)regions, Europe (EUR), North Africa (NAFR),Sub-Saharan Africa (SAFR), West Asia (WASI),Northeast Asia (NEASI), North America (NAME),South America (SAME), Southeast Asia (SEASI), andOceania (OCE), and (2) their assumed demographic his-tory through either rapid genetic drift (RGD), for small-sized and isolated populations, or slow genetic drift(SGD) for the others (large outbred populations).
Statistical analyses
Characterizing the HLA class I molecular diversityat the peptide-binding regions
Exon 2 and 3 sequence alignments of the three HLA class Igenes A, B, and C were downloaded from the IMGT/HLAdatabase and pre-formatted as described in SupplementaryMaterial and Methods (Online Resource 1). These were usedto calculate pairwise molecular distances (PMD) among the328 HLA class I alleles (86, 179, and 63 alleles at HLA-A,HLA-B, and HLA-C, respectively) observed in the 46 avail-able population samples, estimated with Arlequin 3.11(Excoffier and Lischer 2010) by counting the number of nu-cleotide differences between their corresponding sequences.Shannon entropy (Shannon 1948) is a very sensitive measureof diversity widely used in biology for estimating the variabil-ity of sequence data, including HLA (Reche and Reinherz2003), that also allows to distinguish sequence variabilityfrom heterozygosity-based population diversity analyses. Torelate the molecular diversity (at exons 2 and 3) of HLA allelesto the peptide-binding properties of their corresponding HLAmolecules (defined by amino acid changes in the PBR), all183 codons of these two regions were characterized by severalcriteria: (i) the maximal value of entropy was estimated foreach codon (HCODON_MAX hereafter, details in SupplementaryMaterial and Methods, Online Resource 1), allowing to cate-gorize all codons as containing at least one non-synonymoussite (label NS), only synonymous site(s) (label S), or as beingmonomorphic (label M); (ii) the codons were also classified ascoding or not coding for the residues forming the six pocket-like structures (A, B, C, D, E, and F) of the PBR as defined bythe crystallographic study of Saper et al. (1991). Thesepockets accommodate the amino acid residues of the antigenicpeptides presented by the HLAmolecules (note, however, thatthe central C, D, and E pockets were regrouped into a singleCDE pocket for the analyses, see Supplementary Material andMethods, Online Resource 1). As a result, 34 codons werelabelled P (for pocket) and 149 NP (for non-pocket); (iii)finally, a broader definition of peptide-binding residues takinginto account 31 additional codons (Supplementary Materialand Methods, Online Resource 1) was used to classify thecodons into two additional categories, binding (B) and non-binding (NB); of the 183 codons, 65 were labelled Band 118 NB.
We then checked whether polymorphic (NS and S) andnon-polymorphic (M) codons were randomly distributedwithin the PBR, when categorized as coding or not for resi-dues forming the pocket-like structures (P or NP), and ascoding or not for residues involved in peptide binding (B orNB). To that aim, we assessed the independence between thelevel of polymorphism of the codons and their involvement inpocket-like structures or peptide binding by using Pearson’s
Table 1 Summary of the population data
Region Npop (RGD/SGD) N Mean sample sizea
EUR 5 (0/5) 1563 312.6 (±775.25)
NAFR 1 (0/1) 230 230 (NA)
NAME 1 (1/0) 149 149 (NA)
NEASI 2 (0/2) 356 178 (±36.77)
OCE 4 (4/0) 399 99.75 (±123.96)
SAFR 7 (0/7) 1225 175 (±134.3)
SAME 2 (2/0) 212 106 (±90.51)
SEASIb 20 (12/8) 1637 81.85 (±103.98)
WASI 4 (0/4) 323 80.75 (±49.33)
46 (19/27) 6094
Npop number of population samples, SGD slow genetic drift, RGD rapidgenetic drift, N number of individuals, NA not available, EUR Europe,NAFR Northern Africa, NAME Northern America, NEASI NortheasternAsia, OCE Oceania, SAFR Sub-Saharan Africa, SAME SouthernAmerica, SEASI Southeastern Asia, WASIWestern AsiaaMean sample size (±2*standard deviation)b Including 15 populations from Taiwan
Immunogenetics (2016) 68:401–416 403
chi-squared tests, and we estimated their respective contribu-tion to a significant relationship, in case of rejection, by stan-dardized residuals (stdres) (Agresti 2007). The distribution ofHCODON_MAX values was also used to compare more preciselythe categories of codons (P, NP, B, and NB) with Wilcoxon-Mann-Whitney rank sum tests and box-and-whisker plots. Wealso used a linear model followed by a post hoc Tukey’s HSDtest in order to compare the HCODON_MAX values at a moredetailed structural level using the residues of the four individ-ual pockets A, B, CDE, and F and the non-pocket (NP) resi-dues. All the analyses described above were performed on thethree HLA class I loci (A, B, and C) considered separately butalso on the three loci taken together (ABC) by using combinedsequence alignments.
Predicting peptide-binding distances between HLA class Imolecules
The method MHCcluster 2.0 (Thomsen et al. 2013), recentlydeveloped to cluster HLA molecules according to theirpeptide-binding specificities, was applied to estimate pairwisepeptide-binding distances (PPBD) between the 328 class Ivariants considered in this study. For a given HLA molecule,MHCcluster 2.0 predicts the binding of its corresponding PBRto a set of 50,000 predefined natural peptides by using theNetMHCpan method (Hoof et al. 2008). Next, the correlationbetween the top 10 % strongest peptides bound by differentmolecules is used to measure a peptide-binding similarity be-tween them. This similarity is +1 if the PBRs of two differentmolecules have a perfect binding specificity overlap (i.e., bothPBRs bind exactly to the same top 10 % peptides) and −1 ifthe two PBRs share no specificity overlap. Given this similar-ity, the peptide-binding distance between two molecules isdefined as (1-similarity). These distances are then transformedto fall within the range [0–1] by dividing them by the largestdistance in the dataset analyzed (Morten Nielsen, personalcommunication).
Estimating the mean increase of molecular distanceand the mean gain in peptide-binding coverage in differentpopulations
We first investigated the putative relationship between thenumbers of HLA alleles (k) observed in the populations andthe depth of their immune repertoire. Indeed, under DAAselection, one may expect that alleles found in small-sizedand isolated populations are increasingly divergent in orderto ensure a sufficient immune coverage despite a significantdrop in number. To that aim, Spearman’s correlation coeffi-cients were estimated between k and two different statistics,i.e., the mean value of all pairwise molecular distances be-tween the observed alleles (mean PMD), and the mean valueof all pairwise peptide-binding distances (mean PPBD)
between their corresponding HLA molecules, respectively.We also tested the relationship between these two statisticsand both the sample size (N) and (to correct for sample sizeheterogeneity among populations) the allelic richness (ar)using the formula given by El Mousadik and Petit (1996).Finally, the relationship between k and the two distance statis-tics was also explored by simulation. To do so, we generatedcollections of 46 samples of N=50 individuals (the smallestsample size in the dataset) by bootstrapping from each of the46 original population samples. Spearman’s correlation coef-ficients between the simulated k and both distances were thenestimated for each collection of 46 bootstrapped samples andrepeated 2500 times as a tradeoff between computational timeand numerical precision to obtain empirical distributions to becompared to the observed correlation coefficients. This ap-proach was expected to correct for sample size disparitiesand thus indicate whether the sample size affected the ob-served correlations between k and the distances.
Our second approach was to use the HLA class I genotypedata of the 6094 individuals to estimate two newly definedparameters, (i) the relative increase of molecular distance(RIMD) and (ii) the relative gain in peptide-binding coverage(RGPBC) for each individual. These two variables estimatethe extent of the immune potential of an individual conferredby the two alleles he carries at a given locus. The HLA mol-ecules might exhibit a higher capacity to bind different pep-tides (i.e., a higher immune potential) because they differ fromeach other either by a greater molecular distance (allele diver-gence) or by a greater peptide-binding distance (peptide-binding coverage) when compared to a null situation wherethese two parameters are equal to zero. For example, a homo-zygote at locus HLA-A will have a RIMDA of 0, whereas aheterozygote will have a RIMDA varying from 0 (in case of aheterozygote carrying alleles with an identical PBR sequence)to 1 with increasing molecular distances between its twoHLA-A alleles. The same rationale applies to estimateRGPBC after replacing the molecular distances by thepeptide-binding distances. Interestingly, these two parameterscan also be estimated by considering several loci at the sametime. For example, a homozygote at both loci HLA-A andHLA-B with same PBR sequence will have a RIMDAB of 0,whereas a heterozygote at any of the two loci, or both, willhave a RIMDAB varying from 0 to 1 with increasing meanmolecular distances between its four HLA-A and HLA-B al-leles and so on for the three loci A, B, and C. Finally, the twoparameters can be used at the population, rather than the indi-vidual, level: a high mean RIMD between the individuals of agiven population indicates that they tend to carry molecularlydistant alleles and a high mean RGPBC that they tend toexpress HLA molecules with elevated peptide-binding dis-tances. Furthermore, if the loci combinations do not haveany additional effect, the expectation is that the variance ofboth RIMD and RGPBCmeasured on the population samples
404 Immunogenetics (2016) 68:401–416

remains at the same level as for individual loci (or, at least, areduction is not expected), what provides a statistical test forthe null hypothesis of loci acting independently on RIMD andRGPBC. Both parameters thus capture the breadth of func-tional diversity in populations from an immunological per-spective and allow one to compare the obtained profiles tothe ones obtained with more conventional measures of diver-sity such as heterozygosity. Based on these, mean RIMD andRGPBC were estimated in the 46 populations of this study.Linear models followed by Tukey’s HSD post hoc tests werethen used to compare these values across the loci, i.e., acrossthe three individual class I loci (A, B, and C), across all pairsof loci (AB, AC, and BC), and across the three loci takentogether (ABC). In addition to the Blocus^ variable, popula-tion demography (defined by the two categories RGD andSGD, see above) was also included as an explanatory variablein the models tested (but we did not use the geographicinformation because of the uneven distribution of samplesamong the different geographic regions, see Table 1 andSupplementary Material and Methods, Online Resource 1).
Most of the analyses described above were performed withR version 3.1.0 (R Core Team 2014) using the packages coin(Hothorn Torsten 2008), to perform statistical analyses withp values provided by Monte Carlo simulations, and ggplot2(Wickham 2009), for exploratory data analysis and graphics.The various linear models used always accounted for maineffects and interactions of the predictor variables.
Results
Molecular diversity of the HLA class I genes
Distribution of polymorphic residues within the PBR
The results of the independence test between the polymorphicstatus (M/NS/S) of the codons and their involvement in eitherpocket-like structures (P/NP) or peptide binding (B/NB) indi-cate that polymorphic residues are predominantly non-randomly distributed within the PBR of the HLA class I mol-ecules (Table 2). Indeed, except in one case (for HLA-C pep-tide binding when a correction for multiple tests is applied:p=0.037, n.s. with α′=0.00625), the independence is signif-icantly rejected (p values: 0.0005–0.0045). In all cases, weobserve a significant (stdres > |2|) excess of non-synonymouscodons (NS) for residues which are either physically locatedwithin the pockets of the PBR (P) or outside these pockets butbroadly involved in peptide binding (B). By contrast, mono-morphic codons (M) are significantly overrepresented for res-idues which are either located outside the PBR pockets (NP)or not involved in peptide binding (NB). Also, synonymoussites (S, the few ones that were not eliminated when we for-matted the data, see BMaterials and methods^) are mainly
detected at codons coding for residues which are locatedoutside the PBR pockets (NP) or not involved in pep-tide binding (NB).
Amount and distribution of molecular variationwithin the PBR-coding region
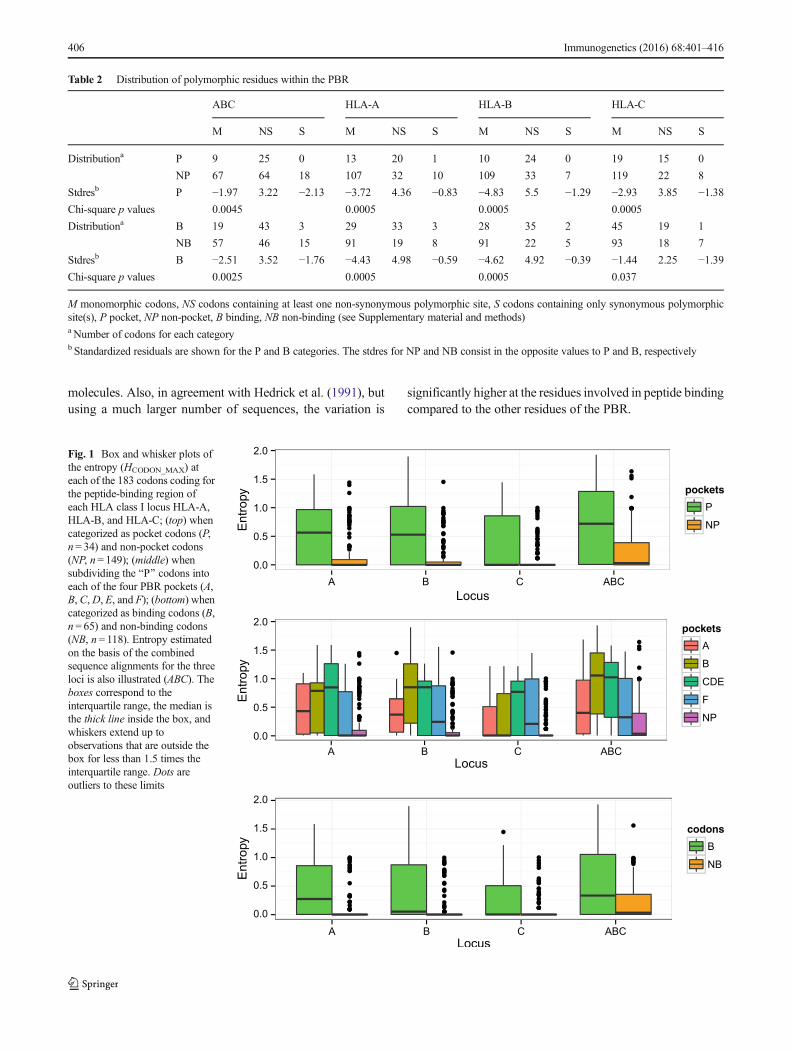
Molecular var ia t ion assessed by codon entropy(HCODON_MAX) within the PBR-coding region (exons 2 and3) is significantly higher at residues located within (P) thanoutside (NP) the PBR pockets (Fig. 1 top and p<2.2e-16 at A,B, C, and ABC according to Wilcoxon-Mann-Whitney ranksum tests) and at binding (B) than non-binding (NB) residues(Fig. 1 bottom and p<2.2e-16 at ABC, A, and B), except atHLA-C (p=0.05). When considering the four pockets A, B,CDE, and F, CDE is the most variable at all loci, and F the lessvariable except at locus C (Fig. 1middle). Interestingly, codon116 of locus C exhibits the highest entropy within the F pocket(1.45), followed by codon 80 (0.997), possibly because thecorresponding residues assume key functions of HLA-C.Actually, residue 116 is of critical relevance in hematopoieticstem cell transplantation (Ferrara et al. 2001; Pidala et al.2013), while residue 80 defines the epitopes C1 (with aspara-gine), recognized by receptors KIR2DL2/3 and KIR2DS4,and C2 (with lysine), recognized by receptors KIR2DL1 andKIR2DS1, respectively (Boyington and Sun 2002; Parhamand Moffett 2013).
According to the linear regression model that we used toanalyze HCODON_MAX in relation to both the Blocus^ and theBpockets^ (i.e., location of residues within or outside the fourPBR pockets) variables (Supplementary Table S1a, OnlineResource 2), the global F statistic is highly significant andboth variables are significant predictors of the entropy(p<0.05 or <0.01 for BlocusA^ to BlocusC^ and BpocketA^to BpocketF^). Also, the only significant interaction betweenthe two variables involves HLA-C and pocket B(BpocketB:locusC^). According to the Tukey’s HSD posthoc test (Supplementary Table S1b, Online Resource 2), forthe Bpockets^ variable, HCODON_MAX is significantly lower atcodons defining non-pocket (NP) residues than at those defin-ing any of the four pockets A, B, CDE, and F and significantlyhigher at codons defining the CDE pocket than at those defin-ing the A pocket (p adj <0.05 for BNP-A^ to BNP-F^ as well as^CDE-A^); for the Blocus^ variable, HCODON_MAX is signifi-cantly higher at ABC than at any of the three individual loci (padj <0.05 for BA-ABC^ to BC-ABC^), whereas loci A, B, andC are not significantly different from each other (p adj >0.05for BB-A,^ BC-A,^ BC-B^). These results are in agreementwith the graphs shown in Fig. 1.
In summary, although some differences are revealed forHLA-C, the results confirm that the polymorphic residuesare not randomly distributed within the PBR and follow apattern related to the functional properties of the HLA
Immunogenetics (2016) 68:401–416 405
molecules. Also, in agreement with Hedrick et al. (1991), butusing a much larger number of sequences, the variation is
significantly higher at the residues involved in peptide bindingcompared to the other residues of the PBR.
Table 2 Distribution of polymorphic residues within the PBR
ABC HLA-A HLA-B HLA-C
M NS S M NS S M NS S M NS S
Distributiona P 9 25 0 13 20 1 10 24 0 19 15 0
NP 67 64 18 107 32 10 109 33 7 119 22 8
Stdresb P −1.97 3.22 −2.13 −3.72 4.36 −0.83 −4.83 5.5 −1.29 −2.93 3.85 −1.38Chi-square p values 0.0045 0.0005 0.0005 0.0005
Distributiona B 19 43 3 29 33 3 28 35 2 45 19 1
NB 57 46 15 91 19 8 91 22 5 93 18 7
Stdresb B −2.51 3.52 −1.76 −4.43 4.98 −0.59 −4.62 4.92 −0.39 −1.44 2.25 −1.39Chi-square p values 0.0025 0.0005 0.0005 0.037
M monomorphic codons, NS codons containing at least one non-synonymous polymorphic site, S codons containing only synonymous polymorphicsite(s), P pocket, NP non-pocket, B binding, NB non-binding (see Supplementary material and methods)a Number of codons for each categoryb Standardized residuals are shown for the P and B categories. The stdres for NP and NB consist in the opposite values to P and B, respectively
Fig. 1 Box and whisker plots ofthe entropy (HCODON_MAX) ateach of the 183 codons coding forthe peptide-binding region ofeach HLA class I locus HLA-A,HLA-B, and HLA-C; (top) whencategorized as pocket codons (P,n= 34) and non-pocket codons(NP, n= 149); (middle) whensubdividing the BP^ codons intoeach of the four PBR pockets (A,B, C,D, E, and F); (bottom) whencategorized as binding codons (B,n= 65) and non-binding codons(NB, n= 118). Entropy estimatedon the basis of the combinedsequence alignments for the threeloci is also illustrated (ABC). Theboxes correspond to theinterquartile range, the median isthe thick line inside the box, andwhiskers extend up toobservations that are outside thebox for less than 1.5 times theinterquartile range. Dots areoutliers to these limits
406 Immunogenetics (2016) 68:401–416
Functional diversity of the HLA class I genes
Patterns of molecular and predicted peptide-bindingdistances between alleles and molecules
The PMD among the 328 observed HLA class I alleles areshown with density curves in Supplementary Fig. S1a (OnlineResource 3). HLA-A and B alleles differ two by two by a largenumber of nucleotide differences (approximately 40 to 60).The same is true for HLA-A and C alleles, whereas HLA-Band C alleles are more closely related (20 to 50 nucleotidedifferences). Within each locus, HLA-B exhibits the largestnumber of nucleotide differences between alleles (up to 47,with a mean of 22.4 and standard deviation of 8.2), followedby HLA-A (up to 39, with a mean of 21.8 ± 8.4). HLA-Calleles are less diverse, with only up to 25 nucleotide differ-ences among each other (mean of 13.6±4.8). These patternsare consistent with HLA class I genes evolution in primates(see BDiscussion^).
The density curves of the PPBD predictedwithMHCcluster2.0 between the corresponding 328 molecules are shown inSupplementary Fig. S1b (Online Resource 3). The distancesbetween molecules taken from different class I loci are usually(very) high (almost always >0.4). This is also true, but to alesser extent, between molecules taken within either HLA-A orHLA-B, with skewed density distributions towards highpeptide-binding distances at both loci. By contrast, HLA-Cmolecules exhibit lower PPBD as well as a clear bimodal den-sity distribution, suggesting the existence of two broad groupsof molecules differing by their peptide-binding properties.
Effect of the number of alleles on molecular distancesand peptide-binding coverage
To test the relationship between the number of alleles ob-served in populations (k) and the depth of their immune rep-ertoire, we first checked that k was smaller in small-sized andisolated (RGD) than in large and outbred (SGD) populations.The differences between the two groups are significant at eachlocus taken individually, as well as when we consider thedifferent pairs of loci or even the three loci taken together (pvalues=2.2e-16 at A, B, C, AB, AC, BC, and ABC accordingto Wilcoxon-Mann-Whitney rank sum tests and correspond-ing graphs in Supplementary Fig. S2, Online Resource 3). Thecorrelations between k and the mean PMD and PPBD at eachlocus and for the different locus combinations are given inTable 3. Only in two cases, a highly significant negative cor-relation is observed (Brwith k^=−0.76, p=7.6e-10 at HLA-Cfor PMD; Br with k^= −0.59, p = 1.7e-05 at HLA-A forPPBD), suggesting an overall increase in peptide-binding cov-erage with a decreasing number of alleles. Otherwise, we ob-serve either a significant positive correlation ranging between0.42 and 0.74 (p < 0.01) or no significant correlation
(p>0.05). These unexpected results probably arose becausethe number of observed alleles (k) is not independent from thesample size (N). We indeed confirmed that k and N are highly(positively) correlated at all loci (Br between k and N^ rangingfrom 0.53 to 0.65, with all p<0.001, Table 3). This is alsoshown in Supplementary Fig. S2 (Online Resource 3), moreparticularly in the case of large outbred (SGD) populationswhich exhibit more heterogeneous sample sizes (see alsoTable 1). Therefore, in an attempt to correct for sample sizeheterogeneity, we tested the correlation between both themean PMD and the mean PPBD and the allelic richness in-stead of k. However, the results are very similar to those ob-tained when using k (Table 3), suggesting that allelic richnessdoes not correct adequately or sufficiently for sample sizeheterogeneity. This is why an additional approach using a re-sampling procedure (see BMaterial and methods^) was ap-plied. The results show that the correlation coefficients ob-served at A, C, AB, and AC, when the mean PMD is used(Fig. S3a, Online Resource 3), and at A, B, C, and AB, whenthe mean PPDB is used (Fig. S3b, Online Resource 3), deviatesubstantially from the empirical distributions obtainedthrough 2500 random samplings, indicating a significant ef-fect of sample size on the allele repertoires of the studiedpopulations. As a consequence, we cannot draw any conclu-sion on the effect of k and ar on peptide-binding coverage.
Effect of the genotypes on molecular distancesand peptide-binding coverage
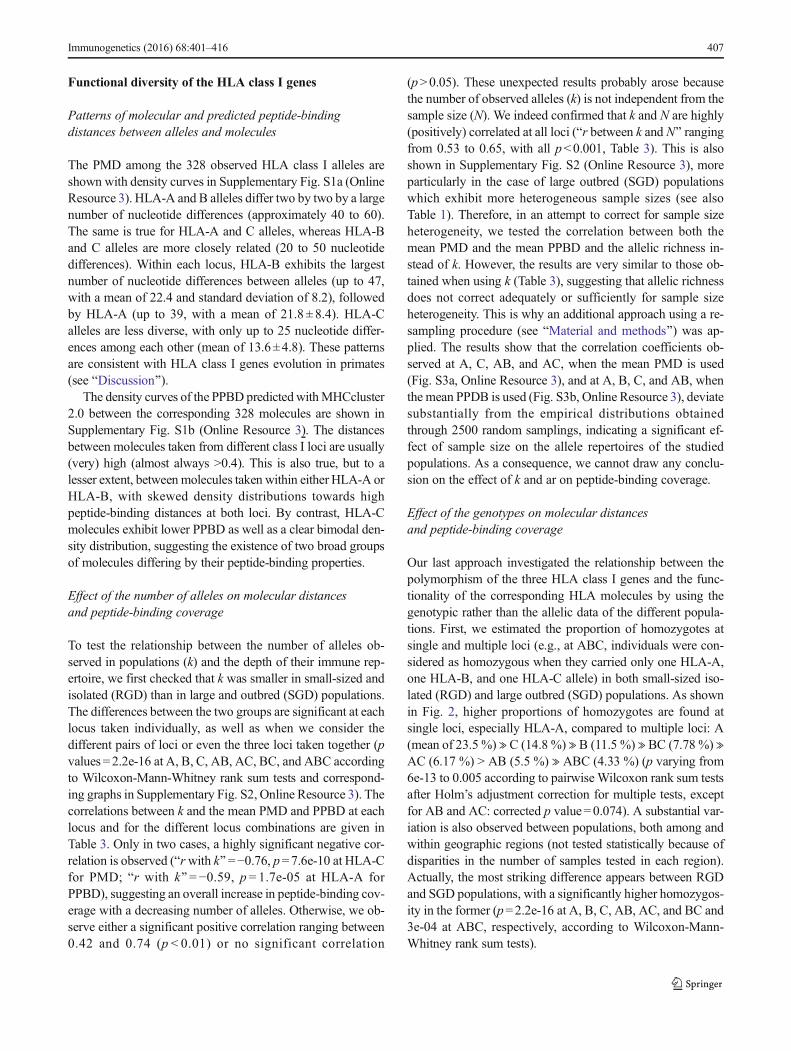
Our last approach investigated the relationship between thepolymorphism of the three HLA class I genes and the func-tionality of the corresponding HLA molecules by using thegenotypic rather than the allelic data of the different popula-tions. First, we estimated the proportion of homozygotes atsingle and multiple loci (e.g., at ABC, individuals were con-sidered as homozygous when they carried only one HLA-A,one HLA-B, and one HLA-C allele) in both small-sized iso-lated (RGD) and large outbred (SGD) populations. As shownin Fig. 2, higher proportions of homozygotes are found atsingle loci, especially HLA-A, compared to multiple loci: A(mean of 23.5 %) ≫ C (14.8 %) ≫ B (11.5 %) ≫ BC (7.78 %) ≫AC (6.17 %) > AB (5.5 %) ≫ ABC (4.33 %) (p varying from6e-13 to 0.005 according to pairwiseWilcoxon rank sum testsafter Holm’s adjustment correction for multiple tests, exceptfor AB and AC: corrected p value=0.074). A substantial var-iation is also observed between populations, both among andwithin geographic regions (not tested statistically because ofdisparities in the number of samples tested in each region).Actually, the most striking difference appears between RGDand SGD populations, with a significantly higher homozygos-ity in the former (p=2.2e-16 at A, B, C, AB, AC, and BC and3e-04 at ABC, respectively, according to Wilcoxon-Mann-Whitney rank sum tests).
Immunogenetics (2016) 68:401–416 407
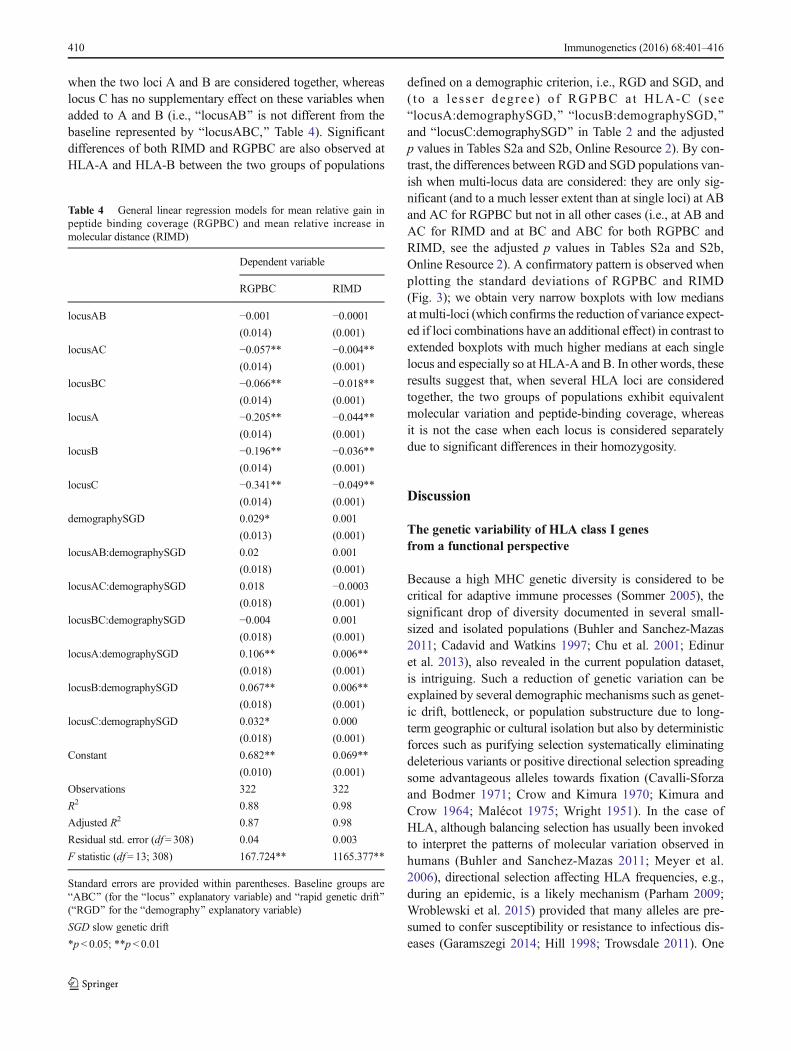
The mean relative increase in molecular distances (meanRIMD) and the mean relative gain in peptide-binding cover-age (mean RGPBC) are shown in Fig. 3 for the 46 populationslabelled with their corresponding geographic (region) and de-mographic (RGD or SGD) information (an alternativerepresentation with density curves is provided in Fig. S4a, b,Online Resource 3). Both RIMD and RGPBC show a steady
increase from single locus tomulti-locus genotypes (i.e., whenmoving along x-axis from right to left in Fig. 3). The lowestvalues are observed at HLA-C (except for one outlier popula-tion at HLA-A), and maximum values are reached at AB andABC loci groups (the slight decrease between AB and ABC isnot significant, see hereafter). This Bfunctional plateau^ isreached by every population, despite the fact that all
Table 3 Analysis of the allelic repertories
Mean pairwise peptide-binding distances (PPBD) Mean pairwise molecular distances (PMD)
Loci r between k and N p value r with N p value r with k p value r with ar p value r with N p value r with k p value r with ar p value
ABC 0.65 1.1E-06 0.42 3.9E-03 0.43 2.8E-03 – – 0.45 1.7E-03 0.63 2.8E-06 – –AB 0.66 7.3E-07 0.11 0.45 0.02 0.89 – – 0.34 0.02 0.43 2.5E-03 – –AC 0.6 1.2E-05 0.49 4.8E-04 0.39 0.01 – – 0.51 2.5E-04 0.52 1.9E-04 – –BC 0.63 2.3E-06 0.45 1.6E-03 0.42 3.9E-03 – – 0.29 0.05 0.56 5.6E-05 – –A 0.64 1.8E-06 −0.47 9.4E-04 −0.59 1.7E-05 −0.55 7.6E-05 0.43 3.1E-03 0.74 5.4E-09 0.72 1.5E-08B 0.67 3.6E-07 0.29 0.05 0.14 0.34 0.1 0.51 0.4 0.01 0.55 6.7E-05 0.53 0C 0.53 1.4E-04 0.05 0.72 −0.22 0.14 −0.2 0.19 −0.46 1.3E-03 −0.76 7.6E-10 −0.71 2.5E-08
r correlation coefficient, N sample size, k number of alleles, ar allelic richness (note that it was only possible to estimate this parameter at individual lociand not when using multi-loci data)
RGD SGD
EUR
NAFR
NAME
NEASI
OCE
SAFR
SAME
SEASI
WASI
EUR
NAFR
NAME
NEASI
OCE
SAFR
SAME
SEASI
WASI
EUR
NAFR
NAME
NEASI
OCE
SAFR
SAME
SEASI
WASI
EUR
NAFR
NAME
NEASI
OCE
SAFR
SAME
SEASI
WASI
EUR
NAFR
NAME
NEASI
OCE
SAFR
SAME
SEASI
WASI
EUR
NAFR
NAME
NEASI
OCE
SAFR
SAME
SEASI
WASI
EUR
NAFR
NAME
NEASI
OCE
SAFR
SAME
SEASI
WASI
AB
CA
BA
CB
CA
BC
0.00 0.25 0.50 0.75 1.00 0.00 0.25 0.50 0.75 1.00
Proportion of homozygotes
region
EUR
NAFR
NAME
NEASI
OCE
SAFR
SAME
SEASI
WASI
Fig. 2 Proportion ofhomozygotes in 46 humanpopulations at single and multipleloci. The geographic provenanceof each population is indicated bya colored dot. Populations aresubdivided into rapid genetic drift(RGD, on the left plots) and slowgenetic drift (SGD, on the rightplots)
408 Immunogenetics (2016) 68:401–416

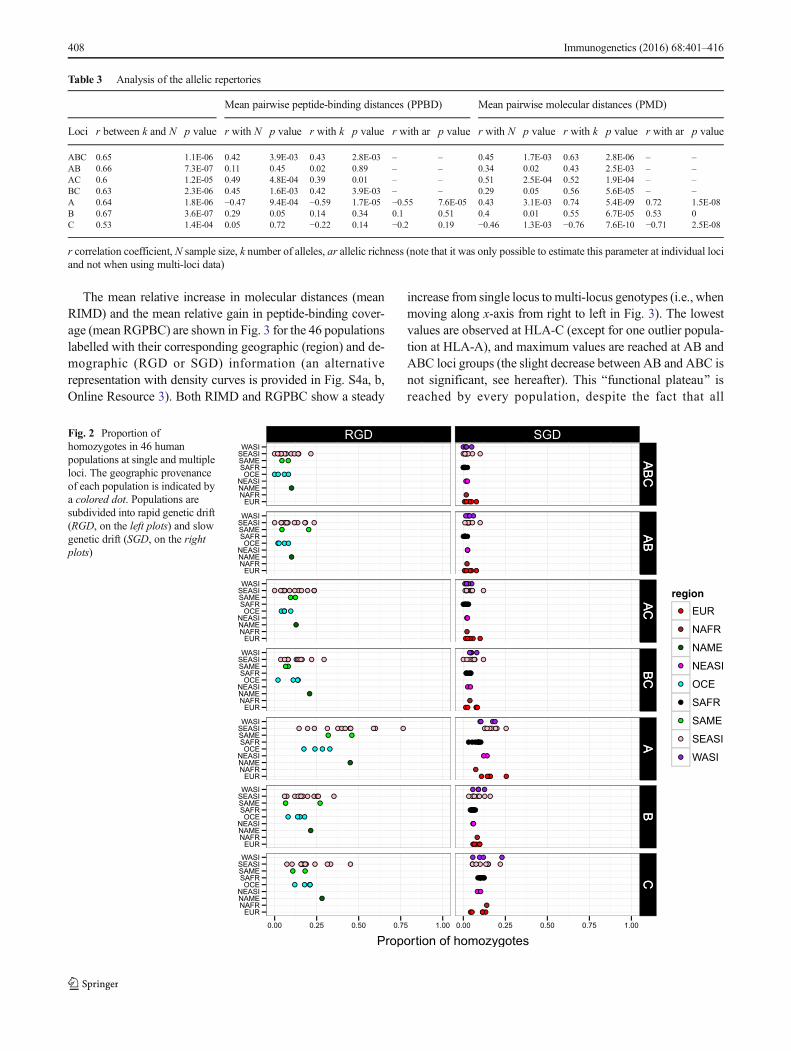
populations differ from each other by their sets of alleles andfrequency distributions (Buhler and Sanchez-Mazas 2011;Mack and Erlich 2006; Riccio et al. 2013; Sanchez-Mazaset al. 2011). The mean RIMD and RGPBCwere also analyzedby using a linear regression model considering both Blocus^and Bdemography^ as explanatory variables (Table 4). Thebest model retained for each index is highly significant (largeF statistics with p<0.01). The results reveal that RIMD and
RGPBC differ significantly among loci and groups of loci(p<0.01 for BlocusAC^ to BlocusC^ in Table 4 and p adj<0.05 in Table S2a and b, Online Resource 2), except RIMDbetween AB and ABC and RGPBC between A and B, BC andAC, and AB and ABC (p adj >0.05 in Tables S2a and b).These observations suggest that the populations reach both amaximum molecular variation (assessed by RIMD) and amaximum peptide-binding coverage (assessed by RGPBC)
0.0
0.2
0.4
0.6
0.00
0.02
0.04
0.06
RG
PB
CR
IMD
ABC AB AC BC A B C
region
EUR
NAFR
NAME
NEASI
OCE
SAFR
SAME
SEASI
WASI
demography
RGD
SGD
0.000
0.005
0.010
0.015
0.020
0.025
AB
C
AB
AC
BC A B C
standard deviations
0.0
0.1
0.2
0.3
0.4A
BC
AB
AC
BC A B C
standard deviations
Fig. 3 Mean relative gain inpeptide binding coverage(RGPBC) and mean relativeincrease in molecular distance(RIMD) in 46 human populations.Broad geographic regions areindicated by different colors,while demography is indicated bythe shape of the dots (a circle forpopulations characterized byrapid genetic drift (RGD) and atriangle for populations with slowgenetic drift (SGD)). Differentscales are used on the y-axis forboth measures. Standarddeviations of RGPBC and RIMDin the populations are provided asinsets and represented withboxplots
Immunogenetics (2016) 68:401–416 409
when the two loci A and B are considered together, whereaslocus C has no supplementary effect on these variables whenadded to A and B (i.e., BlocusAB^ is not different from thebaseline represented by BlocusABC,^ Table 4). Significantdifferences of both RIMD and RGPBC are also observed atHLA-A and HLA-B between the two groups of populations
defined on a demographic criterion, i.e., RGD and SGD, and( to a lesser degree ) of RGPBC at HLA-C (seeBlocusA:demographySGD,^ BlocusB:demographySGD,^and BlocusC:demographySGD^ in Table 2 and the adjustedp values in Tables S2a and S2b, Online Resource 2). By con-trast, the differences between RGD and SGD populations van-ish when multi-locus data are considered: they are only sig-nificant (and to a much lesser extent than at single loci) at ABand AC for RGPBC but not in all other cases (i.e., at AB andAC for RIMD and at BC and ABC for both RGPBC andRIMD, see the adjusted p values in Tables S2a and S2b,Online Resource 2). A confirmatory pattern is observed whenplotting the standard deviations of RGPBC and RIMD(Fig. 3); we obtain very narrow boxplots with low mediansat multi-loci (which confirms the reduction of variance expect-ed if loci combinations have an additional effect) in contrast toextended boxplots with much higher medians at each singlelocus and especially so at HLA-A and B. In other words, theseresults suggest that, when several HLA loci are consideredtogether, the two groups of populations exhibit equivalentmolecular variation and peptide-binding coverage, whereasit is not the case when each locus is considered separatelydue to significant differences in their homozygosity.
Discussion
The genetic variability of HLA class I genesfrom a functional perspective
Because a high MHC genetic diversity is considered to becritical for adaptive immune processes (Sommer 2005), thesignificant drop of diversity documented in several small-sized and isolated populations (Buhler and Sanchez-Mazas2011; Cadavid and Watkins 1997; Chu et al. 2001; Edinuret al. 2013), also revealed in the current population dataset,is intriguing. Such a reduction of genetic variation can beexplained by several demographic mechanisms such as genet-ic drift, bottleneck, or population substructure due to long-term geographic or cultural isolation but also by deterministicforces such as purifying selection systematically eliminatingdeleterious variants or positive directional selection spreadingsome advantageous alleles towards fixation (Cavalli-Sforzaand Bodmer 1971; Crow and Kimura 1970; Kimura andCrow 1964; Malécot 1975; Wright 1951). In the case ofHLA, although balancing selection has usually been invokedto interpret the patterns of molecular variation observed inhumans (Buhler and Sanchez-Mazas 2011; Meyer et al.2006), directional selection affecting HLA frequencies, e.g.,during an epidemic, is a likely mechanism (Parham 2009;Wroblewski et al. 2015) provided that many alleles are pre-sumed to confer susceptibility or resistance to infectious dis-eases (Garamszegi 2014; Hill 1998; Trowsdale 2011). One
Table 4 General linear regression models for mean relative gain inpeptide binding coverage (RGPBC) and mean relative increase inmolecular distance (RIMD)
Dependent variable
RGPBC RIMD
locusAB −0.001 −0.0001(0.014) (0.001)
locusAC −0.057** −0.004**(0.014) (0.001)
locusBC −0.066** −0.018**(0.014) (0.001)
locusA −0.205** −0.044**(0.014) (0.001)
locusB −0.196** −0.036**(0.014) (0.001)
locusC −0.341** −0.049**(0.014) (0.001)
demographySGD 0.029* 0.001
(0.013) (0.001)
locusAB:demographySGD 0.02 0.001
(0.018) (0.001)
locusAC:demographySGD 0.018 −0.0003(0.018) (0.001)
locusBC:demographySGD −0.004 0.001
(0.018) (0.001)
locusA:demographySGD 0.106** 0.006**
(0.018) (0.001)
locusB:demographySGD 0.067** 0.006**
(0.018) (0.001)
locusC:demographySGD 0.032* 0.000
(0.018) (0.001)
Constant 0.682** 0.069**
(0.010) (0.001)
Observations 322 322
R2 0.88 0.98
Adjusted R2 0.87 0.98
Residual std. error (df= 308) 0.04 0.003
F statistic (df= 13; 308) 167.724** 1165.377**
Standard errors are provided within parentheses. Baseline groups areBABC^ (for the Blocus^ explanatory variable) and Brapid genetic drift^(BRGD^ for the Bdemography^ explanatory variable)
SGD slow genetic drift
*p< 0.05; **p < 0.01
410 Immunogenetics (2016) 68:401–416
example is HLA-B*53:01, a protective allele against severemalaria (Hill et al. 1992), that exhibits a marked increase offrequencies in areas of Sub-Saharan Africa wherePlasmodium falciparum is prevalent (Garamszegi 2014;Testi et al. 2015). However, even in areas where malaria isthe main endemic disease, many other pathogens may also bepresent and a low level of HLA allele diversity may still bevery detrimental. In this context, we thus planned to investi-gate the relationship between the molecular and functionaldiversity (i.e., the putative ability to present a broad spectrumof peptides) of the 3 HLA class I genes A, B, and C in a largeset of 46 populations from different geographic locations andshowing contrasted amounts of HLA polymorphism.
We first assessed the relevance of using the huge levels ofnon-synonymous molecular variation observed in exons 2 and3 as a sound, although indirect, estimate of the properties ofHLA class I molecules at binding antigenic peptides. Indeed,these two exons are the backbonewheremost of the functionalpolymorphism has been accumulating, being generated by denovomutational events or shuffled by recombination and geneconversion events (Martinsohn et al. 1999). By analyzing thecodons’ molecular entropy at the three class I genes, weconfirmed and generalized the previous suggestion ofHedrick et al. (1991) that non-synonymous sites in exons 2and 3 are not randomly distributed within the PBR (despitesome peculiarities observed at the HLA-C locus) but follow apattern that is significantly related to functionality. Indeed,these sites are concentrated not only in the codons that definethe pocket-like structures of the PBR accommodating the an-tigenic peptides but also in codons that are defined as criticallyinvolved in peptide binding (Bjorkman et al. 1987;Chelvanayagam 1996; Kangueane et al. 2001; Reche andReinherz 2003), despite their physical location outside ofthese pockets. This pattern is concordant with the hypothesisthat balancing selection is a main force maintaining highlevels of molecular variation in the PBR (Bitarello et al.2015; Hedrick et al. 1991; Hughes and Nei 1988). As a com-plementary and original approach, we used peptide-bindingpredictions which allowed us to show that the patterns ofpairwise molecular distances among alleles are similar to thepatterns of predicted peptide-binding distances among theircorresponding molecules. The latter were assessed byNetMHCpan (Hoof et al. 2008), one of the best performingalgorithms currently available for class I binding predictions(Trolle et al. 2015; Zhang et al. 2009, 2012), and which wasrecently integrated into a method, MHCcluster (Thomsen et al.2013), allowing to perform functional clustering of HLA classI molecules. In accordance with our results, a recent studyindicates that the amino acid positions that mostly alter peptidebinding are the highly polymorphic ones, while other codonshave much less or no influence at all on the peptide repertoire(van Deutekom and Keşmir 2015). In light of these observa-tions, both types of distances (molecular and peptide binding)
were retained in this study as independent and complementarymeasures of the HLA class I functional diversity, i.e., theability to present a broad spectrum of antigenic peptides.
Explaining the evolution of HLA class I polymorphismby a model of joint divergent asymmetric selection
Our objective was then to compare this functional diversityamong the 46 populations of our study. To that aim, we firstdefined two original indices, the RIMD and the RGPBC,allowing to compare the levels of functional variation amongindividuals, conditional of their heterozygous state (account-ing for allele divergence or DAA) and of the alleles carried atone, two, or the three classical HLA class I loci (A, B, C)considered together. While the mechanisms of natural selec-tion occur at the level of the individuals, signals of the processof natural selection are only visible at the level of the popula-tions. We thus expanded the functional comparisons by com-puting mean values of RIMD and RGPBC in each population,again by considering successively each locus separately, thedifferent pairs of loci and the three loci together. The mostoutstanding result was that while small-sized and isolated(RGD) populations differ in their functional diversity (in termsof both molecular variation and peptide-binding coverage)from large outbred (SGD) populations at individual class Igenes (and particularly so at HLA-A and HLA-B), all popu-lations share similar levels of functional diversity when thethree loci (ABC) are considered together. In other words, asimilar amount of functionally relevant HLA diversity appearsto be maintained at the three HLA class I genes taken togetherin every population, irrespective of a drop of diversity at singleloci due to demographic events or directional selection. Basedon this essential result, we thus propose a model of joint di-vergent asymmetric selection acting on (the three classicalgenes of) HLA class I as a whole.
A form of DAA selection thus appears to favor combina-tions of functionally divergent alleles at multiple loci in dif-ferent populations, probably as a general mechanism to ham-per pathogens evading immune recognition (Lenz 2011; Pottsand Slev 1995). Moreover, the diversifying effect of selectionis likely to reach a maximal threshold, here evidenced by theBfunctional plateaus^ shown in Fig. 3. This latest observationparallels a suggestion by Lau et al. of an upper limit to se-quence divergence generated by the DAAmodel at HLA classII locus, HLA-DRB1 (Lau et al. 2015). One reason invokedfor explaining this limit is that a too high sequence divergencebetween HLA molecules would reduce the T cell repertoireduring thymus maturation (Lau et al. 2015; Lenz 2011), in thesame way to what has been proposed for a too high number ofMHC molecules (Nowak et al. 1992; Woelfing et al. 2009).Some empirical evidence for this hypothesis comes from stud-ies of mate choice in fish, where intermediate rather than max-imum MHC sequence dissimilarity would be preferred
Immunogenetics (2016) 68:401–416 411
(Forsberg et al. 2007; Lenz et al. 2009; Nowak et al. 1992;Woelfing et al. 2009). This hypothesis is also retained byChappell et al. (2015) to explain why promiscuous (i.e., gen-eralist) MHC molecules, presenting a great variety of antigen-ic peptides, exhibit significantly lower levels of expressionthan fastidious (i.e., specialist) ones, thus allowing survivalof enough T cell clones during negative selection in the thy-mus. In addition to the model of joint divergent asymmetricselection, the present study thus proposes for the first time anupper limit to both sequence divergence—and hence peptide-binding distances—for HLA class I alleles.
In line with the above mentioned observations, a substan-tial overlap between the peptides bound by different HLAmolecules at one or several loci is often observed, even whenthese molecules exhibit a large variability in the number ofpeptides that they are able to bind (Lenz 2011; Rao et al.2011). This binding overlap, or promiscuity (in the sense ofnon-specific binding), may lead to a much reduced HLA func-tional polymorphism than anticipated (Rao et al. 2011) andmay explain the currently observed Bplateaus.^ Actually,some level of redundancy is essential to prevent pathogensevading immune recognition (Potts and Slev 1995).Interestingly, it has been recently proposed that MHC class Imolecules can either have promiscuous or fastidious bindingproperties (i.e., subdividing into generalist and specialist mol-ecules, respectively) as alternative strategies for resistanceagainst different pathogenic strains (Chappell et al. 2015).Furthermore, contrasting levels of peptide-binding promiscu-ity have also been invoked to explain the distinct patterns ofgenetic variation observed in relation to pathogen richness atHLA-DQA1 and DQB1, on the one hand, and at HLA-A, B,C, and DRB1, on the other hand (Sanchez-Mazas et al. 2012).
One question that remains open is the timescale of the jointdivergent asymmetric selection acting on the HLA loci, assuggested in this study. As the RGPBC and RIMD variablespertain to a genotype-level aspect of variation, it is probablethat only selection operating in relatively recent timescales canbe detected. However, part of our approach incorporates amolecular level of variation into the equation and might thusallow inferring balancing selection at a longer term, a bit sim-ilar to what is proposed for the Tajima’s D statistic (Garriganand Hedrick 2003). In any case, measuring the timescale ofbalancing selection in populations is a complex issue and war-rants further and more detailed analyses.
The peculiar evolution of HLA-C
Although focusing only on class I genes, the present investi-gation also uncovers some fundamental similarities or dissim-ilarities among different HLA loci. Indeed, the pair AB ex-hibits the greatest increase of functional variation, suggestingthat a joint role of these two genes is a critical characteristic ofclass I peptide presentation. This is concordant with the
finding of a general complementarity of binding motifs be-tween HLA-A and Bmolecules (Rao et al. 2013). By contrast,the implication of HLA-C in this process is less obvious, asthe inclusion of this locus does not add anything to the max-imal increase of functional variation seen at HLA-AB (themean RIMD and RGPBC reached by the ABC trio are notsignificantly different from those reached by the AB pair).Moreover, while some differences in RGPBC can be retrievedbetween RGD and SGD populations (but to a much lesserextent than at HLA-A and B), the RIMD values estimatedfor HLA-C are much more similar between these two groupsthan for the other loci. Other peculiar results characterize theHLA-C locus: the molecular entropy estimated in the PBRprovides a weaker signal for polymorphic codons than forHLA-A and B; the pocket-like structure exhibits lower levelsof variation in pocket B compared to HLA-A and B and prob-ably a more prominent role of pockets CDE and F at definingthe peptide-binding properties of HLA-C molecules; and fi-nally, the peptide-binding distances predicted withMHCcluster suggest a subdivision of HLA-C molecules intotwo broad groups regarding their peptide presentationproperties.
Our hypothesis is that HLA-C does not contribute substan-tially to the diversification of class I peptide presentation.Actually, the HLA-C polymorphism is peculiar in several re-spects: it exhibits very balanced frequency distributions ac-cording to selective neutrality tests and the patterns of molec-ular diversity observed in human populations differ markedlyfrom those of the other loci (Buhler and Sanchez-Mazas 2011;Qutob et al. 2011; Solberg et al. 2008); the HLA-C gene alsodistinguishes itself by a differential pattern of expression, bothin lower levels on cell surface (McCutcheon et al. 1995;Neisig et al. 1998) and in tissue distribution (Apps et al.2009; King et al. 1996); and finally, from a functional pointof view, HLA-C is the prominent and specialized ligand forkiller cell immunoglobulin-like receptors (KIR) expressed onnatural killer (NK) cells (Norman et al. 2013; Parham 2005),with C1 and C2 allotypes being recognized by several activa-tor and inhibitory receptors and maintained (probably bybalancing selection) in all extant human populations(Parham et al. 2012). HLA-C has thus likely evolved in a verydifferent way than the other class I loci, despite its more recentorigin. In primates, MHC-C is thought to have arisen from aduplication of aMHC-B ancestral gene after the divergence ofapes and Old World monkeys (Adams and Parham 2001;Fukami-Kobayashi et al. 2005). One stimulating hypothesisto explain the peculiar characteristics of HLA-C moleculardiversity observed in the present study is that, following theduplication from a MHC-B ancestor, MHC-C rapidly ac-quired new functions related to its role as a specialized KIRligand (see (Parham andMoffett 2013) and references therein)and did not assume an equivalent role asMHC-A andMHC-Bin peptide presentation. This study thus also provides the first
412 Immunogenetics (2016) 68:401–416
evidence based on the analysis of HLA sequence diversity thatthe HLA genomic region underwent a mechanism of birth anddeath evolution whereby recently duplicated genes acquirenew functions, as theoretically proposed for the multigenefamilies of the immune system (Nei and Hughes 1992; Neiand Rooney 2005).
Conclusion
The HLA polymorphism is characterized by an extraordi-nary amount of molecular diversity that has since manydecades been supposed to play a crucial role in immunity.However, the evolutionary models that have been pro-posed so far, in particular balancing selection in the formof heterozygous advantage, have not been able to explainsome marked differences of diversity between small-sizedisolated and large outbred populations, the former beingtheoretically disadvantaged due to a much lower hetero-zygosity. Here we reconcile the two kinds of observationsby proposing an original model of joint divergent asym-metric selection of the HLA class I genes, which suggeststhat the lack of diversity at individual loci, as observed inpopulations submitted to rapid genetic drift or to positiveselection due to disease associations, is counter-balancedby complementary peptide-binding properties (due to mo-lecularly divergent alleles) of the molecules coded by sev-eral loci. Moreover, while this model seems robust for thetwo genes HLA-A and HLA-B playing together, the di-versity of HLA-C does not increase significantly the HLAclass I peptide-binding potential, suggesting that this lo-cus assumes a more important role in its KIR-relatedfunctions acquired by birth-and-death evolution. The re-sults presented here provide a framework to conciliatedisparate observations and improve considerably our com-prehension of the adaptive immune response at the populationlevel.
Acknowledgments We are grateful toM.Nielsen for constructive com-ments and technical support for using MHCcluster. This work was sup-ported by the Swiss National Science Foundation (grant no. 31003A_144180 to ASM).
Compliance with ethical standards
Conflict of interest The authors declare that they have no conflict ofinterest.
Open Access This article is distributed under the terms of theCreative Commons Attribution 4.0 International License (http://creativecommons.org/licenses/by/4.0/), which permits unrestricteduse, distribution, and reproduction in any medium, provided you giveappropriate credit to the original author(s) and the source, provide a linkto the Creative Commons license, and indicate if changes were made.
References
Adams EJ, Parham P (2001) Species-specific evolution of MHC class Igenes in the higher primates. Immunol Rev 183:41–64
Agresti A (2007) An introduction to categorical data analysis, 2nd edn.Wiley, New York
Apps R, Murphy SP, Fernando R, Gardner L, Ahad T, Moffett A (2009)Human leucocyte antigen (HLA) expression of primary trophoblastcells and placental cell lines, determined using single antigen beadsto characterize allotype specificities of anti-HLA antibodies.Immunology 127:26–39
Bitarello BD, Francisco RdS, Meyer D (2015) Heterogeneity of dN/dSratios at the classical HLA class I genes over divergence time andacross the allelic phylogeny. J Mol Evol 1–13
Bjorkman PJ, SaperMA, Samraoui B, BennettWS, Strominger JL,WileyDC (1987) Structure of the human class I histocompatibility antigen,HLA-A2. Nature 329:506–512
Black FL (1992) Why did they die? Science 258:1739–1740Boyington JC, Sun PD (2002) A structural perspective on MHC class I
recognition by killer cell immunoglobulin-like receptors. MolImmunol 38:1007–1021
Bronson PG, Mack SJ, Erlich HA, Slatkin M (2013) A sequence-basedapproach demonstrates that balancing selection in classical humanleukocyte antigen (HLA) loci is asymmetric. Hum Mol Genet 22:252–261
Brusic V, Rudy G, Harrison LC (1998) MHCPEP, a database of MHC-binding peptides: update 1997. Nucleic Acids Res 26:368–371
Buhler S, Sanchez-Mazas A (2011) HLA DNA sequence variationamong human populations: molecular signatures of demographicand selective events. PLoS ONE 6:e14643
Cadavid LF, Watkins DI (1997) Heirs of the jaguar and the anaconda:HLA, conquest and disease in the indigenous populations of theAmericas. Tissue Antigens 50:209–218
Cavalli-Sforza LL, Bodmer WF (1971) The genetics of human popula-tions. San Francisco
Chappell PE,Meziane EK, HarrisonM,Magiera Ł, HermannC,Mears L,Wrobel AG, Durant C, Nielsen LL, Buus S, Ternette N, Mwangi W,Butter C, Nair V, Ahyee T, Duggleby R, Madrigal A, Roversi P, LeaSM, Kaufman J (2015) Expression levels of MHC class I moleculesare inversely correlated with promiscuity of peptide binding. eLife4:e05345
Chelvanayagam G (1996) A roadmap for HLA-A, HLA-B, and HLA-Cpeptide binding specificities. Immunogenetics 45:15–26
Chu CC, Lin M, Nakajima F, Lee HL, Chang SL, Juji T, Tokunaga K(2001) Diversity of HLA among Taiwan’s indigenous tribes and theIvatans in the Philippines. Tissue Antigens 58:9–18
Crow JF, Kimura M (1970) An introduction to population genetic theory.New York
DiD, Sanchez-Mazas A, CurratM (2015) Computer simulation of humanleukocyte antigen genes supports twomain routes of colonization byhuman populations in East Asia. BMC Evol Biol 15:1
Doherty PC, Zinkernagel R (1975) Enhanced immunological surveil-lance in mice heterozygous at the H-2 gene complex. Nature 256:50–52
Edinur HA, Dunn PPJ, Hammond L, Selwyn C, Brescia P, Askar M,Reville P, Velickovic ZM, Lea RA, Chambers GK (2013) HLAand MICA polymorphism in Polynesians and New Zealand Maori:implications for ancestry and health. Hum Immunol 74:1119–1129
Excoffier L, Lischer HEL (2010) Arlequin suite ver 3.5: a new series ofprograms to perform population genetics analyses under Linux andWindows. Mol Ecol Resour 10:564–567
Ferrara GB, Bacigalupo A, Lamparelli T, Lanino E, Delfino L, MorabitoA, Parodi AM, Pera C, Pozzi S, Sormani MP, Bruzzi P, Bordo D,Bolognesi M, Bandini G, Bontadini A, Barbanti M, Frumento G(2001) Bone marrow transplantation from unrelated donors: the
Immunogenetics (2016) 68:401–416 413

impact of mismatches with substitutions at position 116 of the hu-man leukocyte antigen class I heavy chain. Blood 98:3150–3155
Forsberg L, Dannewitz J, Petersson E, Grahn M (2007) Influence ofgenetic dissimilarity in the reproductive success and mate choiceof brown trout—females fishing for optimal MHC dissimilarity. JEvol Biol 20:1859–1869
Francisco RS, Buhler S, Nunes JM, Bitarello BD, França GS, Meyer D,Sanchez-Mazas A (2015) HLA supertype variation across popula-tions: new insights into the role of natural selection in the evolutionof HLA-A and HLA-B polymorphisms. Immunogenetics 67:651–663
Froeschke G, Sommer S (2005) MHC class II DRB variability and par-asite load in the stripedmouse (Rhabdomys pumilio) in the SouthernKalahari. Mol Biol Evol 22:1254–1259
Fukami-Kobayashi K, Shiina T, Anzai T, Sano K, Yamazaki M, Inoko H,Tateno Y (2005) Genomic evolution of MHC class I region in pri-mates. Proc Natl Acad Sci U S A 102:9230–9234
Garamszegi LZ (2014) Global distribution of malaria-resistant MHC-HLA alleles: the number and frequencies of alleles and malaria risk.Malar J 13:349
Garrigan D, Hedrick PW (2003) Perspective: detecting adaptive molecu-lar polymorphism: lessons from the MHC. Evol Int J Org Evol 57:1707–1722
Hedrick PW (2002) Pathogen resistance and genetic variation at MHCloci. Evol Int J Org Evol 56:1902–1908
Hedrick PW, Whittam TS, Parham P (1991) Heterozygosity at individualamino acid sites: extremely high levels for HLA-A and -B genes.Proc Natl Acad Sci U S A 88:5897–5901
Hill AVS (1998) The immunogenetics of human infectious diseases.Annu Rev Immunol 16:593–617
Hill AVS, Elvin J, Willis AC, Aidoo M, Allsopp CEM, Gotch FM, MingGao X, Takiguchis M, Greenwood BM, Townsend ARM,McMichael AJ, Whittle HC (1992) Molecular analysis of the asso-ciation of HLA-B53 and resistance to severe malaria. Nature 360:434–439
Hoof I, Peters B, Sidney J, Pedersen LE, Sette A, Lund O, Buus S,Nielsen M (2008) NetMHCpan, a method for MHC class I bindingprediction beyond humans. Immunogenetics 61:1–13
Hothorn Torsten HK (2008) Implementing a class of permutation tests:the coin package. J Stat Softw
Huchard E, Knapp LA, Wang J, Raymond M, Cowlishaw G (2010)MHC, mate choice and heterozygote advantage in a wild socialprimate. Mol Ecol 19:2545–2561
Hughes AL, Nei M (1988) Pattern of nucleotide substitution at majorhistocompatibility complex class I loci reveals overdominant selec-tion. Nature 335:167–170
Ilmonen P, Penn DJ, Damjanovich K, Morrison L, Ghotbi L, Potts WK(2007) Major histocompatibility complex heterozygosity reducesfitness in experimentally infected mice. Genetics 176:2501–2508
Kangueane P, Sakharkar MK, Kolatkar PR, Ren EC (2001) Towards theMHC-Peptide combinatorics. Hum Immunol 62:539–556
Kimura M, Crow JF (1964) The number of alleles that can be maintainedin a finite population. Genetics 49:725–738
King A, Boocock C, Sharkey AM, Gardner L, Beretta A, Siccardi AG,Loke YW (1996) Evidence for the expression of HLA-C class ImRNA and protein by human first trimester trophoblast. JImmunol 156:2068–2076
Lau Q, Yasukochi Y, Satta Y (2015) A limit to the divergent allele ad-vantage model supported by variable pathogen recognition acrossHLA-DRB1 allele lineages. Tissue Antigens 86:343–352
Lenz TL (2011) Computational prediction of MHC II-antigen bindingsupports divergent allele advantage and explains trans-species poly-morphism. Evol Int J Org Evol 65:2380–2390
Lenz TL, Eizaguirre C, Scharsack JP, Kalbe M, Milinski M (2009)Disentangling the role of MHC-dependent ‘good genes’ and ‘com-patible genes’ in mate-choice decisions of three-spined sticklebacks
Gasterosteus aculeatus under semi-natural conditions. J Fish Biol75:2122–2142
Liao WWP, Arthur JW (2011a) Predicting peptide binding affinities toMHC molecules using a modified semi-empirical scoring function.PLoS ONE 6
Liao WWP, Arthur JW (2011a) Predicting peptide binding to major his-tocompatibility complex molecules. Autoimmun Rev 10:469–473
LinM, Chu CC, Lee HL, Chang SL, Ohashi J, Tokunaga K, Akaza T, JujiT (2000) Heterogeneity of Taiwan’s indigenous population: possiblerelation to prehistoricMongoloid dispersals. Tissue Antigens 55:1–9
Little AM, Parham P (1999) Polymorphism and evolution of class I and IIgenes and molecules. Rev Immunogenet 1:105–123
Lundegaard C, Lamberth K, Harndahl M, Buus S, Lund O, Nielsen M(2008) NetMHC-3.0: accurate web accessible predictions of human,mouse and monkey MHC class I affinities for peptides of length 8–11. Nucleic Acids Res 36:W509–W512
Lundegaard C, Lund O, Buus S, Nielsen M (2010) Major histocompati-bility complex class I binding predictions as a tool in epitope dis-covery. Immunology 130:309–318
Mack SJ, Erlich H (2006) 13th International HistocompatibilityWorkshop Anthropology/Human Genetic Diversity Joint Report—Chapter 6: Population relationships as inferred from classical HLAgenes. In: Hansen JA (ed) Immunobiology of the human MHC:Proceedings of the 13th International HistocompatibilityWorkshop and Conference. IHWG Press, Seattle, WA
Mainguy J, Worley K, Côté SD, Coltman DW (2006) Low MHC DRBclass II diversity in the mountain goat: past bottlenecks and possiblerole of pathogens and parasites. Conserv Genet 8:885–891
Malécot G (1975) Heterozygosity and relationship in regularlysubdivided populations. Theor Popul Biol 8:212–241
Martinsohn JT, Sousa AB, Guethlein LA, Howard JC (1999) The geneconvers ion hypothesis of MHC evolut ion: a review.Immunogenetics 50:168–200
McClelland EE, Penn DJ, Potts WK (2003) Major histocompatibilitycomplex heterozygote superiority during coinfection. InfectImmun 71:2079–2086
McCutcheon JA, Gumperz J, Smith KD, Lutz CT, Parham P (1995) LowHLA-C expression at cell surfaces correlates with increased turnoverof heavy chain mRNA. J Exp Med 181:2085–2095
Meyer D, Thomson G (2001) How selection shapes variation of thehuman major histocompatibility complex: a review. Ann HumGenet 65:1–26
Meyer D, Single RM, Mack SJ, Erlich HA, Thomson G (2006)Signatures of demographic history and natural selection inthe human major histocompatibility complex loci. Genetics173:2121–2142
Mousadik AE, Petit RJ (1996) High level of genetic differentiation forallelic richness among populations of the argan tree [Arganiaspinosa (L.) Skeels] endemic to Morocco. Theor Appl Genet 92:832–839
Nei M, Hughes AL (1992) Balanced polymorphism and evolution by thebirth-and-death process in the MHC loci. In: Tsuji K, Aizawa M,Sasazuki T (eds) 11th Histocompatibility Workshop andConference. Oxford Univ. Press, Oxford, UK
Nei M, Rooney AP (2005) Concerted and birth-and-death evolution ofmultigene families. Annu Rev Genet 39:121–152
Neisig A, Melief CJM, Neefjes J (1998) Reduced cell surface expressionof HLA-C molecules correlates with restricted peptide binding andstable TAP interaction. J Immunol 160:171–179
Norman PJ, Hollenbach JA, Nemat-Gorgani N, Guethlein LA, HiltonHG, Pando MJ, Koram KA, Riley EM, Abi-Rached L, Parham P(2013) Co-evolution of human leukocyte antigen (HLA) class Iligands with killer-cell immunoglobulin-like receptors (KIR) in agenetically diverse population of Sub-Saharan Africans. PLoSGenet 9:e1003938
414 Immunogenetics (2016) 68:401–416
Nowak MA, Tarczy-Hornoch K, Austyn JM (1992) The optimal numberof major histocompatibility complex molecules in an individual.Proc Natl Acad Sci U S A 89:10896–10899
Nunes JM, Riccio ME, Buhler S, Di D, Currat M, Ries F, Almada AJ,Benhamamouch S, Benitez O, Canossi A, Fadhlaoui-Zid K, FischerG, Kervaire B, Loiseau P, De Oliveira DCM, Papasteriades C,Piancatelli D, Rahal M, Richard L, Romero M, Rousseau J,Spiroski M, Sulcebe G, Middleton D, Tiercy JM, Sanchez-MazasA (2010) Analysis of the HLA population data (AHPD) submitted tothe 15th International Histocompatibility/ImmunogeneticsWorkshop by using the Gene[rate] computer tools accommodatingambiguous data (AHPD project report). Tissue Antigens 76:18–30
Nunes JM, Buhler S, Roessli D, Sanchez-Mazas A, HLA-net 2013 col-laboration (2014) The HLA-net GENE[RATE] pipeline for effectiveHLA data analysis and its application to 145 population samplesfrom Europe and neighbouring areas. Tissue Antigens 83:307–323
Parham P (2005)MHC class I molecules and kirs in human history, healthand survival. Nat Rev Immunol 5:201–214
Parham P (2009) The immune system. Garland Science, London andNew York
Parham P, Moffett A (2013) Variable NK cell receptors and their MHCclass I ligands in immunity, reproduction and human evolution. NatRev Immunol 13:133–144
Parham P, Norman PJ, Abi-Rached L, Guethlein LA (2012) Human-specific evolution of killer cell immunoglobulin-like receptor recog-nition of major histocompatibility complex class I molecules. PhilosTrans R Soc Lond B Biol Sci 367:800–811
PennDJ, Damjanovich K, PottsWK (2002)MHC heterozygosity confersa selective advantage against multiple-strain infections. Proc NatlAcad Sci U S A 99:11260–11264
Peters B, Sidney J, Bourne P, Bui H-H, Buus S, Doh G, Fleri W,Kronenberg M, Kubo R, Lund O, Nemazee D, Ponomarenko JV,Sathiamurthy M, Schoenberger SP, Stewart S, Surko P, Way S,Wilson S, Sette A (2005) The design and implementation of theimmune epitope database and analysis resource. Immunogenetics57:326–336
Pidala J, Wang T, Haagenson M, Spellman SR, Askar M, Battiwalla M,Baxter-Lowe LA, Bitan M, Fernandez-Viña M, Gandhi M,Jakubowski AA, Maiers M, Marino SR, Marsh SGE,Oudshoorn M, Palmer J, Prasad VK, Reddy V, Ringden O,Saber W, Santarone S, Schul tz KR, Se t terholm M,Trachtenberg E, Turner EV, Woolfrey AE, Lee SJ, Anasetti C(2013) Amino acid substitution at peptide-binding pockets ofHLA class I molecules increases risk of severe acute GVHDand mortality. Blood 122:3651–3658
Potts WK, Slev PR (1995) Pathogen-based models favoring MHC genet-ic diversity. Immunol Rev 143:181–197
Prugnolle F, Manica A, Charpentier M, Guegan JF, Guernier V, Balloux F(2005) Pathogen-driven selection and worldwide HLA class I diver-sity. Curr Biol 15:1022–1027
Qutob N, Balloux F, Raj T, Liu H, Procé SM, Trowsdale J, Manica A(2011) Signatures of historical demography and pathogen richnesson MHC class I genes. Immunogenetics 64:165–175
R Core Team (2014) R: a language and environment for statistical com-puting. R Foundation for Statistical Computing, Vienna
Rammensee H, Bachmann J, Emmerich NP, Bachor OA, Stevanović S(1999) SYFPEITHI: database for MHC ligands and peptide motifs.Immunogenetics 50:213–219
Rao X, Hoof I, Costa AICAF, Baarle D, Keşmir C (2011) HLA class Iallele promiscuity revisited. Immunogenetics 63:691–701
Rao X, De Boer RJ, van Baarle D, Maiers M, Kesmir C (2013)Complementarity of binding motifs is a general property of HLA-A and HLA-B molecules and does not seem to effect HLA haplo-type composition. T Cell Biol 4:374
Rapin N, Hoof I, Lund O, Nielsen M (2001) The MHC motif viewer: avisualization tool for MHC binding motifs. Current protocols inimmunology. Wiley
Reche PA, Reinherz EL (2003) Sequence variability analysis ofhuman class I and class II MHC molecules: functional andstructural correlates of amino acid polymorphisms. J Mol Biol331:623–641
Riccio ME, Buhler S, Nunes JM, Vangenot C, Cuénod M, Currat M, DiD, Andreani M, Boldyreva M, Chambers G, Chernova M, ChiaroniJ, Darke C, Di Cristofaro J, Dubois V, Dunn P, Edinur HA, ElaminN, Eliaou JF, Grubic Z, Jaatinen T, Kanga U, Kervaire B, Kolesar L,Kunachiwa W, Lokki ML, Mehra N, Nicoloso G, Paakkanen R,Voniatis DP, Papasteriades C, Poli F, Richard L, Romón Alonso I,Slavčev A, Sulcebe G, Suslova T, Testi M, Tiercy JM, VarnavidouA, Vidan-Jeras B, Wennerström A, Sanchez-Mazas A (2013) 16thIHIW: analysis of HLA population data, with updated results for1996 to 2012 workshop data (AHPD project report). Int JImmunogenet 40:21–30
Robinson J, Halliwell JA, Hayhurst JD, Flicek P, Parham P, Marsh SGE(2015) The IPD and IMGT/HLA database: allele variant databases.Nucleic Acids Res 43:D423–D431
RoompK, Antes I, Lengauer T (2010) PredictingMHC class I epitopes inlarge datasets. BMC Bioinf 11:90
Sanchez-Mazas A, Fernandez-Viña M, Middleton D, Hollenbach JA,Buhler S, Di D, Rajalingam R, Dugoujon J-M, Mack SJ, ThorsbyE (2011) Immunogenetics as a tool in anthropological studies.Immunology 133:143–164
Sanchez-Mazas A, Lemaître J-F, Currat M (2012) Distinct evolutionarystrategies of human leucocyte antigen loci in pathogen-rich environ-ments. Philos Trans R Soc LondB Biol Sci 367:830–839
Sanchez-Mazas A, Buhler S, Nunes JM (2013) A new HLA map ofEurope: regional genetic variation and its implication for peoplinghistory, disease-association studies and tissue transplantation. HumHered 76:162–177
Santos EJMd, McCabe A, Gonzalez-Galarza FF, Jones AR, Middleton D(2015) Allele frequencies net database: improvements for storage ofindividual genotypes and analysis of existing data. Hum Immunol
Saper MA, Bjorkman PJ, Wiley DC (1991) Refined structure of thehuman histocompatibility antigen HLA-A2 at 2.6 Å resolution. JMol Biol 219:277–319
Shannon C (1948) A mathematical theory of communication. Bell SystTech J 27:379–423
Sidney J, Peters B, Frahm N, Brander C, Sette A (2008) HLA class Isupertypes: a revised and updated classification. BMC Immunol 9:1
Slade RW, McCallum HI (1992) Overdominant vs. frequency-dependentselection at MHC loci. Genetics 132:861–864
Solberg OD,Mack SJ, Lancaster AK, Single RM, Tsai Y, Sanchez-MazasA, Thomson G (2008) Balancing selection and heterogeneity acrossthe classical human leukocyte antigen loci: a meta-analytic review of497 population studies. Hum Immunol 69:443–464
Sommer S (2005) The importance of immune gene variability (MHC) inevolutionary ecology and conservation. Front Zool 2:16
Spurgin LG, Richardson DS (2010) How pathogens drive genetic diver-sity: MHC, mechanisms and misunderstandings. Proc R Soc B BiolSci 277:979–988
Takahata N, Nei M (1990) Allelic genealogy under overdominant andfrequency-dependent selection and polymorphism of major histo-compatibility complex loci. Genetics 124:967–978
Testi M, Battarra M, Lucarelli G, Isgro A, Morrone A, AkinyanjuO, Wakama T, Nunes JM, Andreani M, Sanchez-Mazas A(2015) HLA-A-B-C-DRB1-DQB1 phased haplotypes in 124Nigerian families indicate extreme HLA diversity and lowlinkage disequilibrium in Central-West Africa. TissueAntigens n/a–n/a
Immunogenetics (2016) 68:401–416 415

The MHC sequencing consortium (1999) Complete sequence and genemap of a human major histocompatibility complex. Nature 401:921–923
Thomsen M, Lundegaard C, Buus S, Lund O, Nielsen M (2013)MHCcluster, a method for functional clustering of MHC molecules.Immunogenetics 65:655–665
Thursz MR, Thomas HC, Greenwood BM, Hill AVS (1997)Heterozygote advantage for HLA class-II type in hepatitis B virusinfection. Nat Genet 17:11–12
Trolle T, Metushi IG, Greenbaum JA, Kim Y, Sidney J, Lund O, Sette A,Peters B, Nielsen M (2015) Automated benchmarking of peptide-MHC class I binding predictions. Bioinformatics btv123
Trowsdale J (2011) The MHC, disease and selection. ImmunolLett 137:1–8
van DeutekomHWM,Keşmir C (2015) Zooming into the binding grooveof HLA molecules: which positions and which substitutions changepeptide binding most? Immunogenetics 67:425–436
Vita R, Zarebski L, Greenbaum JA, Emami H, Hoof I, Salimi N, DamleR, Sette A, Peters B (2010) The immune epitope database 2.0.Nucleic Acids Res 38:D854–D862
Wakeland EK, Boehme S, She JX, Lu C-C, McIndoe RA, Cheng I, Ye Y,Potts WK (1990) Ancestral polymorphisms of MHC class II genes:divergent allele advantage. Immunol Res 9:115–122
Wickham H (2009) ggplot2. Springer, New YorkWoelfing B, Traulsen A, Milinski M, Boehm T (2009) Does intra-
individual major histocompatibility complex diversity keep a goldenmean? Phil Trans R Soc B Biol Sci 364:117–128
Worley K, Collet J, Spurgin LG, Cornwallis C, Pizzari T, Richardson DS(2010) MHC heterozygosity and survival in red junglefowl. MolEcol 19:3064–3075
Wright S (1951) The genetical structure of populations. Ann Eugenics 15:323–354
Wroblewski EE, Norman PJ, Guethlein LA, Rudicell RS, Ramirez MA,Li Y, Hahn BH, Pusey AE, Parham P (2015) Signature patterns ofMHC diversity in three gombe communities of wild chimpanzeesreflect fitness in reproduction and immune defense against SIVcpz.PLoS Biol 13:e1002144
Yang Z,WongWS, Nielsen R (2005) Bayes empirical Bayes inference ofamino acid sites under positive selection. Mol Biol Evol 22:1107–1118
Zhang H, Lundegaard C, Nielsen M (2009) Pan-specific MHC class Ipredictors: a benchmark of HLA class I pan-specific predictionmethods. Bioinformatics 25:83–89
Zhang L, Udaka K, Mamitsuka H, Zhu S (2012) Toward more accuratepan-specific MHC-peptide binding prediction: a review of currentmethods and tools. Brief Bioinform 13:350–364
416 Immunogenetics (2016) 68:401–416


![Peptide Nucleic Acids Having Enhanced Binding Affinity and ...[54] PEPTIDE NUCLEIC ACIDS HAVING FOREIGN PATENT DOCUMENTS ENHANCED BINDING AFFINITY AND WO 86/05518 9/1986 WIPO](https://img.pdfslide.net/doc/110x75/5ed9280a6714ca7f4769402c/-peptide-nucleic-acids-having-enhanced-binding-affinity-and-54-peptide-nucleic.jpg)