Embed Size (px)
Citation preview

i
PROLOGUE
I was interested in writing a thesis on the genetic susceptibility to microvascular complications in
patients with type 1 diabetes mellitus because this disease (and diabetes mellitus in general) is a highly
prevalent disease with a rising incidence. No matter what specialization a doctor chooses, diabetes
mellitus will somehow be part of it. Therefore, I believe that as a future healthcare worker it is
essential to understand the pathogenesis of type 1 diabetes mellitus and to be aware which organs are
affected by the disease. I was particularly interested in this topic because I am intrigued by how all the
different environmental and genetic factors interact with each other to finally develop the
complications associated with type 1 diabetes mellitus.
This thesis was realized with the help of my promotor Prof Dr. Van Aken E. and my co-promotor Dr.
Van Aken S. I would like to thank them for their time and consideration. I want to thank Prof. Dr.
Vande Walle J., Prof. Dr. Raes A., Mrs. Rawoens A. and the secretariat of ophthalmology for their
contribution to this thesis. At last, I would also like to thank my family and friends for their support.

ii
TABLE OF CONTENTS
PROLOGUE ........................................................................................................................................................ I
TABLE OF CONTENTS ........................................................................................................................................ II
LIST OF ABBREVIATIONS .................................................................................................................................. III
ABSTRACT (NEDERLANDS) ................................................................................................................................ V
I. ABSTRACT ..................................................................................................................................................... 1
II. INTRODUCTION ............................................................................................................................................ 2
II.1 TYPE 1 DIABETES MELLITUS .................................................................................................................................. 2 II.1.1 Definition ............................................................................................................................................... 2 II.1.2 Incidence and prevalence of type 1 diabetes mellitus ........................................................................... 3 II.1.3 Physiopathology of type 1 diabetes mellitus ......................................................................................... 4 II.1.4 Complications of type 1 diabetes mellitus ............................................................................................. 5
II.2 THE ROLE OF HUMAN LEUKOCYTE ANTIGEN (HLA) IN T1DM ..................................................................................... 7 II.3 DIABETIC RETINOPATHY AND DIABETIC NEPHROPATHY ............................................................................................. 13
II.3.1 Diabetic retinopathy ............................................................................................................................ 13 II.3.1.1 Prevalence and incidence .............................................................................................................................. 13 II.3.1.2 Clinical course of diabetic retinopathy .......................................................................................................... 13 II.3.1.3 The pathogenesis of diabetic retinopathy ..................................................................................................... 15 II.3.1.4 Genetic susceptibility of diabetic retinopathy ............................................................................................... 16
II.3.2 Diabetic nephropathy .......................................................................................................................... 17 II.3.2.1 Prevalence and incidence .............................................................................................................................. 17 II.3.2.2 Clinical course of diabetic nephropathy ......................................................................................................... 17 II.3.2.3 The pathogenesis of diabetic nephropathy ................................................................................................... 18 II.3.2.4 Genetic susceptibility of diabetic nephropathy ............................................................................................. 20
II.3.3 The association between diabetic retinopathy and diabetic nephropathy ......................................... 21 II.4 RESEARCH AIMS ............................................................................................................................................... 21
III. MATERIAL AND METHODS ........................................................................................................................ 22
III.1 PATIENT RECRUITMENT .................................................................................................................................... 22 III.2 STUDY POPULATION ......................................................................................................................................... 22 III.3 COLLECTION OF DATA....................................................................................................................................... 22
III.3.1 HLA-DQ typing and islet autoantibodies, the Belgian Diabetes Registry ........................................... 22 III.3.2 Smoking habits and blood pressure .................................................................................................... 23 III.3.3 HbA1c ................................................................................................................................................. 23 III.3.4 Determination of retinopathy ............................................................................................................ 23 III.3.5 Determination of nephropathy .......................................................................................................... 24
III.4 STATISTICAL ANALYSIS ...................................................................................................................................... 24 III.5 LITERATURE ................................................................................................................................................... 24
IV. RESULTS .................................................................................................................................................... 25
IV.1 PATIENT CHARACTERISTICS ................................................................................................................................ 25 IV.2 ANALYSIS OF THE VARIABLES ............................................................................................................................. 32 IV.3 ANALYTICAL TESTS........................................................................................................................................... 34
IV.3.1 Analytical tests for the microvascular complications ......................................................................... 34 IV.3.2 Analytical tests for diabetic retinopathy ............................................................................................ 37 IV.3.3 Diabetic nephropathy ......................................................................................................................... 39 IV.3.4 Diabetic retinopathy and diabetic nephropathy ................................................................................ 41
V. DISCUSSION ............................................................................................................................................... 42
VI. REFRENCES ................................................................................................................................................ 50
ADDENDUM ...................................................................................................................................................... I
iii
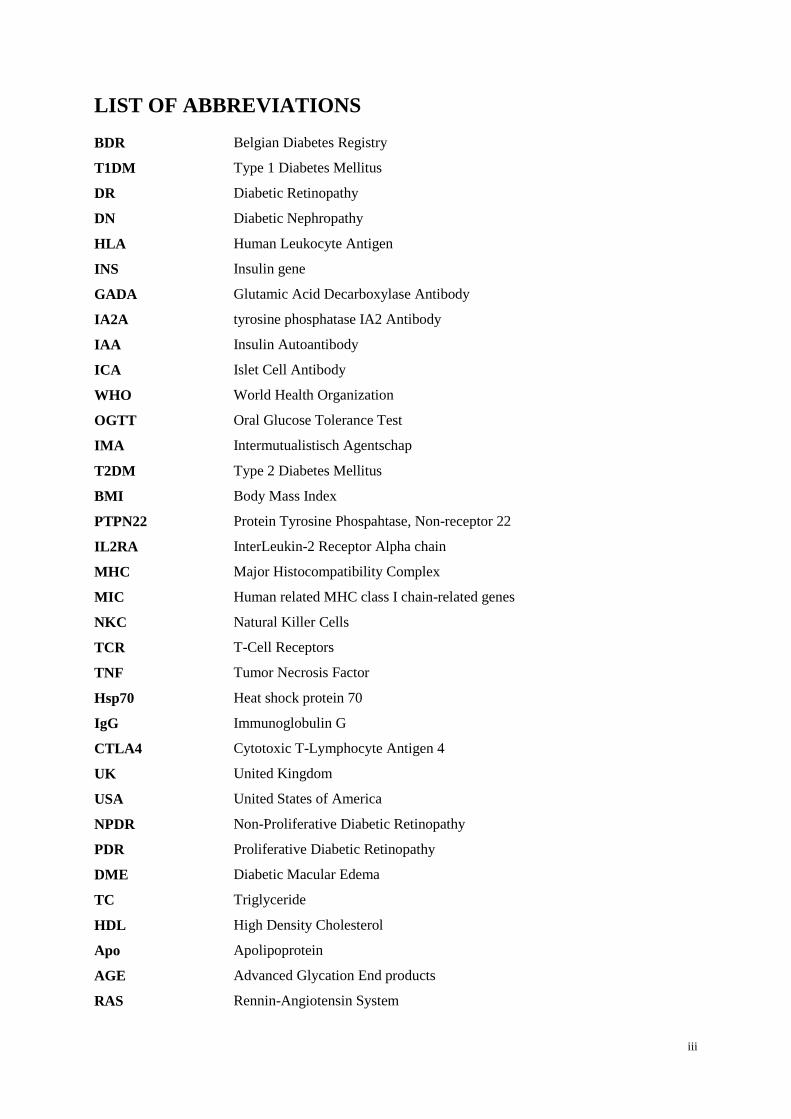
LIST OF ABBREVIATIONS
BDR Belgian Diabetes Registry
T1DM Type 1 Diabetes Mellitus
DR Diabetic Retinopathy
DN Diabetic Nephropathy
HLA Human Leukocyte Antigen
INS Insulin gene
GADA Glutamic Acid Decarboxylase Antibody
IA2A tyrosine phosphatase IA2 Antibody
IAA Insulin Autoantibody
ICA Islet Cell Antibody
WHO World Health Organization
OGTT Oral Glucose Tolerance Test
IMA Intermutualistisch Agentschap
T2DM Type 2 Diabetes Mellitus
BMI Body Mass Index
PTPN22 Protein Tyrosine Phospahtase, Non-receptor 22
IL2RA InterLeukin-2 Receptor Alpha chain
MHC Major Histocompatibility Complex
MIC Human related MHC class I chain-related genes
NKC Natural Killer Cells
TCR T-Cell Receptors
TNF Tumor Necrosis Factor
Hsp70 Heat shock protein 70
IgG Immunoglobulin G
CTLA4 Cytotoxic T-Lymphocyte Antigen 4
UK United Kingdom
USA United States of America
NPDR Non-Proliferative Diabetic Retinopathy
PDR Proliferative Diabetic Retinopathy
DME Diabetic Macular Edema
TC Triglyceride
HDL High Density Cholesterol
Apo Apolipoprotein
AGE Advanced Glycation End products
RAS Rennin-Angiotensin System

iv
VEGF Vascular Endothelial Growth Factor
EPO Erythropoietin
GH-IGF Growth Hormone – Insulin Growth Factor
ESDR End Stage Renal Disease
G-protein G-coupled protein
MAPK Mitogen-Activated Protein Kinase
ROS Reactive Oxygen Species
GFR Glomerular Filtration Rate
ECM Extracellular Matrix
RNS Reactive Nitrogen Species
ILGF Insulin Like Growth Factor
ADIPOQ Adiponectin gene
HbA1c Glycated Hemoglobin, type A1c
SPSS Statistical Package for the Social Sciences
St.D Standard Deviation
mL Milliliter
dL Deciliter
mg Milligram
Mmol Millimol
L Liter
v
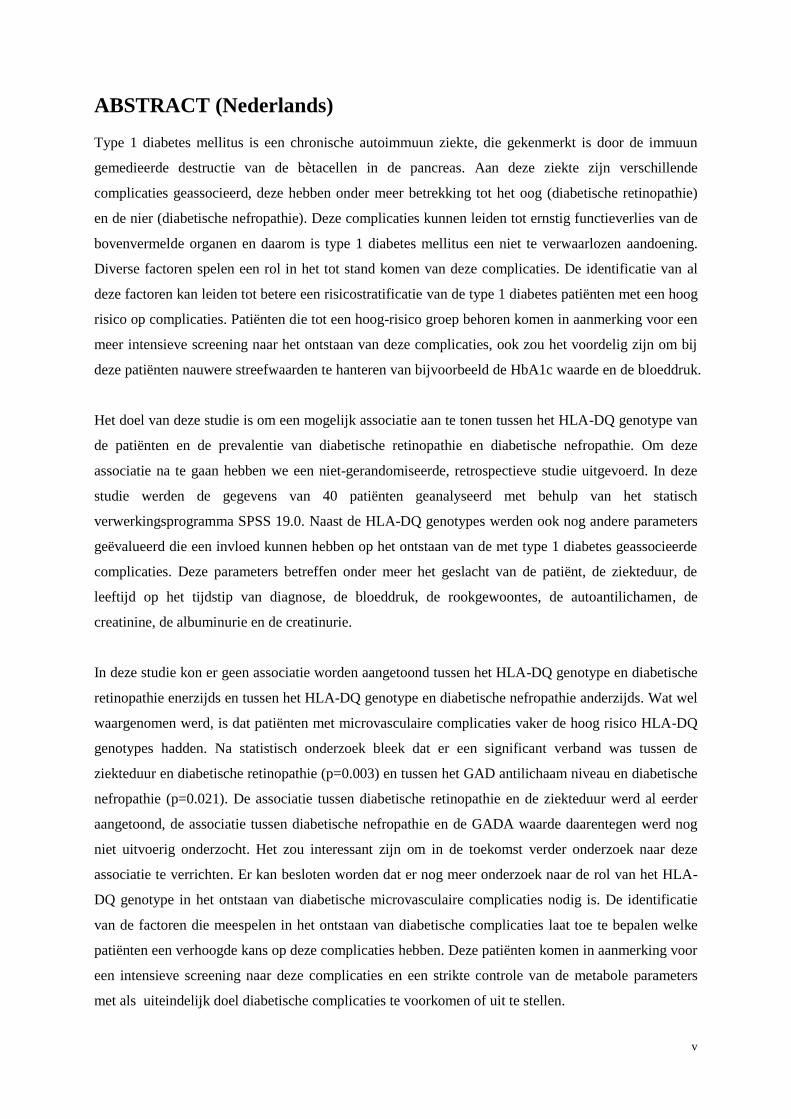
ABSTRACT (Nederlands)
Type 1 diabetes mellitus is een chronische autoimmuun ziekte, die gekenmerkt is door de immuun
gemedieerde destructie van de bètacellen in de pancreas. Aan deze ziekte zijn verschillende
complicaties geassocieerd, deze hebben onder meer betrekking tot het oog (diabetische retinopathie)
en de nier (diabetische nefropathie). Deze complicaties kunnen leiden tot ernstig functieverlies van de
bovenvermelde organen en daarom is type 1 diabetes mellitus een niet te verwaarlozen aandoening.
Diverse factoren spelen een rol in het tot stand komen van deze complicaties. De identificatie van al
deze factoren kan leiden tot betere een risicostratificatie van de type 1 diabetes patiënten met een hoog
risico op complicaties. Patiënten die tot een hoog-risico groep behoren komen in aanmerking voor een
meer intensieve screening naar het ontstaan van deze complicaties, ook zou het voordelig zijn om bij
deze patiënten nauwere streefwaarden te hanteren van bijvoorbeeld de HbA1c waarde en de bloeddruk.
Het doel van deze studie is om een mogelijk associatie aan te tonen tussen het HLA-DQ genotype van
de patiënten en de prevalentie van diabetische retinopathie en diabetische nefropathie. Om deze
associatie na te gaan hebben we een niet-gerandomiseerde, retrospectieve studie uitgevoerd. In deze
studie werden de gegevens van 40 patiënten geanalyseerd met behulp van het statisch
verwerkingsprogramma SPSS 19.0. Naast de HLA-DQ genotypes werden ook nog andere parameters
geëvalueerd die een invloed kunnen hebben op het ontstaan van de met type 1 diabetes geassocieerde
complicaties. Deze parameters betreffen onder meer het geslacht van de patiënt, de ziekteduur, de
leeftijd op het tijdstip van diagnose, de bloeddruk, de rookgewoontes, de autoantilichamen, de
creatinine, de albuminurie en de creatinurie.
In deze studie kon er geen associatie worden aangetoond tussen het HLA-DQ genotype en diabetische
retinopathie enerzijds en tussen het HLA-DQ genotype en diabetische nefropathie anderzijds. Wat wel
waargenomen werd, is dat patiënten met microvasculaire complicaties vaker de hoog risico HLA-DQ
genotypes hadden. Na statistisch onderzoek bleek dat er een significant verband was tussen de
ziekteduur en diabetische retinopathie (p=0.003) en tussen het GAD antilichaam niveau en diabetische
nefropathie (p=0.021). De associatie tussen diabetische retinopathie en de ziekteduur werd al eerder
aangetoond, de associatie tussen diabetische nefropathie en de GADA waarde daarentegen werd nog
niet uitvoerig onderzocht. Het zou interessant zijn om in de toekomst verder onderzoek naar deze
associatie te verrichten. Er kan besloten worden dat er nog meer onderzoek naar de rol van het HLA-
DQ genotype in het ontstaan van diabetische microvasculaire complicaties nodig is. De identificatie
van de factoren die meespelen in het ontstaan van diabetische complicaties laat toe te bepalen welke
patiënten een verhoogde kans op deze complicaties hebben. Deze patiënten komen in aanmerking voor
een intensieve screening naar deze complicaties en een strikte controle van de metabole parameters
met als uiteindelijk doel diabetische complicaties te voorkomen of uit te stellen.
1
I. ABSTRACT
Type 1 diabetes mellitus is a chronic autoimmune disease mediated by the destruction of the beta-cells
in the pancreas. The complications associated with this disease can lead to severe dysfunctions of the
eye (vision impairment) and the kidney (end stage renal disease). The identification of all the factors
that are involved in the pathogenesis of these complications is essential, because this will help the
discovery of patients with an increased risk to these complications.
In this study we have explored the possible association between the HLA-DQ genotype and the
diabetic microvascular complications, i.e. diabetic retinopathy and diabetic nephropathy. In order to
accomplish our objective we have performed a nonrandomized, retrospective study in Ghent, Belgium
in the year 2012 whereby we have analyzed the data of 40 patients. We have evaluated the HLA-DQ
types in our patient population but we have also included other parameters like the disease duration,
the age at the time of diagnosis, the smoking habits, the blood pressure status, the gender, the
pancreatic autoantibodies, the creatinin level, the albuminuria level and the creatinuria.
After an extensive analysis we were not able to discover an association between diabetic retinopathy
and diabetic nephropathy with the HLA-DQ genotypes. However, we have observed a tendency to a
higher prevalence of the high risk HLA-DQ genotypes in patients with diabetic microvascular
complications. Although it was not our primary objective, we did find a possible link between diabetic
retinopathy and the disease duration (p=0.003) and between diabetic nephropathy and the GADA
levels at the time of diagnosis (p=0.021). The association between the GADA level and diabetic
nephropathy has not been studied thoroughly and could be a new subject of interest thanks to the
association found in this study.
In conclusion, additional studies are needed to unravel the possible involvement of the HLA-DQ type
in the pathogenesis of diabetic microvascular complications. A comprehensive view on the
pathogenesis of diabetic microvascular complications in the near future would be beneficial for the
screening and prevention of these microvascular complications of type 1 diabetes mellitus.
2
II. INTRODUCTION
II.1 Type 1 diabetes mellitus
II.1.1 Definition
Type 1 diabetes mellitus (T1DM) is a multisystem disease characterized by a lack of insulin. As a
consequence the disease is inevitably followed by too high glycemic levels in the blood. The decrease
in insulin is caused by a gradual autoimmune destruction of the insulin producing beta-cells in the
pancreas. The pathogenesis of T1DM will be further explored in section II.1.3. T1DM is sometimes
called juvenile diabetes mellitus because most patients are children or adolescents at the time of
diagnosis (1).
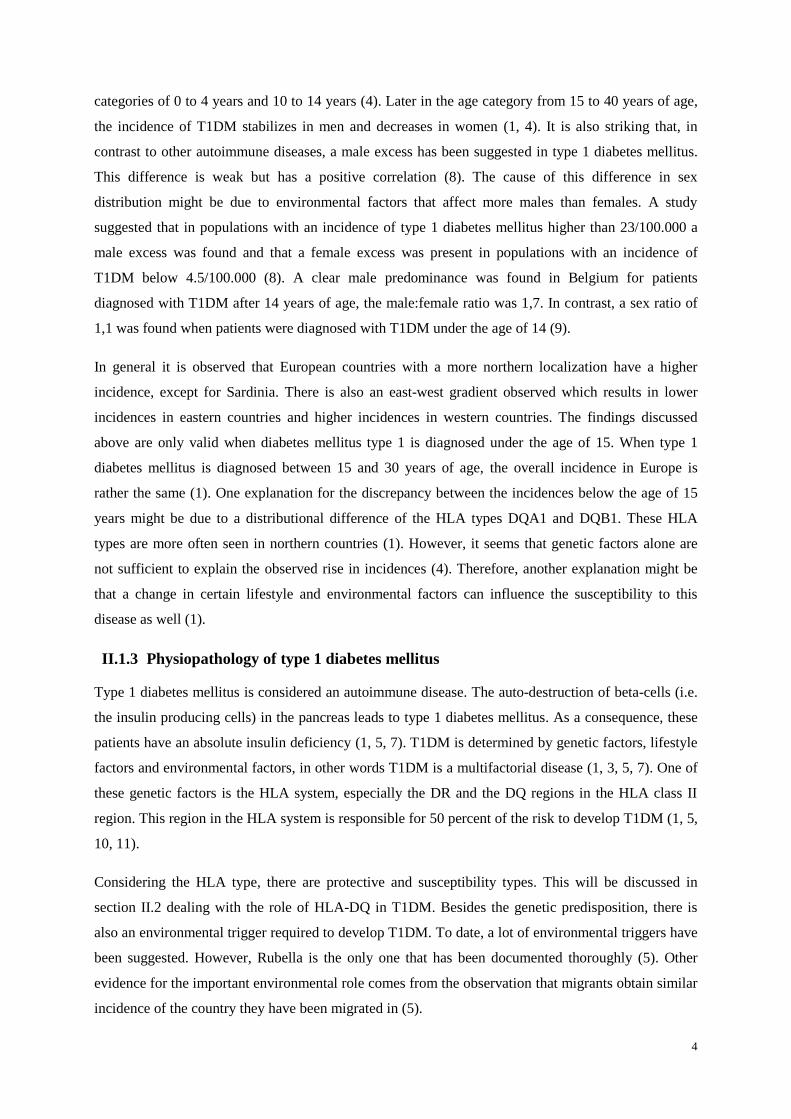
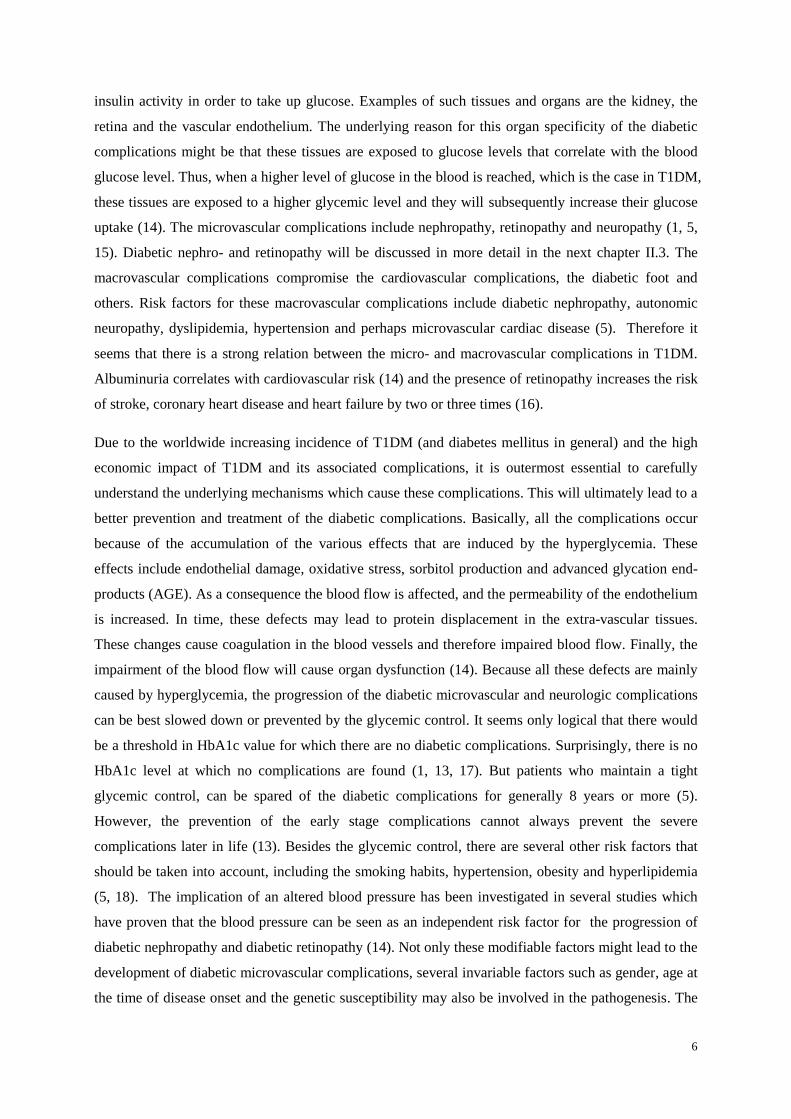
The diagnosis of type 1 diabetes mellitus is made when the blood glucose levels exceed normal values
and by the presence or absence of symptoms (figure I). Undiagnosed T1DM is characterized by
symptoms such as polyuria, weight loss, polydipsia, glucosuria and ketonuria. Some patients develop
ketoacidosis or non-ketotic hyperosmolar state before the diagnosis is made. As we previously
mentioned, T1DM is caused by destruction of the insulin producing beta-cells in the pancreas. 90
percent of the beta-cells are destructed when T1DM becomes clinically symptomatic (2).
Figure I. Diagnostic criteria for type 1 diabetes mellitus.
The three possible ways to diagnose T1DM are given in order of preference. According to the WHO, the oral
glucose tolerance test or OGTT measures the glucose load containing the equivalent of 75 g anhydrous glucose
dissolved in water or 1,75 g/kg of body weight to a maximum of 75 g. (adapted from (2)).
The diagnosis of T1DM has a huge impact on the patient’s life. It is a chronic disease and as a
consequence the patient has to inject insulin for a lifetime to maintain the proper level of glucose in
the blood stream. Besides the burden of the disease itself, T1DM is characterized by its inevitable
complications caused by changes in the glycemic level and by alterations in the fat and protein
metabolism. The associated complications can be divided into macrovascular and microvascular
complications and will be further explored in the sections II.1.4 and II.3.
Diagnostic criteria for
T1DM
Symptoms of diabetes + glucose concentration in plasma equals or exceeds 11.1 mmol/L (or 200 mg/dl) at any time
Glucose concentration in plasma ≥ 7.0 mmol/L (126 mg/dl) after fasting (no caloric intake for at least 8 hours)
2 hours postprandial glucose concentration ≥ 11.1 mmol/L (or 200 mg/dl) during an oral glucose tolerance test (OGTT)

3
Diabetes mellitus is not only a heavy burden for the patients but also for society. This economic
burden can be illustrated by an international cost estimate which points out that diabetes mellitus uses
up to 10 percent of the medicinal care in Belgium. Patients who are insulin dependent (all patients
with T1DM and some patients with T2DM) used up to 4 percent of the disease insurance in 2003
(numbers of IMA). The refund of insulin syringes in 2003 went up to 195 012 Euros in Belgium.
(minister of Public Health, May 2003).
II.1.2 Incidence and prevalence of type 1 diabetes mellitus
The risk in the Western world to develop diabetes mellitus is 10 percent. In 2010 more than 200
million people had diabetes mellitus. Concerning diabetes mellitus, the most important subcategories
of the disease are type 1 and type 2 diabetes mellitus. The underlying difference between these
subcategories is that in T1DM autoantibodies against the beta-cell antigens are responsible for the
development of T1DM (1). T1DM represents 10 to 15 percent of all the diabetic patients. The
prevalence is 0,4 percent and the most common form of diabetes in Caucasian adults (3). This
subcategory of diabetes mellitus starts at a relatively young age, for instance 50 to 60 percent of the
patients are diagnosed with T1DM at 16 to 18 years of age (1). The incidence of T1DM increases with
2 to 5 percent each year (4-6). Together with the annual increasing incidence, there is the alarming
issue that nowadays more young patients are getting diagnosed with type 1 diabetes mellitus. The
explanation for this trend probably lies in environmental factors combined with a strong increased
Body Mass Index (BMI) worldwide (5).
A notable observation is that the countries with the lowest incidence have the highest increase in
incidence. Although not all studies confirm these findings, it seems that countries that previously had a
high incidence have reached a plateau phase (5). These authors further suggest that countries with a
low to very low incidence show a decrease in incidence (countries such as Cuba, West Indies, and
Central America). However it appears that the incidence in countries with a high incidence keeps on
rising (4). Intriguingly, the incidence of T1DM varies demographically, for example from
0,57/100.000 in China to 48-49/100.000 in Finland (1, 4, 5). The incidence in Antwerp, Belgium is
12/100.000 (1). One possible explanation for this difference in incidence might be attributed due to a
difference in the HLA (human leukocyte antigen) distribution which correlates with a higher risk to
the development of T1DM (3). The role of the HLA system in T1DM will be further discussed in
section II.2 of the introduction.
In certain countries, including Belgium, the incidence of T1DM has been increasing below the age of
5 (1, 7), while it has been decreasing between the ages of 15 and 30 (1). Besides the varying
incidences of T1DM between the different age groups, it has also been shown that the incidence can
differ between the sexes in the various age groups despite an equal incidence in general. Females show
an increase in incidence between the ages of 0 to 9 whereas men show an increase in the age
4
categories of 0 to 4 years and 10 to 14 years (4). Later in the age category from 15 to 40 years of age,
the incidence of T1DM stabilizes in men and decreases in women (1, 4). It is also striking that, in
contrast to other autoimmune diseases, a male excess has been suggested in type 1 diabetes mellitus.
This difference is weak but has a positive correlation (8). The cause of this difference in sex
distribution might be due to environmental factors that affect more males than females. A study
suggested that in populations with an incidence of type 1 diabetes mellitus higher than 23/100.000 a
male excess was found and that a female excess was present in populations with an incidence of
T1DM below 4.5/100.000 (8). A clear male predominance was found in Belgium for patients
diagnosed with T1DM after 14 years of age, the male:female ratio was 1,7. In contrast, a sex ratio of
1,1 was found when patients were diagnosed with T1DM under the age of 14 (9).
In general it is observed that European countries with a more northern localization have a higher
incidence, except for Sardinia. There is also an east-west gradient observed which results in lower
incidences in eastern countries and higher incidences in western countries. The findings discussed
above are only valid when diabetes mellitus type 1 is diagnosed under the age of 15. When type 1
diabetes mellitus is diagnosed between 15 and 30 years of age, the overall incidence in Europe is
rather the same (1). One explanation for the discrepancy between the incidences below the age of 15
years might be due to a distributional difference of the HLA types DQA1 and DQB1. These HLA
types are more often seen in northern countries (1). However, it seems that genetic factors alone are
not sufficient to explain the observed rise in incidences (4). Therefore, another explanation might be
that a change in certain lifestyle and environmental factors can influence the susceptibility to this
disease as well (1).
II.1.3 Physiopathology of type 1 diabetes mellitus
Type 1 diabetes mellitus is considered an autoimmune disease. The auto-destruction of beta-cells (i.e.
the insulin producing cells) in the pancreas leads to type 1 diabetes mellitus. As a consequence, these
patients have an absolute insulin deficiency (1, 5, 7). T1DM is determined by genetic factors, lifestyle
factors and environmental factors, in other words T1DM is a multifactorial disease (1, 3, 5, 7). One of
these genetic factors is the HLA system, especially the DR and the DQ regions in the HLA class II
region. This region in the HLA system is responsible for 50 percent of the risk to develop T1DM (1, 5,
10, 11).
Considering the HLA type, there are protective and susceptibility types. This will be discussed in
section II.2 dealing with the role of HLA-DQ in T1DM. Besides the genetic predisposition, there is
also an environmental trigger required to develop T1DM. To date, a lot of environmental triggers have
been suggested. However, Rubella is the only one that has been documented thoroughly (5). Other
evidence for the important environmental role comes from the observation that migrants obtain similar
incidence of the country they have been migrated in (5).
5
The destruction of the beta cells is T-cell mediated, nevertheless there is a humoral factor (antibodies
against the beta cell antigens) (5, 7). Often several antibodies against insulin are found: insulin
autoantibodies (IAA), glutamic acid decarboxylase autoantibodies (GADA), tyrosine phosphatase IA2
antibodies (IA2A) and islet antibodies (ICA) (5, 10). These antibodies can be present at the time of
diagnosis of T1DM, and in some cases even precede the disease (5, 10, 11). 98 percent of the patients
with T1DM have at least one autoantibody present and 75 percent of the patients have 2
autoantibodies at the time of diagnosis (10). The autoantibodies are useful but insufficient in the
detection of T1DM (12), because the presence of one autoantibody consists only with a small increase
in risk for developing T1DM. The risk is significantly higher when more autoantibodies are present,
the risk rises incrementally for each extra autoantibody whereby IA2A has the highest risk (12). A
faster disease progression rate has been correlated with the number of autoantibodies (5) and with the
time at which the autoantibodies are present. The sooner these autoantibodies are present, the faster the
progression rate will be (12). Nowadays it is possible for patients that have siblings or parents with
T1DM, and therefore an increased risk to develop T1DM, to determine the risk of the development of
T1DM. In order to perform this risk analysis, they will first determine the genetic risk. If this risk is
significantly higher than in the rest of the population, they will determine the autoantibodies (IA2,
GADA, IAA, and ICA). If the subject has an increased genetic risk and autoantibodies are present, the
residual beta-cell function will be determined. This can be done by the use of the oral glucose
tolerance test (12).
The age at the time of diagnosis is an important factor considering the various complications
associated with the disease. The younger the patients are, the sooner they are exposed to
hyperglycemia (1). This is an important co-factor for the development of T1DM besides the presence
of the previous discussed autoantibodies. It has been suggested that the older the patient is at the time
of diagnosis, the lower the prevalence of the autoantibodies like IAA, ICA and IA2A are. Another
finding in these patients is that they often have lower risk HLA types. Despite this finding it has been
suggested that the GADA and the residual C-peptide levels reach a higher concentration in these
patients (1).
II.1.4 Complications of type 1 diabetes mellitus
In the previous section ‘incidence and prevalence of T1DM’ it was mentioned that the prevalence of
T1DM increases. A significant number of the world population has T1DM and this number will only
increase in time. Not only the disease itself but also the complications of the disease and the
susceptibility to other diseases make T1DM an important disease to take into account.
There are two types of complications associated with the disease, namely the macro- and
microvascular complications (1, 5, 13). Considering the diabetic complications it is crucial to realize
that the microvascular complications affect most the organ systems which are independent of the
6
insulin activity in order to take up glucose. Examples of such tissues and organs are the kidney, the
retina and the vascular endothelium. The underlying reason for this organ specificity of the diabetic
complications might be that these tissues are exposed to glucose levels that correlate with the blood
glucose level. Thus, when a higher level of glucose in the blood is reached, which is the case in T1DM,
these tissues are exposed to a higher glycemic level and they will subsequently increase their glucose
uptake (14). The microvascular complications include nephropathy, retinopathy and neuropathy (1, 5,
15). Diabetic nephro- and retinopathy will be discussed in more detail in the next chapter II.3. The
macrovascular complications compromise the cardiovascular complications, the diabetic foot and
others. Risk factors for these macrovascular complications include diabetic nephropathy, autonomic
neuropathy, dyslipidemia, hypertension and perhaps microvascular cardiac disease (5). Therefore it
seems that there is a strong relation between the micro- and macrovascular complications in T1DM.
Albuminuria correlates with cardiovascular risk (14) and the presence of retinopathy increases the risk
of stroke, coronary heart disease and heart failure by two or three times (16).
Due to the worldwide increasing incidence of T1DM (and diabetes mellitus in general) and the high
economic impact of T1DM and its associated complications, it is outermost essential to carefully
understand the underlying mechanisms which cause these complications. This will ultimately lead to a
better prevention and treatment of the diabetic complications. Basically, all the complications occur
because of the accumulation of the various effects that are induced by the hyperglycemia. These
effects include endothelial damage, oxidative stress, sorbitol production and advanced glycation end-
products (AGE). As a consequence the blood flow is affected, and the permeability of the endothelium
is increased. In time, these defects may lead to protein displacement in the extra-vascular tissues.
These changes cause coagulation in the blood vessels and therefore impaired blood flow. Finally, the
impairment of the blood flow will cause organ dysfunction (14). Because all these defects are mainly
caused by hyperglycemia, the progression of the diabetic microvascular and neurologic complications
can be best slowed down or prevented by the glycemic control. It seems only logical that there would
be a threshold in HbA1c value for which there are no diabetic complications. Surprisingly, there is no
HbA1c level at which no complications are found (1, 13, 17). But patients who maintain a tight
glycemic control, can be spared of the diabetic complications for generally 8 years or more (5).
However, the prevention of the early stage complications cannot always prevent the severe
complications later in life (13). Besides the glycemic control, there are several other risk factors that
should be taken into account, including the smoking habits, hypertension, obesity and hyperlipidemia
(5, 18). The implication of an altered blood pressure has been investigated in several studies which
have proven that the blood pressure can be seen as an independent risk factor for the progression of
diabetic nephropathy and diabetic retinopathy (14). Not only these modifiable factors might lead to the
development of diabetic microvascular complications, several invariable factors such as gender, age at
the time of disease onset and the genetic susceptibility may also be involved in the pathogenesis. The
7
role of the genetic susceptibility, in particular the role of the HLA system in the development of
microvascular complications, will be explored in detail in this thesis. The role of the sex in the
development of microvascular complications seems to be disputable. As an example we will address
the gender distribution in diabetic nephropathy that is extensively studied, but it appears that there is
no consensus on its involvement. For instance, certain studies did not find a linkage between gender
and diabetic nephropathy (19, 20) while Jacobsen et al., 1999 has found a linkage between diabetic
nephropathy and the male gender (21). It has been stated that the female gender is less prone to the
progression of the microvascular disease, especially diabetic nephropathy, when compared to the male
gender (22). Another study suggested that diabetic nephropathy was more prevalent in males
diagnosed with type 1 diabetes mellitus between the ages of 20 to 34 years (23). Surprisingly, Orchard
and coworkers have observed that overt nephropathy (and proliferative diabetic retinopathy) was
slightly more prevalent in females when short disease duration was considered (24). However, they
have found a male excess in microvascular complications over a longer period of time.
Microvascular complications are rarely seen in patients before they reach puberty. It has been
suggested that the complications mostly occur during or after puberty. A possible explanation for this
finding might be that certain triggers for the diabetic complications occur during puberty. The
suggested triggers are endocrine or metabolic dependent factors (17). Because of the role of puberty in
the development of diabetic complications we have only studied patients with a disease duration of at
least 10 years.
Finally, patients with type 1 diabetes mellitus are more susceptible to other autoimmune diseases
compared to the rest of the population. These autoimmune diseases include hyperthyroidia (5 percent
of the patients with T1DM) and celiac disease (3 to 10 percent of the patients with T1DM) (5).
II.2 The role of Human Leukocyte Antigen (HLA) in T1DM
It the previous section we have mentioned that T1DM is a multifactorial disease, which is partially
genetically determined. The genetic susceptibility of T1DM is considered to be complex and
multigenetic (11, 25). The genetic determination can be illustrated by the fact that T1DM clusters in
families. Familial aggregation is responsible for the development of T1DM in 10 percent of the
patients (2). However, it stays remarkable that there is no defined pattern of inheritance. Without the
presence of any family relative carrying the disease the prevalence is only 0,4 percent (3), while the
risk rises to 3 percent when mothers are affected, to 5 percent when fathers are affected and even to 8
percent if a sibling is affected. Remarkably, the risk of developing T1DM increases further to 25
percent if the affected family member has the same genotype (12).
The discovered genes that can play a role in the development of T1DM are (1) the Human Leukocyte
Antigen gene system (HLA), (2) the multiple polymorphisms in the promoter region of the insulin
8
gene leading to differences in the insulin expression levels, (3) the PTPN22 gene that encodes for an
essential protein which negatively regulates the immune response (this gene has major association
with the DR and DQ alleles) and (4) the IL2RA gene. All these loci and genes have an odds ratio
greater than 1.5 which is a strong indication that they are associated with the disease (12, 25). Because
the study in this thesis only deals with the role of the HLA-DQ region in diabetic retinopathy and
nephropathy, we focus in this section solely on the HLA function and explore its implication in Type 1
diabetes mellitus.
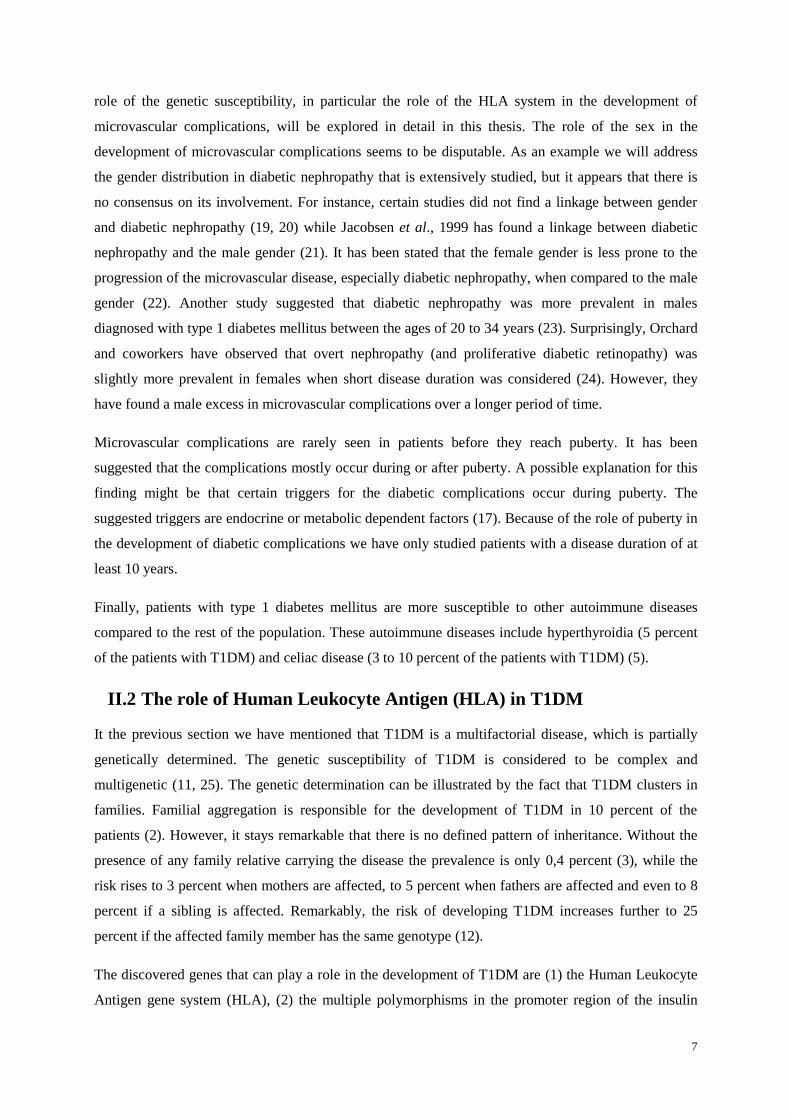
In humans, the HLA system is known as the Major Histocompatibility Complex (MHC). The HLA
region accords for 0,1 percent of the human genome and is localized on chromosome 6 (more specific
6p21.3) (3) (figure II). The HLA system contains the greatest amount of polymorphisms in the human
genome (3, 25). The system plays an important role in T-cell selection, antigen presentation and in the
immune response (12). The implication of some of these genes in cellular immunity is clearly shown
by the expression of antigen-presenting proteins on the cell surface. Antigen presenting cells like
dendritic cells, B-cells and macrophages engulf or harbor protein bodies such as viral proteins or
native proteins. These engulfed proteins are broken down into peptides and are loaded onto the HLA
structures. By doing so, the T-cells can recognize the specific peptides of the corresponding proteins
which ultimately lead to the destruction of the antigen presenting cells (26).
There are three types of HLA’s: HLA class I, HLA class II and HLA class III. HLA class I and HLA
class II play a role in the immunogenic recognition (3, 25). A good example that proves the
importance of this immunological recognition is the graft rejection that might occur after organ
transplantation.
The HLA class I consists out of the classical loci (A, B, C), the non-classical loci (E, F, G) and the
pseudogenes (H, J, K, L) (figure II). In the HLA class I genetic region we also find the MIC genes
(MHC Class I Chain Related genes) with two functional genes (A, B) and three pseudogenes (C, D, E).
The MIC-A is a transmembrane glycoprotein that is expressed on the intestinal epithelium when the
cells are exposed to cellular stress. Once the MIC-A protein is exposed, the protein can be recognized
by the TCRs (T-cell receptors) and by the NK cells (natural killer cells) (3).
There are three main loci (DR, DQ, and DP) in the HLA class II region. Each locus has several alpha-
A genes, beta-B genes and pseudogenes (figure II).
Finally, the HLA class III genes play more a role in other immunologic reactions and implicate the
proteins like Hsp70, TNF-α, TNF-β and others (3).

9
Figure II. Structural overview of the HLA region.
The HLA region is situated in locus 21.3 which is located on the short arm of chromosome 6. We can categorize
the HLA region into 3 classes of genotypes: class I, class II and class III. A detailed magnification of the genetic
region is only given for class I and class II. Class I consists out of the classical loci A, B, C and the non-classical
loci E, F G. In this same genetic region we also find the MIC genes. There are three main loci in the HLA class
II region, namely DR, DQ and DP. Each locus has several alpha-A genes, beta-B genes and pseudogenes
(Adapted from (3)).
Now, the role of the HLA system in the pathogenesis of type 1 diabetes mellitus will be further
explored. As we already described earlier, it has been suggested that the HLA system accords for 50
percent of the genetic risk (27). The risk in siblings can vary from 0.3 percent to 30 percent depending
on the HLA type (12). It is important to realize that the concordance rate for developing T1DM is 50
percent in identical twins, and only 15 percent in HLA identical siblings (27). This illustrates an
important role for environmental factors, which is typical for a multifactorial disease.
The DR-DQ genotype on the HLA class II region (determined by the HLA-DR3/4 alleles) is an
essential determinant for the negative or positive association with T1DM (protective or susceptible
respectively) (see table I). The loci associated with T1DM are the DRB1, the DQA1 and the DQB1
locus (28). It has been reported that combinations of the DR-B1 locus with the DQ-B1 locus are more
important in the determination of the risk than DR or DQ alone (3, 25, 27, 28). A good example for
this observation was given in a study performed by Erlich et al. which showed that the odds ratio of
the DRB1*0401-DQA1*0301-DQB1*0302 type was 8,39 while the odds ratio of the DRB1*0401-
DQA1*0301-DQB1*0301 type was 0,35 (28). Although combinations are considered to be more
important, other studies have been able to show that the DQB1 locus is the most significant factor in
the risk estimation for the high and the low risk HLA genotypes (3, 25). Therefore, the HLA-
DQB1*0302 cell surface receptor is now recognized as the major susceptibility gene for type 1

10
diabetes mellitus. Besides this gene alone, the combination of this gene with DQA1*0301 on the DR4
gene and the combination of this gene with DQA1*0501 on DR3 gene can synergistically increase the
risk of developing type 1 diabetes mellitus (3). Noble et al. (2012) investigated the increased risk in
heterozygotes for the DRB1*03:01-DQA1*05:01-DQB1*02:01/DRB1*04:xx-DQA1*03:01-
DQB1*03:02 genotype and found that the risk of this combination was greater than the risk for
homozygotes of either haplotype (25). Therefore, it can be stated that the DR and the DP genes
modify the risk of the HLA-DQ type to type 1 diabetes mellitus (3, 27).
Table I. The HLA class II susceptible, neutral (or rare) and protective genotypes for T1DM.
In this figure the different haplotypes are showed that play a role in the susceptibility or protection of the
development of Type 1 diabetes mellitus. The table was put together by the use of the data of the doctoral thesis
of Weets I. (29) and an article of the author Van Der Auwera, B. J., 2002 (30). X stands for the protective
haplotypes 01-0503/0601 or 01-0503/0602/0603 or 0201-0201 or 0201-0303 or 0501-0301 and Y stands for the
neutral or rare haplotypes 01-0501/0604/0605 or 0102-0201 or 0102-0502 or 0301-0201 or 0301-0301 or 0301-
0303 or 0301-0401 or 0401-0402 or 0501-0302.
The HLA-DP types are encoded by the DP-A1 and the DP-B1 genes whereby the DP-B1 gene shows
the most variation. These variations can also contribute to the risk to developing T1DM but this effect
is not as strong compared to the DR and DQ genes (25). The alleles on loci A and B influence the
susceptibility to T1DM. These alleles affect this susceptibility independently from the Class II alleles.
The role of the HLA system in the genetic risk of T1DM can be illustrated by the fact that 74 percent
of the Caucasian patients with type 1 diabetes mellitus have the genotype DQA1*0301-DQB1*0302
and 52 percent has DQA1*0501-DQB1*0201(3). Another example of the difference in HLA-DQ
distribution is that 29 percent of the Belgian patients with T1DM have the susceptible DQA3-
DQB3.2/DQA4-DQB2 genotype while only 1,9 percent of a Belgian reference population has this
genotype (30).
Risk to T1DM Genotypes
Susceptible 0301-0302/0501-0201
0301-0302/0301-0302
0501-0201/0501-0201
0301-0302/Y
Neutral or rare 0501-0201/Y
0301-0302/X
Y/Y
Protective 0501-0201/X
X/Y
X/X
11
It is important to get insight on the underlying mechanism of the disease, therefore we here describe
the molecular basis for the genetic predisposition to T1DM. In other words, we will describe how the
HLA type influences the pathogenesis of T1DM on a molecular level. As we mentioned before, the
HLA system plays a role in the T-cell mediated selection. One of the properties of the T-cell selection
is to have tolerance to self-antigens. Tolerance to self antigens is established in two steps. The first
step is called the central-thymic tolerance. It is established by the destruction of T-cells that bind with
high affinity to the HLA-peptide complex which is exposed on antigen presenting cells. The second
step is the post-thymic tolerance. The second step consists out of 5 mechanisms. The detailed
explanation of these mechanisms fall out of the scope of this study.
The HLA system also plays a role in antigen presentation, whereby antigens are presented by B-cells
and others. Tolerance to self antigens is established in two steps, like in the selection of T-cells. This
tolerance takes place in the bone marrow and peripheral lymphoid organs. In the bone marrow the B-
cells that bind with their IgG’s to the HLA antigens, are consequentially negatively selected to prevent
auto-antigen recognition. There is a possible role for HLA-DO, the absence of this gene might lead to
a generalized immune activation (3).
The formulation of several hypotheses on the genetic susceptibility to T1DM is based on the role of
the HLA molecules in the T-cell recognition process, whereby one possibility is that the HLA-
DQB1*0302 genotype prevents a good communication between the T-cells and the T-cell recognition
cells. Therefore potentially auto-reactive T-cells do not go into apoptosis. These T-cells multiply in the
peripheral system and make the patient prone to T1DM. A certain trigger can lead to the activation of
these auto-reactive T-cells (3).
Another possible hypothesis is based on the structure of the HLA-DQ molecules. The HLA molecules
bind anti-genetic peptides with a groove on the surface. The interaction between the HLA proteins and
the anti-genetic peptides is determined by four contact points. Certain HLA-DQ types (such as HLA-
DQ3.2, HLA-DQ2.1) have different amino acids in these binding pockets that might lead to
insufficient stability of the peptide binding. This possibly results in an insufficient negative selection
of T-cells. In contrast, the protective genotypes (such as HLA-DQ6.2) bind with a higher affinity to
the anti-genetic peptides. It is noteworthy that HLA-DQ3.2 is an unstable Class II dimer which in turn
leads to an insufficient anti-genetic peptide binding (3). In conclusion, patients with the DR3/DR4
heterozygous genotype seem to have a higher genetic risk to develop T1DM. A possible explanation
for this observation is that there may be a higher number of auto-reactive T-cells (3).
However, it remains unlikely that only one self-peptide antigen is responsible for triggering the
disease. Therefore suggestions have been made for the implication of several other genes in the
pathogenesis of type 1 diabetes mellitus. These genes include the MIC-A gene and the HLA-A, HLA-
B, HLA-C gene on the class I region. (3, 6). furthermore, it has been suggested that the HLA-A gene

12
increases the risk to the development of T1DM independently of the HLA class II region (6). TNF-α
and TNF-β on the class III locus may also play a role in the development of T1DM (3). Another
problem with the theory considering the role of the HLA system in the development of T1DM is that
this theory does not give an explanation for the specificity of the T-cells to the pancreatic organ. As a
result it can be stated that the underlying mechanisms of the development of T1DM are not yet fully
unraveled.
In the previous section we have described that the HLA system contributes for 50 percent of the
inherited disease risk. An interesting question that arises from this observation is of what possible
genes the other 50 percent consists. As we have described earlier, several genes have been proposed to
play part in the inheritance of T1DM. These genes include the insulin gene, the PTPN22 gene, the
IL2RA gene and the CTLA4 gene (11, 12, 25). However, the role of some of these suggested genes in
the development of T1DM still needs to be confirmed. In this study we will not discuss these genes
extensively because this would carry us too far, we will only consider the role of the HLA system in
the development of T1DM.
In conclusion, the association between the HLA system and the development to T1DM has been
confirmed by many studies. It is certain that the patient’s HLA genotype has an influence on the
genetic susceptibility to the development of type 1 diabetes mellitus.
13
II.3 Diabetic retinopathy and diabetic nephropathy
As we have indicated in the previous section it has been suggested that many genetic factors, including
the HLA system, play a major role in the susceptibility to the development of T1DM. However, it
remains uncertain if the type of HLA explains as well the genetic risk of the associated diabetic
microvascular complications like diabetic retinopathy and diabetic nephropathy. This hypothesis is
still highly controversial and needs to be further addressed thoroughly in the near future.
II.3.1 Diabetic retinopathy
II.3.1.1 Prevalence and incidence
Diabetic retinopathy is the leading cause of acquired blindness in the Western world (5, 16, 22, 31).
According to a study performed in the UK and in Wales, diabetic retinopathy is responsible for 5,9
percent of the causes of blindness and for 7,4 percent of the causes of partial sight (32). Diabetic
retinopathy is the third most important cause for blindness and partial sight. Only age related macula
degeneration and glaucoma are a more prevalent cause for blindness and partial sight (32). Almost all
patients with T1DM will develop a form of retinopathy after twenty years of disease (5, 15, 22). After
ten years of disease duration 35,9 percent of the patients will develop diabetic retinopathy (33). All of
the patients with T1DM and a disease duration of 20 years will have a degree of diabetic retinopathy
(31). Although many patients have severe eye complications, only a small percentage is actually blind
(22, 34). The ocular complications are observed in the retina, the lens and in a lesser extent in the
external ocular muscles (31).
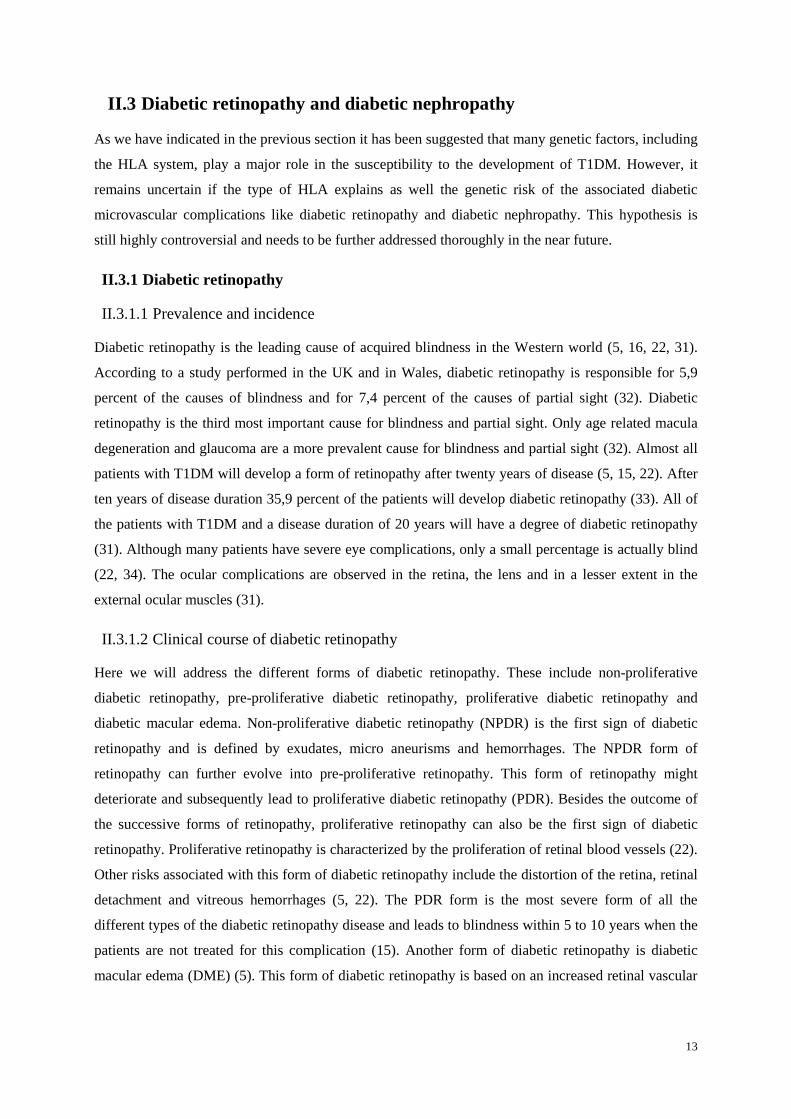
II.3.1.2 Clinical course of diabetic retinopathy
Here we will address the different forms of diabetic retinopathy. These include non-proliferative
diabetic retinopathy, pre-proliferative diabetic retinopathy, proliferative diabetic retinopathy and
diabetic macular edema. Non-proliferative diabetic retinopathy (NPDR) is the first sign of diabetic
retinopathy and is defined by exudates, micro aneurisms and hemorrhages. The NPDR form of
retinopathy can further evolve into pre-proliferative retinopathy. This form of retinopathy might
deteriorate and subsequently lead to proliferative diabetic retinopathy (PDR). Besides the outcome of
the successive forms of retinopathy, proliferative retinopathy can also be the first sign of diabetic
retinopathy. Proliferative retinopathy is characterized by the proliferation of retinal blood vessels (22).
Other risks associated with this form of diabetic retinopathy include the distortion of the retina, retinal
detachment and vitreous hemorrhages (5, 22). The PDR form is the most severe form of all the
different types of the diabetic retinopathy disease and leads to blindness within 5 to 10 years when the
patients are not treated for this complication (15). Another form of diabetic retinopathy is diabetic
macular edema (DME) (5). This form of diabetic retinopathy is based on an increased retinal vascular
14
permeability that results in the loss of the central vision ability and/or the non-perfusion of the
capillary vessels (22).
Secondly, T1DM can also influence the metabolism of the lens, this can provoke cataract disease. The
patients diagnosed with cataract will gradually loose visual acuity (31). The disease can also implicate
the iris, also known as rubeosis iridis, whereby abundant new vessels are produced in the iris. Another
cause of vision loss is diabetic neuropathy, which is characterized by temporal ptosis or diplopia
(double vision) (31).
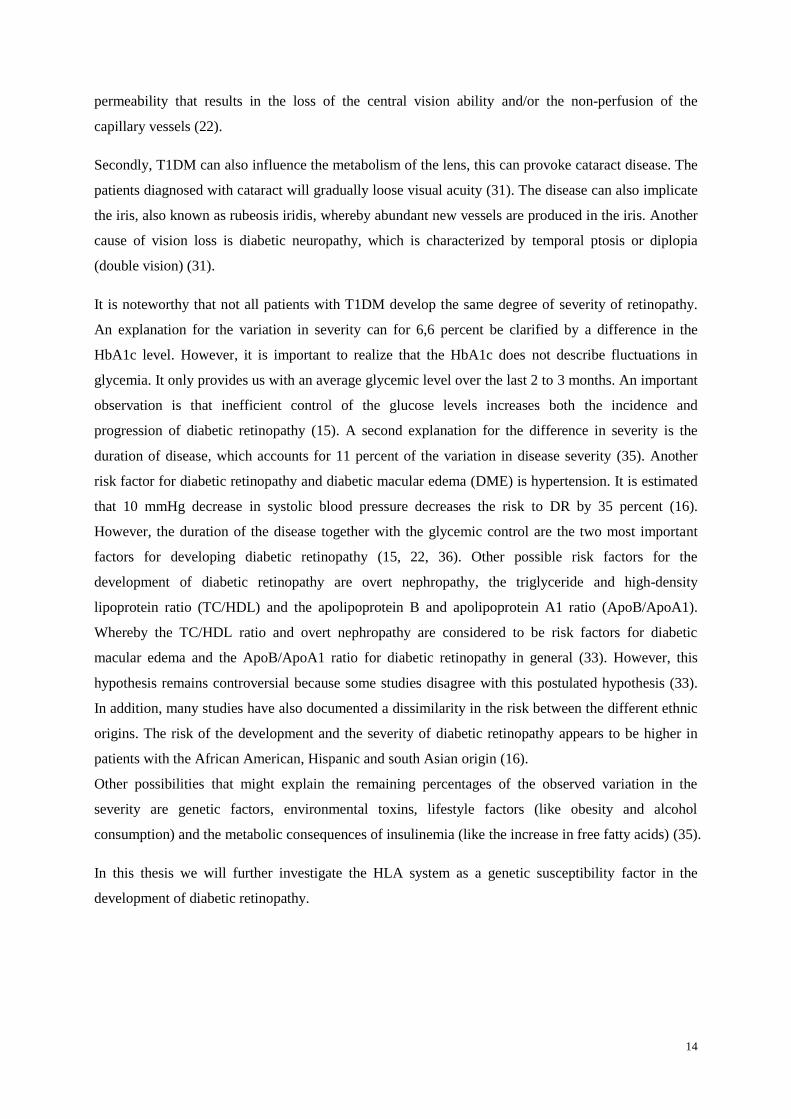
It is noteworthy that not all patients with T1DM develop the same degree of severity of retinopathy.
An explanation for the variation in severity can for 6,6 percent be clarified by a difference in the
HbA1c level. However, it is important to realize that the HbA1c does not describe fluctuations in
glycemia. It only provides us with an average glycemic level over the last 2 to 3 months. An important
observation is that inefficient control of the glucose levels increases both the incidence and
progression of diabetic retinopathy (15). A second explanation for the difference in severity is the
duration of disease, which accounts for 11 percent of the variation in disease severity (35). Another
risk factor for diabetic retinopathy and diabetic macular edema (DME) is hypertension. It is estimated
that 10 mmHg decrease in systolic blood pressure decreases the risk to DR by 35 percent (16).
However, the duration of the disease together with the glycemic control are the two most important
factors for developing diabetic retinopathy (15, 22, 36). Other possible risk factors for the
development of diabetic retinopathy are overt nephropathy, the triglyceride and high-density
lipoprotein ratio (TC/HDL) and the apolipoprotein B and apolipoprotein A1 ratio (ApoB/ApoA1).
Whereby the TC/HDL ratio and overt nephropathy are considered to be risk factors for diabetic
macular edema and the ApoB/ApoA1 ratio for diabetic retinopathy in general (33). However, this
hypothesis remains controversial because some studies disagree with this postulated hypothesis (33).
In addition, many studies have also documented a dissimilarity in the risk between the different ethnic
origins. The risk of the development and the severity of diabetic retinopathy appears to be higher in
patients with the African American, Hispanic and south Asian origin (16).
Other possibilities that might explain the remaining percentages of the observed variation in the
severity are genetic factors, environmental toxins, lifestyle factors (like obesity and alcohol
consumption) and the metabolic consequences of insulinemia (like the increase in free fatty acids) (35).
In this thesis we will further investigate the HLA system as a genetic susceptibility factor in the
development of diabetic retinopathy.
15
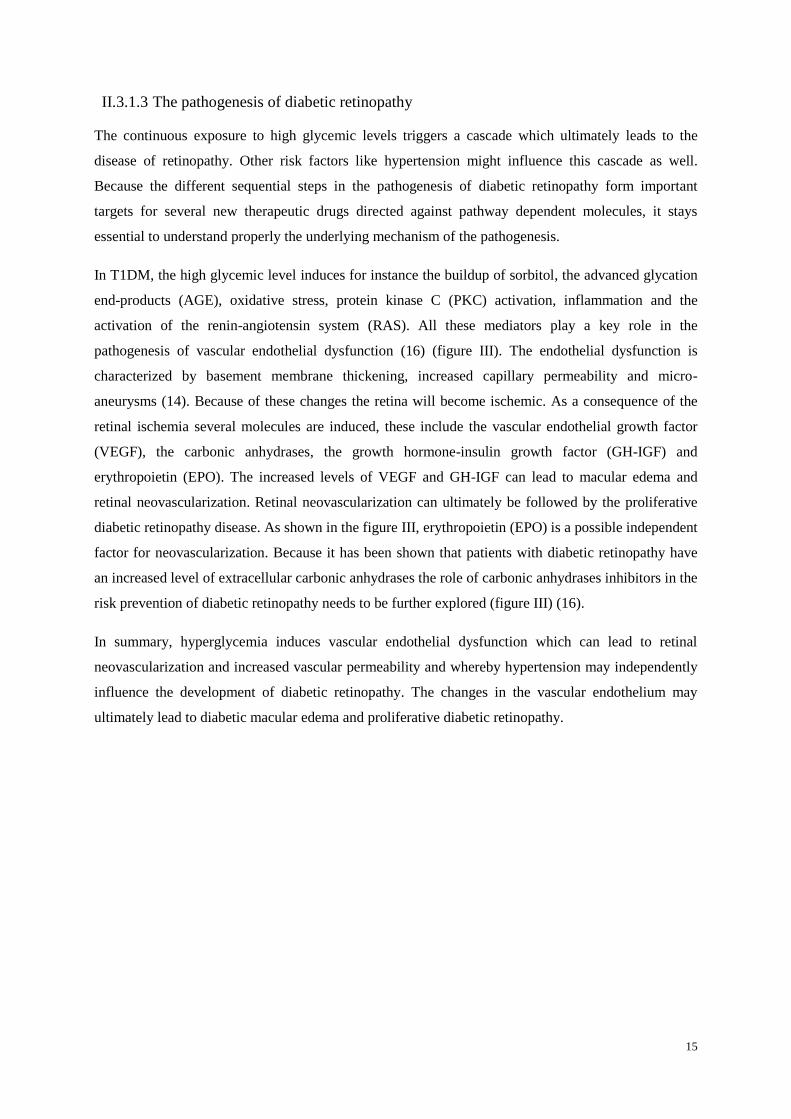
II.3.1.3 The pathogenesis of diabetic retinopathy
The continuous exposure to high glycemic levels triggers a cascade which ultimately leads to the
disease of retinopathy. Other risk factors like hypertension might influence this cascade as well.
Because the different sequential steps in the pathogenesis of diabetic retinopathy form important
targets for several new therapeutic drugs directed against pathway dependent molecules, it stays
essential to understand properly the underlying mechanism of the pathogenesis.
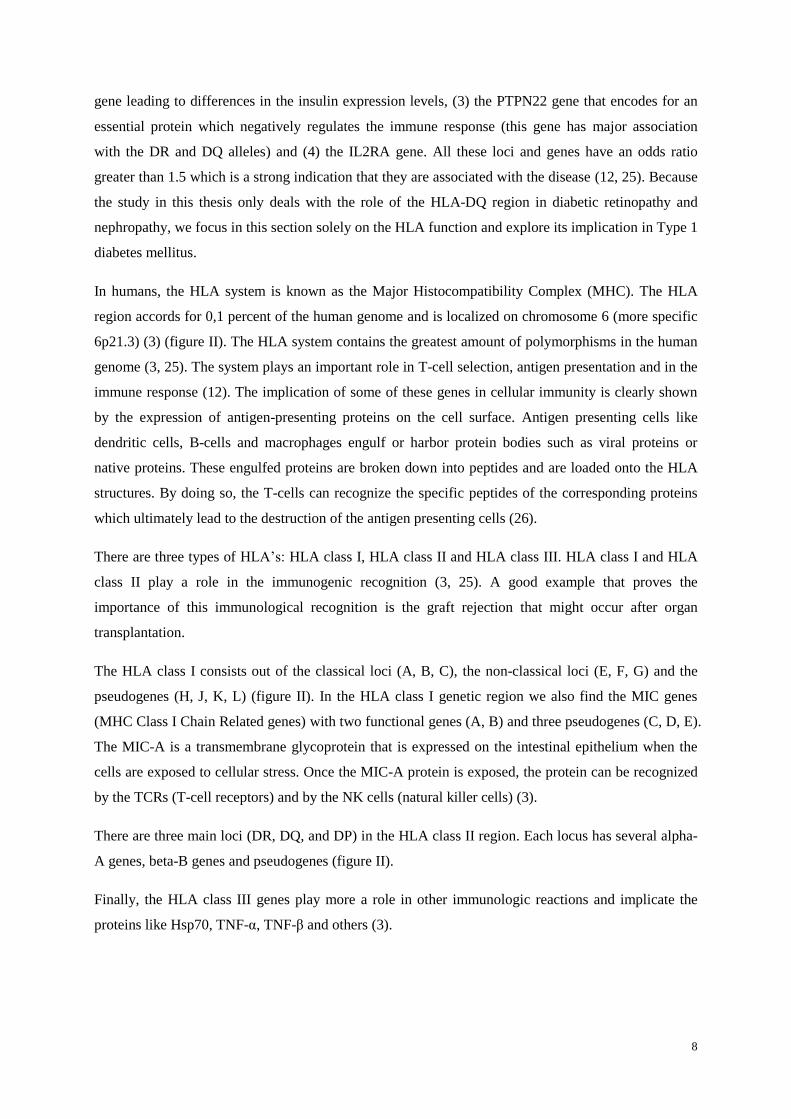
In T1DM, the high glycemic level induces for instance the buildup of sorbitol, the advanced glycation
end-products (AGE), oxidative stress, protein kinase C (PKC) activation, inflammation and the
activation of the renin-angiotensin system (RAS). All these mediators play a key role in the
pathogenesis of vascular endothelial dysfunction (16) (figure III). The endothelial dysfunction is
characterized by basement membrane thickening, increased capillary permeability and micro-
aneurysms (14). Because of these changes the retina will become ischemic. As a consequence of the
retinal ischemia several molecules are induced, these include the vascular endothelial growth factor
(VEGF), the carbonic anhydrases, the growth hormone-insulin growth factor (GH-IGF) and
erythropoietin (EPO). The increased levels of VEGF and GH-IGF can lead to macular edema and
retinal neovascularization. Retinal neovascularization can ultimately be followed by the proliferative
diabetic retinopathy disease. As shown in the figure III, erythropoietin (EPO) is a possible independent
factor for neovascularization. Because it has been shown that patients with diabetic retinopathy have
an increased level of extracellular carbonic anhydrases the role of carbonic anhydrases inhibitors in the
risk prevention of diabetic retinopathy needs to be further explored (figure III) (16).
In summary, hyperglycemia induces vascular endothelial dysfunction which can lead to retinal
neovascularization and increased vascular permeability and whereby hypertension may independently
influence the development of diabetic retinopathy. The changes in the vascular endothelium may
ultimately lead to diabetic macular edema and proliferative diabetic retinopathy.
16
Figure III. Pathophysiology of diabetic retinopathy.
Hyperglycemia initiates a cascade that leads to vascular endothelial dysfunction. This subsequently results in
retinal ischemia and increased vascular permeability, which are enhanced by hypertension. Retinal ischemia
induces several molecules that enhance the vascular permeability together with the induction of retinal
neovascularization. This respectively leads to diabetic macular edema and PDR complications. Abbreviations:
AGE, advanced glycation end-products; PKC, protein kinase C; RAS, renin-angiotensin system; CA, carbonic
anhydrase; VEGF, vascular endothelial growth factor; GH-IGF, growth hormone–insulin growth factor; EPO,
erythropoietin; PDR, proliferative diabetic retinopathy; VH, vitreous hemorrhage; RD, retinal detachment
(Adapted from (16)).
II.3.1.4 Genetic susceptibility of diabetic retinopathy
As it is according to certain studies for diabetic nephropathy, it might be possible that diabetic
retinopathy aggregates in families as well. First evidence for this suggested heritability of the disease
came from Looker et al. in 2007, which provided proof that diabetic retinopathy might cluster in
families. This study has suggested that a region on chromosome 1p might contain a possible genetic
locus for the susceptibility of diabetic retinopathy (37). Another study suggested that genes like the
insulin gene, the aldose reductase gene, the nitric oxide synthase gene, the gene for the receptor of
advanced glycation end products, the angiotensin converting enzyme gene, the vitamin-D receptor
gene and the HLA system might play a role in the susceptibility of diabetic retinopathy. However, the
role of some of these suggested genes still needs to be confirmed (36). In contrast, a study performed
in 2008 found no major loci after the execution of a genome wide screening, which is often the case
for multifactorial diseases (15). Besides the familial clustering, there are several other findings that
also contribute to the assumption of this heritability. One study confirmed an increased risk of
developing PDR in siblings of patients diagnosed with PDR as a consequence of T1DM (15). Another
17
study mentioned that the stage of DR was similar in twins with T1DM (38). Arar et al. (2008) found a
concordance in families considering the presence of DR and the type of retinal lesions (22).
These recent findings direct us to the assumption that the susceptibility of diabetic retinopathy is, as
type 1 diabetes mellitus itself, partially genetically determined.
II.3.2 Diabetic nephropathy
II.3.2.1 Prevalence and incidence
Diabetic nephropathy is another microvascular complication of type 1 diabetes mellitus and leads to
the impairment of the kidney function. 15 percent of the patients with T1DM will develop diabetic
nephropathy after 30 years of disease duration (17). Diabetic nephropathy is the most important cause
of end stage renal disease (ESDR) and occurs in 7,7 percent of the patients with type 1 diabetes
mellitus after 30 years (5). One out of three patients with severe nephropathy will develop ESDR (39).
Today, it is clear that the implication of diabetic nephropathy is very important. For instance, 40
percent of the patients undergoing dialysis are diabetics in the United States of America (22) and the
highest mortality levels are seen in patients that develop signs of nephropathy (17, 34). The overall
risk of cardiovascular disease is 37 times higher in patients with T1DM that have overt proteinuria
(40).
II.3.2.2 Clinical course of diabetic nephropathy
When the diagnosis of T1DM is made, most patients do not yet show signs of diabetic nephropathy
like microalbuminuria. Contradictory, one out of three patients has an elevated glomerular filtration
rate (GFR). The elevated filtration might be the result of an expansion of the total glomerular capillary
surface at the time of diagnosis, which is likely induced by the insulin-like-growth-factor (ILGF) (40).
Indeed, when patients at this stage were treated with insulin, the glucose levels subsequently
normalized, and the GFR was decreased within a few days to weeks (40).
Patients with T1DM whereby the glycemic level is insufficiently controlled may develop the clinical
symptom of microalbuminuria. Microalbuminuria is a protein concentration between 30 and 300 mg in
a 24 hours urine collection. The abnormal presence of protein in the urine is the result of an increased
glomerular filtration pressure (14). Microalbuminuria is observed in 2 to 20 percent of the patients
with a disease duration of 10 years, and in 30 percent of the patients with a disease duration of 20
years (17). Upon manifestation of the microalbuminuria complication it is essential to intervene by a
proper metabolic control, by the lowering of the cholesterol level and by reducing the blood pressure
in case of hypertension. It was shown that 50 percent of the adolescent patients demonstrated a
regression of the clinical manifestation of microalbuminuria after 3 to 10 years, when the previously
described risk factors of diabetic nephropathy were treated (5).
18
Besides a bad metabolic control and hypertension, there are other factors that may lead to
microalbuminuria. These possible factors include obesity, intense exercise, disease duration, heart
failure, several acute and chronic diseases (40). Because the day to day variance in microalbuminuria
is 30 to 50 percent, it appears that one measurement is not sufficient to make the symptom related
diagnosis of microalbuminuria in patients with T1DM. When microalbuminuria persists, the yearly
increase of the protein level in the urine is 20 percent. At this stage it is very crucial to carefully
control the blood pressure, because there is a direct link between the lowering of the blood pressure
and the decrease of microalbuminuria (40).
When the kidney function further deteriorates and a protein level of more than 300 mg in 24 urine
collection is found, patients are diagnosed with macroalbuminuria. If the macroalbuminuria persists,
patients can be diagnosed with diabetic nephropathy. Diabetic nephropathy is clinically defined by a
decrease in GFR, a high arterial blood pressure and persistent albuminuria (22, 40). It still remains
important to improve the metabolic control, because the normalization of the glucose level directly
results in the lowering of the progression rate of diabetic nephropathy (40). Diabetic nephropathy has
a poor prognosis, because proteinuria often correlates with vascular endothelial dysfunction together
with an increased cardiovascular risk (14).
II.3.2.3 The pathogenesis of diabetic nephropathy
Initially, it was believed that diabetic nephropathy was a chronic degenerative disease. This
assumption was refuted by Bohle et al. in 1991. They have found monocytes, macrophages, T-cells
and fibroblasts in renal biopsy specimens from 488 patients with diabetic glomerulosclerosis (41). Due
to their observation the view on the pathogenesis of diabetic nephropathy has been entirely changed.
Now it is assumed that there is a clear immunological role in the development and progression of
diabetic nephropathy.
Similar to what we have described for the risk of diabetic retinopathy complications (see section II.3.1)
hyperglycemia and hypertension are as well considered to be two important causal factors for diabetic
nephropathy (14). However, it is believed that hypertension is an independent causal factor in the
progression of diabetic nephropathy (14).
The pathology of diabetic nephropathy is identical in T1DM and T2DM, regarding the renal lesions
(42). Renal lesions include a thickening of the glomerular and tubular basement membrane, expansion
of tubule-interstitial and mesangial compartments and afferent and efferent glomerular arterial
hyalinosis. The hyalinosis of the arteries can lead to smooth muscle replacement in the small vessels
(40, 42). The presence of these lesions can initiate glomerular hyperfiltration, which can be followed
by microalbuminuria and can ultimately lead to a decrease in renal function (14, 42). The cell types
that are affected by the changes typical for diabetic nephropathy include the glomerular podocytes, the
19
mesangial and the endothelial cells, the tubular epithelium cells, the vascular endothelium cells and the
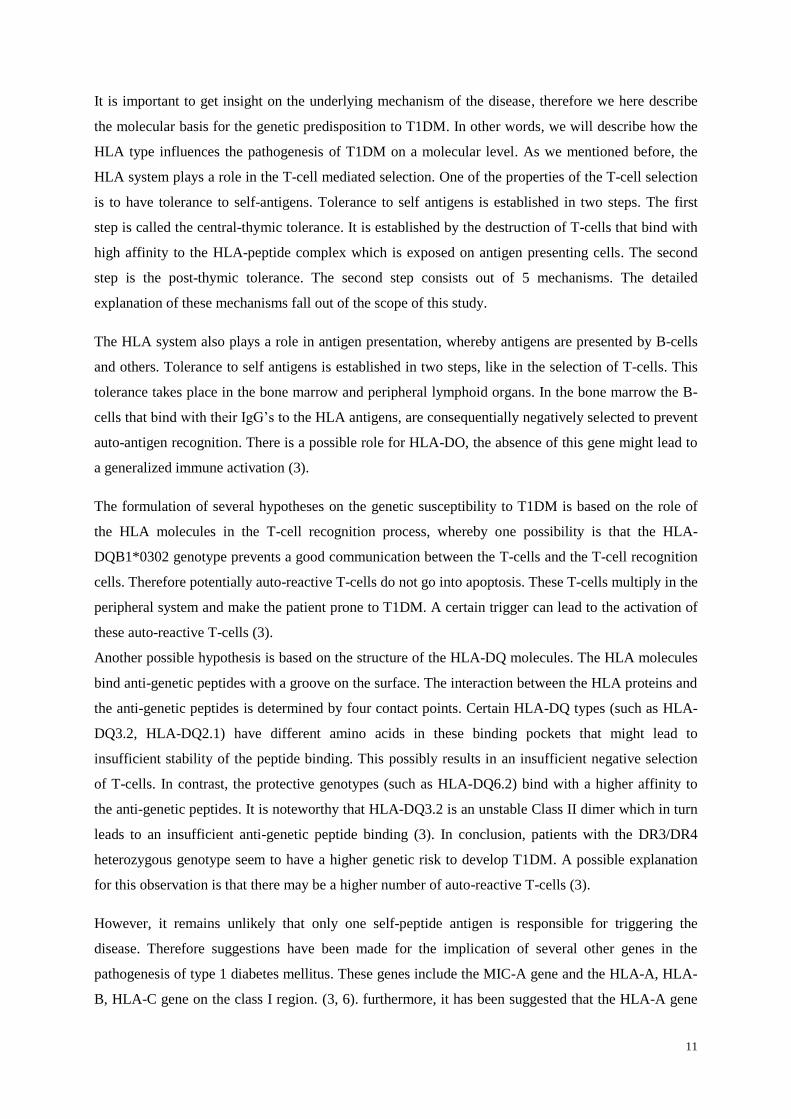
interstitial fibroblasts (42). It has been suggested that all these different cell types react to an increase
in the glucose level in the blood stream by activating the same intracellular pathway (42) (see figure
IV). This pathway triggers the increase in polyols (an alcohol containing multiple hydroxyl groups)
and hexosamines (an amino sugar), the production of advanced glycation end products (AGEs) the
activity of protein kinase C (PKC), the TGF-β-Smad-MAPK signaling pathway and the G-proteins.
This pathway also causes an altered expression of the cyclin kinases, the inhibitors of cyclin kinases,
the matrix degrading enzymes and the inhibitors of matrix degrading enzymes. The final result of the
damage caused by hyperglycemia to the kidney is increased synthesis and deposition of extracellular
matrix (ECM). It is possible that the reactive oxygen species (ROS) is a central signaling point in all
these pathways. ROS will magnify the damage initiated by the hyperglycemia and ROS might also be
responsible for activating the renin-angiotensin system (RAS). In addition, the activation of the RAS
signaling pathway will further compromise the renal function (42).
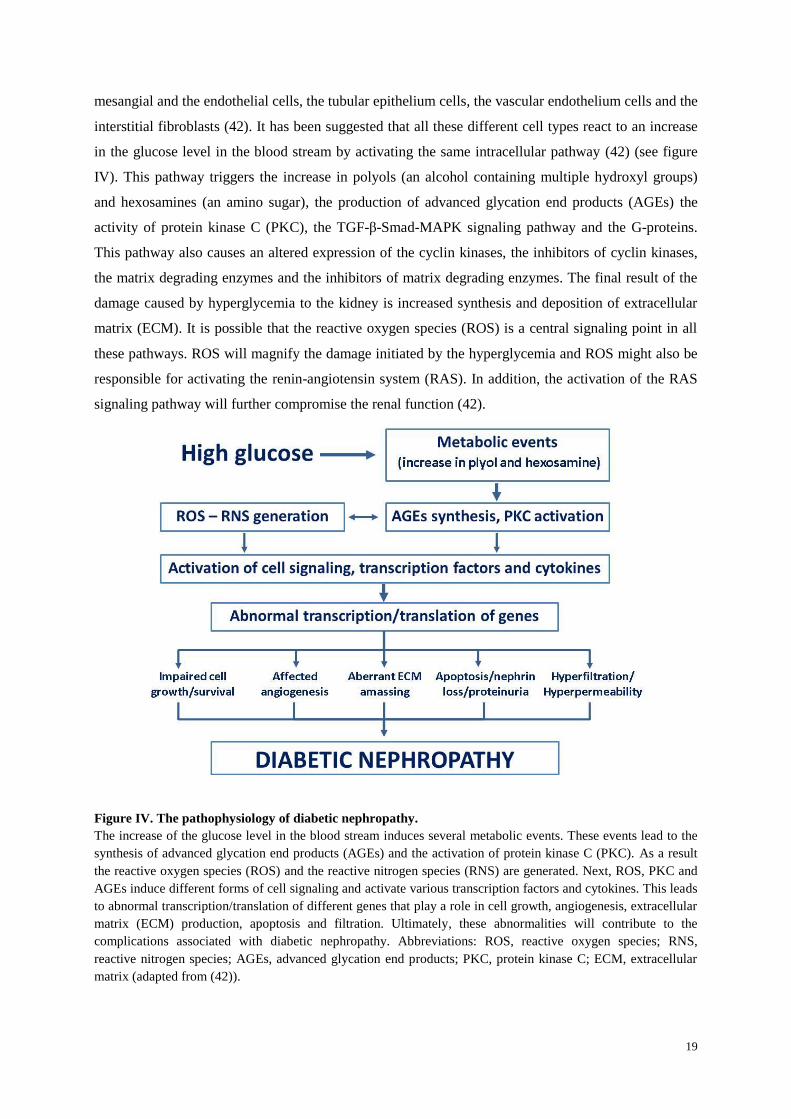
Figure IV. The pathophysiology of diabetic nephropathy.
The increase of the glucose level in the blood stream induces several metabolic events. These events lead to the
synthesis of advanced glycation end products (AGEs) and the activation of protein kinase C (PKC). As a result
the reactive oxygen species (ROS) and the reactive nitrogen species (RNS) are generated. Next, ROS, PKC and
AGEs induce different forms of cell signaling and activate various transcription factors and cytokines. This leads
to abnormal transcription/translation of different genes that play a role in cell growth, angiogenesis, extracellular
matrix (ECM) production, apoptosis and filtration. Ultimately, these abnormalities will contribute to the
complications associated with diabetic nephropathy. Abbreviations: ROS, reactive oxygen species; RNS,
reactive nitrogen species; AGEs, advanced glycation end products; PKC, protein kinase C; ECM, extracellular
matrix (adapted from (42)).
20
In summary, hyperglycemia interferes with the autoregulation of the glomerular circulation whereby
hypertension exacerbates the damage caused by hyperglycemia. Both metabolic (the activation of
intracellular pathways) and hemodynamic (activation of the RAS system) changes induce diabetic
nephropathy (42).
II.3.2.4 Genetic susceptibility of diabetic nephropathy
Several strong suggestions have been proposed, which assume that there is a possible role for genetic
factors in the susceptibility of diabetic nephropathy (22, 43). These suggestions arose from the
observation that end stage renal disease (ESDR), albuminuria and chronic kidney disease aggregate in
families. This aggregation can be explained by genetic factors and/or environmental factors (43). To
date, genome wide scans in order to research the susceptibility to diabetic nephropathy in type 1
diabetes mellitus have been performed (43-45). These scans suggested the presence of susceptibility
genes for diabetic nephropathy on chromosomal regions like 3q, chromosome 7 and chromosome 20.
The genes on the chromosomal 3q region include the glucose transporter gene, the kininogen gene and
the adiponectin gene. Polymorphisms in theses susceptibility genes might be responsible for the
susceptibility to T1DM (43). The implication of the adiponectin gene (or ADIPOQ) was confirmed by
another study. Adiponectin is a hormone that plays a role in the glucose regulation and fatty acid
catabolism. One study demonstrates that adiponectin in combination with the hormone leptin can lead
to a reversion of the insulin resistance in mice (46). As a consequence of the low adiponectin levels in
patients with diabetes, it appears that these patients have a higher susceptibility to diseases such as
atherosclerosis. Because atherosclerosis is considered to be a risk factor for diabetic nephropathy, it
might be that adiponectin acts as an indirect risk factor for diabetic nephropathy as well (43).
Other suspected genes that may play a role in diabetic nephropathy are the DR-B1 gene, the DQ-A1
gene, the DQ-B1 gene (all located on chromosome 6) and the insulin gene which is situated on
chromosome 11 (39). Another study proposes that DN has positive and negative associations with the
A2, B8, B15, DR4 and DR3/4 genes of the HLA gene system (47). There might also be a role for
changes in the hormone levels, the vasoactive peptides, the cytokines and the growth factors (47) .
In summary, a lot of assumptions have been made for the genetic susceptibility to diabetic
nephropathy. These assumptions are mostly based on the finding that DN clusters in families. To date,
several genes, including the HLA gene system, have been suggested to be responsible for the genetic
susceptibility to diabetic nephropathy.
21
II.3.3 The association between diabetic retinopathy and diabetic nephropathy
Diabetic retinopathy and diabetic nephropathy often coexist (22). Their association is partially based
on the findings that both microvascular complications share the same predisposing factors. It has been
suggested that diabetic retinopathy can be predicted by the observed microalbuminuria in patients with
type 1 diabetes mellitus. There are two possible explanations for the coexisting of DN and DR. It is
possible that diabetic nephropathy acts as an independent risk factor for diabetic retinopathy. The other
explanation is the important role of hyperglycemia. Hyperglycemia is in both complications the
initiator of the disease pathway (as shown in figure IV and V). Another observation is that patients
with severe diabetic nephropathy have a more advanced form of diabetic retinopathy (22). As an
illustration: blindness as the result of diabetic retinopathy is 2 to 5 times more prevalent in patients
with nephropathy than in patients with microalbuminuria alone (40). Furthermore, patients that
undergo renal transplantation or start with dialysis have a stabilization of the visual function (15).
II.4 Research aims
The main objective of this study was to unravel a linkage between the HLA-DQ genotype and both
microvascular complications, i.e. diabetic retinopathy and diabetic nephropathy. The two
complications can lead to severe dysfunctions of the eye (vision impairment) and the kidney (end
stage renal disease). The function of the HLA system in the development of the late complications in
type 1 diabetes mellitus remains controversial because there were a lot of contradicting results
published. Nevertheless, the exact determination of the role of the HLA system in the development of
these complications can help us understand the underlying mechanisms of the pathogenesis associated
with the microvascular complications of type 1 diabetes mellitus. Finding all the pieces of the puzzle
will tremendously improve our ability to identify patients with a high risk to these microvascular
complications. Once these patients are identified, they could be screened more often and more
thoroughly while they strive towards a more tight metabolic control. Thus a better understanding of
the involved parameters will be outermost beneficial to the patients as well as to the health care system
expenses. In order to accomplish our objective, we have studied the data of 40 patients with type 1
diabetes mellitus in Ghent, Belgium. In our analysis, we have also included other parameters of which
it is believed that there is an influence on the pathogenesis of the microvascular complications.
22
III. MATERIAL AND METHODS
III.1 Patient recruitment
This study about the correlation between the HLA-DQ system and the late complications in patients
with type 1 diabetes’ was approved by the local Ethical Committee of Ghent University. It concerns a
retrospective, nonrandomized study and was held in Flanders, Belgium. More specific, most of the
patients frequent the Ghent University Hospital. Patients with type 1 diabetes mellitus from the
department endocrinology were consistently contacted. The participating patients were verbally
informed about the procedures and the goals of the study. After giving this information an informed
consent was sent to the patient’s home or it was provided during the consultation. We obtained a
written informed consent of all the patients participating in this study.
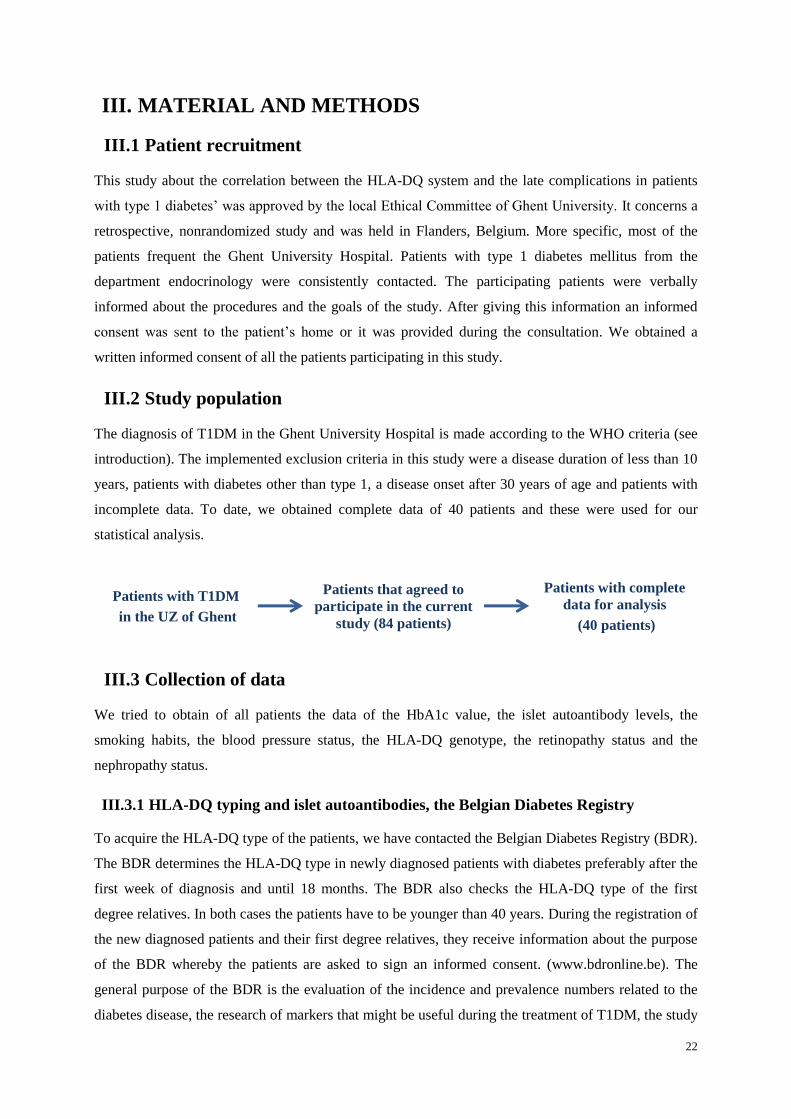
III.2 Study population
The diagnosis of T1DM in the Ghent University Hospital is made according to the WHO criteria (see
introduction). The implemented exclusion criteria in this study were a disease duration of less than 10
years, patients with diabetes other than type 1, a disease onset after 30 years of age and patients with
incomplete data. To date, we obtained complete data of 40 patients and these were used for our
statistical analysis.
III.3 Collection of data
We tried to obtain of all patients the data of the HbA1c value, the islet autoantibody levels, the
smoking habits, the blood pressure status, the HLA-DQ genotype, the retinopathy status and the
nephropathy status.
III.3.1 HLA-DQ typing and islet autoantibodies, the Belgian Diabetes Registry
To acquire the HLA-DQ type of the patients, we have contacted the Belgian Diabetes Registry (BDR).
The BDR determines the HLA-DQ type in newly diagnosed patients with diabetes preferably after the
first week of diagnosis and until 18 months. The BDR also checks the HLA-DQ type of the first
degree relatives. In both cases the patients have to be younger than 40 years. During the registration of
the new diagnosed patients and their first degree relatives, they receive information about the purpose
of the BDR whereby the patients are asked to sign an informed consent. (www.bdronline.be). The
general purpose of the BDR is the evaluation of the incidence and prevalence numbers related to the
diabetes disease, the research of markers that might be useful during the treatment of T1DM, the study
Patients that agreed to
participate in the current
study (84 patients)
Patients with T1DM
in the UZ of Ghent
Patients with complete
data for analysis
(40 patients)
23
of the natural course of type 1 diabetes mellitus and the identification of the people at risk for the
development of diabetes or the identification of patients prone to the complications of diabetes.
Patients who are registered at the BDR are the first possible candidates for studies that involve beta-
cell transplantation.
In order to perform the HLA-DQ typing and to analyze the antibody level, a blood sample from the
patient is needed at the time of diagnosis. The method that is applied for the HLA-DQ typing by the
BDR is the non-radioactive allele specific oligo-hybridization technique. This method involves a DNA
amplification step which is followed by a dot-blot hybridization with an allele-specific probe (48). The
procedure used to measure the autoantibody level of the islet cell cytoplasmic antibodies (ICA) is the
indirect immunofluorescense, while the method used to detect the antibodies against the IA-2 protein,
the 65-kDa glutamate cecarboxylase and the insulin is the liquid-phase radiobinding assay (49).
III.3.2 Smoking habits and blood pressure
Information about the smoking habits and the blood pressure was retrieved from the data of the
Electronic Patient Record. The blood pressure status was further divided into hypertension and
normotension. Hypertension was defined as a blood pressure higher than 140/90. Patients were also
categorized under ‘hypertension’ if they were taking anti-hypertensive drugs. The importance of the
blood pressure in the development and progression of microvascular complications in T1DM has been
described in the introduction. Information about the smoking habits was categorized into smoker and
non-smokers. Patients that had been smoking previously to the study were categorized under smokers.
III.3.3 HbA1c
In the Ghent University Hospital the HbA1c is used as a parameter for the evaluation of the metabolic
control during T1DM. As mentioned in the introduction, metabolic control has an influence on the
development of the microvascular complications associated with T1DM. The HbA1c values were
determined in the blood samples of the patients whereby HbA1c levels greater than 6.5 percent were
considered as abnormal. The general goal in diabetic patients is to maintain an HbA1c value less than
7 percent.
III.3.4 Determination of retinopathy
During the two years (2010-2012) of this study, all the patients underwent an eye exam. Information
about this eye exam was retrieved from the Electronic Patient Record within the Ghent University
Hospital or via the patients’ ophthalmologists. All the patients have given their permission to contact
their ophthalmologists concerning the information about the eye exam. The patients were invited to a
free eye exam if they did not have visited their ophthalmologists within the last two years. As a result,
we obtained up to date information about the patients’ eye status. For the eye examination, the
ophthalmologists used the dilated funduscopic method.
24
III.3.5 Determination of nephropathy
In order to investigate the nephropathy status we have checked the creatinin level, the creatinuria level
and the albuminuria level in the Electronic Patient Record. We determined the degree of proteinuria
with the use of the formula “urinary albumin concentration x urine volume / urine collection time”.
The possible outcomes of this formula were no albuminuria, microalbuminuria (an outcome between
20 and 200 µg/min) and macroalbuminuria (an outcome bigger than 200 µg/min). However, due to
missing data of the urine volume and the urine collection time we were obliged to sometimes use the
albumin - creatinin ratio. The outcome of this equation was classified as microalbuminuria when a
ratio higher than 2,5 in men or a ratio higher than 3,5 in women was reached. An outcome that
exceeded the value of 30 was defined as macroalbuminuria. Because none of the patients had
macroalbuminuria, we have categorized patients with microalbuminuria under diabetic nephropathy in
this study.
III.4 Statistical analysis
Our data was consistently analyzed with the statistical software packet SPSS version 19.0. We have
evaluated the patient characteristics by making use of several descriptive and frequency tables. We
have carried out various Q-Q plots and Shapiro-Wilk tests on our continuous variables to see if they
were Gaussian divided. On the categorical variables we have applied the Χ² goodness-of-fit-test to
check if the values were divided as expected. The analytical tests that we have used to verify our
hypothesis concerning the HLA-DQ types were the Mann-Whitney U test for the continuous variables
and the Fisher’s exact test for the categorical variables. For all the applied tests we have set the
significance level of p at 0.05.
III.5 Literature
Relevant articles were found in the PubMed database and in the Web of Science database. The search
terms that we have applied in these databases were first evaluated in the Mesh database. Interesting
articles were also obtained with the option ‘related articles’. Additional information about diabetes,
diabetic retinopathy and diabetic nephropathy was found in books (i.e. in the library of ophthalmology,
UZ Ghent; in the library of health sciences, UZ Ghent). Relevant articles were selected on the basis of
the amount of citations, the impact of the journal, the relevance of the abstract and the publication date.

25
Figure IV. Boxplot of the disease duration.
The mean value of the disease duration was 16 years while the
median value was 15 years.
IV. RESULTS
To date, 84 patients agreed to participate in our study where the association between the HLA-DQ
genotypes and the late complications in patients with T1DM was investigated. Because we did not
acquire all the records of these 84 patients, we have analyzed and worked with the data of only 40
patients. Of the 84 patients we only achieved the complete data on 24 patients. Most of the missing
data includes the information of the diabetic nephropathy and the diabetic retinopathy status, and we
have therefore analyzed these microvascular complications separately.
IV.1 Patient characteristics
Of the 40 patients that were implemented in this study, 47,5 percent were males and 52,5 percent were
females. The information about blood pressure status was available for 25 patients. Of these 25
patients, 44 percent had an elevated blood pressure. Data about the smoking habits was known of 20
patients, whereof 30 percent actually smoked or had smoked before. Diabetic retinopathy was
diagnosed in 4 patients, which represents 12,9 percent of the patient population. In addition, 5 patients
were diagnosed with diabetic nephropathy, which accounts for 15,2 percent of the patient population.
Another important parameter was the disease duration. The mean value of the disease duration was
16,4 years (with a standard deviation of 6,714) (figure V). Furthermore, 50 percent of the patients had
a disease duration shorter than 15 years. A detailed overview of the patients’ characteristics is given in
table II and table III.
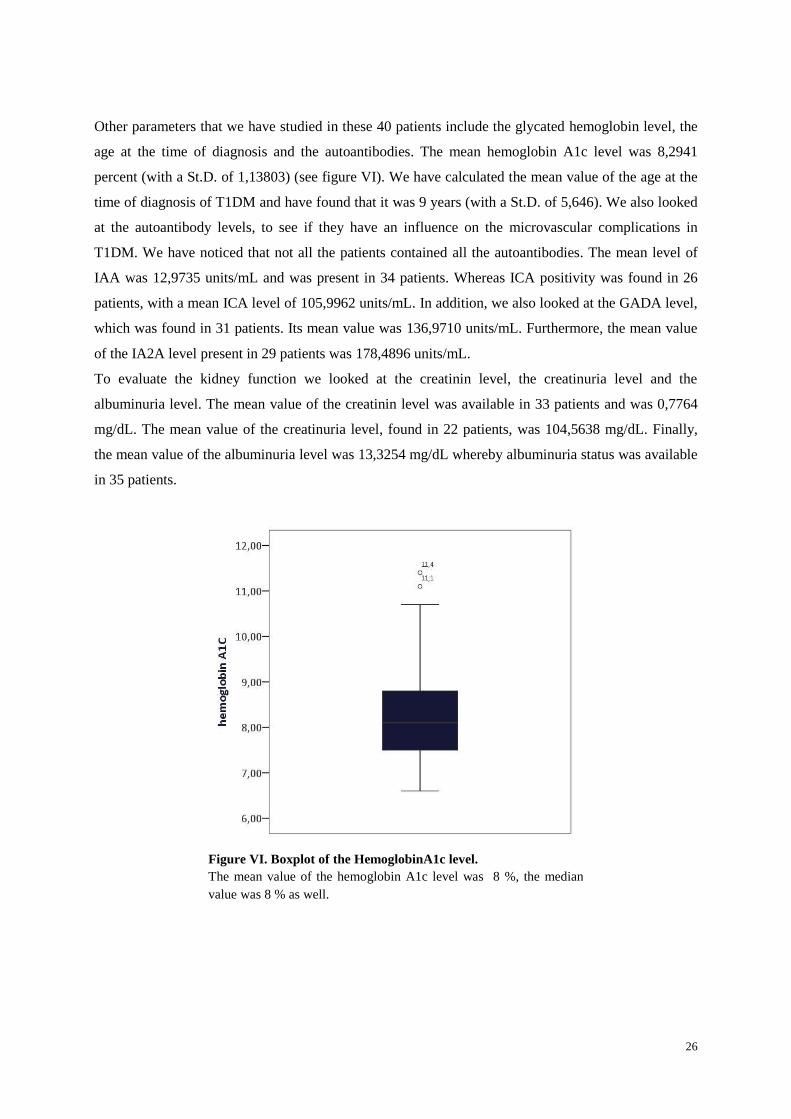
26
Other parameters that we have studied in these 40 patients include the glycated hemoglobin level, the
age at the time of diagnosis and the autoantibodies. The mean hemoglobin A1c level was 8,2941
percent (with a St.D. of 1,13803) (see figure VI). We have calculated the mean value of the age at the
time of diagnosis of T1DM and have found that it was 9 years (with a St.D. of 5,646). We also looked
at the autoantibody levels, to see if they have an influence on the microvascular complications in
T1DM. We have noticed that not all the patients contained all the autoantibodies. The mean level of
IAA was 12,9735 units/mL and was present in 34 patients. Whereas ICA positivity was found in 26
patients, with a mean ICA level of 105,9962 units/mL. In addition, we also looked at the GADA level,
which was found in 31 patients. Its mean value was 136,9710 units/mL. Furthermore, the mean value
of the IA2A level present in 29 patients was 178,4896 units/mL.
To evaluate the kidney function we looked at the creatinin level, the creatinuria level and the
albuminuria level. The mean value of the creatinin level was available in 33 patients and was 0,7764
mg/dL. The mean value of the creatinuria level, found in 22 patients, was 104,5638 mg/dL. Finally,
the mean value of the albuminuria level was 13,3254 mg/dL whereby albuminuria status was available
in 35 patients.
Figure VI. Boxplot of the HemoglobinA1c level.
The mean value of the hemoglobin A1c level was 8 %, the median
value was 8 % as well.
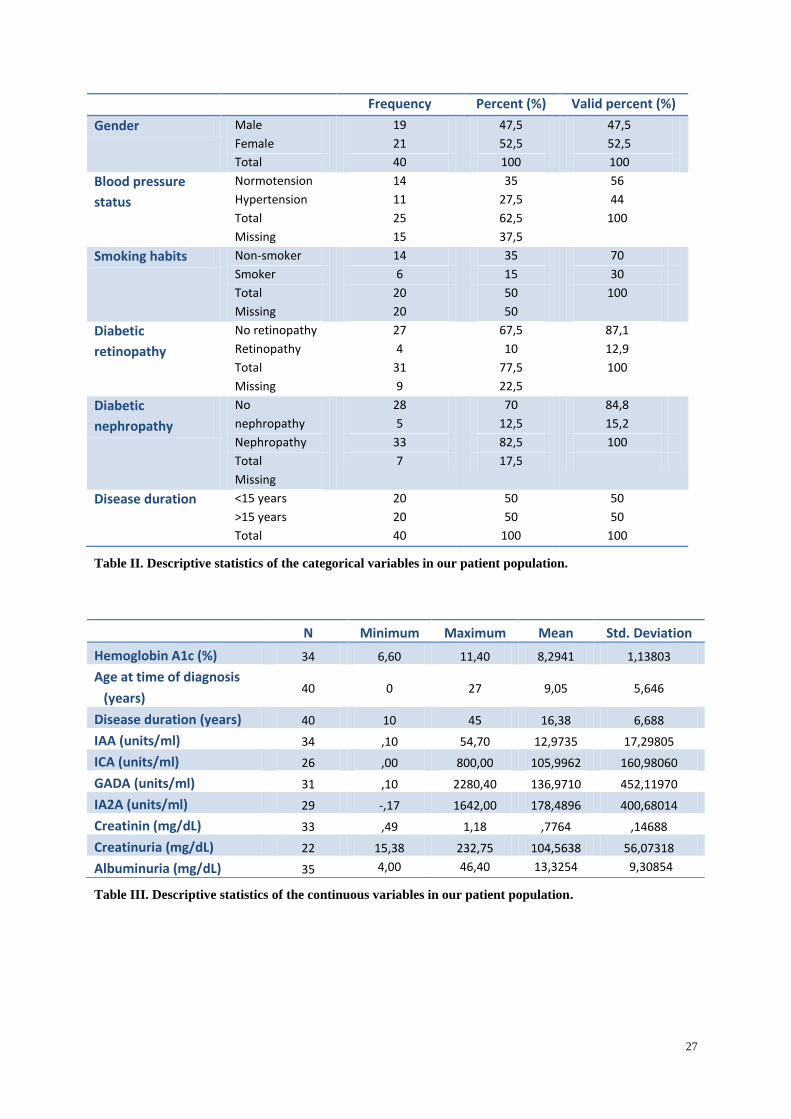
27
Table II. Descriptive statistics of the categorical variables in our patient population.
Table III. Descriptive statistics of the continuous variables in our patient population.
Frequency Percent (%) Valid percent (%)
Gender Male
Female
Total
19
21
40
47,5
52,5
100
47,5
52,5
100
Blood pressure
status
Normotension
Hypertension
Total
Missing
14
11
25
15
35
27,5
62,5
37,5
56
44
100
Smoking habits Non-smoker
Smoker
Total
Missing
14
6
20
20
35
15
50
50
70
30
100
Diabetic
retinopathy
No retinopathy
Retinopathy
Total
Missing
27
4
31
9
67,5
10
77,5
22,5
87,1
12,9
100
Diabetic
nephropathy
No
nephropathy
Nephropathy
Total
Missing
28
5
33
7
70
12,5
82,5
17,5
84,8
15,2
100
Disease duration <15 years
>15 years
Total
20
20
40
50
50
100
50
50
100
N Minimum Maximum Mean Std. Deviation
Hemoglobin A1c (%) 34 6,60 11,40 8,2941 1,13803
Age at time of diagnosis
(years) 40 0 27 9,05 5,646
Disease duration (years) 40 10 45 16,38 6,688
IAA (units/ml) 34 ,10 54,70 12,9735 17,29805
ICA (units/ml) 26 ,00 800,00 105,9962 160,98060
GADA (units/ml) 31 ,10 2280,40 136,9710 452,11970
IA2A (units/ml) 29 -,17 1642,00 178,4896 400,68014
Creatinin (mg/dL) 33 ,49 1,18 ,7764 ,14688
Creatinuria (mg/dL) 22 15,38 232,75 104,5638 56,07318
Albuminuria (mg/dL) 35 4,00 46,40 13,3254 9,30854

28
Another crucial determinant in the development of type 1 diabetes mellitus is the HLA-DQ genotype.
Because our investigation deals with the association between microvascular complications and HLA-
DQ, we were fortunate to have information of the different HLA-DQ types in 40 patients. The
prevalence of the different HLA-DQ types in percentages is given in the figure VII. From this graph,
we have taken our findings concerning the different HLA-DQ genotypes in our population. To be
complete, we also included table XIII in the addendum that displays the prevalence of the HLA-DQ
types in numbers. Thus in figure VII, we surveyed that the HLA-DQA3-DQB3.2/DQA4-DQB2
genotype, with a prevalence of 27,5 percent, is the most prevalent amongst the patients with type 1
diabetes mellitus. The second place, which is responsible for 12,5 percent of all the genotypes is the
DQA1-DQB1.1/DQA3-DQB3.2 genotype. The third most prevalent genotype is the DQA4-
DQB2/DQA4-DQB2 genotype and represents 10 percent of the population. As expected and
mentioned in the introduction, these three genotypes are the most susceptible haplotypes for the
development of type 1 diabetes mellitus.
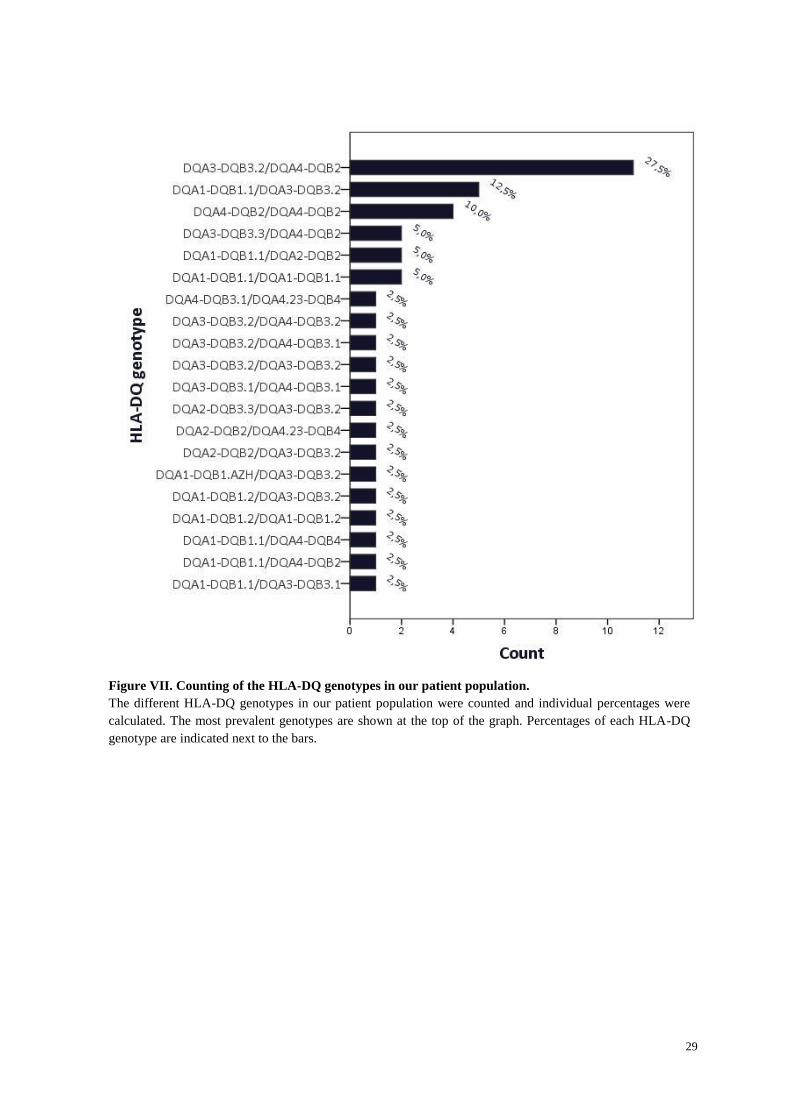
29
Figure VII. Counting of the HLA-DQ genotypes in our patient population.
The different HLA-DQ genotypes in our patient population were counted and individual percentages were
calculated. The most prevalent genotypes are shown at the top of the graph. Percentages of each HLA-DQ
genotype are indicated next to the bars.
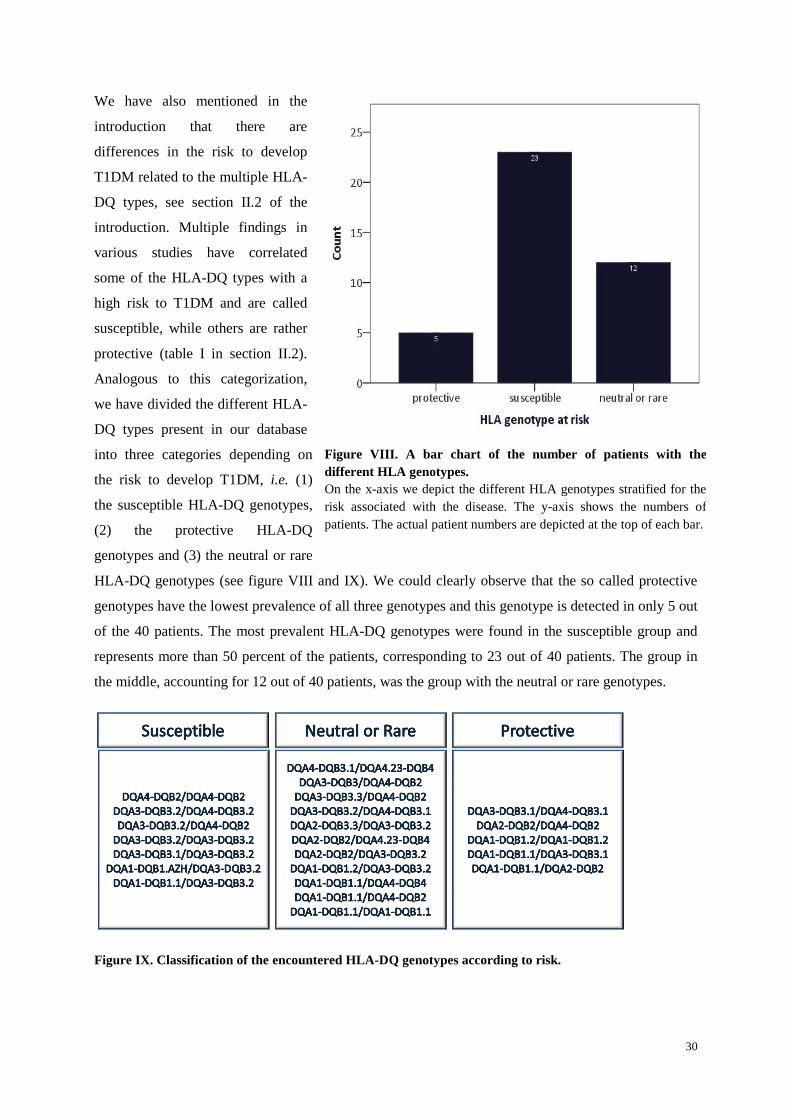
30
Figure VIII. A bar chart of the number of patients with the
different HLA genotypes.
On the x-axis we depict the different HLA genotypes stratified for the
risk associated with the disease. The y-axis shows the numbers of
patients. The actual patient numbers are depicted at the top of each bar.
We have also mentioned in the
introduction that there are
differences in the risk to develop
T1DM related to the multiple HLA-
DQ types, see section II.2 of the
introduction. Multiple findings in
various studies have correlated
some of the HLA-DQ types with a
high risk to T1DM and are called
susceptible, while others are rather
protective (table I in section II.2).
Analogous to this categorization,
we have divided the different HLA-
DQ types present in our database
into three categories depending on
the risk to develop T1DM, i.e. (1)
the susceptible HLA-DQ genotypes,
(2) the protective HLA-DQ
genotypes and (3) the neutral or rare
HLA-DQ genotypes (see figure VIII and IX). We could clearly observe that the so called protective
genotypes have the lowest prevalence of all three genotypes and this genotype is detected in only 5 out
of the 40 patients. The most prevalent HLA-DQ genotypes were found in the susceptible group and
represents more than 50 percent of the patients, corresponding to 23 out of 40 patients. The group in
the middle, accounting for 12 out of 40 patients, was the group with the neutral or rare genotypes.
Figure IX. Classification of the encountered HLA-DQ genotypes according to risk.
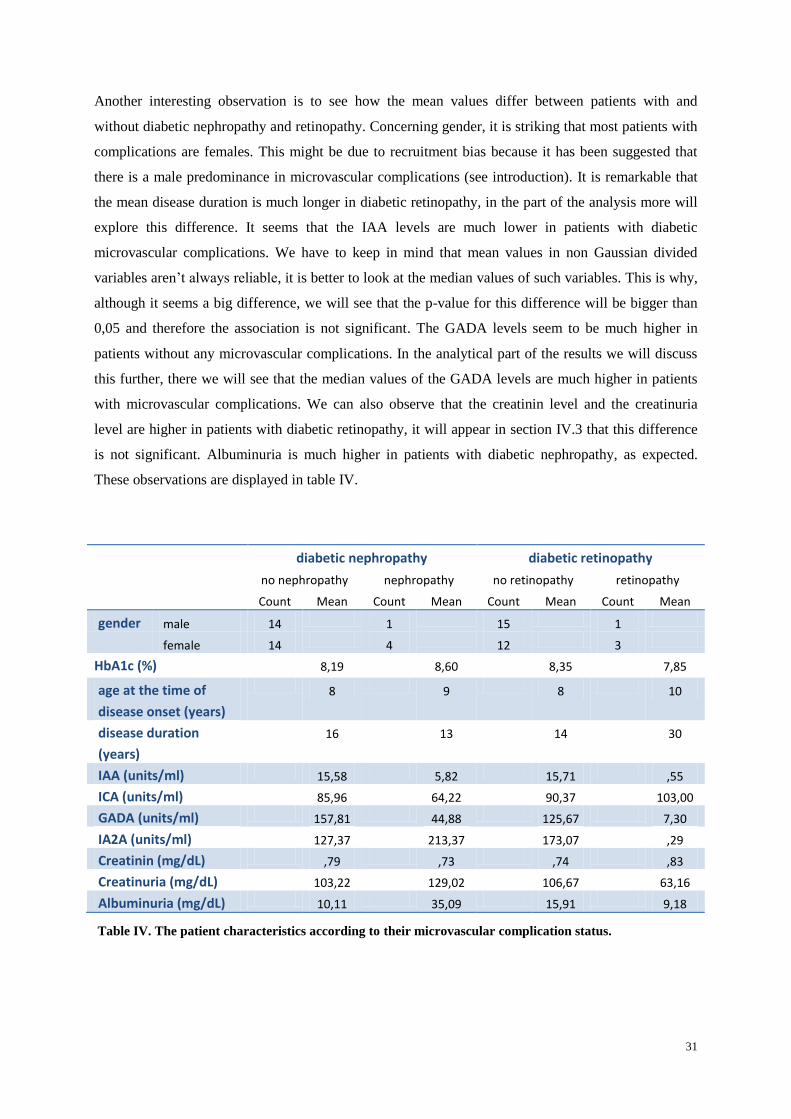
31
Another interesting observation is to see how the mean values differ between patients with and
without diabetic nephropathy and retinopathy. Concerning gender, it is striking that most patients with
complications are females. This might be due to recruitment bias because it has been suggested that
there is a male predominance in microvascular complications (see introduction). It is remarkable that
the mean disease duration is much longer in diabetic retinopathy, in the part of the analysis more will
explore this difference. It seems that the IAA levels are much lower in patients with diabetic
microvascular complications. We have to keep in mind that mean values in non Gaussian divided
variables aren’t always reliable, it is better to look at the median values of such variables. This is why,
although it seems a big difference, we will see that the p-value for this difference will be bigger than
0,05 and therefore the association is not significant. The GADA levels seem to be much higher in
patients without any microvascular complications. In the analytical part of the results we will discuss
this further, there we will see that the median values of the GADA levels are much higher in patients
with microvascular complications. We can also observe that the creatinin level and the creatinuria
level are higher in patients with diabetic retinopathy, it will appear in section IV.3 that this difference
is not significant. Albuminuria is much higher in patients with diabetic nephropathy, as expected.
These observations are displayed in table IV.
diabetic nephropathy diabetic retinopathy
no nephropathy nephropathy no retinopathy retinopathy
Count Mean Count Mean Count Mean Count Mean
gender male 14 1 15 1
female 14 4 12 3
HbA1c (%) 8,19 8,60 8,35 7,85
age at the time of
disease onset (years)
8 9 8 10
disease duration
(years)
16 13 14 30
IAA (units/ml) 15,58 5,82 15,71 ,55
ICA (units/ml) 85,96 64,22 90,37 103,00
GADA (units/ml) 157,81 44,88 125,67 7,30
IA2A (units/ml) 127,37 213,37 173,07 ,29
Creatinin (mg/dL) ,79 ,73 ,74 ,83
Creatinuria (mg/dL) 103,22 129,02 106,67 63,16
Albuminuria (mg/dL) 10,11 35,09 15,91 9,18
Table IV. The patient characteristics according to their microvascular complication status.

32
IV.2 Analysis of the variables
In this section we have explored how the different variables, which are possibly involved in T1DM,
were statistically divided in our population. For the categorical variables we have used the Χ²
goodness-of-fit test to verify if they were randomly distributed. The categorical variables consist of the
blood pressure status, the smoking habits, gender, diabetic retinopathy, diabetic nephropathy, the HLA
type divided in three categories and the duration divided in two categories. We have used the Q-Q plot
and the Shapiro-Wilk test to check whether our continuous variables were Gaussian divided. The
continuous variables include the mean HbA1c value, the duration of the disease, age at the time of
disease diagnosis, the GADA levels, the IAA levels, the IA2A levels, the ICA levels, the creatinin, the
creatinuria and the albuminuria.
The results of the Χ² statistical test, which is considered to be significant when the p-level is smaller
than 0.05, are given in the table V. A significant outcome was found for diabetic retinopathy (p <
0.0005), for diabetic nephropathy (p<0.0005) and for the HLA-DQ genotype grouped according to risk
to T1DM (p=0.002). This means that for these categorical variables, the values in both groups are
different than would be expected on the principle of randomness.
Table V. Chi-square goodness-of-fit test applied to the categorical variables.
Abbreviations: Χ², chi-square test; Df, degrees of freedom; Sig, significance.
A p-level of the Shapiro-Wilk test higher than 0.05, means that the variables are Gaussian divided. A
Gaussian distribution was not observed for the IAA levels, the ICA levels, the GADA levels and the
IA2A levels. The p-value for these variables was smaller than 0.05. Therefore, we can say that these
variables are probably not Gaussian divided. A plausible explanation for this finding might be a high
prevalence of outliers in these variables. A detailed overview of the varying p-levels of the Shapiro-
Wilk test is given in the table XVIII in the addendum.
Next we have investigated a possible association between the variables. To obtain this information we
performed a correlation analysis (spearman’s correlation coefficient). Using this correlation analysis,
we have found that several variables were indeed linked. The associated p-level of the different
variables can be seen in table VI whereby significance level of the p-value is set at < 0.05.
gender
blood
pressure
status
smoking
habits
diabetic
retinopathy nephropathy
HLA
genotype
at risk duration
Χ² ,100 ,360 3,200 17,065 16,030 12,350 0,000
Df 1 1 1 1 1 2 1
Sig. ,752 ,549 ,074 ,000 ,000 ,002 1,000

33
Variable Variable P-level
Diabetic retinopathy Smoking habits 0.044
Disease duration 0.001
Disease duration dichotomized 0.017
Disease duration dichotomized IAA <0.0005
ICA 0.040
Creatinin 0.029
Albuminuria 0.017
Gender IA2A 0.048
Blood pressure status Smoking habits 0.048
ICA 0.014
Diabetic nephropathy GADA 0.018
Albuminuria <0.0005
Age at time of disease onset IAA 0.002
Smoking habits 0.035
ICA 0.021
Disease duration IAA 0.002
GADA 0.049
Creatinin 0.004
IAA Creatinin 0.04
Albuminuria 0.043
ICA IA2A 0.013
Albuminuria Creatinin 0.027
Creatinuria 0.023
Table VI. A correlation analysis of the different variables that were significant.
The p-value is given for each couple of variables that had a significant correlation.
Next, we checked for some of the dichotomy variables if the mean value in the two groups was
significantly different. The statistical tests that we used were the Fisher’s exact test for categorical
variables and the Mann-Whitney U test for continuous variables. We first did this for gender, and
didn’t find any significant differences between the previous discussed variables for males and females.
Secondly we preformed these tests for blood pressure, where we have found a significant result for the
ICA levels (p=0.020). This means that the mean values of the ICA levels were different in the patients
with hypertension versus patients with a normal blood pressure. Next, we have found an association
between the smoking habits of the patients and the age at the time of diagnosis (p=0.039). The
meaning of this association is not clear. We have also found significant differences in the mean values
of the IAA levels between smokers and non smokers (p=0.009). We did not find any significant results
for the different variables with the HLA-DQ type.
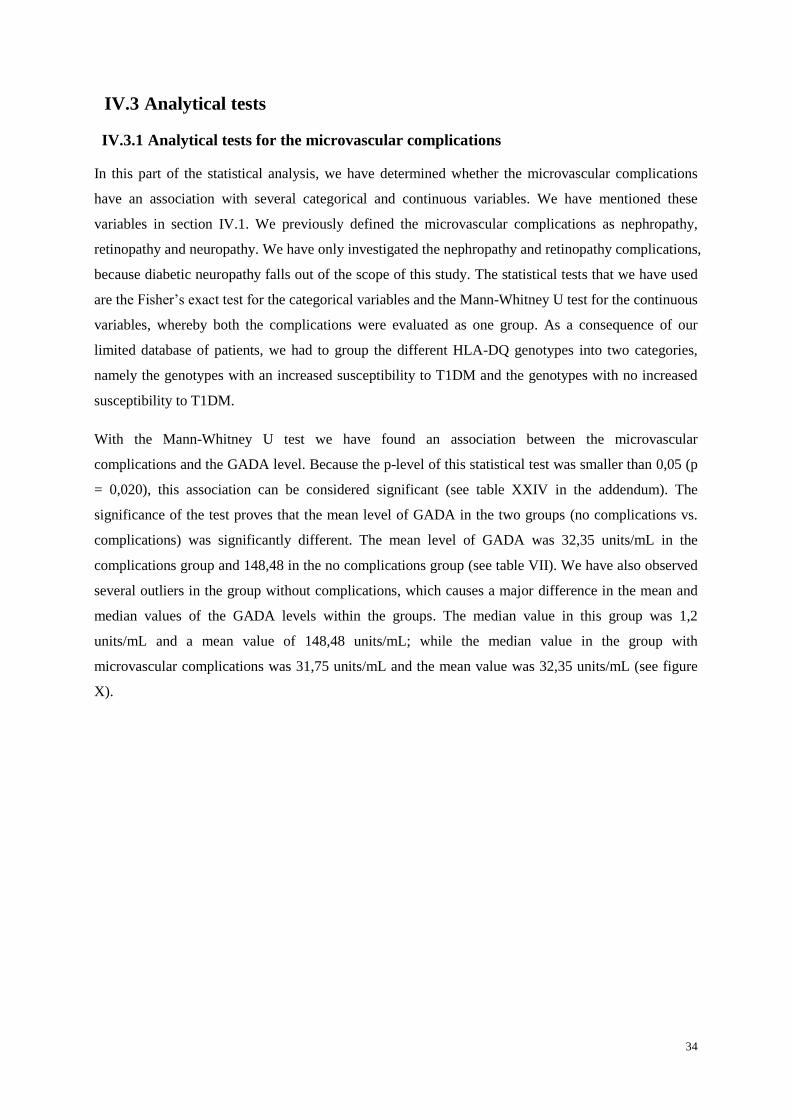
34
IV.3 Analytical tests
IV.3.1 Analytical tests for the microvascular complications
In this part of the statistical analysis, we have determined whether the microvascular complications
have an association with several categorical and continuous variables. We have mentioned these
variables in section IV.1. We previously defined the microvascular complications as nephropathy,
retinopathy and neuropathy. We have only investigated the nephropathy and retinopathy complications,
because diabetic neuropathy falls out of the scope of this study. The statistical tests that we have used
are the Fisher’s exact test for the categorical variables and the Mann-Whitney U test for the continuous
variables, whereby both the complications were evaluated as one group. As a consequence of our
limited database of patients, we had to group the different HLA-DQ genotypes into two categories,
namely the genotypes with an increased susceptibility to T1DM and the genotypes with no increased
susceptibility to T1DM.
With the Mann-Whitney U test we have found an association between the microvascular
complications and the GADA level. Because the p-level of this statistical test was smaller than 0,05 (p
= 0,020), this association can be considered significant (see table XXIV in the addendum). The
significance of the test proves that the mean level of GADA in the two groups (no complications vs.
complications) was significantly different. The mean level of GADA was 32,35 units/mL in the
complications group and 148,48 in the no complications group (see table VII). We have also observed
several outliers in the group without complications, which causes a major difference in the mean and
median values of the GADA levels within the groups. The median value in this group was 1,2
units/mL and a mean value of 148,48 units/mL; while the median value in the group with
microvascular complications was 31,75 units/mL and the mean value was 32,35 units/mL (see figure
X).
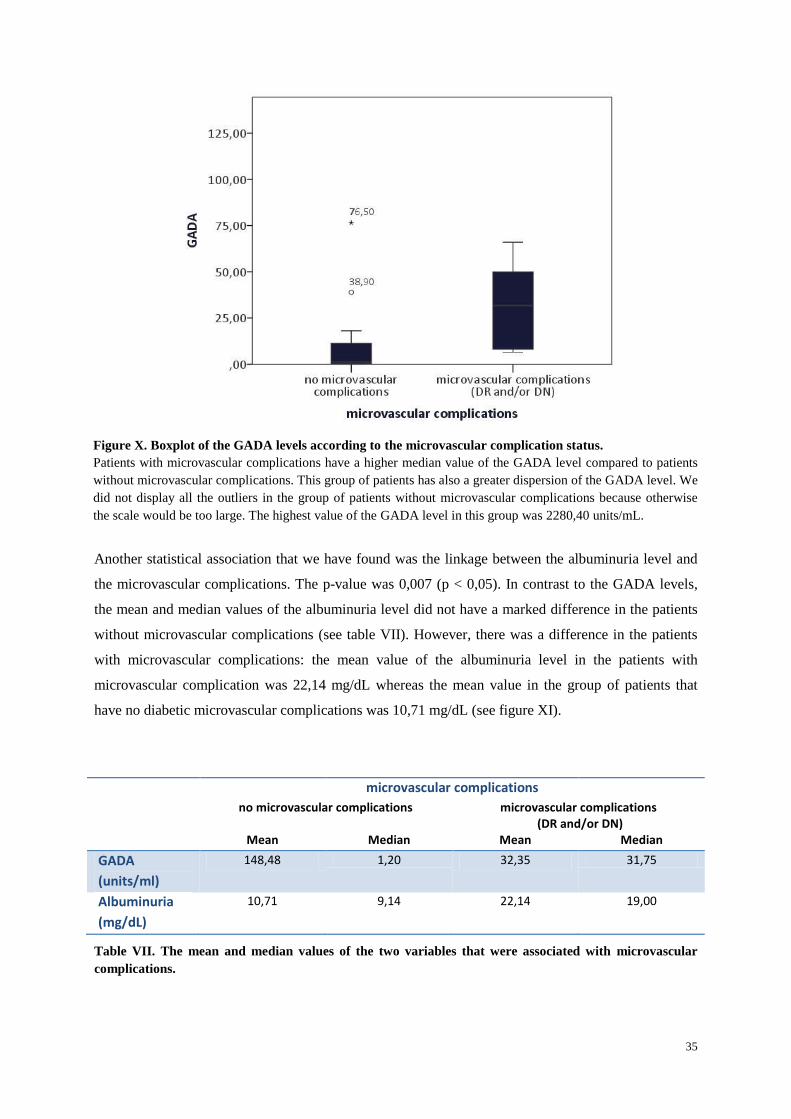
35
Another statistical association that we have found was the linkage between the albuminuria level and
the microvascular complications. The p-value was 0,007 (p < 0,05). In contrast to the GADA levels,
the mean and median values of the albuminuria level did not have a marked difference in the patients
without microvascular complications (see table VII). However, there was a difference in the patients
with microvascular complications: the mean value of the albuminuria level in the patients with
microvascular complication was 22,14 mg/dL whereas the mean value in the group of patients that
have no diabetic microvascular complications was 10,71 mg/dL (see figure XI).
Table VII. The mean and median values of the two variables that were associated with microvascular
complications.
microvascular complications
no microvascular complications microvascular complications (DR and/or DN)
Mean Median Mean Median
GADA
(units/ml)
148,48 1,20 32,35 31,75
Albuminuria
(mg/dL)
10,71 9,14 22,14 19,00
Figure X. Boxplot of the GADA levels according to the microvascular complication status.
Patients with microvascular complications have a higher median value of the GADA level compared to patients
without microvascular complications. This group of patients has also a greater dispersion of the GADA level. We
did not display all the outliers in the group of patients without microvascular complications because otherwise
the scale would be too large. The highest value of the GADA level in this group was 2280,40 units/mL.
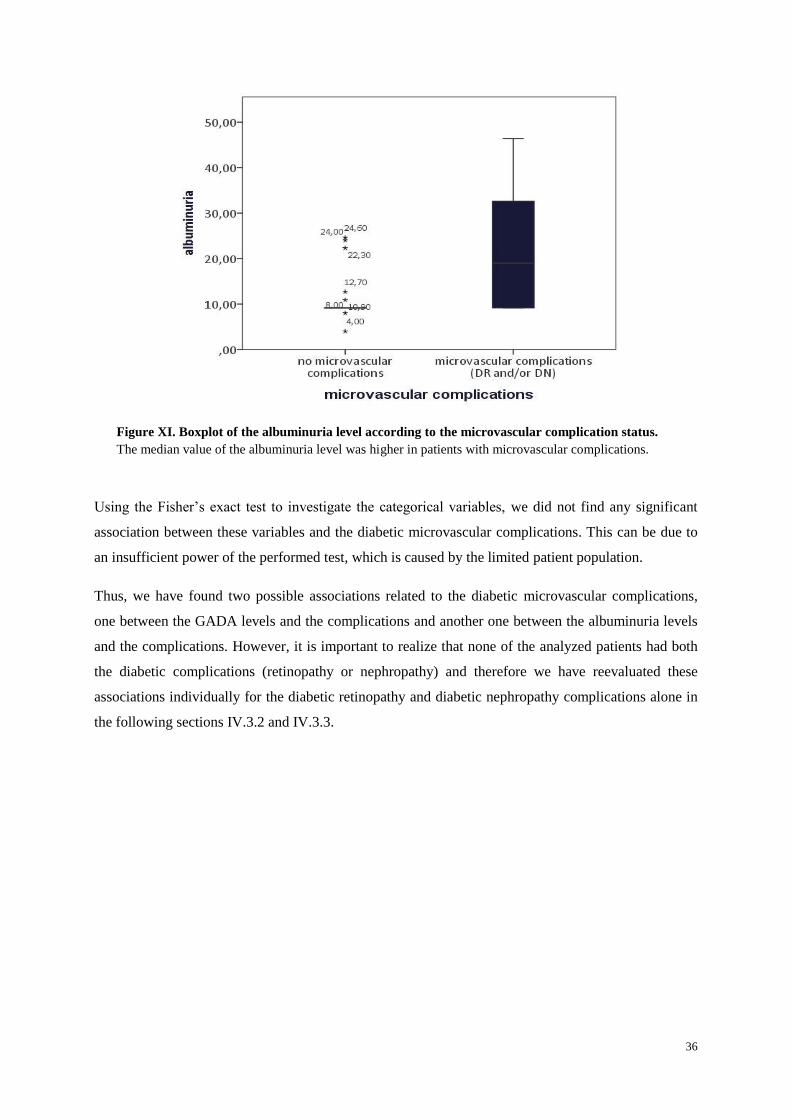
36
Figure XI. Boxplot of the albuminuria level according to the microvascular complication status.
The median value of the albuminuria level was higher in patients with microvascular complications.
Using the Fisher’s exact test to investigate the categorical variables, we did not find any significant
association between these variables and the diabetic microvascular complications. This can be due to
an insufficient power of the performed test, which is caused by the limited patient population.
Thus, we have found two possible associations related to the diabetic microvascular complications,
one between the GADA levels and the complications and another one between the albuminuria levels
and the complications. However, it is important to realize that none of the analyzed patients had both
the diabetic complications (retinopathy or nephropathy) and therefore we have reevaluated these
associations individually for the diabetic retinopathy and diabetic nephropathy complications alone in
the following sections IV.3.2 and IV.3.3.
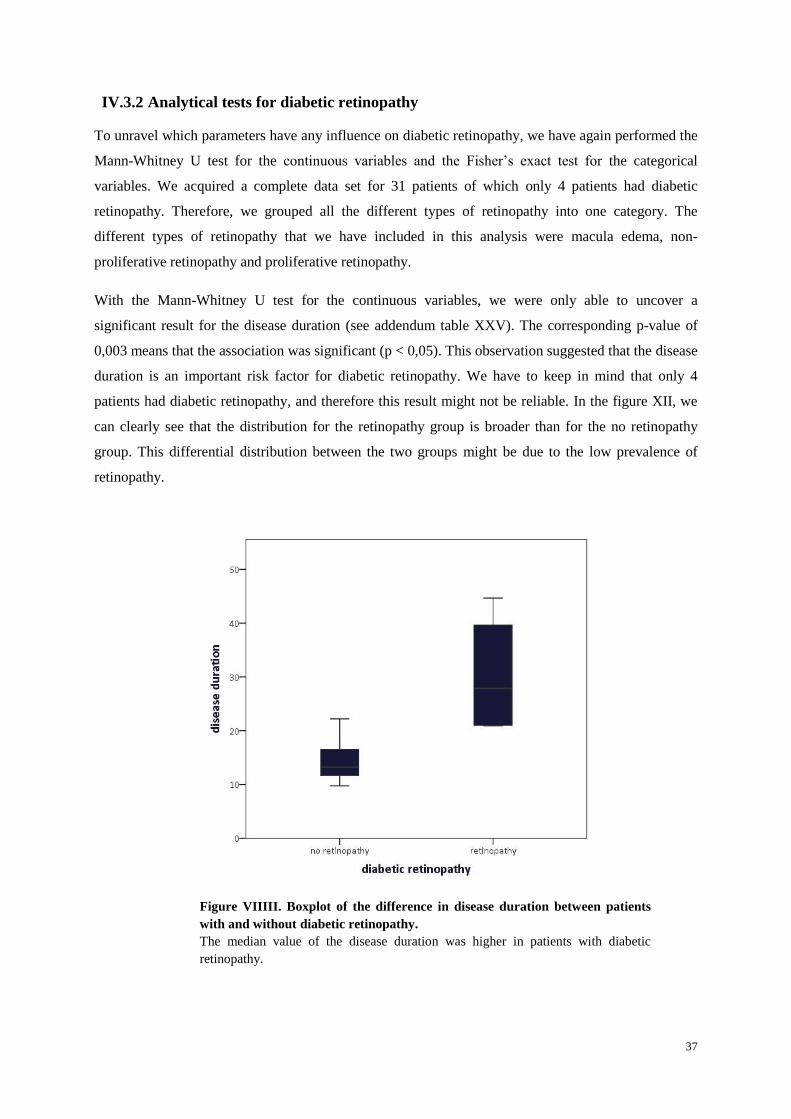
37
IV.3.2 Analytical tests for diabetic retinopathy
To unravel which parameters have any influence on diabetic retinopathy, we have again performed the
Mann-Whitney U test for the continuous variables and the Fisher’s exact test for the categorical
variables. We acquired a complete data set for 31 patients of which only 4 patients had diabetic
retinopathy. Therefore, we grouped all the different types of retinopathy into one category. The
different types of retinopathy that we have included in this analysis were macula edema, non-
proliferative retinopathy and proliferative retinopathy.
With the Mann-Whitney U test for the continuous variables, we were only able to uncover a
significant result for the disease duration (see addendum table XXV). The corresponding p-value of
0,003 means that the association was significant (p < 0,05). This observation suggested that the disease
duration is an important risk factor for diabetic retinopathy. We have to keep in mind that only 4
patients had diabetic retinopathy, and therefore this result might not be reliable. In the figure XII, we
can clearly see that the distribution for the retinopathy group is broader than for the no retinopathy
group. This differential distribution between the two groups might be due to the low prevalence of
retinopathy.
Figure VIIIII. Boxplot of the difference in disease duration between patients
with and without diabetic retinopathy.
The median value of the disease duration was higher in patients with diabetic
retinopathy.
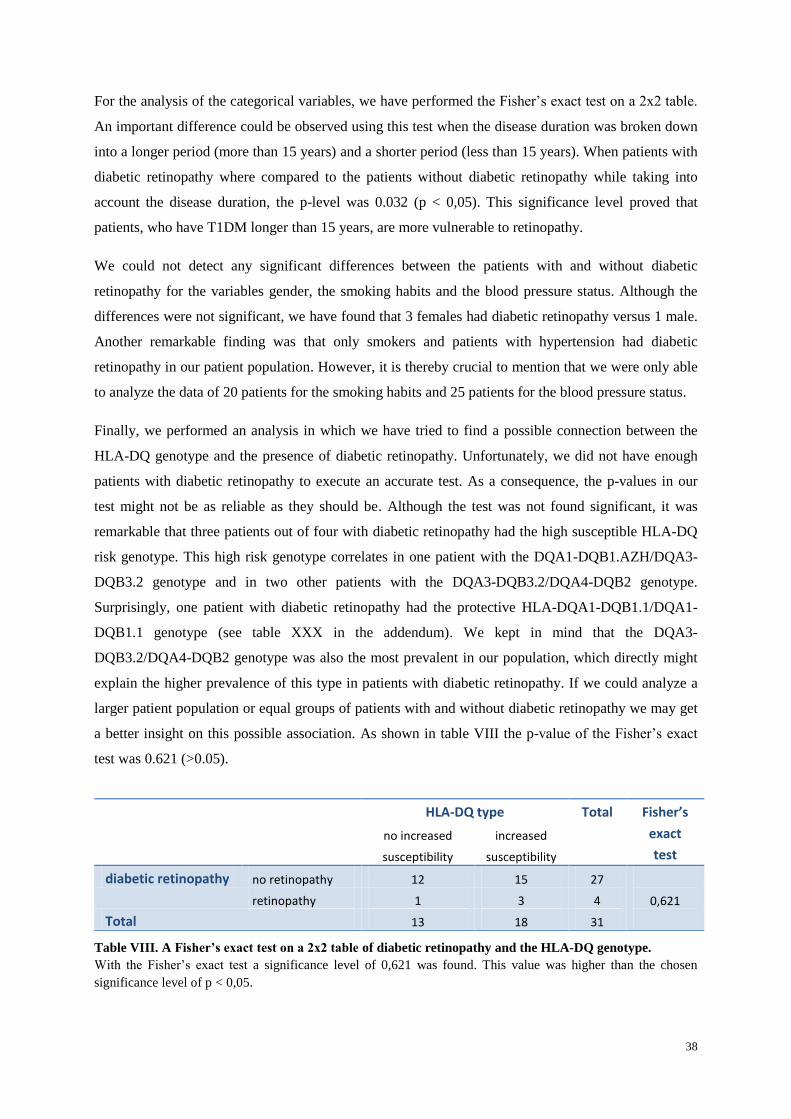
38
For the analysis of the categorical variables, we have performed the Fisher’s exact test on a 2x2 table.
An important difference could be observed using this test when the disease duration was broken down
into a longer period (more than 15 years) and a shorter period (less than 15 years). When patients with
diabetic retinopathy where compared to the patients without diabetic retinopathy while taking into
account the disease duration, the p-level was 0.032 (p < 0,05). This significance level proved that
patients, who have T1DM longer than 15 years, are more vulnerable to retinopathy.
We could not detect any significant differences between the patients with and without diabetic
retinopathy for the variables gender, the smoking habits and the blood pressure status. Although the
differences were not significant, we have found that 3 females had diabetic retinopathy versus 1 male.
Another remarkable finding was that only smokers and patients with hypertension had diabetic
retinopathy in our patient population. However, it is thereby crucial to mention that we were only able
to analyze the data of 20 patients for the smoking habits and 25 patients for the blood pressure status.
Finally, we performed an analysis in which we have tried to find a possible connection between the
HLA-DQ genotype and the presence of diabetic retinopathy. Unfortunately, we did not have enough
patients with diabetic retinopathy to execute an accurate test. As a consequence, the p-values in our
test might not be as reliable as they should be. Although the test was not found significant, it was
remarkable that three patients out of four with diabetic retinopathy had the high susceptible HLA-DQ
risk genotype. This high risk genotype correlates in one patient with the DQA1-DQB1.AZH/DQA3-
DQB3.2 genotype and in two other patients with the DQA3-DQB3.2/DQA4-DQB2 genotype.
Surprisingly, one patient with diabetic retinopathy had the protective HLA-DQA1-DQB1.1/DQA1-
DQB1.1 genotype (see table XXX in the addendum). We kept in mind that the DQA3-
DQB3.2/DQA4-DQB2 genotype was also the most prevalent in our population, which directly might
explain the higher prevalence of this type in patients with diabetic retinopathy. If we could analyze a
larger patient population or equal groups of patients with and without diabetic retinopathy we may get
a better insight on this possible association. As shown in table VIII the p-value of the Fisher’s exact
test was 0.621 (>0.05).
Table VIII. A Fisher’s exact test on a 2x2 table of diabetic retinopathy and the HLA-DQ genotype.
With the Fisher’s exact test a significance level of 0,621 was found. This value was higher than the chosen
significance level of p < 0,05.
HLA-DQ type Total Fisher’s
exact
test
no increased
susceptibility
increased
susceptibility
diabetic retinopathy no retinopathy 12 15 27
0,621
retinopathy 1 3 4
Total 13 18 31
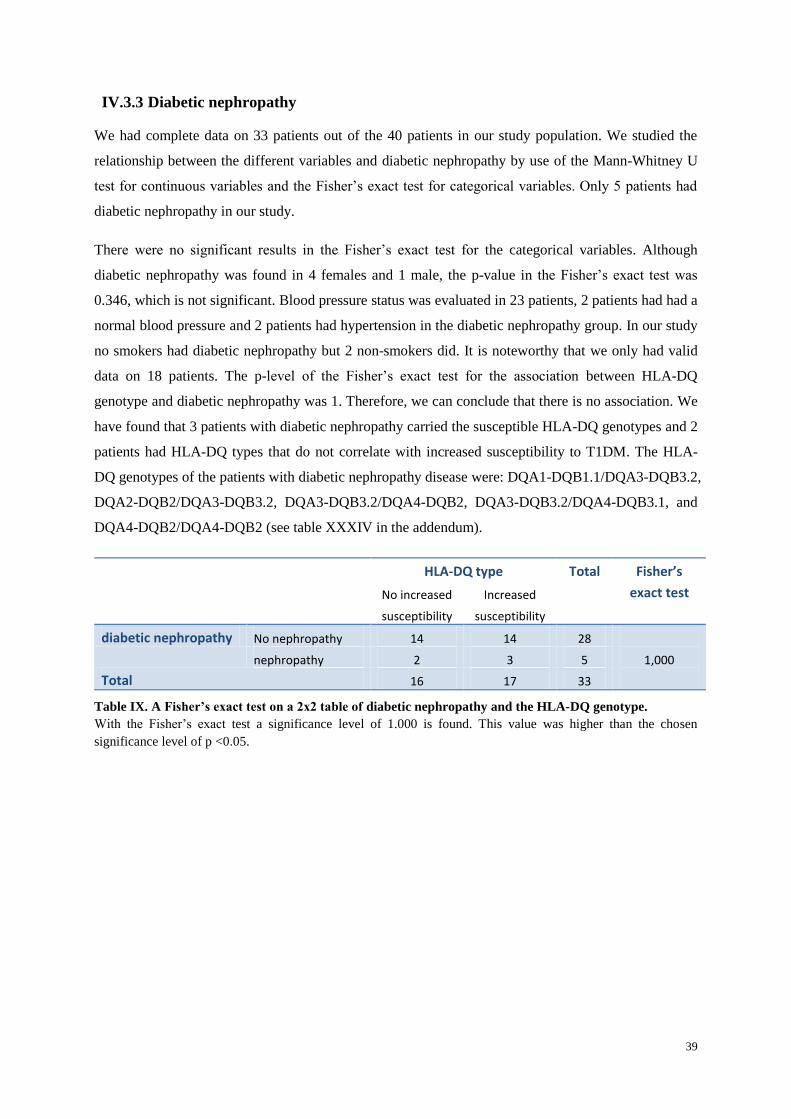
39
IV.3.3 Diabetic nephropathy
We had complete data on 33 patients out of the 40 patients in our study population. We studied the
relationship between the different variables and diabetic nephropathy by use of the Mann-Whitney U
test for continuous variables and the Fisher’s exact test for categorical variables. Only 5 patients had
diabetic nephropathy in our study.
There were no significant results in the Fisher’s exact test for the categorical variables. Although
diabetic nephropathy was found in 4 females and 1 male, the p-value in the Fisher’s exact test was
0.346, which is not significant. Blood pressure status was evaluated in 23 patients, 2 patients had had a
normal blood pressure and 2 patients had hypertension in the diabetic nephropathy group. In our study
no smokers had diabetic nephropathy but 2 non-smokers did. It is noteworthy that we only had valid
data on 18 patients. The p-level of the Fisher’s exact test for the association between HLA-DQ
genotype and diabetic nephropathy was 1. Therefore, we can conclude that there is no association. We
have found that 3 patients with diabetic nephropathy carried the susceptible HLA-DQ genotypes and 2
patients had HLA-DQ types that do not correlate with increased susceptibility to T1DM. The HLA-
DQ genotypes of the patients with diabetic nephropathy disease were: DQA1-DQB1.1/DQA3-DQB3.2,
DQA2-DQB2/DQA3-DQB3.2, DQA3-DQB3.2/DQA4-DQB2, DQA3-DQB3.2/DQA4-DQB3.1, and
DQA4-DQB2/DQA4-DQB2 (see table XXXIV in the addendum).
HLA-DQ type Total Fisher’s
exact test No increased
susceptibility
Increased
susceptibility
diabetic nephropathy No nephropathy 14 14 28
1,000
nephropathy 2 3 5
Total 16 17 33
Table IX. A Fisher’s exact test on a 2x2 table of diabetic nephropathy and the HLA-DQ genotype.
With the Fisher’s exact test a significance level of 1.000 is found. This value was higher than the chosen
significance level of p <0.05.
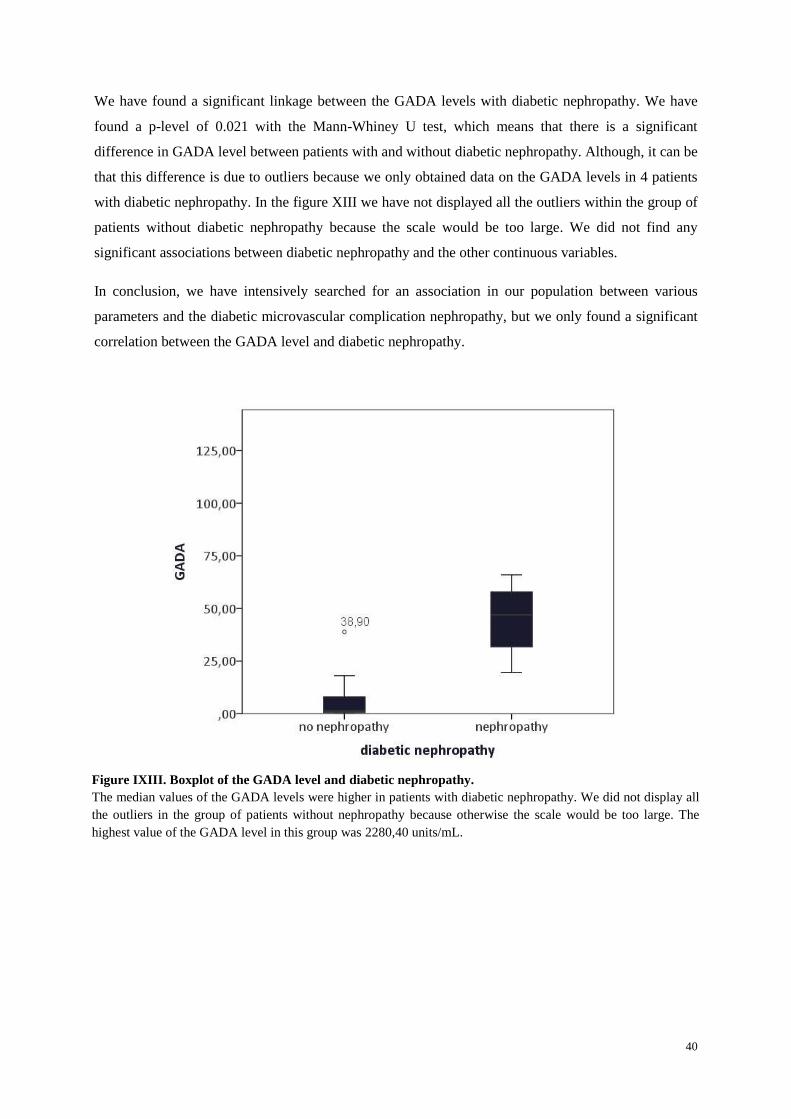
40
We have found a significant linkage between the GADA levels with diabetic nephropathy. We have
found a p-level of 0.021 with the Mann-Whiney U test, which means that there is a significant
difference in GADA level between patients with and without diabetic nephropathy. Although, it can be
that this difference is due to outliers because we only obtained data on the GADA levels in 4 patients
with diabetic nephropathy. In the figure XIII we have not displayed all the outliers within the group of
patients without diabetic nephropathy because the scale would be too large. We did not find any
significant associations between diabetic nephropathy and the other continuous variables.
In conclusion, we have intensively searched for an association in our population between various
parameters and the diabetic microvascular complication nephropathy, but we only found a significant
correlation between the GADA level and diabetic nephropathy.
Figure IXIII. Boxplot of the GADA level and diabetic nephropathy.
The median values of the GADA levels were higher in patients with diabetic nephropathy. We did not display all
the outliers in the group of patients without nephropathy because otherwise the scale would be too large. The
highest value of the GADA level in this group was 2280,40 units/mL.

41
IV.3.4 Diabetic retinopathy and diabetic nephropathy
Besides being interested in the association between diabetic retinopathy and nephropathy with the
different discussed variables, we were also interested to explore a possible association between
diabetic nephropathy and diabetic retinopathy. Like we have described earlier in section II.3.3 it has
been suggested in several studies that there might be an association between these two microvascular
complications.
To research this association we have performed a 2x2 table and a Fisher’s exact test (table X). We
have found that the p-level was 1. The p-value is higher than 0.99, which indicates that there is only 1
percent chance of randomness of the results. Therefore the test is almost definitely insignificant, or in
other words diabetic retinopathy and diabetic nephropathy are not linked. However, this finding might
not be accurate because we only analyzed the data of 24 patients. In the previously discussed table IV,
the mean levels of the patients are given between diabetic nephropathy and diabetic retinopathy.
diabetic retinopathy Total Fisher’s
exact test
(p-value)
no retinopathy retinopathy
diabetic
nephropathy
no nephropathy 16 3 19
1,000 nephropathy 5 0 5
Total 21 3 24
Table X. A Fisher’s exact test on a 2x2 table of diabetic nephropathy and diabetic retinopathy.
With the Fisher’s exact test a significance level of 1.000 is found. This was higher than the chosen significance
level of p <0.05.
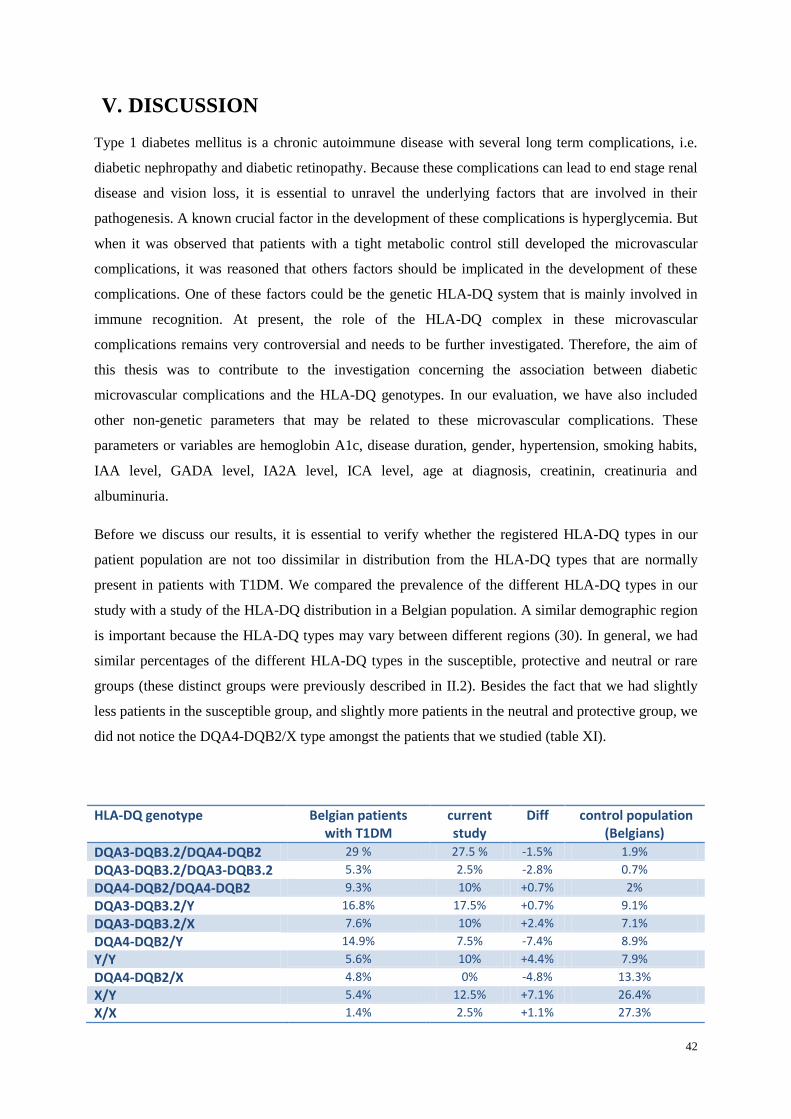
42
V. DISCUSSION
Type 1 diabetes mellitus is a chronic autoimmune disease with several long term complications, i.e.
diabetic nephropathy and diabetic retinopathy. Because these complications can lead to end stage renal
disease and vision loss, it is essential to unravel the underlying factors that are involved in their
pathogenesis. A known crucial factor in the development of these complications is hyperglycemia. But
when it was observed that patients with a tight metabolic control still developed the microvascular
complications, it was reasoned that others factors should be implicated in the development of these
complications. One of these factors could be the genetic HLA-DQ system that is mainly involved in
immune recognition. At present, the role of the HLA-DQ complex in these microvascular
complications remains very controversial and needs to be further investigated. Therefore, the aim of
this thesis was to contribute to the investigation concerning the association between diabetic
microvascular complications and the HLA-DQ genotypes. In our evaluation, we have also included
other non-genetic parameters that may be related to these microvascular complications. These
parameters or variables are hemoglobin A1c, disease duration, gender, hypertension, smoking habits,
IAA level, GADA level, IA2A level, ICA level, age at diagnosis, creatinin, creatinuria and
albuminuria.
Before we discuss our results, it is essential to verify whether the registered HLA-DQ types in our
patient population are not too dissimilar in distribution from the HLA-DQ types that are normally
present in patients with T1DM. We compared the prevalence of the different HLA-DQ types in our
study with a study of the HLA-DQ distribution in a Belgian population. A similar demographic region
is important because the HLA-DQ types may vary between different regions (30). In general, we had
similar percentages of the different HLA-DQ types in the susceptible, protective and neutral or rare
groups (these distinct groups were previously described in II.2). Besides the fact that we had slightly
less patients in the susceptible group, and slightly more patients in the neutral and protective group, we
did not notice the DQA4-DQB2/X type amongst the patients that we studied (table XI).
HLA-DQ genotype Belgian patients with T1DM
current study
Diff control population (Belgians)
DQA3-DQB3.2/DQA4-DQB2 29 % 27.5 % -1.5% 1.9%
DQA3-DQB3.2/DQA3-DQB3.2 5.3% 2.5% -2.8% 0.7%
DQA4-DQB2/DQA4-DQB2 9.3% 10% +0.7% 2%
DQA3-DQB3.2/Y 16.8% 17.5% +0.7% 9.1%
DQA3-DQB3.2/X 7.6% 10% +2.4% 7.1%
DQA4-DQB2/Y 14.9% 7.5% -7.4% 8.9%
Y/Y 5.6% 10% +4.4% 7.9%
DQA4-DQB2/X 4.8% 0% -4.8% 13.3%
X/Y 5.4% 12.5% +7.1% 26.4%
X/X 1.4% 2.5% +1.1% 27.3%
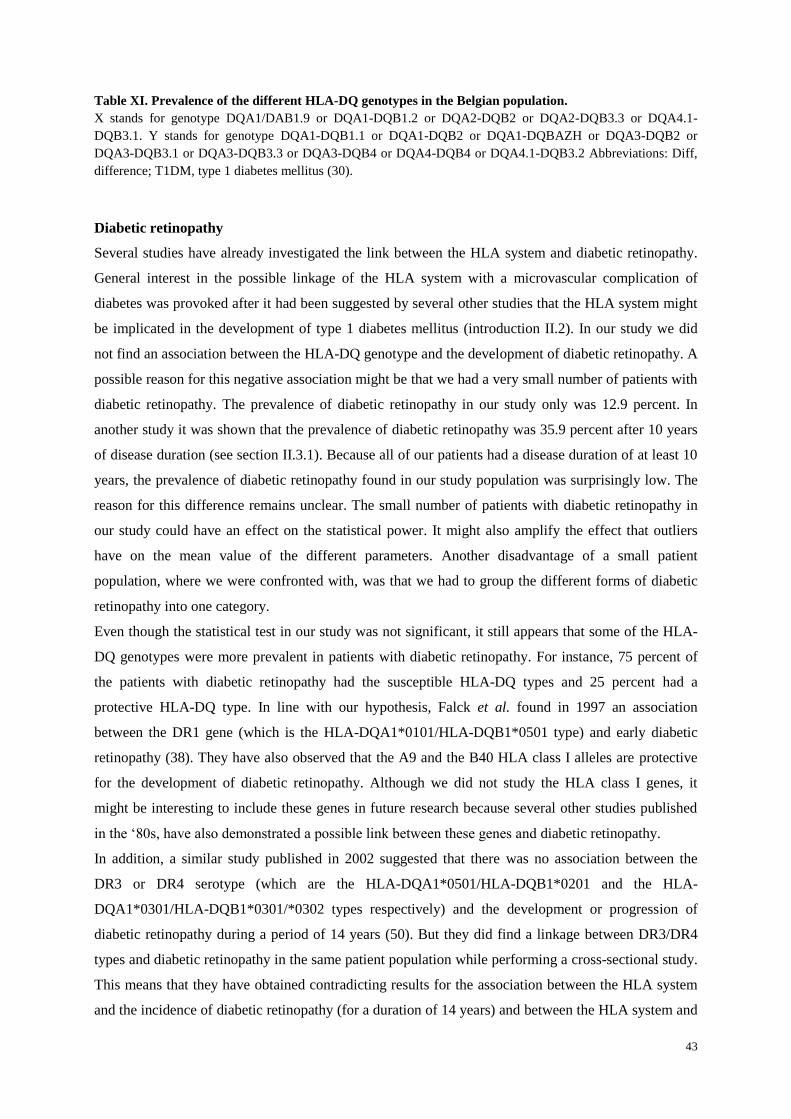
43
Table XI. Prevalence of the different HLA-DQ genotypes in the Belgian population.
X stands for genotype DQA1/DAB1.9 or DQA1-DQB1.2 or DQA2-DQB2 or DQA2-DQB3.3 or DQA4.1-
DQB3.1. Y stands for genotype DQA1-DQB1.1 or DQA1-DQB2 or DQA1-DQBAZH or DQA3-DQB2 or
DQA3-DQB3.1 or DQA3-DQB3.3 or DQA3-DQB4 or DQA4-DQB4 or DQA4.1-DQB3.2 Abbreviations: Diff,
difference; T1DM, type 1 diabetes mellitus (30).
Diabetic retinopathy
Several studies have already investigated the link between the HLA system and diabetic retinopathy.
General interest in the possible linkage of the HLA system with a microvascular complication of
diabetes was provoked after it had been suggested by several other studies that the HLA system might
be implicated in the development of type 1 diabetes mellitus (introduction II.2). In our study we did
not find an association between the HLA-DQ genotype and the development of diabetic retinopathy. A
possible reason for this negative association might be that we had a very small number of patients with
diabetic retinopathy. The prevalence of diabetic retinopathy in our study only was 12.9 percent. In
another study it was shown that the prevalence of diabetic retinopathy was 35.9 percent after 10 years
of disease duration (see section II.3.1). Because all of our patients had a disease duration of at least 10
years, the prevalence of diabetic retinopathy found in our study population was surprisingly low. The
reason for this difference remains unclear. The small number of patients with diabetic retinopathy in
our study could have an effect on the statistical power. It might also amplify the effect that outliers
have on the mean value of the different parameters. Another disadvantage of a small patient
population, where we were confronted with, was that we had to group the different forms of diabetic
retinopathy into one category.
Even though the statistical test in our study was not significant, it still appears that some of the HLA-
DQ genotypes were more prevalent in patients with diabetic retinopathy. For instance, 75 percent of
the patients with diabetic retinopathy had the susceptible HLA-DQ types and 25 percent had a
protective HLA-DQ type. In line with our hypothesis, Falck et al. found in 1997 an association
between the DR1 gene (which is the HLA-DQA1*0101/HLA-DQB1*0501 type) and early diabetic
retinopathy (38). They have also observed that the A9 and the B40 HLA class I alleles are protective
for the development of diabetic retinopathy. Although we did not study the HLA class I genes, it
might be interesting to include these genes in future research because several other studies published
in the ‘80s, have also demonstrated a possible link between these genes and diabetic retinopathy.
In addition, a similar study published in 2002 suggested that there was no association between the
DR3 or DR4 serotype (which are the HLA-DQA1*0501/HLA-DQB1*0201 and the HLA-
DQA1*0301/HLA-DQB1*0301/*0302 types respectively) and the development or progression of
diabetic retinopathy during a period of 14 years (50). But they did find a linkage between DR3/DR4
types and diabetic retinopathy in the same patient population while performing a cross-sectional study.
This means that they have obtained contradicting results for the association between the HLA system
and the incidence of diabetic retinopathy (for a duration of 14 years) and between the HLA system and

44
the prevalence of diabetic retinopathy (at the start of the study). Thus from this study, it appears that
the HLA system does not have a significant effect on the long term risk of developing diabetic
retinopathy, but that it rather has an important role during the first years of the disease duration. In
other words, the HLA system seems to exhibit a dominant effect on the pathogenesis of diabetic
retinopathy during the first years, when the modifiable factors are not yet present very long. These
modifiable factors, such as hypertension and hyperglycemia, become more dominant in the later stages
of the disease. This might also explain why most cross-sectional studies find a linkage between the
HLA system and the risk of developing diabetic retinopathy and why most prospective studies do not.
However and in strong contrast with a possible positive association, Jensen and coworkers have
recently refuted the link between the HLA class II system and diabetic retinopathy (51). A strength of
this study was a bigger patient population that enabled them to perform a multivariate analysis on their
patients’ database. Because the statistical power of the analysis is dependent on the size of the patient
population, it might implicate that their results are more reliable than ours.
The previous studies here discussed, explored more or less a similar hypothesis as we did, i.e. the
linkage between the HLA system and the development of diabetic retinopathy. Nevertheless, there are
many other studies that researched a variation of this hypothesis. For instance, the investigation of the
linkage between the HLA system and the severity of diabetic retinopathy. In 2009, Khazee and
colleagues investigated if there were differences between the HLA-DQB1 types in patients with
diabetic retinopathy after 20 years of disease duration (normal clinical course) and in patients without
diabetic retinopathy after 20 years of disease duration (postponed group). They have found that
patients with the normal course had a higher prevalence of the HLA-DQB1*0201/*0501 and the HLA-
DQB1*0201/*0504 types than the patients within the postponed course group (52). Another study
investigated the association between the HLA-DR and HLA-DQ types and the severity of diabetic
retinopathy. They found no association and suggested that the HLA-DQ and HLA-DR types do not
influence the severity of diabetic retinopathy (53). A possible association between the HLA class I and
class II and proliferative diabetic retinopathy was studied by Mimura and coworkers. Besides finding a
plausible link between proliferative diabetic retinopathy and the HLAB62, Cw4 and DQ4 serotypes,
they have excluded a positive association between proliferative retinopathy and the DR4 serotype (54).
As a result, they proposed that the HLAB62, Cw4 and DQ4 serotypes are prognostic factors for the
development of proliferative diabetic retinopathy.
Taken together, it has been suggested that certain types of HLA are responsible for the development of
DR together with its different types of progression (53, 54). Linking the different HLA types to
diabetic retinopathy is a fascinating insight, because this can help us to predict which patients have a
higher risk to develop diabetic retinopathy and which patients have a change to develop a more severe
form of diabetic retinopathy. As a consequence, the patients can be screened more frequently for signs
of diabetic retinopathy. These patients should also strive to a more strict control of the known
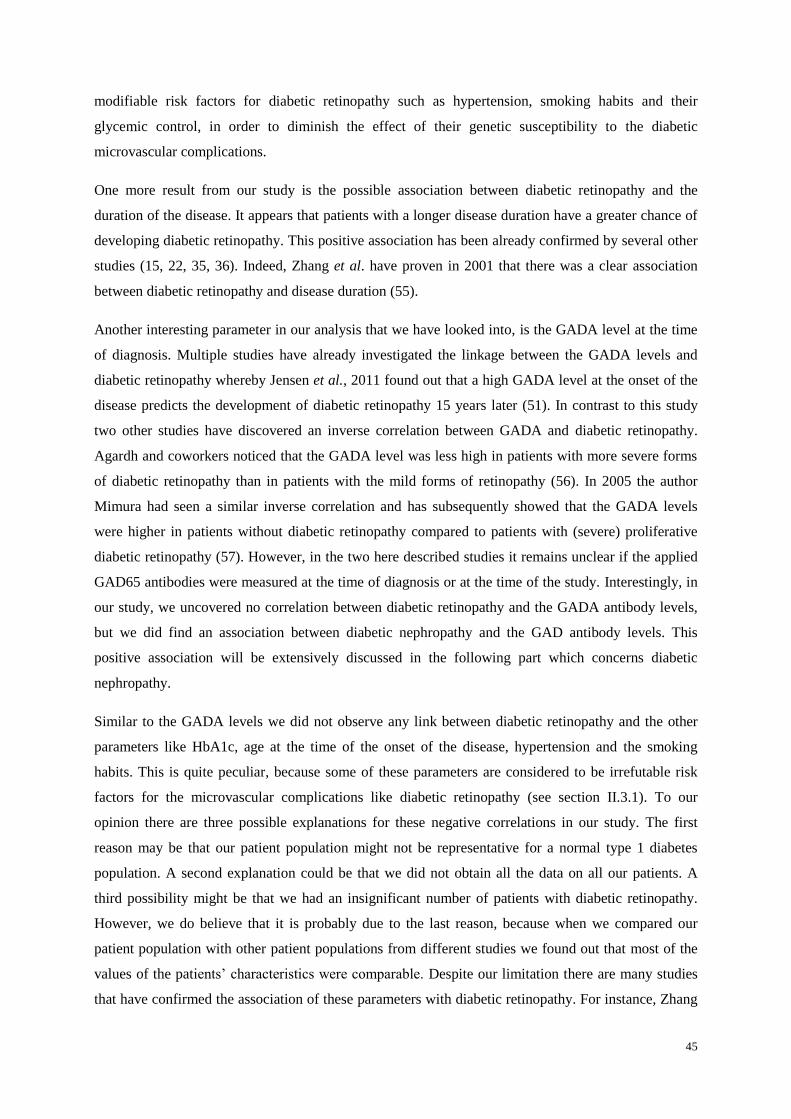
45
modifiable risk factors for diabetic retinopathy such as hypertension, smoking habits and their
glycemic control, in order to diminish the effect of their genetic susceptibility to the diabetic
microvascular complications.
One more result from our study is the possible association between diabetic retinopathy and the
duration of the disease. It appears that patients with a longer disease duration have a greater chance of
developing diabetic retinopathy. This positive association has been already confirmed by several other
studies (15, 22, 35, 36). Indeed, Zhang et al. have proven in 2001 that there was a clear association
between diabetic retinopathy and disease duration (55).
Another interesting parameter in our analysis that we have looked into, is the GADA level at the time
of diagnosis. Multiple studies have already investigated the linkage between the GADA levels and
diabetic retinopathy whereby Jensen et al., 2011 found out that a high GADA level at the onset of the
disease predicts the development of diabetic retinopathy 15 years later (51). In contrast to this study
two other studies have discovered an inverse correlation between GADA and diabetic retinopathy.
Agardh and coworkers noticed that the GADA level was less high in patients with more severe forms
of diabetic retinopathy than in patients with the mild forms of retinopathy (56). In 2005 the author
Mimura had seen a similar inverse correlation and has subsequently showed that the GADA levels
were higher in patients without diabetic retinopathy compared to patients with (severe) proliferative
diabetic retinopathy (57). However, in the two here described studies it remains unclear if the applied
GAD65 antibodies were measured at the time of diagnosis or at the time of the study. Interestingly, in
our study, we uncovered no correlation between diabetic retinopathy and the GADA antibody levels,
but we did find an association between diabetic nephropathy and the GAD antibody levels. This
positive association will be extensively discussed in the following part which concerns diabetic
nephropathy.
Similar to the GADA levels we did not observe any link between diabetic retinopathy and the other
parameters like HbA1c, age at the time of the onset of the disease, hypertension and the smoking
habits. This is quite peculiar, because some of these parameters are considered to be irrefutable risk
factors for the microvascular complications like diabetic retinopathy (see section II.3.1). To our
opinion there are three possible explanations for these negative correlations in our study. The first
reason may be that our patient population might not be representative for a normal type 1 diabetes
population. A second explanation could be that we did not obtain all the data on all our patients. A
third possibility might be that we had an insignificant number of patients with diabetic retinopathy.
However, we do believe that it is probably due to the last reason, because when we compared our
patient population with other patient populations from different studies we found out that most of the
values of the patients’ characteristics were comparable. Despite our limitation there are many studies
that have confirmed the association of these parameters with diabetic retinopathy. For instance, Zhang

46
et al. unraveled an association between the metabolic control and diabetic retinopathy. It seemed that
the BMI and the HbA1c level at the onset of the disease had also an influence on the development of
diabetic retinopathy (55). Gray et al. discovered an association between diabetic retinopathy and the
HbA1c levels and the smoking habits (58). Another study suggested that the development of diabetic
retinopathy is related to hyperglycemia, high blood pressure, lipid abnormalities and the smoking
habits (59). Also a linkage between diabetic retinopathy and the creatinin level was suggested by
Agardh et al. We could not confirm this association, but we did observe an elevation of the creatinin
levels in patients with diabetic retinopathy. Unfortunately, the difference in creatinin levels was not
significant (see part IV.1) (53). Furthermore, it has been proposed in the Wisconsin study that the
progression risk of diabetic retinopathy is not only increased in males, but also in patients with a
higher mean HbA1c value and in patients with hypertension (60).
Diabetic nephropathy
Although the heritability and familial clustering of diabetic nephropathy have been already thoroughly
studied and confirmed, not many studies have considered the association between HLA-DQ and the
prevalence of diabetic nephropathy. As part of our hypothesis and similar to our work for diabetic
retinopathy, we have tried to find a possible association between diabetic nephropathy and the HLA-
DQ genotype as well. Having done the appropriate analytical tests, we were not able to confirm this
association. We wondered that this might be due to the small number of patients (i.e. only five patients)
with diabetic nephropathy in our study. As we mentioned in the discussion part of diabetic retinopathy,
there are several reasons why a small patient number has an influence on the results. Similar to what
we have concluded for diabetic retinopathy, we probably do not have a sufficient patient number to
undeniably accept or decline our hypothesis.
Thus in our population, 5 patients had diabetic nephropathy whereof three patients contained the
HLA-DQ genotypes corresponding with the high susceptibility genes for T1DM and two patients
contained the neutral or rare HLA-DQ genotypes. The five encountered HLA-DQ genotypes were the
DQA1-DQB1.1/DQA3-DQB3.2 genotype (susceptible genotype), the DQA2-DQB2/DQA3-DQB3.2
genotype (neutral or rare genotype), the DQA3-DQB3.2/DQA4-DQB2 genotype (susceptible
genotype), the DQA3-DQB3.2/DQA4-DQB3.1 genotype (neutral or rare genotype) and the DQA4-
DQB2/DQA4-DQB2 genotype (susceptible genotype). Ronningen et al. found a similar negative
result for the relationship the HLA class II system and diabetic nephropathy. They have also included
the INS gene (insulin gene) in their analysis but failed in finding an association with diabetic
nephropathy (61). The study of Ronningen et al. together with our study have investigated the
association between diabetic nephropathy and the HLA class II, whereas Chowdhury et al. studied the
linkage between diabetic nephropathy and the HLA class I genotypes. Also their study could not show
any significant association between the HLA-A, -B and –C alleles and diabetic nephropathy (47).
However, in another study where they have focused on the HLA-DQ and DRB1 alleles they did find

47
an association. In that particular study they have proven a linkage between the HLA-DRB1*04
haplotype and diabetic nephropathy. It appears that this haplotype is inversely related with the
development of diabetic nephropathy for both the short and the long duration (39). In the present study
we did not look into the HLA class I genes or the HLA-DRB1 genes, but it might be interesting to
include this in the future. Only then, the risk stratification of the whole HLA system could be made.
Taken together, the role of the HLA system in the development of diabetic nephropathy has not been
established in our study. The few studies dealing with this same hypothesis have as well declined any
association between the HLA system and diabetic nephropathy. We could only find one study that has
found an association and they have suggested a protective role for one of the HLA-DRB1 genes.
The only parameter that we could positively link to diabetic nephropathy was the GADA level, which
was measured by the GADA levels in the blood stream (p=0.021). Like we have mentioned earlier,
this association was not the case for diabetic retinopathy in our study. Because our study contained in
total five patients with diabetic nephropathy whereof only for four patients was the GADA level
available, we are aware that outliers could have an indisputable effect on the mean values of the
GADA level. Despite the limited amount of data, we are positive about this trend between the GADA
level and diabetic nephropathy. Our suggested association remains very speculative, because a study
performed by Roll et al. refuted this association because they did not find an association between the
antibodies directed to GAD and the development of nephropathy in patients with T1DM (62).
Another study confirms the findings of Roll et al., they did not find an association between diabetic
nephropathy and the GADA level. However, it is remarkable that they did find twice as much patients
with GADA positivity in the diabetic nephropathy group, compared to patients without diabetic
nephropathy (63).
Although most studies disagree on the existence of a linkage between diabetic nephropathy and the
GADA level, our data contradicts with these observations and suggest a possible link. It would be
interesting to expand the number of patients participating in our study in order to check if this linkage
remains significant when more patients with diabetic nephropathy are analyzed.
Analogous to our results concerning diabetic retinopathy, we did not discover any significant result for
any of the other included parameters and diabetic nephropathy. This finding contradicts with the
results found in the literature whereby the role of some of these parameters in the development of
diabetic nephropathy has yet been well documented (see section II.3.2). One study that researched the
possible risk factors for diabetic nephropathy in a population of 27805 children has suggested that the
main risk factors involved in the development of diabetic nephropathy were disease duration, the
glycated hemoglobin level, dyslipidemia, the blood pressure and the male gender (64). In contrast,
Chowdhury et al. did not only find no association between diabetic nephropathy and the glycated
hemoglobin level and the disease duration but also for the age of the patients, the serum cholesterol
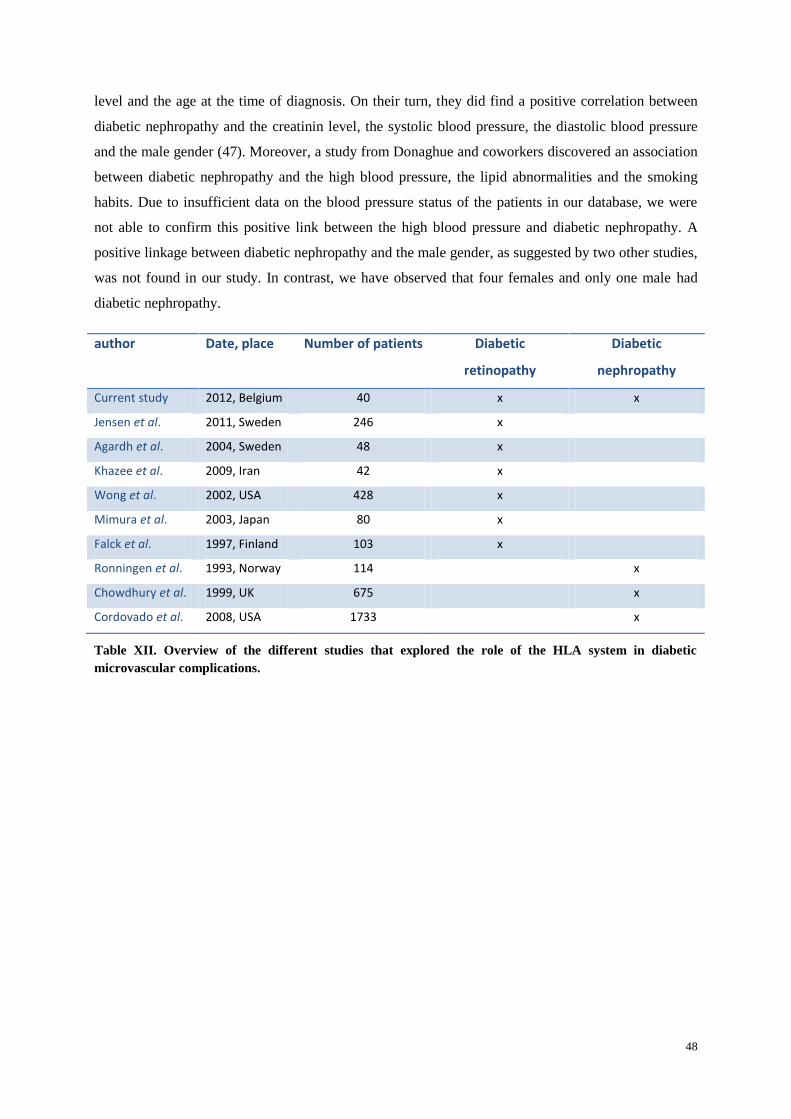
48
level and the age at the time of diagnosis. On their turn, they did find a positive correlation between
diabetic nephropathy and the creatinin level, the systolic blood pressure, the diastolic blood pressure
and the male gender (47). Moreover, a study from Donaghue and coworkers discovered an association
between diabetic nephropathy and the high blood pressure, the lipid abnormalities and the smoking
habits. Due to insufficient data on the blood pressure status of the patients in our database, we were
not able to confirm this positive link between the high blood pressure and diabetic nephropathy. A
positive linkage between diabetic nephropathy and the male gender, as suggested by two other studies,
was not found in our study. In contrast, we have observed that four females and only one male had
diabetic nephropathy.
author Date, place Number of patients Diabetic
retinopathy
Diabetic
nephropathy
Current study 2012, Belgium 40 x x
Jensen et al. 2011, Sweden 246 x
Agardh et al. 2004, Sweden 48 x
Khazee et al. 2009, Iran 42 x
Wong et al. 2002, USA 428 x
Mimura et al. 2003, Japan 80 x
Falck et al. 1997, Finland 103 x
Ronningen et al. 1993, Norway 114 x
Chowdhury et al. 1999, UK 675 x
Cordovado et al. 2008, USA 1733 x
Table XII. Overview of the different studies that explored the role of the HLA system in diabetic
microvascular complications.

49
General conclusion and perspectives
After an extensive analysis, we were not able to discover an association between diabetic retinopathy
and diabetic nephropathy with the HLA-DQ genotypes. Although it was not our primary objective, we
did find a possible link between diabetic retinopathy and the disease duration and between diabetic
nephropathy and the GADA levels at the time of diagnosis. Because we were confronted with the
difficulty of recruiting patients, we were obliged to work with a relative small patient population. As a
consequence of this limited population, we speculated that in our statistical test together with our
results might not be very reliable. However, we do believe that despite this drawback we were able to
point out certain tendencies which make an ideal basis for further research.
In order to solve this problem we suggest recruiting more patients by changing the recruitment form of
future patients. For instance, the change can be obtained by the request of signing an informed consent
during the first visit which allows the participation of the patients in all future anonymous studies in
the hospital. With this type of recruitment form it would be easier to carry out a cohort study whereby
the evolution of the disease can be nicely followed over time. With a cohort study it is possible to
determine in which period of time the different factors influence the development of the diabetic
complications. We would be able to confirm our suggestion concerning the alternating importance of
the HLA-DQ type and the modifiable factors in the development of diabetic retinopathy. We also
believe that it may be interesting to evaluate the HbA1c level and the autoantibody levels during the
whole disease duration, again this is more easily done with a cohort study.
In conclusion, additional studies are needed to unravel the possible involvement of the HLA-DQ type
in the pathogenesis of diabetic microvascular complications. A comprehensive view on the
pathogenesis of diabetic microvascular complications in the near future would be beneficial for the
screening and prevention of these microvascular complications of type 1 diabetes mellitus.
50
VI. REFRENCES
1. Gorus FK, Weets I, Couck P, Pipeleers DG, Belgian Diabetes R. Epidemiology of type 1 and
type 2 diabetes. The added value of diabetes registries for conducting clinical studies: the Belgian
paradigm. Acta clinica Belgica. 2004;59(1):1-13.
2. Craig ME, Hattersley A, Donaghue KC. Definition, epidemiology and classification of
diabetes in children and adolescents. Pediatric diabetes. 2009;10 Suppl 12:3-12.
3. Cerna M. Genetics of autoimmune diabetes mellitus. Wiener medizinische Wochenschrift.
2008;158(1-2):2-12.
4. Group DP. Incidence and trends of childhood Type 1 diabetes worldwide 1990-1999. Diabetic
medicine : a journal of the British Diabetic Association. 2006;23(8):857-66. Epub 2006/08/17.
5. Daneman D. Type 1 diabetes. Lancet. 2006;367(9513):847-58.
6. Steck AK, Rewers MJ. Genetics of type 1 diabetes. Clinical chemistry. 2011;57(2):176-85.
7. Bluestone JA, Herold K, Eisenbarth G. Genetics, pathogenesis and clinical interventions in
type 1 diabetes. Nature. 2010;464(7293):1293-300.
8. Gale EA, Gillespie KM. Diabetes and gender. Diabetologia. 2001;44(1):3-15. Epub
2001/02/24.
9. Vandewalle CL, Coeckelberghs MI, De Leeuw IH, Du Caju MV, Schuit FC, Pipeleers DG, et
al. Epidemiology, clinical aspects, and biology of IDDM patients under age 40 years. Comparison of
data from Antwerp with complete ascertainment with data from Belgium with 40% ascertainment. The
Belgian Diabetes Registry. Diabetes care. 1997;20(10):1556-61.
10. Heras P, Mantzioros M, Mendrinos D, Heras V, Hatzopoulos A, Xourafas V, et al.
Autoantibodies in type 1 diabetes. Diabetes research and clinical practice. 2010;90(2):e40-2.
11. Gorodezky C, Alaez C, Murguia A, Rodriguez A, Balladares S, Vazquez M, et al. HLA and
autoimmune diseases: Type 1 diabetes (T1D) as an example. Autoimmunity reviews. 2006;5(3):187-
94.
12. Ziegler AG, Nepom GT. Prediction and pathogenesis in type 1 diabetes. Immunity.
2010;32(4):468-78.
13. Epidemiology of Diabetes Interventions and Complications (EDIC). Design, implementation,
and preliminary results of a long-term follow-up of the Diabetes Control and Complications Trial
cohort. Diabetes care. 1999;22(1):99-111.
14. Vithian K, Hurel S. Microvascular complications: pathophysiology and management. Clinical
medicine. 2010;10(5):505-9.
15. Hietala K, Forsblom C, Summanen P, Groop PH, FinnDiane Study G. Heritability of
proliferative diabetic retinopathy. Diabetes. 2008;57(8):2176-80.
16. Cheung N, Mitchell P, Wong TY. Diabetic retinopathy. Lancet. 2010;376(9735):124-36.
51
17. Jesic M, Sajic S, Kostic M, Peco-Antic A, Vujnovic Z, Necic S. Microalbuminuria in relation
to metabolic control and blood pressure in adolescents with type 1 diabetes. Archives of medical
science : AMS. 2011;7(6):1037-41.
18. Karamanos B, Porta M, Songini M, Metelko Z, Kerenyi Z, Tamas G, et al. Different risk
factors of microangiopathy in patients with type I diabetes mellitus of short versus long duration. The
EURODIAB IDDM Complications Study. Diabetologia. 2000;43(3):348-55.
19. Krolewski AS, Warram JH, Christlieb AR, Busick EJ, Kahn CR. The changing natural history
of nephropathy in type I diabetes. The American journal of medicine. 1985;78(5):785-94.
20. Finne P, Reunanen A, Stenman S, Groop PH, Gronhagen-Riska C. Incidence of end-stage
renal disease in patients with type 1 diabetes. JAMA : the journal of the American Medical
Association. 2005;294(14):1782-7.
21. Jacobsen P, Rossing K, Tarnow L, Rossing P, Mallet C, Poirier O, et al. Progression of
diabetic nephropathy in normotensive type 1 diabetic patients. Kidney international Supplement.
1999;71:S101-5.
22. Arar NH, Freedman BI, Adler SG, Iyengar SK, Chew EY, Davis MD, et al. Heritability of the
severity of diabetic retinopathy: the FIND-Eye study. Investigative ophthalmology & visual science.
2008;49(9):3839-45.
23. Mollsten A, Svensson M, Waernbaum I, Berhan Y, Schon S, Nystrom L, et al. Cumulative
risk, age at onset, and sex-specific differences for developing end-stage renal disease in young patients
with type 1 diabetes: a nationwide population-based cohort study. Diabetes. 2010;59(7):1803-8.
24. Orchard TJ, Dorman JS, Maser RE, Becker DJ, Drash AL, Ellis D, et al. Prevalence of
complications in IDDM by sex and duration. Pittsburgh Epidemiology of Diabetes Complications
Study II. Diabetes. 1990;39(9):1116-24.
25. Noble JA, Erlich HA. Genetics of type 1 diabetes. Cold Spring Harbor perspectives in
medicine. 2012;2(1):a007732.
26. Parham P. The immune system: New York : Garland Science, c2005.
27. Balducci-Silano PL, Layrisse ZE. HLA-DP and susceptibility to insulin-dependent diabetes
mellitus in an ethnically mixed population. Associations with other HLA-alleles. Journal of
autoimmunity. 1995;8(3):425-37.
28. Erlich H, Valdes AM, Noble J, Carlson JA, Varney M, Concannon P, et al. HLA DR-DQ
haplotypes and genotypes and type 1 diabetes risk: analysis of the type 1 diabetes genetics consortium
families. Diabetes. 2008;57(4):1084-92.
29. Weets I. Etiological and phenotypical heterogeneity of diabetes presenting before age 40
according to demographic and biological parameters: variable contribution of genetic and external
accelerators: Vrije Universiteit Brussel; 2004.
30. Van der Auwera BJ, Schuit FC, Weets I, Ivens A, Van Autreve JE, Gorus FK, et al. Relative
and absolute HLA-DQA1-DQB1 linked risk for developing type I diabetes before 40 years of age in
52
the Belgian population: implications for future prevention studies. Human immunology.
2002;63(1):40-50.
31. Priem HA. Diabetes mellitus and the eye. Acta clinica Belgica. 2004;59(5):237-40.
32. Bunce C, Xing W, Wormald R. Causes of blind and partial sight certifications in England and
Wales: April 2007-March 2008. Eye. 2010;24(11):1692-9.
33. Romero-Aroca P, Baget-Bernaldiz M, Fernandez-Ballart J, Plana-Gil N, Soler-Lluis N,
Mendez-Marin I, et al. Ten-year incidence of diabetic retinopathy and macular edema. Risk factors in
a sample of people with type 1 diabetes. Diabetes research and clinical practice. 2011;94(1):126-32.
34. Bain SC, Gill GV, Dyer PH, Jones AF, Murphy M, Jones KE, et al. Characteristics of Type 1
diabetes of over 50 years duration (the Golden Years Cohort). Diabetic medicine : a journal of the
British Diabetic Association. 2003;20(10):808-11.
35. Grauslund J, Green A, Kawasaki R, Hodgson L, Sjolie AK, Wong TY. Retinal vascular
fractals and microvascular and macrovascular complications in type 1 diabetes. Ophthalmology.
2010;117(7):1400-5.
36. Radha V, Rema M, Mohan V. Genes and diabetic retinopathy. Indian journal of
ophthalmology. 2002;50(1):5-11.
37. Looker HC, Nelson RG, Chew E, Klein R, Klein BE, Knowler WC, et al. Genome-wide
linkage analyses to identify Loci for diabetic retinopathy. Diabetes. 2007;56(4):1160-6.
38. Falck AA, Knip JM, Ilonen JS, Laatikainen LT. Genetic markers in early diabetic retinopathy
of adolescents with type I diabetes. Journal of diabetes and its complications. 1997;11(4):203-7.
39. Cordovado SK, Zhao Y, Warram JH, Gong H, Anderson KL, Hendrix MM, et al.
Nephropathy in type 1 diabetes is diminished in carriers of HLA-DRB1*04: the genetics of kidneys in
diabetes (GoKinD) study. Diabetes. 2008;57(2):518-22.
40. Brenner B.M. RFC. Brenner and Rector's the kidney Philadelphia : Saunders Elsevier, c2008.
41. Bohle A, Wehrmann M, Bogenschutz O, Batz C, Muller CA, Muller GA. The pathogenesis of
chronic renal failure in diabetic nephropathy. Investigation of 488 cases of diabetic glomerulosclerosis.
Pathology, research and practice. 1991;187(2-3):251-9.
42. Kanwar YS, Wada J, Sun L, Xie P, Wallner EI, Chen S, et al. Diabetic nephropathy:
mechanisms of renal disease progression. Experimental biology and medicine. 2008;233(1):4-11.
43. Freedman BI, Bostrom M, Daeihagh P, Bowden DW. Genetic factors in diabetic nephropathy.
Clinical journal of the American Society of Nephrology : CJASN. 2007;2(6):1306-16.
44. Ntemka A, Iliadis F, Papanikolaou N, Grekas D. Network-centric Analysis of Genetic
Predisposition in Diabetic Nephropathy. Hippokratia. 2011;15(3):232-7.
45. Tanaka N, Babazono T. Assessing genetic susceptibility to diabetic nephropathy. Nephrology.
2005;10 Suppl:S17-21.

53
46. Yamauchi T, Kamon J, Waki H, Terauchi Y, Kubota N, Hara K, et al. The fat-derived
hormone adiponectin reverses insulin resistance associated with both lipoatrophy and obesity. Nature
medicine. 2001;7(8):941-6.
47. Chowdhury TA, Dyer PH, Mijovic CH, Dunger DB, Barnett AH, Bain SC. Human leucocyte
antigen and insulin gene regions and nephropathy in type I diabetes. Diabetologia. 1999;42(8):1017-20.
48. Heimberg H, Nagy ZP, Somers G, De Leeuw I, Schuit FC. Complementation of HLA-DQA
and -DQB genes confers susceptibility and protection to insulin-dependent diabetes mellitus. Human
immunology. 1992;33(1):10-7.
49. Decochez K, Keymeulen B, Somers G, Dorchy H, De Leeuw IH, Mathieu C, et al. Use of an
islet cell antibody assay to identify type 1 diabetic patients with rapid decrease in C-peptide levels
after clinical onset. Belgian Diabetes Registry. Diabetes care. 2000;23(8):1072-8.
50. Wong TY, Cruickshank KJ, Klein R, Klein BE, Moss SE, Palta M, et al. HLA-DR3 and DR4
and their relation to the incidence and progression of diabetic retinopathy. Ophthalmology.
2002;109(2):275-81.
51. Jensen RA, Agardh E, Lernmark A, Gudbjornsdottir S, Smith NL, Siscovick DS, et al. HLA
genes, islet autoantibodies and residual C-peptide at the clinical onset of type 1 diabetes mellitus and
the risk of retinopathy 15 years later. PloS one. 2011;6(3):e17569.
52. Khazaee MH, Tavakol Afshari J, Khazaee B, Daneshvar R, Akbarzadeh J, Khazaee L, et al.
HLA-DQB1 subtypes predict diabetic retinopathy in patients with type I diabetes mellitus. European
journal of ophthalmology. 2009;19(4):638-45.
53. Agardh E, Gaur LK, Lernmark A, Agardh CD. HLA-DRB1, -DQA1, and -DQB1 subtypes or
ACE gene polymorphisms do not seem to be risk markers for severe retinopathy in younger Type 1
diabetic patients. Journal of diabetes and its complications. 2004;18(1):32-6.
54. Mimura T, Funatsu H, Uchigata Y, Kitano S, Noma H, Shimizu E, et al. Relationship between
human leukocyte antigen status and proliferative diabetic retinopathy in patients with younger-onset
type 1 diabetes mellitus. American journal of ophthalmology. 2003;135(6):844-8.
55. Zhang L, Krzentowski G, Albert A, Lefebvre PJ. Risk of developing retinopathy in Diabetes
Control and Complications Trial type 1 diabetic patients with good or poor metabolic control.
Diabetes care. 2001;24(7):1275-9.
56. Agardh D, Agardh E, Landin-Olsson M, Gaur LK, Agardh CD, Lernmark A. Inverse
relationship between GAD65 antibody levels and severe retinopathy in younger type 1 diabetic
patients. Diabetes research and clinical practice. 1998;40(1):9-14.
57. Mimura T, Funatsu H, Uchigata Y, Kitano S, Shimizu E, Amano S, et al. Glutamic acid
decarboxylase autoantibody prevalence and association with HLA genotype in patients with younger-
onset type 1 diabetes and proliferative diabetic retinopathy. Ophthalmology. 2005;112(11):1904-9.
54
58. Gray RS, Starkey IR, Rainbow S, Kurtz AB, Abdel-Khalik A, Urbaniak S, et al. HLA antigens
and other risk factors in the development of retinopathy in type 1 diabetes. The British journal of
ophthalmology. 1982;66(5):280-5.
59. Donaghue KC, Chiarelli F, Trotta D, Allgrove J, Dahl-Jorgensen K. Microvascular and
macrovascular complications associated with diabetes in children and adolescents. Pediatric diabetes.
2009;10 Suppl 12:195-203.
60. Klein R, Klein BE, Moss SE. The Wisconsin epidemiological study of diabetic retinopathy: a
review. Diabetes/metabolism reviews. 1989;5(7):559-70.
61. Ronningen KS, Bangstad HJ, Undlien DE, Thorsby E. Influence of genetic factors (HLA class
II genes, insulin-gene region polymorphisms) and metabolic control on the development of diabetic
nephropathy. Diabetes research. 1993;23(1):31-40.
62. Roll U, Nuber A, Schroder A, Gerlach E, Janka HU, Ziegler AG. No association of antibodies
to glutamic acid decarboxylase and diabetic complications in patients with IDDM. Diabetes care.
1995;18(2):210-5.
63. Ko GT, Cockram CS, Critchley JA, Lau MS, Chan JC. No relationship between antibodies to
GAD and microangiopathic complications in young Chinese diabetic patients. Diabetes care.
2000;23(7):1045-6.
64. Raile K, Galler A, Hofer S, Herbst A, Dunstheimer D, Busch P, et al. Diabetic nephropathy in
27,805 children, adolescents, and adults with type 1 diabetes: effect of diabetes duration, A1C,
hypertension, dyslipidemia, diabetes onset, and sex. Diabetes care. 2007;30(10):2523-8.
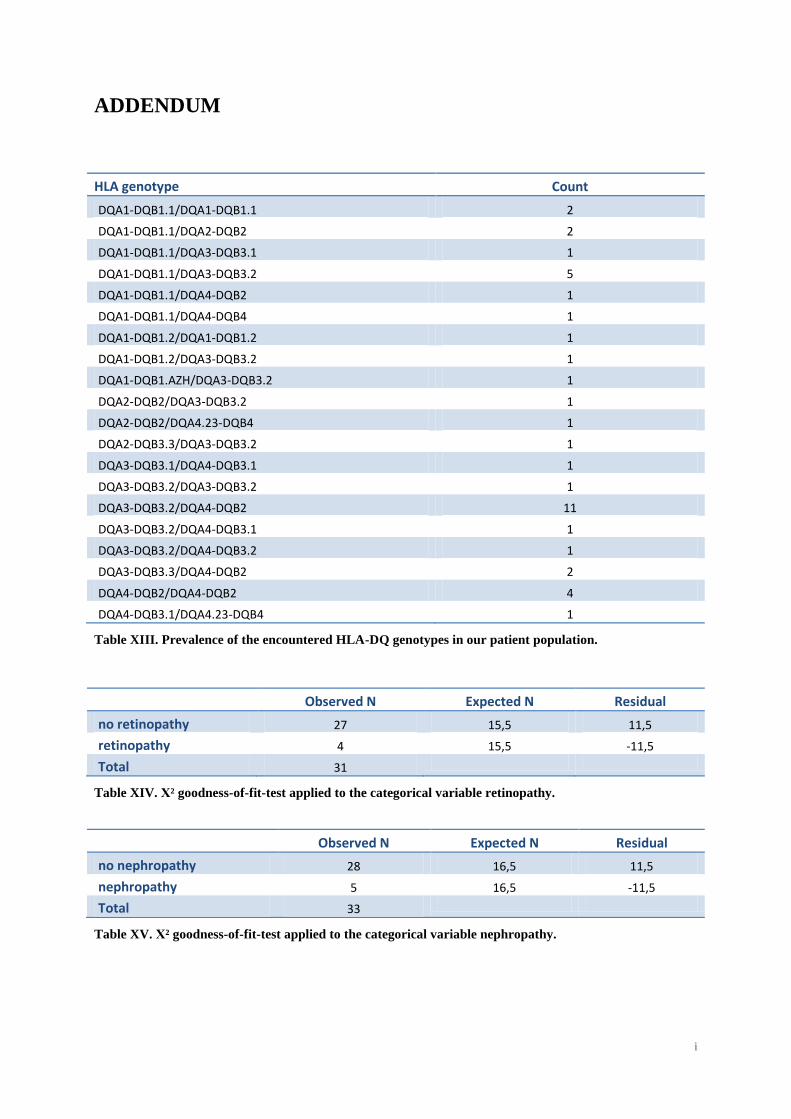
i
ADDENDUM
HLA genotype Count
DQA1-DQB1.1/DQA1-DQB1.1 2
DQA1-DQB1.1/DQA2-DQB2 2
DQA1-DQB1.1/DQA3-DQB3.1 1
DQA1-DQB1.1/DQA3-DQB3.2 5
DQA1-DQB1.1/DQA4-DQB2 1
DQA1-DQB1.1/DQA4-DQB4 1
DQA1-DQB1.2/DQA1-DQB1.2 1
DQA1-DQB1.2/DQA3-DQB3.2 1
DQA1-DQB1.AZH/DQA3-DQB3.2 1
DQA2-DQB2/DQA3-DQB3.2 1
DQA2-DQB2/DQA4.23-DQB4 1
DQA2-DQB3.3/DQA3-DQB3.2 1
DQA3-DQB3.1/DQA4-DQB3.1 1
DQA3-DQB3.2/DQA3-DQB3.2 1
DQA3-DQB3.2/DQA4-DQB2 11
DQA3-DQB3.2/DQA4-DQB3.1 1
DQA3-DQB3.2/DQA4-DQB3.2 1
DQA3-DQB3.3/DQA4-DQB2 2
DQA4-DQB2/DQA4-DQB2 4
DQA4-DQB3.1/DQA4.23-DQB4 1
Table XIII. Prevalence of the encountered HLA-DQ genotypes in our patient population.
Observed N Expected N Residual
no retinopathy 27 15,5 11,5
retinopathy 4 15,5 -11,5
Total 31
Table XIV. Χ² goodness-of-fit-test applied to the categorical variable retinopathy.
Observed N Expected N Residual
no nephropathy 28 16,5 11,5
nephropathy 5 16,5 -11,5
Total 33
Table XV. Χ² goodness-of-fit-test applied to the categorical variable nephropathy.
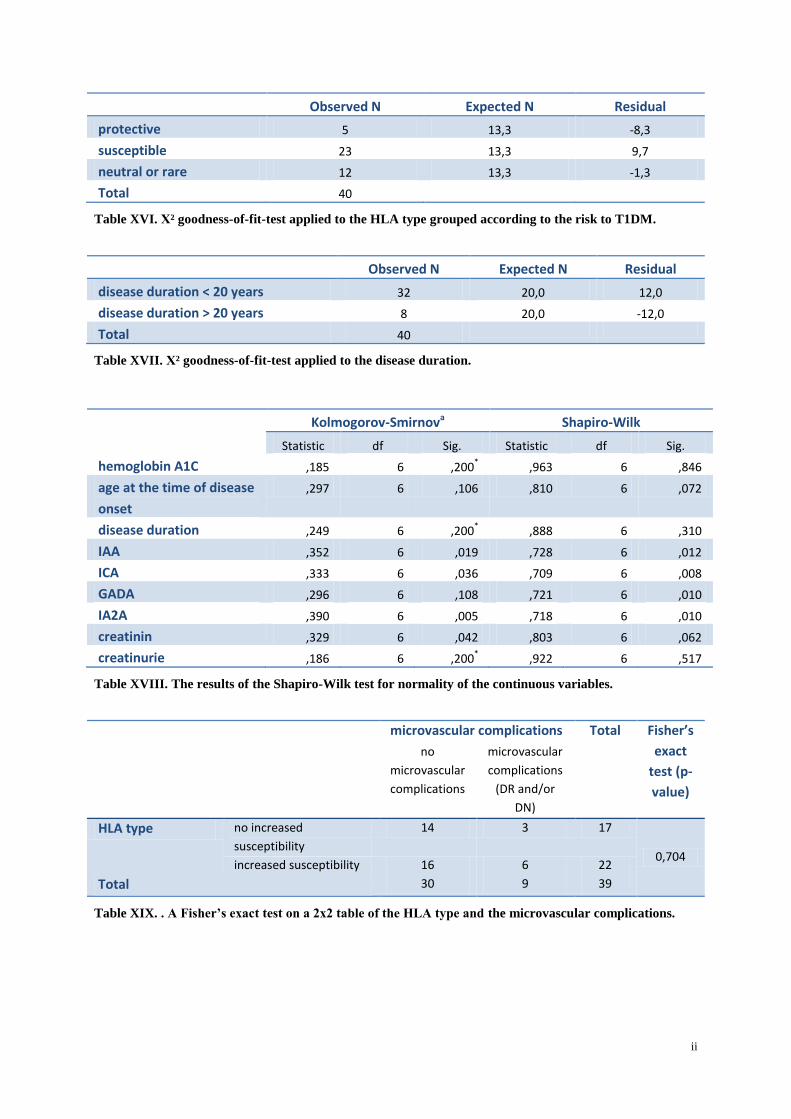
ii
Observed N Expected N Residual
protective 5 13,3 -8,3
susceptible 23 13,3 9,7
neutral or rare 12 13,3 -1,3
Total 40
Table XVI. Χ² goodness-of-fit-test applied to the HLA type grouped according to the risk to T1DM.
Observed N Expected N Residual
disease duration < 20 years 32 20,0 12,0
disease duration > 20 years 8 20,0 -12,0
Total 40
Table XVII. Χ² goodness-of-fit-test applied to the disease duration.
Kolmogorov-Smirnova Shapiro-Wilk
Statistic df Sig. Statistic df Sig.
hemoglobin A1C ,185 6 ,200* ,963 6 ,846
age at the time of disease
onset
,297 6 ,106 ,810 6 ,072
disease duration ,249 6 ,200* ,888 6 ,310
IAA ,352 6 ,019 ,728 6 ,012
ICA ,333 6 ,036 ,709 6 ,008
GADA ,296 6 ,108 ,721 6 ,010
IA2A ,390 6 ,005 ,718 6 ,010
creatinin ,329 6 ,042 ,803 6 ,062
creatinurie ,186 6 ,200* ,922 6 ,517
Table XVIII. The results of the Shapiro-Wilk test for normality of the continuous variables.
microvascular complications Total Fisher’s
exact
test (p-
value)
no
microvascular
complications
microvascular
complications
(DR and/or
DN)
HLA type no increased
susceptibility
14 3 17
0,704 increased susceptibility 16 6 22
Total 30 9 39
Table XIX. . A Fisher’s exact test on a 2x2 table of the HLA type and the microvascular complications.

iii
microvascular complications Total Fisher’s
exact test
(p-value)
no microvascular
complications
microvascular
complications (DR
and/or DN)
gender male 17 2 19
0,127 female 13 7 20
Total 30 9 39
Table XX. A Fisher’s exact test on a 2x2 table of the gender and the microvascular complications.
microvascular complications Total Fisher’
s exact
test (p-
value)
no
microvascular
complications
microvascular
complications
(DR and/or DN)
blood pressure status normotension 12 2 14
0,350 hypertension 7 4 11
Total 19 6 25
Table XXI. A Fisher’s exact test on a 2x2 table of the blood pressure status and the microvascular
complications.
microvascular complications Total Fisher’s
exact
test (p-
value)
no microvascular
complications
microvascular
complications
(DR and/or DN)
smoking habits non smoker 12 2 14
0,549 smoker 4 2 6
Total 16 4 20
Table XXII. A Fisher’s exact test on a 2x2 table of the smoking habits and the microvascular
complications.
microvascular complications Total Fisher’s
exact test
(p-value)
no microvascular
complications
microvascular
complications (DR
and/or DN)
Disease
duration
< 20 years 27 5 32
0,037 > 20 years 3 4 7
Total 30 9 39
Table XXIII. A Fisher’s exact test on a 2x2 table of the disease duration and the microvascular
complications.

iv
microvascular complications
N Mean Rank
Sum of Ranks
Mann-Whitney U
test (p-value)
IAA no complications 27 17,72 478,50 complications 6 13,75 82,50 0,362 Total 33
ICA no complications 27 16,57 447,50 complications 6 18,92 113,50 0,580 Total 33
GADA no complications 27 15,15 409,00 complications 6 25,33 152,00 0,020 Total 33
IA2A no complications 27 16,59 448,00 complications 6 18,83 113,00 0,604 Total 33
hemoglobin A1C
no complications 25 17,80 445,00 complications 9 16,67 150,00 0,770 Total 34
Age at time of diagnosis
no complications 30 19,57 587,00 complications 9 21,44 193,00 0,665 Total 39
disease duration
no complications 30 18,93 568,00 complications 9 23,56 212,00 0,286 Total 39
creatinin no complications 25 17,02 425,50 complications 8 16,94 135,50 0,983 Total 33
albuminuria no complications 27 15,85 428,00 complications 8 25,25 202,00 0,007 Total 35
creatinurie no complications 16 11,63 186,00 complications 6 11,17 67,00 0,883 Total 22
Table XXIV. The results of the Mann-Whitney U test applied to the microvascular complication status
and the different continuous variables.
diabetic
retinopathy
N Mean Rank Sum of
Ranks
Mann-Whitney
U test (p-value)
hemoglobin A1C no retinopathy
retinopathy
Total
22
4
26
13,86
11,50
305,00
46,00
0,569
Onset of disease
(age)
no retinopathy 27 15,52 419,00
retinopathy 4 19,25 77,00
Total 31 0,444
disease duration no retinopathy 27 14,11 381,00
retinopathy 4 28,75 115,00
Total 31 0,003
IAA no retinopathy 24 14,06 337,50
retinopathy 2 6,75 13,50
Total 26 0,194
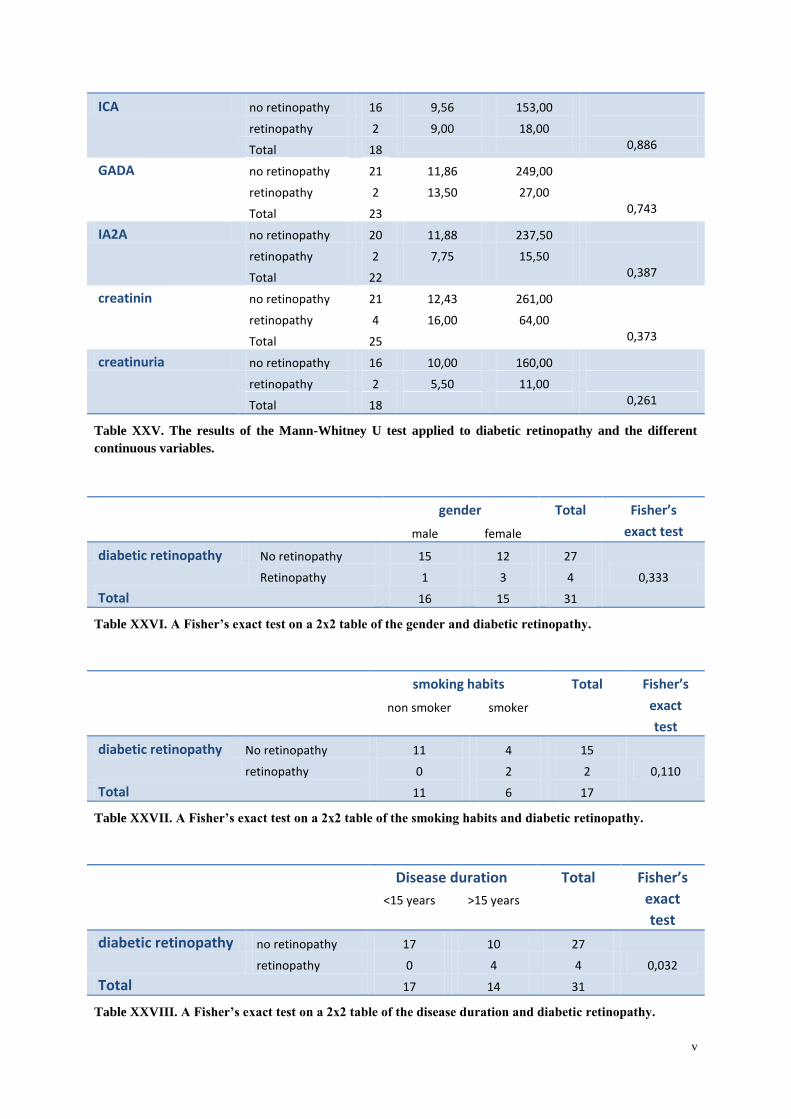
v
ICA no retinopathy 16 9,56 153,00
retinopathy 2 9,00 18,00
Total 18 0,886
GADA no retinopathy 21 11,86 249,00
retinopathy 2 13,50 27,00
Total 23 0,743
IA2A no retinopathy 20 11,88 237,50
retinopathy 2 7,75 15,50
Total 22 0,387
creatinin no retinopathy 21 12,43 261,00
retinopathy 4 16,00 64,00
Total 25 0,373
creatinuria no retinopathy 16 10,00 160,00
retinopathy 2 5,50 11,00
Total 18 0,261
Table XXV. The results of the Mann-Whitney U test applied to diabetic retinopathy and the different
continuous variables.
gender Total Fisher’s
exact test male female
diabetic retinopathy No retinopathy 15 12 27
0,333 Retinopathy 1 3 4
Total 16 15 31
Table XXVI. A Fisher’s exact test on a 2x2 table of the gender and diabetic retinopathy.
smoking habits Total Fisher’s
exact
test
non smoker smoker
diabetic retinopathy No retinopathy 11 4 15
0,110 retinopathy 0 2 2
Total 11 6 17
Table XXVII. A Fisher’s exact test on a 2x2 table of the smoking habits and diabetic retinopathy.
Disease duration Total Fisher’s
exact
test
<15 years >15 years
diabetic retinopathy no retinopathy 17 10 27
0,032 retinopathy 0 4 4
Total 17 14 31
Table XXVIII. A Fisher’s exact test on a 2x2 table of the disease duration and diabetic retinopathy.
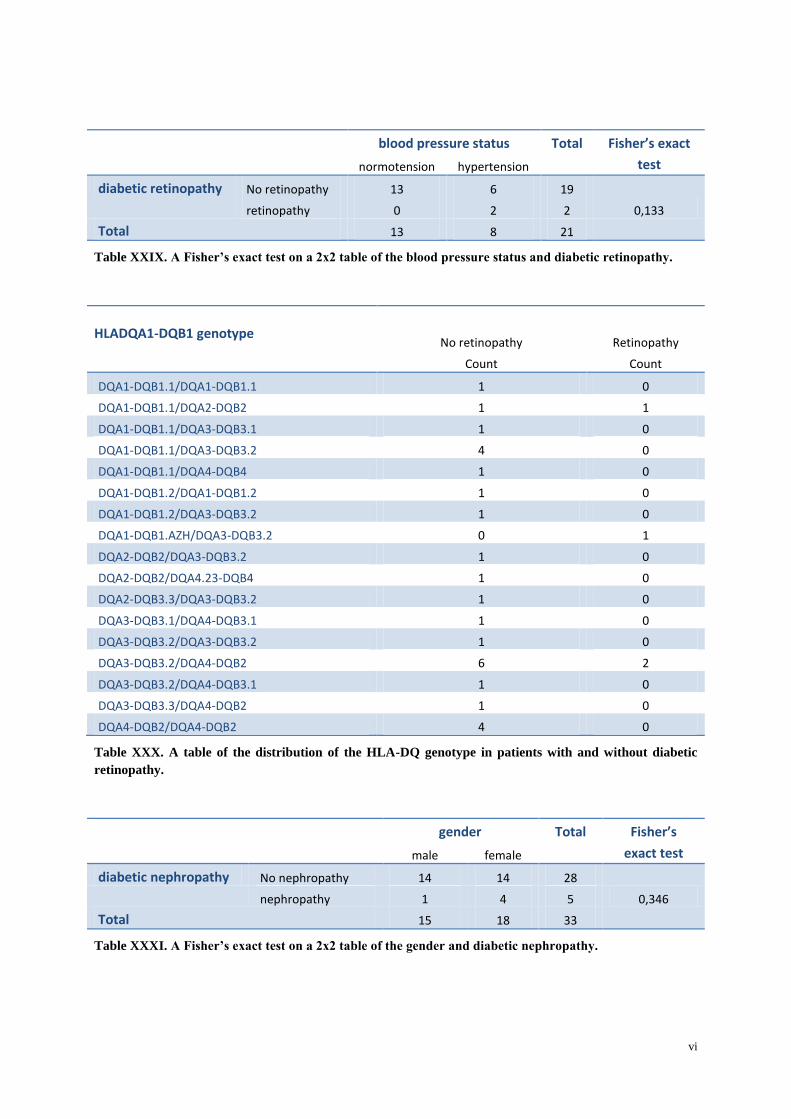
vi
blood pressure status Total Fisher’s exact
test normotension hypertension
diabetic retinopathy No retinopathy 13 6 19
0,133 retinopathy 0 2 2
Total 13 8 21
Table XXIX. A Fisher’s exact test on a 2x2 table of the blood pressure status and diabetic retinopathy.
HLADQA1-DQB1 genotype
No retinopathy Retinopathy
Count Count
DQA1-DQB1.1/DQA1-DQB1.1 1 0
DQA1-DQB1.1/DQA2-DQB2 1 1
DQA1-DQB1.1/DQA3-DQB3.1 1 0
DQA1-DQB1.1/DQA3-DQB3.2 4 0
DQA1-DQB1.1/DQA4-DQB4 1 0
DQA1-DQB1.2/DQA1-DQB1.2 1 0
DQA1-DQB1.2/DQA3-DQB3.2 1 0
DQA1-DQB1.AZH/DQA3-DQB3.2 0 1
DQA2-DQB2/DQA3-DQB3.2 1 0
DQA2-DQB2/DQA4.23-DQB4 1 0
DQA2-DQB3.3/DQA3-DQB3.2 1 0
DQA3-DQB3.1/DQA4-DQB3.1 1 0
DQA3-DQB3.2/DQA3-DQB3.2 1 0
DQA3-DQB3.2/DQA4-DQB2 6 2
DQA3-DQB3.2/DQA4-DQB3.1 1 0
DQA3-DQB3.3/DQA4-DQB2 1 0
DQA4-DQB2/DQA4-DQB2 4 0
Table XXX. A table of the distribution of the HLA-DQ genotype in patients with and without diabetic
retinopathy.
gender Total Fisher’s
exact test male female
diabetic nephropathy No nephropathy 14 14 28
0,346 nephropathy 1 4 5
Total 15 18 33
Table XXXI. A Fisher’s exact test on a 2x2 table of the gender and diabetic nephropathy.
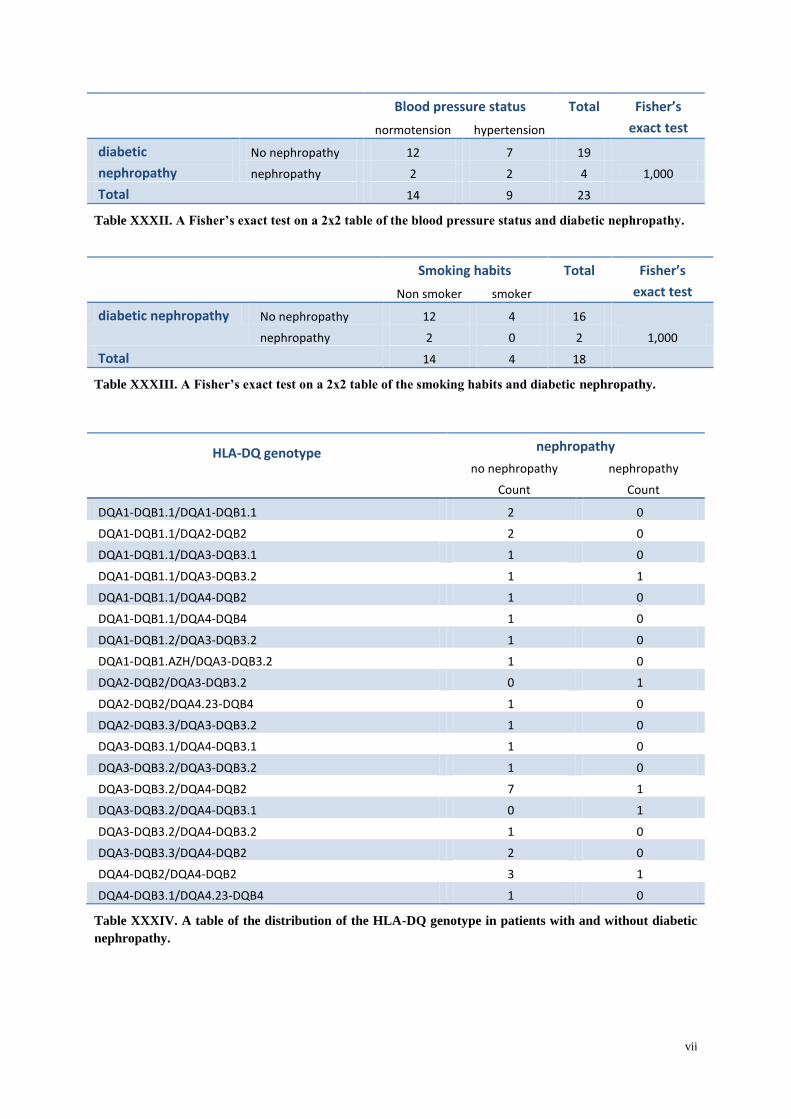
vii
Blood pressure status Total Fisher’s
exact test normotension hypertension
diabetic
nephropathy
No nephropathy 12 7 19
1,000 nephropathy 2 2 4
Total 14 9 23
Table XXXII. A Fisher’s exact test on a 2x2 table of the blood pressure status and diabetic nephropathy.
Smoking habits Total Fisher’s
exact test Non smoker smoker
diabetic nephropathy No nephropathy 12 4 16
1,000 nephropathy 2 0 2
Total 14 4 18
Table XXXIII. A Fisher’s exact test on a 2x2 table of the smoking habits and diabetic nephropathy.
HLA-DQ genotype
nephropathy
no nephropathy nephropathy
Count Count
DQA1-DQB1.1/DQA1-DQB1.1 2 0
DQA1-DQB1.1/DQA2-DQB2 2 0
DQA1-DQB1.1/DQA3-DQB3.1 1 0
DQA1-DQB1.1/DQA3-DQB3.2 1 1
DQA1-DQB1.1/DQA4-DQB2 1 0
DQA1-DQB1.1/DQA4-DQB4 1 0
DQA1-DQB1.2/DQA3-DQB3.2 1 0
DQA1-DQB1.AZH/DQA3-DQB3.2 1 0
DQA2-DQB2/DQA3-DQB3.2 0 1
DQA2-DQB2/DQA4.23-DQB4 1 0
DQA2-DQB3.3/DQA3-DQB3.2 1 0
DQA3-DQB3.1/DQA4-DQB3.1 1 0
DQA3-DQB3.2/DQA3-DQB3.2 1 0
DQA3-DQB3.2/DQA4-DQB2 7 1
DQA3-DQB3.2/DQA4-DQB3.1 0 1
DQA3-DQB3.2/DQA4-DQB3.2 1 0
DQA3-DQB3.3/DQA4-DQB2 2 0
DQA4-DQB2/DQA4-DQB2 3 1
DQA4-DQB3.1/DQA4.23-DQB4 1 0
Table XXXIV. A table of the distribution of the HLA-DQ genotype in patients with and without diabetic
nephropathy.
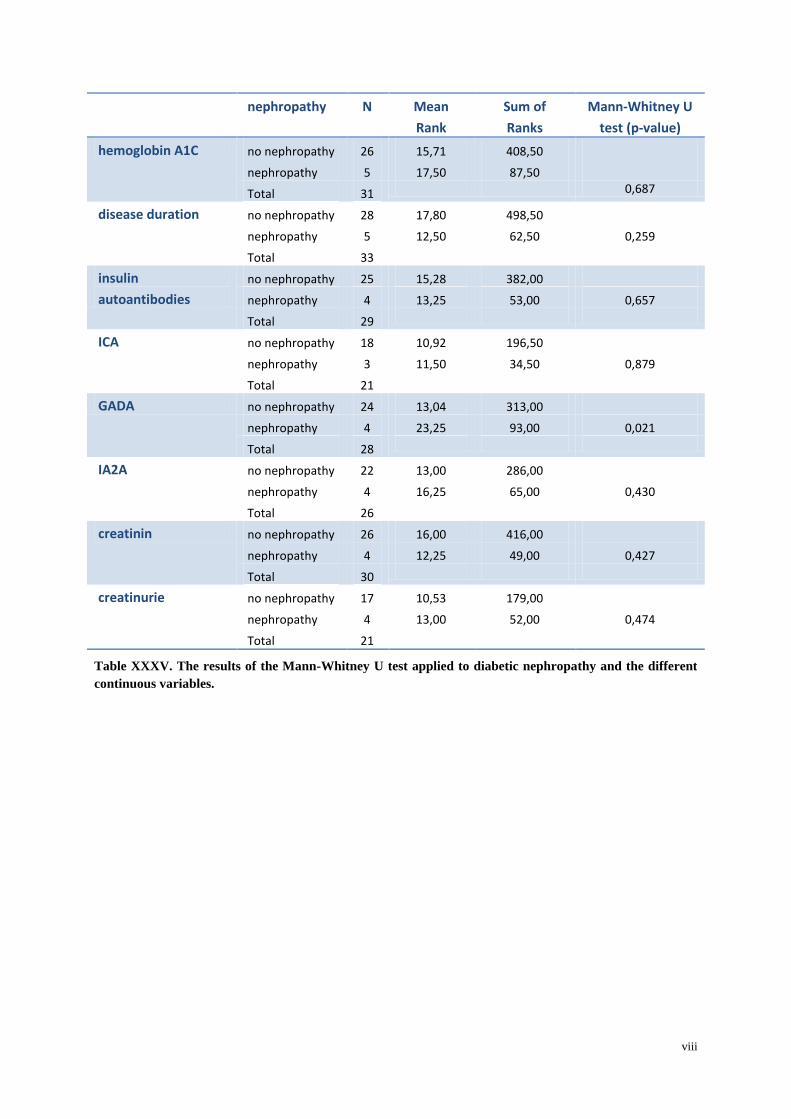
viii
nephropathy N Mean
Rank
Sum of
Ranks
Mann-Whitney U
test (p-value)
hemoglobin A1C no nephropathy 26 15,71 408,50
nephropathy 5 17,50 87,50
Total 31 0,687
disease duration no nephropathy 28 17,80 498,50
nephropathy 5 12,50 62,50 0,259
Total 33
insulin
autoantibodies
no nephropathy 25 15,28 382,00
nephropathy 4 13,25 53,00 0,657
Total 29
ICA no nephropathy 18 10,92 196,50
nephropathy 3 11,50 34,50 0,879
Total 21
GADA no nephropathy 24 13,04 313,00
nephropathy 4 23,25 93,00 0,021
Total 28
IA2A no nephropathy 22 13,00 286,00
nephropathy 4 16,25 65,00 0,430
Total 26
creatinin no nephropathy 26 16,00 416,00
nephropathy 4 12,25 49,00 0,427
Total 30
creatinurie no nephropathy 17 10,53 179,00
nephropathy 4 13,00 52,00 0,474
Total 21
Table XXXV. The results of the Mann-Whitney U test applied to diabetic nephropathy and the different
continuous variables.