Embed Size (px)
Citation preview
HMA Surface Characteristics Study
MnROAD Research Conference
October 4, 2011,Minneapolis, MN
Mark Watson, MS, PE
Assistant Bituminous Engineer
Minnesota Department of Transportation
• Sidewalk had enough heat but …
• Lacked: cleanliness, portability, etc.
• Pavements need to be more than safe & durable
• Pavement Surface Characteristics Study – Optimization
• Safe, Durable, economical, green
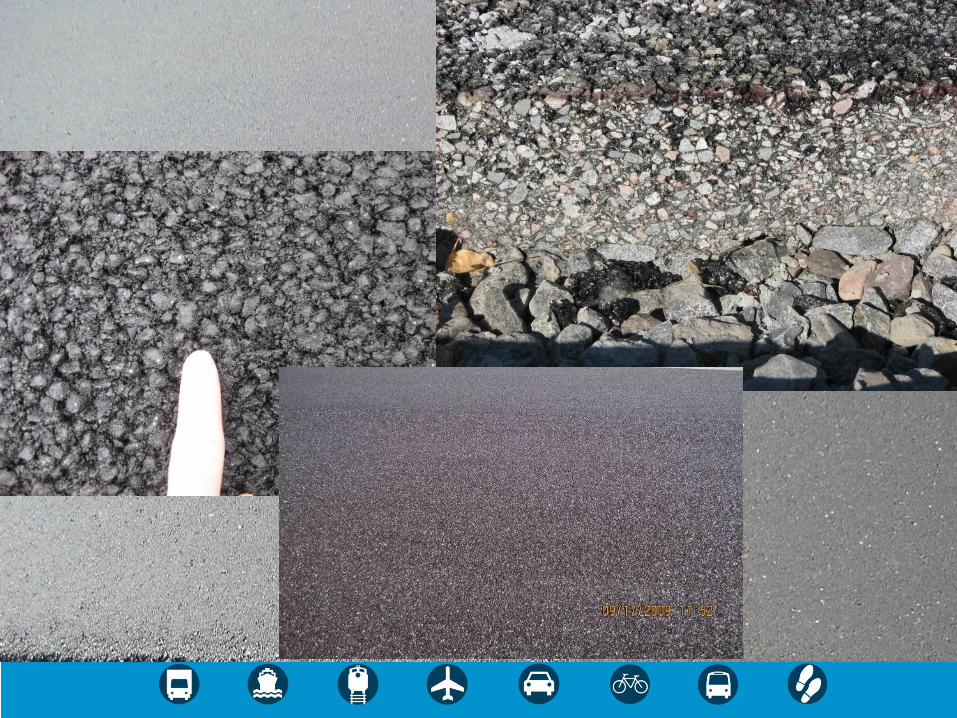
• Friction, Texture, Ride, Noise, Permeability and Durability
Surface Characteristics
• History
• Measured Pavement Characteristics
• Observed Performance
• Summary
Outline
• 1870’s US Cities Started to use Wooden instead of Granite Blocks
• Wooden Roads Quieter but …
• Service life of ½ - ¼ that of Granite Brick/block
• Also tried mastic (native asphalt), but had traction issues (horse falls)
History

• Literature Review
• Test Section Construction • Phase 2, $10.1M
• Seasonal Testing & Monitoring
• Analysis of Experimental Data
• Deployment & Implementation
• Final Report
Work Plan
• 6 cells on Mainline and 5 cells on Low Volume Road
• Traditional HMA & New/emerging tech (variables: gradation, binder, recycle)
• Porous HMA
• Warm Mix Asphalt
• 4.75 Taconite
• Pavement Preservation • Fog Seal (various ages)
• Chip Seal (2 gradations)
Test Section Construction
• Cells are generally tested 2 -3 times per year
• Data collected every year for 4 year monitoring period of study: • Friction & Texture
• Ride
• Noise
• Permeability
• Durability
Seasonal Tests & Monitoring
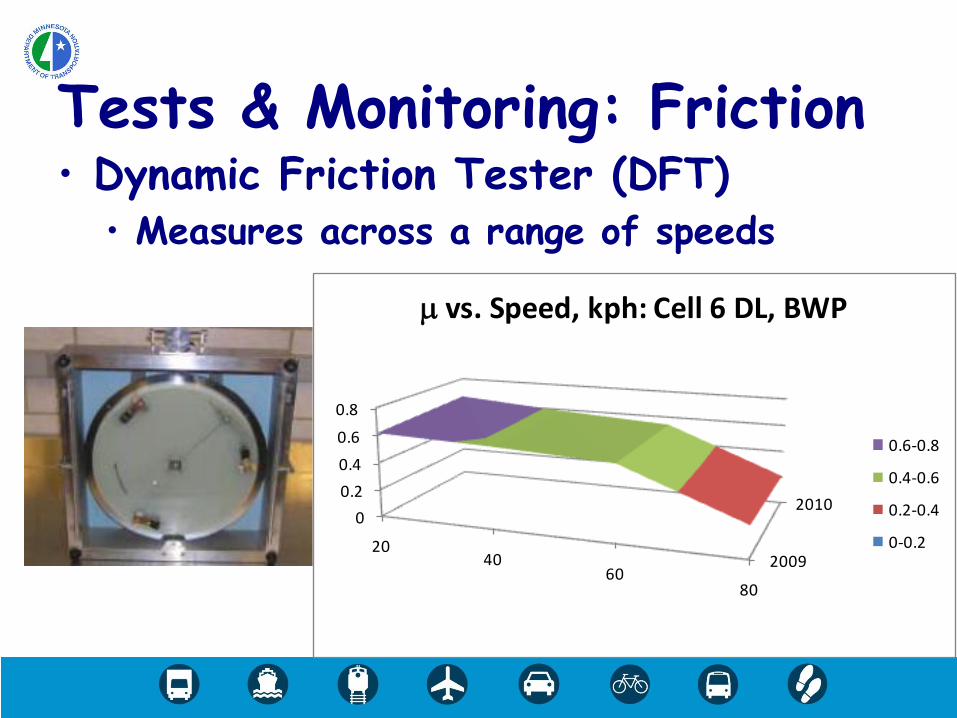
• Dynamic Friction Tester (DFT) • Measures across a range of speeds
Tests & Monitoring: Friction
2009
20100
0.2
0.4
0.6
0.8
2040
6080
m vs. Speed, kph: Cell 6 DL, BWP
0.6-0.8
0.4-0.6
0.2-0.4
0-0.2
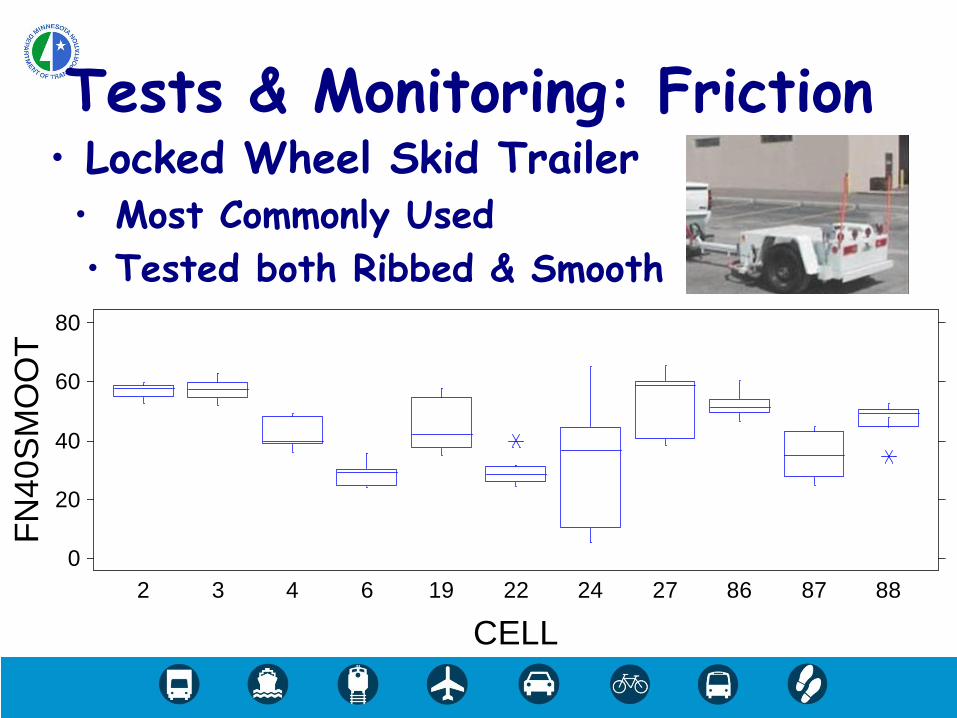
• Locked Wheel Skid Trailer • Most Commonly Used
• Tested both Ribbed & Smooth
Tests & Monitoring: Friction
Box and Whisker Plot
2 3 4 6 19 22 24 27 86 87 88
0
20
40
60
80
FN
40
SM
OO
T
CELL76 cases
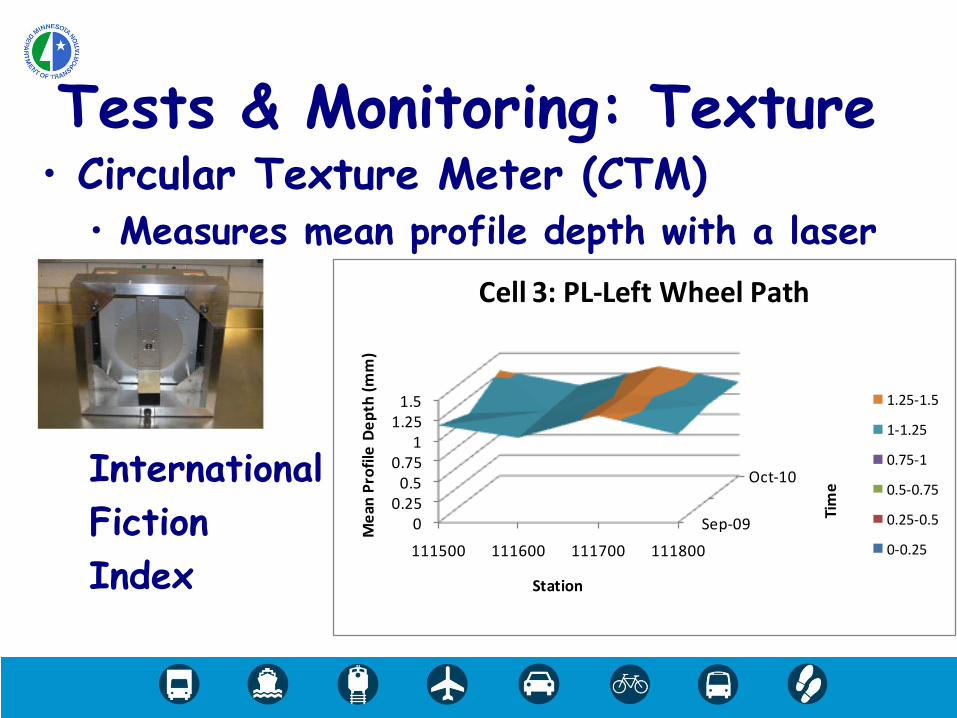
• Circular Texture Meter (CTM) • Measures mean profile depth with a laser
International
Fiction
Index
Tests & Monitoring: Texture
Sep-09
Oct-10
00.250.50.75
11.251.5
111500 111600 111700 111800
Tim
e
Me
an P
rofi
le D
ep
th (
mm
)
Station
Cell 3: PL-Left Wheel Path
1.25-1.5
1-1.25
0.75-1
0.5-0.75
0.25-0.5
0-0.25
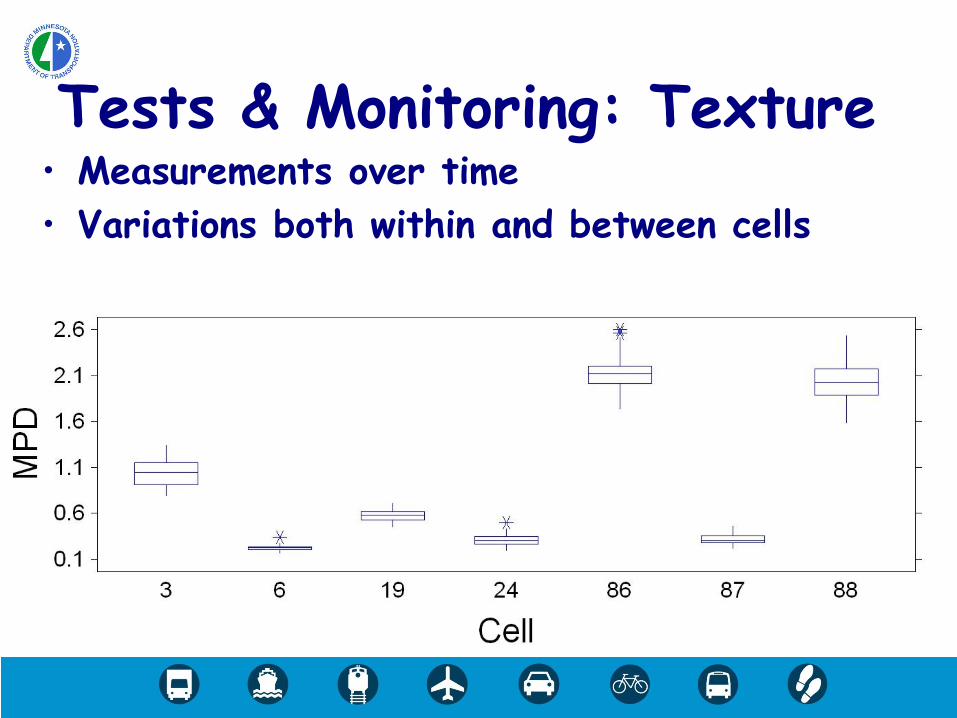
• Measurements over time
• Variations both within and between cells
Tests & Monitoring: Texture
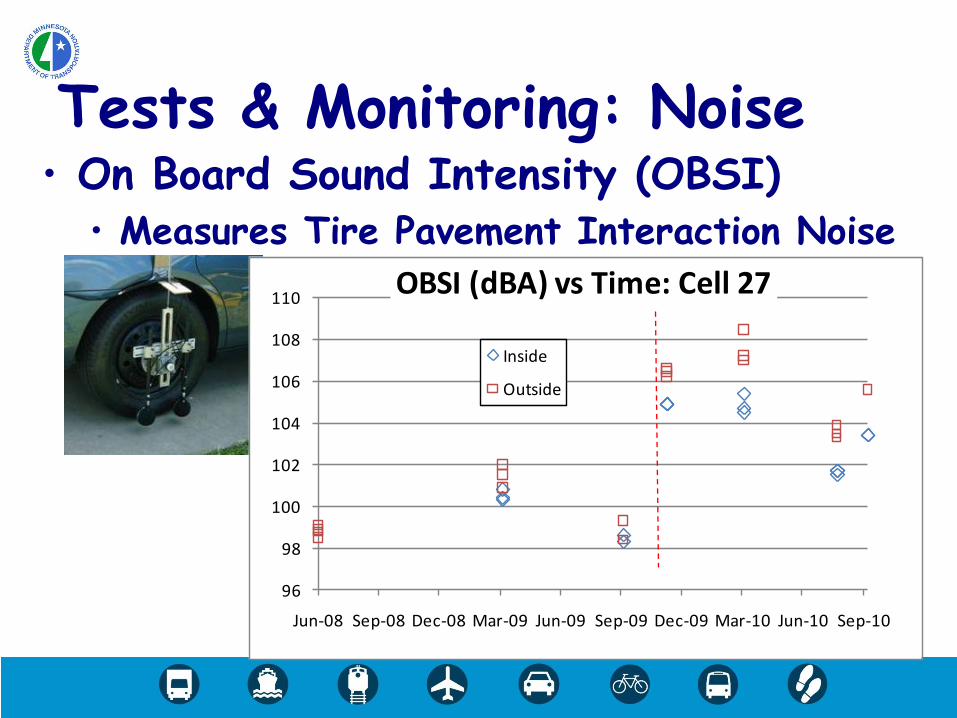
• On Board Sound Intensity (OBSI) • Measures Tire Pavement Interaction Noise
Tests & Monitoring: Noise
96
98
100
102
104
106
108
110
Jun-08 Sep-08 Dec-08 Mar-09 Jun-09 Sep-09 Dec-09 Mar-10 Jun-10 Sep-10
OBSI (dBA) vs Time: Cell 27
Inside
Outside
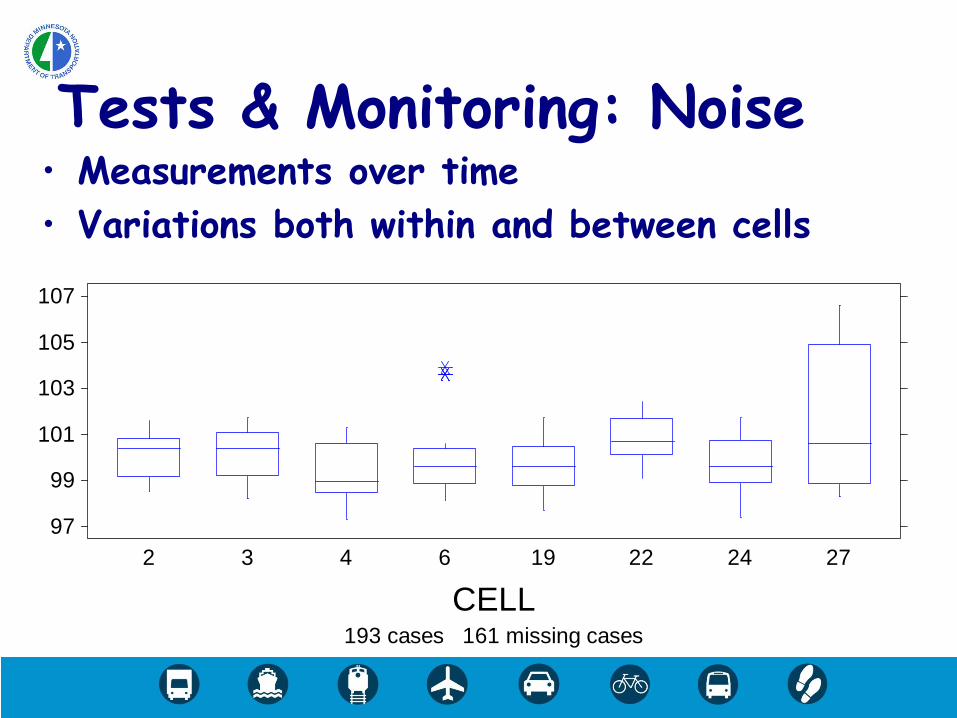
• Measurements over time
• Variations both within and between cells
Tests & Monitoring: Noise
Box and Whisker Plot
2 3 4 6 19 22 24 27
97
99
101
103
105
107
RU
N_
AV
ER
A
CELL193 cases 161 missing cases
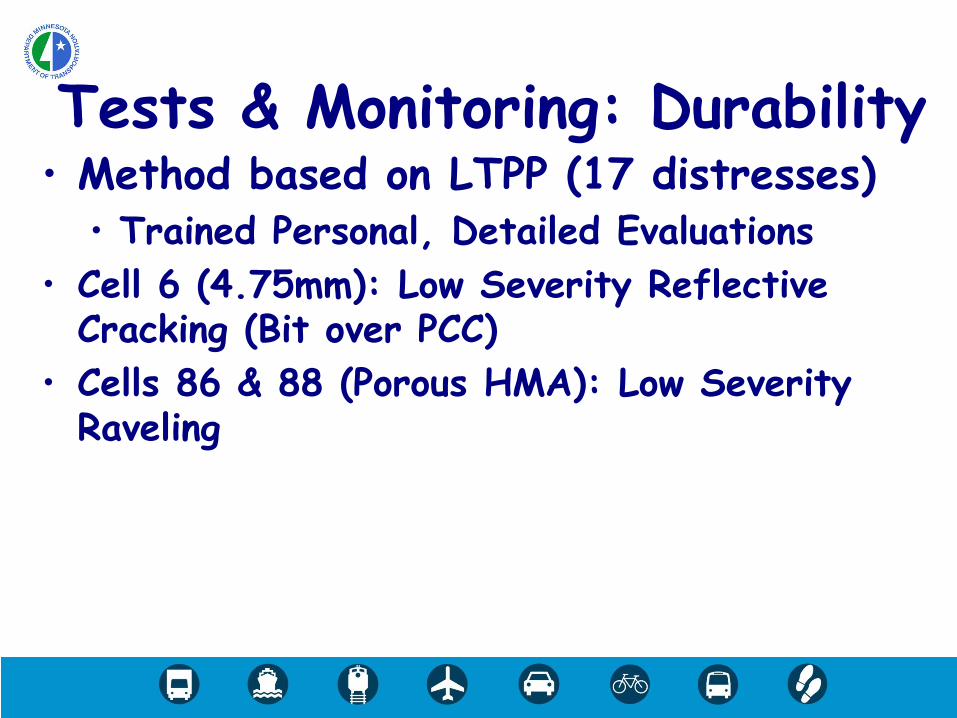
• Method based on LTPP (17 distresses) • Trained Personal, Detailed Evaluations
• Cell 6 (4.75mm): Low Severity Reflective Cracking (Bit over PCC)
• Cells 86 & 88 (Porous HMA): Low Severity Raveling
Tests & Monitoring: Durability

• Contract Awarded to Purdue to: 1. Review of Literature
2. Effect of Changing Seasons on HMA Surface Characteristics
3. ID of Significant Variables
4. Model of Sound Intensity
5. Draft Final Report
Data, Data and Data
• Surface Characteristics should be optimized with other HMA properties
• Study is producing valuable data
• Analyzed for use in sound model
• Aid in understanding of cost-benefits
• Long Term & Consistent Monitoring
Summary
Thank You!