Embed Size (px)
Citation preview

HMDA and New Developments in Fair
Lending—What We Have Learned
Presented by:Joseph T. Lynyak III ReedSmith LLP1901 Avenue of the Stars – Suite 700Los Angeles, CA 90067-6078Tel.(310) 734-5407
1301 K Street NW, Suite 1100Washington, DC 20005Tel: (202) [email protected]
©2005 ReedSmith LLP. All rights reserved.
MBA’s Legal IssuesIn Mortgage Technology
San Diego, California November 30, 2005
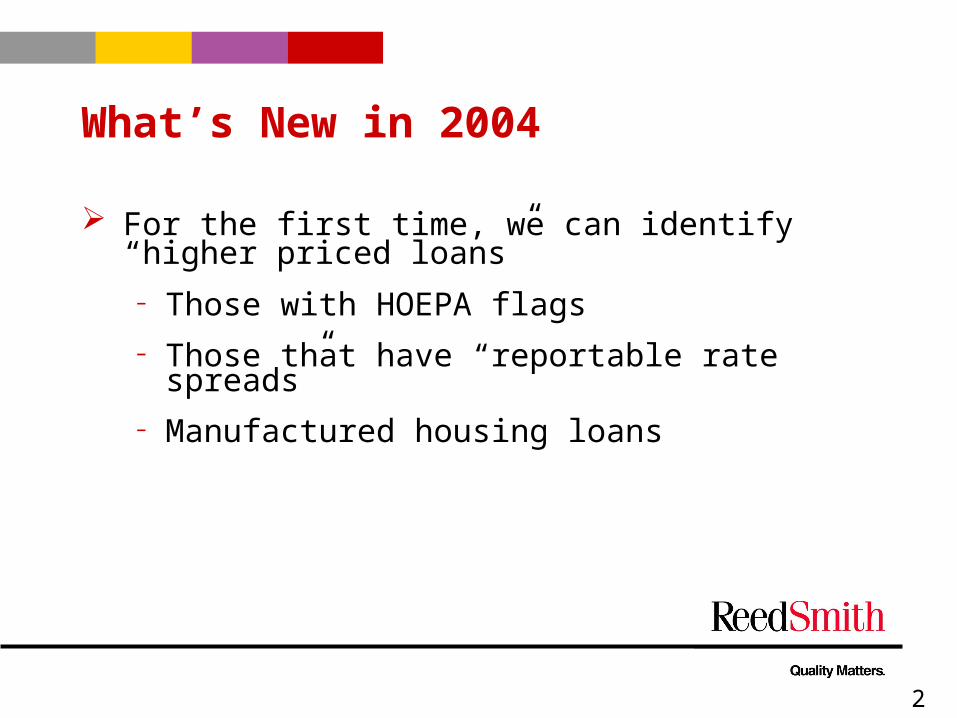
What’s New in 2004
For the first time, we can identify “higher priced loans”
– Those with HOEPA flags– Those that have “reportable rate spreads”– Manufactured housing loans
2

What’s New in 2004
We can compare by race or ethnicity– Incidence – either in terms of relative probabilities or
“odds ratios”
– Magnitudes, levels, severities – to determined whether for higher priced loans minorities pay more on average than do Caucasians or White, Non-Hispanic borrowers
3

Different Categories for Comparison
All loans – or subgroups of loans First (senior) lien loans Second (junior) lien loans Conventional loans (not FHA, VA, etc.) Business related (e.g., gender, race, ethnicity n/a)
4

Different Categories for Comparison
Rate spread loans Purchase, refinance, home improvement In metropolitan areas – or everywhere By state, by MSA, by county With or without early apps
5

The Fed (Finally) Issued Its Report
2004 HMDA data reported to the FFIEC and the Fed in March of 2005
Federal Reserve report and public data issued on September 12th
CDs now available—all 20 gigabits worth Critical Table 11 data not issued until late September Enormous volume of data now being analyzed
6

100s of Ways to Use These Numbers
Incidence of likelihood an ethnicity or racial group will receive a reportable loan compared to another racial or ethnic group
Media comparisons made between African Americans and Caucasians and between Hispanics and Whites (e.g., non-Hispanic Caucasians)
Typically higher relative probabilities shown in the prime market
7

100s of Ways to Use These Numbers
Prime Example: 100 loans for a prime lender – 700 White, 100 AA, 200 Hispanic. They have only 10% rate spread loans (100 total) with 40 AA, and 15% Hispanic. Disparity (odds ratio) AA: W is 30/5.7=5.26 and that for Hispanics is 2.63
Nonprime Example: The nonprime lender with same distribution of applicants who has a 50% rate spread incidence across the board. Then 350 Whites, 50 AA and 100 Hispanics have higher priced loans but the disparity (odds ratio) does not exist. Disparity AA: W and Hispanic: W is 50/50=1
8

100 Ways to Use Those Numbers
Rate spread comparisons between ethnicities and racial groups Comparisons for those borrowers who received
reportable loans Table 11 APR data permits calculation of differences
between groups by simple arithmetic Fed made state aggregation more difficult by not
posting data aggregated by state
9

The National View: The Odds Ratios
National Incidence of Loans with Reportable Rate Spreads: First Lien, Owner Occupied, Conventional, 1-4
Family Loans
1.892.55
1.29 1.611.14
3.21
2.162.081.41
0
1
2
3
4
African American Hispanic Minority
Od
ds
Rat
io
Purchase Refinance Improvement
10

The National View: Average Differences by Race(Compared to Whites)
11
National Difference in Mean Rate Spread in BPS: First Lien, Owner Occupied, Conventional, 1-4 Family Loans
-15
0
13
-4
17
-12
3
25
12
-20
-10
0
10
20
30
African American Hispanic Minority
Odd
s R
atio
Purchase Refinance Improvement

The Rate Spreads Observed
12
Summary of Nationally HMDA Reported Rate Spreads
Purchase RefinanceHome
Improvement
Race/Ethnicity Statistic First Lien Junior Lien First Lien Junior Lien First Lien Junior Lien
AfricanAmerican
Probability ofReported Rate Spread
31.97 61.69 34.28 45.11 42.30 37.67
AverageRate Spread
4.18 6.60 4.31 7.50 4.64 8.40
Hispanic
Probability ofReported Rate Spread
19.61 57.45 18.61 36.95 24.85 24.31
AverageRate Spread
3.94 6.30 4.07 7.06 4.44 7.94
WhiteNon-Hispanic
Probability ofReported Rate Spread
8.61 29.77 12.83 23.32 19.82 15.41
AverageRate Spread
4.08 6.43 4.16 7.14 4.40 7.96

HOEPA Loans
13
Summary of Nationally HMDA Reported HOEPA Loans
Refinance Home Improvement
Race/Ethnicity Statistic First LienJunior Lien First Lien
Junior Lien
AfricanAmerican
Probability of HOEPA
0.18% 1.00% 0.80% 2.54%
HispanicProbability of HOEPA
0.16% 1.71% 0.60% 2.04%
WhiteNon-Hispanic
Probability of HOEPA
0.14% 0.77% 0.63% 1.26%
Clearly, the incidence of HOEPA loans is low—with less than one percent of first lien loans being HOEPA loans.

Incidence – Top 5 Prime Lenders
14
Top 5 Prime Lenders Relative Incidence of FLOOC Loans with Reported Rate Spreads
Hispanic/Non-Hispanic
1.622.13 2.01
1.19 1.141.70 1.481.20
1.601.04
0.001.002.003.004.005.006.00
Lender A Lender B Lender C Lender D Lender E
Odd
s R
atio
Purchase Refinance

Level of Rate Spreads – Top 5 Prime Lenders
15
Top 5 Prime LendersDifference in FLOOC Mean Rate Spreads
(African American - White)
18 19
76
-2
-15
171811
-5
-30-20-10
01020
Lender A Lender B Lender C Lender D Lender E
Odd
s R
atio
Purchase Refinance

Level of Rate Spreads – Top 5 Prime Lenders
16
Top 5 Prime LendersDifference in FLOOC Mean Rate Spreads
(Hispanic - Non-Hispanic)
-18 -21-8 -2
98
-32
-4
4
-2-16
-50
0
50
100
Lender A Lender B Lender C Lender D Lender E
Odd
s R
atio
Purchase Refinance

Incidence – Top 5 Subprime Lenders
17
Top 5 Non-Prime Lenders Relative Incidence of FLOOC Loans with Reported Rate Spreads
African American/White
1.18 1.10
1.411.291.20 1.27
1.091.28
1.411.36
0.00
1.00
2.00
Lender F Lender G Lender H Lender I Lender J
Odd
s R
atio
Purchase Refinance

Incidence – Top 5 Subprime Lenders
18
Top 5 Non-Prime LendersRelative Incidence of FLOOC Loans with Reported Rate Spreads
Hispanic/Non-Hispanic
0.950.82 0.910.89 0.95 0.97 0.88 0.79
0.53
1.01
0.00
1.00
2.00
Lender F Lender G Lender H Lender I Lender J
Odd
s R
atio
Purchase Refinance

Level of Rate Spreads – Top 5 Non-Prime Lenders
19
Top 5 Non-Prime LendersDifference in FLOOC Mean Rate Spreads
(African American - White)
13 1218
129
25
12 12
19
-10-20
-10
0
10
20
30
Lender F Lender G Lender H Lender I Lender J
Odd
s R
atio
Purchase Refinance

Level of Rate Spreads – Top 5 Non-Prime Lenders
20
Top 5 Non-Prime LendersDifference in FLOOC Mean Rate Spreads
(Hispanic - Non-Hispanic)
-12 -15
9
-11-5
2
-3
6
-2-2
-20
-10
0
10
20
30
Lender F Lender G Lender H Lender I Lender J
Odd
s R
atio
Purchase Refinance
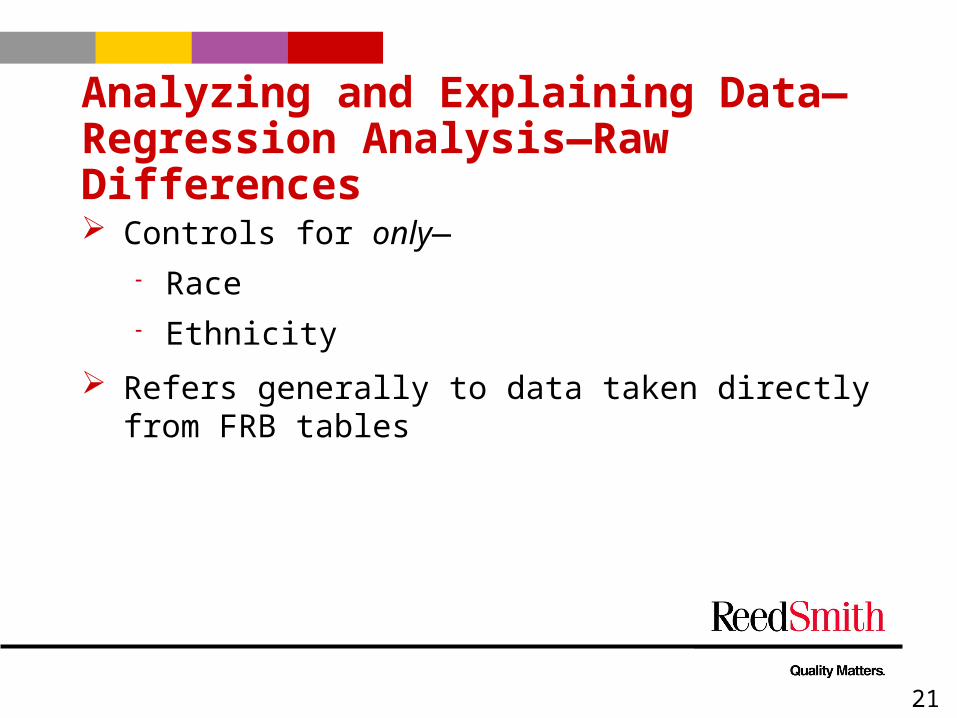
Analyzing and Explaining Data—Regression Analysis—Raw Differences
Controls for only— Race Ethnicity
Refers generally to data taken directly from FRB tables
21

Analyzing and Explaining Data—Regression Analysis—HMDA Regression
Includes raw difference variables
Loan type Property type Lien status Occupancy type Loan amount < $100,000 Loan amount between
$100,000 and $333,700
Loan amount between $333,700 and $$641,650
Purpose Tract income level Income to MSA median Income to loan amount Principal city indicator Tract percent
22

Analyzing and Explaining Data—Regression Analysis—HMDA Regression With State/County Controls
Controls for— HMDA variables Inserts “dummy” variable for
States Counties
23

Analyzing and Explaining Data—Regression Analysis—Credit Variables and Risk-Based Pricing Controls for—
HMDA variables Inserts lender-specific credit factors—such as—
LTV buckets FICO scores Prepayment penalty indicators DTI Refinance or cash-out indicators Documentation type Loan term Loan product
24

Analyzing and Explaining Data—Regression Analysis—Credit Variables and Risk-Based Pricing and State/County Controls Controls for—
All rate sheet variables Adds “dummy” variables for states and counties
25

Necessary Terminology—Statistical Significance All data is not created equal—to be useable, data must
be “statistically significant” Non-economists must always focus on economic
techniques and nomenclature Overwhelming weight of authority—if the results are
not statistically significant—the data is not legally admissible
Chi Square Test/Fisher Exact Test
T-Test
26

Data has been far more difficult to analyze than previously assumed
Rash of adverse publicity has not occurred to date
Delay in posting Table 11 racial and ethnicity data has further slowed analysis
Determination not to post state-wide data has also complicated analysis—just MSAs
27
Recent Developments

Recent Developments
Results confirm effectiveness of risk-based pricing
Raw HMDA data can identify pockets of incidence or rate spread disparities that require further study
Application of increased sophistication of regression analyses can completely explain and/or narrow disparities to geographic or product lines
28

Recent Developments
Many lenders have already completed several levels of regression analysis Verifies risk-based pricing models or significantly
limits fair lending concerns to discrete geographic areas
In areas of local concern—broker issues may need to be addressed
29

Observations
Fed has verified that 200 or more referrals have been made to the DOJ Referrals appear to reflect disparities after a HMDA regression
analysis Agencies have hinted at expanding HMDA review to review of
APRs on non-reportable loans
Other Federal Banking Agencies in varying states of follow-up
AGs Yet to Weigh-in
30

Observations
Homeownership in America is at or near record highs Risk-based pricing has expanded access to credit & significantly
contributed to the growth in the availability of mortgage credit, which fosters increased homeownership
While HMDA data may show some differences in denial rates, industry is effectively serving more borrowers
While differences in loan pricing exist, publicly available HMDA data and other objective risk factors can explain the differences
The price of a mortgage is based on a variety of factors related to the economic risk involved
Financial literacy would help improve credit and shopping to lower prices
31

Observations
Regardless of credit-based explanations—should there be a public policy debate to address and to resolve the national disparities and incidence issues between African Americans and Whites? Is financial education and literacy the key? Is closer broker monitoring needed?
32