Embed Size (px)
Citation preview

FINAL RE
HoSalt
EPORT
ousingt Lake C
g MaCity Co
arket orporat
Studtion
dy

Final
Sept
Ho
PrepSalt LHous451 SRoomSalt Lwww PrepBBC R1999Denv303.3wwwbbc@
l Report
ember 30, 20
ousing
ared for Lake City Corpsing and NeighSouth State Stm 406 Lake City, Utah
w.slcgov.com/h
ared by Research & Co
9 Broadway, Suver, Colorado 8321.2547 fax
w.bbcresearch@bbcresearch
013
Marke
poration hborhood Devtreet
h 84114 hand
onsulting uite 2200 80202-9750 303.399.0448.com .com
et Stud
velopment
8
y
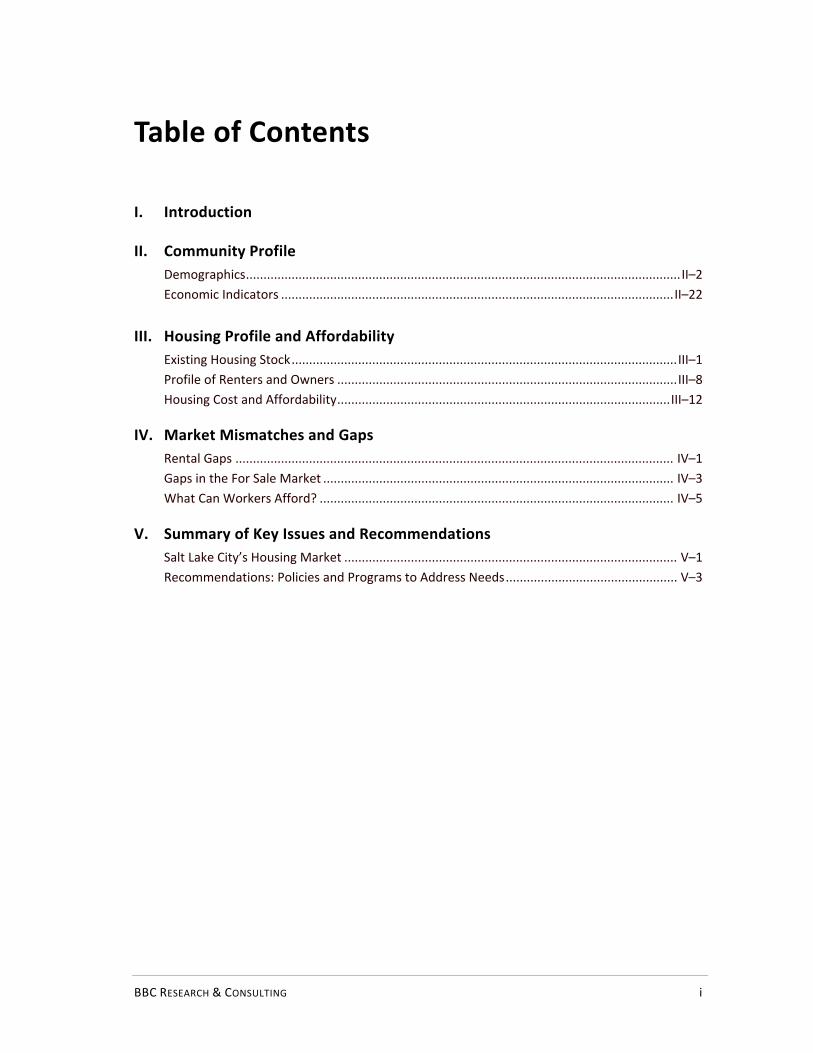
Table of Contents
BBC RESEARCH & CONSULTING i
I. Introduction
II. Community Profile
Demographics ............................................................................................................................ II–2
Economic Indicators ................................................................................................................ II–22
III. Housing Profile and Affordability
Existing Housing Stock .............................................................................................................. III–1
Profile of Renters and Owners ................................................................................................. III–8
Housing Cost and Affordability ............................................................................................... III–12
IV. Market Mismatches and Gaps
Rental Gaps ............................................................................................................................. IV–1
Gaps in the For Sale Market .................................................................................................... IV–3
What Can Workers Afford? ..................................................................................................... IV–5
V. Summary of Key Issues and Recommendations
Salt Lake City’s Housing Market ............................................................................................... V–1
Recommendations: Policies and Programs to Address Needs ................................................. V–3

SECTION I.
Introduction

BBC RESEARCH & CONSULTING SECTION I, PAGE 1
SECTION I. Introduction
In May 2013, Salt Lake City Corporation contracted with BBC Research & Consulting (BBC) to conduct a housing market study for the city, with a focus on affordable housing needs.
The city, as a condition of receiving federal housing and community development funds, is required to assess housing market conditions and identify the greatest needs. The city also desired to better understand how well the city’s private housing stock meets the housing needs of the workforce, as well as current and potential residents.
This report contains the results of the housing market analysis. The Community Profile—Section II—provides context for the housing analysis. It reviews population growth, changing demographics, in‐commuting, and employment.
The third section provides an overview of the housing stock in the city. It discusses housing type, rate of homeownership, age of housing, and cost of housing, both rental and for sale housing. Section III also introduces the study’s analysis of affordability.
Section IV compares the cost of rental and for sale housing at various price points with resident demand for housing, using income as a proxy. This modeling effort shows where “gaps” in housing provision exist—that is, where there are more households who need affordable housing than is supplied.
The final section, Section V, concludes the study with a summary of key issues and a list of recommendations for the city to consider.

SECTION II.
Community Profile

BBC RESEARCH & CONSULTING SECTION II, PAGE 1
SECTION II. Community Profile
ThissectionprovidesageneraloverviewofSaltLakeCity’sdemographicandeconomicenvironmenttosetthecontextforthehousingmarketanalysis.Keyfindingsfromthissectioninclude:
SaltLakeCityiscurrentlyhometoabout186,000peopleandisforecastedtoreach211,000peopleby2020(13%increase).Historically,theSaltLakeCityareahasgeneratedmostofitsowngrowththroughnaturalincrease(asopposedtoin‐migration).
AllofSaltLakeCity’spopulationgrowth(4%)between2000and2011canbeattributedtogrowthintheminoritypopulation:Thenon‐Hispanicwhitepopulationinthecitydecreasedby2percentwhiletheminoritypopulationincreasedby19percent.Evenso,changesintheoveralldistributionofthepopulationwererelativelysmall.Theminoritypopulation,asaproportionoftotalpopulation,increasedfrom29percentin2000to33percentin2011.TheHispanicshareofthepopulationincreasedfrom19percentin2000to22percentin2010butdroppedbackto19percentin2011.
In2011,9percentofSaltLakeCityresidentswereseniors.AlthoughthepopulationofSaltLakeCityisaging,forecastssuggestthatthecityislesslikelytoexperienceasignificant“graying”ofthepopulationthanotherpeercitiesandthenationasawhole.
Asistypicalinlargemetropolitanareas,householdsinthesuburbsaremorelikelytobefamiliesthanhouseholdsinthecity(75%comparedto52%).However,thatgapdoesnotappeartobewideningovertime;inotherwords,thecitydoesnotseemtobelosingadisproportionateproportionoffamiliestothesuburbs.
Therearecharacteristicdifferencesbetweenfamiliesinthecityandfamiliesinthesuburbs.Familieslivinginthecityaremorelikelytobelivinginpovertyandaremorelikelytobesingle‐parenthouseholdsthanfamiliesinthebalanceofthecounty.
Thecityhasrelativelyfewmiddleandupperincomehouseholdsandahighproportionoflowincomehouseholds.Forty‐onepercentofcityhouseholdsearnlessthan$35,000peryear.
SaltLakeCityhasaveryhighproportionofin‐commuterscomparedtopeercities:only18percentofSaltLakeCityjobsareheldbycityresidents,comparedto44percentinBoiseand29percentinDenver.

BBC RESEARCH & CONSULTING SECTION II, PAGE 2
Demographics
SaltLakeCityishometo186,440people—18percentofthecountypopulationand7percentofthestatepopulation.ThefollowingdemographicsectionpresentstrendsandstatisticsfortheresidentsofSaltLakeCityintermsofpopulationgrowth,householdsizeandcomposition,age,raceandethnicity,disability,poverty,income,andeducation.
Population growth.Between2000and2010,thepopulationofSaltLakeCityincreasedby3percent,fromabout182,000toabout186,000.AccordingtotheGovernor’sOfficeofManagementandBudget,SaltLakeCityisprojectedtohavemoreaggressivegrowthoverthenextdecade,reachingnearly211,000by2020(13%increase).SomeofthatgrowthmaybeexpectedtooccurintheNorthwestQuadrantofthecity(westoftheairport)whichisintheprocessofcreatingamasterplantoguidenewdevelopmentlanduseactivitiesandzoningdecisions.1
SaltLakeCountyasawholeexpandeditspopulationby15percentbetween2000and2010,largelyduetosuburbangrowth.ThenearbycitiesofWestJordan,SouthJordanandDraperhadgrowthratesexceeding50percentbetween2000and2010.FigureII‐1displayspopulationtrendsforSaltLakeCityandsurroundingmunicipalities.
Figure II‐1. Population Trends in Salt Lake City and Surrounding communities, 1980 through 2030
Note: Population projections are conducted by the Governor’s Office of Management and Budget and use 2010 Census data as a baseline.
Sources: Utah Population Estimates Committee of the Governor’s Office of Management and Budget Demographic and Economic Analysis and BBC Research & Consulting.
1http://www.ci.slc.ut.us/planning/planning‐project‐northwest‐quadrant‐master‐plan.
163,034 159,936
181,743 186,440
210,592
227,824
0
50,000
100,000
150,000
200,000
250,000
1980 1990 2000 2010 2020 2030
Salt Lake City
West Valley City
Farmington
West Jordan
Sandy
Ogden
Layton
Murray
Draper
South Jordan
Bountiful

BBC RESEARCH & CONSULTING SECTION II, PAGE 3
Between2000and2010,populationgrowthwashighestinthewesternhalfofthecity,particularlyinthewesternportionsoftheWestSaltLake,CentralCityandNorthwestplanningareas.FigureII‐2displaysSaltLakeCity’spopulationgrowthbyCensustract.
Figure II‐2. Population Growth by Census Tract, Salt Lake City, 2000 through 2010
Note: Due to minor changes in the geographic boundary of some Census tracts between 2000 and 2010 some tracts were combined for analysis.
Sources: 2000 Census, 2010 Census and BBC Research & Consulting.
Therearetworeasonscommunitiesgainorlosepopulation:
1. “Naturalincrease”describestheneteffectofbirthsanddeathsinacommunity;and
2. “Netmigration”accountsfortheneteffectofnewresidentsmovingintoanareaandexistingresidentsmovingout.
FigureII‐3displaysthosecomponentsofpopulationchangeinSaltLakeCountybetween1991and2011.2
2TheGovernor’sOfficeofPlanningandBudgetprovidessuchdataatthecountylevel,butnotatthecitylevel.

BBC RESEARCH & CONSULTING SECTION II, PAGE 4
Naturalincreasehasbeenrelativelyconsistentandpositive(morebirthsthandeaths),averaging13,327peryearfrom2001through2011.Populationchangeduetonetmigrationhasbeenlowerandlessconsistent.In2001through2003andagainin2007through2009moreresidentsmovedoutofthecountythanmovedin.In2010and2011netmigrationwaspositivebutsmall(1,624in2010and214in2011).
Utah,unlikeneighboringstatesArizona,NevadaandIdaho,tendstogeneratemostofitsowngrowth—thatthatis,inUtahnaturalincreaseexceedsnetmigration.3Since2000,73percentofUtah’sgrowthcanbeattributedtonaturalincrease.InSaltLakeCounty99.5percentofgrowthsince2000canbeattributedtonaturalincrease.
Figure II‐3. Components of Population Change, Salt Lake County, 1991 through 2011
Source: Utah Population Estimates Committee.
Household trends.Accordingtothe2011ACS,thereare184,107peoplelivingin74,088householdsinSaltLakeCity.Ofthe74,088households,52percentarefamilies,halfofwhichincludechildren.Morethanoneinthreehouseholdersinthecitylivealone.Twenty‐threepercentofthoselivingaloneareseniors.
Approximately8percentofallSaltLakeCityhouseholdsaresingleparenthouseholds—1percentissinglefathers(1,069households)and7percentaresinglemothers(5,087households).Singleparenthouseholdsaccountforaboutone‐thirdofallfamilieswithchildreninthecity,comparedtojustone‐quarterinthebalanceofthecounty.
FigureII‐4displayshouseholdcompositionforSaltLakeCity.
3U.S.CensusBureauPopulationEstimates,2000through2010.

BBC RESEARCH & CONSULTING SECTION II, PAGE 5
Figure II‐4. Household Composition, Salt Lake City, 2011
Note:
Seven percent of households in the city are unmarried‐partner households. Those households may appear in either family or non‐family. An unmarried partner of the householder is present for about one in five children living in “single parent” households.
Sources:
2011 American Community Survey and BBC Research & Consulting.
Comparedtosurroundingsuburbancommunities,SaltLakeCityhasamuchlowerproportionoffamilies—inthebalanceofthecounty75percentofhouseholdsarefamilies.Whilethattypeofdifferenceistypicalforalargemetropolitanarea,animportantquestionforcentralcitiesiswhethertheyarelosingfamiliestothesuburbs.Between2000and2011,familyhouseholdsasapercentofallhouseholdsdeclinedinboththecity(from56%to52%)andthesuburbs(from78%to75%).Familieswithchildrenalsodeclinedasapercentageofallhouseholdsinboththecity(from29%to26%)andthesuburbs(from44%to38%).Sincesimilardeclineswereevidentinboththecityandthesuburbs,SaltLakeCitydoesnotappeartobelosingfamiliestothesuburbs.
Household size.Utahhasthehighestaveragehouseholdsizeinthenationandistheonlystatewhereaveragehouseholdsizeisgreaterthanthree.AveragehouseholdsizeinSaltLakeCityis2.48,lowerthanthestate(3.13)andcounty(2.99)buthigherthanpeercitiessuchasDenver(2.27)andBoise(2.42).FigureII‐5displaystheaveragehouseholdsizebyCensustractforSaltLakeCity.Averagehouseholdsizeishighestinthewesternportionofthecityandlowestinthecitycenter.

BBC RESEARCH & CONSULTING SECTION II, PAGE 6
Figure II‐5. Average Household Size by Block Group, Salt Lake City, 2010
Sources: 2010 Census and BBC Research & Consulting.
Age.Aboutone‐thirdofthecity’spopulationaremiddleaged(between25and44),one‐quarterarechildrenand9percentareseniors.Comparedtothecountyasawhole,thecityhasasmallerrepresentationofchildrenandahigherrepresentationofyoungadultsandmiddleagedresidents.
Between2000and2011,themedianageofSaltLakeCityincreasedonlyslightly,from30to31.Increasesinmedianageweremorepronouncedinthecounty(29to31),thestate(27to30)andthenation(35to37).AstheBabyBoomersage,increasesinmedianageareexpectedandarisingseniorpopulationisforecasted.ThatagingtrendisevidentinSaltLakeCity,buttoalesserextentthaninthenationasawhole.
FigureII‐6comparesSaltLakeCity’sresidentsbyagefrom2000to2011.Thecounty’sageprofileisalsoincludedforcomparison.

BBC RESEARCH & CONSULTING SECTION II, PAGE 7
Figure II‐6. Age Profile, Salt Lake City, 2000 and 2011
Sources: 2000 Census, 2011 American Community Survey and BBC Research & Consulting.
Between2000and2011,theproportionofthecity’spopulation45andolderincreasedfrom28percentto30percent.However,theseniorsubsetofthatpopulation(thoseaged65andolder)actuallydecreasedasaproportionofthetotalpopulation—from11percentto9percent.
Agingwasmorepronouncedinthecountyasawholewheretheproportionofresidents45andolderincreasedfrom26percentto30percentandtheproportionofseniorsincreasedfrom8percentto9percent.
ThefollowingthreemapspresentagecharacteristicsbygeographyforSaltLakeCityresidents:
FigureII‐7displaystheproportionofblockgroupresidentsthatarechildren(under18);
FigureII‐8mapstheproportionofblockgroupresidentsthatareseniors(65andover);and
FigureII‐9showsthechangeintheproportionofresidentsthatareseniorsbyCensustract(between2000and2010).

BBC RESEARCH & CONSULTING SECTION II, PAGE 8
Figure II‐7. Percent of Block Group Residents Under Age 18, Salt Lake City 2010
Sources: 2010 Census and BBC Research & Consulting.
Thecitycenterhasarelativelylowconcentrationofchildrenwhilethewesternportionofthecitycontainsmanyblockgroupsinwhich30percentormoreoftheresidentsarechildren.
BBC RESEARCH & CONSULTING SECTION II, PAGE 9
Figure II‐8. Percent of Block Group Residents that are Seniors, Salt Lake City, 2010
Note: Seniors are residents aged 65 or older.
Sources: 2010 Census and BBC Research & Consulting.
AsdisplayedinFigureII‐8,seniorsaremorelikelytoliveontheeasternsideofthecity,particularlyintheCityCreekCanyon,AvenuesandportionsoftheEastBenchplanningareas.Thoseareasofthecity,alongwithWestSaltLake,alsoexperiencedanaboveaverageincreaseintheproportionofseniorsbyCensustract(FigureII‐9).

BBC RESEARCH & CONSULTING SECTION II, PAGE 10
Figure II‐9. Change in the Proportion of Block Group Residents that are Seniors, Salt Lake City, 2000 to 2010
Note: Seniors are residents aged 65 or older. Negative percentage point change does not necessarily indicate a decrease in the number of seniors but does indicate that growth in the senior population was lower than growth in the total population. Due to minor changes in the geographic boundary of some Census tracts between 2000 and 2010, some tracts were combined for analysis.
Sources: 2000 Census, 2010 Census and BBC Research & Consulting.
AccordingtotheGovernor’sOfficeofManagementandBudgetpopulationforecasts,by2020,onein10residentslivinginSaltLakeCountywillbe65orolder(upfrom9%in2011).4Relativetoout‐of‐statepeercommunities,suchasDenver,andthenationasawhole,forecastedgrowthintheSaltLakeseniorpopulationislow.Assuch,SaltLakeislesslikelytoexperienceasignificant“graying”ofthepopulation.
Evenso,SaltLakeCounty’spopulationforecastssuggesttherewillbeadecreaseintheproportionofthepopulationunder40andanincreaseintheproportion40orolder—particularlythoseaged60orolder—betweennowand2020.Suchashiftcanhavesignificantimpactonhousingpreferencesandservicedemands.
4Projectionsbyagewerenotavailableatthecitylevel.

BBC RESEARCH & CONSULTING SECTION II, PAGE 11
Race and ethnicity.TwothirdsofSaltLakeCityresidentsarenon‐Hispanicwhite;one‐thirdbelongtoaminoritygroup.Aboutoneinfive(19%)areHispanic,5percentareAsianand3percentareAfricanAmerican.Thecountyandthestatearesomewhatlessdiversewithpopulationdistributionsthatare27and20percentminorityrespectively.FigureII‐10displaysthepopulationbyrace/ethnicityforSaltLakeCityin2000,2010,and2011.
Figure II‐10. Race and Ethnicity, Salt Lake City, 2000, 2010, and 2011
Note: Census data on race and ethnic identification vary with how people choose to identify themselves. The U.S. Census Bureau treats race and ethnicity separately: the Bureau does not classify Hispanic/Latino as a race, but rather as an identification of origin and ethnicity. In 2000, 15,556 Hispanic respondents racially identified as white and 15,188 Hispanic respondents racially identified as Some other race. In 2011, 14,709 Hispanic respondents racially identified as white and 17,355 Hispanic respondents racially identified as Some other race.
Source: 2000 Census, 2010 Census, 2011 American Community Survey, and BBC Research & Consulting.
Total Population 181,743 100 % 186,440 100 % 189,906 100 % 3 % 4 %
Race and Ethnicity Combined
All minority groups 53,366 29 % 64,115 34 % 63,531 33 % 20 % 19 %Non‐Hispanic white 128,377 71 122,325 66 126,375 67 ‐5 ‐2
Race Detail
Black or African American 3,433 2 % 5,088 3 % 5,382 3 % 48 % 57 % American Indian and Alaska Native 2,442 1 2,316 1 3,097 2 ‐5 27 Asian 6,579 4 8,247 4 9,255 5 25 41 Native Hawaiian/Pacific Islander 3,437 2 3,776 2 5,363 3 10 56 White 143,933 79 140,080 75 141,084 74 ‐3 ‐2 Some other race 15,482 9 20,036 11 19,334 10 29 25 Two or more races 6,437 4 6,897 4 6,391 3 7 ‐1
Ethnicity Detail
Hispanic 34,254 19 % 41,637 22 % 36,001 19 % 22 % 5 %Non‐Hispanic 147,489 81 144,803 78 153,905 1 ‐2 4
Total Growth,
2000 to 2011Percent2000 2010 2011 Total Growth,
2000 to 2010Number Percent Number Number Percent

BBC RESEARCH & CONSULTING SECTION II, PAGE 12
ThetotalpopulationofSaltLakeCityincreasedby4percentbetween2000and2011.Althoughsmall,allofthatgrowthcanbeattributedtogrowthintheminoritypopulation.Indeed,thenon‐Hispanicwhitepopulationinthecitydecreasedby2percentwhiletheminoritypopulationincreasedby19percent.GrowthrateswerehighestforAfricanAmericans,NativeHawaiians/otherPacificIslanders,andAsians.ArecentBEBRpublicationdocumentedsimilartrendsbetween2000and2010.5,6
YetgrowthintheHispanicpopulationwaslowerinthecitythaninsurroundingareas.IntheportionsofSaltLakeCountysurroundingthecity,theHispanicpopulationdoubledbetween2000and2011—increasingtheHispanicshareoftotalpopulationfrom10percentto17percent.ThepeercityofBoisealsoexperiencedveryrapidgrowthintheHispanicpopulation(113%).LikeSaltLake’s,Denver’sHispanicpopulationgrowthwasnotnearlyaslarge,increasingby12percent.
Nationalgrowthpatternsshowasubstantialincreaseintheshareofminoritieslivinginmetro‐areasuburbsthroughoutthe2000s.7Someexplanationsposedfortheracial/ethnicdiversificationofAmericansuburbsincludeemploymentdecentralizationandanincreaseintheaffordabilityofsuburbanhousingstock.8
FigureII‐11providesagraphicalrepresentationoftheracial/ethnicdistributionofSaltLakeCityin2000,2010and2011.Despitethedifferenceingrowthratesbetweenminoritiesandnon‐Hispanicwhites,changesintheoveralldistributionofthepopulationwererelativelysmall.Theminoritypopulation,asaproportionoftotalpopulation,increasedfrom29percentin2000to33percentin2011.TheHispanicshareofthepopulationincreasedfrom19percentin2000to22percentin2010butdroppedbackto19percentin2011.
Assumingconstantgrowthratesforminoritiesandnon‐Hispanicwhites,thecitycouldbeminoritymajorityinthefuture,althoughthiswouldnotoccuruntilatleast2040(basedonthegrowthratesbetween2000and2010)or2051(basedonthegrowthratesbetween2000and2011).
5http://www.bebr.utah.edu/Documents/SLCAtlas2010/SLC2010Atlas_3RaceEthnicity.pdf.
6Itshouldbenotedthatthe2010Censusreportedmoderatelyhighergrowththanthe2011ACSfortheHispanicpopulation.Itisunclearifthedifferencebetweenthe2010Censusdataandthe2011ACSdataindicatesatrendorifitreflectssamplingerror.
7http://www.brookings.edu/~/media/research/files/papers/2011/5/04%20census%20ethnicity%20frey/0504_census_ethnicity_frey.pdf.
8http://www.brookings.edu/research/speeches/2011/07/14‐census‐suburbs‐berube.

BBC RESEARCH & CONSULTING SECTION II, PAGE 13
Figure II‐11. Racial and Ethnic Composition, Salt Lake City, 2000, 2010, and 2011
Source: 2000 Census, 2010 Census, 2011 American Community Survey and BBC Research & Consulting.
FiguresII‐12andII‐13displaytheHispanicpopulationproportionandtotalminoritypopulationproportioninSaltLakeCitybyblockgroup.MinoritiesconstituteamajorityinmostblockgroupsWestofI‐15,andinsomeblockgroupsinthecitycenterandneartheUniversity.Hispanics,inparticular,compriseahighproportionofthepopulationonthewesternsideoftheI‐15corridor.

BBC RESEARCH & CONSULTING SECTION II, PAGE 14
Figure II‐12. Percent of Block Group Population that is Minority, Salt Lake City 2010
Sources: 2010 Census and BBC Research & Consulting.
BBC RESEARCH & CONSULTING SECTION II, PAGE 15
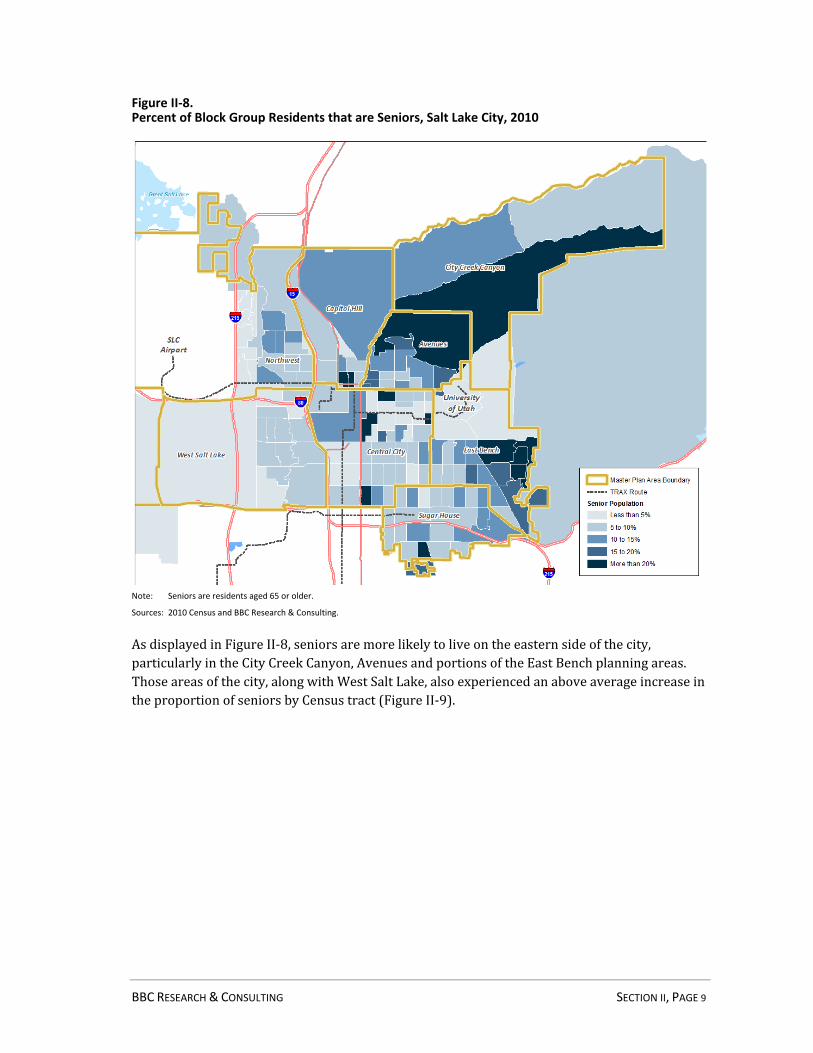
Figure II‐13. Percent of Block Group Population that is Hispanic, Salt Lake City 2010
Sources: 2010 Census and BBC Research & Consulting.
Disability.In2011,about22,600SaltLakeCityresidents—12percentofthetotalpopulation—hadatleastonetypeofdisability.Amongresidentsaged65to74,28%hadadisabilityandamongresidentsaged75oroldernearlyhalf(47%)hadadisability.FigureII‐14displaysdisabilityincidenceratesbyagegroupforSaltLakeCity.
Therearecurrently5,957seniorswithatleastonetypeofdisabilitylivinginthecity.Basedonpopulationforecastsandincidencerates,thatfigureislikelytoincreaseto8,049by2020.

BBC RESEARCH & CONSULTING SECTION II, PAGE 16
Figure II‐14. Disability by Age Cohort, Salt Lake City, 2011
Sources:
2011 American Community Survey and BBC Research & Consulting.
Poverty.ThepovertyrateforSaltLakeCitywas23percentin2011,substantiallyhigherthanthecountyandthestate(bothat14%).9BecauseofthepresenceoftheUniversityofUtah—thelimitedincomesofstudentscaninflatetruepovertynumbers—familypovertymaybeabettermeasureoftruepovertyinthecity.EighteenpercentofSaltLakeCityfamilieslivedinpovertyin2011,somewhathigherthanpeercitiessuchasBoiseandDenver(bothat13%).OgdenandWestValleyCityhadrelativelyhighratesoffamilypoverty(17%and20%respectively)butmostsuburbancommunitiesoutsideSaltLakeCityhadlowratesoffamilypoverty.
FigureII‐15displaysindividualpovertybyageandfamilypovertybyhouseholdtypeforthecity.Povertyishighestforchildren(31%ofallchildreninthecityarelivinginpoverty),especiallythoselivinginsingleparenthouseholds(54%ofsinglemotherhouseholdsand43%ofsinglefatherhouseholdsarelivinginpoverty).
Figure II‐15. Poverty, Salt Lake City, 2011
Sources:
2011 American Community Survey and BBC Research & Consulting.
FigureII‐16mapspovertyratesinSaltLakeCitybyCensustract.Thedarkestblueshadingindicatesapovertyrateexceeding40percent;researchhasshownthata40percentpovertythresholdisthepointatwhichanareabecomessociallyandeconomicallydysfunctional.
9FollowingtheOfficeofManagementandBudget's(OMB)StatisticalPolicyDirective14,theCensusBureauusesasetofmoneyincomethresholdsthatvarybyfamilysizeandcompositiontodeterminewhoisinpoverty.Forexample,in2011,thefederalpovertythresholdforindividualswas$11,484andthethresholdforafamilyoffour(withtwochildren)was$22,811.
Individuals
All people 42,336 23 % Children (under 18 years) 13,828 31 Adults (18 years and over) 28,508 20
18 to 64 years 27,153 2265 years and over 1,355 9
Families
All Families 6,845 18Married couple families 2,651 10
with children 2,349 17Male householder, no wife present: 851 26
with children 619 43Female householder, no husband present: 3,343 38
with children 3,212 54
Percent Living in
Poverty
Number Living
in Poverty
BBC RESEARCH & CONSULTING SECTION II, PAGE 17
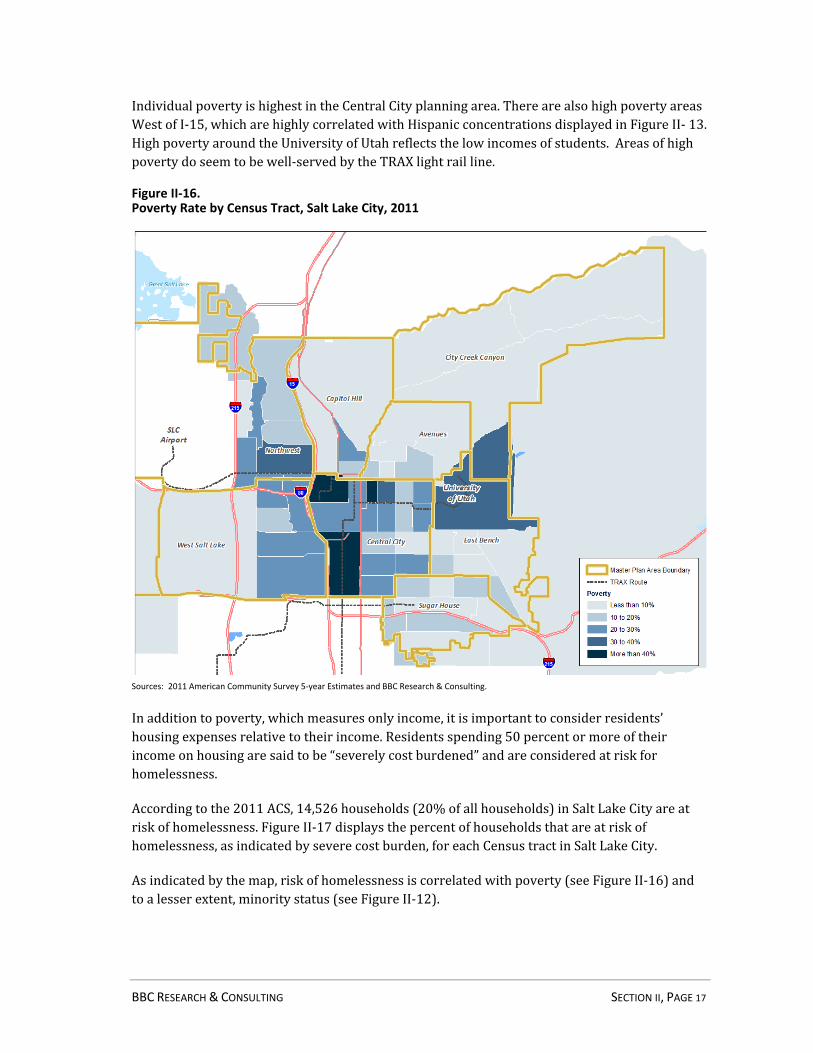
IndividualpovertyishighestintheCentralCityplanningarea.TherearealsohighpovertyareasWestofI‐15,whicharehighlycorrelatedwithHispanicconcentrationsdisplayedinFigureII‐13.HighpovertyaroundtheUniversityofUtahreflectsthelowincomesofstudents.Areasofhighpovertydoseemtobewell‐servedbytheTRAXlightrailline.
Figure II‐16. Poverty Rate by Census Tract, Salt Lake City, 2011
Sources: 2011 American Community Survey 5‐year Estimates and BBC Research & Consulting.
Inadditiontopoverty,whichmeasuresonlyincome,itisimportanttoconsiderresidents’housingexpensesrelativetotheirincome.Residentsspending50percentormoreoftheirincomeonhousingaresaidtobe“severelycostburdened”andareconsideredatriskforhomelessness.
Accordingtothe2011ACS,14,526households(20%ofallhouseholds)inSaltLakeCityareatriskofhomelessness.FigureII‐17displaysthepercentofhouseholdsthatareatriskofhomelessness,asindicatedbyseverecostburden,foreachCensustractinSaltLakeCity.
Asindicatedbythemap,riskofhomelessnessiscorrelatedwithpoverty(seeFigureII‐16)andtoalesserextent,minoritystatus(seeFigureII‐12).

BBC RESEARCH & CONSULTING SECTION II, PAGE 18
Figure II‐17. Percent of Census Tract Households at Risk of Homelessness, Salt Lake City, 2011
Note: Households spending more than 50 percent of their monthly income on housing are considered to be at risk of homelessness.
Sources: 2011 American Community Survey 5‐year Estimates and BBC Research & Consulting.
Income. In2011,themedianhouseholdincomeforSaltLakeCitywas$41,588.Asisoftenthecaseforurbancenters,SaltLakeCity’smedianincomewaslowerthanmanysurrounding,suburbancommunities.FigureII‐18showsthemedianincomeforSaltLakeCityalongwithsurroundingmunicipalities,SaltLakeCountyandtheStateofUtah.

BBC RESEARCH & CONSULTING SECTION II, PAGE 19
Figure II‐18. Median Income, Salt Lake City and Surrounding Communities, 2011
Note:
Data presented for Salt Lake City, Salt Lake County and Utah reflect 2011 1‐year estimates; Farmington reflects 2011 5‐year estimate and all other municipalities reflect 2011 3‐year estimates.
Sources:
2011 American Community Survey 1‐year, 3‐year and 5‐year estimates and BBC Research & Consulting.
Thecityhasfewermiddleandupperincomehouseholdscomparedtothecountyandstateandahigherproportionoflowincomehouseholds.Forty‐onepercentofhouseholdsinthecityearnlessthan$35,000peryear,comparedto30percentforboththecountyandthestate.FigureII‐19displaysthedistributionofhouseholdincomesforSaltLakeCity,SaltLakeCountyandtheStateofUtah.
Figure II‐19. Income Distribution, Salt Lake City, Salt Lake County and Utah, 2011
Sources: 2011 American Community Survey and BBC Research & Consulting.
Althoughtheproportionoflowincomeresidentsishigh,incomemobilityisalsohigh.Accordingtoarecentstudycomparingupwardmobilityacrossmetropolitanareas,theSaltLakeCityMSAhasoneofthehighestratesofincomemobilityofanymajormetro:morethanoneintenchildrenthatwereraisedinthebottomfifthrisetothetopfifth.Onaverage,achildwhogrows
BBC RESEARCH & CONSULTING SECTION II, PAGE 20
upintheSaltLakeCitymetropolitanstatisticalarea(MSA)withparentswhoearn$16,000orlessperyear(bottom10thpercentile)willendupinthe43rdpercentile.10
HUDAreaMedianFamilyIncome(HAMFI)isusedbyHUD’sstateandlocalpolicymakerstoqualifyhouseholdsforhousingprograms.HAMFIisthesameforallcountieslocatedwithintheSaltLakeCityMSA:$70,300in2013forafour‐personhousehold.
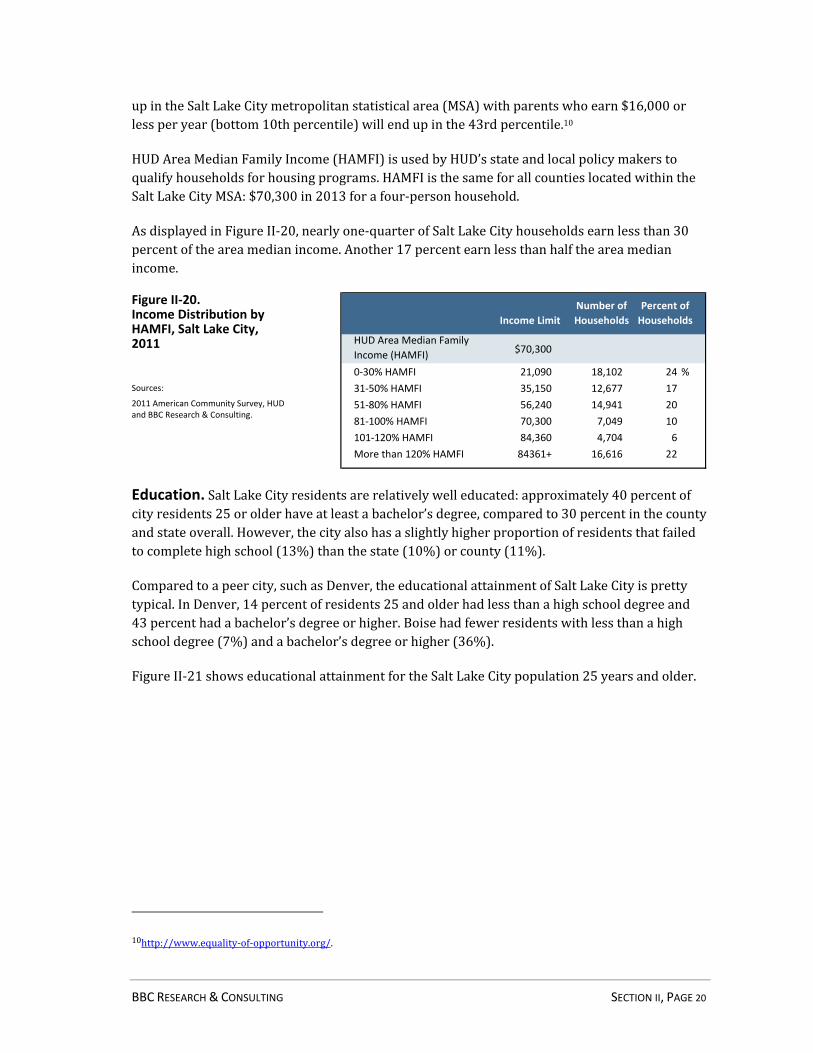
AsdisplayedinFigureII‐20,nearlyone‐quarterofSaltLakeCityhouseholdsearnlessthan30percentoftheareamedianincome.Another17percentearnlessthanhalftheareamedianincome.
Figure II‐20. Income Distribution by HAMFI, Salt Lake City, 2011
Sources:
2011 American Community Survey, HUD and BBC Research & Consulting.
Education.SaltLakeCityresidentsarerelativelywelleducated:approximately40percentofcityresidents25orolderhaveatleastabachelor’sdegree,comparedto30percentinthecountyandstateoverall.However,thecityalsohasaslightlyhigherproportionofresidentsthatfailedtocompletehighschool(13%)thanthestate(10%)orcounty(11%).
Comparedtoapeercity,suchasDenver,theeducationalattainmentofSaltLakeCityisprettytypical.InDenver,14percentofresidents25andolderhadlessthanahighschooldegreeand43percenthadabachelor’sdegreeorhigher.Boisehadfewerresidentswithlessthanahighschooldegree(7%)andabachelor’sdegreeorhigher(36%).
FigureII‐21showseducationalattainmentfortheSaltLakeCitypopulation25yearsandolder.
10http://www.equality‐of‐opportunity.org/.
HUD Area Median Family Income (HAMFI) $70,300
0‐30% HAMFI 21,090 18,102 24 %31‐50% HAMFI 35,150 12,677 1751‐80% HAMFI 56,240 14,941 2081‐100% HAMFI 70,300 7,049 10101‐120% HAMFI 84,360 4,704 6More than 120% HAMFI 84361+ 16,616 22
Income Limit
Number of
Households
Percent of
Households

BBC RESEARCH & CONSULTING SECTION II, PAGE 21
Figure II‐21. Educational Attainment, Salt Lake City and Salt Lake County, 2011
Sources:
2011 American Community Survey and BBC Research & Consulting.
Approximatelyone‐thirdofSaltLakeCityresidentsareenrolledinschool.AsshowninFigureII‐22,thereare32,455childrenenrolledinpreschoolthroughhighschooland24,983enrolledincollegeorgraduateschool.Over95percentofschool‐agedchildrenareenrolledinelementaryorhighschool.
Figure II‐22. School Enrollment, Salt Lake City, 2011
Sources: 2011 American Community Survey and BBC Research & Consulting.
Nursery school, preschool 2,748 2 % 5 %Kindergarten 2,823 2 5Elementary: 1st through 4th grade 10,442 6 18Elementary: 5th through 8th grade 7,805 4 14High School: 9th through 12th grade 8,637 5 15College (undergraduate) 18,266 10 32Graduate or professional school 6,717 4 12Total enrolled in school 57,438 32 % 100 %
Number
Percent of School
Enrollment
Percent of
Population
BBC RESEARCH & CONSULTING SECTION II, PAGE 22
Economic Indicators
Asacomplementtothedemographicprofile,thissectiondiscussestheeconomicindicatorsforSaltLakeCityresidentsandworkersfocusingonthefollowingtopics:laborforceandunemployment,employmentandearningsbyindustry,andcommutingpatterns.
Labor force and unemployment.AmongSaltLakeCityresidentsaged16andolder,70percent,about105,000residents,participateinthelaborforce.Thisindicatestheseresidentswerecurrentlyemployed(eitherpart‐timeorfull‐time)orwereactivelylookingforajob.
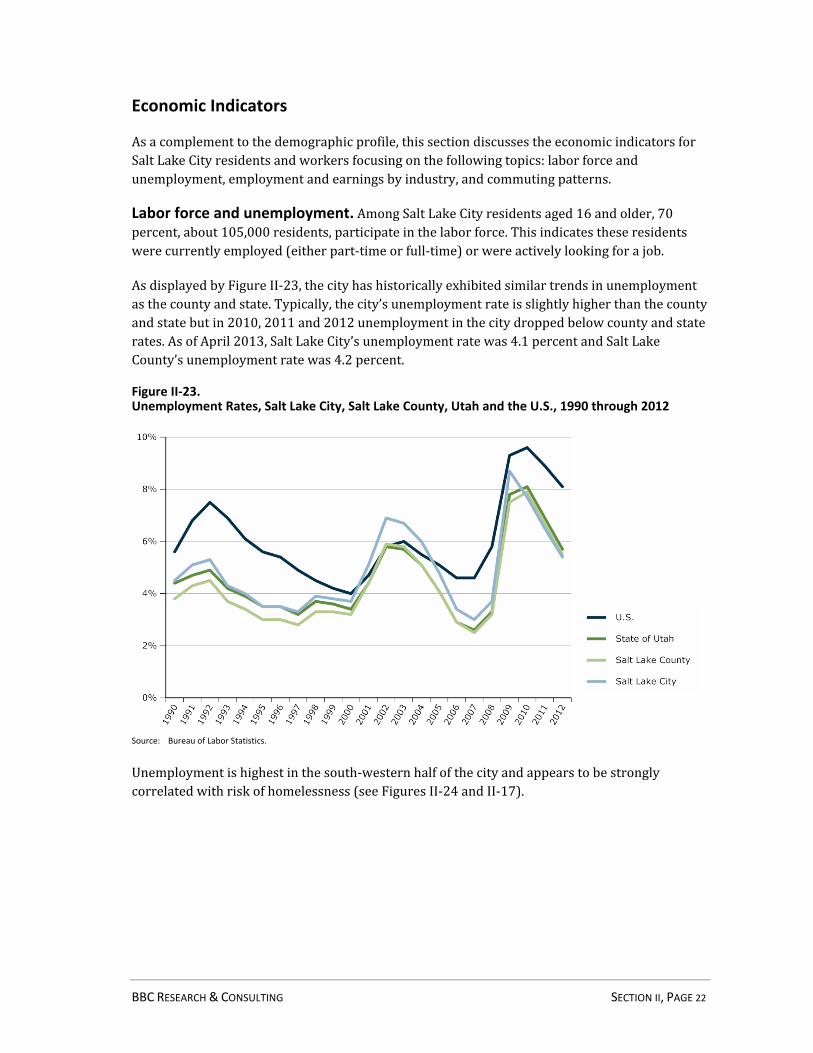
AsdisplayedbyFigureII‐23,thecityhashistoricallyexhibitedsimilartrendsinunemploymentasthecountyandstate.Typically,thecity’sunemploymentrateisslightlyhigherthanthecountyandstatebutin2010,2011and2012unemploymentinthecitydroppedbelowcountyandstaterates.AsofApril2013,SaltLakeCity’sunemploymentratewas4.1percentandSaltLakeCounty’sunemploymentratewas4.2percent.
Figure II‐23. Unemployment Rates, Salt Lake City, Salt Lake County, Utah and the U.S., 1990 through 2012
Source: Bureau of Labor Statistics.
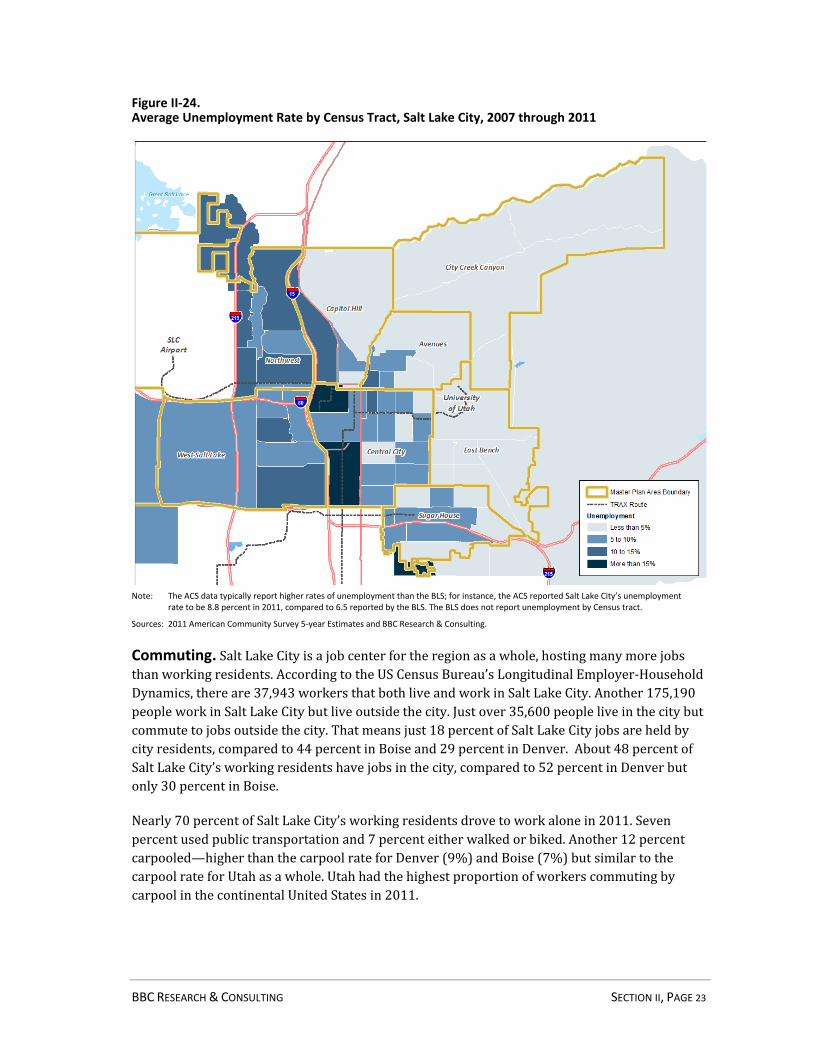
Unemploymentishighestinthesouth‐westernhalfofthecityandappearstobestronglycorrelatedwithriskofhomelessness(seeFiguresII‐24andII‐17).
BBC RESEARCH & CONSULTING SECTION II, PAGE 23
Figure II‐24. Average Unemployment Rate by Census Tract, Salt Lake City, 2007 through 2011
Note: The ACS data typically report higher rates of unemployment than the BLS; for instance, the ACS reported Salt Lake City’s unemployment rate to be 8.8 percent in 2011, compared to 6.5 reported by the BLS. The BLS does not report unemployment by Census tract.
Sources: 2011 American Community Survey 5‐year Estimates and BBC Research & Consulting.
Commuting.SaltLakeCityisajobcenterfortheregionasawhole,hostingmanymorejobsthanworkingresidents.AccordingtotheUSCensusBureau’sLongitudinalEmployer‐HouseholdDynamics,thereare37,943workersthatbothliveandworkinSaltLakeCity.Another175,190peopleworkinSaltLakeCitybutliveoutsidethecity.Justover35,600peopleliveinthecitybutcommutetojobsoutsidethecity.Thatmeansjust18percentofSaltLakeCityjobsareheldbycityresidents,comparedto44percentinBoiseand29percentinDenver.About48percentofSaltLakeCity’sworkingresidentshavejobsinthecity,comparedto52percentinDenverbutonly30percentinBoise.
Nearly70percentofSaltLakeCity’sworkingresidentsdrovetoworkalonein2011.Sevenpercentusedpublictransportationand7percenteitherwalkedorbiked.Another12percentcarpooled—higherthanthecarpoolrateforDenver(9%)andBoise(7%)butsimilartothecarpoolrateforUtahasawhole.UtahhadthehighestproportionofworkerscommutingbycarpoolinthecontinentalUnitedStatesin2011.

BBC RESEARCH & CONSULTING SECTION II, PAGE 24
Figure II‐25. Means of Transportation to Work, Salt Lake City, 2011
Sources:
2011 American Community Survey and BBC Research & Consulting.
Employment and earnings by industry.FigureII‐26displaysemploymentbyindustryforpeopleworkinginthecityandforpeoplelivinginthecity.Thefigurealsodisplaystheaverage2011wageforeachindustry.
Figure II‐26. Employment and Earnings by Industry, Salt Lake City, 2011
Note: People who live and work the city are included in both distributions. Average annual wages are estimated for the county as a whole.
Sources: US Census Bureau’s Longitudinal Employer‐Household Dynamics, Bureau of Labor Statistics Quarterly Census of Employment and Wages (BLS QCEW) and BBC Research & Consulting.
BBC RESEARCH & CONSULTING SECTION II, PAGE 25
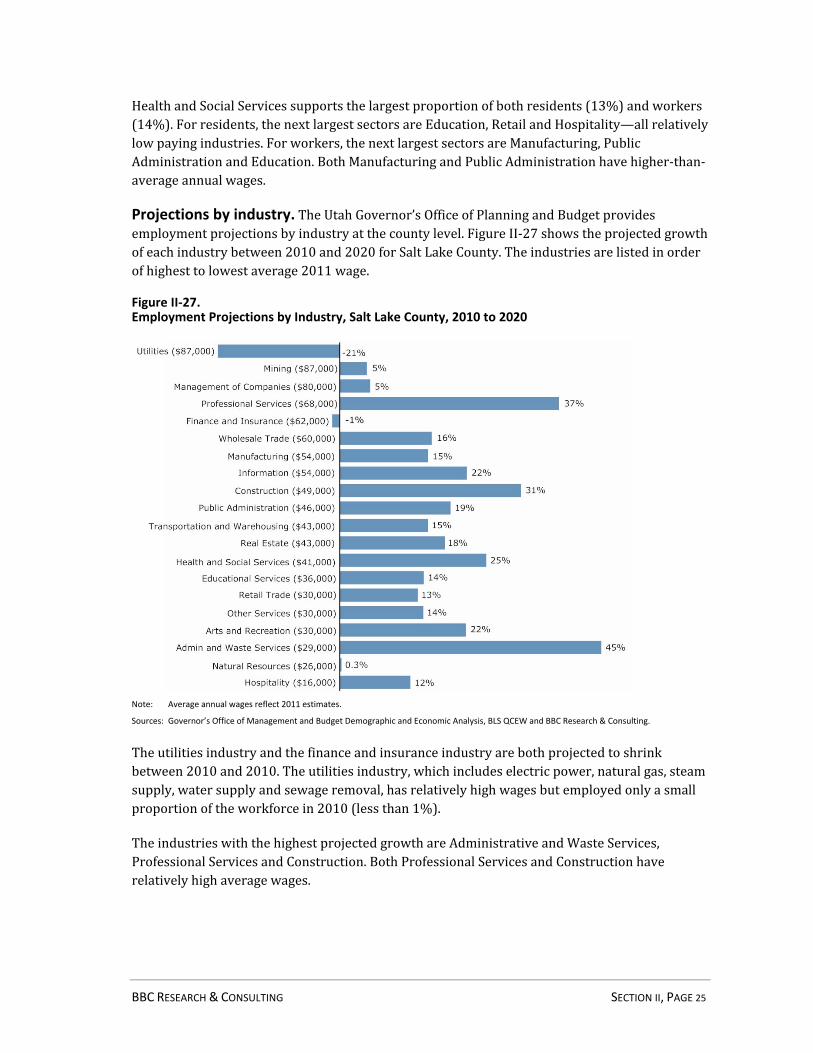
HealthandSocialServicessupportsthelargestproportionofbothresidents(13%)andworkers(14%).Forresidents,thenextlargestsectorsareEducation,RetailandHospitality—allrelativelylowpayingindustries.Forworkers,thenextlargestsectorsareManufacturing,PublicAdministrationandEducation.BothManufacturingandPublicAdministrationhavehigher‐than‐averageannualwages.
Projections by industry.TheUtahGovernor’sOfficeofPlanningandBudgetprovidesemploymentprojectionsbyindustryatthecountylevel.FigureII‐27showstheprojectedgrowthofeachindustrybetween2010and2020forSaltLakeCounty.Theindustriesarelistedinorderofhighesttolowestaverage2011wage.
Figure II‐27. Employment Projections by Industry, Salt Lake County, 2010 to 2020
Note: Average annual wages reflect 2011 estimates.
Sources: Governor’s Office of Management and Budget Demographic and Economic Analysis, BLS QCEW and BBC Research & Consulting.
Theutilitiesindustryandthefinanceandinsuranceindustryarebothprojectedtoshrinkbetween2010and2010.Theutilitiesindustry,whichincludeselectricpower,naturalgas,steamsupply,watersupplyandsewageremoval,hasrelativelyhighwagesbutemployedonlyasmallproportionoftheworkforcein2010(lessthan1%).
TheindustrieswiththehighestprojectedgrowthareAdministrativeandWasteServices,ProfessionalServicesandConstruction.BothProfessionalServicesandConstructionhaverelativelyhighaveragewages.
SECTION III.
Housing Profile and Affordability

BBC RESEARCH & CONSULTING SECTION III, PAGE 1
SECTION III. Housing Profile and Affordability
ThissectionprovidesanoverviewofSaltLakeCity’shousingstock,includingunittypes,renterversusownercomparisonandvacancyrates.AffordabilityisalsodiscussedbutmarketmismatchesareaddressedinSectionIV.Keyfindingsfromthissectioninclude:
SaltLakeCityishometomorerenters(53%)thanowners(47%).Renterstendtobeyounger,havelowerlevelsofeducationalattainmentandearnlowerincomesthanowners.Rentersarealsomorelikelytobenon‐familyhouseholdsandsingle‐personhouseholds.
Minorityhouseholdsinthecitymuchlesslikelytobehomeownersthannon‐Hispanicwhitehouseholdsbuttendtobelargerthannon‐Hispanicwhitehouseholds.
Comparedtosurroundingcommunities,medianrentisrelativelylow($761)andmedianhomevalue($225,600)ismoderate.
Bothrentersandownerslostpurchasingpowerbetween2000and2011;thatis,homevalues(andsaleprices)increasedfasterthanownerincomesandrentincreasedfasterthanrenterincomes.
Medianhomevalueincreased47percentandmediansalepriceforhomesincreased36percentbutownerincomesincreasedbyonly26percent.
Medianrentincreased35percentbutrenterincomesincreasedonly17percent.
Forty‐twopercentofSaltLakeCityhouseholdsarecostburdened(spending30%ormoreoftheirincomeonhousing).Abouttwo‐thirdsofthosehouseholdsarerenters.
Existing Housing Stock
Accordingtothe2011ACSthereare79,105housingunitsinSaltLakeCity,upfrom77,054in2000—a3percentincrease.Thecity’shousingstockaccountsfor19percentofthehousingunitsinSaltLakeCounty.Justfewerthanhalf(47%)ofhouseholdsinthecityareowner‐occupied.
Housing type.Overall,abouthalfofSaltLakeCity’shousingstockissinglefamilydetachedandhalfisattachedhousing(apartments,condos,townhomes,etc).Thevastmajorityofowners(85%)liveinsinglefamilydetachedhousesandthevastmajorityofrenters(81%)liveinattachedunits.FigureIII‐1displayshousingtypebytenureforSaltLakeCity.

BBC RESEARCH & CONSULTING SECTION III, PAGE 2
Figure III‐1. Housing Type by Tenure, Salt Lake City, 2011
Source:
2011 American Community Survey and BBC Research & Consulting.
FigureIII‐2displaystheproportionofhomesthataredetachedsinglefamilyhomesbyCensustract.Notsurprisingly,thecitycenterandUniversityareahavealowproportionofdetachedhomesandtheouterportionsofthecityhaveahigherproportionofdetachedhomes.

BBC RESEARCH & CONSULTING SECTION III, PAGE 3
Figure III‐2. Percent of Census Tract Households that are Single Family Detached, Salt Lake City, 2010
Source: 2010 Census.
Household size and bedrooms. Onaverage,owner‐occupiedhouseholdsinSaltLakeCityarelarger(2.73people)thanrenteroccupiedhouseholds(2.27people).Owneroccupiedunitsalsotendtohavemorebedroomsthanrenteroccupiedunits.Nearlythreequartersofowneroccupiedhomeshavethreeormorebedrooms,comparedtolessthanonequarterofrenteroccupiedhomes(seeFigureIII‐3).

BBC RESEARCH & CONSULTING SECTION III, PAGE 4
Figure III‐3. Number of Bedrooms by Tenure, Salt Lake City, 2011
Source:
2011 American Community Survey and BBC Research & Consulting.
Household size and tenure by race and ethnicity.AsdiscussedinSectionII,theaveragehouseholdsizeforSaltLakeCityis2.48,lowerthanthestate(3.13)andcounty(2.99)buthigherthanpeercitiessuchasDenver(2.27)andBoise(2.42).AsdisplayedinFigureIII‐4,minorityhouseholdsinthecitytendtobelargerthannon‐Hispanicwhitehouseholdsbutminoritiesaremuchlesslikelytobehomeownersthannon‐Hispanicwhitehouseholds.
Figure III‐4. Average Household Size and Ownership Rate by Race and Ethnicity, Salt Lake City, 2010
Source:
2010 Census and BBC Research & Consulting.
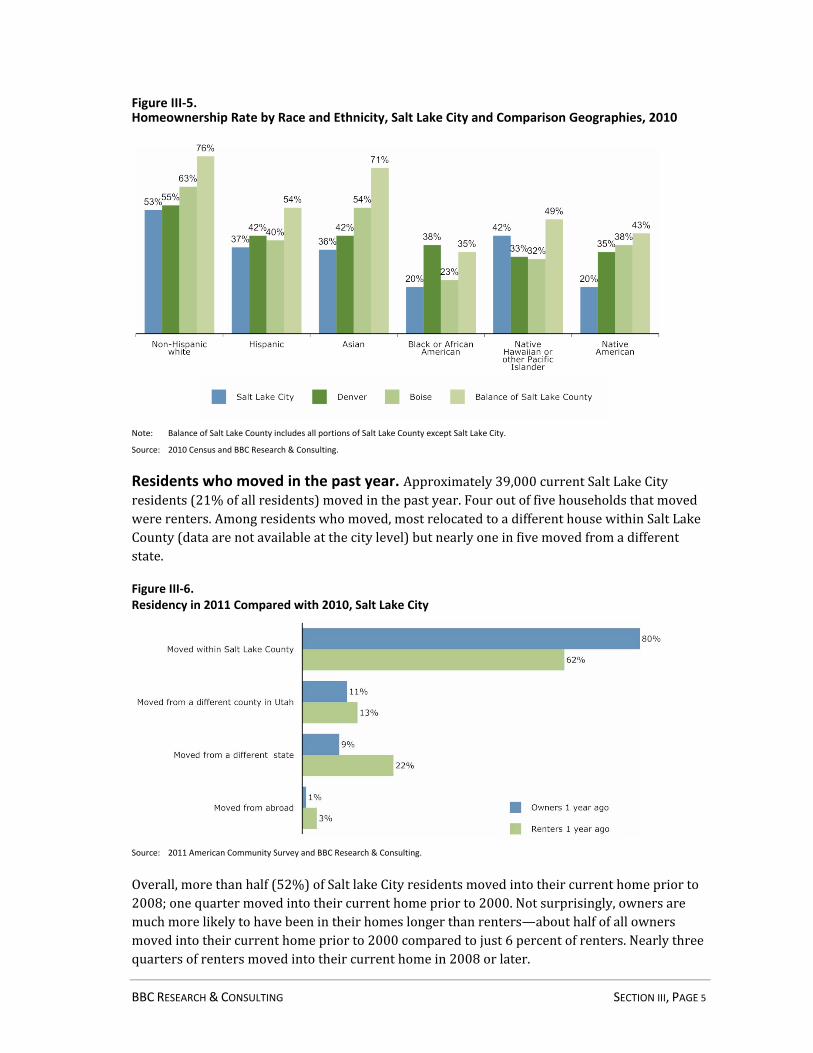
InSaltLakeCity,53percentofnon‐Hispanicwhitehouseholdersareownerscomparedtoonly37percentofHispanichouseholders.OwnershipratesareevenlowerforAfricanAmerican(20%),NativeAmerican(20%)andAsian(36%)householders.Ownershipratesforallgroupsarehigheroutsidethecity(inthebalanceofthecounty)butsimilarracial/ethnicdisparitiesexist.FigureIII‐5comparestenurebyraceandethnicityinSaltLakeCitytothebalanceofthecounty,thestateandpeercities(BoiseandDenver).
Non‐Hispanic white 2.17 53%Hispanic 3.66 37%Asian 2.42 36%Black or African American 2.67 20%Native Hawaiian or other Pacific Islander 4.60 42%Native American 2.78 20%
Average
Household Size
Ownership
Rate
BBC RESEARCH & CONSULTING SECTION III, PAGE 5
Figure III‐5. Homeownership Rate by Race and Ethnicity, Salt Lake City and Comparison Geographies, 2010
Note: Balance of Salt Lake County includes all portions of Salt Lake County except Salt Lake City.
Source: 2010 Census and BBC Research & Consulting.
Residents who moved in the past year. Approximately39,000currentSaltLakeCityresidents(21%ofallresidents)movedinthepastyear.Fouroutoffivehouseholdsthatmovedwererenters.Amongresidentswhomoved,mostrelocatedtoadifferenthousewithinSaltLakeCounty(dataarenotavailableatthecitylevel)butnearlyoneinfivemovedfromadifferentstate.
Figure III‐6. Residency in 2011 Compared with 2010, Salt Lake City
Source: 2011 American Community Survey and BBC Research & Consulting.
Overall,morethanhalf(52%)ofSaltlakeCityresidentsmovedintotheircurrenthomepriorto2008;onequartermovedintotheircurrenthomepriorto2000.Notsurprisingly,ownersaremuchmorelikelytohavebeenintheirhomeslongerthanrenters—abouthalfofallownersmovedintotheircurrenthomepriorto2000comparedtojust6percentofrenters.Nearlythreequartersofrentersmovedintotheircurrenthomein2008orlater.
BBC RESEARCH & CONSULTING SECTION III, PAGE 6
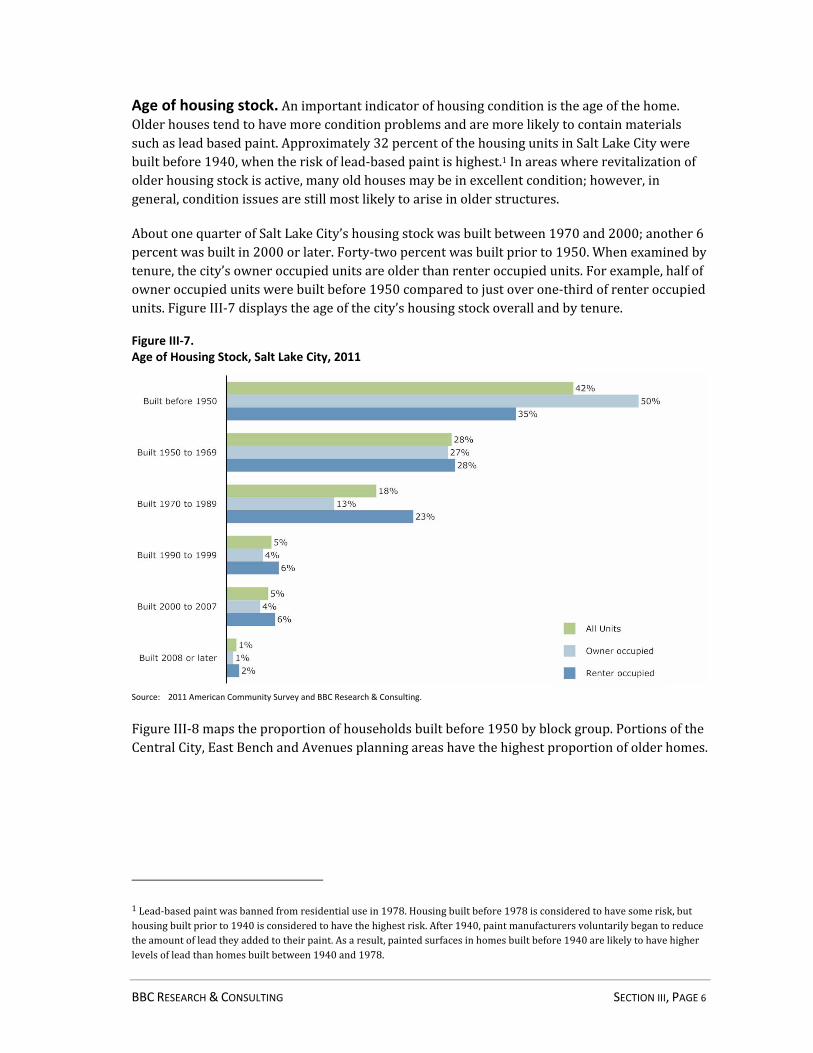
Age of housing stock.Animportantindicatorofhousingconditionistheageofthehome.Olderhousestendtohavemoreconditionproblemsandaremorelikelytocontainmaterialssuchasleadbasedpaint.Approximately32percentofthehousingunitsinSaltLakeCitywerebuiltbefore1940,whentheriskoflead‐basedpaintishighest.1Inareaswhererevitalizationofolderhousingstockisactive,manyoldhousesmaybeinexcellentcondition;however,ingeneral,conditionissuesarestillmostlikelytoariseinolderstructures.
AboutonequarterofSaltLakeCity’shousingstockwasbuiltbetween1970and2000;another6percentwasbuiltin2000orlater.Forty‐twopercentwasbuiltpriorto1950.Whenexaminedbytenure,thecity’sowneroccupiedunitsareolderthanrenteroccupiedunits.Forexample,halfofowneroccupiedunitswerebuiltbefore1950comparedtojustoverone‐thirdofrenteroccupiedunits.FigureIII‐7displaystheageofthecity’shousingstockoverallandbytenure.
Figure III‐7. Age of Housing Stock, Salt Lake City, 2011
Source: 2011 American Community Survey and BBC Research & Consulting.
FigureIII‐8mapstheproportionofhouseholdsbuiltbefore1950byblockgroup.PortionsoftheCentralCity,EastBenchandAvenuesplanningareashavethehighestproportionofolderhomes.
1Lead‐basedpaintwasbannedfromresidentialusein1978.Housingbuiltbefore1978isconsideredtohavesomerisk,buthousingbuiltpriorto1940isconsideredtohavethehighestrisk.After1940,paintmanufacturersvoluntarilybegantoreducetheamountofleadtheyaddedtotheirpaint.Asaresult,paintedsurfacesinhomesbuiltbefore1940arelikelytohavehigherlevelsofleadthanhomesbuiltbetween1940and1978.
BBC RESEARCH & CONSULTING SECTION III, PAGE 7
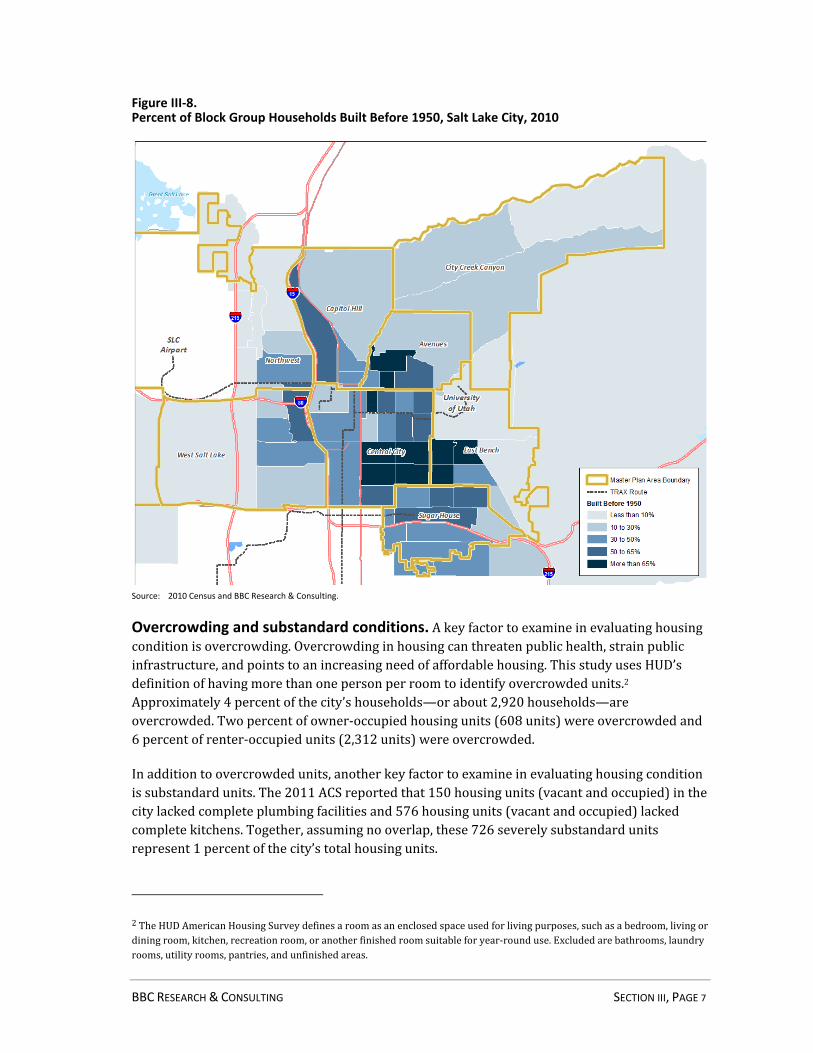
Figure III‐8. Percent of Block Group Households Built Before 1950, Salt Lake City, 2010
Source: 2010 Census and BBC Research & Consulting.
Overcrowding and substandard conditions.Akeyfactortoexamineinevaluatinghousingconditionisovercrowding.Overcrowdinginhousingcanthreatenpublichealth,strainpublicinfrastructure,andpointstoanincreasingneedofaffordablehousing.ThisstudyusesHUD’sdefinitionofhavingmorethanonepersonperroomtoidentifyovercrowdedunits.2Approximately4percentofthecity’shouseholds—orabout2,920households—areovercrowded.Twopercentofowner‐occupiedhousingunits(608units)wereovercrowdedand6percentofrenter‐occupiedunits(2,312units)wereovercrowded.
Inadditiontoovercrowdedunits,anotherkeyfactortoexamineinevaluatinghousingconditionissubstandardunits.The2011ACSreportedthat150housingunits(vacantandoccupied)inthecitylackedcompleteplumbingfacilitiesand576housingunits(vacantandoccupied)lackedcompletekitchens.Together,assumingnooverlap,these726severelysubstandardunitsrepresent1percentofthecity’stotalhousingunits.
2TheHUDAmericanHousingSurveydefinesaroomasanenclosedspaceusedforlivingpurposes,suchasabedroom,livingordiningroom,kitchen,recreationroom,oranotherfinishedroomsuitableforyear‐rounduse.Excludedarebathrooms,laundryrooms,utilityrooms,pantries,andunfinishedareas.

BBC RESEARCH & CONSULTING SECTION III, PAGE 8
Profile of Renters and Owners
SaltLakeCityishometomorerenters(53%)thanowners(47%).Renterstendtobeyounger,havelowerlevelsofeducationalattainmentandearnlowerincomesthanowners.Rentersarealsomorelikelytobenon‐familyhouseholdsandsingle‐personhouseholds.FigureIII‐9summarizessomeofthekeydifferencesbetweenrentersandownersinSaltLakeCity.Additionaldetailontheage,educationalattainment,householdcomposition,andincomeofrentersandownersfollow.
Figure III‐9. Key Differences Between Renters and Owners, Salt Lake City, 2011
Source:
2011 American Community Survey and BBC Research & Consulting.
Age.Aboutone‐thirdofownersaremiddleaged(25to44),comparedtomorethanhalf(56%)ofrenters.Homeownersarealsomorelikelytobeseniors—22percentofownersare65oroldercomparedto8percentofrenters.FigureIII‐10displaystheageprofileofrentersandownersinSaltLakeCity.
Figure III‐10. Age of Householder by Tenure, Salt Lake City, 2011
Source:
2011 American Community Survey and BBC Research & Consulting.
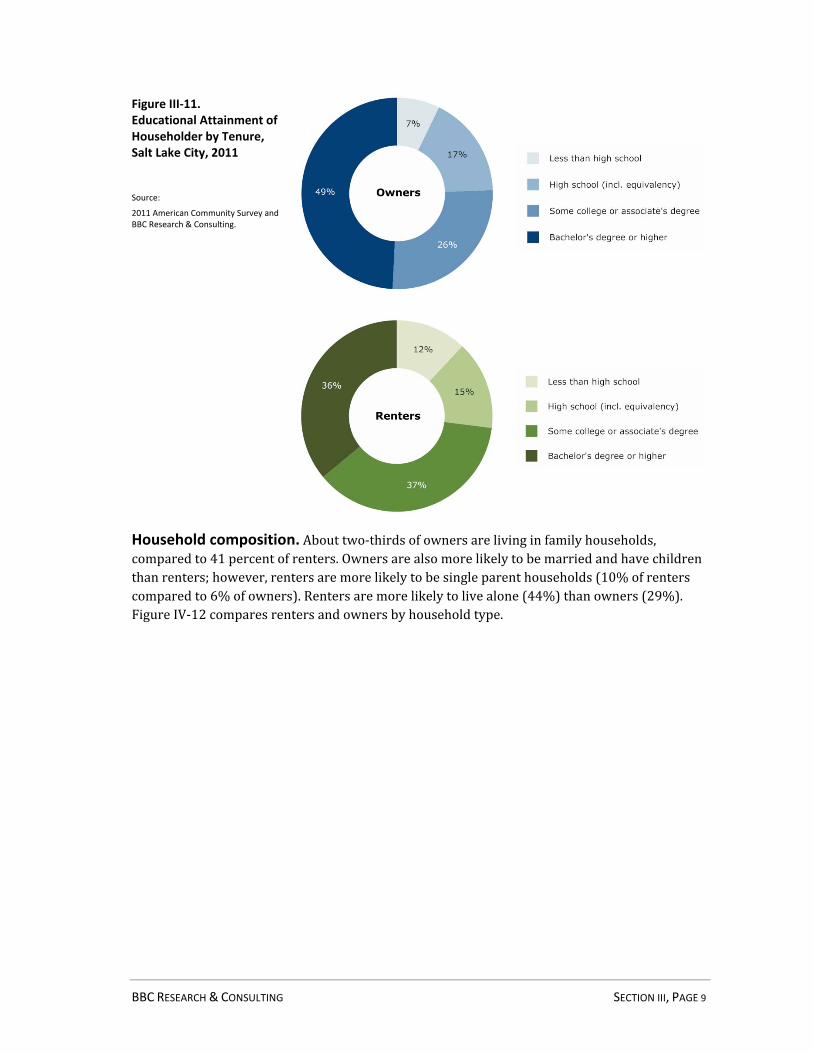
Educational attainment.Nearlyhalfofhomeownershaveabachelor’sdegreeorhigherandonly7percentfailedtocompletehighschool.Amongrenters,12percenthavelessthanahighschooldegreeand36percenthaveabachelor’sdegreeorhigher.
Age: 25 to 44 34% 56%Education: Bachelors degree or higher 49% 36%Income: Median $66,297 $29,133Household type: Families 66% 41%
Owner
householders
Renter
householders
BBC RESEARCH & CONSULTING SECTION III, PAGE 9
Figure III‐11. Educational Attainment of Householder by Tenure, Salt Lake City, 2011
Source:
2011 American Community Survey and BBC Research & Consulting.
Household composition.Abouttwo‐thirdsofownersarelivinginfamilyhouseholds,comparedto41percentofrenters.Ownersarealsomorelikelytobemarriedandhavechildrenthanrenters;however,rentersaremorelikelytobesingleparenthouseholds(10%ofrenterscomparedto6%ofowners).Rentersaremorelikelytolivealone(44%)thanowners(29%).FigureIV‐12comparesrentersandownersbyhouseholdtype.

BBC RESEARCH & CONSULTING SECTION III, PAGE 10
Figure III‐12. Household Type by Tenure, Salt Lake City, 2011
Source: 2011 American Community Survey and BBC Research & Consulting.
BBC RESEARCH & CONSULTING SECTION III, PAGE 11
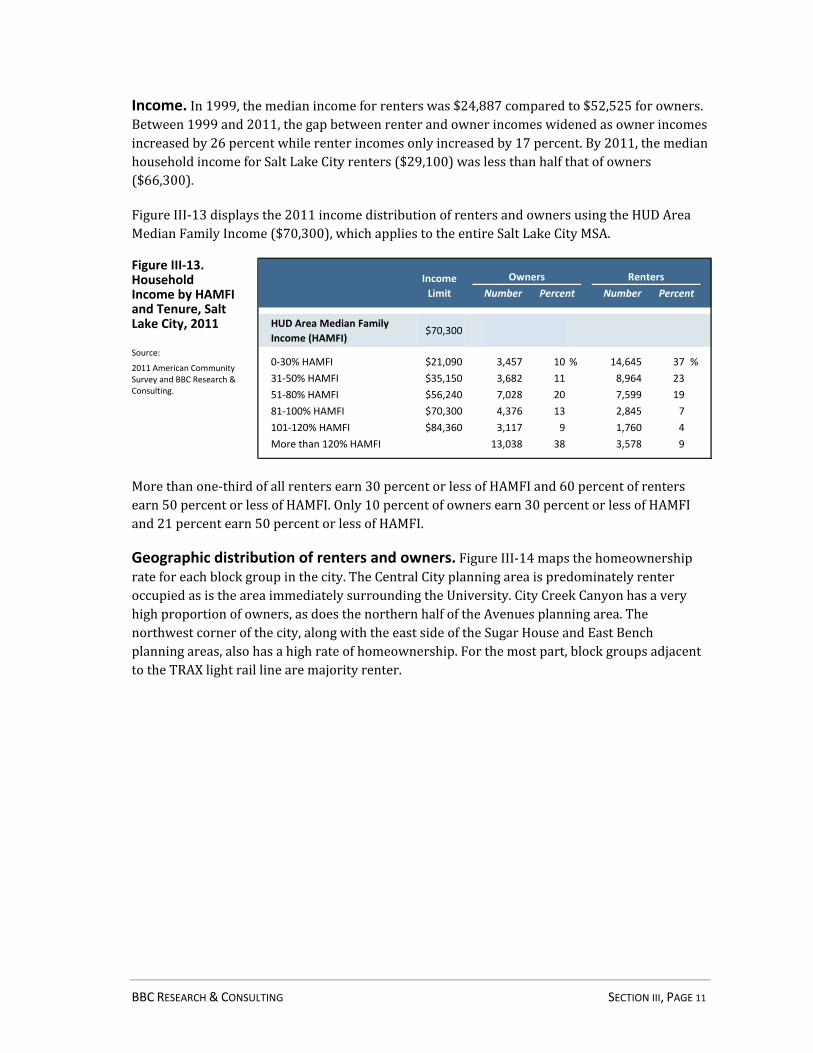
Income.In1999,themedianincomeforrenterswas$24,887comparedto$52,525forowners.Between1999and2011,thegapbetweenrenterandownerincomeswidenedasownerincomesincreasedby26percentwhilerenterincomesonlyincreasedby17percent.By2011,themedianhouseholdincomeforSaltLakeCityrenters($29,100)waslessthanhalfthatofowners($66,300).
FigureIII‐13displaysthe2011incomedistributionofrentersandownersusingtheHUDAreaMedianFamilyIncome($70,300),whichappliestotheentireSaltLakeCityMSA.
Figure III‐13. Household Income by HAMFI and Tenure, Salt Lake City, 2011
Source:
2011 American Community Survey and BBC Research & Consulting.
Morethanone‐thirdofallrentersearn30percentorlessofHAMFIand60percentofrentersearn50percentorlessofHAMFI.Only10percentofownersearn30percentorlessofHAMFIand21percentearn50percentorlessofHAMFI.
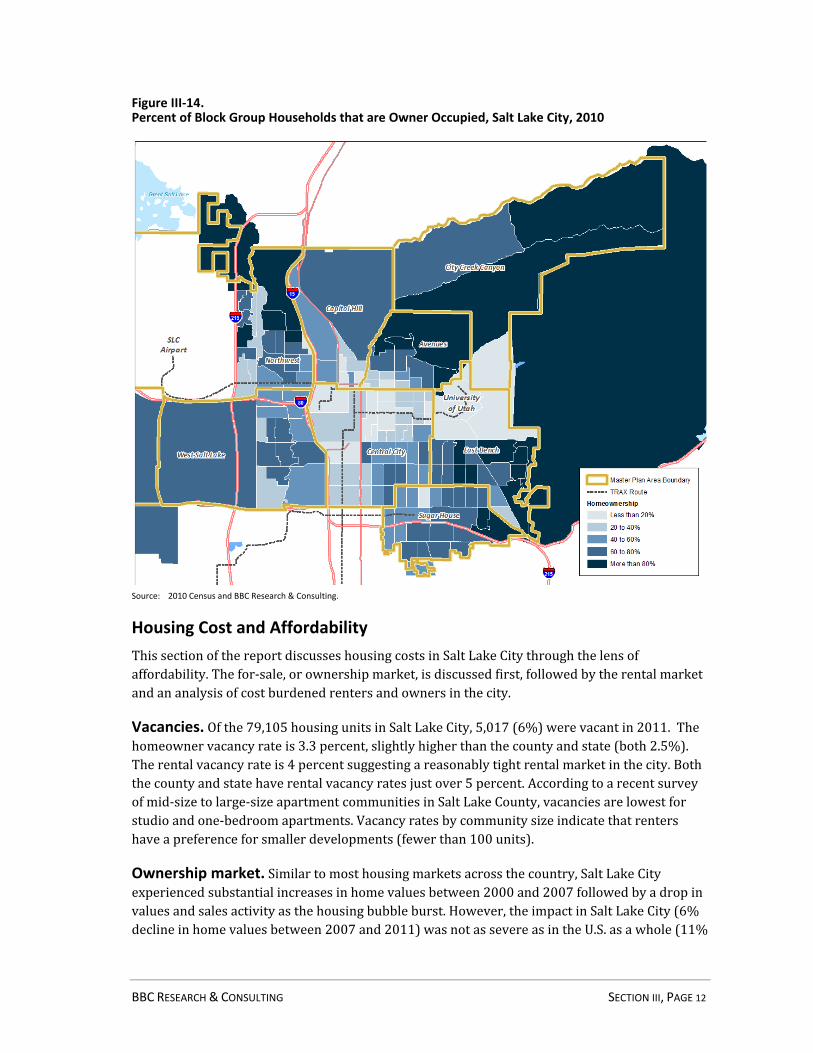
Geographic distribution of renters and owners.FigureIII‐14mapsthehomeownershiprateforeachblockgroupinthecity.TheCentralCityplanningareaispredominatelyrenteroccupiedasistheareaimmediatelysurroundingtheUniversity.CityCreekCanyonhasaveryhighproportionofowners,asdoesthenorthernhalfoftheAvenuesplanningarea.Thenorthwestcornerofthecity,alongwiththeeastsideoftheSugarHouseandEastBenchplanningareas,alsohasahighrateofhomeownership.Forthemostpart,blockgroupsadjacenttotheTRAXlightraillinearemajorityrenter.
HUD Area Median Family
Income (HAMFI)$70,300
0‐30% HAMFI $21,090 3,457 10 % 14,645 37 %31‐50% HAMFI $35,150 3,682 11 8,964 2351‐80% HAMFI $56,240 7,028 20 7,599 1981‐100% HAMFI $70,300 4,376 13 2,845 7101‐120% HAMFI $84,360 3,117 9 1,760 4More than 120% HAMFI 13,038 38 3,578 9
PercentNumberRentersIncome
Limit PercentNumberOwners
BBC RESEARCH & CONSULTING SECTION III, PAGE 12
Figure III‐14. Percent of Block Group Households that are Owner Occupied, Salt Lake City, 2010
Source: 2010 Census and BBC Research & Consulting.
Housing Cost and Affordability
ThissectionofthereportdiscusseshousingcostsinSaltLakeCitythroughthelensofaffordability.Thefor‐sale,orownershipmarket,isdiscussedfirst,followedbytherentalmarketandananalysisofcostburdenedrentersandownersinthecity.
Vacancies.Ofthe79,105housingunitsinSaltLakeCity,5,017(6%)werevacantin2011.Thehomeownervacancyrateis3.3percent,slightlyhigherthanthecountyandstate(both2.5%).Therentalvacancyrateis4percentsuggestingareasonablytightrentalmarketinthecity.Boththecountyandstatehaverentalvacancyratesjustover5percent.Accordingtoarecentsurveyofmid‐sizetolarge‐sizeapartmentcommunitiesinSaltLakeCounty,vacanciesarelowestforstudioandone‐bedroomapartments.Vacancyratesbycommunitysizeindicatethatrentershaveapreferenceforsmallerdevelopments(fewerthan100units).
Ownership market.Similartomosthousingmarketsacrossthecountry,SaltLakeCityexperiencedsubstantialincreasesinhomevaluesbetween2000and2007followedbyadropinvaluesandsalesactivityasthehousingbubbleburst.However,theimpactinSaltLakeCity(6%declineinhomevaluesbetween2007and2011)wasnotassevereasintheU.S.asawhole(11%
BBC RESEARCH & CONSULTING SECTION III, PAGE 13
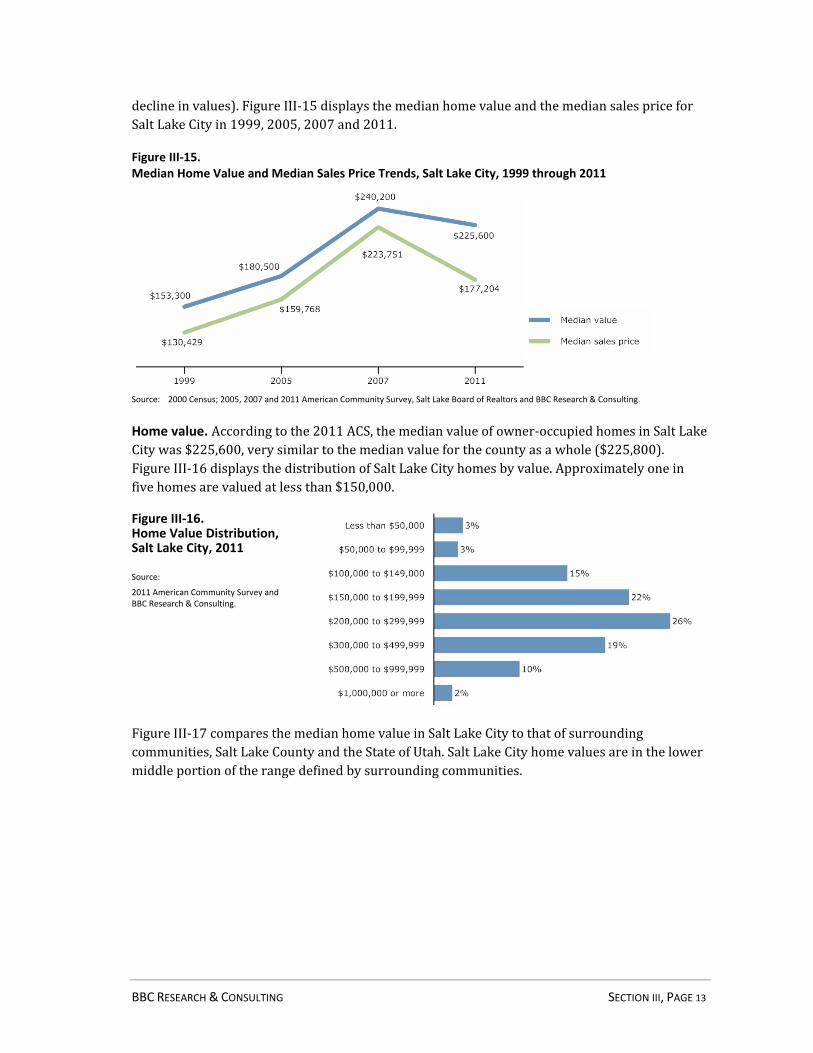
declineinvalues).FigureIII‐15displaysthemedianhomevalueandthemediansalespriceforSaltLakeCityin1999,2005,2007and2011.
Figure III‐15. Median Home Value and Median Sales Price Trends, Salt Lake City, 1999 through 2011
Source: 2000 Census; 2005, 2007 and 2011 American Community Survey, Salt Lake Board of Realtors and BBC Research & Consulting.
Home value. Accordingtothe2011ACS,themedianvalueofowner‐occupiedhomesinSaltLakeCitywas$225,600,verysimilartothemedianvalueforthecountyasawhole($225,800).FigureIII‐16displaysthedistributionofSaltLakeCityhomesbyvalue.Approximatelyoneinfivehomesarevaluedatlessthan$150,000.
Figure III‐16. Home Value Distribution, Salt Lake City, 2011
Source:
2011 American Community Survey and BBC Research & Consulting.
FigureIII‐17comparesthemedianhomevalueinSaltLakeCitytothatofsurroundingcommunities,SaltLakeCountyandtheStateofUtah.SaltLakeCityhomevaluesareinthelowermiddleportionoftherangedefinedbysurroundingcommunities.

BBC RESEARCH & CONSULTING SECTION III, PAGE 14
Figure III‐17. Median Home Value, Salt Lake City and Surrounding Communities, 2011
Note:
Data presented for Murray, Bountiful, South Jordan and Draper reflect 2011 3‐year estimates; Farmington reflects 2011 5‐year estimate and all other municipalities reflect 2011 1‐year estimates.
Source:
2011 American Community Survey 1‐year, 3‐year and 5‐year estimates and BBC Research & Consulting.
Between2000and2011themedianhomevalueinSaltLakeCityincreased47percent,from$153,300to$225,600.Asdisplayedinthefollowingmap,thelargestincreaseswereseenintheCentralCityplanningarea,alongwithportionsoftheEastBench,SugarHouse,AvenuesandCapitalHillplanningareas.ThereweretwoCensustractsinthecitywheremedianhomevalueactuallydeclinedbetween2000and2011:thenorthwestcorneroftheCentralCityplanningareaandtheCensustractcontainingtheUniversityofUtah.

BBC RESEARCH & CONSULTING SECTION III, PAGE 15
Figure III‐18. Percent Change in Median Home Value by Census Tract, Salt Lake City, 2000 to 2011
Note: Due to minor changes in the geographic boundary of some Census tracts between 2000 and 2010 some tracts were combined for analysis.
Source: 2000 Census, 2011 American Community Survey 5‐year estimate and BBC Research & Consulting.
Home sales. In2012,nearly4,200homesweresoldinSaltLakeCityforamediansalepriceof$178,162.Approximatelyfouroutoffivesalesweresinglefamilydetachedhomes,aproportionrepresentativeofthedetachedhousingstockinthecity.Between2005and2012,housingpricesincreasedfasterinthecity(14%)thaninthecountyasawhole(11%).

BBC RESEARCH & CONSULTING SECTION III, PAGE 16
Figure III‐19. Median Sold Price for Homes in Salt Lake City and Salt Lake County, 2005 and 2012
Note:
Attached includes condos, townhomes, and twins.
Source:
Multiple List Service (MLS) and BBC Research & Consulting.
FigureIII‐20comparesthe2012mediansalepriceforhomessoldinSaltLakeCitytosurroundingcommunities.SimilartoSaltLakeCityhomevalues(FigureIII‐17),themediansalespriceofSaltLakeCityhomesisinthelowermiddleportionoftherangedefinedbysurroundingcommunities.
Figure III‐20. Median Sold Price, Salt Lake City and Surrounding Communities, 2012
Source:
Multiple List Service (MLS) and BBC Research & Consulting.
Foreclosures.Withtherecentcollapseofthehousingmarket,foreclosureshavebeenontheriseacrossthecountry.Inanefforttoinformcommunitydecisionsregardingforeclosurepreventionandneighborhoodstabilization,theLocalInitiativesSupportCorporation(LISC)providesforeclosureriskscoresforzipcodesbymetropolitanarea(dataareofMarch2013).Thehighestriskzipcodeinthemetroareaisassignedascoreof100andallothersareassignedarelativescore.
Thezipcodewiththehighestriskinthemetroareawas84118,inKearns.Foreclosureriskinthecityitselfwasrelativelylow.FigureIII‐21displaystheLISCforeclosureriskscoresforSaltLakeCity.
Salt Lake City
All Homes $162,500 $185,000 14 %Single Family Detached 172,500 196,893 14Attached* 129,950 145,000 12
Salt Lake County
All Homes $175,000 $195,000 11 %Single Family Detached 187,500 212,000 13Attached* 132,900 144,050 8
2005 2012 % Change

BBC RESEARCH & CONSULTING SECTION III, PAGE 17
Figure III‐21. Foreclosure Risk Score by Zip Code, Salt Lake City Metro Area, 2013
Source: Local Initiatives Support Corporation (LISC) and BBC Research & Consulting.
Rental market.Accordingtothe2011ACS,medianrent(includingutilities)inSaltLakeCitywas$761permonth,upfrom$564in2000.AsshowninFigureIII‐22,mostrenters(61%)paybetween$500and$1,000fortheirunits.Sixpercentpaylessthan$300and7percentpaymorethan$1,500permonth.
Figure III‐22. Gross Rent Distribution, Salt Lake City, 2011
Source:
2011 American Community Survey and BBC Research & Consulting.
FigureIII‐23comparesthemedianrentinSaltLakeCitytothatofsurroundingcommunities,SaltLakeCountyandtheStateofUtah.Asindicatedbythefigure,themedianrentinSaltLakeCityisrelativelyaffordablecomparedtosurroundingcommunities.

BBC RESEARCH & CONSULTING SECTION III, PAGE 18
Figure III‐23. Median Rent, Salt Lake City and Surrounding Communities, 2011
Note:
Data presented for Salt Lake City, Salt Lake County and Utah reflect 2011 1‐year estimates; Farmington reflects 2011 5‐year estimate and all other municipalities reflect 2011 3‐year estimates.
Source:
2011 American Community Survey 1‐year, 3‐year and 5‐year estimates and BBC Research & Consulting.
Cost burden.Animportantmeasurementofacity’shousingenvironmentisthepercentageofahousehold’stotalmonthlyincomethatmustbespentonhousingcosts.Itiscommonpracticetolabelanyhouseholdspending30percentormoreoftheirmonthlyincomeonhousingexpensesas“cost‐burdened.”
In2011,overhalf(54%)ofrentersspentatleast30percentoftheirmonthlyincomeonhousingcosts.Amonghomeowners,36percentofownerswithamortgageand10percentofownerswithoutamortgagewerecostburdened.FigureIII‐24displayshousingcostsasapercentageofmonthlyincomeforSaltLakeCityHouseholds.
Figure III‐24. Cost Burden by Tenure, Salt Lake City, 2011
Note:
Cost‐burdened households spend 30 percent or more of their monthly income on housing expenses.
Source:
2011 American Community Survey and BBC Research & Consulting.
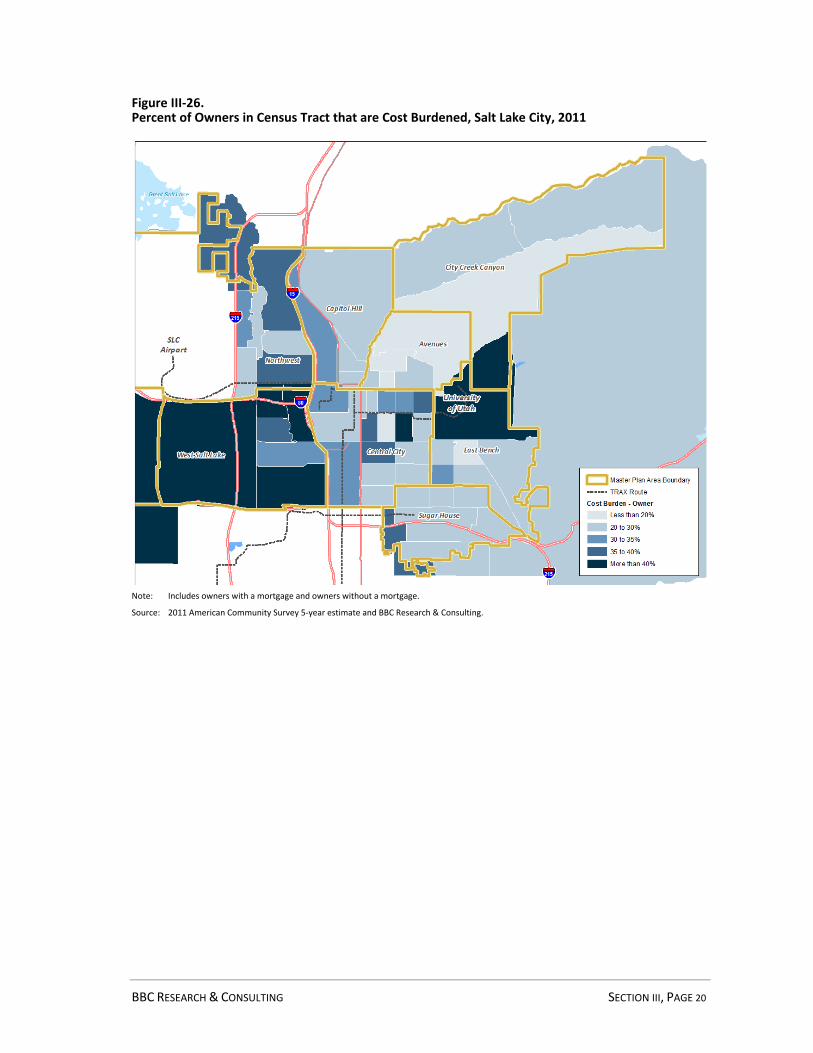
FiguresIII‐25andIII‐26mapthedistributionofcostburdenedrentersandownersinSaltLake.TheWestSaltLakeplanningareacontainsahighproportionofcostburdenedrentersandcost

BBC RESEARCH & CONSULTING SECTION III, PAGE 19
burdenedowners.TheNorthwestplanningareaalsocontainsahighproportionofrentersthatarecostburdened.
Figure III‐25. Percent of Renters in Census Tract that are Cost Burdened, Salt Lake City, 2011
Source: 2011 American Community Survey 5‐year estimate and BBC Research & Consulting.
BBC RESEARCH & CONSULTING SECTION III, PAGE 20
Figure III‐26. Percent of Owners in Census Tract that are Cost Burdened, Salt Lake City, 2011
Note: Includes owners with a mortgage and owners without a mortgage.
Source: 2011 American Community Survey 5‐year estimate and BBC Research & Consulting.

SECTION IV.
Market Mismatches and Gaps

BBC RESEARCH & CONSULTING SECTION IV, PAGE 1
SECTION IV. Market Mismatches and Gaps
ToexaminehowwellSaltLakeCity’scurrenthousingmarketmeetstheneedsofitsresidents—andtodeterminehowlikelyitistoaccommodatedemandoffutureresidentsandworkers—BBCconductedamodelingeffortcalleda“gapsanalysis.”Theanalysiscomparesthesupplyofhousingatvariouspricepointstothenumberofhouseholdswhocanaffordsuchhousing.Iftherearemorehousingunitsthanhouseholds,themarketis“over‐supplying”housingatthatpricerange.Conversely,iftherearetoofewunits,themarketis“under‐supplying”housing.
Thissectionusestheresultsofthegapsanalysistoanswerthefollowingquestions:
1. Howeasyisitforrenterstofindunitsintheiraffordabilityrange?
2. HoweasyisitforrenterswhowanttobehomeownerstobuyinSaltLakeCity?
3. Cancurrentownersaffordtobuyinthecityiftheywanttobuyupordownsize?
4. Whatcanworkersafford?
Rental Gaps
Affordabilityforrentershastwocomponents:mismatchesintherentalmarketandownershipopportunitiesforrenterswantingtobuy.ThegapsanalysisconductedforrentersinSaltLakeCityaddressesbothrentalaffordabilityandownershipopportunities.
Mismatch in rental market.FigureIV‐1comparesthenumberofrenterhouseholdsinSaltLakeCityin2011,theirincomelevels,themaximummonthlyrenttheycouldaffordwithoutbeingcost‐burdened,andthenumberofunitsinthemarketthatwereaffordabletothem.The“RentalGap”columnshowsthedifferencebetweenthenumberofrenterhouseholdsandthenumberofrentalunitsaffordabletothem.Negativenumbers(inparentheses)indicateashortageofunitsatthespecificincomelevel;positiveunitsindicateanexcessofunits.

BBC RESEARCH & CONSULTING SECTION IV, PAGE 2
Figure IV‐1. Mismatch in Rental Market, Salt Lake City, 2011
Source: 2011 American Community Survey and BBC Research & Consulting.
ThegapsanalysisinFigureIV‐1showsthat:
Twenty‐percentofrentersinSaltLakeCityearnlessthan$10,000peryear.Theserentersneedunitsthatcostlessthan$250permonthtoavoidbeingcostburdened.Just4percentofrentalunitsinthecityrentforlessthan$250/month.
Almost3,000rentersearnlessthan$5,000peryear.Thereareonly400rentalunitspricedattheiraffordabilityrange(lessthan$125/month).Thisleavesa“gap,”orshortage,of2,600unitsfortheseextremelylowincomehouseholds.
Another4,600householdearnbetween$5,000and$10,000peryear.Thesehouseholdshave1,200affordableunitstochoosefrom,leavingashortageof3,400rentalunits.
Rentalunitshortagesalsoexistforrentersearningbetween$10,000and$15,000peryear(2,800rentersv.1,700units=gapof1,100units)andthoseearningbetween$15,000and$20,000peryear(3,100rentersand2,000units=gapof1,100units).
Altogether,thecityhasashortageofrentalunitspricedaffordabilityforrentersearninglessthan$20,000peryearof8,240units.Someoftheserentersarestudents.1Thesehouseholdsarealsoworkingresidentsearninglowwages,residentswhoareunemployedandresidentswhoaredisabledandcannotwork—inotherwords,thoseresidentswhoaretrulylivinginpoverty.2
1Datalimitationsmakeitdifficulttoseparateoutrenterswhoarestudentsandmayreceiveassistancepayingrentfromparents,studentloansand/orothernon‐incomesources.Thesestudentsaffecttherentalmarketinanumberofwaysbuttheirtrueeconomicneedforaffordableunitsisunknown.
2Itisimportantthattheserentersarenothomeless.Thoserenterswhocannotfindaffordabilitypricedrentalsarelivinginunitsthatcostmorethantheycanafford.Thesehouseholdsare“costburdened.”
Income Range
Less than $5,000 $125 2,966 8 % 397 1 % (2,568)$5,000 to $9,999 $250 4,608 12 1,168 3 (3,441)$10,000 to $14,999 $375 2,773 7 1,667 4 (1,106)$15,000 to $19,999 $500 3,119 8 1,994 5 (1,126)$20,000 to $24,999 $625 3,569 9 6,847 17 3,279$25,000 to $34,999 $875 5,866 15 14,125 35 8,259$35,000 to $49,999 $1,250 6,225 16 8,284 21 2,059$50,000 to $74,999 $1,875 4,920 13 4,467 11 (453)$75,000 or more $1875+ 4,267 11 999 3 (3,268)
Total/Low Income Gap 38,312 100 % 39,947 100 % (8,240)
Maximum
Affordable Rent,
Including Utilities Number PercentRenters Rental Units
Number Percent Rental Gap

BBC RESEARCH & CONSULTING SECTION IV, PAGE 3
Insum,theprivaterentalmarketinSaltLakeCitylargelyservesrentersearningbetween$20,000and$50,000peryear—73percentofrentalunitsarepricedwithinthatgroup’saffordabilityrange.
Themarketfailstoadequatelyservethe35percentofrentersearninglessthan$20,000peryear—only13percentofunitsarepricedwithinthatgroup’saffordabilityrange,evenwhenaccountingfortheimpactofhousingchoicevouchers.Thereare13,466rentersearninglessthan$20,000and5,226unitsaffordabletothem,leavingagapof8,240.
Gaps in the For Sale Market
ThissectiondiscusseshoweasilyitisforrentersatvariousincomelevelstobuyinSaltLakeCity.Itconcludeswithanassessmentofhoweasilycurrenthomeownerscanbuy“up”or“down”inthemarket.
Market options for renters wanting to buy. AsimilargapsanalysiswasconductedtoevaluatethemarketoptionsaffordabletorenterswhomaywishtopurchaseahomeinSaltLakeCity.Again,themodelcomparedrenters,renterincomelevels,themaximummonthlyhousingpaymenttheycouldafford,andtheproportionofunitsinthemarketthatwereaffordabletothem.ThemaximumaffordablehomepricesshowninFigureIV‐2assumea30‐yearmortgagewitha10percentdownpaymentandaninterestrateof4.25percent.Theestimatesalsoincorporatepropertytaxes,insuranceandutilities(assumedtocollectivelyaccountfor30%ofthemonthlypayment).
The“RenterPurchaseGap”columninFigureIV‐2showsthedifferencebetweentheproportionofrenterhouseholdsandtheproportionofhomessoldin2012thatwereaffordabletothem.Negativenumbers(inparentheses)indicateashortageofunitsatthespecificincomelevel;positiveunitsindicateanexcessofunits.
Figure IV‐2. Market Options for Renters Wanting to Buy, Salt Lake City, 2011
Note: Maximum affordable home price is based on a 30 year mortgage with a 10 percent down payment and an interest rate of 4.25%. Property taxes, insurance and utilities are assumed to collectively account for 30% of the monthly payment.
Source: 2011 American Community Survey, Multiple List Service and BBC Research & Consulting.
Less than $5,000 $19,565 8 % 6 0.1 % 0 % ‐8 %$5,000 to $9,999 $39,131 12 18 0.4 1 ‐12$10,000 to $14,999 $58,692 7 81 2 3 ‐5$15,000 to $19,999 $78,258 8 152 4 6 ‐5$20,000 to $24,999 $97,823 9 252 6 12 ‐3$25,000 to $34,999 $136,954 15 697 17 29 1$35,000 to $49,999 $195,650 16 1,061 25 54 9$50,000 to $74,999 $293,477 13 1,041 25 79 12$75,000 or more $293477+ 11 882 21 100 10
Renter
Purchase
Gap
Total Homes for
Sale/Sold, 2012
Income Range
Renters who
want to buy:
Maximum Affordable
Home Price
Percent of
all Renters Number Percent
Cumulative
Percent of
Sold Homes,
2012

BBC RESEARCH & CONSULTING SECTION IV, PAGE 4
TheforsalegapsanalysisshowstheSaltLakemarkettoberelativelyaffordableforrentersearningmorethan$35,000peryear.Atthisincomelevel,about29percentofunitsareaffordable.Twentypercentofallrenterscanaffordthemedianhomevalue($225,600)and29percentofallrenterscanaffordthemediansoldpricein2012($177,204).
BBCrecentlyconductedsimilarhomebuyergapsanalysesforDenver.In2010,13percentofDenver’shomessoldforlessthan$100,000—aboutthesameasinSaltLake.InDenver,40percentofhomeswerepricedatlessthan$200,000,comparedto54percentinSaltLake.
FigureIV‐3showsthetypicalcharacteristicsofahomeaffordabletorenterhouseholdsearning$50,000and$75,000inSaltLakeCity.Althougholder,thesehomesareadequatelysizedforastarterhomeandaremostlycomprisedofsinglefamilydetachedhousing.
Figure IV‐3. Characteristics of Homes Affordable to Renters, Salt Lake City and Balance of County, 2011
Note:
Maximum affordable home price is based on a 30 year mortgage with a 10 percent down payment and an interest rate of 4.25%. Property taxes, insurance and utilities are assumed to collectively account for 30% of the monthly payment.
Source:
Multiple List Service and BBC Research & Consulting.
FigureIV‐4displaysthecharacteristicsofhomesaffordabletotheaverageSaltLakeCityworker(earning$44,973),bothinthecityandinthebalanceofthecounty.Affordablehomesinthebalanceofthecountyareslightlynewerandslightlylargerthanaffordablehomesinthecitybutoverall,workershavecomparablechoicesinthecityandbalanceofthecounty.
Figure IV‐4. Characteristics of Homes Affordable to the Average Worker, Salt Lake City and Balance of County, 2011
Source:
Multiple List Service (MLS) and BBC Research & Consulting.
Current homeowner equity and options.Between2000and2011,ownerslostpurchasingpowerinthecity’shousingmarketashousingpricesincreasedfaster(36%)thanownerincomes
Property Characteristics
Average number of bedrooms 3.1 3.2Average number of bathrooms 1.8 1.9Average square footage 1,597 1,694Average year built 1,960 1,958
Property Type
Single family detached 76% 79%Condo 19% 17%Townhome 4% 3%
Renters earning
$50,000 or less
Renters earning
$75,000 or less
Property Characteristics
Average number of bedrooms 3.0 3.3Average number of bathrooms 1.8 2.1Average square footage 1,483 1,685Average year built 1,962 1,979
Property type
Single Family Detached 74% 69%Condo 21% 14%Townhome 4% 15%
Salt Lake City
Balance of
County

BBC RESEARCH & CONSULTING SECTION IV, PAGE 5
(26%).However,themarketisstillrelativelyaffordabletocurrenthomeowners.Evenifweassumeownerswouldnotusetheircurrentequityforthepurchaseofanewhome,thedistributionofmarketofferingsissimilartotheincomedistributionofcurrentowners.Inotherwords,thereappearstobenosubstantialmismatchesbetweenowneraffordabilityandtheforsalemarket.
What Can Workers Afford?
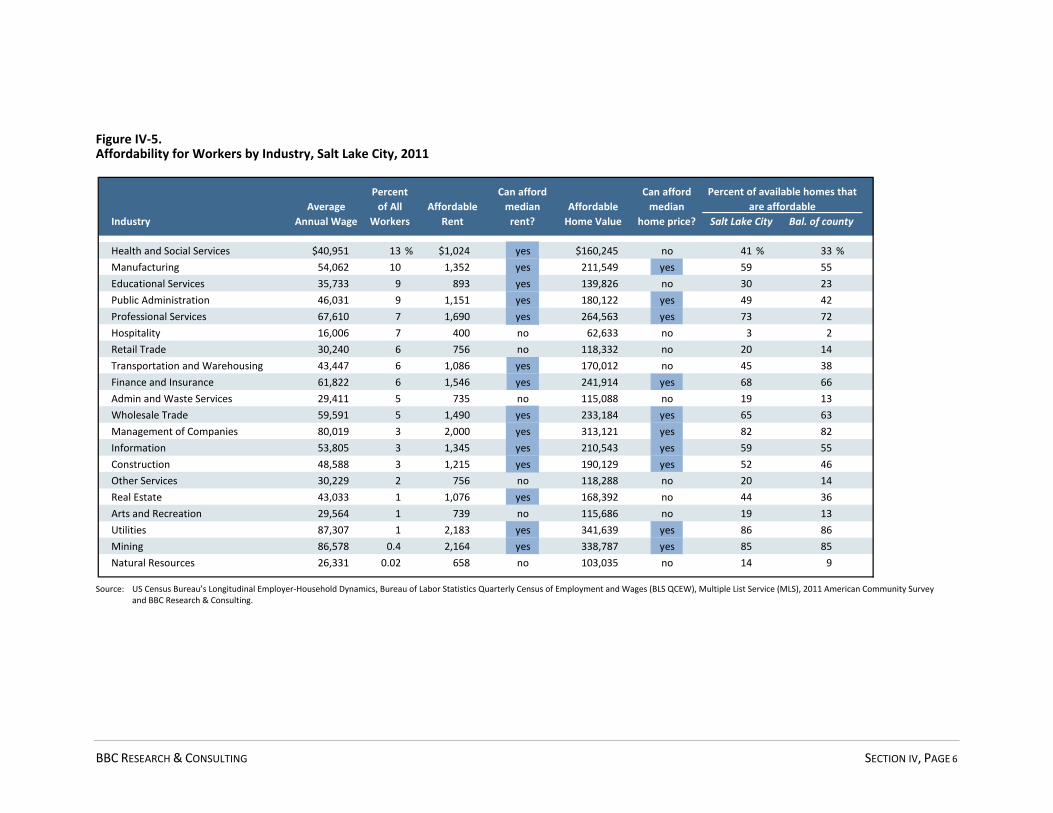
AsdiscussedintheCommunityProfile(SectionII),SaltLakeCityhasasubstantialnumberofin‐commuters:175,190peopleworkbutdonotliveinthecity.Althoughhousingpreferencesamongin‐commutersmaydiffer,itisimportanttoevaluatethecity’saffordableoptionsinordertounderstandthetradeoffsrelatedtohousingandcommute.FigureIV‐5displaysaffordablerentalandownershipoptionsforworkersearningtheaveragecountywagebyindustry.
AmongthefivelargestindustriesinSaltLakeCity,whichaccountforabouthalfofallworkers,allindustrieshaveaveragewageshighenoughtoaffordthecity’smedianrentandthreeofthefiveindustries(27%ofallworkers)haveaveragewageshighenoughtoaffordthe2012mediansoldpriceof$177,204.
Overall,theaverageSaltLakeCityworker—earning$44,973peryear—couldafford80percentofthecity’srentalunitsand47percentofthehomessoldin2012.Thesameworkercouldaffordonlyone‐thirdofthehomesinthebalanceofthecounty.
BBC RESEARCH & CONSULTING SECTION IV, PAGE 6
Figure IV‐5. Affordability for Workers by Industry, Salt Lake City, 2011
Source: US Census Bureau’s Longitudinal Employer‐Household Dynamics, Bureau of Labor Statistics Quarterly Census of Employment and Wages (BLS QCEW), Multiple List Service (MLS), 2011 American Community Survey and BBC Research & Consulting.
Health and Social Services $40,951 13 % $1,024 yes $160,245 no 41 % 33 %Manufacturing 54,062 10 1,352 yes 211,549 yes 59 55Educational Services 35,733 9 893 yes 139,826 no 30 23Public Administration 46,031 9 1,151 yes 180,122 yes 49 42Professional Services 67,610 7 1,690 yes 264,563 yes 73 72Hospitality 16,006 7 400 no 62,633 no 3 2Retail Trade 30,240 6 756 no 118,332 no 20 14Transportation and Warehousing 43,447 6 1,086 yes 170,012 no 45 38Finance and Insurance 61,822 6 1,546 yes 241,914 yes 68 66Admin and Waste Services 29,411 5 735 no 115,088 no 19 13Wholesale Trade 59,591 5 1,490 yes 233,184 yes 65 63Management of Companies 80,019 3 2,000 yes 313,121 yes 82 82Information 53,805 3 1,345 yes 210,543 yes 59 55Construction 48,588 3 1,215 yes 190,129 yes 52 46Other Services 30,229 2 756 no 118,288 no 20 14Real Estate 43,033 1 1,076 yes 168,392 no 44 36Arts and Recreation 29,564 1 739 no 115,686 no 19 13Utilities 87,307 1 2,183 yes 341,639 yes 86 86Mining 86,578 0.4 2,164 yes 338,787 yes 85 85Natural Resources 26,331 0.02 658 no 103,035 no 14 9
Percent of available homes that
are affordable
Bal. of countyIndustry
Average
Annual Wage
Percent
of All
Workers
Affordable
Rent
Can afford
median
rent?
Affordable
Home Value
Can afford
median
home price? Salt Lake City

SECTION V.
Summary of Key Issues and Recommendations
BBC RESEARCH & CONSULTING SECTION V, PAGE 1
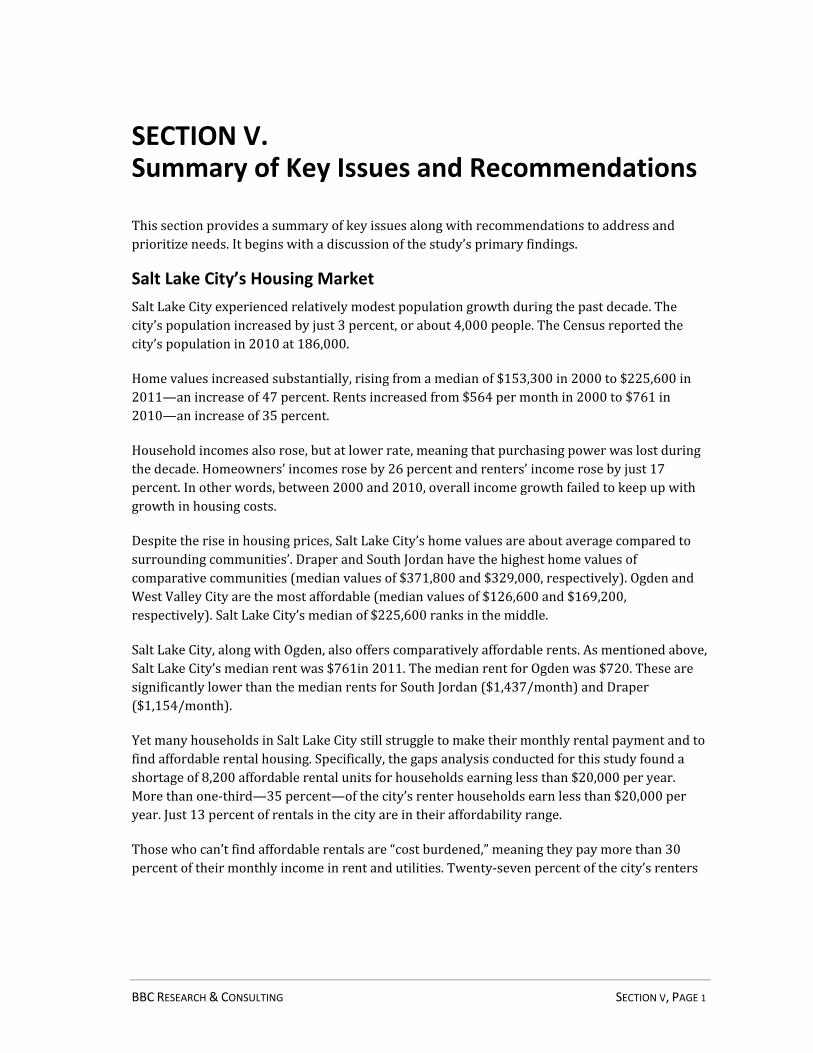
SECTION V. Summary of Key Issues and Recommendations
This section provides a summary of key issues along with recommendations to address and prioritize needs. It begins with a discussion of the study’s primary findings.
Salt Lake City’s Housing Market
Salt Lake City experienced relatively modest population growth during the past decade. The city’s population increased by just 3 percent, or about 4,000 people. The Census reported the city’s population in 2010 at 186,000.
Home values increased substantially, rising from a median of $153,300 in 2000 to $225,600 in 2011—an increase of 47 percent. Rents increased from $564 per month in 2000 to $761 in 2010—an increase of 35 percent.
Household incomes also rose, but at lower rate, meaning that purchasing power was lost during the decade. Homeowners’ incomes rose by 26 percent and renters’ income rose by just 17 percent. In other words, between 2000 and 2010, overall income growth failed to keep up with growth in housing costs.
Despite the rise in housing prices, Salt Lake City’s home values are about average compared to surrounding communities’. Draper and South Jordan have the highest home values of comparative communities (median values of $371,800 and $329,000, respectively). Ogden and West Valley City are the most affordable (median values of $126,600 and $169,200, respectively). Salt Lake City’s median of $225,600 ranks in the middle.
Salt Lake City, along with Ogden, also offers comparatively affordable rents. As mentioned above, Salt Lake City’s median rent was $761in 2011. The median rent for Ogden was $720. These are significantly lower than the median rents for South Jordan ($1,437/month) and Draper ($1,154/month).
Yet many households in Salt Lake City still struggle to make their monthly rental payment and to find affordable rental housing. Specifically, the gaps analysis conducted for this study found a shortage of 8,200 affordable rental units for households earning less than $20,000 per year. More than one‐third—35 percent—of the city’s renter households earn less than $20,000 per year. Just 13 percent of rentals in the city are in their affordability range.
Those who can’t find affordable rentals are “cost burdened,” meaning they pay more than 30 percent of their monthly income in rent and utilities. Twenty‐seven percent of the city’s renters

BBC RESEARCH & CONSULTING SECTION V, PAGE 2
are “severely” cost burdened, paying more than 50 percent of their monthly income in rent and utilities. These renters are generally at the highest risk of homelessness. 1
Gaps in the for sale market are more modest than in the rental market. In 2011, the for sale market was relatively affordable to renters earning $35,000 per year. At this income level, about 29 percent of units listed or sold in Salt Lake were affordable. Yet these units are older in age, may need repairs and are smaller than what might be found in immediate suburbs at a similar price‐point.
How will future demographic trends impact needs? Growth in the city during the next 10 years is expected to be more aggressive than in the past. Salt Lake City is projected to reach a population of 211,000 by 2020 (13% growth for the decade). Some of that growth may be expected to occur in the Northwest Quadrant of the city (west of the airport) which is in the process of creating a master plan to guide new development. Additional housing units could be generated through increased density and infill of vacant and underutilized properties.
The city’s current homeownership rate—47 percent—is unlikely to change significantly even with this accelerated growth.2 The presence of the University of Utah and urban lifestyle offered by the city—which appeals to younger residents who are more likely to rent—contribute to the comparatively high renter population of the city.
As is typical in large metropolitan areas, households in the suburbs are more likely to be families than households in the city (75% compared to 52%). This is likely to continue. However, that gap does not appear to be widening over time. In other words, the city does not seem to be losing—nor appears likely to lose—a disproportionate proportion of families to the suburbs. Some of this is due to the difference in family socioeconomic status between the city and suburbs: Salt Lake City’s families are more likely to be lower income and need affordable housing and therefore have limited housing choices in pricier surrounding communities.
Households who are racial and ethnic minorities in Salt Lake have much lower homeownership rates than non‐minority households: 37 percent of Hispanic householders own their homes, compared to 53 percent of non‐Hispanic white householders. Ownership rates are even lower for racial minorities (20% for African Americans, 20% for Native Americans and 36% for Asians).
In 2011, 9 percent of Salt Lake City residents were seniors. Although the population of Salt Lake City is aging, forecasts suggest that the city is less likely to experience a significant “graying” of the population than other peer cities and the nation as a whole.
1 Some renters who appear as having housing needs are college students, whose earnings are likely to increase after school is completed. It is difficult to determine how many students have housing needs from Census and housing market data alone; this typically requires a student housing demand analysis.
2 If every new housing unit developed between 2010 and 2020 is owned, the homeownership rate would reach a maximum 53 percent.
BBC RESEARCH & CONSULTING SECTION V, PAGE 3
The highest proportions of seniors are found in the East Bench and northeast Avenues/Canyons neighborhoods. Demand for senior housing in the city will depend on the extent that these seniors choose to and can live independently in their homes as they age. An adequate home health care system will also be important.
Salt Lake City has a very high proportion of in‐commuters compared to peer cities: only 18 percent of Salt Lake City jobs are held by city residents, compared to 44 percent in Boise and 29 percent in Denver. The city’s in‐commuting population will continue to grow if job growth exceeds household growth. Although traffic congestion is modest compared to larger urban areas, it will worsen if residential growth continues to be primarily concentrated outside of the city core.
Taking into consideration Salt Lake City’s current housing market and demographics along with future demographic trends, the city’s greatest housing needs are:
1) A shortage of 8,200 rental units to meet the affordability needs of renters earning $20,000 and less per year. It should be noted that some of these renters are students who will have future earnings increases—but many of these renters are low income families, persons with disabilities, and persons who are under‐ and unemployed.
2) Additional residential housing product to entice in‐commuters to relocate to the city, encourage current residents to remain in the city and provide more homeownership opportunities for minority renters.
Recommendations: Policies and Programs to Address Needs
Salt Lake City is fortunate to be a relatively low density urban center with many opportunities to repurpose and reuse existing land. Focusing on how to better utilize this space should be central component to addressing the city’s most pressing current and future housing needs. To that end, we recommend that the city:
Inventory vacant and underutilized parcels for residential redevelopment potential. The city could take the lead on assembling a list of available publicly‐owned parcels of real estate, including those owned by the city and considered for redevelopment, along with their current use status. The city and potential stakeholders (developers, affordable housing nonprofits, housing authority, school district) could assess the potential of these parcels for mixed income housing locations.
The city could develop a vision for the parcel redevelopments—e.g., suburban style detached and attached housing for families, higher density housing for singles, housing for persons with disabilities and/or seniors—and examine how zoning may need modification to accomplish the redevelopment. Once a development vision is in place, the city would issue a request for proposals for acquisition and redevelopment of the land.
Explore a land bank. Land banking is a program whereby land is acquired by a division of government or nonprofit with the purpose of developing affordable/workforce housing or engaging in revitalization activities. After a holding period, the land is sold to a nonprofit or

BBC RESEARCH & CONSULTING SECTION V, PAGE 4
private developer, often at a price lower than market, who agrees to the land use conditions (e.g., creation of affordable/workforce housing).
Land bank programs can serve dual purposes. While some programs are created solely for the acquisition of land for future affordable housing development, others have broader long‐term community planning goals. In distressed communities, land banking programs allow cities to acquire vacant and underperforming parcels, be a catalyst for redevelopment, and to benefit from increased tax revenues from the properties. In communities with rapidly rising land costs, land banking programs promise a long‐term savings to taxpayers: for example, when public buildings need to be constructed, they can be built at less than the current market cost due to the earlier acquisition of the property by the land bank.
Salt Lake City could establish a land bank to which private property may be donated (with potential tax benefits) and public property may be held for future affordable and mixed‐income housing development. The city could also explore partnerships with the school district, utility companies, and other public landowners to donate the land for affordable housing in exchange for a certain proportion of the units that have first right of refusal to public sector employees (e.g., teachers). The city can also “bank” its own land identified for future residential redevelopment.
Denver’s Urban Land Conservatory—a version of a land bank—acquires land and property for future redevelopment into affordable housing, schools, and community centers. The organization also administers the country’s first transit‐oriented fund, which acquires land around future transit sites to preserve them for affordable and mixed income housing. The organization was capitalized through private and public contributions. For more information, see http://www.urbanlandc.org/
Review building and land use restrictions that could make it time consuming and costly to expand or remodel homes. Many of the city’s aging homes are situated on larger lots in the city core or near desirable areas like the East Bench. Those without historical value may offer a competitive product to suburban single family detached homes if these homes are redeveloped or expanded. The city may want to consider relaxing restrictions or providing incentives for redevelopment (fee waivers, fast track approval, redevelopment grants) in certain development zones and neighborhoods. Providing neighborhoods with potential housing prototypes can also encourage and guide proper redevelopment (see below). Prototypes can also reduce Not‐in‐My‐Backyard Syndrome (NIMBYism) by showing resistant neighbors how attractive, well‐designed housing can benefit an existing neighborhood.
Explore housing prototypes. The city may want to partner with the University of Utah architecture program to develop infill and redevelopment prototypes that would be attractive to families, renters who want to buy and/or seniors seeking alternative housing products. These prototypes should be shared with neighborhood organizations and available online.
An example can be found in the Alley Flats program in Austin, Texas, an initiative to create new, sustainable, and green affordable housing in small, detached residential units, accessed through underutilized alleyways. See http://www.thealleyflatinitiative.org/

BBC RESEARCH & CONSULTING SECTION V, PAGE 5
Survey in‐commuters and current residents. To better understand the housing preferences of renters who desire to own, homeowners who want to downsize and in‐commuters who may consider relocating to the city, Salt Lake City may want to conduct a survey or focus groups of these targeted populations. Including reactions to housing prototypes is recommended. Given the low homeownership rates for minorities in the city, any market research should include outreach to minority residents about their desire to and challenges in purchasing a home.
Prioritize the creation of affordable rentals. Subsidized rental units, affordable to households earning $20,000 and less, should be incorporated into all mixed‐used developments. These units should also receive priority in funding allocations. Although the city’s rental gap is not significantly large, the households represented by the gap have extremely limited housing choices and are at the greatest risk of homelessness.


![BBC VOICES RECORDINGS€¦ · BBC Voices Recordings) ) ) ) ‘’ -”) ” (‘)) ) ) *) , , , , ] , ,](https://img.pdfslide.net/doc/110x75/5f8978dc43c248099e03dd05/bbc-voices-recordings-bbc-voices-recordings-aa-a-a-a-.jpg)