Embed Size (px)
Citation preview

From information, knowledge
Paragon Economics, Inc.
Steve R. Meyer, Ph.D.Paragon Economics, Inc.
PPIC/RAC - - September 2009
Hog and Pork Market Outlook

From information, knowledge
Paragon Economics, Inc.
Thought for the day
If a man is in a desert and speaks
And no woman is around
Is he still wrong?
From information, knowledge
Paragon Economics, Inc.
To paraphrase the Clinton campaign:
“IT‟S COSTS, STUPID!”

From information, knowledge
Paragon Economics, Inc.
The cause of losses is still COSTS!!!!!
. . . +22% from historical levels through 2010ACTUAL & PREDICTED HOG
PRODUCTION COSTS*
40
45
50
55
60
65
70
75
80
85
90
96 97 98 99 00 01 02 03 04 05 06 07 08 09 10
$/cwt carcass
Actual Costs per ISU
Predicted/Forecast Costs - Carcass
*Based on relationsip between ISU Estimated Costs & Returns data and historic Omaha corn and Decatur soybean meal prices
9/28/09
Average Cost, 1999-2006:
$52.76/cwt
Average Cost, 9/09 - 12/10:
$64.44/cwt

From information, knowledge
Paragon Economics, Inc.
September would be our first losses . . .
. . . under the historical cost scenario ACTUAL & PREDICTED HOG
PRODUCTION COSTS* AND PRICES
10
20
30
40
50
60
70
80
90
100
96 97 98 99 00 01 02 03 04 05 06 07 08 09 10
$/cwt carcassActual Costs per ISU
Predicted/Forecast Costs - Carcass
Cash Hog Price
Futures-Implied IA-MN Price
*Based on relationsip between ISU Estimated Costs & Returns data and historic Omaha corn and Decatur soybean meal prices
9/28/09

From information, knowledge
Paragon Economics, Inc.
Near-record corn crop will help!
U S ANNUAL CORN PRODUCTIONCrop Year
2
4
6
8
10
12
14
1985 1987 1989 1991 1993 1995 1997 1999 2001 2003 2005 2007 2009
Bil. Bushels

From information, knowledge
Paragon Economics, Inc.
Record-high availability, price down 19% . . .
U S TOTAL CORN SUPPLY AND PRICECrop Year
6
7
8
9
10
11
12
13
14
15
1985 1988 1991 1994 1997 2000 2003 2006 2009
Bil. Bushels
1.20
1.60
2.00
2.40
2.80
3.20
3.60
4.00
4.40
4.80
$ Per Bushel
Supply
Price
. . . but still around $3/bu

From information, knowledge
Paragon Economics, Inc.
Cash corn is still in its new “normal” range . . .
. . . at least in Omaha CASH CORN PRICE, OMAHA, WEEKLY
0.00
1.00
2.00
3.00
4.00
5.00
6.00
7.00
8.00
91 92 93 94 95 96 97 98 99 00 01 02 03 04 05 06 07 08 09
$/bu.
Source: USDA, Agricultural Marketing Service
From information, knowledge
Paragon Economics, Inc.
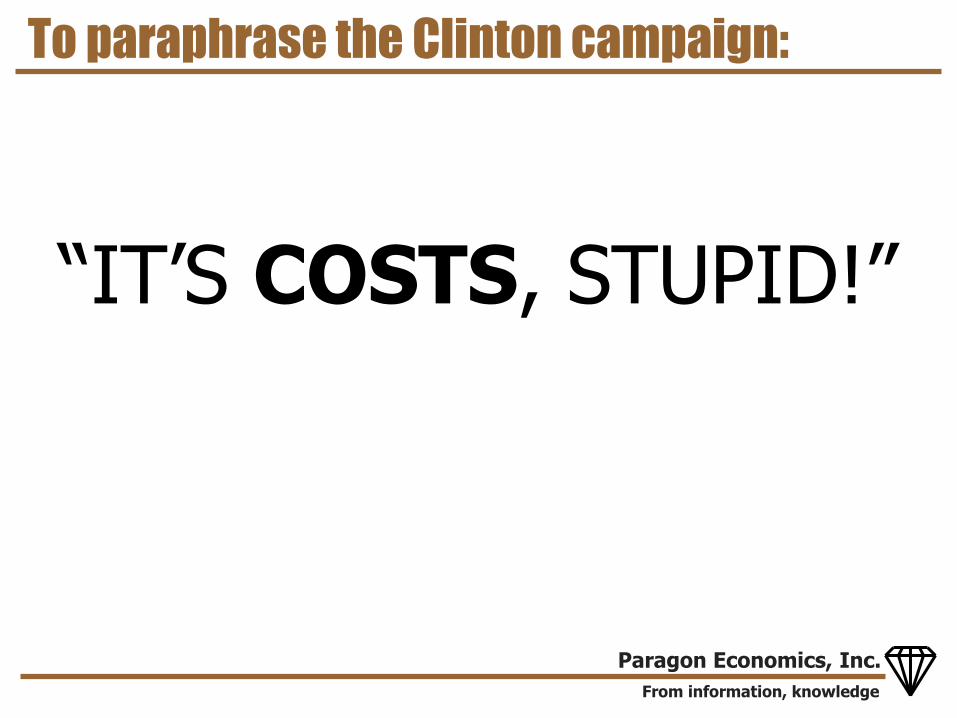
Actual corn:oil relationship: $3.80 to $4.25
. . . Market is not forcing these prices now
CASH CORN VS. CASH CRUDE
y = 2.5776e0.0063x
R2 = 0.7595
0.00
1.00
2.00
3.00
4.00
5.00
6.00
7.00
8.00
0 10 20 30 40 50 60 70 80 90 100 110 120 130 140 150
Crude, $/bbl
Corn, $/bu.
Wisner's Minnesota Cost
Line
November Crude = $66.52 October '10 Crude = $72.07
Since July 1

From information, knowledge
Paragon Economics, Inc.
Corn usage for ethanol up to 4.2 bil. bu. . . .
. . . +14.3% vs. ‟08; 280 mil. bu. more in „10U.S. CORN PRODUCTION & USAGE BY
CATEGORY
0
1000
2000
3000
4000
5000
6000
7000
1969 1972 1975 1978 1981 1984 1987 1990 1993 1996 1999 2002 2005 2008
Usage - Mil. bu.
Ethanol
FSI-Non Ethanol
Feed & Residual
Exports
USDA Forecast, 9/11

From information, knowledge
Paragon Economics, Inc.
Positive ethanol margins will drive corn bids

From information, knowledge
Paragon Economics, Inc.
Dec corn was trending down . . .
. . . but can it do much more with oil at $70?

From information, knowledge
Paragon Economics, Inc.
Cash meal has been near record high . . .
. . . Poor SA crop, VERY tight bean stocks CASH SBM PRICE, DECATUR
150.00
200.00
250.00
300.00
350.00
400.00
450.00
500.00
J F M A M J J A S O N D
$/bu.
2009
2008
2007
Avg. '03-'07

From information, knowledge
Paragon Economics, Inc.
Futures market is +/-$275 and falling . . .
. . . Tech: Sit tight, watch for a breakout

From information, knowledge
Paragon Economics, Inc.
Feed costs have fallen 25% since June. . .
. . . still 2X historical, but at a BUYING level CORN-SOY COST, 16% CR. PROTEIN DIET
50
100
150
200
250
300
91 92 93 94 95 96 97 98 99 00 01 02 03 04 05 06 07 08 09 10
$/Ton
Actual
Predicted July 1, 2008
Predicted December 8, 2008
Predicted June 11, 2009
Predicted September 28, 2009

From information, knowledge
Paragon Economics, Inc.
We can‟t “unring” the ethanol bell
The plants are in place – they will be operated by someone
From information, knowledge
Paragon Economics, Inc.
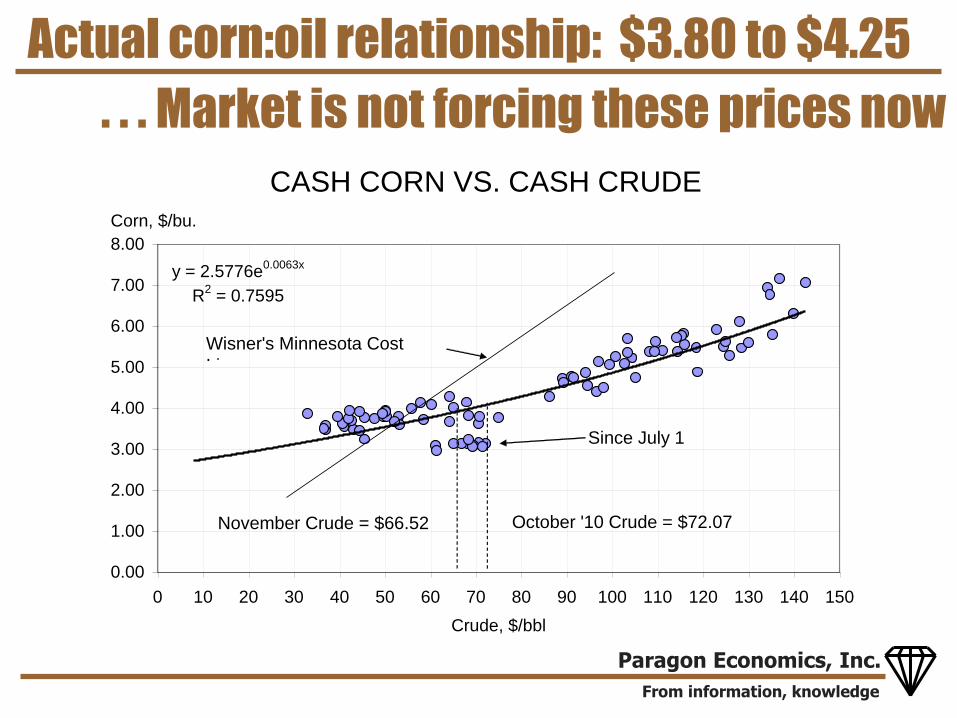
Ethanol production capacity is still growing
As of September 24, 2009:- 186 plants operating -- capacity of 13.06 bil.
gal./yr.
- 15 more plants expanding or under construction – capacity of 1.5 bil. gal./yr.
Current plants could use 4.66 bil. bushels -- All plants would use 5.2 bil. Bushels
Already have enough to exceed E10 for all U.S. gasoline – thus the push for E15- RFS has promised more than the market can
deliver!

From information, knowledge
Paragon Economics, Inc.
We can‟t “unring” the ethanol bell
The plants are in place – they will be operated by someone
FAPRI/TAMU study – looked at 2011-2018- Removing the BTC lowers corn price 0.6%
- Removing the tariff lowers corn price 2.8%
- Removing the RFS lowers corn price 4.6%
- Removing all three lowers corn price 13.1%
- NONE OF THESE WILL HAPPEN -- Politics
NEED – an automatic trigger for situation where oil is cheap and we have a drought

From information, knowledge
Paragon Economics, Inc.
If an input price rises – SLR & SSR shift . . .
P
Q
SLR
SSRDH
PE
QE
SS’SR
C’
. . . But S cannot shift immediately
Revenue =
PE * QE
Costs = QE * C’
Losses = QE *
(C’ – PE)

From information, knowledge
Paragon Economics, Inc.
ONLY TWO WAYS TO RESTORE PROFITS
Increase demand
P
Q
SLR
SSRDH
PE
QE
S
S’LR
S’SR
C’=P’
D’H

From information, knowledge
Paragon Economics, Inc.
Increasing demand is a SLOW process!
Population growth – 0.8 to 0.9% per year
New markets – most of the big ones are open – most of the time!
Reduce tariffs in existing markets
- NAFTA did this but total reduction took 10 yrs
- Korean FTA and others would help now
Promotion – small budget vs. market size
Product development – the driver of chicken demand since 1980s

From information, knowledge
Paragon Economics, Inc.
Second, more likely, solution . . .
Reduce supply
P
Q
SLR
SSRDH
PE
QE
S’
S’LR
S’SR
Q’
P’

From information, knowledge
Paragon Economics, Inc.
ALL PROTEINS ARE IN THE SAME PICKLE!!!!
Chicken production is down 4.7% YTD
Turkey production is down 5.4% YTD
Pork production is down 2.2% YTD
Beef production is down 3.9% YTD
Chicken and turkey reductions will slow –they could react more quickly
Pork reduction will get larger
Beef reduction may not get larger but will last MUCH longer

From information, knowledge
Paragon Economics, Inc.
Consider the impact in the pork industry:
For each 1 million head fewer market hogs produced in the U.S., there will be
- 331 fewer jobs in pork production
- 681 fewer jobs in pork processing
- 1,142 fewer jobs in the rest of agriculture
- 2,154 fewer jobs – mostly rural!
And we are in the process of reducing output by 10 million head
- 21,540 fewer jobs – mainly in rural areas

From information, knowledge
Paragon Economics, Inc.
Other impacts
Financial requirements and risk
- It now takes $130-$170 to produce a market hog vs. $110 pre-2007
- Raising a fed steer now takes $1200-$1500 vs. $1100-$1300 pre-2007
Many banks are bowing out of ag lending in general and livestock in particular
At best, owner equity requirements are higher
From information, knowledge
Paragon Economics, Inc.
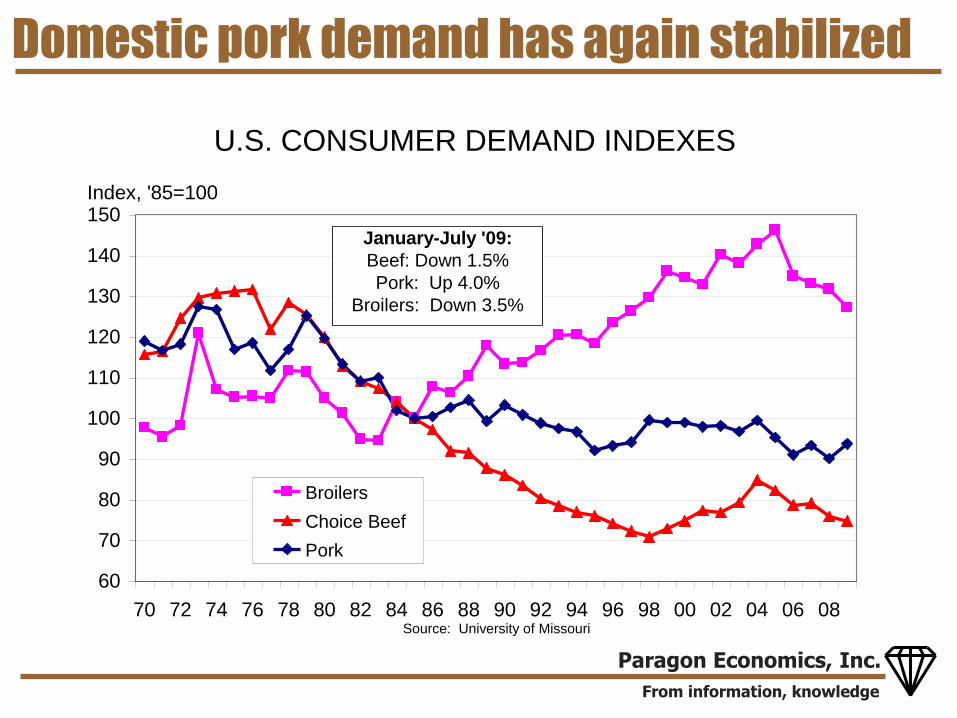
Domestic pork demand has again stabilized
U.S. CONSUMER DEMAND INDEXES
60
70
80
90
100
110
120
130
140
150
70 72 74 76 78 80 82 84 86 88 90 92 94 96 98 00 02 04 06 08
Index, '85=100
Broilers
Choice Beef
Pork
Source: University of Missouri
January-July '09:
Beef: Down 1.5%
Pork: Up 4.0%
Broilers: Down 3.5%

From information, knowledge
Paragon Economics, Inc.
Monthly expenditures – higher demand . . .
MONTHLY REAL PER CAPITA PORK
CONSUMPTION VALUE
6.00
7.00
8.00
9.00
10.00
11.00
12.00
J F M A M J J A S O N D
$/month
2007
2008
2009
Average,'03-'07

From information, knowledge
Paragon Economics, Inc.
Retail prices show VERY LITTLE decline ???
RETAIL MEAT PRICES, USDA
0
50
100
150
200
250
300
350
400
450
2000 2001 2002 2003 2004 2005 2006 2007 2008 2009
Cents/lb.
All-Fresh Beef
Pork
Composite Broiler
Turkey

From information, knowledge
Paragon Economics, Inc.
Very good disappearance/consumption . . .
DOMESTIC PORK CONSUMPTION
1200
1300
1400
1500
1600
1700
1800
1900
2000
90 91 92 93 94 95 96 97 98 99 00 01 02 03 04 05 06 07 08 09
Bil. lbs. carc. wt.
Disappearance
Dissappearance, 6-mo. Avg.
. . . Largest July ever, 2nd largest June ever

From information, knowledge
Paragon Economics, Inc.
Pork exports grew rapidly in 2008 . . .
U.S. PORK EXPORTS
0
500
1000
1500
2000
2500
3000
3500
4000
4500
5000
1955 1959 1963 1967 1971 1975 1979 1983 1987 1991 1995 1999 2003 2007
Mil. lbs. carcass
The NAFTA signed in 1994
2008: Exports UP 48%!
. . . Permanent or transient?

From information, knowledge
Paragon Economics, Inc.
2008 exports: A happy confluence . . .
Record-low U.S. dollar made U.S. product relatively cheap
China/Hong Kong was the driver
- Booming economy and rising middle class
- Death losses in 2006-07 due to disease, earthquake, harsh winters = pork shortage
- Olympic games
Economic growth in other countries
Strong Canadian dollar

From information, knowledge
Paragon Economics, Inc.
YTD: Export Q and V are lower . . .
YTD PORK EXPORTS - PRODUCT WT.
0
200
400
600
800
1000
1200
1400
1600
1800
2000
2200
2003 2004 2005 2006 2007 2008 2009
Mil
. lb
s.
-- W
orl
d
0
50
100
150
200
250
300
350
400
450
500
550
600
Mil
. lb
s.
-- I
nd
iv.
Co
un
trie
s
WORLD TOTAL AUSTRALIA
CANADA JAPAN
KOREA MEXICO
RUSSIA TAIWAN
CHINA/HONG KONG
JANUARY - JULY
-16.9%
-69.9%
-2.6%
33.0%
YTD PORK EXPORT VALUE
0
200
400
600
800
1000
1200
1400
1600
1800
2000
2200
2400
2003 2004 2005 2006 2007 2008 2009
Mil.
$$
--
Wo
rld
0
100
200
300
400
500
600
700
800
900
1000
Mi. $
$ -
- In
div
. C
ou
ntr
ies
WORLD TOTAL AUSTRALIA
CANADA JAPAN
KOREA MEXICO
RUSSIA TAIWAN
CHINA/HONG KONG
-12.9%
JANUARY - JULY
25.5%
-69.6%
10.2%
13.8%
Mexico: +33% Q, +14% V
Japan: -2.6% Q, +10.2% V
Ch/HK: -70% Q & V

From information, knowledge
Paragon Economics, Inc.
Variety meat exports have been GOOD . . . YTD PORK VARIETY MEAT EXPORTS -
PRODUCT WT.
0
50
100
150
200
250
300
350
400
450
500
550
600
650
2003 2004 2005 2006 2007 2008 2009
Mil
. lb
s.
-- W
orl
d
0
25
50
75
100
125
150
175
200
225
250
Mil
. lb
s.
-- I
nd
iv.
Co
un
trie
s
WORLD TOTAL AUSTRALIA
CANADA JAPAN
KOREA MEXICO
RUSSIA TAIWAN
CHINA + HONG KONG
JANUARY - JULY
21.3%
7.1%
-48.1%
62.5%
81.8%
YTD PORK VARIETY MEAT EXPORT
VALUE
0
50
100
150
200
250
300
350
2003 2004 2005 2006 2007 2008 2009
Mil.
$$
--
Wo
rld
0
30
60
90
120
150
Mi. $
$ -
- In
div
. C
ou
ntr
ies
WORLD TOTALAUSTRALIACANADAJAPANKOREAMEXICORUSSIATAIWANCHINA + HONG KONG
17.9%
JANUARY - JULY
208.8%
12.3%
-46.0%
47.2%
47.3%
Quantity: +21% YTD
Mexico: +63%!
Ch/HK: +7%
Value: +18% YTD
Mexico: +47%
Ch/HK: +12.3%

From information, knowledge
Paragon Economics, Inc.
2009 exports have been remarkably strong .
. . . Given the obstacles we have faced!!!
MONTHLY U.S. PORK EXPORTS &
TRENDS
0
100
200
300
400
500
600
90 91 92 93 94 95 96 97 98 99 00 01 02 03 04 05 06 07 08 09
Mil. lbs. carcass
U.S. Pork Exports
Polynomial, '90-'08
Trend '04-'07 2008 Export Surge
July ’09:
Down13.2% vs. ’08
UP 61% vs. ‘07

From information, knowledge
Paragon Economics, Inc.
Slaughter exploded in ‟07 -- +7.8% in Q4-‟07
FI HOG SLAUGHTER, WEEKLY
600
800
1,000
1,200
1,400
1,600
1,800
2,000
2,200
2,400
70 72 74 76 78 80 82 84 86 88 90 92 94 96 98 00 02 04 06 08
Thous. Hd.
Record: 2.478 mil. hd., 12/22/2007
Circovirus vaccines
introduced -- July 2007
. . . circovirus vaccines were main cause
From information, knowledge
Paragon Economics, Inc.
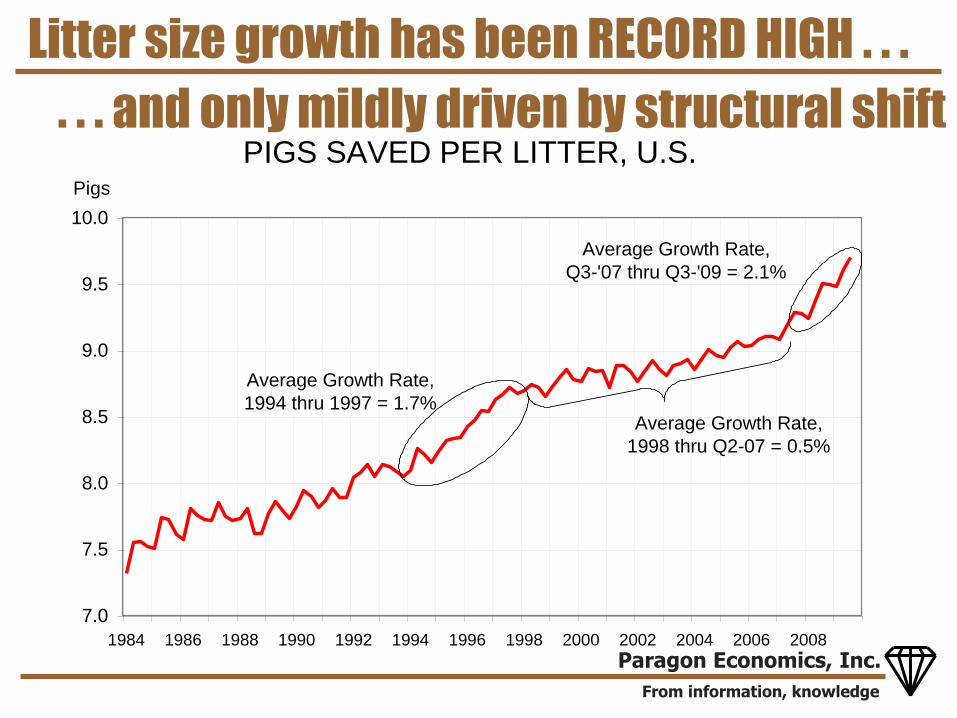
Litter size growth has been RECORD HIGH . . .
PIGS SAVED PER LITTER, U.S.
7.0
7.5
8.0
8.5
9.0
9.5
10.0
1984 1986 1988 1990 1992 1994 1996 1998 2000 2002 2004 2006 2008
Pigs
Average Growth Rate,
1994 thru 1997 = 1.7%
Average Growth Rate,
Q3-'07 thru Q3-'09 = 2.1%
Average Growth Rate,
1998 thru Q2-07 = 0.5%
. . . and only mildly driven by structural shift

From information, knowledge
Paragon Economics, Inc.
FI HOG SLAUGHTER, WEEKLY
1600
1700
1800
1900
2000
2100
2200
2300
2400
2500
2600
J F M A M J J A S O N D
Thous. Hd.
Actual 08
Actual 09
Pred '09
Pred '10
Based on USDA Hogs & Pigs Report, June '09 w/ Adjustments
Last 8 wks -- +3.0% from June H&P level . . .
. . . hogs backed up or pulled ahead?
-196+501

From information, knowledge
Paragon Economics, Inc.
High weights have added 2-3% to prod . . .
FI CARCASS WEIGHTS, HOGS
192
194
196
198
200
202
204
206
208
J F M A M J J A S O N D
Pounds
2009
2008
Avg '03-'07
From information, knowledge
Paragon Economics, Inc.
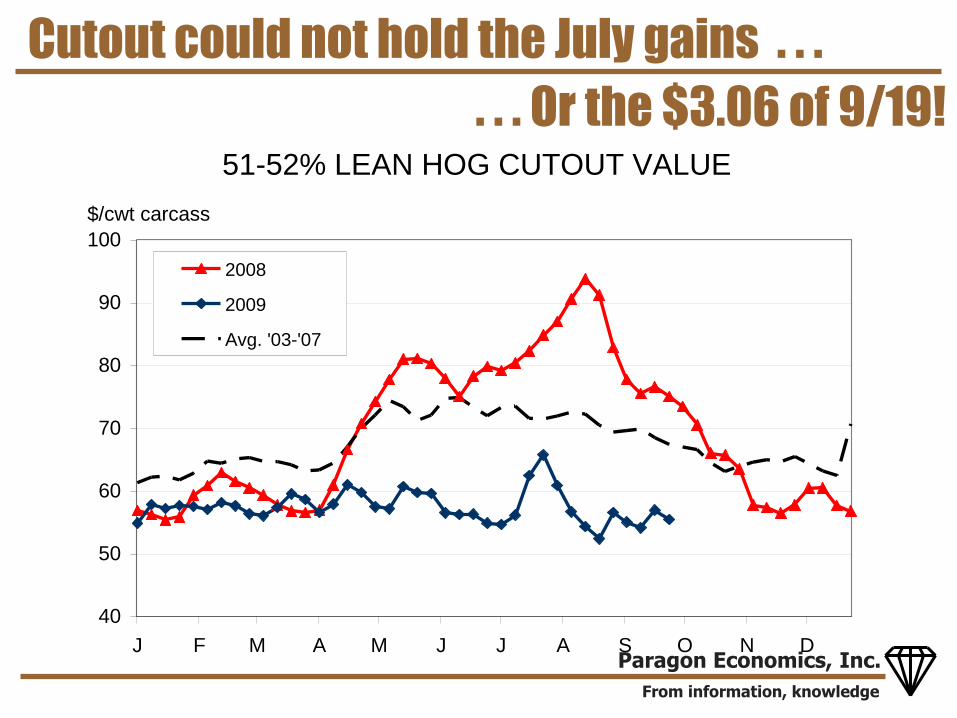
Cutout could not hold the July gains . . .
. . . Or the $3.06 of 9/19!51-52% LEAN HOG CUTOUT VALUE
40
50
60
70
80
90
100
J F M A M J J A S O N D
$/cwt carcass
2008
2009
Avg. '03-'07

From information, knowledge
Paragon Economics, Inc.
Packers finally healed up margins in July . . .
PORK PACKERS' EST'D GROSS MARGIN
0.00
5.00
10.00
15.00
20.00
25.00
30.00
35.00
40.00
J F M A M J J A S O N D
$/hd.
2008
2009
Average '03-'07
Highest gross margin since Feb 1999
Lowest gross margin on record

From information, knowledge
Paragon Economics, Inc.
By-products have helped since May . . .
PORK PACKER MARGIN COMPONENTS
-20.00
-10.00
0.00
10.00
20.00
30.00
40.00
50.00
92 93 94 95 96 97 98 99 00 01 02 03 04 05 06 07 08 09
Dollars/Head
By-Product Value, $/hd.
Meat Margin, $/Hd
. . . But the July jump was meat margin
From information, knowledge
Paragon Economics, Inc.
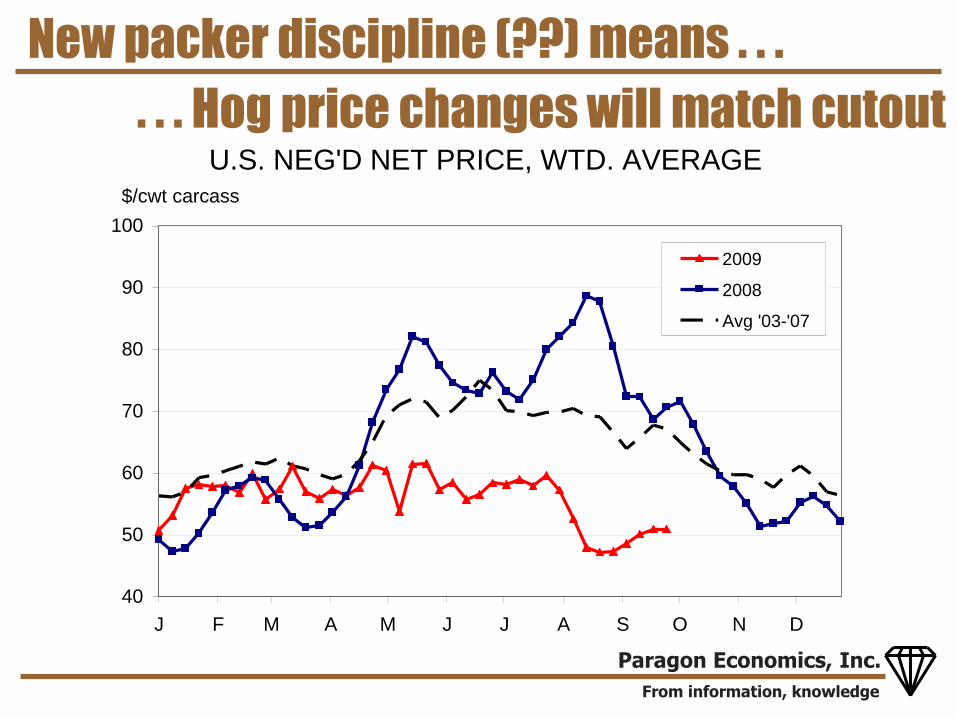
New packer discipline (??) means . . .
. . . Hog price changes will match cutoutU.S. NEG'D NET PRICE, WTD. AVERAGE
40
50
60
70
80
90
100
J F M A M J J A S O N D
$/cwt carcass
2009
2008
Avg '03-'07

From information, knowledge
Paragon Economics, Inc.
Average price actually received . . .
. . . still about $5/cwt higher than spot priceNATIONAL WTD. AVG. NET PRICE
ALL PURCHASE METHODS
40
45
50
55
60
65
70
75
80
85
90
J F M A M J J A S O N D
$/cwt carcass
2009
2008
Avg '03-'07
From information, knowledge
Paragon Economics, Inc.
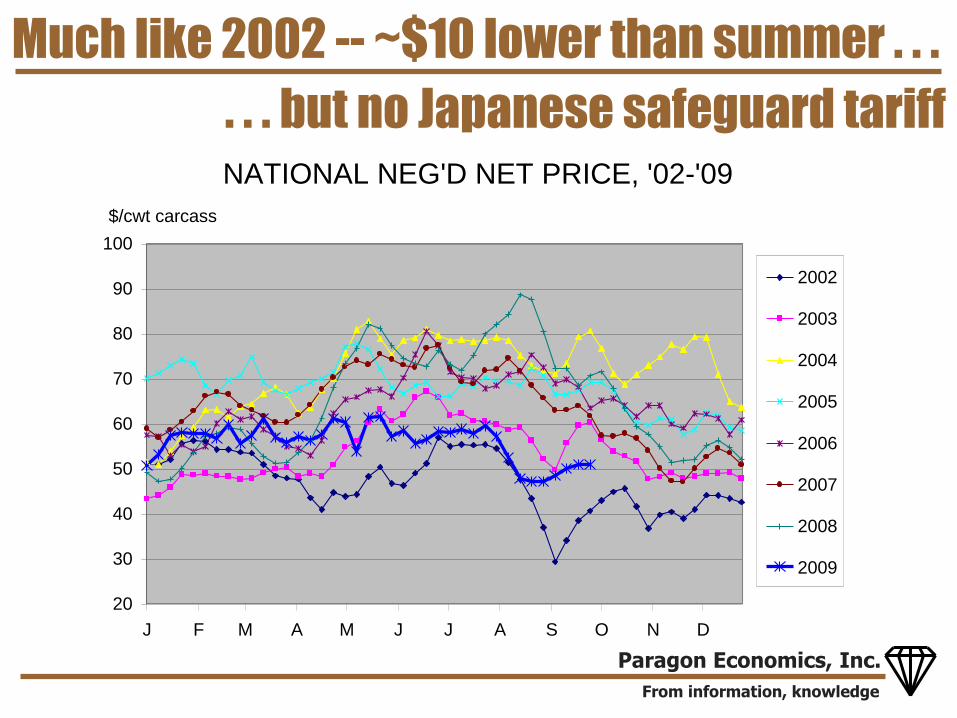
Much like 2002 -- ~$10 lower than summer . . .
. . . but no Japanese safeguard tariffNATIONAL NEG'D NET PRICE, '02-'09
20
30
40
50
60
70
80
90
100
J F M A M J J A S O N D
$/cwt carcass
2002
2003
2004
2005
2006
2007
2008
2009

From information, knowledge
Paragon Economics, Inc.
September Hogs & Pigs: About as expected . .
. . . with some reduction of the pig crop
Category 2008 2009
2009 as Pct
of 2008
Pre-Report
Estimates
Actual -
Estimate
Inventories on September 11
All hogs and pigs 68,196 66,626 97.7 98.2 -0.5
Kept for breeding 6,061 5,874 96.9 97.4 -0.5
Kept for market 62,135 60,752 97.8 98.3 -0.5
Under 60 lbs. 22,683 21,837 96.3 98.3 -2.0
60-119 lbs. 15,397 15,078 97.9 98.3 -0.4
120-179 lbs. 12,855 12,674 98.6 98.8 -0.2
180 lbs. and over 11,201 11,163 99.7 99.0 0.7
Farrowings2
June-Aug sows farrowed 3,075 2,966 96.5 96.8 -0.3
Sep-Nov Intentions 3,028 2,935 96.9 97.3 -0.4
Dec-Feb Intentions 3,024 2,930 96.9 96.9 0.0
June-Aug Pig Crop1 29,240 28,772 98.4 98.1 0.3
June-Aug pigs saved per litter 9.51 9.70 102.0 101.4 0.61Thousand head
2Thousand litters
USDA Quarterly Hogs and Pigs Report
September 25, 2009

From information, knowledge
Paragon Economics, Inc.
Slaughter declining, yr/yr, through 2010 . . .
FI HOG SLAUGHTER, WEEKLY
1,600
1,700
1,800
1,900
2,000
2,100
2,200
2,300
2,400
2,500
2,600
J F M A M J J A S O N D
Thous. Head
Actual 08
Actual 09
Pred '09
Pred '10
Based on USDA Hogs & Pigs Report, September '09
Adjustmets have been made for
fewer market hogs from
Canada through Jan '10 and
fewer feeder pigs through
September '10
. . . But with largest drop – so far – in Q2

From information, knowledge
Paragon Economics, Inc.
FP and MH imports are down sharply . . .
LIVE HOG IMPORTS FROM CANADA
-
50,000
100,000
150,000
200,000
250,000
Jan-
00
Jan-
01
Jan-
02
Jan-
03
Jan-
04
Jan-
05
Jan-
06
Jan-
07
Jan-
08
Jan-
09
Jan-
10
Head
Feeder Pigs
Slght Barr's & Gilts
Slght Sows & Boars
Incorrect data from
APHIS
MH: -71%
FP: -27%
SB: +3%
All: -33%
. . . But are equal to the levels I expected

From information, knowledge
Paragon Economics, Inc.
Quarterly slaughter forecasts . . .
Mil. Hd % Chnge Mil. Hd % Chnge Mil. Hd % Chnge Mil. Hd % Chnge
2008 Q1 29.601 11.1%
Q2 27.941 9.5%
Q3 28.696 8.1%
Q4 30.214 -0.05%
Year 116.452 6.7%
2009 Q1 28.488 -3.8% 28.488 -3.8% 28.488 -3.8% 28.488 -3.8%
Q2 27.063 -3.1% 27.063 -3.1% 27.063 -3.1% 27.063 -3.1%
Q3 28.400 -1.0% 28.553 -0.5% 28.208 -1.7% 28.380 -1.1%
Q4 29.670 -1.8% 29.912 -1.0% 29.607 -2.0% 29.489 -2.4%
Year 113.621 -2.4% 114.015 -2.1% 113.366 -2.7% 113.420 -2.6%
2010 Q1 27.435 -3.7% 28.061 -1.5% 28.357 -0.5% 27.405 -3.8%
Q2 26.200 -3.2% 26.657 -1.5% 27.036 -0.1% 27.804 -2.4%
Q3 27.500 -3.2% 27.981 -2.0% 27.908 -1.1% 27.699 -2.4%
Green figures are actual data from USDA. Red figures are based on partial USDA data. 9/28/2009
September 2009 Commercial Slaughter ForecastsMizzou LMIC MeyerISU
ACTUAL DATA FOR 2008

From information, knowledge
Paragon Economics, Inc.
Sow herd reduction has sped up and . . .
SWINE BREEDING HERDS -- US & Canada
-10%
-8%
-6%
-4%
-2%
0%
2%
4%
6%
8%
10%
1997 1998 1999 2000 2001 2002 2003 2004 2005 2006 2007 2008 2009
Pct Chnge, Yr-Yr
Canada
U.S.
Can-Am
Canada July 2009 -- Down 4.6%
U.S. September 2009 -- Down 3.1%
%
y
. . . Canada‟s October report will say the same

From information, knowledge
Paragon Economics, Inc.
MPR sow purchases: Continued high slghtr
TOTAL SOW PURCHASES, MPR DATA
10
15
20
25
30
35
40
45
50
55
60
J F M A M J J A S O N D
Thous. Head
Avg. '03-'07
2008
2009
MPR Coverage
Expanded by
Farm Bill
Changes

From information, knowledge
Paragon Economics, Inc.
Sow slaughter finally went above 70k/wk. . . .
. . . Will it stay this high? Canadian buyout?FI SOW SLAUGHTER, U.S.
40
45
50
55
60
65
70
75
80
J F M A M J J A S O N D
Thous. Head
Avg. '03-'07
2008
2009
Forecast

From information, knowledge
Paragon Economics, Inc.
Sow slaughter as a % of BH is just now . . .
. . . large enough to make a real differenceFI SOW SLAUGHTER
As a Percent of Previous Quarter's Breeding Herd
0.60%
0.70%
0.80%
0.90%
1.00%
1.10%
1.20%
1.30%
1.40%
J F M A M J J A S O N D
2009
2008
Avg. '03-'07

From information, knowledge
Paragon Economics, Inc.
Why such a slow reaction?
Producers WANT to be in this business – it has been good to them!
2008 exports provided false security and hope – Producers believed 2008 was the new reality???

From information, knowledge
Paragon Economics, Inc.
Producer equity was record high in ‟07 . . .
ACCUMULATED PROFITS
IOWA FARROW-TO-FINISH OPERATIONS(Sum of the profit from selling one pig per month since January 1991)
$(200)
$(100)
$-
$100
$200
$300
$400
$500
$600
$700
$800
$900
91 92 93 94 95 96 97 98 99 00 01 02 03 04 05 06 07 08 09
Took 8 years to get
back to Nov 1997 level
Peak in Sept '07 = $786.87
Thru August 2009
Have lost $517.52
66% of peak amount
Source: Paragon Economics, Inc. using data from Estimated Costs and Returns, Dr. John Lawrence, Department of Economics, Iowa State
University
Aug '09 = $269.35
. . . but is now down by two-thirds!
From information, knowledge
Paragon Economics, Inc.
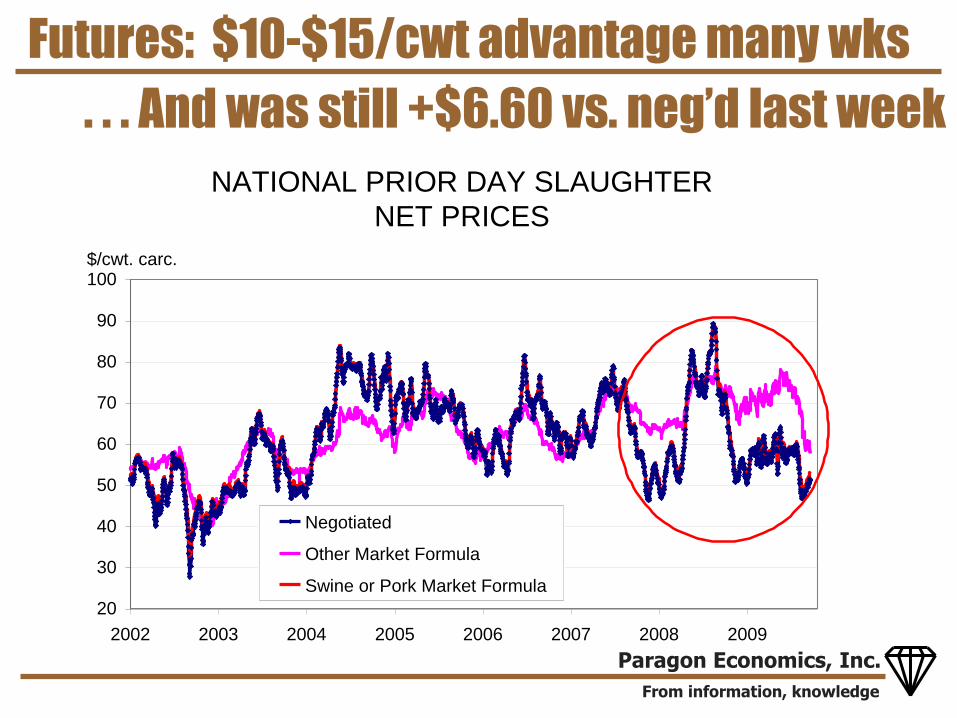
Futures: $10-$15/cwt advantage many wks
NATIONAL PRIOR DAY SLAUGHTER
NET PRICES
20
30
40
50
60
70
80
90
100
2002 2003 2004 2005 2006 2007 2008 2009
$/cwt. carc.
Negotiated
Other Market Formula
Swine or Pork Market Formula
. . . And was still +$6.60 vs. neg‟d last week

From information, knowledge
Paragon Economics, Inc.
What to expect
Incentives to cut back are now VERY strong – actually for the first time in this cycle!
Though the pace is quickening – liquida-tion will be slow by historical standards
THERE WILL BE A U.S. PORK INDUSTRY
- Exceptional operational efficiencies
- Adept financial management
- Successful RISK MANAGEMENT – a BIG one!

From information, knowledge
Paragon Economics, Inc.
How much of a reduction do we need?
We have to make up for:
- ~7-8% productivity increase of circo vac‟s
- 20-30% higher costs.
Need a 12% reduction of US/Canada herd from 10/07 peak of 7.752 mil. = 6.82 mil.
- Canada is already at 1.38 million and will cut farther – to 1.25 mil. or so
- U.S. needs to go to between 5.5 and 5.6 million
Sept 1: 5.874 million, down 3.1% vs. „08

From information, knowledge
Paragon Economics, Inc.
Price forecasts – but futures are higher!
Missouri ISU LMIC Meyer CME
51-52% Lean,
Live1
Ia-S. Mn. Live
Price1
National Wtd
Avg. Base Price
National Net
Neg'd Price,
Wtd. Avg.
CME Lean
Hog Futures
9/28/09
2008 Q1 $52.85 $53.05 $55.27 $53.40 $54.26**
Q2 $70.01 $73.80 $69.92 $71.66 $71.66**
Q3 $76.36 $80.02 $75.60 $77.48 $78.45**
Q4 $55.89 $57.25 $59.00 $56.70 $58.51**
Year $63.78 $66.03 $64.95 $64.81 $65.72**
2009 Q1 56.15 56.80 58.11 57.22 $58.14**
Q2 57.67 58.48 59.45 58.18 $59.03**
Q3 52.13* 52.79* 54.14* 52.72* $54.18**
Q4 43 - 47 45 - 48 51 - 54 50 - 53 $49.81
Year 52 - 54 53 - 54 56 - 57 54 - 56 $55.29
2010 Q1 47 - 51 53 - 56 56 - 59 54 - 56 $56.60
Q2 53 - 57 64 - 67 61 - 64 62 - 66 $66.97
Q3 52 - 56 57 - 61 65 - 68 64 - 68 $70.051Converted to carcass using a yield of 75% *Partial USDA data **Average of CME Lean Hog Index
September 2009 Hogs & Pigs Price Forecasts
From information, knowledge
Paragon Economics, Inc.
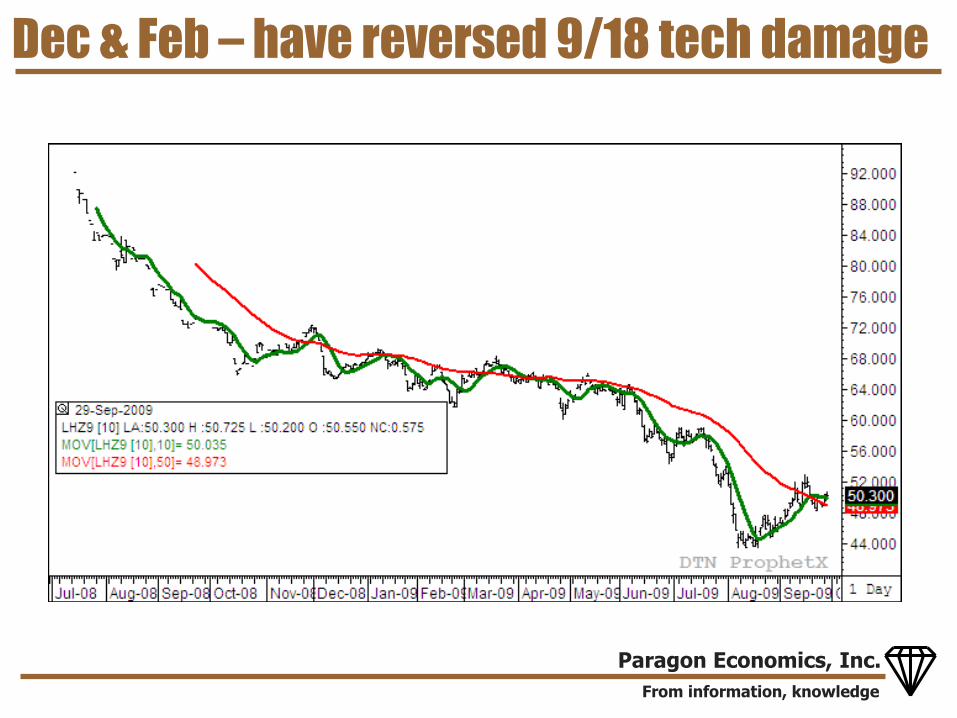
Dec & Feb – have reversed 9/18 tech damage

From information, knowledge
Paragon Economics, Inc.
April and beyond: Big top side breakout

From information, knowledge
Paragon Economics, Inc.
H1N1 hurt prices in May & June . . .
. . . hard to blame it now – exc. export PROJECTED & ACTUAL HOG PRICES, PRE
AND POST H1N1 -- AS OF 9/28
35
45
55
65
75
4/24
5/22
6/19
7/17
8/14
9/11
10/9
11/6
12/4 1/
11/
292/
263/
264/
23
$/cwt.Futures-Implied, 4/24
Neg&Swine/Pork Formula
Futures-Implied, 9/28
$1.125 Bil.
Through April 2010: $2.74 Billion

From information, knowledge
Paragon Economics, Inc.
“Why are you in this shape?”
“20% higher production costs driven by higher corn and soybean meal prices.”
NOT due to overexpansion – only 3.1% more sows during 44 months of profits!
Productivity has played a big role:
- Circo vaccines – economic and humane treatment AND concern for workers
- Improved genetics, management, etc.
H1N1 and associated disruptions
From information, knowledge
Paragon Economics, Inc.
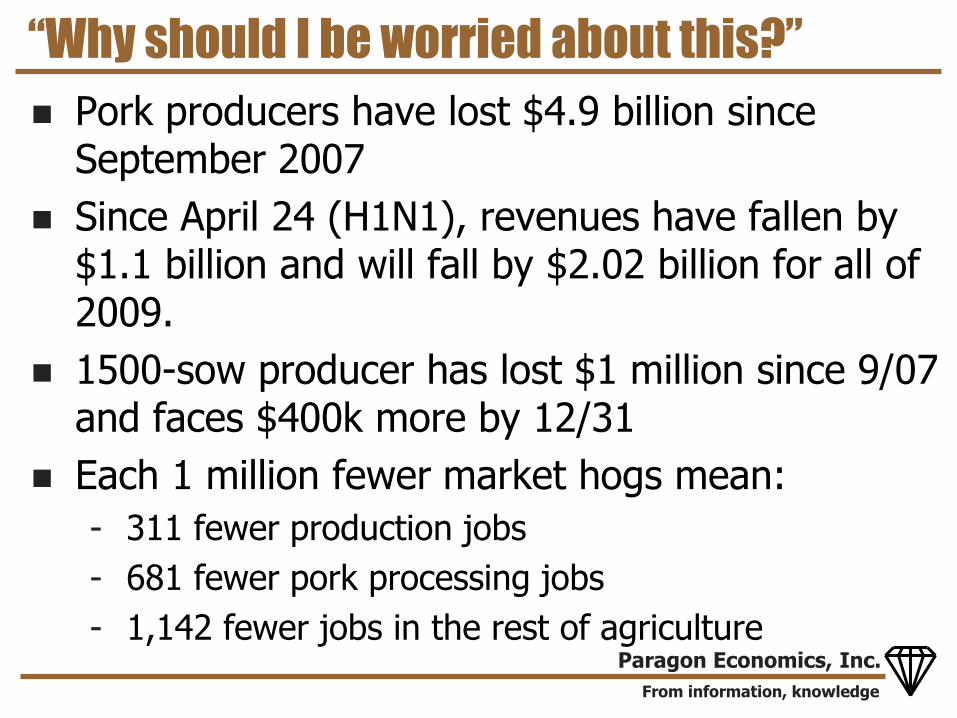
“Why should I be worried about this?”
Pork producers have lost $4.9 billion since September 2007
Since April 24 (H1N1), revenues have fallen by $1.1 billion and will fall by $2.02 billion for all of 2009.
1500-sow producer has lost $1 million since 9/07 and faces $400k more by 12/31
Each 1 million fewer market hogs mean:
- 311 fewer production jobs
- 681 fewer pork processing jobs
- 1,142 fewer jobs in the rest of agriculture

From information, knowledge
Paragon Economics, Inc.
QUESTIONS AND DISCUSSION?