Embed Size (px)
Citation preview
Outside the Box is a free weekly economics e-letter by best-selling author and renowned financial expert John Mauldin. You can learn more and get your free subscription by visiting www.mauldineconomics.com
Page 1
Hoisington Investment Management Quarterly Review and Outlook Third Quarter 2012 John Mauldin |October 20, 2012
The Hoisington Quarterly Review and Outlook is one of the cornerstones of my reading on where the economy
is headed. Van Hoisington and Lacy Hunt do a masterful job of turning data points into cogent, well-argued themes.
This month they waste no time in dissecting the Fed’s recent move to QE3 and similar efforts in Europe, arriving
at the conclusion that “While prices for risk assets have improved, governments have not been able to address
underlying debt imbalances. Thus, nothing suggests that these latest actions do anything to change the extreme over-
indebtedness of major global economies.”
Their expectation: global recession. The only issue left to sort out, they say, is How deep will the downturn be?
They make the interesting observation that with each injection of liquidity by the Fed, commodity prices have
surged: “During QE1 & QE2 wholesale gasoline prices jumped 30% and 37%, respectively, and the Goldman Sachs
Commodity Food Index (GSCI-Food) rose 7% and 22%, respectively. From the time the press reported that the Fed was
moving toward QE3, both gasoline and the GSCI Food index jumped by 19%, through the end of the 3rd quarter.”
The QE picture gets even muddier. The unintended consequence of the Fed’s actions, say Lacy and Van, has
been to actually slow economic activity: “The CPI rose significantly in QE1 and QE2 (Chart 1). These price increases had
a devastating effect on worker's incomes (Chart 2). Wages did not immediately respond to commodity price changes;
therefore, there was an approximate 3% decline in real average hourly earnings in both instances. It is true that stock
prices also rose along with commodity prices (S&P plus 36% and 24%, respectively, in QE1 and QE2). However, median
households hold a small portion of equities, and thus received minimal wealth benefit.”
They proceed to tear apart the wealth effect that the Fed is banking on to restimulate the economy, drawing on
several solid studies. They also make the key point that “When the Fed actions lead to higher food and fuel prices, the
shock wave reverberates around the world, with many foreign economies being hit adversely. When prices of basic
necessities rise, the greatest burden is on those with the lowest incomes since more of their budget is allocated to the
basic necessities such as food and fuel.”
The next few years are not going to be pretty. We’re looking right into the teeth of a rolling global deleveraging
recession – the End Game, I’ve called it. And the decisions we make in the next couple years about how to handle our
debts and budget deficits – here in the US, in Europe, in China and Japan, and elsewhere – are going to be absolutely
crucial.
Outside the Box is a free weekly economic e-letter by best-selling author and renowned financial expert, John Mauldin. You can learn more and get your free subscription by visiting www.JohnMauldin.com
Page 2
Hoisington Investment Management Company (www.hoisingtonmgt.com) is a registered investment advisor
specializing in fixed-income portfolios for large institutional clients. Located in Austin, Texas, the firm has over $4 billion
under management, composed of corporate and public funds, foundations, endowments, Taft-Hartley funds, and
insurance companies.
My daughter Abbi is coming into town tonight from Tulsa with her fiance, and most of the family will gather
over the weekend for dinners and fun. And her twin Amanda is expecting, so another grandchild is in the future as well.
Family and friends are among the few permanent fixtures in a world that seems to change almost weekly.
I was with Pat Cox of Breakthrough Technology Alert on tuesday night. We watched the debate and then went
deep into the night talking about the future. And got up the next day and did the same between meetings. We ended
up doing a tag team that night for Hedge Fund Cares, which raised a lot of money to help abused children. I talked
about the global landscape (which was not so upbeat) and he talked about the changes we see in the biotech world;
and we then both answered questions, which was more fun, as we got to think about the marvelous the future that is
shaping up. Such totally amazing things are happening. I am really quite the optimist over the longer term.
Have a great weekend, and look for your next Thoughts from the Frontline in your inbox Monday.
Your bullish on the future but bearish on governments analyst,
John Mauldin, Editor
Outside the Box
_____________
Hoisington Investment Management
Quarterly Review and Outlook
Third Quarter 2012
Growth Recession
Entering the final quarter of the year, domestic and global economic conditions are extremely
fragile. Across the globe, countries are in outright recession, and in some instances where aggregate
growth is holding above the zero line, manufacturing sectors are contracting. The only issue left to
determine is the degree of the downturn underway. International trade is declining, so weaknesses in
different parts of the world are reinforcing domestic deteriorations in economies continents away. With
this global slump at hand, a highly relevant question is whether the U.S. can escape a severe recession
in light of the following:

Outside the Box is a free weekly economic e-letter by best-selling author and renowned financial expert, John Mauldin. You can learn more and get your free subscription by visiting www.JohnMauldin.com
Page 3
a) the U.S. manufacturing sector that paced domestic economic growth over the past three years
has lapsed into recession;
b) real income and the personal saving rate have been slumping in the face of an interim upturn
in inflation, and
c) aggregate over-indebtedness, which is the dominant negative force in the economy, has
continued to move upward in concert with flagging economic activity.
New government initiatives have been announced, particularly by central banks, in an attempt to
counteract deteriorating economic conditions. These latest programs in the U.S. and Europe are similar
to previous efforts. While prices for risk assets have improved, governments have not been able to
address underlying debt imbalances. Thus, nothing suggests that these latest actions do anything to
change the extreme over-indebtedness of major global economies.
To avoid recession in the U.S., the Federal Reserve embarked on open-ended quantitative easing
(QE3). Importantly, the enactment of QE3 is a tacit admission by the Fed that earlier efforts failed, but
this action will also fail to bring about stronger economic growth.
Commodity Market Reactions
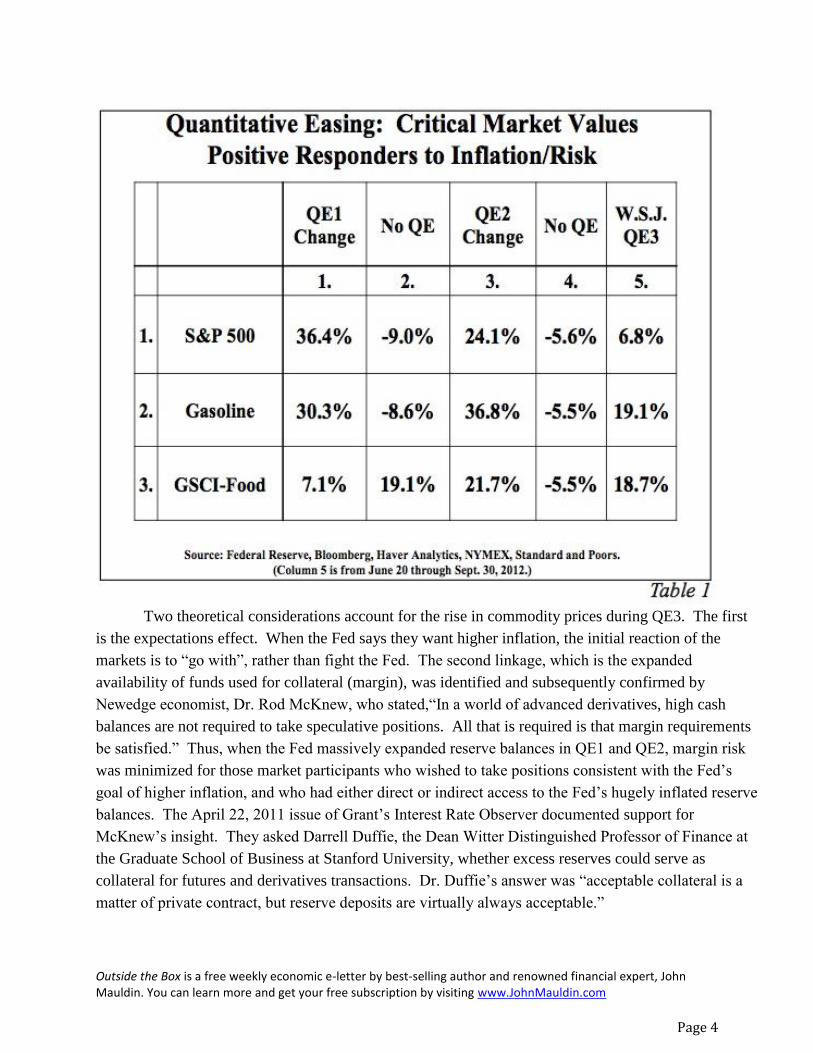
Commodity markets have risen in reaction to the Federal Reserve’s liquidity injections into the
banking sector (Table 1). From the time the press reported that the Fed was moving toward QE1 &
QE2 commodity prices surged. During QE1 & QE2 wholesale gasoline prices jumped 30% and 37%,
respectively, and the Goldman Sachs Commodity Food Index (GSCI-Food) rose 7% and 22%,
respectively. From the time the press reported that the Fed was moving toward QE3, both gasoline and
the GSCI Food index jumped by 19%, through the end of the 3rd quarter.
Outside the Box is a free weekly economic e-letter by best-selling author and renowned financial expert, John Mauldin. You can learn more and get your free subscription by visiting www.JohnMauldin.com
Page 4
Two theoretical considerations account for the rise in commodity prices during QE3. The first
is the expectations effect. When the Fed says they want higher inflation, the initial reaction of the
markets is to “go with”, rather than fight the Fed. The second linkage, which is the expanded
availability of funds used for collateral (margin), was identified and subsequently confirmed by
Newedge economist, Dr. Rod McKnew, who stated,“In a world of advanced derivatives, high cash
balances are not required to take speculative positions. All that is required is that margin requirements
be satisfied.” Thus, when the Fed massively expanded reserve balances in QE1 and QE2, margin risk
was minimized for those market participants who wished to take positions consistent with the Fed’s
goal of higher inflation, and who had either direct or indirect access to the Fed’s hugely inflated reserve
balances. The April 22, 2011 issue of Grant’s Interest Rate Observer documented support for
McKnew’s insight. They asked Darrell Duffie, the Dean Witter Distinguished Professor of Finance at
the Graduate School of Business at Stanford University, whether excess reserves could serve as
collateral for futures and derivatives transactions. Dr. Duffie’s answer was “acceptable collateral is a
matter of private contract, but reserve deposits are virtually always acceptable.”
Outside the Box is a free weekly economic e-letter by best-selling author and renowned financial expert, John Mauldin. You can learn more and get your free subscription by visiting www.JohnMauldin.com
Page 5
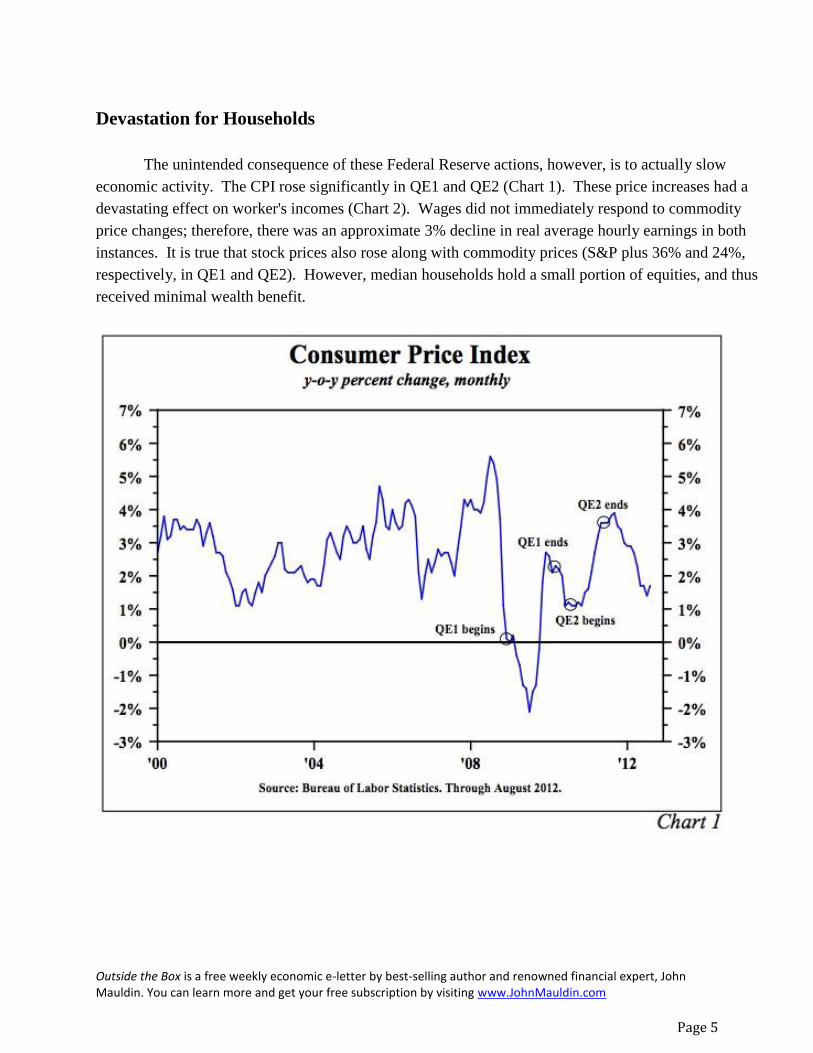
Devastation for Households
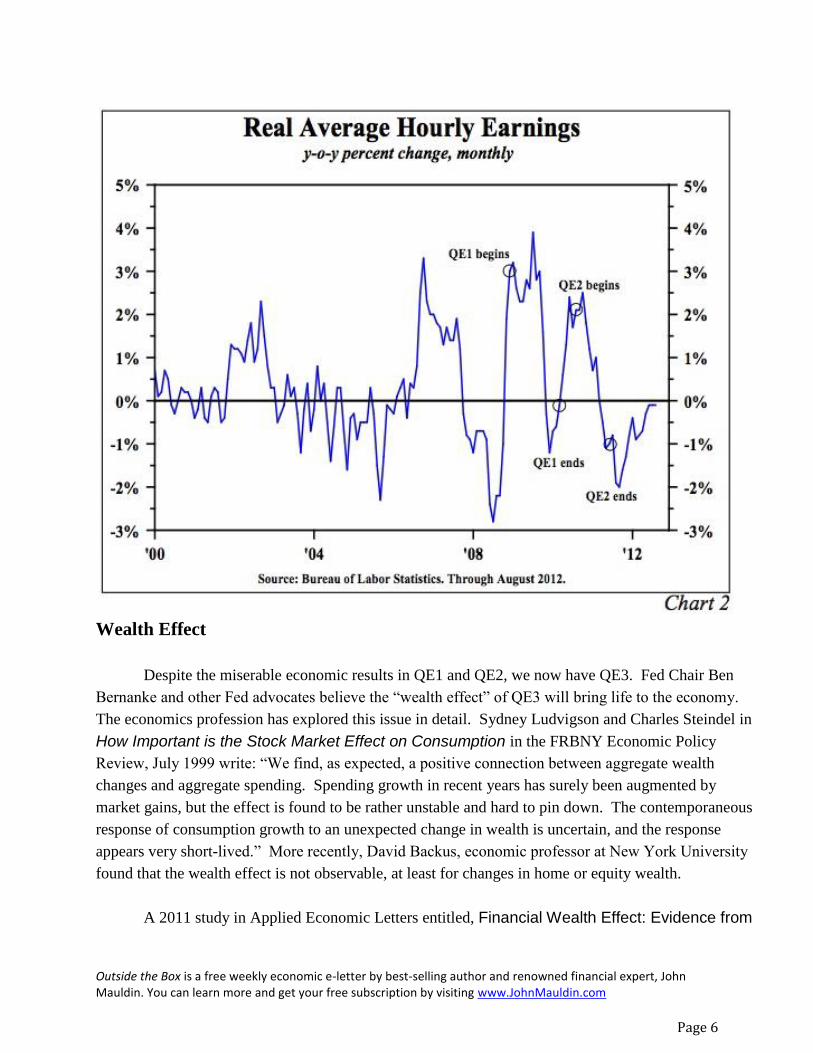
The unintended consequence of these Federal Reserve actions, however, is to actually slow
economic activity. The CPI rose significantly in QE1 and QE2 (Chart 1). These price increases had a
devastating effect on worker's incomes (Chart 2). Wages did not immediately respond to commodity
price changes; therefore, there was an approximate 3% decline in real average hourly earnings in both
instances. It is true that stock prices also rose along with commodity prices (S&P plus 36% and 24%,
respectively, in QE1 and QE2). However, median households hold a small portion of equities, and thus
received minimal wealth benefit.
Outside the Box is a free weekly economic e-letter by best-selling author and renowned financial expert, John Mauldin. You can learn more and get your free subscription by visiting www.JohnMauldin.com
Page 6
Wealth Effect
Despite the miserable economic results in QE1 and QE2, we now have QE3. Fed Chair Ben
Bernanke and other Fed advocates believe the “wealth effect” of QE3 will bring life to the economy.
The economics profession has explored this issue in detail. Sydney Ludvigson and Charles Steindel in
How Important is the Stock Market Effect on Consumption in the FRBNY Economic Policy
Review, July 1999 write: “We find, as expected, a positive connection between aggregate wealth
changes and aggregate spending. Spending growth in recent years has surely been augmented by
market gains, but the effect is found to be rather unstable and hard to pin down. The contemporaneous
response of consumption growth to an unexpected change in wealth is uncertain, and the response
appears very short-lived.” More recently, David Backus, economic professor at New York University
found that the wealth effect is not observable, at least for changes in home or equity wealth.
A 2011 study in Applied Economic Letters entitled, Financial Wealth Effect: Evidence from

Outside the Box is a free weekly economic e-letter by best-selling author and renowned financial expert, John Mauldin. You can learn more and get your free subscription by visiting www.JohnMauldin.com
Page 7
Threshold Estimation by Sherif Khalifa, Ousmane Seck and Elwin Tobing found “a threshold income
level of almost $130,000, below which the financial wealth effect is insignificant, and above which the
effect is 0.004.” This means a $1 rise in wealth would, in time, boost consumption by less than one-half
penny.
These three studies show that the impact of wealth on spending is miniscule—indeed, “nearly
not observable.” How the Fed expects the U.S. to gain any economic traction from higher stock prices
when rising commodity prices are curtailing real income and spending is puzzling. This is particularly
relevant when econometricians have estimated that for every dollar of gained real income, consumption
will rise by about 70 cents. Conversely, the Fed actions are causing real incomes to decline, which has
a 70-cent negative impact on spending for every dollar loss. Compare that with the 0.004 positive
impact on spending for every one-dollar increase in wealth. Former Fed Chairman, Paul Volcker,
summarized the new Fed initiative as sufficiently and succinctly as anyone when he stated that another
round of QE3 “is understandable, but it will fail to fix the problem.”
An International Corollary
The unintended consequences of QE3 could also serve to worsen and undermine global
economic conditions already under considerable duress. When the Fed actions lead to higher food and
fuel prices, the shock wave reverberates around the world, with many foreign economies being hit
adversely. When prices of basic necessities rise, the greatest burden is on those with the lowest
incomes since more of their budget is allocated to the basic necessities such as food and fuel. Thus, a
jump in daily essentials has a more profound negative impact on living standards in economies with
lower levels of real per capita income.
Can the Fed Create Demand?
Can all the trillions of dollars of reserves being added to the banking system move the economy
forward enough to eventually create a higher level of aggregate spending? Our analysis of the
aggregate demand curve and its determinants indicate they cannot. The question is whether monetary
actions can shift this aggregate demand (AD) curve out to the right from AD0 to AD1 (Chart 3). If this
were possible, then indeed the economy would shift to a higher level of prices and real GDP.

Outside the Box is a free weekly economic e-letter by best-selling author and renowned financial expert, John Mauldin. You can learn more and get your free subscription by visiting www.JohnMauldin.com
Page 8
The AD curve is equal to planned expenditures for nominal GDP since every point on the curve
is equal to the aggregate price level (measured on the vertical axis of the graph), multiplied by real
GDP (measured on the horizontal axis of the graph). We know that GDP is equal to money times its
turnover or velocity, which is called the equation of exchange as developed by Irving Fisher (Nominal
GDP = M*V).
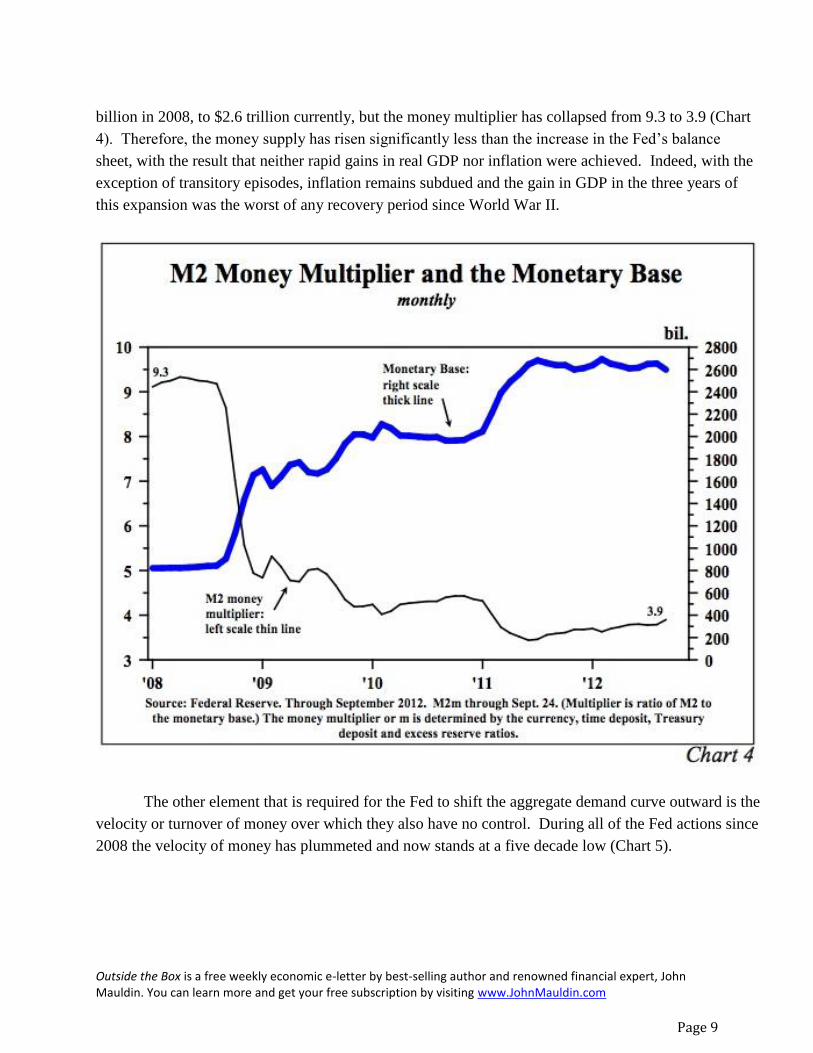
Deconstructing this formula, M (or M2) is comprised of the monetary base (currency plus
reserves) times the money multiplier (m). The Federal Reserve has control over the monetary base
since its balance sheet is the dominant component of the monetary base. However, the Fed does not
directly control the money supply. The decisions of the depository institutions and the non-bank public
determine the money multiplier (m). M2 thus equals the monetary base multiplied by the money
multiplier. The monetary base, also referred to as high powered money, has exploded from $800
Outside the Box is a free weekly economic e-letter by best-selling author and renowned financial expert, John Mauldin. You can learn more and get your free subscription by visiting www.JohnMauldin.com
Page 9
billion in 2008, to $2.6 trillion currently, but the money multiplier has collapsed from 9.3 to 3.9 (Chart
4). Therefore, the money supply has risen significantly less than the increase in the Fed’s balance
sheet, with the result that neither rapid gains in real GDP nor inflation were achieved. Indeed, with the
exception of transitory episodes, inflation remains subdued and the gain in GDP in the three years of
this expansion was the worst of any recovery period since World War II.
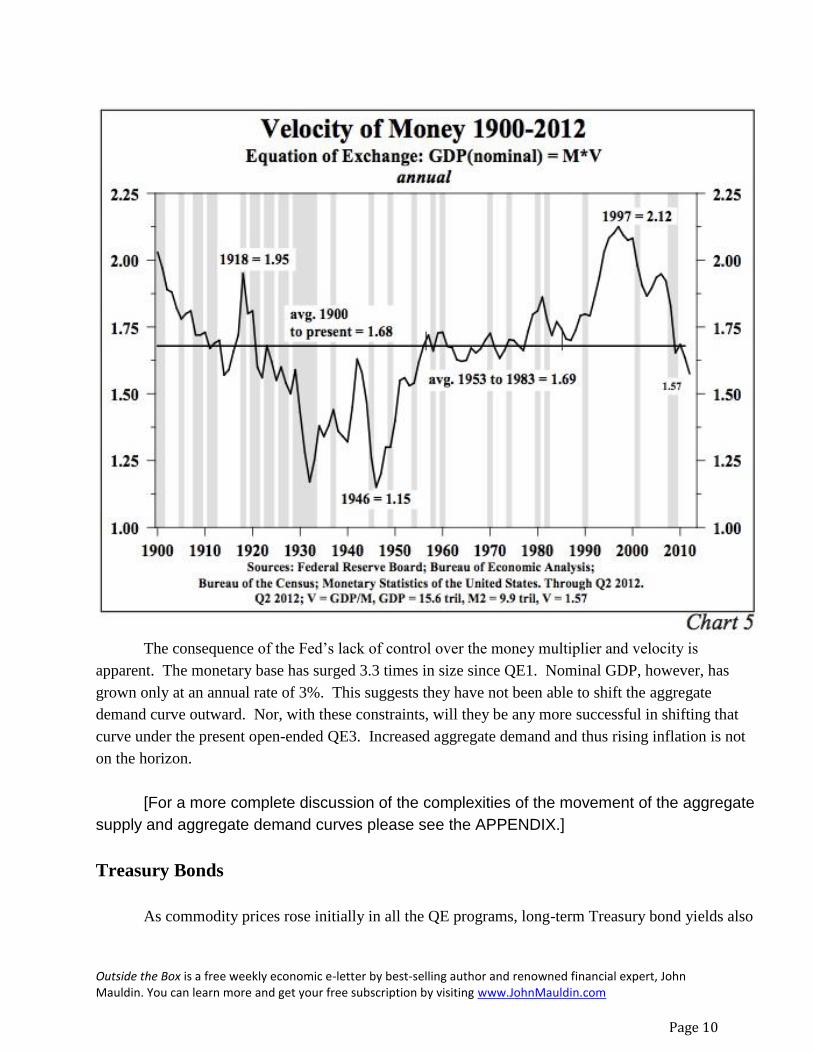
The other element that is required for the Fed to shift the aggregate demand curve outward is the
velocity or turnover of money over which they also have no control. During all of the Fed actions since
2008 the velocity of money has plummeted and now stands at a five decade low (Chart 5).
Outside the Box is a free weekly economic e-letter by best-selling author and renowned financial expert, John Mauldin. You can learn more and get your free subscription by visiting www.JohnMauldin.com
Page 10
The consequence of the Fed’s lack of control over the money multiplier and velocity is
apparent. The monetary base has surged 3.3 times in size since QE1. Nominal GDP, however, has
grown only at an annual rate of 3%. This suggests they have not been able to shift the aggregate
demand curve outward. Nor, with these constraints, will they be any more successful in shifting that
curve under the present open-ended QE3. Increased aggregate demand and thus rising inflation is not
on the horizon.
[For a more complete discussion of the complexities of the movement of the aggregate
supply and aggregate demand curves please see the APPENDIX.]
Treasury Bonds
As commodity prices rose initially in all the QE programs, long-term Treasury bond yields also
Outside the Box is a free weekly economic e-letter by best-selling author and renowned financial expert, John Mauldin. You can learn more and get your free subscription by visiting www.JohnMauldin.com
Page 11
increased. However, those higher yields eventually reversed and generally continued to ratchet
downward, reaching near record lows. The current Fed actions may be politically necessary due to
numerous demands for them to act to improve the clearly depressed state of economic conditions.
However, these policies will prove to be unproductive. Economic fundamentals will not improve until
the extreme over-indebtedness of the U.S. economy is addressed, and this is in the realm of fiscal, not
monetary policy. It would be more beneficial for the Fed to sit on the sidelines and try to put pressure
on the fiscal authorities to take badly needed actions rather than do additional harm. Until the excessive
debt issues are addressed, the multi-year trend in inflation, and thus the long Treasury bond yields will
remain downward.
APPENDIX
One of the most important concepts in macroeconomics is aggregate demand (AD) and
aggregate supply (AS) analysis – a highly attractive approach that is neither Keynesian, monetarist,
Austrian, nor any other individual school, but can be used to illustrate all of their main propositions.
However, before detailing the broader macroeconomics associated with the movement of the AD and
AS curves, it is important to understand microeconomic supply and demand curves. This can best be
illustrated through the recent impact the Fed’s decisions had on commodity prices. In the commodity
market, like individual markets in general, the demand curve is downward sloping, the supply curve is
upward sloping, and where they intersect determines the price of the commodity and the quantity
supplied/demanded. The micro-demand curve slopes downward because as the price of an item rises,
the quantity demanded falls due to income and substitution effects (buyers can shift to a substitute
product). The micro-supply curve slopes upward since producers will sell more at higher prices than
lower ones.
Both supply and demand schedules are influenced by expectation, fundamental, and liquidity
considerations. When the Fed says that they want faster inflation and that they are going to take steps
to achieve this objective, both economic theory and historical experiences indicate that commodity
prices will rise, at least transitorily (as seen with the surge in commodity prices after the announcement
of QE1, QE2 and QE3). Information and liquidity available to the buyers is also available to the
suppliers, so by saying faster inflation is ahead, suppliers are encouraged to reduce or withhold current
production or inventories, moving the supply curve inward. Thus, in the commodity market, the Fed
action spurs an outward shift in the micro-demand curve along with an inward shift of the micro-supply
curve, producing higher prices and lower quantities. These microeconomic developments transmit to
the broader economy, which we will now trace through AD and AS curves.

Outside the Box is a free weekly economic e-letter by best-selling author and renowned financial expert, John Mauldin. You can learn more and get your free subscription by visiting www.JohnMauldin.com
Page 12
The AD curve slopes downward and indicates the amount of real GDP that would be purchased
at each aggregate price level (Chart 6). Aggregate demand varies inversely with the price level, so if
the price level moves upward from P0 to P1, real GDP declines from Y0 to Y1. When the price level
rises, real wages, real money balances and net exports worsen, thereby reducing real GDP. The
rationale for the downward sloping AD curve is thus quite different from the sloping of the micro-
demand curve since substitution effects are not possible when dealing with aggregate prices. In order
to improve real GDP with a rising price level, the AD curve would need to be shifted outward and to
the right (from AD0 to AD1). And as detailed in the letter, the Fed is not capable of shifting the entire
AD curve.
The AS curve slopes upward and indicates the quantity of GDP supplied at various price levels.
The positive correlation between price and output in micro and macroeconomics is the same since the
AS curve is the sum of all supply curves across all individual markets. When Fed policy
Outside the Box is a free weekly economic e-letter by best-selling author and renowned financial expert, John Mauldin. You can learn more and get your free subscription by visiting www.JohnMauldin.com
Page 13
announcements shock commodity markets, the AS curve shifts inward and to the left (from AS0 to
AS1). This immediately causes a reduction in real GDP (the difference between Y0 and Y1) as the
price increases by the difference between P0 and P1 (also Chart 6). Furthermore, as discussed in the
letter, lower GDP as a result of higher prices reduces the demand for labor and widens the output gap,
setting in motion a negative spiral.
For Fed policy to improve real GDP, actions must be taken that either (1) shift the entire
demand curve outward (to the right), or (2) do not cause an inward shift of the AS curve that induces an
adverse movement along the AD curve. Accordingly, the Fed is without options to improve the pace of
economic activity.
Copyright 2012 John Mauldin. All Rights Reserved.
Share Your Thoughts on This Article
Like Outside the Box? Then we think you'll love John’s premium product, Over My Shoulder. Each week John Mauldin sends his Over My Shoulder subscribers the most interesting items that he personally cherry picks from the dozens of books, reports, and articles he reads each week as part of his research. Learn more about Over My Shoulder
Outside the Box is a free weekly economic e-letter by best-selling author and renowned financial expert, John Mauldin. You can
learn more and get your free subscription by visiting http://www.mauldineconomics.com.
Please write to [email protected] to inform us of any reproductions, including when and where copy will be
reproduced. You must keep the letter intact, from introduction to disclaimers. If you would like to quote brief portions only, please
reference http://www.mauldineconomics.com.
To subscribe to John Mauldin's e-letter, please click here: http://www.mauldineconomics.com/subscribe/
To change your email address, please click here: http://www.mauldineconomics.com/change-address
If you would ALSO like changes applied to the Mauldin Circle e-letter, please include your old and new email address along with a
note requesting the change for both e-letters and send your request to [email protected].
To unsubscribe, please refer to the bottom of the email.
Outside the Box and JohnMauldin.com is not an offering for any investment. It represents only the opinions of John Mauldin and
Outside the Box is a free weekly economic e-letter by best-selling author and renowned financial expert, John Mauldin. You can learn more and get your free subscription by visiting www.JohnMauldin.com
Page 14
those that he interviews. Any views expressed are provided for information purposes only and should not be construed in any way as
an offer, an endorsement, or inducement to invest and is not in any way a testimony of, or associated with, Mauldin's other firms.
John Mauldin is the Chairman of Mauldin Economics, LLC. He also is the President of Millennium Wave Advisors, LLC (MWA) which
is an investment advisory firm registered with multiple states, President and registered representative of Millennium Wave Securities,
LLC, (MWS) member FINRA, SIPC. MWS is also a Commodity Pool Operator (CPO) and a Commodity Trading Advisor (CTA)
registered with the CFTC, as well as an Introducing Broker (IB) and NFA Member. Millennium Wave Investments is a dba of MWA
LLC and MWS LLC. This message may contain information that is confidential or privileged and is intended only for the individual or
entity named above and does not constitute an offer for or advice about any alternative investment product. Such advice can only be
made when accompanied by a prospectus or similar offering document. Past performance is not indicative of future performance.
Please make sure to review important disclosures at the end of each article. Mauldin companies may have a marketing relationship
with products and services mentioned in this letter for a fee.
Note: Joining the Mauldin Circle is not an offering for any investment. It represents only the opinions of John Mauldin and Millennium
Wave Investments. It is intended solely for investors who have registered with Millennium Wave Investments and its partners at
www.MauldinCircle.com or directly related websites. The Mauldin Circle may send out material that is provided on a confidential
basis, and subscribers to the Mauldin Circle are not to send this letter to anyone other than their professional investment counselors.
Investors should discuss any investment with their personal investment counsel. John Mauldin is the President of Millennium Wave
Advisors, LLC (MWA), which is an investment advisory firm registered with multiple states. John Mauldin is a registered
representative of Millennium Wave Securities, LLC, (MWS), an FINRA registered broker-dealer. MWS is also a Commodity Pool
Operator (CPO) and a Commodity Trading Advisor (CTA) registered with the CFTC, as well as an Introducing Broker (IB).
Millennium Wave Investments is a dba of MWA LLC and MWS LLC. Millennium Wave Investments cooperates in the consulting on
and marketing of private and non-private investment offerings with other independent firms such as Altegris Investments; Capital
Management Group; Absolute Return Partners, LLP; Fynn Capital; Nicola Wealth Management; and Plexus Asset Management.
Investment offerings recommended by Mauldin may pay a portion of their fees to these independent firms, who will share 1/3 of
those fees with MWS and thus with Mauldin. Any views expressed herein are provided for information purposes only and should not
be construed in any way as an offer, an endorsement, or inducement to invest with any CTA, fund, or program mentioned here or
elsewhere. Before seeking any advisor's services or making an investment in a fund, investors must read and examine thoroughly
the respective disclosure document or offering memorandum. Since these firms and Mauldin receive fees from the funds they
recommend/market, they only recommend/market products with which they have been able to negotiate fee arrangements.
PAST RESULTS ARE NOT INDICATIVE OF FUTURE RESULTS. THERE IS RISK OF LOSS AS WELL AS THE OPPORTUNITY
FOR GAIN WHEN INVESTING IN MANAGED FUNDS. WHEN CONSIDERING ALTERNATIVE INVESTMENTS, INCLUDING
HEDGE FUNDS, YOU SHOULD CONSIDER VARIOUS RISKS INCLUDING THE FACT THAT SOME PRODUCTS: OFTEN
ENGAGE IN LEVERAGING AND OTHER SPECULATIVE INVESTMENT PRACTICES THAT MAY INCREASE THE RISK OF
INVESTMENT LOSS, CAN BE ILLIQUID, ARE NOT REQUIRED TO PROVIDE PERIODIC PRICING OR VALUATION
INFORMATION TO INVESTORS, MAY INVOLVE COMPLEX TAX STRUCTURES AND DELAYS IN DISTRIBUTING IMPORTANT
TAX INFORMATION, ARE NOT SUBJECT TO THE SAME REGULATORY REQUIREMENTS AS MUTUAL FUNDS, OFTEN
CHARGE HIGH FEES, AND IN MANY CASES THE UNDERLYING INVESTMENTS ARE NOT TRANSPARENT AND ARE KNOWN
ONLY TO THE INVESTMENT MANAGER. Alternative investment performance can be volatile. An investor could lose all or a
substantial amount of his or her investment. Often, alternative investment fund and account managers have total trading authority
over their funds or accounts; the use of a single advisor applying generally similar trading programs could mean lack of
diversification and, consequently, higher risk. There is often no secondary market for an investor's interest in alternative investments,
and none is expected to develop.
All material presented herein is believed to be reliable but we cannot attest to its accuracy. Opinions expressed in these reports may
change without prior notice. John Mauldin and/or the staffs may or may not have investments in any funds cited above as well as
economic interest. John Mauldin can be reached at 800-829-7273.