Embed Size (px)
Citation preview
econstorMake Your Publications Visible.
A Service of
zbwLeibniz-InformationszentrumWirtschaftLeibniz Information Centrefor Economics
Godart, Olivier N.; Görg, Holger
Working Paper
Suppliers of multinationals and the forced linkageeffect: Evidence from firm level data
IZA Discussion Papers, No. 7173
Provided in Cooperation with:IZA – Institute of Labor Economics
Suggested Citation: Godart, Olivier N.; Görg, Holger (2013) : Suppliers of multinationals and theforced linkage effect: Evidence from firm level data, IZA Discussion Papers, No. 7173, Institutefor the Study of Labor (IZA), Bonn
This Version is available at:http://hdl.handle.net/10419/69410
Standard-Nutzungsbedingungen:
Die Dokumente auf EconStor dürfen zu eigenen wissenschaftlichenZwecken und zum Privatgebrauch gespeichert und kopiert werden.
Sie dürfen die Dokumente nicht für öffentliche oder kommerzielleZwecke vervielfältigen, öffentlich ausstellen, öffentlich zugänglichmachen, vertreiben oder anderweitig nutzen.
Sofern die Verfasser die Dokumente unter Open-Content-Lizenzen(insbesondere CC-Lizenzen) zur Verfügung gestellt haben sollten,gelten abweichend von diesen Nutzungsbedingungen die in der dortgenannten Lizenz gewährten Nutzungsrechte.
Terms of use:
Documents in EconStor may be saved and copied for yourpersonal and scholarly purposes.
You are not to copy documents for public or commercialpurposes, to exhibit the documents publicly, to make thempublicly available on the internet, or to distribute or otherwiseuse the documents in public.
If the documents have been made available under an OpenContent Licence (especially Creative Commons Licences), youmay exercise further usage rights as specified in the indicatedlicence.
www.econstor.eu
DI
SC
US
SI
ON
P
AP
ER
S
ER
IE
S
Forschungsinstitut zur Zukunft der ArbeitInstitute for the Study of Labor
Suppliers of Multinationals and the Forced Linkage Effect: Evidence from Firm Level Data
IZA DP No. 7173
January 2013
Olivier N. GodartHolger Görg
Suppliers of Multinationals and the
Forced Linkage Effect: Evidence from Firm Level Data
Olivier N. Godart Kiel Institute for the World Economy
and University of Kiel
Holger Görg Kiel Institute for the World Economy,
University of Kiel and IZA
Discussion Paper No. 7173 January 2013
IZA
P.O. Box 7240 53072 Bonn
Germany
Phone: +49-228-3894-0 Fax: +49-228-3894-180
E-mail: [email protected]
Any opinions expressed here are those of the author(s) and not those of IZA. Research published in this series may include views on policy, but the institute itself takes no institutional policy positions. The IZA research network is committed to the IZA Guiding Principles of Research Integrity. The Institute for the Study of Labor (IZA) in Bonn is a local and virtual international research center and a place of communication between science, politics and business. IZA is an independent nonprofit organization supported by Deutsche Post Foundation. The center is associated with the University of Bonn and offers a stimulating research environment through its international network, workshops and conferences, data service, project support, research visits and doctoral program. IZA engages in (i) original and internationally competitive research in all fields of labor economics, (ii) development of policy concepts, and (iii) dissemination of research results and concepts to the interested public. IZA Discussion Papers often represent preliminary work and are circulated to encourage discussion. Citation of such a paper should account for its provisional character. A revised version may be available directly from the author.
IZA Discussion Paper No. 7173 January 2013
ABSTRACT
Suppliers of Multinationals and the Forced Linkage Effect: Evidence from Firm Level Data*
Using information on more than 1000 firms in a number of emerging countries, we find quantitative evidence that suppliers of multinationals that are pressured by their customers to reduce production costs or develop new products have higher productivity growth than other firms, including other host country suppliers of multinationals. These findings provide first empirical support for a “forced linkage effect” from supplying multinational companies. Our findings hold controlling for other factors within and outside the supplier-customer relationship and when endogeneity concerns are taken into consideration. JEL Classification: F23, O12 Keywords: backward linkages, multinational customers, suppliers, forced linkage,
productivity spillovers
NON-TECHNICAL SUMMARY Empirical evidence shows that domestic firms increase productivity in the wake of an influx of foreign multinationals. This is generally interpreted as suggesting that there is learning from multinationals, whereby multinationals voluntarily share knowledge and cooperate with their suppliers. We argue that this is a somewhat overly benevolent view of how multinationals manage their suppliers in emerging economies. We suggest an alternative interpretation, namely that multinationals force their customers to adopt new practices – and may punish if these are not implemented to their satisfaction. Using a rich firm level data set for Central Europe and Central Asia, we find robust evidence that a domestic supplier to a multinational only experiences productivity gains if the supplier status is interacted with a variable indicating that there is pressure from customers. This shows that there is a “forced linkage” at work and that spillovers do not materialize in the absence of such pressure. Corresponding author: Holger Görg Kiel Institute for the World Economy Hindenburgufer 66 24105 Kiel Germany E-mail: [email protected]
* This paper is forthcoming in the Journal of Economic Behavior & Organization. We are grateful to Robert Feenstra, Lionel Fontagné, Gene Grossman, Aoife Hanley, Richard Kneller, Peter Neary, Horst Raff, Selin Sayek Böke, Eric Strobl, seminar participants at the Kiel Institute, the University of Granada and Bilkent University, and two anonymous referees for very helpful comments. All remaining errors are our own.
1
1. Introduction
The search for positive productivity effects (commonly termed “spillovers”) from
multinational companies to host country firms has attracted considerable interest in the
academic literature. While the earlier literature looked specifically for within-industry
“horizontal spillovers”, the consensus is now that much stronger effects should be expected
from vertical and in particular backward linkages between multinationals and their local
suppliers.1 Somewhat inspired by these empirical findings, many countries have attracted
actively foreign direct investment (FDI) with fiscal incentives, hoping that in return
indigenous suppliers will learn through their business relationship with multinational
customers.2
While the available empirical literature produces encouraging results, it suffers from
one main conceptual shortcoming. The traditional backward spillovers studies, such as
Javorcik (2004), measure linkages between multinationals and domestic firms only at the
industry level. Specifically, productivity in domestic firms is linked to a measure of the
importance of multinationals in downstream industries, calculated using aggregate input-
output tables. This does not allow the researcher to identify the exact channels through
which domestic firms in upstream industries are expected to benefit – is it a supplier effect,
a competition effect, or something else entirely?3
Javorcik and Spatareanu (2009) and Gorodnichenko et al. (2007) are among the first
to confront this limitation. Javorcik and Spatareanu (2009) use firm level data for the
1 The most widely cited example of a study on horizontal spillovers is probably Aitken and Harrison (1999),
see also Haskel et al. (2007) and Keller and Yeaple (2009). The importance of backward linkages has been
shown in theoretical models (Rodriguez-Clare, 1996; Markusen and Venables, 1999) as well as recent
econometric studies (Javorcik, 2004; Liu, 2008, Girma et al., 2008). There are also studies that point to a
potential for negative spillovers through backward linkages, due to potential hold up problems between
supplier and multinational customer (e.g., Driffield et al., 2002; Blalock and Gertler, 2008). Görg and
Greenaway (2004) and Havranek and Irsova (2012) provide comprehensive reviews of this literature. 2 Harrison and Rodríguez-Clare (2009) argue that China's emphasis on domestic content requirement to
foreign multinationals has been, inter alia, motivated by empirical evidence on productivity spillovers from
foreign direct investment to supplying industries. 3 There are also methodological problems related to the assumptions implicit in the use of aggregate input-
output tables, see Barrios et al. (2011) for a discussion.
2
Czech Republic, including information on whether a domestic firm is a supplier to a
multinational. They show that suppliers are indeed more productive than non-suppliers.
Gorodnichenko et al. (2007) use data for 17 Eastern European and Central Asian countries.
They exploit firm level information on the share of output supplied by domestic firms to
multinationals and find that a higher share is correlated with higher productivity growth.
These papers, however, are silent on the actual mechanism that is at work and that causes
productivity to increase. We, therefore, expand on these papers by examining one potential
mechanism through which suppliers may improve their productivity. We refer to this as a
“forced linkage effect”.
While many authors interpret the above results as suggesting that there is learning
from multinationals, whereby multinationals voluntarily share knowledge and cooperate
with their suppliers (backed up by some case study evidence, such as Moran, 2001), this
may be a somewhat overly benevolent view of how multinationals manage their suppliers
in emerging economies. An alternative interpretation is that multinationals force their
customers to adopt new practices – and may punish if these are not implemented to their
satisfaction. Blomström and Kokko (1998), also based on case study evidence, point out
that such “forced linkage effects” may be an important mechanism through which domestic
suppliers can improve their performance.
To our knowledge, no one has explored empirically the existence of such a “forced
linkage” mechanism thus far. This paper attempts to fill this gap in the literature. We
investigate empirically whether this is an important channel through which multinationals
increase the productivity of their suppliers. In order to do so, we use a rich source of firm
level data for emerging market economies in Central and Eastern Europe and Central Asia.
This data comes from the Business Environment and Enterprise Performance Survey
(BEEPS) provided jointly by the World Bank and the European Bank for Reconstruction
and Development (EBRD). We use the 2005 survey, complemented with some information
3
from the 2002 survey. Our dataset provides unique information, at the firm level, on
whether a firm supplies multinationals (and how much) and also on whether a firm
perceives to be subject to pressure from customers to reduce production costs or to create
new products. The combination of these two variables is central to our measurement of the
forced linkage effect.
What exactly do we mean by a “forced linkage effect”? We conceptualize this idea
in the following way. First, multinationals require that their suppliers meet their higher
standards on product features, delivery schedules, quality control, inventory holding and
accommodate continuously their demanding business procedures. Second, such
requirements have a potential productivity enhancing effect on host country suppliers
because multinationals have gathered their own experience and best practices with similar
products in their main country. Third, and this is the main difference from a mere
cooperation effect, suppliers are forced by their multinational customers to meet those
requirements.4 Multinationals, due to their extensive experience with international
production networks, are in a position to evaluate the performance of host country suppliers
accurately. This enables them to “punish” local suppliers, e.g., through switching supplier
sources or forcing price reductions, if the required standards are not met.
While the concept of a “forced linkage” is not firmly grounded in the existing
theoretical literature, recent theoretical developments on imperfect contracts and bargaining
may provide some guidance for a better understanding of frictions between customers and
suppliers in general and the forced linkage effect in particular. In the “property rights”
view of the firm, as applied to international sourcing decisions by, e.g. Antràs (2003) and
Antràs and Helpman (2004, 2008), a final good producer and its one supplier are engaged
in generalized Nash bargaining on the total surplus generated from the relationship. In this
set up, one interpretation of “pressure” from the customer is that it shifts the bargaining
4 For example, Javorcik (2008) provides some evidence for the Czech Republic that multinationals require
suppliers to improve quality assurance, acquire ISO 9000 certification or improve the timeliness of delivery.
4
weight in favor of the customer. Normally, we would expect that this would reduce the
incentives for the independent supplier and thus lead to an underinvestment in terms of
effort, i.e. lower productivity for the supplier.
However, the situation of a multinational company and its supplier is likely to be
somewhat different than assumed in this stylized model. Firstly, the multinational has
access to superior technology, which it may transfer to the supplier. This may either be
done voluntarily, or it may come with pressure to fulfill some tough requirements or else be
punished. The latter would correspond to our notion of a “forced linkage”. In our
empirical analysis, we attempt to distinguish the simple technology transfer effect from a
forced linkage effect. Another important difference from the theoretical model is that it is
unlikely to be the case that one supplier exclusively supplies one multinational firm.
Rather, independent suppliers have the option of working for additional customers.5 In this
case, the benefits of responding to pressure by multinationals might have additional
positive effects for the output sold to other firms. These two aspects are likely to overcome
the disincentive to provide effort when pressured by the customer, and provide higher
overall productivity gains when supplying pressuring multinationals.
Our paper is, to the best of our knowledge, the first to investigate whether
knowledge is transferred through a forced linkage or through a more cooperative channel.
Thereby we add to the existing studies on productivity spillovers from multinational
companies, providing one further step towards understanding the mechanisms at work.
Indeed, the existence of a forced linkage effect might help explain an ambivalence often
found in surveys on suppliers of multinationals: they complain occasionally about their
5 Grossman and Helpman (2002) allow the produced good to be valuable for other producers on a secondary
market in cases in which the bargaining breaks down. This offers a positive outside option for the supplier at
the bargaining stage. Note that the commitment given by the multinational to keep the supplier as a separate
legal entity (i.e., not to “integrate” the supplier) is that the customer gives up a valuable outside option at the
bargaining stage (see Antras and Helpman, 2004). In Grossman and Helpman (2004) a customer can give its
supplier a higher stake in the relationship when he cannot monitor its independent supplier. While this creates
incentive for the supplier to provide more effort, it might also as well bind the supplier to this specific
customer when the supplier uses its option to serve other customers.
5
multinational clients but at the same time they are eager to develop or extend business
relationships with multinationals.6 The forced linkage effect highlights a possibly more
frictional customer- supplier relationship than one in which multinationals share their
proprietary knowledge freely.7
The paper by Gorodnichenko et al. (2007) is closest to us as it also uses data from
the 2005 BEEPS survey and uses information on supplies to multinationals at the firm
level. However, they do not consider the “forced linkage” as a channel through which
productivity may be boosted in local suppliers but only ask whether suppliers experience
higher productivity growth. As we show below, it is however crucially important to
distinguish the effect of supplying to multinationals for firms that experience “pressure
from their customers” from those that do not. Furthermore, the identification of a causal
effect from supplier status to productivity growth is difficult in the Gorodnichenko et al.
(2007) study. They regress productivity growth between 2002 and 2005 on the supplier
status of a firm in 2005. Hence, it is difficult to judge whether they estimate the effect of
supplying on productivity growth, or whether they pick up the fact that highly productive
firms are more likely to become suppliers. Our research design is different in that we use
data on productivity growth between 2002 and 2005 and regress this on the supplier status
in 2002, exploiting the panel dimension available in the BEEPS data. This set up allows us
to be more confident about identification of an effect of the supplier status of the firm on
productivity growth. We also combine our approach with an explicit test for exogeneity,
using instrumental variables available in the BEEPS data.8,9
6 Javorcik (2008) shows using a survey on Czech suppliers of multinationals that 37.5 percent of
multinationals mandatory scheduled regular price cuts to their suppliers which might lead to complaints from
suppliers. She also shows that more than 35 percent of suppliers report to undertake improvements to satisfy
their multinational clients. 7 This does not contradict the findings that suppliers might on some occasions receive some effective
assistance from their multinational clients as, for example, illustrated by Liker and Choi (2004). 8 Another difference is that Gorodnichenko et al. (2007) only use data for 17 countries (due to availability of
input-output tables) while we use firm level data for 25 Eastern European and Central Asian countries. 9 Our use of panel data implies, however, that our sample size is smaller than if we used the full cross section
for 2005. However, in this trade-off between larger sample size and more precise identification of the
6
To preview our results, we find evidence for a productivity gain of being a supplier
only if the supplier status is interacted with a variable indicating that there is pressure from
customers. We interpret this as evidence that there is a forced linkage at work and that
spillovers do not seem to materialize in the absence of such pressure. This result is robust to
various specifications of the empirical model.
In section 2 we develop our empirical strategy, while section 3 discusses the data
used and presents summary statistics. The econometric analysis is presented in Section 4.
Section 5 provides some concluding comments.
2. Empirical framework
In our empirical analysis we investigate whether there are positive productivity
effects from supplying multinationals, and whether these may be due to a “forced linkage”.
In order to do so we examine the relationship between productivity growth of a host
country firm and its status of whether it is a supplier to a multinational.
More specifically, we estimate the determinants of productivity growth using an
augmented Cobb- Douglas production function, which in its most basic form looks as
follows10
icji
MNE
i
CUST
i
CUST
i
MNE
i
L
i
LK
i
KM
i
M
i
Cspps
xxxY
3321
(1)
estimated effects we opt for the latter. Reassuringly, Gorodnichenko et al. (2007) as well as the companion
paper Gorodnichenko et al. (2010) both compare the cross-section results with the smaller set of panel results.
They do not find any major differences in results, apart from the fact that coefficients appear less statistically
significant in the panel. Hence, if anything, it is likely that we would underestimate any effects. 10
The production function estimation allows us to estimate the determinants of productivity growth, i.e., the
variation in the change of output that is not explained by variations in the growth of inputs. The setup of a
one-step production function has been used extensively for analysing the effect of foreign direct investment
on productivity; see, for example, Javorcik (2004). An alternative would be a two-step approach, were one
retrieves TFP as the error term of a simple production function and in a second step regresses TFP on the
spillover variables. We do not follow such an approach mainly for two reasons. Firstly, it is less efficient than
the one step estimation. Second, while the two step approach allows the researcher to better deal with
potential simultaneity in the production function (see Levinsohn and Petrin, 2003) we cannot implement such
an approach due to data limitations.
7
where iY , M
ix , K
ix and L
ix , are respectively measures of percentage changes
(growth rates) in output, material, capital and labour inputs for firm i over the three year
period from the end of 2002 to the end of 2005. We use growth rates of these variables in
order to purge any unobserved firm level effects that may impact productivity levels. We
include a vector of firm level controls C (size dummies and a foreign ownership dummy),
and j and c which are industry and country dummy variables that control for any shock
that could occur along these aggregates. The remaining error term i is assumed to be
white noise.11
The focus of our study is on whether being a supplier to a multinational firm matters
for productivity growth. In order to capture this, we include MNE
is , a dummy variable
indicating whether a firm sells to multinationals or not. This variable is constructed using
the following survey question:
"What percent of your domestic sales are to: Multinationals located in your
country…?”
We set MNE
is equal to 1 for any firm that sells part of its output to multinational
firms in 2002 and zero otherwise. As an alternative variable we also use the actual share of
sales to multinationals in a different specification of the empirical model. We use
information relating to 2002 as this is prior to the measurement of the dependent variable.
This allows us to attenuate potential endogeneity problems between productivity growth
and the supplier status.
11
Details of the data source are provided in the next section and variable definitions in the Appendix. All
firms are classified according to a broad industry classification: mining and quarrying, construction,
manufacturing, transport storage and communication, real estate, renting and business service and other
service activities. Compared to studies of backward spillovers where the aggregation of industries is very
important, our study does not rely on the aggregation of industries because we use precise information about
firms and their business relationship with multinational customers.
8
The next important variable, CUST
ip , captures whether firms receive pressure from
customers to reduce production costs or to create new products based on the following
questions in the BEEPS survey:
“How would you rate the importance of [PRESSURE FROM CUSTOMERS] on key
decisions about your business with respect to "reducing the production costs of existing
products and services"? or “creating new goods and services and new markets by
customers"?”
Respondents had to rate the magnitude of such pressure according to a Likert-type
scale from 1 (not at all important) to 4 (very important). We use the information available
in 2002 in order to generate CUST
ip for each firm. We set CUST
ip equal to one if the
respondent answered “very important” to either the question on reducing costs or creating
new products. It is zero otherwise.
Following the arguments set out in the introduction, the expected sign for CUST
ip is
ambiguous. On the one hand, the underinvestment problem of the supplier becomes more
severe when the balance of power is shifted in favor of the customer. In this case,
“pressure” is likely to exacerbate the underinvestment problem, reduce the incentives for
the supplier and thus lead to less effort, i.e. lower productivity for the supplier.12
However
if a supplier has more than one customer, pressure by one customer to reduce inefficiency
may positively affect also output sold to other customers, thus leading to productivity
growth.
The main variable of interest is our proxy for “forced linkages”. To generate this,
we interact MNE
i
CUST
i sp . This interacted variable allows us to test whether the effect of
supplying a multinational is different depending on whether there is pressure from
12
Alternatively, firms might report pressure from their customers because of the risk to be let down at short
notice or because customers switch their supply sources often. As a result, suppliers are confronted with
uncertainty about future demand conditions which is likely to slow down productivity growth.
9
customers or not.13
If there is a forced linkage mechanism, we expect a positive association
between firm´s productivity growth and pressure from customers in firms supplying
multinational customers. Note that this variable is also measured in 2002 in order to
alleviate endogeneity concerns.
This set up allows us to distinguish a simple technology transfer between
multinational and its customer from the forced linkage effect, where the technology transfer
is accompanied by tough demands. The coefficient β1, if statistically significant and
positive, represents any productivity enhancing effect while β3 would only be positive and
significant if pressure is applied by the multinational.
In order to identify the forced linkage effect more precisely we also introduce, in
extensions to equation (1) an additional variable that measures pressure from competitors to
reduce production costs COMPET
ip and add also its interaction term MNE
i
COMPET
i sp .14
The
survey question used to construct COMPET
ip has an identical design to CUST
ip and allows
generating a dummy exactly the same way as for CUST
ip : COMPET
ip is equal to 1 if important
pressure is reported by a firm in 2002.
One way pressure from competition might be related to higher supplier productivity
is provided by Horn et al. (1995). They analyze the design of optimal incentive contracts in
an environment with international trade in which a principal cannot monitor the actions
undertaken by its supplying agent. In their framework, openness to trade increases
competition on product markets through a general equilibrium effect and contributes to
higher levels of managerial effort provided by the supplier, and thus improved internal
efficiency (i.e. reduced X-inefficiency). If “pressure by competitors to reduce production
13
Note that our data only allow us to calculate a variable indicating whether there is pressure from customers,
not whether these pressuring customers are multinationals. We only know whether a firm is intensively
pressured by customers and at the same time whether it has multinational firms as customers. It is unlikely
that the average domestic customer in emerging economies has access to international best practices and the
resulting accumulated knowledge that they could impose upon their suppliers. 14
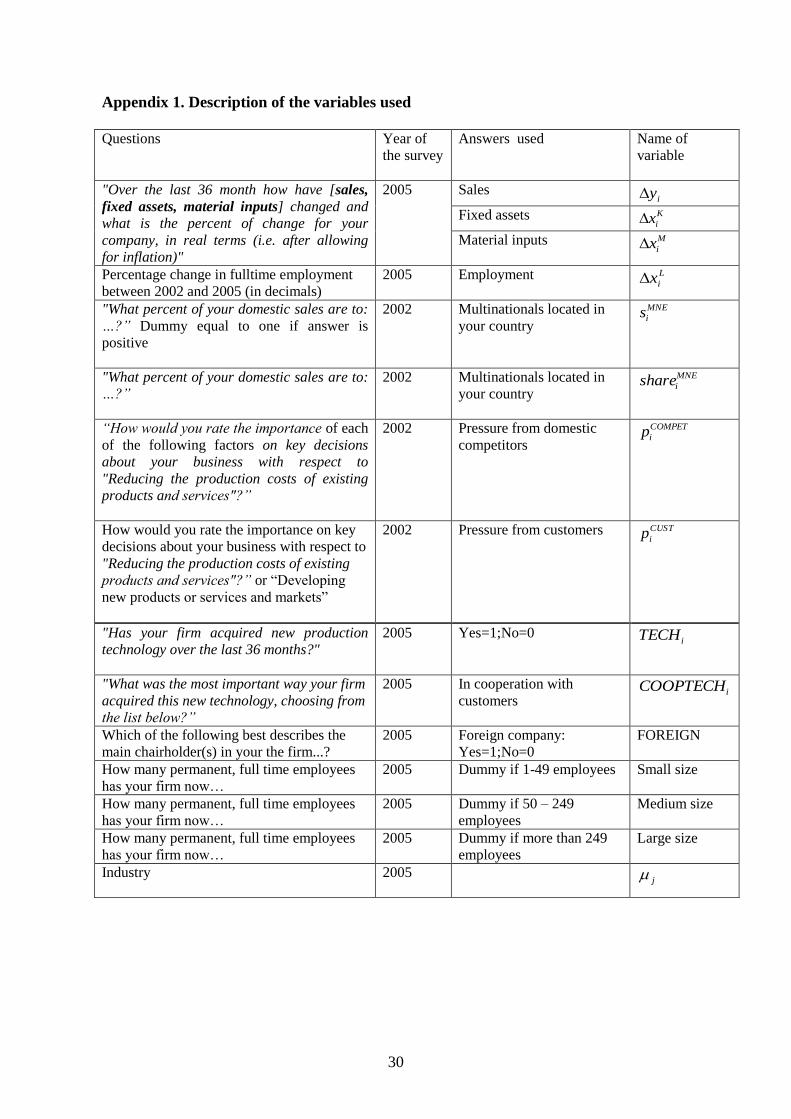
The survey questions related to all variables are listed in Appendix 1.
10
costs” is a good proxy for how increased competition impact firms in this framework, then
we would expect that high pressure from competitors is related to more managerial effort
provided by the supplying agent and thus improved productivity.15
Including COMPET
ip and MNE
i
COMPET
i sp shows whether our interpretation of the
forced linkages holds or if pressure from competitors (external to the supplier-multinational
relationship) potentially drives the measured forced linkage effect.
In a further extension to the baseline model we also include some other variables
that are by their very nature closely related to a more benevolent relationship between
customers and their suppliers. These variables are defined in Appendix 1. The first variable
uses a question about whether a surveyed firm has acquired a new technology ( iTECH ).
Including this variable together with a variable about whether cooperation with customers
resulted in these new technology acquirements ( iCOOPTECH ) permits us to control for a
more cooperative learning mechanism.
Note that a potential problem with estimating equation (1) using OLS is that we
assume that the suppliers´ status is exogenous. This may be a problematic assumption, in
particular because there may be self-selection of more productive firms as suppliers to
multinationals (Javorcik and Spatareanu, 2008). However, this problem is likely to be less
acute in our case as we define the supplier status in 2002, while productivity growth is
calculated between 2002 and 2005. Also, our variable of most interest is the interaction of
pressure from customers and the supplier status. There is no clear reason to suspect that
among the suppliers of MNEs the most productive ones are also necessarily the most
subjected to customers´ pressure. Nevertheless, we check the assumption of exogeneity
using an instrumental variables approach. Details are in the results section.
15
According to Javorcik et al. (2008) competition between suppliers is important for the diffusion of best
practices among suppliers in the Mexican soap and detergents industry. They argue that Walmart brought its
best standards and practices into Mexico and that those have been quickly adopted by their suppliers´
competitors in this retail industry.
11
3. Data sources and summary statistics
This paper uses the 2002 and 2005 versions of the EBRD/World Bank Business
Environment and Enterprise Performance Surveys (BEEPS) of firms in “transition
countries”. This dataset provides ample information on enterprises and their business
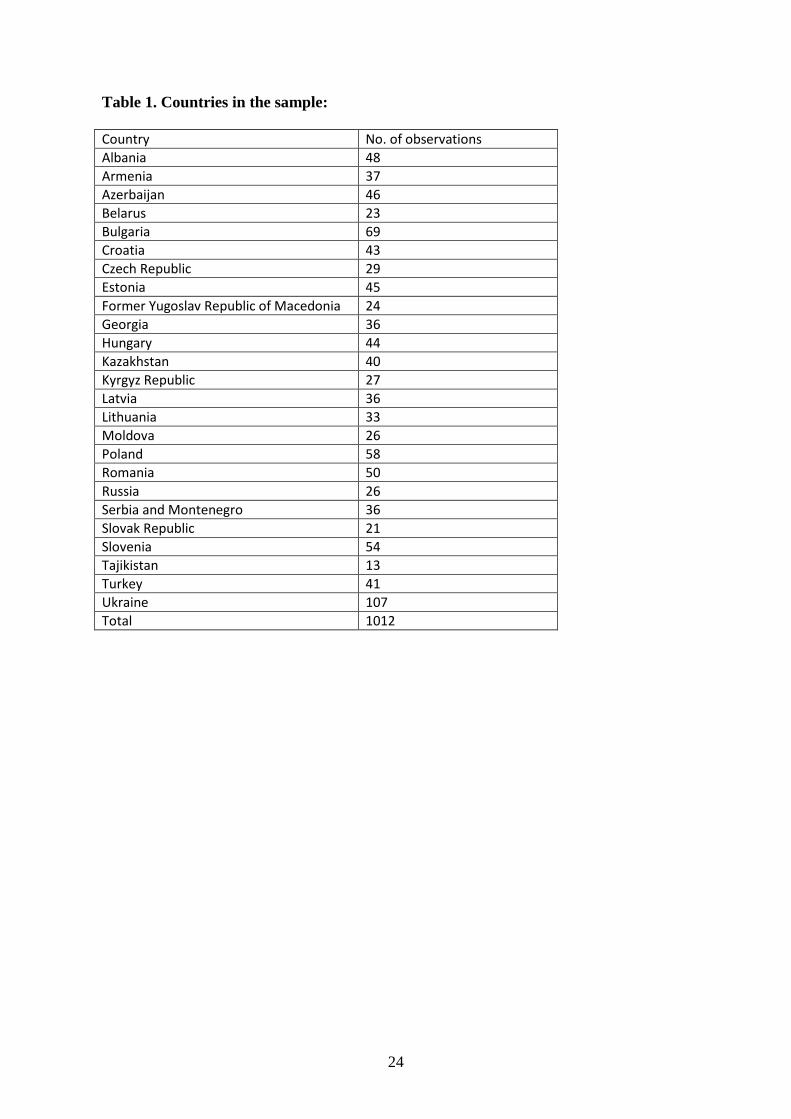
environment in many emerging countries (see the list of countries in Table 1) in three
rounds in 1999, 2002 and 2005. A limited number of firms can be linked in the 2002 and
2005 surveys.16
In our analysis, we exclusively use the panel component of the BEEPS
data. It includes more than 1000 firms that have been surveyed in the 2002 survey as well
as in the 2005 survey. This allows us to measure the supplier status, as well as pressure
from customers, in the 2002 survey, while productivity growth is calculated from the 2005
data.
[insert Table 1 here]
The survey’s main aim is to allow for a cross country comparison of business
activities and, to that end, asks each firm more than 80 questions about their business, the
institutional environment and their perceptions about the business environment. The survey
sample in each country is stratified by firm size, sector and region. Sector stratification is
undertaken to reflect the relative contribution of each sector to the region’s GDP.17
Great care has been taken to train and advise interviewers in order to minimize
potential distortions and irregularities between countries or during each interview.
Interviews have been conducted face-to-face and anonymity has been guaranteed to all
participants. Still, a typical concern when using survey data is that of individual perception
16
Unfortunately there is no panel structure linked to the BEEPS 1999 survey. 17
To be precise, stratification by sector depends on the size of the economy. Very small economies (less than
$15bn GNI) are stratified into manufacturing and non-agricultural sector; small economies ($15bn to $100bn
GNI) into manufacturing, retail, and rest of non-agricultural sector; medium economies ($100 to $500bn GNI)
into five manufacturing sectors, retail and rest; large economies (more than $500bn GNI) into seven
manufacturing sectors, retail and rest. This implies that for all economy sizes, the sample should be
representative at least of total manufacturing and the non-agricultural economy. As the economy size
increases, representativeness of other more narrowly defined sectors increases. Details of the sampling
methodology are available at www.enterprisesurveys.org.
12
bias, since it is common that responses of firms based on surveys are likely to be prejudiced
by the general perception of firms (Kaufman and Wei, 1999). Some firms may consistently
provide positive or negative answers depending on their general perception of the
environment in which they currently operate. In principle, assuming that the bias is
uncorrelated among groups of respondents, individual perception bias contributes only to
the standard error of estimates obtained from the survey responses. In cross-country
surveys, such as the BEEPS, the group within which the bias is correlated is the particular
country in which respondents operate. Perception bias at the country level could originate
from different cultural norms and degrees of political freedom across countries, which may
influence the choice of specific ratings and the willingness of business people to criticise
state institutions for example. Fries et al. (2003) check for such perception bias in the
BEEPS 2002 by statistically comparing qualitative measures to related objective measures
and find no significant perception biases across the countries in the sample. Since the
BEEPS 2005 follows a similar methodology, we may be reasonably confident that
perception bias will not affect the results of the analysis. However, as a further control, the
empirical model in equation (1) includes industry and country level fixed effects.
The BEEPS data provide crucial information for estimating productivity growth and
unique information on the share of firms' sales to multinational clients as well as on
whether firms feel pressured by their customers to reduce production costs or to create new
products.
The survey provides information on changes in input use and output between 2002
and 2005. Specifically, the responding firm has to answer the following question in 2005
for each of the variables in brackets.
"Over the last 36 months how have [sales, fixed assets, material inputs] changed
and what is the percent of change for your company, in real terms (i.e. after allowing for
inflation)"
13
A similar question is asked for changes in employment over the same 36 months in
each firm and described in Appendix 1. We use answers to these questions as a base for our
productivity growth estimation in equation (1). Such data enable us to construct a simple
Cobb Douglas production function. We acknowledge that there is a potential simultaneity
problem in input choices in the production function estimation, as described, for example,
by Levinsohn and Petrin (2003). Unfortunately, we do not have sufficient data to
implement the techniques suggested in their paper. However, this potential disadvantage
has to be weighed against the advantages of having unique information on pressure from
customers reported by their suppliers as well as detailed information on suppliers' sales to
multinationals. Such information makes it possible, for the first time, to confront the forced
linkages effect with a formal econometric analysis.
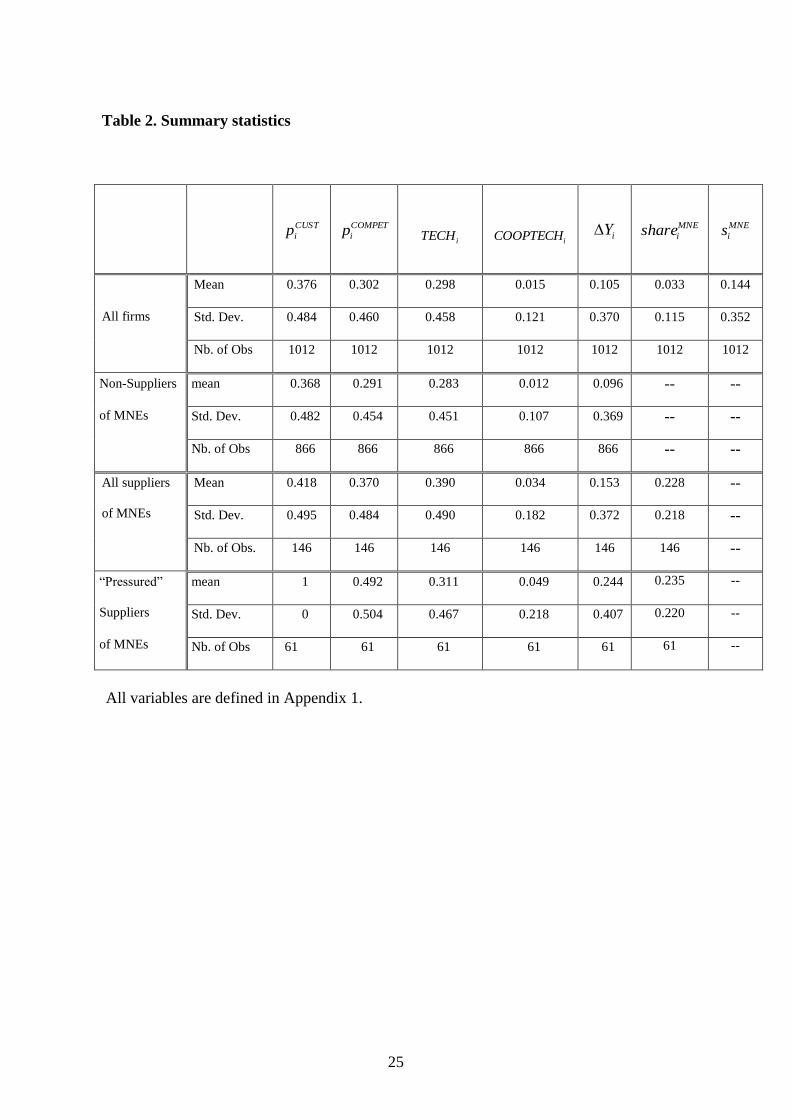
Table 2 presents some summary statistics relating to the variables included in the
econometric analysis. We describe our whole sample in the top panel. The sample contains
1,012 active firms during the study period. First, note that around 38 percent of our firms
reported "very important" pressure from their customers ( CUST
ip ). Furthermore, 30 percent
of firms reported to have developed a new technology ( iTECH ) while only 2 percent of
them responded that customers help them develop their new technology (COOP iTECH ).
Note also that the average firm in our sample had an increase in sales of about 11 percent
between 2002 and 2005.18
Finally, in the last columns of the upper panel we see that 14
percent of our firms are suppliers of multinationals and the average firm (including non-
suppliers) sells 3 percent of their output to multinationals.
We distinguish suppliers from other firms that do not supply multinational
customers in the lower panels of the table. We notice some differences in the mean values
between both types of firms. First, suppliers of multinationals are more likely, on average,
to report pressure from customers than firms that do not supply any multinational. Second,
18
This growth rate is measured in real terms.
14
firms serving multinationals are on average more likely to introduce new technologies and
especially, they are more likely to cooperate with their customers to obtain these new
technologies. Suppliers of multinationals are also more often subject to pressure from
competitors than firms that do not sell goods to multinational firms. Concerning economic
performance over the period, we note that firms that supply goods or services to
multinationals in 2002 seem to have a higher mean output growth over the subsequent three
years. The average supplier sells roughly 23 percent of output to multinational customers.
We also distinguish “pressured” suppliers in the table. We have 61 of such firms in
our data.19
These are firms for which the interaction term MNE
i
CUST
i sp equals one. We
find that these firms are more likely to report pressure from competitors than other
suppliers. They are also firms that experience higher output growth in the subsequent
periods. However, there is no obvious difference in the share of output sold to
multinationals when comparing “pressured” and “non-pressured” suppliers.
[insert Table 2 here]
4 Empirical results
4.1 Baseline model
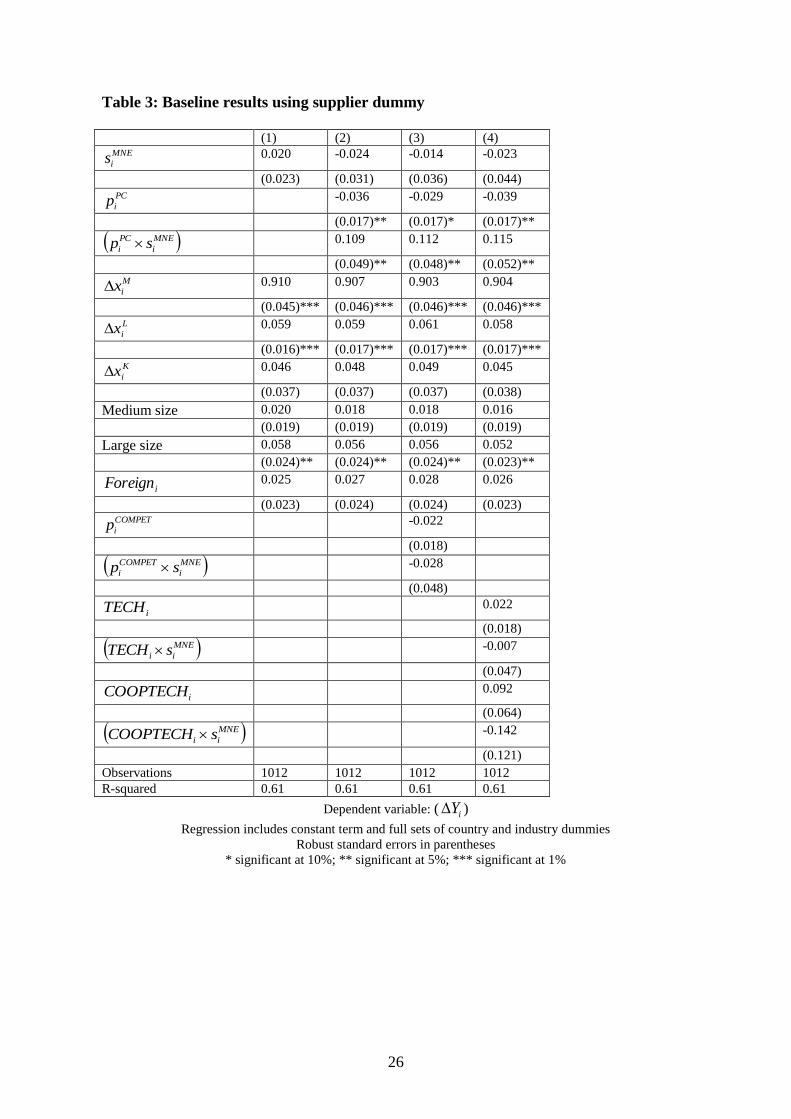
Table 3 presents the baseline regression results from estimating equation (1) using
the supplier dummy MNE
is . Column (1) shows a simple estimation of a Cobb Douglas
production function that is solely augmented by MNE
is . Note that M
ix , L
i and K
ix are all
positive as expected. A dummy variable for firms that are larger than 250 employees (large
size) is also significant and positive. By contrast, dummies for medium sized firms (50 o
249 employees) and foreign-owned firms are not statistically significant. Most importantly
from our point of view, the variable MNE
is which measures whether or not a firm supplies
19
This relatively small number of firms should be kept in mind when interpreting results.
15
goods or services to foreign multinational companies located in the host country is not
statistically significant.20
It indicates that in our data selling goods to multinationals is not
necessarily automatically statistically related to higher gains in productivity.
In column (2) we turn to the estimation of equation (1) that includes MNE
is , CUST
ip
and MNE
i
CUST
i sp jointly in our productivity specification. The supplier dummy remains
statistically insignificant in this specification. The coefficient on CUST
ip
is, however,
negative and significant. It suggests that firms that experience high pressure by their
customers have lower productivity growth than firms that do not report such pressure. This
negative sign is in line with our argument that CUST
ip captures the underinvestment problem
resulting from a weakened bargaining strength of the supplier when pressure is exerted by
its customers. It reduces the incentives for this supplier and thus is related to less effort and
lower productivity.
The coefficient of the interaction term MNE
i
CUST
i sp , our proxy for the “forced
linkage effect” is positive and highly significant. Given that its absolute value is higher than
the value of the coefficient of PC
ip , it supports the forced linkage effect. Hence, suppliers of
multinationals that are pressured by their customers to reduce production costs or create
new products have higher productivity increase relative to all other firms, including other
suppliers of multinationals. There is no productivity enhancing effect for suppliers that are
not pressured by their customers, thus casting doubt on whether, on average, multinationals
transfer technology to their suppliers unconditionally. The point estimate suggests that
suppliers that experience pressure from their customers experience productivity growth that
is about 11 percent higher than that of other firms.
We might ask whether our proxy for the forced linkage does not capture a mere
competition effect through which suppliers of multinationals are forced to adopt their
20
Gorodnichenko et al. (2007) find a similar result when using panel data for 2002 and 2005.
16
industry´s best practices because their domestic competitors apply such practices as well.
This could also result in a productivity enhancing effect, but not through the direct supplier-
customer relationship (Horn et al. 1995). We consider this hypothesis by enlarging our
baseline equation with a variable that considers “pressure from domestic competition to
reduce production costs” COMPET
ip and the interaction term MNE
i
COMPET
i sp .
Results are shown in column (3). First, neither COMPET
ip nor MNE
i
COMPET
i sp are
statistically significant while MNE
i
CUST
i sp is still positive and significant, with a
magnitude similar to that found in column (2). This result suggests that the positive
coefficient on MNE
i
CUST
i sp is not merely driven by a general competition channel in our
data.21
Rather it gives further support that the benefit of the forced linkage effect and its
coercive mechanism runs through the customer- supplier relationship.
In column (4), we enlarge our specification with qualitative variables closely related
to a more cooperative mechanism that might channel productivity gains for suppliers
because they sell their products to multinational firms. These variables are
iTECH , iCOOPTECH and their respective interaction terms with MNE
is . The introduction of
these variables jointly tests whether the beneficial productivity effect induced by the forced
linkage is, as hypothesized, the result of tough demands by multinationals or whether it is
the result of a more frictionless technology transfer between multinationals and their
suppliers. Results show that neither the two variables nor their interaction terms are
significant. At the same time, MNE
i
CUST
i sp stays positive and significant as before. Thus
controlling for collaboration between suppliers and customers in the development of new
technologies does not affect the quantitative role of the forced linkage effect in the supplier-
customer relationship thus far.
21
This finding does not mean that X-inefficiencies are not reduced through competition effects in the spirit of
Horn et al. (1995), as such general equilibrium effects might take more time to materialize. Nevertheless, the
forced linkage effect is not disrupted when controlling for such a possible channel.
17
[insert Table 3 here]
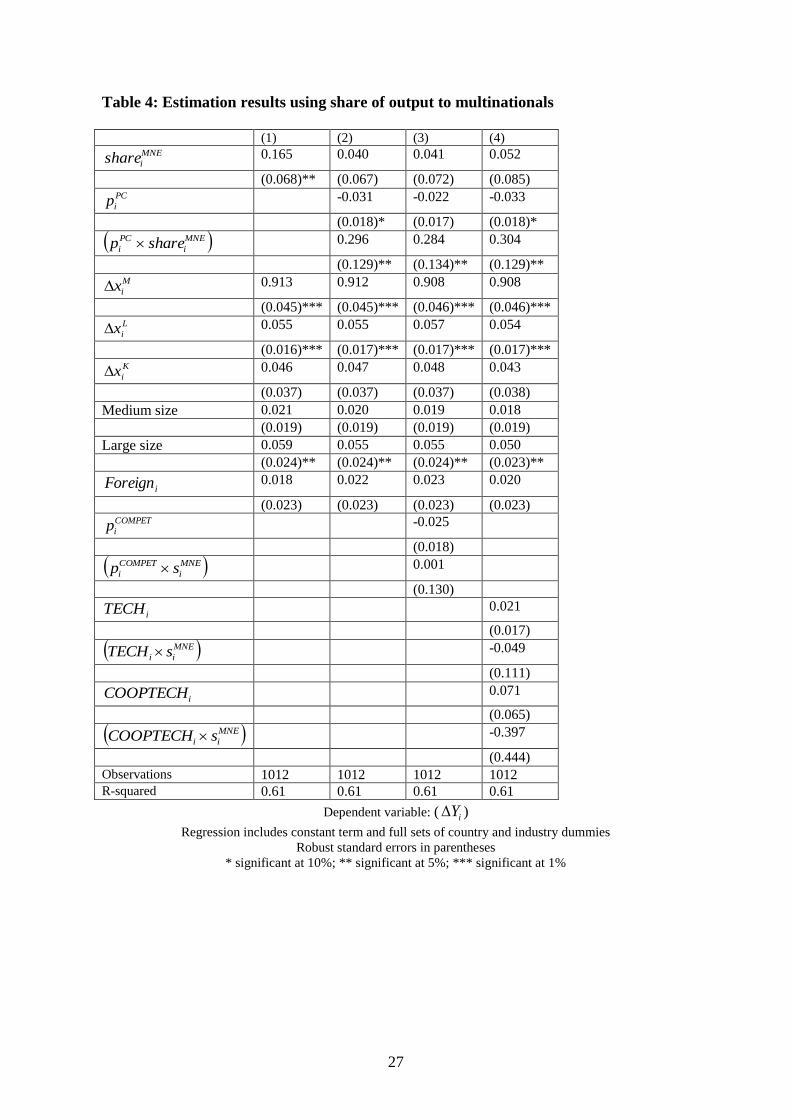
In the above estimations, we defined the supplier status of a firm using a binary
yes/no variable. However, we also have information on the share of output that is sold to a
multinational. We use this information in the results reported in Table 4. We re-estimate
equation (1) but now using the share of output and its interaction as independent variables.
Results are much in line with the results in Table 3. We find that the share of output sold to
multinationals is only positively associated with productivity growth when it is
accompanied by pressure from customers. This, hence, provides further support for our
hypothesis of a forced linkage effect.
[insert Table 4 here]
4.2 Exogeneity of supplier status
Before we move on to some further robustness checks, we consider the assumption
of exogeneity of the supplier status. This assumption would not hold if there were self-
selection, whereby the most productive firms might self-select to become suppliers of
multinationals (Javorcik and Spatareanu, 2008). One way of alleviating this problem is our
definition of the supplier status in the period before productivity growth is measured. Note
also that our variable of most interest is the interaction of pressure from customers and the
supplier status, not solely the supplier status. There is no reason to suspect that among
suppliers of MNEs, those suppliers that exhibit higher pressure from their multinational
customers experience it because they have higher productivity growth.22
Nevertheless, we also test explicitly for exogeneity using an instrumental variables
approach. The BEEPS data provides us with a number of potential instruments. We
employ two instruments for the supplier status (either dummy variable or the share of
22
In fact, as a referee pointed out to us, the interaction of the supplier status and pressure shows how suppliers
are persuaded to improve in light of multinationals’ demands – and for this, in some sense, it does not matter
whether the supplier status is exogenous or not.
18
output supplied to multinationals) which are based on two questions in the 2002 survey.
The first is a dummy variable that indicates whether a firm ever had to resolve an overdue
payment, the second a dummy indicating whether a firm is a member of a business
association or chamber of commerce.
We consider the first to be a relevant instrument, as being a supplier necessarily
implies the receipt of payment from the customer. However, there may be a difference in
the speed and reliability of the payment depending on the nature of the customer. On the
one hand, multinationals as opposed to domestic customers, may be more forthcoming with
their payments as they are part of a large internationally operating enterprise which is likely
to be a reliable debtor. On the other hand, a multinational is likely to be in a strong
bargaining position and might optimise its timing of payment flows which could results in
payment delays. In any case, the variable is likely to be correlated with the supplier status
of a firm. There is, however, no reason to suppose that the receipt of an overdue payment is
related to productivity growth of the firm.
The second instrument is also expected to be correlated with the supplier status as
the membership of an association or chamber of commerce may make it easier for a local
supplier to find customers. Again, however there is no reason to believe that such a
membership may be more or less likely for firms with high vs low productivity growth.
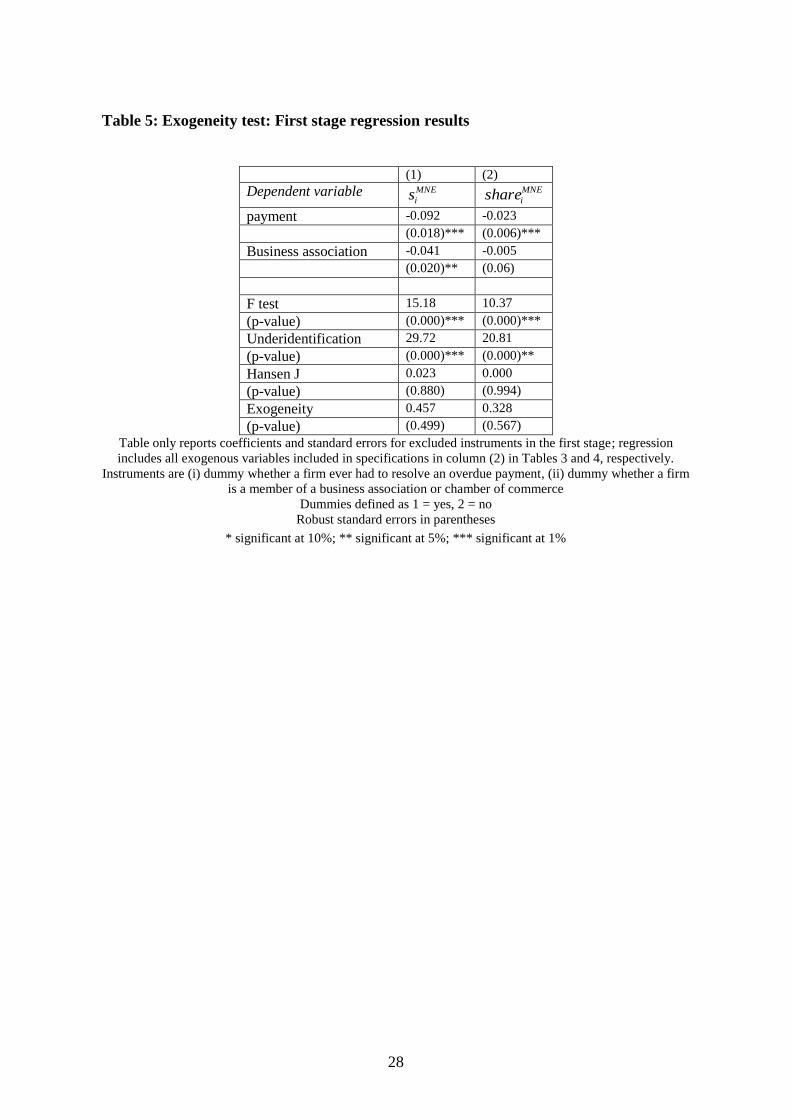
Table 5 presents the first stage regression coefficients for the excluded instruments
as well as the diagnostic tests. We re-estimate the models presented in columns (2) in
Table 3 (supplier dummy) and Table 4 (share of output), respectively, using an IV
estimator. Column (1) in Table 5 assumes the supplier dummy to be endogenous, column
(2) uses the share of output supplied to multinationals.
Note, firstly, that both instruments are individually significant in the regressions.
Given the way these variables are defined, the negative coefficients imply that a firm is
more likely to be a supplier (or supply a larger proportion of output to a multinational) if
19
the firm either had to resolve an overdue payment or is a member of a business organisation
/ chamber of commerce. The F-tests also suggest that the instruments are jointly relevant,
and the F-statistics are above 10, the value generally considered to be high enough to reject
the assumption of weak instruments (Staiger and Stock, 1997). The underidentification
tests also suggest that we do not suffer from a weak instrument problem. The Hansen J
statistics furthermore suggest that our overidentification restrictions are valid, suggesting
instrument validity.
Based on these instruments, we then test for the assumption of exogeneity of the
two alternative measures of the supplier status in equation (1). We are not able to reject
this assumption. Hence, we are confident that our estimations based on the assumption of
exogeneity allow us to identify an effect of the supplier status on productivity growth of
firms.
[insert Table 5 here]
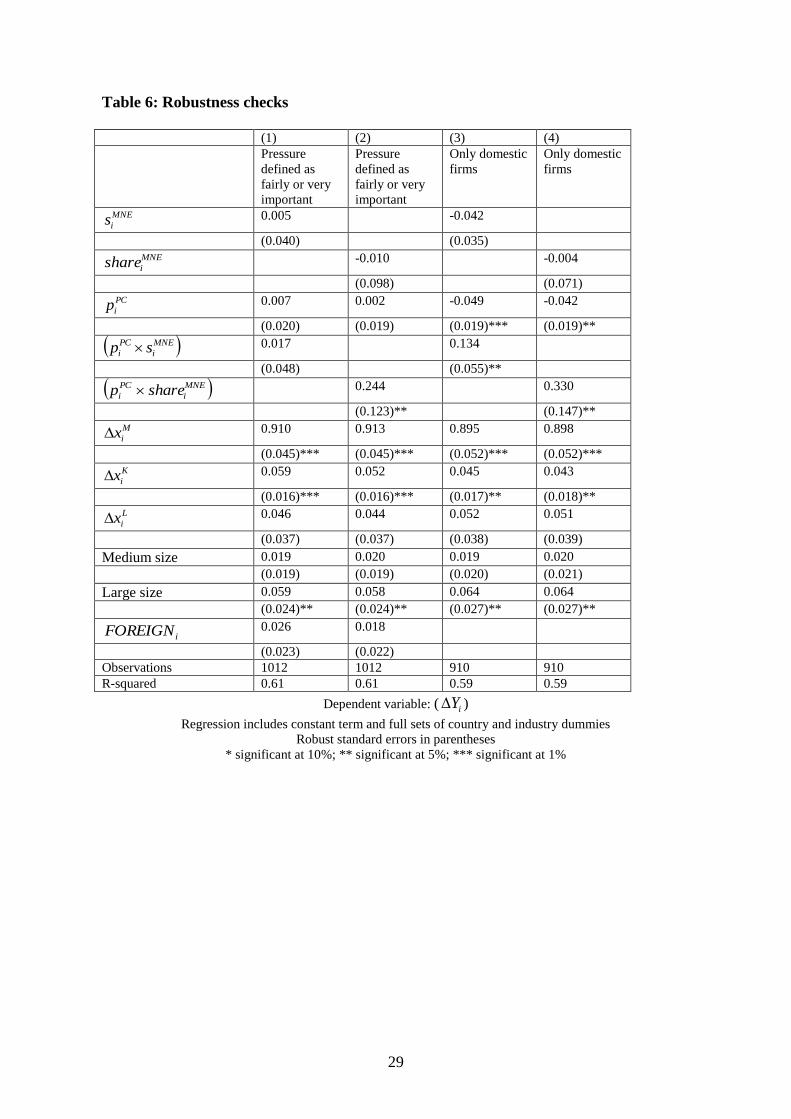
4.3 Further robustness checks
Table 6 presents the results of two further robustness checks. The first one, reported
in columns (1) and (2) uses a slightly re-defined measure of pressure from customers.
Recall that in the estimations thus far this is measured as a dummy equal to one if the firm
reports that pressure from customers is “very important”. We now redefine this variable as
equal to one if the firm answers “very important” or “fairly important” to this question.
This, of course, also implies that the interaction terms MNE
i
CUST
i sp and MNE
i
CUST
i sp
are recalculated. The results in columns (1) and (2) are fairly similar to those reported in
Tables 3 and 4, with one important exception. The coefficient on the interaction term
MNE
i
CUST
i sp is no longer statistically significant in column (1). This indicates that the
supplier status per se (i.e., measured with a dummy) only has a positive effect on
productivity growth if firms are subject to very important pressure from customers.
20
The analysis thus far includes both domestic and foreign firms. From the
perspective of a host country policy maker it may, however, be particularly important to
know how domestic firms are impacted upon by their linkages with multinationals. In
order to consider this explicitly, we dropped all foreign firms from our sample and re-
estimated equation (1) only for the sample of domestic firms. The results, which are very
similar to those found in Tables 3 and 4, are reported in columns (3) and (4) of table 6.
They support our hypothesis of a forced linkage effect in the customer-supplier relationship
between multinationals and domestic firms.
[insert Table 6 here]
5. Conclusions
This paper presents the first empirical evidence of a forced linkage effect in the
context of spillovers from FDI using a large sample of more than 1000 firms in 25
emerging economies. We find that productivity gains only materialize for suppliers of
multinationals when they are pressured by their customers to reduce production costs or
create new products. Suppliers of multinational firms appear to be forced by their
multinational customers to adopt some tough demands on product features and business
interaction procedures that have a positive productivity effect.
Such an effect of serving multinationals has largely been ignored by the recent
literature on backward spillovers. We show that the forced linkage effect holds in various
specifications, controlling for other factors that may impact the supplier-customer
relationship.
This adds a new policy relevant angle to the spillovers literature. Most of the
studies on spillovers through backward linkages at least implicitly, if not explicitly, seem to
be based on the assumption of a benevolent multinational that is willing to share knowledge
voluntarily and instruct willing suppliers. While our evidence does not indicate that this is

21
not the case, our results suggest that the customer-supplier relationship may not always be
so harmonious. Multinationals’ accumulated experience allows them to put pressure on
their suppliers to improve production costs or create new products – which also turns out to
be to the benefit of the supplier, in terms of increased productivity growth.
22
References
Aitken, B., Harrison, A., 1999. Do Domestic Firms Benefit from Direct Foreign
Investment? Evidence from Venezuela. American Economic Review 89, 605-618.
Antràs, P., 2003. Firms, contracts, and trade structure. Quarterly Journal of Economics 118,
1375-1418.
Antràs, P., Helpman, E., 2004. Global sourcing, Journal of Political Economy 112, 552-
580.
Antràs, P., Helpman,E., 2008. Contractual frictions and global sourcing. In: E. Helpman, D.
Marin and T. Verdier (eds.), The Organization of Firms in a Global Economy, Harvard
University Press, 9-54.
Barrios, S., Görg, H., Strobl, E., 2011. Spillovers Through Backward Linkages from
Multinationals: Measurement Matters!. European Economic Review 55, 862-875.
Blalock, G., Gertler, P.J., 2008. Welfare gains from foreign direct investment through
technology transfer to local suppliers, Journal of International Economics 74, 402-421.
Blomström, M., Kokko, A., 1998. Multinational Corporations and Spillovers, Journal of
Economic Surveys 12, 247-277.
Driffield, N., Munday, M., Roberts, A., 2002. Foreign Direct Investment, Transactions
Linkages, and the Performance of the Domestic Sector. International Journal of the
Economics of Business 9, 335–51.
Fries, S., Lysenko, T., Polenac S., 2003. The 2002 Business Environment and Enterprise
Performance Survey: Results from a survey of 6,100 firms. EBRD, London.
Girma, S., H. Görg and M. Pisu, 2008. Exporting, linkages and productivity spillovers from
foreign direct investment, Canadian Journal of Economics, 41, 320-340.
Görg, H., Greenaway, D., 2004. Much Ado about Nothing? Do Domestic Firms Really
Benefit from Foreign Direct Investment?, World Bank Research Observer 19, 171-197.
Gorodnichenko, Y., Svejnar, J., Terrell, K., 2007. When does FDI have positive spillovers?
Evidence from 17 Emerging Market Economies. IZA Discussion Paper 3079.
Gorodnichenko, Y., Svejnar, J., Terrell, K., 2010, Globalization and innovation in emerging
markets, American Economic Journal: Macroeconomics, 2, 194-226.
Grossman, G.M., Helpman, E., 2002. Integration versus outsourcing in industry
equilibrium. Quarterly Journal of Economics, 117, 85-120.
Grossman, G.M. and E. Helpman, 2004, Managerial incentives and the international
organization of production, Journal of International Economics, 63, 237-262.
Harrison, A., Rodriguez-Clare, A., 2009. Trade, Foreign Investment, and Industrial Policy
for Developing Countries, NBER Working Paper 15261.
Haskel, J.E., S.C. Pereira and M.J. Slaughter, 2007, Does inward foreign direct investment
boost the productivity of domestic firms?, Review of Economics and Statistics, 89, 482-496.
Havranek, T. and Z. Irsova, 2012, Estimating vertical spillovers from FDI: Why results
vary and what the true effect is, Journal of International Economics, forthcoming.
Horn, H., Lang, H., Lundgren, S., 1995. Managerial effort incentives, X-inefficiency and
international trade, European Economic Review, 39, 117-138.
23
Javorcik, B.S., 2004. Does Foreign Direct Investment Increase the Productivity of
Domestic Firms? In Search of Spillovers through Backward Linkages. American Economic
Review 94, 605-627.
Javorcik, B., 2008. Can Survey Evidence Shed Light on Spillovers from Foreign Direct
Investment?. World Bank Research Observer 23, 139-59.
Javorcik, B., Spatareanu, M., 2009. Tough Love: Do Czech Suppliers Learn from their
Relationships with Multinationals. Scandinavian Journal of Economics 111, 811-33.
Javorcik, B., Keller, W., Tybout, J., 2008. Openness and Industrial Responses in a Wal-
Mart World: A Case Study of Mexican Soaps, Detergents and Surfactant Producers. The
World Economy 31, 1558-80.
Kaufmann, D., Wei, S., 1999. Does Grease money speed up the wheels of commerce?,
NBER Working Papers 7093.
Keller, W., Yeaple, S.R., 2009. Multinational enterprises, international trade, and
productivity growth: Firm-level evidence from the United States. Review of Economics and
Statistics 91, 821-831
Levinsohn, J., Petrin A., 2003. Estimating production functions using inputs to control for
observables. Review of Economic Studies 70, 317-341.
Liker, J., Choi, T., 2004. Building Deep Supplier Relationship. Harvard business review,
dec.
Liu, Z., 2008. Foreign direct investment and technology spillovers: Theory and evidence.
Journal of Development Economics 85, 176-193.
Markusen, J., Venables, A., 1999. Foreign Direct Investment as a Catalyst for Industrial
Development. European Economic Review 43, 335-356.
Moran, T., 2001. Parental Supervision: The New Paradigm for Foreign Direct Investment
and Development. Washington, D.C.: Institute for International Economics.
Rodriguez-Clare, A., 1996. Multinationals, Linkages, and Economic Development.
American Economic Review 86, 852-73.
Staiger, D., Stock, J.H., 1997. Instrumental variables regression with weak instruments.
Econometrica 65, 557-586.
24
Table 1. Countries in the sample:
Country No. of observations
Albania 48
Armenia 37
Azerbaijan 46
Belarus 23
Bulgaria 69
Croatia 43
Czech Republic 29
Estonia 45
Former Yugoslav Republic of Macedonia 24
Georgia 36
Hungary 44
Kazakhstan 40
Kyrgyz Republic 27
Latvia 36
Lithuania 33
Moldova 26
Poland 58
Romania 50
Russia 26
Serbia and Montenegro 36
Slovak Republic 21
Slovenia 54
Tajikistan 13
Turkey 41
Ukraine 107
Total 1012
25
Table 2. Summary statistics
CUST
ip
COMPET
ip
iTECH
iCOOPTECH
iY
MNE
ishare
MNE
is
All firms
Mean 0.376 0.302 0.298 0.015 0.105 0.033 0.144
Std. Dev. 0.484 0.460 0.458 0.121 0.370 0.115 0.352
Nb. of Obs 1012 1012 1012 1012 1012 1012 1012
Non-Suppliers
of MNEs
mean 0.368 0.291 0.283 0.012 0.096 -- --
Std. Dev. 0.482 0.454 0.451 0.107 0.369 -- --
Nb. of Obs 866 866 866 866 866 -- --
All suppliers
of MNEs
Mean 0.418 0.370 0.390 0.034 0.153 0.228 --
Std. Dev. 0.495 0.484 0.490 0.182 0.372 0.218 --
Nb. of Obs. 146 146 146 146 146 146 --
“Pressured”
Suppliers
of MNEs
mean 1 0.492 0.311 0.049 0.244 0.235 --
Std. Dev. 0 0.504 0.467 0.218 0.407 0.220 --
Nb. of Obs 61 61 61 61 61 61 --
All variables are defined in Appendix 1.
26
Table 3: Baseline results using supplier dummy
(1) (2) (3) (4)
MNE
is 0.020 -0.024 -0.014 -0.023
(0.023) (0.031) (0.036) (0.044)
PC
ip -0.036 -0.029 -0.039
(0.017)** (0.017)* (0.017)**
MNE
i
PC
i sp 0.109 0.112 0.115
(0.049)** (0.048)** (0.052)**
M
ix 0.910 0.907 0.903 0.904
(0.045)*** (0.046)*** (0.046)*** (0.046)***
L
ix 0.059 0.059 0.061 0.058
(0.016)*** (0.017)*** (0.017)*** (0.017)***
K
ix 0.046 0.048 0.049 0.045
(0.037) (0.037) (0.037) (0.038)
Medium size 0.020 0.018 0.018 0.016
(0.019) (0.019) (0.019) (0.019)
Large size 0.058 0.056 0.056 0.052
(0.024)** (0.024)** (0.024)** (0.023)**
iForeign 0.025 0.027 0.028 0.026
(0.023) (0.024) (0.024) (0.023) COMPET
ip
-0.022
(0.018)
MNE
i
COMPET
i sp -0.028
(0.048)
iTECH
0.022
(0.018)
MNE
ii sTECH -0.007
(0.047)
iCOOPTECH
0.092
(0.064)
MNE
ii sCOOPTECH
-0.142
(0.121)
Observations 1012 1012 1012 1012
R-squared 0.61 0.61 0.61 0.61
Dependent variable: ( iY )
Regression includes constant term and full sets of country and industry dummies
Robust standard errors in parentheses
* significant at 10%; ** significant at 5%; *** significant at 1%
27
Table 4: Estimation results using share of output to multinationals
(1) (2) (3) (4)
MNE
ishare 0.165 0.040 0.041 0.052
(0.068)** (0.067) (0.072) (0.085) PC
ip -0.031 -0.022 -0.033
(0.018)* (0.017) (0.018)*
MNE
i
PC
i sharep 0.296 0.284 0.304
(0.129)** (0.134)** (0.129)** M
ix 0.913 0.912 0.908 0.908
(0.045)*** (0.045)*** (0.046)*** (0.046)*** L
ix 0.055 0.055 0.057 0.054
(0.016)*** (0.017)*** (0.017)*** (0.017)*** K
ix 0.046 0.047 0.048 0.043
(0.037) (0.037) (0.037) (0.038)
Medium size 0.021 0.020 0.019 0.018
(0.019) (0.019) (0.019) (0.019)
Large size 0.059 0.055 0.055 0.050
(0.024)** (0.024)** (0.024)** (0.023)**
iForeign 0.018 0.022 0.023 0.020
(0.023) (0.023) (0.023) (0.023) COMPET
ip
-0.025
(0.018)
MNE
i
COMPET
i sp 0.001
(0.130)
iTECH
0.021
(0.017)
MNE
ii sTECH -0.049
(0.111)
iCOOPTECH
0.071
(0.065)
MNE
ii sCOOPTECH
-0.397
(0.444)
Observations 1012 1012 1012 1012
R-squared 0.61 0.61 0.61 0.61
Dependent variable: ( iY )
Regression includes constant term and full sets of country and industry dummies
Robust standard errors in parentheses
* significant at 10%; ** significant at 5%; *** significant at 1%
28
Table 5: Exogeneity test: First stage regression results
(1) (2)
Dependent variable MNE
is MNE
ishare
payment
-0.092 -0.023
(0.018)*** (0.006)***
Business association
-0.041 -0.005
(0.020)** (0.06)
F test
15.18 10.37
(p-value) (0.000)*** (0.000)***
Underidentification
29.72 20.81
(p-value) (0.000)*** (0.000)**
Hansen J
0.023 0.000
(p-value) (0.880) (0.994)
Exogeneity
0.457 0.328
(p-value) (0.499) (0.567)
Table only reports coefficients and standard errors for excluded instruments in the first stage; regression
includes all exogenous variables included in specifications in column (2) in Tables 3 and 4, respectively.
Instruments are (i) dummy whether a firm ever had to resolve an overdue payment, (ii) dummy whether a firm
is a member of a business association or chamber of commerce
Dummies defined as 1 = yes, 2 = no
Robust standard errors in parentheses
* significant at 10%; ** significant at 5%; *** significant at 1%
29
Table 6: Robustness checks
(1) (2) (3) (4)
Pressure
defined as
fairly or very
important
Pressure
defined as
fairly or very
important
Only domestic
firms
Only domestic
firms
MNE
is 0.005 -0.042
(0.040) (0.035)
MNE
ishare -0.010 -0.004
(0.098) (0.071)
PC
ip 0.007 0.002 -0.049 -0.042
(0.020) (0.019) (0.019)*** (0.019)**
MNE
i
PC
i sp 0.017 0.134
(0.048) (0.055)**
MNE
i
PC
i sharep 0.244 0.330
(0.123)** (0.147)**
M
ix 0.910 0.913 0.895 0.898
(0.045)*** (0.045)*** (0.052)*** (0.052)***
K
ix 0.059 0.052 0.045 0.043
(0.016)*** (0.016)*** (0.017)** (0.018)**
L
ix 0.046 0.044 0.052 0.051
(0.037) (0.037) (0.038) (0.039)
Medium size 0.019 0.020 0.019 0.020
(0.019) (0.019) (0.020) (0.021)
Large size 0.059 0.058 0.064 0.064
(0.024)** (0.024)** (0.027)** (0.027)**
iFOREIGN 0.026 0.018
(0.023) (0.022)
Observations 1012 1012 910 910
R-squared 0.61 0.61 0.59 0.59
Dependent variable: ( iY )
Regression includes constant term and full sets of country and industry dummies
Robust standard errors in parentheses
* significant at 10%; ** significant at 5%; *** significant at 1%
30
Appendix 1. Description of the variables used
Questions Year of
the survey
Answers used Name of
variable
"Over the last 36 month how have [sales,
fixed assets, material inputs] changed and
what is the percent of change for your
company, in real terms (i.e. after allowing
for inflation)"
2005 Sales iy
Fixed assets K
ix
Material inputs M
ix
Percentage change in fulltime employment
between 2002 and 2005 (in decimals)
2005 Employment L
ix
"What percent of your domestic sales are to:
…?” Dummy equal to one if answer is
positive
2002 Multinationals located in
your country
MNE
is
"What percent of your domestic sales are to:
…?”
2002 Multinationals located in
your country
MNE
ishare
“How would you rate the importance of each
of the following factors on key decisions
about your business with respect to
"Reducing the production costs of existing
products and services"?”
2002 Pressure from domestic
competitors
COMPET
ip
How would you rate the importance on key
decisions about your business with respect to
"Reducing the production costs of existing
products and services"?” or “Developing
new products or services and markets”
2002 Pressure from customers CUST
ip
"Has your firm acquired new production
technology over the last 36 months?"
2005 Yes=1;No=0 iTECH
"What was the most important way your firm
acquired this new technology, choosing from
the list below?”
2005 In cooperation with
customers iCOOPTECH
Which of the following best describes the
main chairholder(s) in your the firm...?
2005 Foreign company:
Yes=1;No=0
FOREIGN
How many permanent, full time employees
has your firm now…
2005 Dummy if 1-49 employees Small size
How many permanent, full time employees
has your firm now…
2005 Dummy if 50 – 249
employees
Medium size
How many permanent, full time employees
has your firm now…
2005 Dummy if more than 249
employees
Large size
Industry
2005 j