Embed Size (px)
Citation preview

HOLMES COUNTY ROAD SAFETY PLAN
March 2020
i Holmes County Road Safety Plan
TABLE OF CONTENTS:
TABLE OF CONTENTS: ...............................................................................................................i
1 EXECUTIVE SUMMARY..........................................................................................................ii
2 TRANSPORTATION SAFETY PARTNERS ............................................................................1
3 INTRODUCTION – SETTING THE STAGE .............................................................................3
3.1 Transportation Safety Planning ............................................................................. 3
3.2 Holmes County Transportation Safety ..................................................................... 4
3.3 Vision and Objectives ........................................................................................ 7
4 EXISTING CONDITIONS – UNDERSTANDING SAFETY NEEDS IN HOLMES COUNTY...10
4.4 The Big Picture .............................................................................................. 10
4.5 Fatal and Serious Injury Crashes .......................................................................... 14
5 EMPHASIS AREAS ...............................................................................................................18
6 IMPLEMENTATION & ACTION PLAN – CREATING A SAFER ROADWAY SYSTEM ......44
6.6 Priority Intersections........................................................................................ 45
6.7 Priority Segments ............................................................................................ 48
7 PROJECTS RECOMMENDED FOR EARLY ACTION ..........................................................53
7.1 Infrastructure Strategies and Actions .................................................................... 53
7.2 Seat Belts ..................................................................................................... 55
7.3 Young Drivers ................................................................................................ 55
7.4 Older Drivers ................................................................................................. 55
7.5 Motorcyclists ................................................................................................. 56
7.6 Amish Buggies ................................................................................................ 56
ii Holmes County Road Safety Plan
1 EXECUTIVE SUMMARY
Holmes County, located in north-central Ohio, is home to approximately 44,000 residents within four villages and 14
townships spanning 473 square miles. In this predominantly rural county, it is common for residents and visitors alike
to travel to and from destinations in motor vehicles. While some bicycle and pedestrian amenities are available, the
easiest and quickest route is often in a car. With the majority of people traveling by motor vehicle, crashes can occur
which impact families, friendships and the fabric of a smaller community.
As part of the Ohio Department of Transportation’s (ODOT) Toward Zero Deaths initiative, the Holmes County Road
Safety Plan analyzes reported crashes that occurred in Holmes County between 2009 and 2018 and it identifies
potential mitigation measures to address the most challenging safety issues in the county. During the analysis period,
759 transportation-related crashes per year were reported in Holmes County with 47 fatalities and 349 serious
injuries. Reflected as annual averages, each year 5 people lose their life, 35 are seriously injured and 1,673 people
are involved in a crash.
Crashes resulting in fatalities and serious injuries are typically preventable, but it takes an understanding of where
and why the crashes occur to understand the crash factors and characteristics and to identify mitigating measures.
Holmes County crash data was analyzed and reviewed with stakeholders to understand:
• Crash Trends – How fatal and serious injury crashes have trended over the past 10 years. This include a
review of crashes by jurisdiction and by roadway type.
• Safety Performance – How fatal and serious injury crashes could be reduced and to what extent, through
the implementation of proven solutions.
• Crash Types – What types of crashes are over-represented in the county (i.e., rear end, roadway departure,
etc.).
• Contributing Factors – What types of crash contributors (i.e., alcohol impairment, age, etc.) are over-
represented in the county.
• Locations – The roadway segments and intersections within the county that experience higher frequency
and/or severity of crashes than other locations and could be assessed for potential safety improvements.
Holmes County’s local transportation and safety stakeholders met to review the crash data and provide input into the
foundation of the Holmes County Road Safety Plan. This plan identifies the most effective approaches to reducing
fatal and serious injury crashes in the county, including:
• Vision, Goal and Objectives provide a framework for identifying safety programs, projects and policies.
• Four emphasis areas, Roadway Departure Crashes, Unrestrained Occupants, Young Drivers, and
Commercial Motor Vehicles represent the most significant roadway safety challenges in the county.
• An Action Plan, identifying locations, outlining programmatic and project solutions and showing stakeholders
where to focus their time and resources to make the biggest difference.
1 Holmes County Road Safety Plan
2 TRANSPORTATION SAFETY PARTNERS
Holmes County is fortunate to have many agencies and stakeholders that are engaged in transportation safety and
committed to reducing traffic fatalities and injuries. These safety partners provided critical input for the development
of Holmes County’s Safety Plan. The plan benefits from their insight and experience, resulting in a plan that fits the
county and addresses safety issues with a variety of strategies and measures to improve transportation safety.
• AAA
• AloNovus Corporation
• Anazao Community Partners
• Commercial and Savings Bank
• East Holmes Fire & EMS
• Hiland High School
• Holmes County Commissioners
• Holmes County Department of Job and
Family Services
• Holmes County Emergency Management
• Holmes County General Health Department
• Holmes County Safe Communities
• Holmes County Sherriff’s Office
• Hummel Group
• Keim Lumber Company
• Millersburg Police Department
• Ohio Department of Transportation
• Ohio State Fire Marshall
• Ohio State Highway Patrol
• Ohio Traffic Safety Office
• OneEighty
• The Daily Record
• Troy Miller Agency
• Wayne-Holmes Driving School
• West Holmes High School
• West Holmes Local School District
• WKLM Radio

2 Holmes County Road Safety Plan
INTRODUCTION
Setting the Stage
SECTION CONTENT:
Transportation Safety Planning Holmes County Transportation Safety Vision & Objectives
3 Holmes County Road Safety Plan
3 INTRODUCTION – SETTING THE STAGE
3.1 TRANSPORTATION SAFETY PLANNING
Ohio experiences an average of 1,000 transportation-related fatalities
every year. A national strategy called Toward Zero Deaths, driven and
supported by transportation, enforcement, local government,
educators, health professionals and emergency response associations,
concludes that even one death on the transportation network is
unacceptable. The strategy is based on the goal of zero road fatalities
by 2050. The Ohio Department of Transportation (ODOT) has adopted
this strategy and is working toward identifying and implementing
measures to ensure everyone is safe on Ohio’s transportation network.
One effective tool to achieve this vision is development of Local Road
Safety Plans (LRSP). This type of plan empowers local and regional
transportation agencies to review crash data to understand the unique
safety challenges in their areas, organize stakeholders, and customize
solutions, or countermeasures, that will be effective based on local
context.
The Holmes County Road Safety Plan followed this approach to
develop multi-disciplinary safety solutions and mitigating measures.
The planning process focused on the understanding that motor vehicle-
related crashes are preventable. In some instances, roadway features
can be improved to limit the severity of crashes and in other cases reducing or eliminating unsafe behaviors is key.
Most cases benefit from a combination of both factors. This plan identifies proven strategies, actions, programs,
policies and projects to reduce crashes related to infrastructure and driver error.
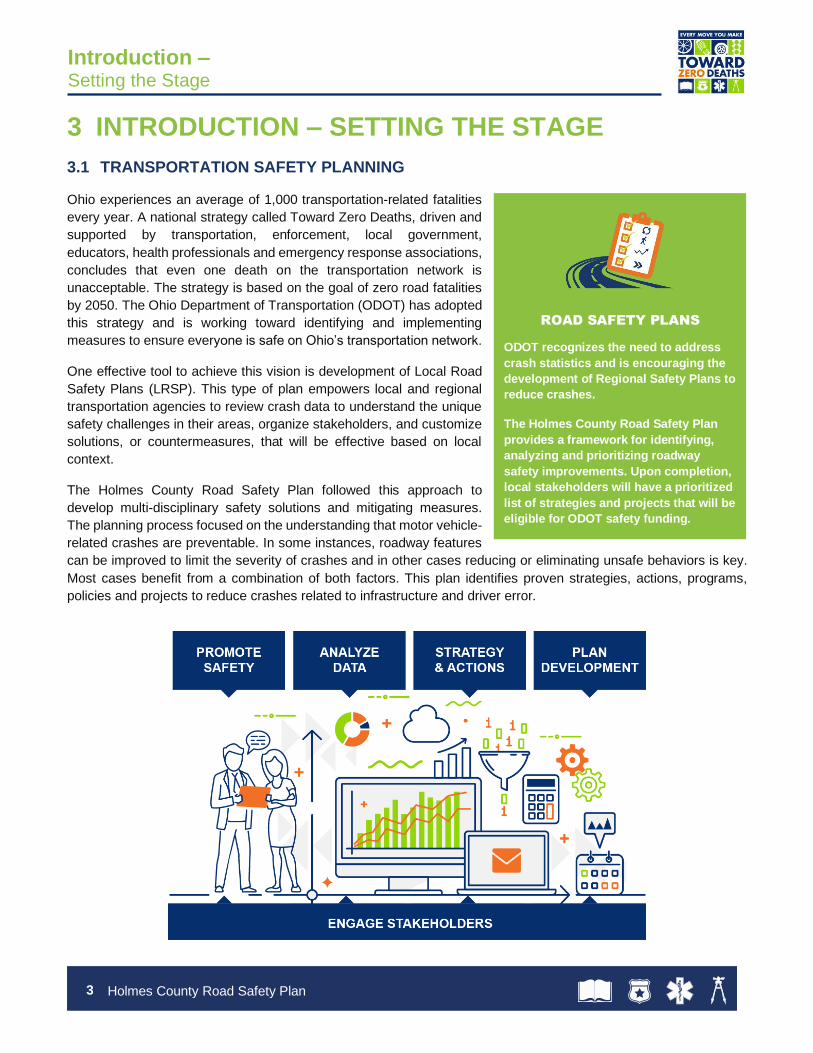
ROAD SAFETY PLANS
ODOT recognizes the need to address
crash statistics and is encouraging the
development of Regional Safety Plans to
reduce crashes.
The Holmes County Road Safety Plan
provides a framework for identifying,
analyzing and prioritizing roadway
safety improvements. Upon completion,
local stakeholders will have a prioritized
list of strategies and projects that will be
eligible for ODOT safety funding.
Introduction – Setting the Stage

4 Holmes County Road Safety Plan
3.2 HOLMES COUNTY TRANSPORTATION SAFETY
THE STUDY AREA
Founded in 1824 and located in the Northeastern quadrant of Ohio,
Holmes County is home to an estimated 43,892 Ohioans, based
on 2018 census data. Holmes County consists of 14 townships and
four villages. Millersburg, the county seat, is known for its historic
district and it is the largest village/municipality with 3,189 residents.
THE PEOPLE
Based on 2010 census data, the population density of Holmes
County was 100.3 inhabitants per square mile with 13,666 housing
units at an average density of 32.3 per square mile. The reported
racial makeup of the county was 98.7% white, 0.8% Hispanic or
Latino, 0.3% black or African American, 0.1% Asian, 0.1%
American Indian, 0.2% from other races, and 0.5% from two or
more races.
Of the 12,554 households in the county, 42.9% had children under
the age of 18 living with them, 69.7% were married couples living together, 6.9% had a female householder with no
husband present, 20.1% were non-families, and 17.2% of all households were made up of individuals. The average
household size was 3.31 and the average family size was 3.80. The median age was 29.7 years.
The 2010 census reported the county’s median household
income as $43,533 (15% lower than the state average)
and the median income for a family was $49,133. Males
had a median income of $36,644 versus $24,317 for
females. The per capita income for the county was
$17,009. About 10.5% of families and 13.3% of the
population were below the poverty line, including 18.9%
of those under age 18 and 6.9% of those aged 65 or
over”.
Ohio’s Amish population is centered in Holmes County,
with more than 17,000 Amish residents and additional
Amish communities in each of the five surrounding
counties. Holmes County includes the highest
percentage of Amish (42%) as compared to all other
counties in the United States, representing the second
largest Amish community in the world. Holmes County is
projected to become the first majority Amish county within
15 years. In addition, Holmes County draws more than 4
million visitors each year to the Amish community and
country-life experience, the scenery, quilts, furniture,
craftwork and locally produced food.
Year Population Change % Change
1900 19,511 -1,628 −7.7%
1910 17,909 -1,602 −8.2%
1920 16,965 -944 −5.3%
1930 16,726 -239 −1.4%
1940 17,876 1,150 6.90%
1950 18,760 884 4.90%
1960 21,591 2,831 15.10%
1970 23,024 1,433 6.60%
1980 29,416 6,392 27.80%
1990 32,849 3,433 11.70%
2000 38,943 6,094 18.60%
2010 42,366 3,423 8.80%
2018 (EST)
43,892 1,526 3.60%
Introduction – Setting the Stage
Figure 1: Ohio County Map
Table 1: Holmes County Population

5 Holmes County Road Safety Plan
THE ROADWAY NETWORK
There are 1,081 miles of road in Holmes County. The majority (82%) are local roads that were built and are maintained
by the County, four villages, and 14 townships. The remaining 18% are state and US routes that are maintained by
ODOT.
Route Type Miles Percent (%)
Interstate - -
US Route 37 3.4
State Route 157 14.5
County Road 257 23.8
Township Road 603 55.8
Municipal Road 27 2.5
TOTAL 1,081 100%
Introduction – Setting the Stage
Introduction – Setting the Stage
Table 2: Holmes County Road Types
Figure 2: Holmes County Jurisdiction and Roadway Network Map

6 Holmes County Road Safety Plan
Holmes County roads present unique challenges resulting from continuous waves of visitors. In addition, pedestrian-
motor vehicle crashes occur as a result of a lack of sidewalks. Other crashes involving vulnerable road users occur
in Holmes County due to the presence of bicyclists, younger drivers, horse-drawn Amish buggies, and farm
equipment. Furthermore, Holmes County exports a variety of goods ranging from construction materials, furniture,
food products, garage and entry-way doors, automotive components and more. As such, the roads throughout the
county carry significant volumes of tractor-trailers, log trucks, cranes and other heavy vehicles. These factors result
in heavy truck usage which causes deterioration of the county’s roads.
Most crashes in Holmes County occur on local roads. Additionally, the crash analyses indicate 41 percent of serious
injuries and 33 percent of fatalities occurred on local roads. The subsequent plan sections review Holmes County
crash trends with their associated analyses, followed by recommended mitigation strategies to support the Toward
Zero Deaths initiative.
CURRENT SAFETY ACTIVITIES
Several efforts have been made to improve transportation safety in Holmes County. The most recent Holmes County
Comprehensive Plan recognizes the diverse mix of road users and expresses interest in providing safe pedestrian-
oriented places, safe havens for buggies, and shared walking/bicycle systems to better accommodate vulnerable
road users. The Ohio Mid-Eastern Governments Association (OMEGA) is the regional transportation planning
organization that serves 10 counties: Belmont, Carroll, Columbiana, Coshocton, Guernsey, Harrison, Holmes,
Jefferson, Muskingum and Tuscarawas. OMEGA has identified and documented existing safety issues and areas of
concerns within the 10-county planning area, including Holmes County. OMEGA recently provided assistance to the
Village of Millersburg and Salt Creek Township, funding transportation alternatives to improve the safety and mobility
of pedestrians within the area as they travel to commercial establishments, the Holmes County Public Library, Old
Airport Park, the Mount Hope Auction facility, and access to the Holmes County Trail. Additionally, the Holmes County
Engineer has completed roadway widening projects to more safely accommodate Amish buggies as part of roadway
maintenance and repair projects.
ODOT District 11 has completed many traffic safety studies which have spurred consideration for improving various
corridors in Holmes County, most notably US 62 within the unincorporated community of Berlin which has been
identified as a hazardous location experiencing rear end, angle and left turning crashes within an identified section
of the corridor.
Statewide programs have also been implemented by the Ohio State Highway Patrol. The highway patrol focuses on
various aspects of traffic safety throughout the year, such as warning against drunk driving around holidays and
campaigning for Ohio motorists to wear their safety belts with the “Click It or Ticket” campaign. Sobriety checkpoints
are enforcement tools often used by the highway patrol aimed to reduce alcohol-related fatalities and injuries and
increase safety overall for those on and off the roads.
The state highway patrol also partners with nearby states and their state police offices to provide coordinated law
enforcement and security in highway safety. The Six-State Trooper Project includes the states of Ohio, Michigan,
Indiana, Kentucky, West Virginia, and Pennsylvania. This consortium focuses on areas of importance including
impaired driving and distracted driving.
Introduction – Setting the Stage

7 Holmes County Road Safety Plan
3.3 VISION AND OBJECTIVES
The vision and objectives of the Holmes County safety plan outline safety aspirations for the next 5 years and what
safety success looks like in the near term. Stakeholders developed the County’s vision and objectives based on
examples from ODOT and other agencies and an understanding of crash data which shows historical safety
performance and future forecasts.
Vision – A safer Holmes County through reduced fatalities and serious injuries
Objective – Reduce fatalities and serious injuries by two percent per year
The contents of the Holmes County Road Safety Plan present a framework that will help the County focus funding
and resources to implement safety policies, programs and projects that will best achieve the identified safety
objectives. Documenting Holmes County’s safety performance, including fatalities and serious injuries, is important
for the development of this plan. Table 3 provides the five-year rolling averages of the common safety performance
targets for each five-year period between 2009 and 2018.
The safety performance targets are:
- Number of Fatalities
- Rate of Fatalities per 100 Million Vehicles Miles Traveled (MVMT)
- Number of Non-Motorized Fatalities & Serious Injuries
- Number of Serious Injuries
- Rate of Serious Injuries per 100 MVMT
The crash data show the number of fatalities is gradually decreasing but the fatality rate is consistent with the five-
year rolling averages for the total fatalities. Serious injury targets show very little change. The rate of serious injuries
per hundred million VMT has not changed since 2009. The non-motorized fatalities and serious injuries performance
measure is included to capture the aggregated number of pedestrian and bicyclist fatalities and serious injuries as
five-year rolling averages. Given the unique presence of Amish buggies within Holmes County, the non-motorized
performance measure also includes Amish buggy crashes. As denoted in the table, non-motorized fatalities and
serious injuries have decreased somewhat.
YEAR NUMBER OF FATALITIES
RATE OF FATALITIES/ 100
MVMT
NUMBER OF SERIOUS INJURIES
RATE OF SERIOUS INJURIES/ 100
MVMT
NUMBER OF NON-
MOTORIZED FSI
2009-2013 6 2 35 12 7
2010-2014 5 2 34 12 5
2011-2015 5 2 34 12 5
2012-2016 5 2 34 11 6
2013-2017 4 1 35 12 6
2014-2018 4 1 34 11 3
TREND Decreasing
Decreasing
No Change
No Change
Decreasing
Introduction – Setting the Stage
Table 3: Five-Year Rolling Averages for the Five Safety Targets
8 Holmes County Road Safety Plan
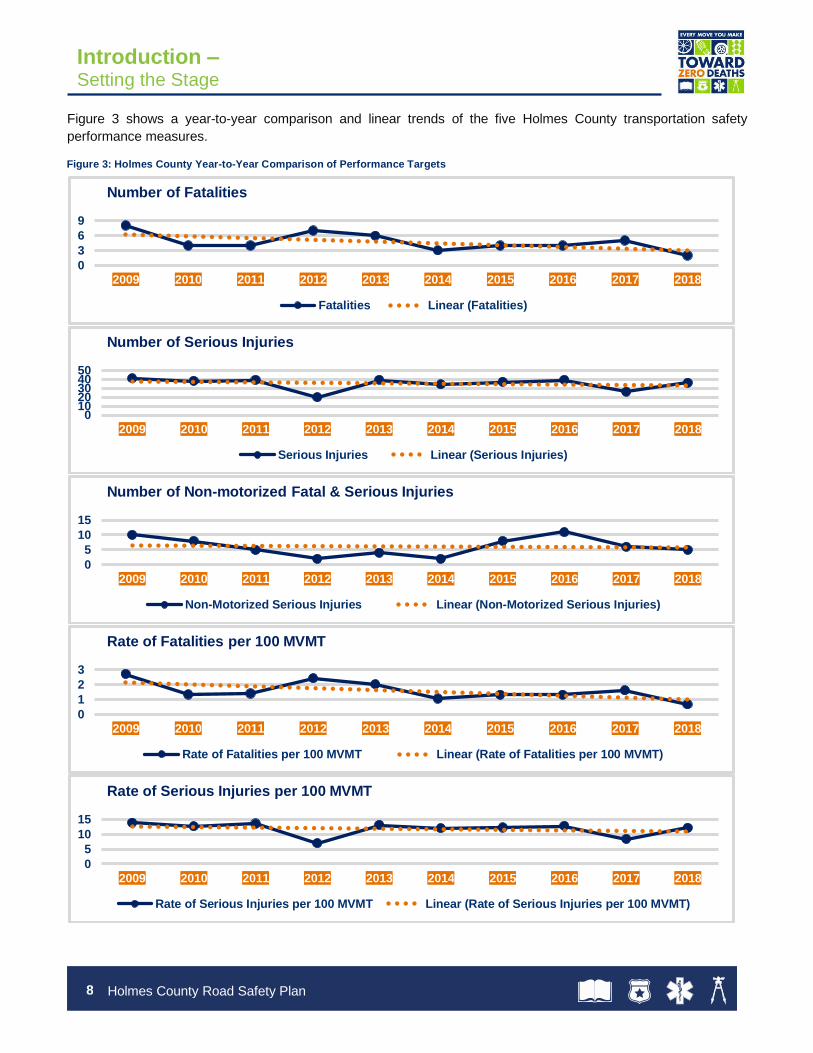
Figure 3 shows a year-to-year comparison and linear trends of the five Holmes County transportation safety
performance measures.
0
3
6
9
2009 2010 2011 2012 2013 2014 2015 2016 2017 2018
Number of Fatalities
Fatalities Linear (Fatalities)
01020304050
2009 2010 2011 2012 2013 2014 2015 2016 2017 2018
Number of Serious Injuries
Serious Injuries Linear (Serious Injuries)
0
5
10
15
2009 2010 2011 2012 2013 2014 2015 2016 2017 2018
Number of Non-motorized Fatal & Serious Injuries
Non-Motorized Serious Injuries Linear (Non-Motorized Serious Injuries)
0
1
2
3
2009 2010 2011 2012 2013 2014 2015 2016 2017 2018
Rate of Fatalities per 100 MVMT
Rate of Fatalities per 100 MVMT Linear (Rate of Fatalities per 100 MVMT)
0
5
10
15
2009 2010 2011 2012 2013 2014 2015 2016 2017 2018
Rate of Serious Injuries per 100 MVMT
Rate of Serious Injuries per 100 MVMT Linear (Rate of Serious Injuries per 100 MVMT)
Introduction – Setting the Stage
Figure 3: Holmes County Year-to-Year Comparison of Performance Targets

9 Holmes County Road Safety Plan
Existing Conditions
Understanding Safety Needs in Holmes County
SECTION CONTENT:
The Big Picture Crash Types
10 Holmes County Road Safety Plan
4 EXISTING CONDITIONS – UNDERSTANDING SAFETY NEEDS IN HOLMES COUNTY
4.4 THE BIG PICTURE
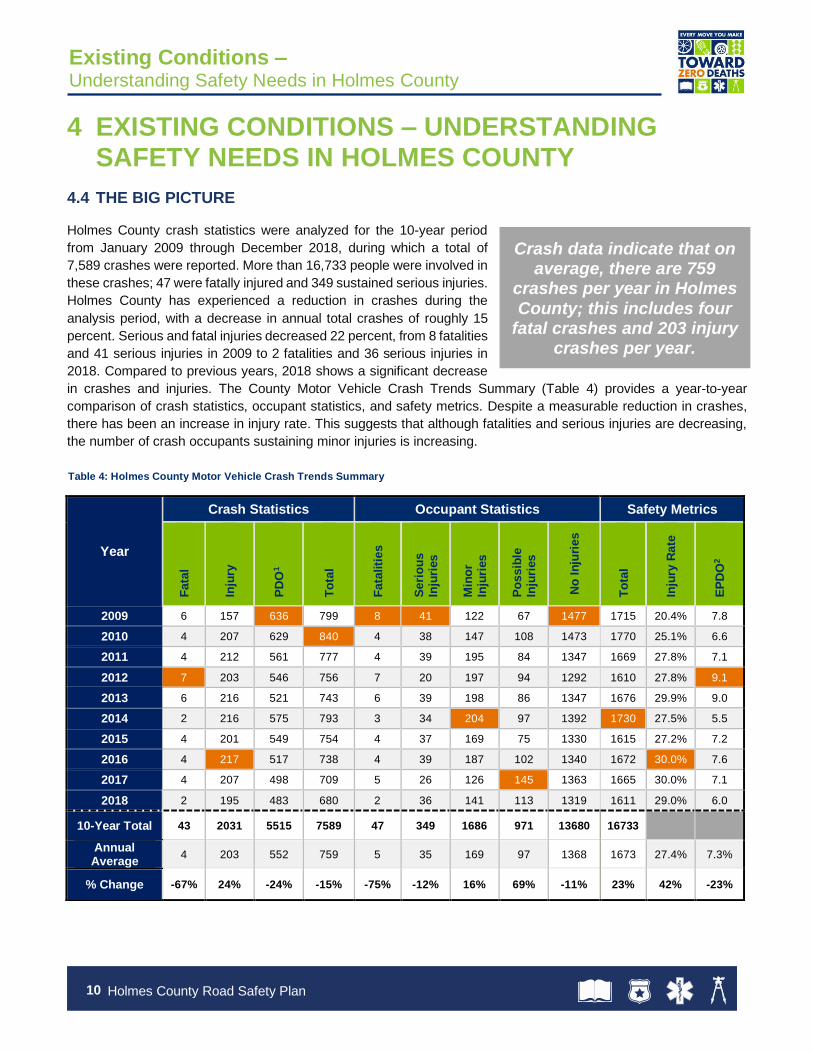
Holmes County crash statistics were analyzed for the 10-year period
from January 2009 through December 2018, during which a total of
7,589 crashes were reported. More than 16,733 people were involved in
these crashes; 47 were fatally injured and 349 sustained serious injuries.
Holmes County has experienced a reduction in crashes during the
analysis period, with a decrease in annual total crashes of roughly 15
percent. Serious and fatal injuries decreased 22 percent, from 8 fatalities
and 41 serious injuries in 2009 to 2 fatalities and 36 serious injuries in
2018. Compared to previous years, 2018 shows a significant decrease
in crashes and injuries. The County Motor Vehicle Crash Trends Summary (Table 4) provides a year-to-year
comparison of crash statistics, occupant statistics, and safety metrics. Despite a measurable reduction in crashes,
there has been an increase in injury rate. This suggests that although fatalities and serious injuries are decreasing,
the number of crash occupants sustaining minor injuries is increasing.
Year
Crash Statistics Occupant Statistics Safety Metrics
Fata
l
Inju
ry
PD
O1
To
tal
Fata
liti
es
Seri
ou
s
Inju
ries
Min
or
Inju
ries
Po
ssib
le
Inju
ries
No
In
juri
es
To
tal
Inju
ry R
ate
EP
DO
2
2009 6 157 636 799 8 41 122 67 1477 1715 20.4% 7.8
2010 4 207 629 840 4 38 147 108 1473 1770 25.1% 6.6
2011 4 212 561 777 4 39 195 84 1347 1669 27.8% 7.1
2012 7 203 546 756 7 20 197 94 1292 1610 27.8% 9.1
2013 6 216 521 743 6 39 198 86 1347 1676 29.9% 9.0
2014 2 216 575 793 3 34 204 97 1392 1730 27.5% 5.5
2015 4 201 549 754 4 37 169 75 1330 1615 27.2% 7.2
2016 4 217 517 738 4 39 187 102 1340 1672 30.0% 7.6
2017 4 207 498 709 5 26 126 145 1363 1665 30.0% 7.1
2018 2 195 483 680 2 36 141 113 1319 1611 29.0% 6.0
10-Year Total 43 2031 5515 7589 47 349 1686 971 13680 16733
Annual Average
4 203 552 759 5 35 169 97 1368 1673 27.4% 7.3%
% Change -67% 24% -24% -15% -75% -12% 16% 69% -11% 23% 42% -23%
Existing Conditions – Understanding Safety Needs in Holmes County
Crash data indicate that on average, there are 759
crashes per year in Holmes County; this includes four
fatal crashes and 203 injury crashes per year.
Table 4: Holmes County Motor Vehicle Crash Trends Summary

11 Holmes County Road Safety Plan
Jurisdiction Fatal Injury Property Damage Total
Number Percent Number Percent Number Percent Number Percent
Baltic 0 0.0% 0 0.0% 9 0.2% 9 0.1%
Berlin Twp. 1 2.3% 284 14.0% 757 13.7% 1,042 13.7%
Clark Twp. 2 4.7% 102 5.0% 242 4.4% 346 4.6%
Glenmont 0 0.0% 7 0.3% 11 0.2% 18 0.2%
Hardy Twp. 3 7.0% 140 6.9% 400 7.3% 543 7.2%
Holmesville 0 0.0% 9 0.4% 36 0.7% 45 0.6%
Killbuck 1 2.3% 15 0.7% 45 0.8% 61 0.8%
Killbuck Twp. 6 14.0% 102 5.0% 291 5.3% 399 5.3%
Knox Twp. 1 2.3% 60 3.0% 169 3.1% 230 3.0%
Loudonville 0 0.0% 3 0.1% 4 0.1% 7 0.1%
Mechanic Twp. 5 11.6% 110 5.4% 291 5.3% 406 5.3%
Millersburg 1 2.3% 222 10.9% 825 15.0% 1,048 13.8%
Monroe Twp. 3 7.0% 124 6.1% 261 4.7% 388 5.1%
Nashville 0 0.0% 5 0.2% 39 0.7% 44 0.6%
Paint Twp. 3 7.0% 140 6.9% 314 5.7% 457 6.0%
Prairie Twp. 4 9.3% 90 4.4% 348 6.3% 442 5.8%
Richland Twp. 1 2.3% 65 3.2% 181 3.3% 247 3.3%
Ripley Twp. 0 0.0% 96 4.7% 249 4.5% 345 4.5%
Salt Creek Twp. 5 11.6% 167 8.2% 412 7.5% 584 7.7%
Walnut Creek Twp. 5 11.6% 180 8.9% 400 7.3% 585 7.7%
Washington Twp. 2 4.7% 110 5.4% 231 4.2% 343 4.5%
TOTAL 43 100% 2,031 100% 5,515 100% 7,589 100%
Table 5: Holmes County Motor Vehicle Crash Trends by Jurisdiction (2009-2018)
Figure 4: Holmes County Crashes and Fatal and Serious Injuries (2009–2018)
Existing Conditions – Understanding Safety Needs in Holmes County
0
10
20
30
40
50
60
0
150
300
450
600
750
900
2009 2010 2011 2012 2013 2014 2015 2016 2017 2018
Fata
liti
es &
Seri
ou
s
Inju
ries
To
tal C
rash
es
Total Crashes Fatal and Serious Injuries
12 Holmes County Road Safety Plan
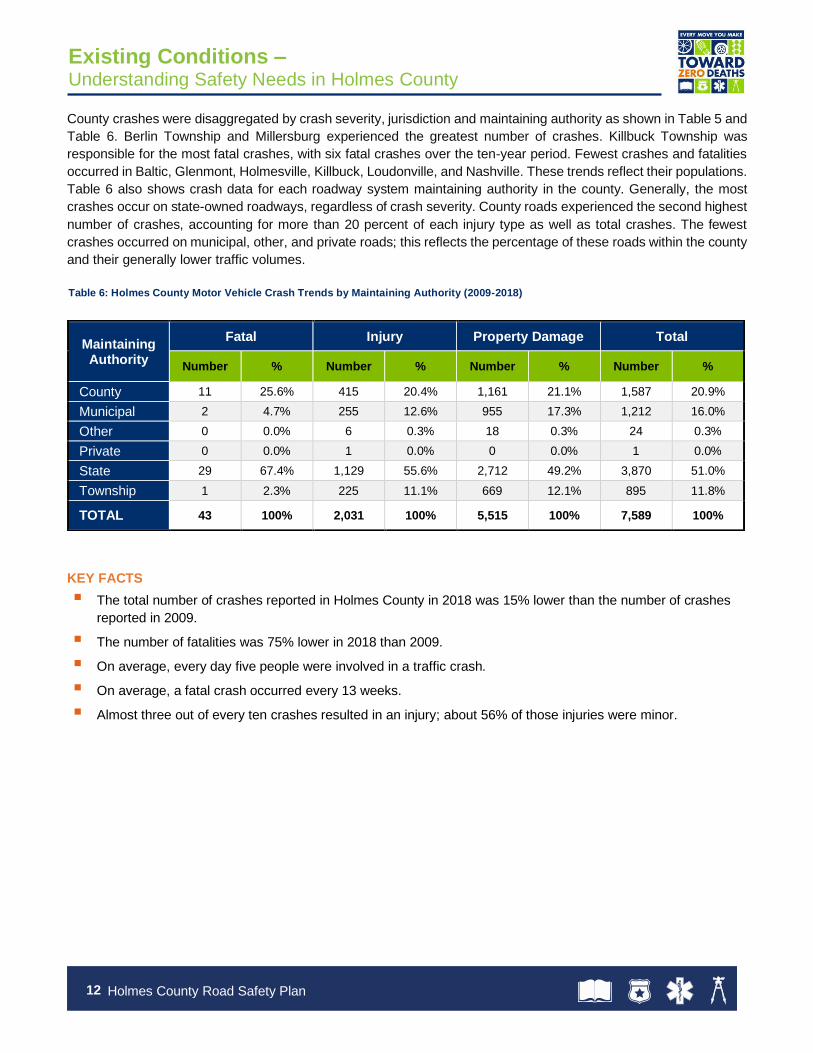
County crashes were disaggregated by crash severity, jurisdiction and maintaining authority as shown in Table 5 and
Table 6. Berlin Township and Millersburg experienced the greatest number of crashes. Killbuck Township was
responsible for the most fatal crashes, with six fatal crashes over the ten-year period. Fewest crashes and fatalities
occurred in Baltic, Glenmont, Holmesville, Killbuck, Loudonville, and Nashville. These trends reflect their populations.
Table 6 also shows crash data for each roadway system maintaining authority in the county. Generally, the most
crashes occur on state-owned roadways, regardless of crash severity. County roads experienced the second highest
number of crashes, accounting for more than 20 percent of each injury type as well as total crashes. The fewest
crashes occurred on municipal, other, and private roads; this reflects the percentage of these roads within the county
and their generally lower traffic volumes.
KEY FACTS
▪ The total number of crashes reported in Holmes County in 2018 was 15% lower than the number of crashes
reported in 2009.
▪ The number of fatalities was 75% lower in 2018 than 2009.
▪ On average, every day five people were involved in a traffic crash.
▪ On average, a fatal crash occurred every 13 weeks.
▪ Almost three out of every ten crashes resulted in an injury; about 56% of those injuries were minor.
Maintaining Authority
Fatal Injury Property Damage Total
Number % Number % Number % Number %
County 11 25.6% 415 20.4% 1,161 21.1% 1,587 20.9%
Municipal 2 4.7% 255 12.6% 955 17.3% 1,212 16.0%
Other 0 0.0% 6 0.3% 18 0.3% 24 0.3%
Private 0 0.0% 1 0.0% 0 0.0% 1 0.0%
State 29 67.4% 1,129 55.6% 2,712 49.2% 3,870 51.0%
Township 1 2.3% 225 11.1% 669 12.1% 895 11.8%
TOTAL 43 100% 2,031 100% 5,515 100% 7,589 100%
Existing Conditions – Understanding Safety Needs in Holmes County
Table 6: Holmes County Motor Vehicle Crash Trends by Maintaining Authority (2009-2018)

13 Holmes County Road Safety Plan
Figure 5 illustrates the overall crash density for Holmes County. Crashes occur in six distinct areas, predominantly in
the central and eastern parts of the county. Of those areas, Hardy Township has both the greatest magnitude and
highest crash density, followed by Berlin Township. These trends reflect the concentration of the county’s population
in these communities.
Figure 5: Holmes County Overall Crash Density (2009-2018)
Existing Conditions – Understanding Safety Needs in Holmes County
14 Holmes County Road Safety Plan
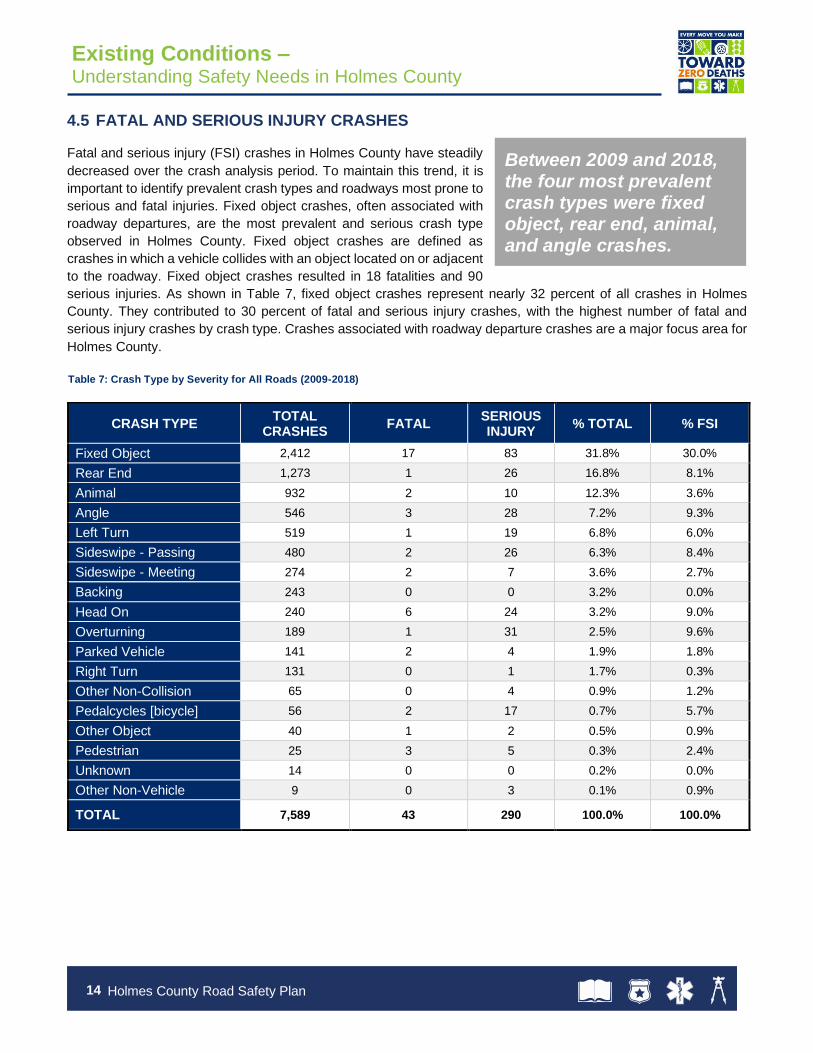
4.5 FATAL AND SERIOUS INJURY CRASHES
Fatal and serious injury (FSI) crashes in Holmes County have steadily
decreased over the crash analysis period. To maintain this trend, it is
important to identify prevalent crash types and roadways most prone to
serious and fatal injuries. Fixed object crashes, often associated with
roadway departures, are the most prevalent and serious crash type
observed in Holmes County. Fixed object crashes are defined as
crashes in which a vehicle collides with an object located on or adjacent
to the roadway. Fixed object crashes resulted in 18 fatalities and 90
serious injuries. As shown in Table 7, fixed object crashes represent nearly 32 percent of all crashes in Holmes
County. They contributed to 30 percent of fatal and serious injury crashes, with the highest number of fatal and
serious injury crashes by crash type. Crashes associated with roadway departure crashes are a major focus area for
Holmes County.
CRASH TYPE TOTAL
CRASHES FATAL
SERIOUS INJURY
% TOTAL % FSI
Fixed Object 2,412 17 83 31.8% 30.0%
Rear End 1,273 1 26 16.8% 8.1%
Animal 932 2 10 12.3% 3.6%
Angle 546 3 28 7.2% 9.3%
Left Turn 519 1 19 6.8% 6.0%
Sideswipe - Passing 480 2 26 6.3% 8.4%
Sideswipe - Meeting 274 2 7 3.6% 2.7%
Backing 243 0 0 3.2% 0.0%
Head On 240 6 24 3.2% 9.0%
Overturning 189 1 31 2.5% 9.6%
Parked Vehicle 141 2 4 1.9% 1.8%
Right Turn 131 0 1 1.7% 0.3%
Other Non-Collision 65 0 4 0.9% 1.2%
Pedalcycles [bicycle] 56 2 17 0.7% 5.7%
Other Object 40 1 2 0.5% 0.9%
Pedestrian 25 3 5 0.3% 2.4%
Unknown 14 0 0 0.2% 0.0%
Other Non-Vehicle 9 0 3 0.1% 0.9%
TOTAL 7,589 43 290 100.0% 100.0%
Existing Conditions – Understanding Safety Needs in Holmes County
Between 2009 and 2018, the four most prevalent crash types were fixed object, rear end, animal, and angle crashes.
Table 7: Crash Type by Severity for All Roads (2009-2018)

15 Holmes County Road Safety Plan
As shown in Table 8, fixed object FSI crashes occur at relatively similar rates on township, county, and state-
maintained roadways and these are the top three categories of maintenance authority for crashes. For township and
county roads, overturning was the second most prevalent crash type. For state-maintained roads, sideswipe-passing
and angle crashes were the next two most common crash types.
KEY FACTS
▪ Crashes involving a fixed object represented 30 percent of all recorded fatal and serious injury crashes.
▪ Fixed object crashes are the predominant type of crash across roads maintained by all authorities.
FSI CRASH TYPE TOTAL FSI MAINTAINING AUTHORITY
TOWNSHIP COUNTY STATE
Fixed Object 30.0% 26.8% 35.5% 30.5%
Head On 9.0% 12.2% 6.5% 10.0%
Sideswipe - Passing 8.4% 4.9% 6.5% 11.0%
Angle 9.3% 2.4% 6.5% 11.0%
Overturning 9.6% 22.0% 9.7% 7.5%
Left Turn 6.0% 2.4% 3.2% 6.0%
Rear End 8.1% 0.0% 1.6% 10.5%
Pedalcycles 5.7% 7.3% 8.1% 5.0%
Animal 3.6% 3.6% 4.8% 2.5%
Sideswipe - Meeting 2.7% 2.7% 3.2% 3.0%
Pedestrian 2.4% 0.0% 6.5% 1.0%
Parked Vehicle 1.8% 0.0% 3.2% 0.5%
Other Non-Vehicle 0.9% 7.3% 0.0% 0.0%
Other Non-Collision 1.2% 2.4% 1.6% 0.5%
Right Turn 0.3% 0.0% 1.6% 0.0%
Other Object 0.9% 0.0% 1.6% 1.0%
Existing Conditions – Understanding Safety Needs in Holmes County
Existing Conditions – Understanding Safety Needs in Holmes County
Table 8: FSI Crash Type by Maintaining Authority (2009-2018)
16 Holmes County Road Safety Plan
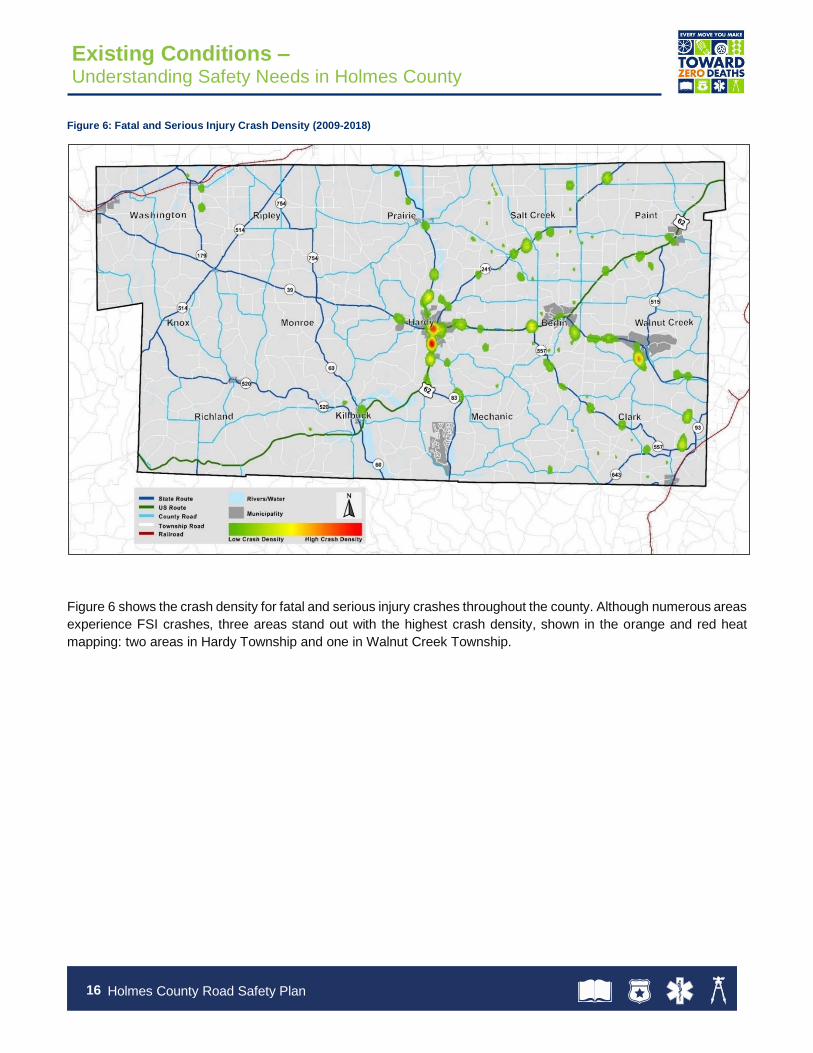
Figure 6 shows the crash density for fatal and serious injury crashes throughout the county. Although numerous areas
experience FSI crashes, three areas stand out with the highest crash density, shown in the orange and red heat
mapping: two areas in Hardy Township and one in Walnut Creek Township.
Figure 6: Fatal and Serious Injury Crash Density (2009-2018)
Existing Conditions – Understanding Safety Needs in Holmes County
17 Holmes County Road Safety Plan
Emphasis Areas
Prioritized Focus Areas
SECTION CONTENT:
Roadway Departures Intersections Younger Drivers Commercial Motor/Farming Vehicles
18 Holmes County Road Safety Plan
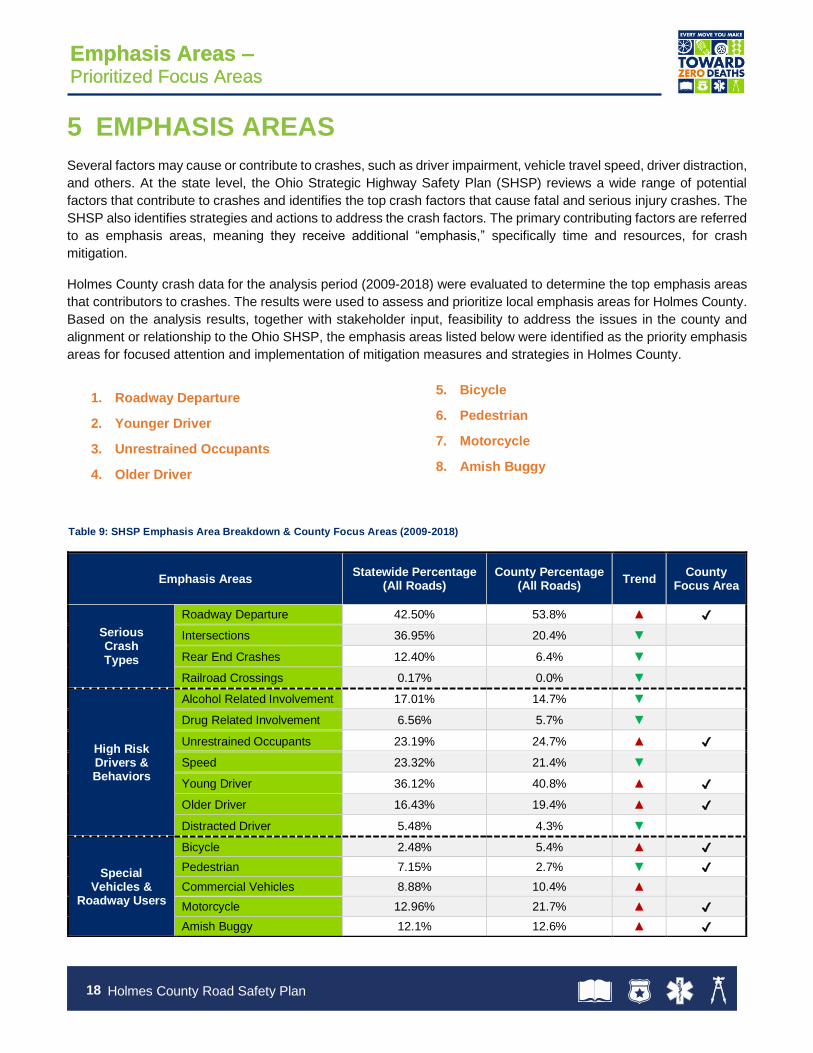
5 EMPHASIS AREAS
Several factors may cause or contribute to crashes, such as driver impairment, vehicle travel speed, driver distraction,
and others. At the state level, the Ohio Strategic Highway Safety Plan (SHSP) reviews a wide range of potential
factors that contribute to crashes and identifies the top crash factors that cause fatal and serious injury crashes. The
SHSP also identifies strategies and actions to address the crash factors. The primary contributing factors are referred
to as emphasis areas, meaning they receive additional “emphasis,” specifically time and resources, for crash
mitigation.
Holmes County crash data for the analysis period (2009-2018) were evaluated to determine the top emphasis areas
that contributors to crashes. The results were used to assess and prioritize local emphasis areas for Holmes County.
Based on the analysis results, together with stakeholder input, feasibility to address the issues in the county and
alignment or relationship to the Ohio SHSP, the emphasis areas listed below were identified as the priority emphasis
areas for focused attention and implementation of mitigation measures and strategies in Holmes County.
1. Roadway Departure
2. Younger Driver
3. Unrestrained Occupants
4. Older Driver
5. Bicycle
6. Pedestrian
7. Motorcycle
8. Amish Buggy
Emphasis Areas Statewide Percentage
(All Roads) County Percentage
(All Roads) Trend
County Focus Area
Serious Crash Types
Roadway Departure 42.50% 53.8% ▲ ✔
Intersections 36.95% 20.4% ▼
Rear End Crashes 12.40% 6.4% ▼
Railroad Crossings 0.17% 0.0% ▼
High Risk Drivers & Behaviors
Alcohol Related Involvement 17.01% 14.7% ▼
Drug Related Involvement 6.56% 5.7% ▼
Unrestrained Occupants 23.19% 24.7% ▲ ✔
Speed 23.32% 21.4% ▼
Young Driver 36.12% 40.8% ▲ ✔
Older Driver 16.43% 19.4% ▲ ✔
Distracted Driver 5.48% 4.3% ▼
Special Vehicles &
Roadway Users
Bicycle 2.48% 5.4% ▲ ✔
Pedestrian 7.15% 2.7% ▼ ✔
Commercial Vehicles 8.88% 10.4% ▲
Motorcycle 12.96% 21.7% ▲ ✔
Amish Buggy 12.1% 12.6% ▲ ✔
Emphasis Areas – Prioritized Focus Areas
Emphasis Areas – Prioritized Focus Areas
Table 9: SHSP Emphasis Area Breakdown & County Focus Areas (2009-2018)
19 Holmes County Road Safety Plan
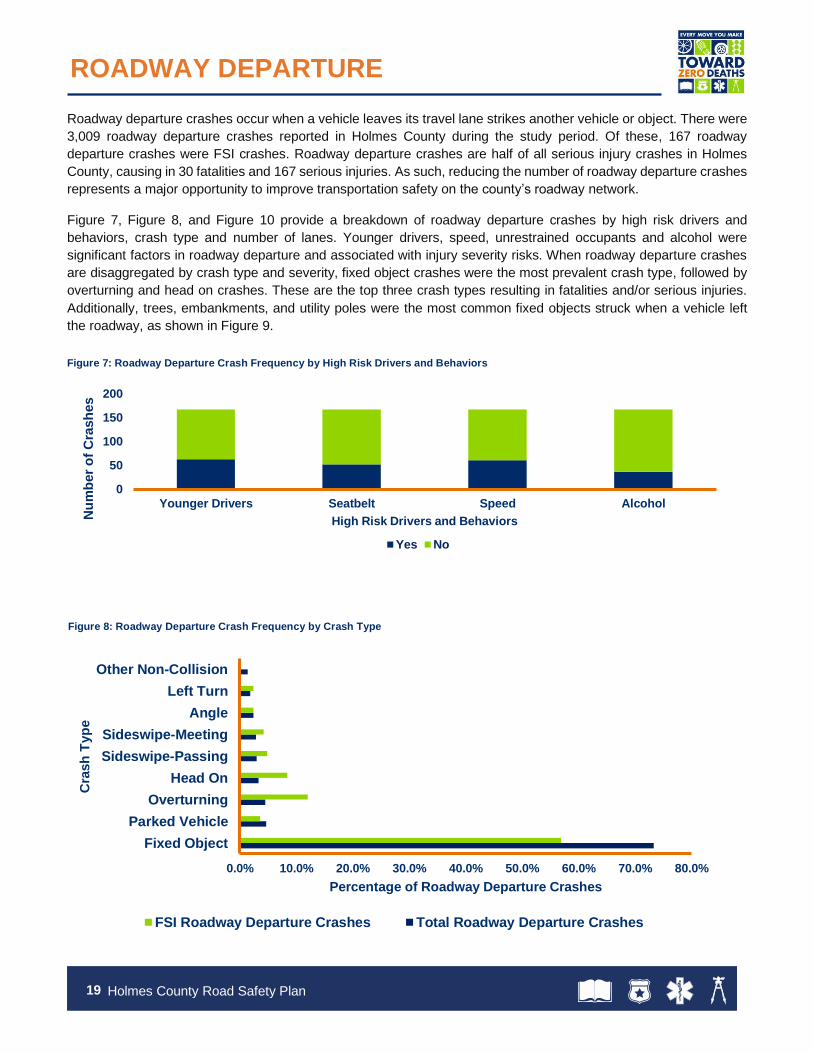
Roadway departure crashes occur when a vehicle leaves its travel lane strikes another vehicle or object. There were
3,009 roadway departure crashes reported in Holmes County during the study period. Of these, 167 roadway
departure crashes were FSI crashes. Roadway departure crashes are half of all serious injury crashes in Holmes
County, causing in 30 fatalities and 167 serious injuries. As such, reducing the number of roadway departure crashes
represents a major opportunity to improve transportation safety on the county’s roadway network.
Figure 7, Figure 8, and Figure 10 provide a breakdown of roadway departure crashes by high risk drivers and
behaviors, crash type and number of lanes. Younger drivers, speed, unrestrained occupants and alcohol were
significant factors in roadway departure and associated with injury severity risks. When roadway departure crashes
are disaggregated by crash type and severity, fixed object crashes were the most prevalent crash type, followed by
overturning and head on crashes. These are the top three crash types resulting in fatalities and/or serious injuries.
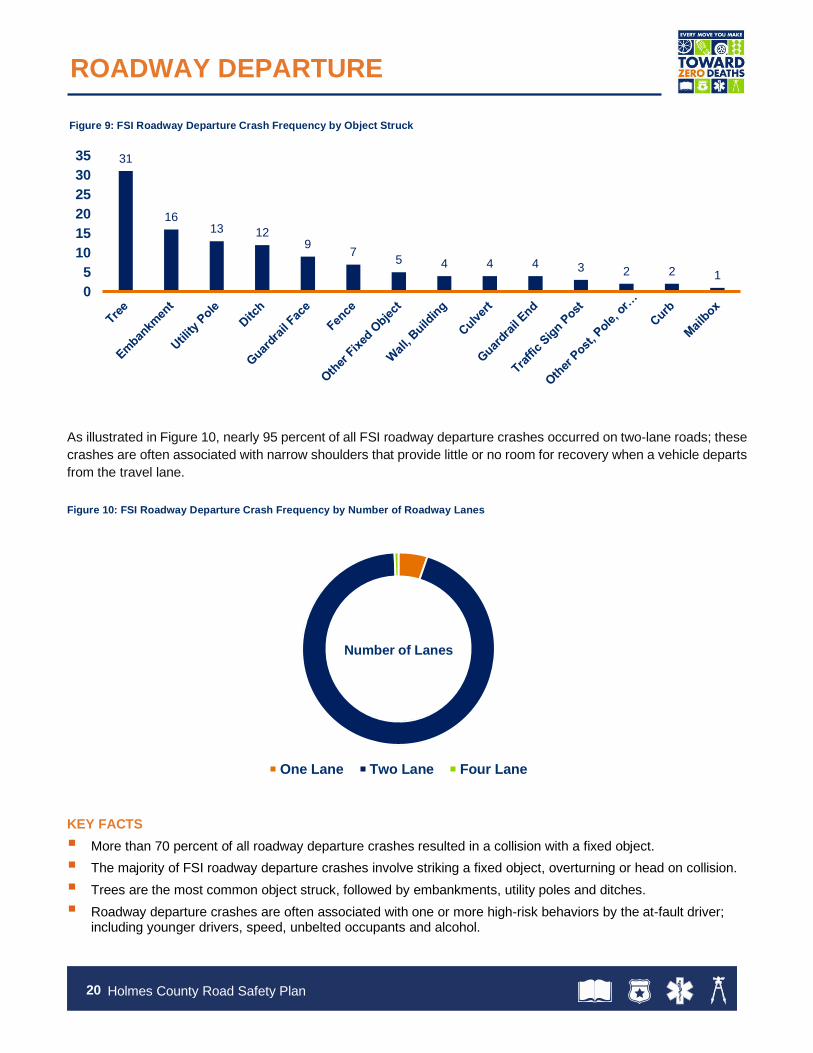
Additionally, trees, embankments, and utility poles were the most common fixed objects struck when a vehicle left
the roadway, as shown in Figure 9.
Figure 7: Roadway Departure Crash Frequency by High Risk Drivers and Behaviors
ROADWAY DEPARTURE
Figure 8: Roadway Departure Crash Frequency by Crash Type
0
50
100
150
200
Younger Drivers Seatbelt Speed Alcohol
Nu
mb
er
of
Cra
sh
es
High Risk Drivers and Behaviors
Yes No
0.0% 10.0% 20.0% 30.0% 40.0% 50.0% 60.0% 70.0% 80.0%
Fixed Object
Parked Vehicle
Overturning
Head On
Sideswipe-Passing
Sideswipe-Meeting
Angle
Left Turn
Other Non-Collision
Percentage of Roadway Departure Crashes
Cra
sh
Typ
e
FSI Roadway Departure Crashes Total Roadway Departure Crashes
20 Holmes County Road Safety Plan
As illustrated in Figure 10, nearly 95 percent of all FSI roadway departure crashes occurred on two-lane roads; these
crashes are often associated with narrow shoulders that provide little or no room for recovery when a vehicle departs
from the travel lane.
KEY FACTS
▪ More than 70 percent of all roadway departure crashes resulted in a collision with a fixed object.
▪ The majority of FSI roadway departure crashes involve striking a fixed object, overturning or head on collision.
▪ Trees are the most common object struck, followed by embankments, utility poles and ditches.
▪ Roadway departure crashes are often associated with one or more high-risk behaviors by the at-fault driver; including younger drivers, speed, unbelted occupants and alcohol.
Figure 10: FSI Roadway Departure Crash Frequency by Number of Roadway Lanes
ROADWAY DEPARTURE
Figure 9: FSI Roadway Departure Crash Frequency by Object Struck
31
1613 12
97
5 4 4 4 3 2 2 1
0
5
10
15
20
25
30
35
One Lane Two Lane Four Lane
Number of Lanes
21 Holmes County Road Safety Plan
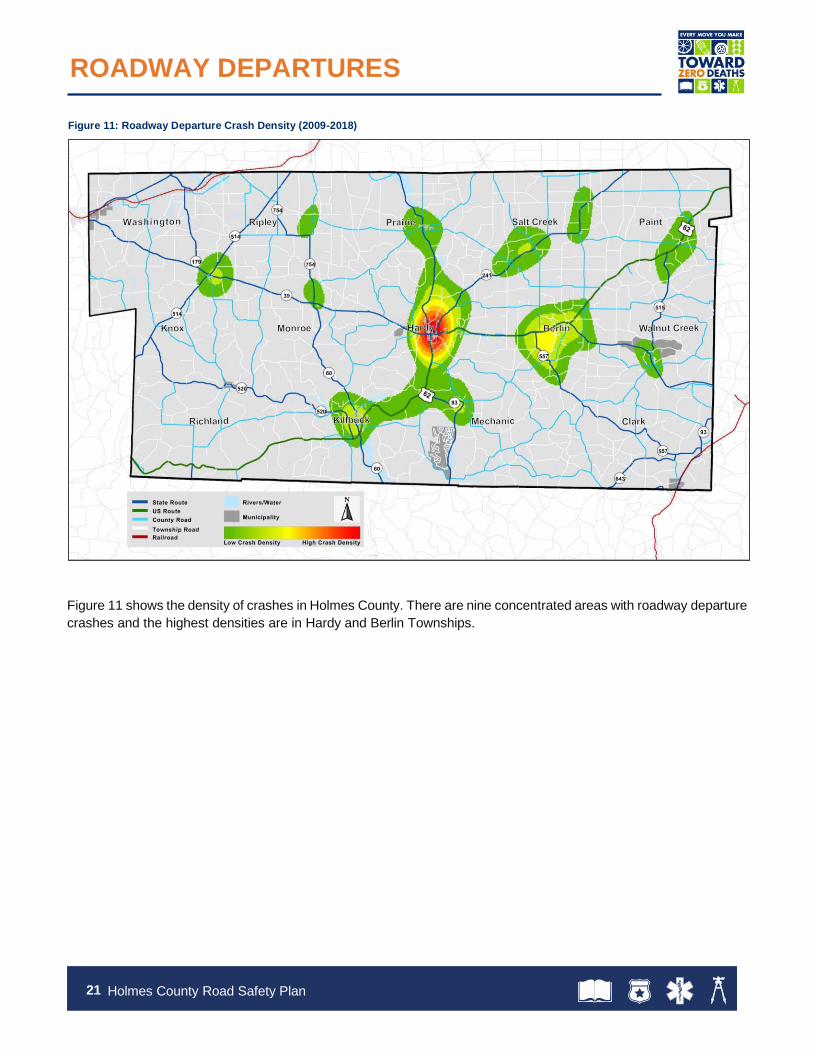
Figure 11 shows the density of crashes in Holmes County. There are nine concentrated areas with roadway departure
crashes and the highest densities are in Hardy and Berlin Townships.
ROADWAY DEPARTURES
Figure 11: Roadway Departure Crash Density (2009-2018)

22 Holmes County Road Safety Plan
Although wearing a seat belt is one of the safest choices that drivers and passengers can make, seatbelt use remains
a safety challenge, especially in rural areas. Lack of seatbelt use contributed to 590 crashes in Holmes County during
the analysis period. A factor in nearly eight percent of Holmes County’s crashes, seatbelt-related crashes resulted in
21 fatalities and 87 serious injuries. Unrestrained crashes contribute to 24 percent of fatality and/or serious injury
crashes.
UNRESTRAINED OCCUPANTS (SEAT BELTS)
Figure 12: Unrestrained Crashes by Select Emphasis Areas (2009-2018)
Figure 13: Top Five Seatbelt-Related FSI Crash Types (2009-2018)
0.0% 10.0% 20.0% 30.0% 40.0% 50.0% 60.0% 70.0%
Younger
Roadway Departure
Speed
Older
Alcohol
Drug
FSI Unrestrained Crashes Total Unrestrained Crashes
47.5%
11.3%
10.0%
5.0%
5.0%
0.0% 5.0% 10.0% 15.0% 20.0% 25.0% 30.0% 35.0% 40.0% 45.0% 50.0%
Fixed Object
Angle
Head On
Overturning
Sideswipe-Passing

23 Holmes County Road Safety Plan
Figure 12 shows the breakdown of unrestrained crashes by emphasis area. Roadway departures are a factor in 65
percent of all unrestrained crashes. Younger drivers (between the ages of 15 and 25) are consistently
overrepresented in unrestrained crashes, with involvement in nearly 50 percent of crashes where occupants were
not wearing seatbelts. Additionally, the percent of impaired (alcohol and/or drugs) and unrestrained occupants
involved in crashes resulting in a fatality and/or serious injury was more than double the comparable percent of all
unrestrained crashes.
As shown in Figure 13, 80 percent of unrestrained crashes were either fixed object, angle, head on, overturning, or
sideswipe-passing. Fixed object crashes alone account for nearly half of all unrestrained crashes. Figure 14 indicates
that more than two-thirds of FSI seatbelt-related crashes occur on state-maintained roadways.
KEY FACTS
▪ Half of all crashes with unrestrained occupants involved younger drivers.
▪ More than 40 percent of road users who died in crashes in Holmes County were unrestrained (21 of 45 fatalities during the analysis period).
▪ More than two thirds of seatbelt related crashes occurred on state facilities. Although there are significantly more county and township roads in Holmes County, speed limits and travel speeds are generally higher on state-maintained roads.
Figure 14: FSI Seatbelt-Related Crashes by Maintaining Authority (2009-2018)
UNRESTRAINED OCCUPANTS (SEAT BELTS)
County State Township

24 Holmes County Road Safety Plan
Figure 15 depicts the density of seatbelt-related crashes across Holmes County. Similar to the trends for other emphasis areas, Hardy and Berlin Townships are among the concentrated crash areas. Killbuck, Salt Creek, Paint, and Walnut Creek Townships are also notable crash areas.
Figure 15: Seatbelt-Related Crash Density (2009-2018)
UNRESTRAINED OCCUPANTS (SEAT BELTS)

25 Holmes County Road Safety Plan
Traffic crashes consistently rank as a leading cause of death in the United States and it is the number one cause of
death for younger drivers (ages 15-25), likely due to an inherent lack of driving experience. Younger drivers were
involved in 42 percent of all reported crashes in Holmes County during the analysis period; this is more than 5 percent
higher than the statewide average. Of those crashes, 133 fatal and serious injury crashes resulted in 20 fatalities and
146 serious injuries.
Younger driver crash statistics reflect the population of younger drivers, Ohio driving laws and licensing, and driver
experience. As shown in Figure 16, younger driver involvement in crashes is lowest for drivers 15 years of age,
typically not licensed drivers but potential drivers of farm equipment and Amish buggies. Younger driver crash
involvement peaks at age 18. In Ohio, drivers younger than age 18 drivers must participate in drivers’ education
programs to obtain a learner’s permit and driver’s license. Most public-school districts in Ohio do not offer in-vehicle
driver training so young drivers need to pay the cost. As such, some young drivers do not obtain licenses until age
18 when driver training is no longer required. As young drivers begin to matriculate in age, their crash involvement
tapers, although drivers ages 15 to 25 are over-represented in overall crash involvement. Fixed object, head on,
sideswipe-passing, angle and left turn crashes are the top five FSI crash types for younger driver crashes in Holmes
County (Figure 17). Roadway departure, lack of seatbelt use, speeding and alcohol are factors in younger driver
crashes resulting in fatalities and/or serious injuries (Figure 18).
0
100
200
300
400
500
600
15 16 17 18 19 20 21 22 23 24 25
Nu
mb
er
of
Cra
sh
es
Driver Age
Figure 16: Younger Driver Crashes (2009-2018)
YOUNGER DRIVERS
Fixed Object
Head On
Sideswipe-Passing
Angle
Left Turn
0.0% 5.0% 10.0% 15.0% 20.0% 25.0% 30.0%
Cra
sh
Typ
e
Percentage of Crashes
Figure 17: Top Five Crash Types for FSI Younger Driver Crashes (2009-2018)

26 Holmes County Road Safety Plan
More than half of young driver FSI crashes in
Holmes County occurred on state roadways;
the number of younger driver FSI crashes on
County and Township roads are similar,
roughly one-fourth of younger driver FSI
crashes (Figure 19).
KEY FACTS
▪ Younger drivers are involved in significantly more crashes than other age groups.
▪ Younger driver crash involvement declines as the driver matriculates in age, even within the young driver age group.
▪ Fixed object crashes are the most prevalent FSI crash type for younger drivers.
▪ Emphasis areas that are factors in young driver crashes are speed, lack of seatbelt use, alcohol and roadway departure.
0.0% 5.0% 10.0% 15.0% 20.0% 25.0% 30.0% 35.0% 40.0% 45.0% 50.0%
Seatbelt
Roadway Departure
Alcohol
Speed
Percentage of Crashes
SH
SP
Em
ph
asis
Are
a
FSI Younger Driver Crashes All Younger Driver Crashes
Figure 18: Younger Driver Crashes by Select Emphasis Areas (2009-2018)
YOUNGER DRIVERS
State Township County
Figure 19: FSI Younger Driver Crashes by Maintaining Authority (2009-2018)
27 Holmes County Road Safety Plan
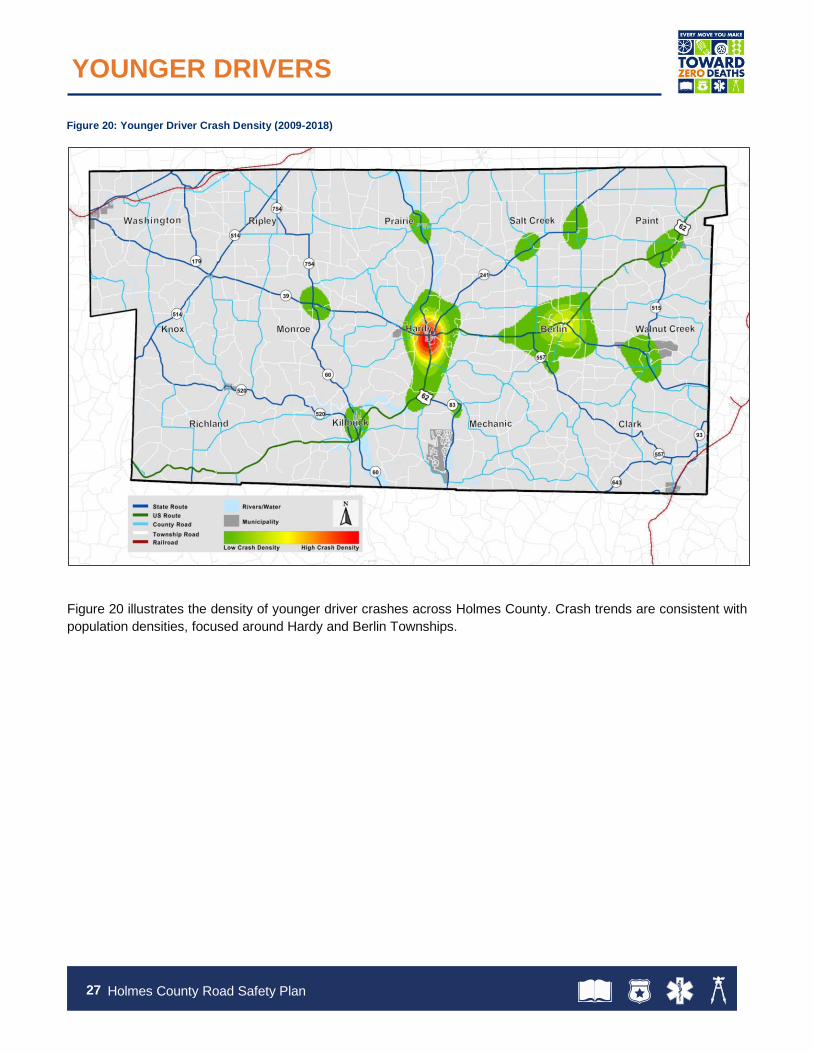
Figure 20 illustrates the density of younger driver crashes across Holmes County. Crash trends are consistent with
population densities, focused around Hardy and Berlin Townships.
YOUNGER DRIVERS
Figure 20: Younger Driver Crash Density (2009-2018)
28 Holmes County Road Safety Plan
In 2016, there were almost 42 million licensed drivers ages 65 and older in the United States, representing a more
than 50 percent increase from 1999 and reflecting the aging Baby Boomer generation (source: FHWA). Although age
does not directly determine driving skill, driving performance is affected by safe driving behaviors, safe decision-
making, crash risks, and physical and mental abilities, all of which may deteriorate with age. Furthermore,
transportation infrastructure, licensing practices and motor vehicle laws are not designed for an aging population.
Understanding these factors, the Toward Zero Deaths initiative must balance older driver mobility with safety for all
road users. Holmes County crash statistics indicate an increased crash risk for older drivers (age 65 and older). They
were involved in 17 percent of reported crashes during the analysis period. Of these older driver crashes, 122 fatal
and serious injury crashes resulted in 14 fatalities and 73 serious injuries.
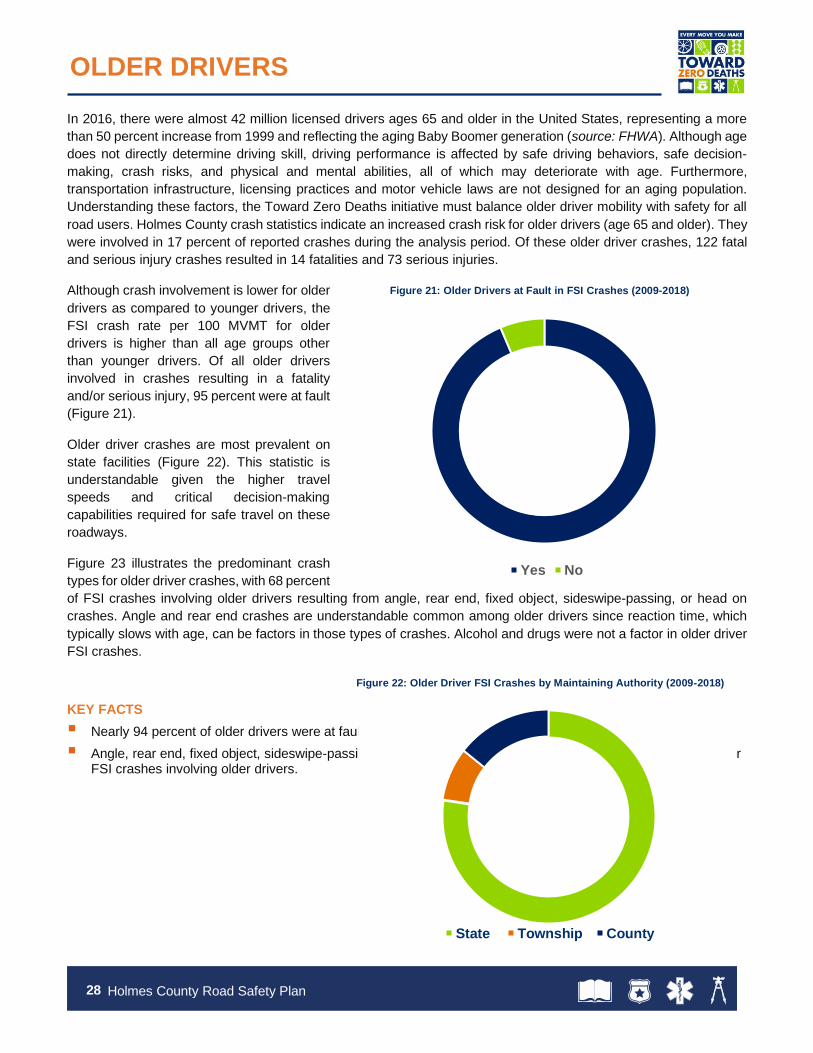
Although crash involvement is lower for older
drivers as compared to younger drivers, the
FSI crash rate per 100 MVMT for older
drivers is higher than all age groups other
than younger drivers. Of all older drivers
involved in crashes resulting in a fatality
and/or serious injury, 95 percent were at fault
(Figure 21).
Older driver crashes are most prevalent on
state facilities (Figure 22). This statistic is
understandable given the higher travel
speeds and critical decision-making
capabilities required for safe travel on these
roadways.
Figure 23 illustrates the predominant crash
types for older driver crashes, with 68 percent
of FSI crashes involving older drivers resulting from angle, rear end, fixed object, sideswipe-passing, or head on
crashes. Angle and rear end crashes are understandable common among older drivers since reaction time, which
typically slows with age, can be factors in those types of crashes. Alcohol and drugs were not a factor in older driver
FSI crashes.
KEY FACTS
▪ Nearly 94 percent of older drivers were at fault in all reported older driver-related crashes.
▪ Angle, rear end, fixed object, sideswipe-passing, and head on crashes were the most prevalent crash types for FSI crashes involving older drivers.
OLDER DRIVERS
Figure 21: Older Drivers at Fault in FSI Crashes (2009-2018)
Yes No
State Township County
Figure 22: Older Driver FSI Crashes by Maintaining Authority (2009-2018)

29 Holmes County Road Safety Plan
Figure 24 shows the density of older driver crashes in Holmes County. Older driver crash density is consistent with
population density. Hardy Township has the highest crash density, followed by Berlin Township.
OLDER DRIVERS
Figure 23: Prevalent FSI Crash Types for Older Drivers (2009-2018)
Figure 24: Older Driver Crash Density (2009-2018)
Angle
Rear End
Fixed Object
Sideswipe-Passing
Head On
0.0% 2.0% 4.0% 6.0% 8.0% 10.0% 12.0% 14.0% 16.0% 18.0%
Cra
sh
Typ
e
Percentage of Crashes

30 Holmes County Road Safety Plan
Bicycle crashes contributed to less than 1 percent of all reported crashes in Holmes County during the analysis period
but with those 56 crashes, there were 2 fatalities and 17 serious injuries. When FSI bicycle crash counts are
normalized using a five-year rolling average, bicycle crashes are relatively consistent over the analysis period.
Although the frequency of bicycle crashes is relatively low when compared to other Holmes County emphasis areas,
bicycle crashes warrant attention and should be addressed given the severity of such crashes and the demographics
often associated with bicycle travel.
Ohio law requires bicyclists to follow the “rules of the road” and bicycles are to be treated as vehicles with the same
rights and responsibilities as motorized vehicles. However, bicycling on the road involves safety-related challenges.
Bicycles are more difficult to see than motor vehicles due to their size and typical profile. Bicyclists can be especially
difficult to see at night, unless the bicyclist uses front and rear lights along with reflective apparel. As shown in Figure
25, 34 percent of bicycle crashes occurred under dark (or unknown) lighting conditions. Another challenge relates to
speed differential between slower moving bicycles and faster motor vehicles; 61 percent of bicycle crashes in Holmes
County occurred on roads with a posted speed of 55 mph. In Holmes County, lack of bicycle infrastructure is another
factor in bicycle crashes.
Bicycle crashes on state-maintained facilities account for 48 percent of bicycle-related deaths and serious injuries in
Holmes County, with all but one of the 56 crashes occurring on two lane roads. Furthermore, 38 percent of bicycle
crashes occurred at intersections. Based on the crash data, 84 percent of bicyclists were cited as being at fault, but
this may reflect a reporting/citation bias.
Dark-Roadway Not Lighted Dawn Daylight Dusk Other
BICYCLES
Figure 25: Bicycle Crashes by Lighting Condition (2009-2018)

31 Holmes County Road Safety Plan
KEY FACTS
▪ 77 percent of Holmes County bicycle crashes occurred on roadways with a posted speed limit of 45 mph or higher.
▪ Roughly one-third of bicycle crashes occurred in dark (or unknown) lighting conditions.
15
25
45
50
55
0% 10% 20% 30% 40% 50% 60% 70%
Po
ste
d S
peed
Lim
it
Percentage of Crashes
BICYCLES
Figure 26: Bicycle Crashes by Posted Speed Limit (2009-2018)
Figure 27: Bicycle by Maintaining Authority (2009-2018)
State County Township

32 Holmes County Road Safety Plan
Figure 28 shows the density of bicycle crash clusters in Holmes County with five primary areas of concentrations of
bicycle crashes. The highest crash density areas are Berlin, Hardy and Salt Creek Townships.
BICYCLES
Figure 28: Bicycle Crash Density (2009-2018)

33 Holmes County Road Safety Plan
Pedestrian crashes are defined as any person on foot, walking, running, jogging, hiking, sitting, or lying down who is
involved in a motor vehicle crash. Like other vulnerable road users, pedestrians are unprotected when sharing the
road with other motorized and non-motorized users. The frequency of pedestrian crashes in Holmes County is very
low compared to other emphasis areas. However, due to the significant Amish population and the serious
consequences associated with pedestrian crashes (32 percent resulted in a fatal or serious injury), pedestrian
crashes are an identified emphasis area for Holmes County.
There were three fatalities and six serious injuries associated with the 25 reported pedestrian crashes in Holmes
County during the analysis period. The likelihood of a pedestrian crash being reported increases with the severity of
injury, so pedestrian crashes that do not result in injury may be under-reported, potentially skewing the data analysis.
Due to the low number of crashes for the analysis period, pedestrian crash counts were normalized using five-year
rolling averages which show an upward trend in the number of pedestrian crashes during the analysis period. The
crash trends illustrated in Figure 29 indicate an increase in pedestrian crashes
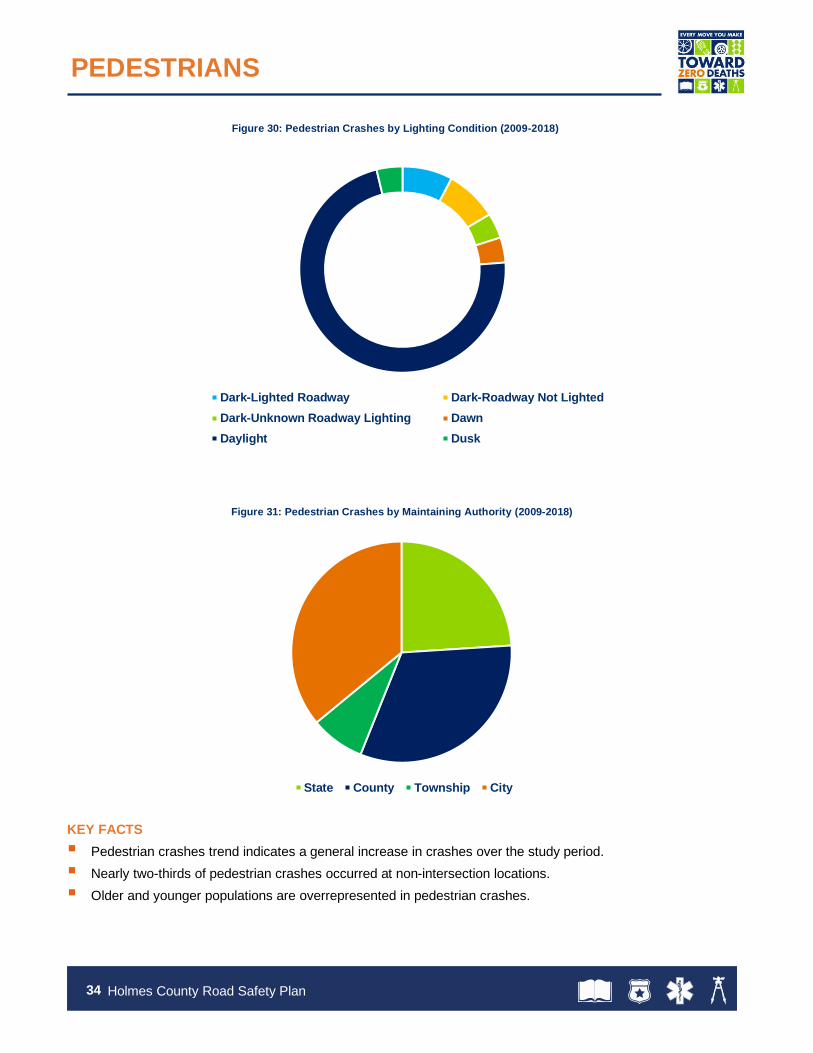
Pedestrians ages 13 and younger and 65 and older (35 and 23 percent, respectively) account for a combined 58
percent of all pedestrians struck. Furthermore, 64 percent of all pedestrian crashes occurred at non-intersection
locations, a reflection of the lack of sidewalks throughout the County. The lack of pedestrian infrastructure likely
contributes to unintended and undesired interactions between motor vehicles and pedestrians. Like the other
emphasis areas, the majority of pedestrian crashes occurred on roads maintained by the state. Additionally, 93
percent of the pedestrians were cited as being at fault although, like bicycle crashes, this this may reflect a
reporting/citation bias.
PEDESTRIANS
Figure 29: Five-Year Rolling Average of Pedestrian Crash Counts (2010-2018)
0
0.5
1
1.5
2
2.5
3
2010-2014 2011-2015 2012-2016 2013-2017 2014-2018
34 Holmes County Road Safety Plan
KEY FACTS
▪ Pedestrian crashes trend indicates a general increase in crashes over the study period.
▪ Nearly two-thirds of pedestrian crashes occurred at non-intersection locations.
▪ Older and younger populations are overrepresented in pedestrian crashes.
Dark-Lighted Roadway Dark-Roadway Not Lighted
Dark-Unknown Roadway Lighting Dawn
Daylight Dusk
State County Township City
PEDESTRIANS
Figure 30: Pedestrian Crashes by Lighting Condition (2009-2018)
Figure 31: Pedestrian Crashes by Maintaining Authority (2009-2018)
35 Holmes County Road Safety Plan
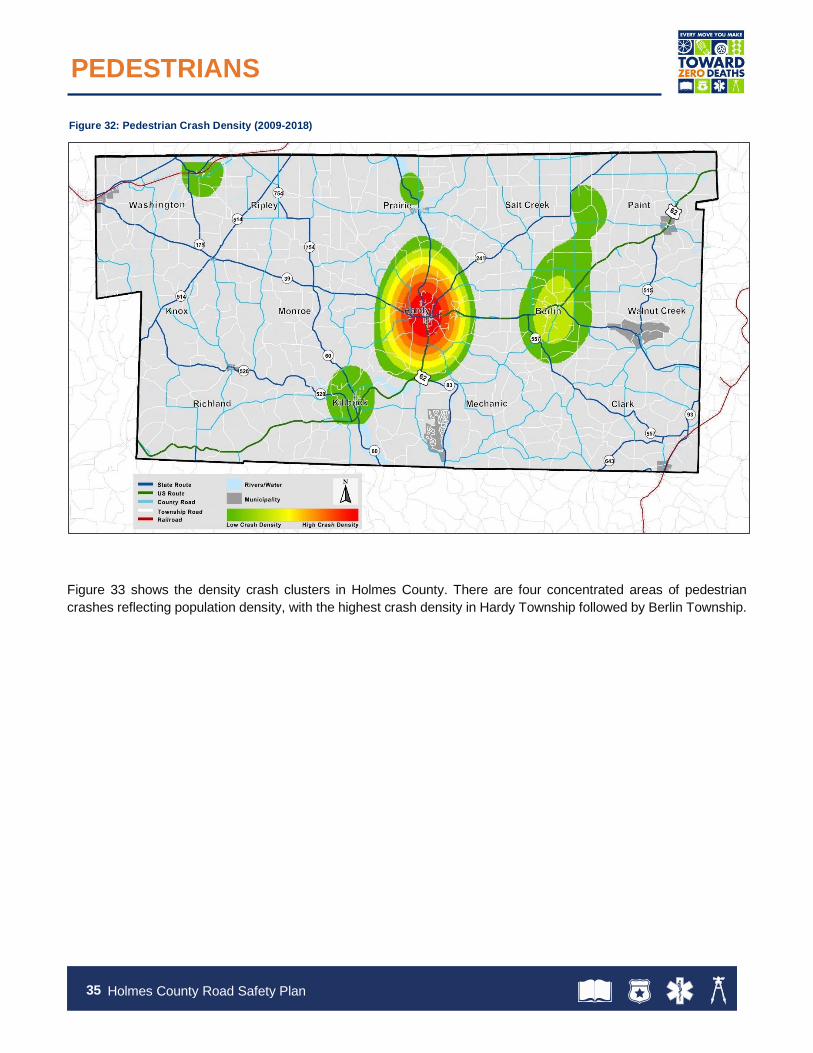
Figure 33 shows the density crash clusters in Holmes County. There are four concentrated areas of pedestrian
crashes reflecting population density, with the highest crash density in Hardy Township followed by Berlin Township.
PEDESTRIANS
Figure 32: Pedestrian Crash Density (2009-2018)

36 Holmes County Road Safety Plan
Motorcycles are inherently dangerous due to the lack of rider protection, the small vehicle frame, the ability to reach
high/excessively high speeds in a short amount of time and over a short distance, and the instability associated with
the motorcycle’s two-wheel base. Furthermore, Ohio’s helmet law applies to riders under the age of 18 so many adult
motorcycle riders do not wear helmets, thereby increasing the likelihood of severe injury or death in the event of a
crash. Often under-represented in state and national vehicle registrations but over-represented in fatal and serious
injury crashes, motorcycles accounted for only 2 percent of all crashes reported in Holmes County during the analysis
period. Of the reported crashes, 172 crashes resulted in 7 fatalities and 69 serious injuries. The number of motorcycle-
related fatalities represents 15 percent of the total fatalities in Holmes County; this is consistent with national trends.
Figure 33 illustrates the distribution of motorcycle crashes in Holmes County by common SHSP emphasis areas, with
separate identification of total and FSI crashes. There is not much difference between the two categories, indicating
that factors associated with motorcycle crashes do not appear to significantly impact injury severity. Roadway
departure, alcohol and/or drug-related crashes were found to be slightly more prevalent in FSI motorcycle crashes.
MOTORCYCLES
Figure 33: Motorcycle Crashes by Common SHSP Emphasis Areas (2009-2018)
0%
10%
20%
30%
40%
50%
60%
RoadwayDeparture
Intersection Alcohol Speed Older Driver Younger Driver Drugs
Per
cen
tage
of
Cra
shes
All Motorcycle Crashes FSI Motorcycle Crashes
37 Holmes County Road Safety Plan
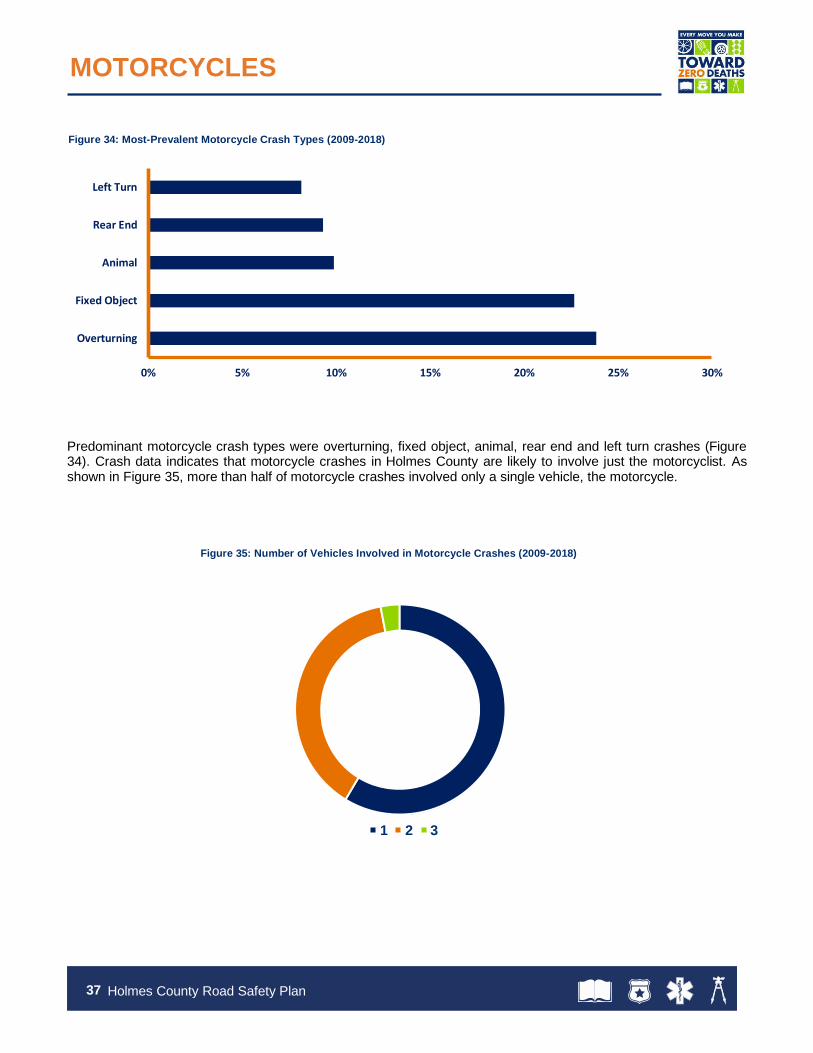
Predominant motorcycle crash types were overturning, fixed object, animal, rear end and left turn crashes (Figure 34). Crash data indicates that motorcycle crashes in Holmes County are likely to involve just the motorcyclist. As shown in Figure 35, more than half of motorcycle crashes involved only a single vehicle, the motorcycle.
1 2 3
Figure 34: Most-Prevalent Motorcycle Crash Types (2009-2018)
Figure 35: Number of Vehicles Involved in Motorcycle Crashes (2009-2018)
0% 5% 10% 15% 20% 25% 30%
Overturning
Fixed Object
Animal
Rear End
Left Turn
MOTORCYCLES

38 Holmes County Road Safety Plan
Figure 36 shows the monthly variation of motorcycle crashes. Due to the seasonality of motorcycle riding in Ohio,
motorcycle crashes are more common between April and October, peaking in September. Very few crashes occur
during the colder months between November and March.
Similar to other emphasis areas, younger and older riders show higher incidence of motorcycle crash involvement as compared to other age groups (Figure 37). As shown in Figure 38, 60 percent of motorcycle crashes occurred on state roads.
0
5
10
15
20
25
30
35
0
5
10
15
20
25
30
35
40
45
15-25 26-34 35-44 45-54 55-64 65+ Unknown
Nu
mb
er o
f C
rash
es
Age Groups
MOTORCYCLES
Figure 36: Motorcycle Crashes by Month (2009-2018)
Figure 37: Motorcycle Crash Involvement by Age Groups (2009-2018)

39 Holmes County Road Safety Plan
KEY FACTS
▪ Although motorcycles accounted for only two percent of all crashes reported in Holmes County during the analysis period, motorcycle-related fatalities represent 15 percent of total fatalities; this is consistent with national trends.
▪ More than half of motorcycle crashes (59%) were single vehicle crashes.
▪ Younger and older riders show higher motorcycle crash involvement than other age groups.
Figure 39 shows the density of motorcycle crash clusters in Holmes County. Seven areas experience concentrations
of motorcycle-related crashes, with the highest density areas in Hardy, Berlin, and Washington Townships.
MOTORCYCLES
Figure 39: Motorcycle Crash Density (2009-2018)
Figure 38: FSI Motorcycle Crashes by Maintaining Authority (2009-2018)
State County Township
40 Holmes County Road Safety Plan
The Holmes County Amish population makes up less than one percent of Ohio’s population, but it represents 42
percent of the Holmes County population (2018 census data) and is expected to become the majority population
group within 15 years. Amish buggy crashes are common in Ohio, especially in Holmes County. There were 243
reported crashes involving a horse-drawn Amish buggy during the analysis period with 29 crashes resulting in six
fatalities and 31 serious injuries.
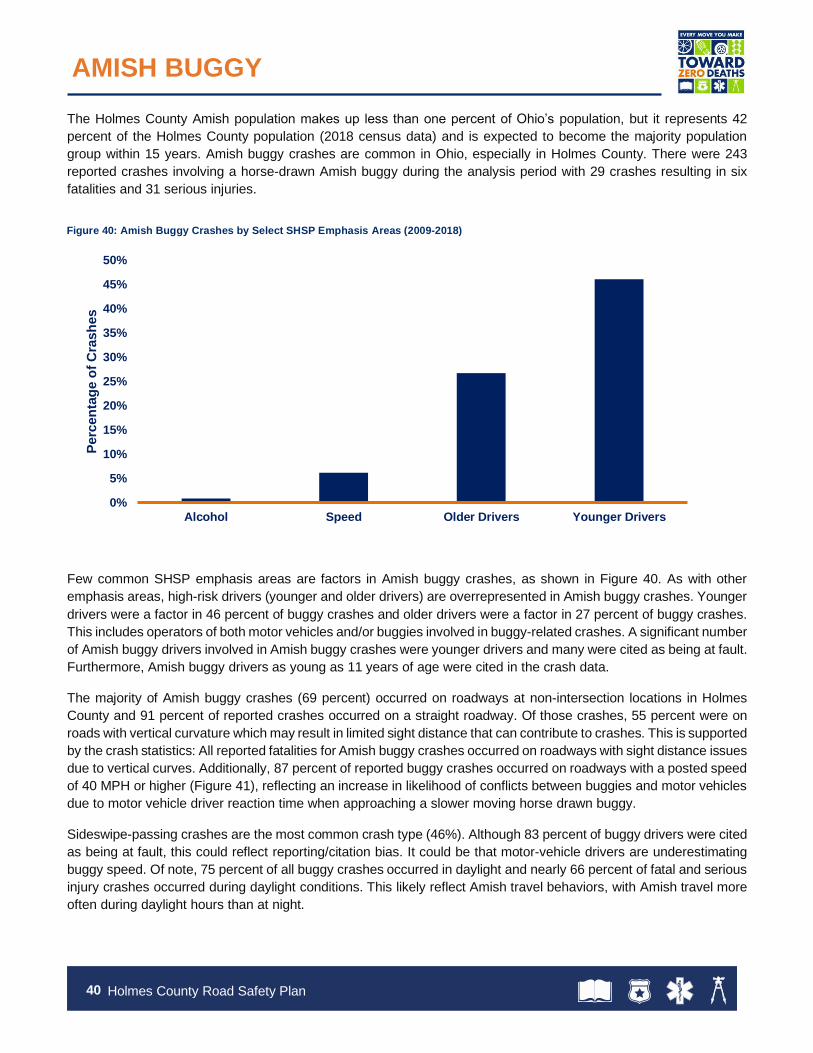
Few common SHSP emphasis areas are factors in Amish buggy crashes, as shown in Figure 40. As with other
emphasis areas, high-risk drivers (younger and older drivers) are overrepresented in Amish buggy crashes. Younger
drivers were a factor in 46 percent of buggy crashes and older drivers were a factor in 27 percent of buggy crashes.
This includes operators of both motor vehicles and/or buggies involved in buggy-related crashes. A significant number
of Amish buggy drivers involved in Amish buggy crashes were younger drivers and many were cited as being at fault.
Furthermore, Amish buggy drivers as young as 11 years of age were cited in the crash data.
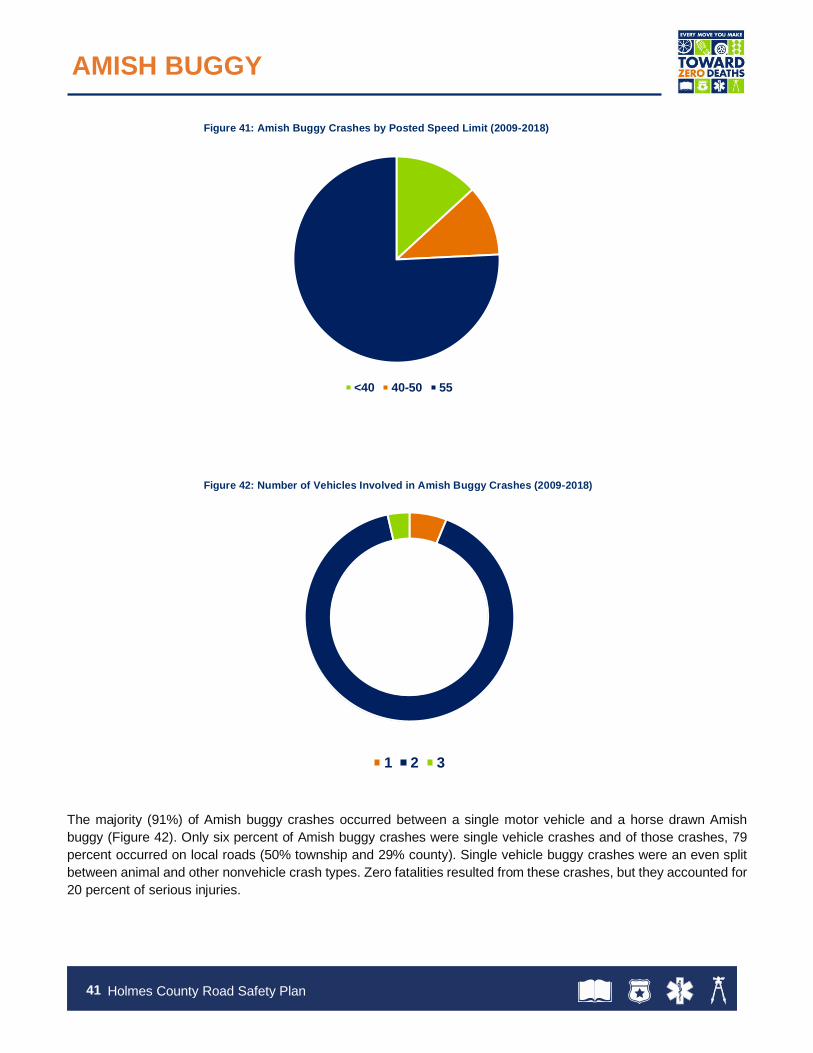
The majority of Amish buggy crashes (69 percent) occurred on roadways at non-intersection locations in Holmes
County and 91 percent of reported crashes occurred on a straight roadway. Of those crashes, 55 percent were on
roads with vertical curvature which may result in limited sight distance that can contribute to crashes. This is supported
by the crash statistics: All reported fatalities for Amish buggy crashes occurred on roadways with sight distance issues
due to vertical curves. Additionally, 87 percent of reported buggy crashes occurred on roadways with a posted speed
of 40 MPH or higher (Figure 41), reflecting an increase in likelihood of conflicts between buggies and motor vehicles
due to motor vehicle driver reaction time when approaching a slower moving horse drawn buggy.
Sideswipe-passing crashes are the most common crash type (46%). Although 83 percent of buggy drivers were cited
as being at fault, this could reflect reporting/citation bias. It could be that motor-vehicle drivers are underestimating
buggy speed. Of note, 75 percent of all buggy crashes occurred in daylight and nearly 66 percent of fatal and serious
injury crashes occurred during daylight conditions. This likely reflect Amish travel behaviors, with Amish travel more
often during daylight hours than at night.
0%
5%
10%
15%
20%
25%
30%
35%
40%
45%
50%
Alcohol Speed Older Drivers Younger Drivers
Perc
en
tag
e o
f C
rash
es
AMISH BUGGY
Figure 40: Amish Buggy Crashes by Select SHSP Emphasis Areas (2009-2018)
41 Holmes County Road Safety Plan
The majority (91%) of Amish buggy crashes occurred between a single motor vehicle and a horse drawn Amish
buggy (Figure 42). Only six percent of Amish buggy crashes were single vehicle crashes and of those crashes, 79
percent occurred on local roads (50% township and 29% county). Single vehicle buggy crashes were an even split
between animal and other nonvehicle crash types. Zero fatalities resulted from these crashes, but they accounted for
20 percent of serious injuries.
AMISH BUGGY
Figure 41: Amish Buggy Crashes by Posted Speed Limit (2009-2018)
<40 40-50 55
1 2 3
Figure 42: Number of Vehicles Involved in Amish Buggy Crashes (2009-2018)
42 Holmes County Road Safety Plan
KEY FACTS
▪ 100 percent of the fatalities resulting from Amish buggy crashes occurred on straight roadways with vertical curves.
▪ Nearly 90 percent of Amish buggy crashes occurred on roadways with posted speed limits of 40 MPH or higher.
▪ 75 percent of Amish buggy crashes occurred during daylight hours and nearly 66 percent of fatalities and serious injuries occurred during daylight conditions.
▪ Younger Amish buggy drivers (11-25 years old) are over-represented in Amish buggy crashes.
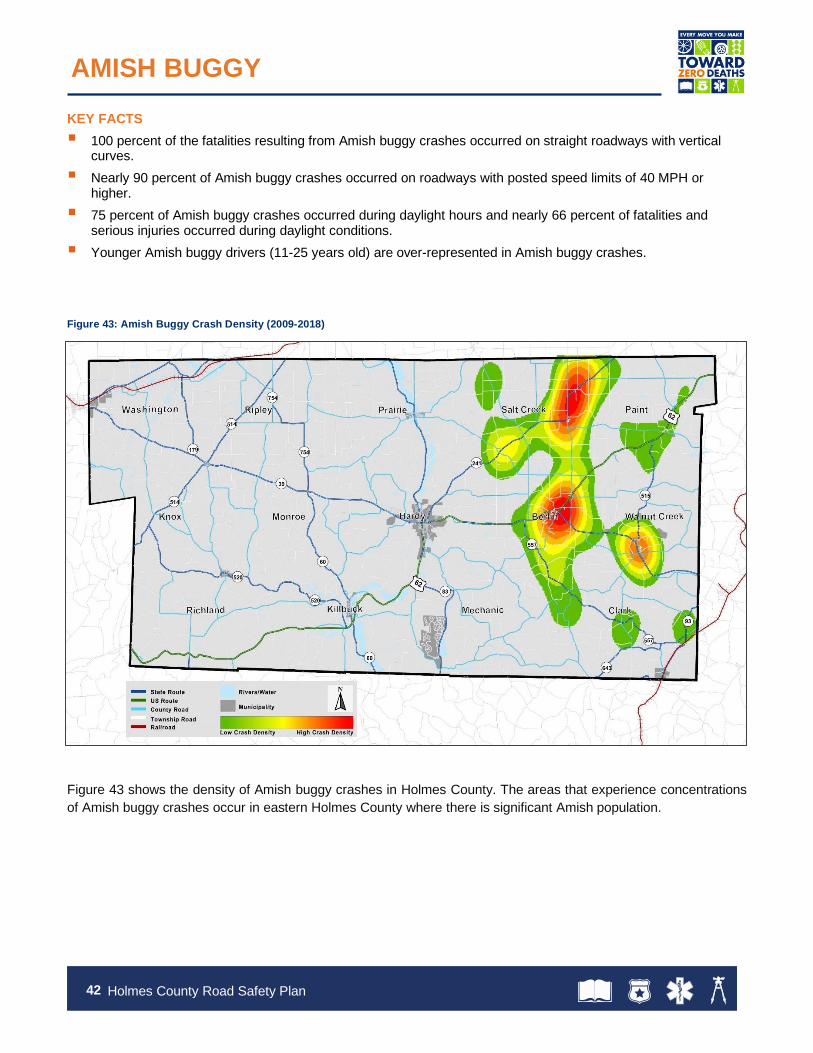
Figure 43 shows the density of Amish buggy crashes in Holmes County. The areas that experience concentrations
of Amish buggy crashes occur in eastern Holmes County where there is significant Amish population.
AMISH BUGGY
Figure 43: Amish Buggy Crash Density (2009-2018)
43 Holmes County Road Safety Plan
Implementation & Action Plan
Creating a Safer Roadway System
SECTION CONTENT:
Roadway Departure Intersection Young Driver Commercial/Farm Vehicles
Priority Locations Priority Segments

44 Holmes County Road Safety Plan
6 IMPLEMENTATION & ACTION PLAN – CREATING A SAFER ROADWAY SYSTEM
The Holmes County Road Safety Plan outlines strategies to address County transportation safety issues, focusing
on the identified emphasis areas of roadway departures, unbelted drivers, younger drivers, older drivers, bicyclists,
pedestrians, motorcycles and Amish buggies. The plan identifies priority corridors, road segments and intersections
that would benefit from safety improvements. The recommendations, including projects, measures and strategies to
reduce FSI crashes, were informed by data analysis, proven crash mitigation strategies and stakeholder input. Plan
recommendations are intended to be implemented over the next five years, with annual evaluations to assess
effectiveness of the programs, projects and policies in helping to achieve performance goals that support the Toward
Zero Deaths initiative. The action plan incorporates a combination of strategies from the six E’s of traffic safety:
education, encouragement, engineering, enforcement, evaluation, and equity.
ROADWAY DEPARTURES
Implementation of safety projects along roadway corridors and specific segments and at intersection will minimize the potential for crashes resulting in fatalities and/or serious injuries.
UNBELTED DRIVERS
Implementation of these strategies and actions will ensure the public and stakeholders are educated about seat belt use; employers are promoting safety in the workplace; and education and enforcement campaigns are effectively utilized.
YOUNGER DRIVERS
Implementation of these strategies and actions will ensure young drivers are well-educated about the risks associated with driving through peer-to-peer efforts, resource materials, and law enforcement engagement.
OLDER DRIVERS
Implementation of these strategies and actions will ensure older drivers are re-educated about the risks associated with driving through peer-to-peer efforts, resource materials, and law enforcement engagement.
BICYCLISTS Implementation of safety projects along corridors or at specific segments and intersections will minimize the chances of bicycle fatalities or serious injuries occurring.
PEDESTRIANS Implementation of safety projects along corridors or at specific segments and intersections will minimize the chances of pedestrian fatalities or serious injuries occurring.
MOTORCYCLES
Implementation of these strategies and actions will ensure the public and stakeholders are educated about sharing the road with motorcyclists; safety projects along corridors or at specific segments and intersections will minimize the chances of motorcyclist fatalities or serious injuries.
AMISH BUGGIES
Implementation of these strategies and actions will ensure the public and stakeholders are educated about sharing the road with buggies; safety projects along corridors or at specific segments and intersections will minimize the chances of buggy fatalities or serious injuries occurring.
Implementation & Action Plan – Creating a Safer Roadway System
Implementation & Action Plan – Creating a Safer Roadway System

PRIORITY INTERSECTIONS AND SEGMENTS
45 Holmes County Road Safety Plan – Action Plan
6.6 PRIORITY INTERSECTIONS
Factors contributing to crashes are over-represented at some intersections. Based on a combination of crash analysis and stakeholder input, the plan identifies
areas within Holmes County that should be studied further to identify location-specific crash mitigation strategies and countermeasures, as listed in Table 10.
Table 10. Top 25 Crash Intersections in Holmes County
Name of Location Local Rank
State Rank
Maintaining Authority
Total Crashes (Freq.)
Fatal Crashes
Serious Injury
Crashes
Minor Injury
Crashes
Possible Injury
Crashes PDO
Emphasis Area
Overlap
SR-39 & CR-114 1 -- ODOT; Holmes County
28 2 2 6 3 15 RWD; YD; MC; OD; SB; AB
US-62 (Millersburg Rd.) & SR-83
2 -- ODOT; Mechanic Twp.
20 0 2 8 0 10 RWD; YD; OD; SB
SR-241 (Massillon Rd.) & CR-201
3 -- Holmes County; Salt Creek Twp.
14 1 2 4 0 7 RWD; YD; MC; OD; SB
SR-179 & SR-3/Wooster Rd.
4 -- ODOT; Holmes County
17 0 2 4 1 10 RWD; YD; OD; SB
US-62/SR-39 & CR-201 5 -- ODOT; Holmes County
30 0 2 7 1 20 RWD; YD; OD; SB; BC; AB
SR-557 & CR-114 & TR-183
6 -- ODOT; Holmes County; Clark Twp.
18 0 2 2 0 14 RWD; YD; MC; OD; SB; AB
US-62/SR-39 & TR-353 7 -- ODOT 21 0 1 7 2 11 RWD; YD; OD; SB
SR-83 (Millersburg Rd.) & CR-1/Harrison Rd.
8 -- ODOT; Holmes County
9 0 1 2 1 5 RWD; YD; OD
PRIORITY INTERSECTIONS AND SEGMENTS
46 Holmes County Road Safety Plan – Action Plan
Name of Location Local Rank
State Rank
Maintaining Authority
Total Crashes (Freq.)
Fatal Crashes
Serious Injury
Crashes
Minor Injury
Crashes
Possible Injury
Crashes PDO
Emphasis Area
Overlap
SR-241 (Massillon Rd.) & CR-216 (Kidron Rd.)/TR-656
9 -- Paint Twp. 18 0 1 5 1 11 RWD; YD; OD; SB; AB
SR-39 & TR-405 10 -- Walnut Creek Twp. 11 1 0 3 0 7 RWD; YD; OD; BC; AB
US-62 & TR-652 10 -- ODOT; Berlin Twp.; Walnut Creek Twp.
12 0 1 2 0 9 RWD; YD; OD; SB; AB
US-62/SR-39 & CR-623 12 -- ODOT; Holmes County
8 0 1 2 0 5 RWD; YD; OD; AB
SR-39 & CR-77/TR-367 13 -- ODOT; Holmes County; Berlin Twp.
28 0 2 3 0 23 RWD; YD; OD; SB; BC; AB
SR-93 & CR-70/TR-167 14 -- Clark Twp. 7 0 1 2 2 2 RWD; YD; MC; OD; SB; AB
US-62 & CR-186 15 -- ODOT; Holmes County; Paint Twp.
7 0 1 1 0 5 RWD; YD; MC; OD; SB
US-62/SR-39 (Jackson St.) & Briar Ln./Lakeview Dr.
16 -- Millersburg 22 0 1 3 4 14 RWD; YD; OD; SB
SR-241 (Massillon Rd.) & TR-614
17 -- Salt Creek Twp. 7 1 2 0 1 5 RWD; YD; OD; SB; BC
SR-83 & TR-568 18 -- Hardy Twp. 9 0 1 1 2 5 RWD; YD; MC; OD; SB; AB
PRIORITY INTERSECTIONS AND SEGMENTS
47 Holmes County Road Safety Plan – Action Plan
Name of Location Local Rank
State Rank
Maintaining Authority
Total Crashes (Freq.)
Fatal Crashes
Serious Injury
Crashes
Minor Injury
Crashes
Possible Injury
Crashes PDO
Emphasis Area
Overlap
Dalbey Ln./Edgar St. 19 -- Berlin Twp. 17 0 1 3 1 12 RWD; YD; OD; MC
SR-83/W Main Street 20 -- Holmesville 17 0 1 1 3 12 YD; MC; OD; BC; AB
US-62/SR-83 & Logsdon Ave.
21 -- Millersburg 16 0 1 1 3 11 RWD; YD; OD; SB; PD
SR-60/Carpenter Street 22 -- Killbuck 6 0 1 1 0 4 RWD; YD
SR-241 & CR-77 23 -- Holmes County; Salt Creek Twp.
8 1 0 1 0 6 RWD; YD; MC; OD; SB; AB
SR-60/Front Street 24 -- Killbuck 9 1 0 0 1 7 RWD; YD; MC; OD
SR-39 & TR-422 25 -- Walnut Creek Twp. 5 0 1 0 0 4 RWD; SB; BC
RWD – Roadway Departure, YD – Young Driver, MC – Motorcycle, OD – Old Driver, SB – Seat Belt, BC – Bicycle, PD – Pedestrian, AB – Amish Buggy
PRIORITY INTERSECTIONS AND SEGMENTS
48 Holmes County Road Safety Plan – Action Plan
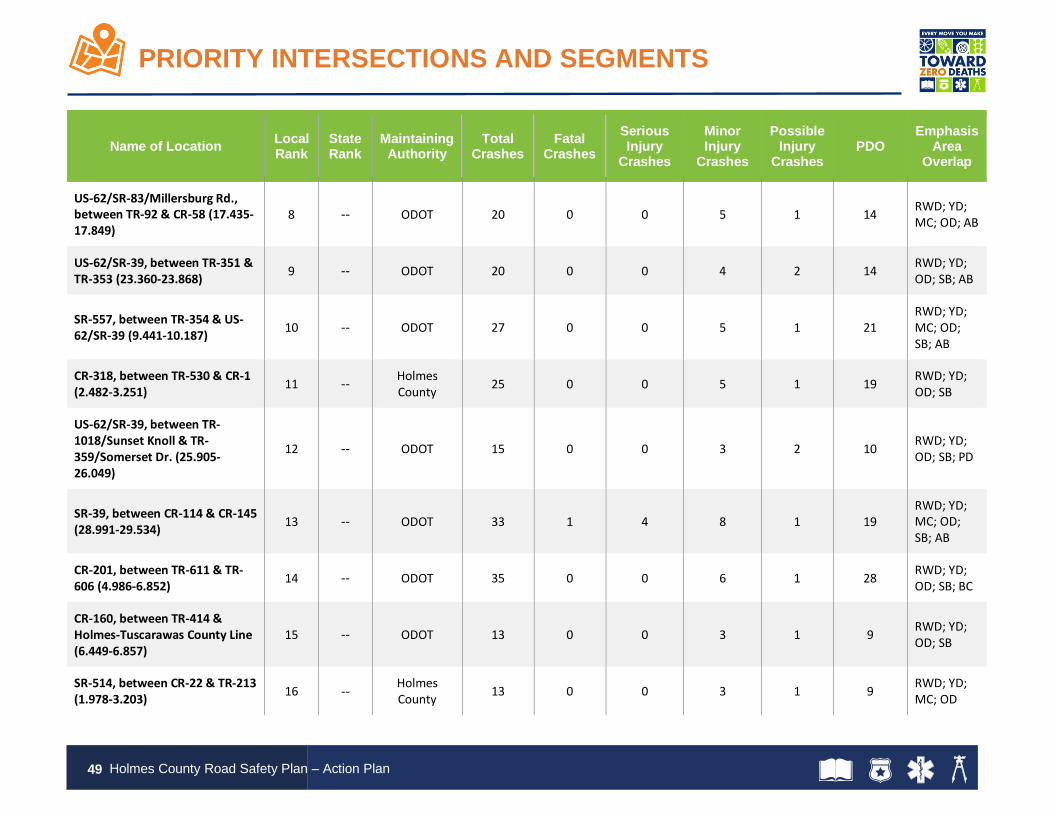
6.7 PRIORITY SEGMENTS
Factors contributing to crashes are over-represented along certain corridors and, more specifically, within some specific roadway corridor segments. Based
on a combination of crash analysis and stakeholder input, the plan identifies areas within Holmes County that should be studied further to identify location-
specific crash mitigation strategies and countermeasures.
Table 11. Top 25 Crash Segments in Holmes County
Name of Location Local Rank
State Rank
Maintaining Authority
Total Crashes
Fatal Crashes
Serious Injury
Crashes
Minor Injury
Crashes
Possible Injury
Crashes PDO
Emphasis Area
Overlap
US-62/SR-83/Washington St., between CR-58 & Glen Dr. (7.676-8.121)
1 -- ODOT 82 0 1 9 14 58 RWD; YD; MC; OD; SB
US-62/Millersburg Rd., between CR-662 & TR-86 (14.175-15.403)
2 -- ODOT 34 0 0 10 0 24 RWD; YD; MC; OD; SB
SR-83/Wooster Rd., between TR-334 & TR-568 (11.156-11.939)
3 -- ODOT 29 0 0 6 3 20 RWD; YD; OD; SB; AB
SR-83/N Clay St., between US-62/SR-39 and Clinton St. (9.021-9.111)
4 -- ODOT 30 0 0 5 5 20 RWD; YD; MC; OD
US-62/SR-83/Washington St., between Monroe St. and Quail St. (8.478-8.632)
5 -- ODOT 22 0 0 1 8 13 YD; OD; SB
US-62/SR-39/E Main St., between Martins Creek & W CR-626 (24.412-25.080)
6 -- ODOT 42 0 0 8 2 32 RWD; YD; OD; SB; AB
US-62/SR-39, between CR-625 E & TR-353 (21.095-21.603)
7 -- ODOT 20 0 0 4 3 13 RWD; YD; MC; OD; SB; AB
PRIORITY INTERSECTIONS AND SEGMENTS
49 Holmes County Road Safety Plan – Action Plan
Name of Location Local Rank
State Rank
Maintaining Authority
Total Crashes
Fatal Crashes
Serious Injury
Crashes
Minor Injury
Crashes
Possible Injury
Crashes PDO
Emphasis Area
Overlap
US-62/SR-83/Millersburg Rd., between TR-92 & CR-58 (17.435-17.849)
8 -- ODOT 20 0 0 5 1 14 RWD; YD; MC; OD; AB
US-62/SR-39, between TR-351 & TR-353 (23.360-23.868)
9 -- ODOT 20 0 0 4 2 14 RWD; YD; OD; SB; AB
SR-557, between TR-354 & US-62/SR-39 (9.441-10.187)
10 -- ODOT 27 0 0 5 1 21 RWD; YD; MC; OD; SB; AB
CR-318, between TR-530 & CR-1 (2.482-3.251)
11 -- Holmes County
25 0 0 5 1 19 RWD; YD; OD; SB
US-62/SR-39, between TR-1018/Sunset Knoll & TR-359/Somerset Dr. (25.905-26.049)
12 -- ODOT 15 0 0 3 2 10 RWD; YD; OD; SB; PD
SR-39, between CR-114 & CR-145 (28.991-29.534)
13 -- ODOT 33 1 4 8 1 19 RWD; YD; MC; OD; SB; AB
CR-201, between TR-611 & TR-606 (4.986-6.852)
14 -- ODOT 35 0 0 6 1 28 RWD; YD; OD; SB; BC
CR-160, between TR-414 & Holmes-Tuscarawas County Line (6.449-6.857)
15 -- ODOT 13 0 0 3 1 9 RWD; YD; OD; SB
SR-514, between CR-22 & TR-213 (1.978-3.203)
16 -- Holmes County
13 0 0 3 1 9 RWD; YD; MC; OD
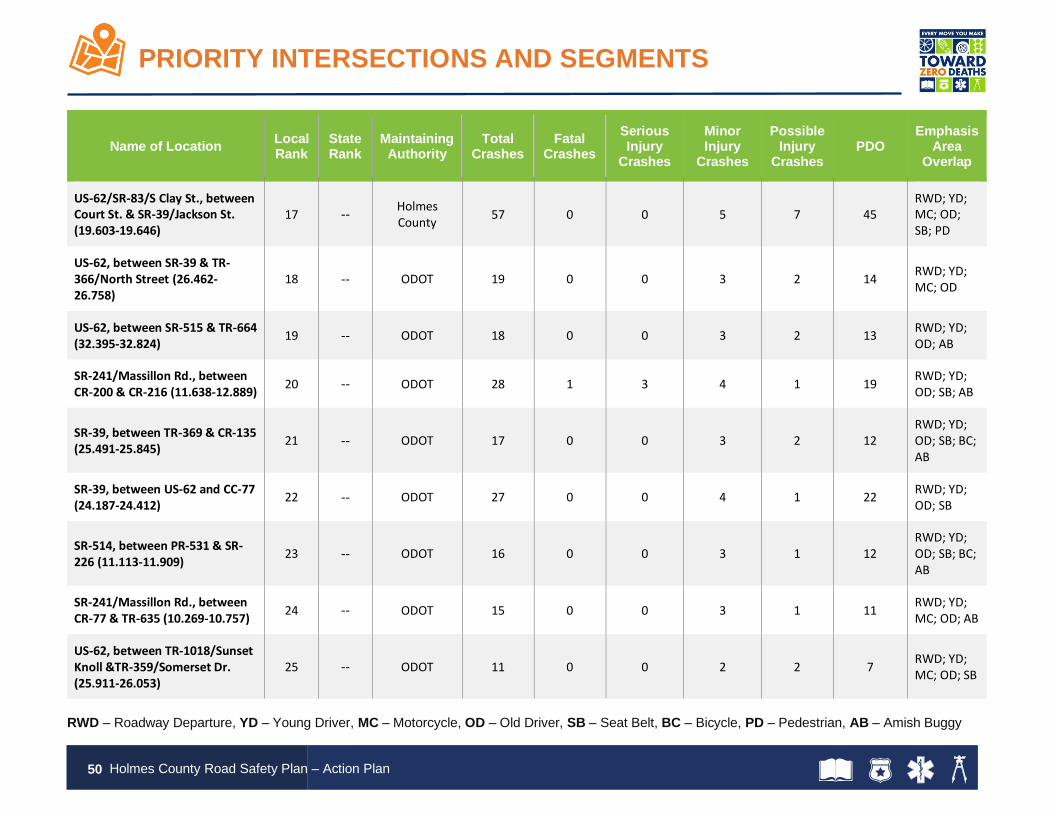
PRIORITY INTERSECTIONS AND SEGMENTS
50 Holmes County Road Safety Plan – Action Plan
Name of Location Local Rank
State Rank
Maintaining Authority
Total Crashes
Fatal Crashes
Serious Injury
Crashes
Minor Injury
Crashes
Possible Injury
Crashes PDO
Emphasis Area
Overlap
US-62/SR-83/S Clay St., between Court St. & SR-39/Jackson St. (19.603-19.646)
17 -- Holmes County
57 0 0 5 7 45 RWD; YD; MC; OD; SB; PD
US-62, between SR-39 & TR-366/North Street (26.462-26.758)
18 -- ODOT 19 0 0 3 2 14 RWD; YD; MC; OD
US-62, between SR-515 & TR-664 (32.395-32.824)
19 -- ODOT 18 0 0 3 2 13 RWD; YD; OD; AB
SR-241/Massillon Rd., between CR-200 & CR-216 (11.638-12.889)
20 -- ODOT 28 1 3 4 1 19 RWD; YD; OD; SB; AB
SR-39, between TR-369 & CR-135 (25.491-25.845)
21 -- ODOT 17 0 0 3 2 12 RWD; YD; OD; SB; BC; AB
SR-39, between US-62 and CC-77 (24.187-24.412)
22 -- ODOT 27 0 0 4 1 22 RWD; YD; OD; SB
SR-514, between PR-531 & SR-226 (11.113-11.909)
23 -- ODOT 16 0 0 3 1 12 RWD; YD; OD; SB; BC; AB
SR-241/Massillon Rd., between CR-77 & TR-635 (10.269-10.757)
24 -- ODOT 15 0 0 3 1 11 RWD; YD; MC; OD; AB
US-62, between TR-1018/Sunset Knoll &TR-359/Somerset Dr. (25.911-26.053)
25 -- ODOT 11 0 0 2 2 7 RWD; YD; MC; OD; SB
RWD – Roadway Departure, YD – Young Driver, MC – Motorcycle, OD – Old Driver, SB – Seat Belt, BC – Bicycle, PD – Pedestrian, AB – Amish Buggy
PRIORITY INTERSECTIONS AND SEGMENTS
51 Holmes County Road Safety Plan – Action Plan
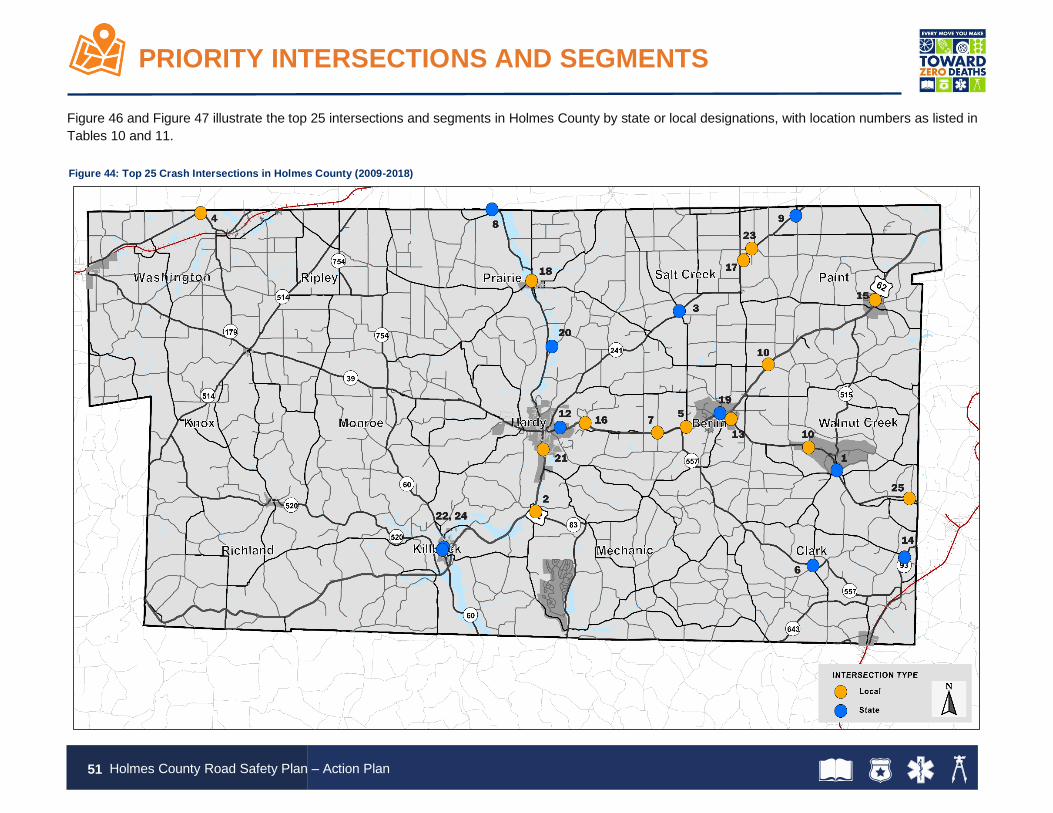
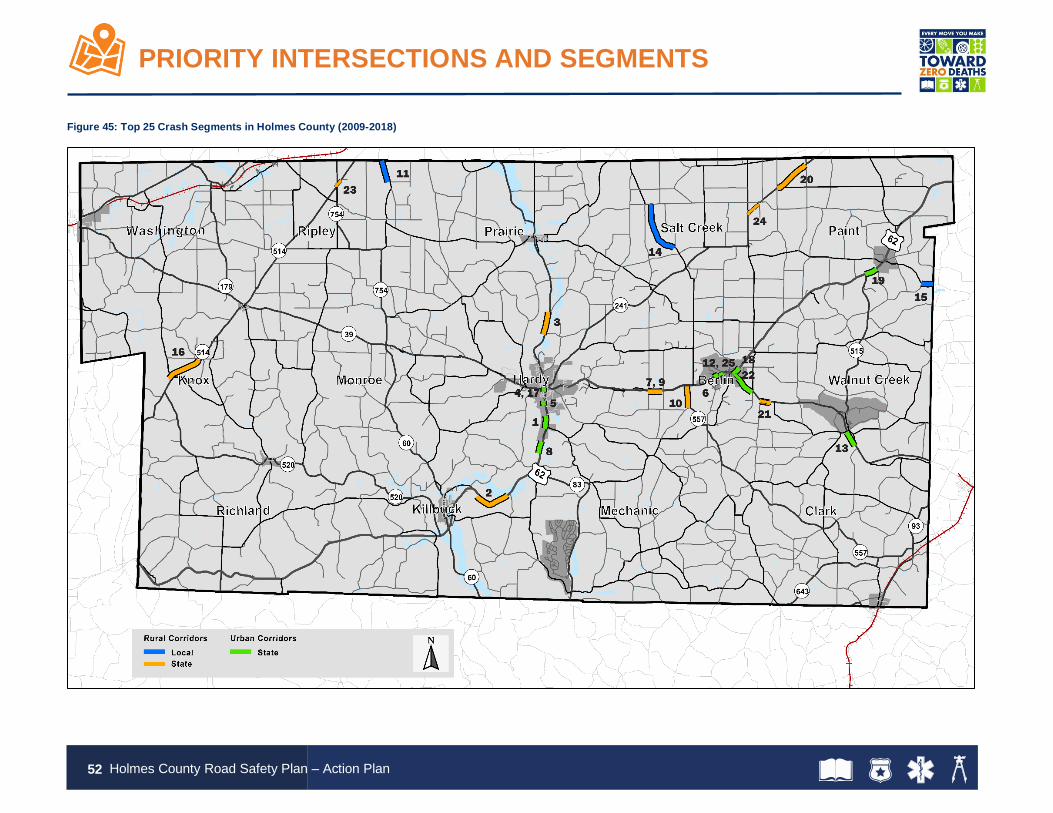
Figure 46 and Figure 47 illustrate the top 25 intersections and segments in Holmes County by state or local designations, with location numbers as listed in
Tables 10 and 11.
Figure 44: Top 25 Crash Intersections in Holmes County (2009-2018)
PRIORITY INTERSECTIONS AND SEGMENTS
52 Holmes County Road Safety Plan – Action Plan
Figure 45: Top 25 Crash Segments in Holmes County (2009-2018)
EARLY ACTION PROJECTS
53 Holmes County Road Safety Plan – Action Plan
7 PROJECTS RECOMMENDED FOR EARLY ACTION
The projects identified in this section are recommended based on the frequency and severity of crashes, with input
from the Project Team and key stakeholders. In addition to projects located at specific intersections and along
identified corridors, the plan also recommends programmatic enhancements that could be implemented by the
Holmes County Engineer’s Office for potential county-wide improvements with physical treatments to mitigate crashes
for the emphasis areas. The Holmes County Engineer is the project champion for these recommendations.
This section also identifies mitigation strategies that involve establishing or modifying programs that are policy,
campaign, and education course based. The programs are recommended based on the Holmes County emphasis
areas. The champions for these programs include community leaders and law enforcement, also benefitting from
involvement and support from the Holmes County Engineer.
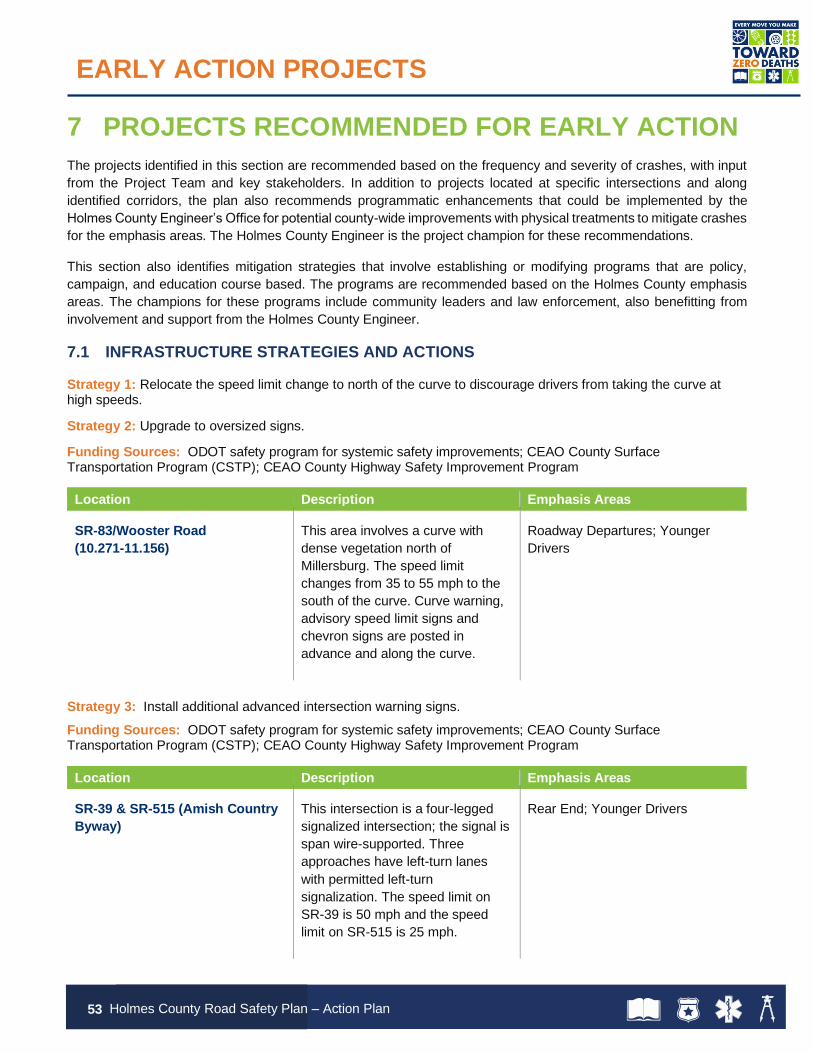
7.1 INFRASTRUCTURE STRATEGIES AND ACTIONS
Strategy 1: Relocate the speed limit change to north of the curve to discourage drivers from taking the curve at high speeds.
Strategy 2: Upgrade to oversized signs.
Funding Sources: ODOT safety program for systemic safety improvements; CEAO County Surface Transportation Program (CSTP); CEAO County Highway Safety Improvement Program
Location Description Emphasis Areas
SR-83/Wooster Road
(10.271-11.156)
This area involves a curve with
dense vegetation north of
Millersburg. The speed limit
changes from 35 to 55 mph to the
south of the curve. Curve warning,
advisory speed limit signs and
chevron signs are posted in
advance and along the curve.
Roadway Departures; Younger
Drivers
Strategy 3: Install additional advanced intersection warning signs.
Funding Sources: ODOT safety program for systemic safety improvements; CEAO County Surface Transportation Program (CSTP); CEAO County Highway Safety Improvement Program
Location Description Emphasis Areas
SR-39 & SR-515 (Amish Country
Byway)
This intersection is a four-legged
signalized intersection; the signal is
span wire-supported. Three
approaches have left-turn lanes
with permitted left-turn
signalization. The speed limit on
SR-39 is 50 mph and the speed
limit on SR-515 is 25 mph.
Rear End; Younger Drivers
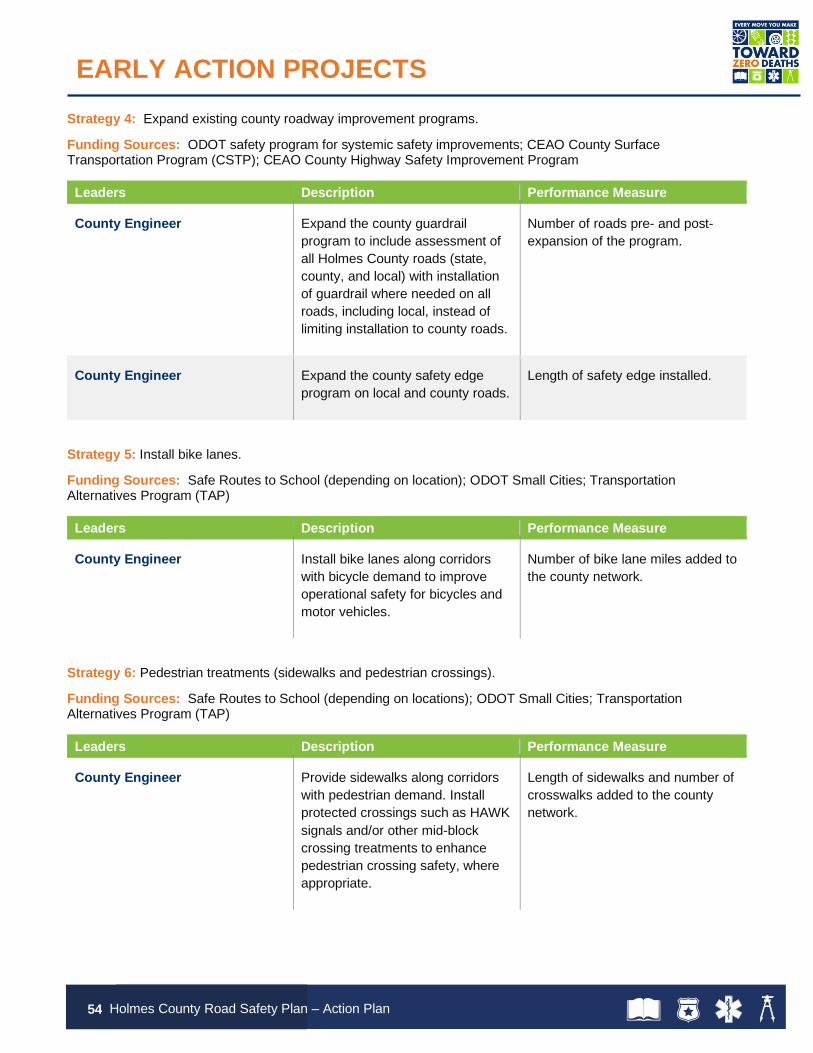
EARLY ACTION PROJECTS
54 Holmes County Road Safety Plan – Action Plan
Strategy 4: Expand existing county roadway improvement programs.
Funding Sources: ODOT safety program for systemic safety improvements; CEAO County Surface Transportation Program (CSTP); CEAO County Highway Safety Improvement Program
Leaders Description Performance Measure
County Engineer Expand the county guardrail
program to include assessment of
all Holmes County roads (state,
county, and local) with installation
of guardrail where needed on all
roads, including local, instead of
limiting installation to county roads.
Number of roads pre- and post-
expansion of the program.
County Engineer Expand the county safety edge
program on local and county roads.
Length of safety edge installed.
Strategy 5: Install bike lanes.
Funding Sources: Safe Routes to School (depending on location); ODOT Small Cities; Transportation Alternatives Program (TAP)
Leaders Description Performance Measure
County Engineer Install bike lanes along corridors
with bicycle demand to improve
operational safety for bicycles and
motor vehicles.
Number of bike lane miles added to
the county network.
Strategy 6: Pedestrian treatments (sidewalks and pedestrian crossings).
Funding Sources: Safe Routes to School (depending on locations); ODOT Small Cities; Transportation Alternatives Program (TAP)
Leaders Description Performance Measure
County Engineer Provide sidewalks along corridors
with pedestrian demand. Install
protected crossings such as HAWK
signals and/or other mid-block
crossing treatments to enhance
pedestrian crossing safety, where
appropriate.
Length of sidewalks and number of
crosswalks added to the county
network.

EARLY ACTION PROJECTS
55 Holmes County Road Safety Plan – Action Plan
7.2 SEAT BELTS
Strategy 1: Enact a local and/or state primary seatbelt law.
Timeline: Varies
Leaders Description Performance Measure
Community Leaders Encourage state representatives to
enact a primary seatbelt law that
can be enforced by local law
officials.
Estimated number of lives saved
before and after implementation
based on crash data.
7.3 YOUNG DRIVERS
Strategy 1: Enforce Graduated Driver’s Licensing protocols and zero-tolerance laws.
Timeline: 0-2 years
Leaders Description Performance Measure
Law Enforcement Enforce Graduated Driver’s License
(GDL) and zero-tolerance laws by
local law enforcement, publicity
campaigns, and parents.
Number of citations issued for
failure to comply with licensing and
drinking laws.
Strategy 2: Establish scholarship fund for driver’s education courses
Timeline: 0-2 years
Leaders Description Performance Measure
Community Leaders Many teenagers may elect to wait
until they are 18 years old to get a
driver’s license due to the cost of
driver’s education.
Number of scholarships awarded.
7.4 OLDER DRIVERS
Strategy 1: Modify driver’s license screening and assessment procedures.
Timeline: Ongoing
Leaders Description Performance Measure
Community Leaders; Bureau of
Motor Vehicles
License restrictions and/or
additional screening and testing.
Number of older drivers trained
under newly implemented
screening and testing.

EARLY ACTION PROJECTS
56 Holmes County Road Safety Plan – Action Plan
Strategy 2: Produce continuing educational materials for the BMV.
Timeline: Ongoing
Leaders Description Performance Measure
Community Leaders; Bureau of
Motor Vehicles
Produce continuing educational
materials in the form of videos or
brochures for drivers renewing their
licenses to update them on
advancing technology or new laws.
Number of drivers
receiving/reviewing the material.
7.5 MOTORCYCLISTS
Strategy 1: Reinstate universal helmet law.
Timeline: 1-3 years
Leaders Description Performance Measure
Community Leaders Mandate helmet use by motorcycle
riders and passengers to reduce
severe and fatal injury crashes.
Percent of helmeted/non-helmeted
motorcycle riders and passengers.
7.6 AMISH BUGGIES
Strategy 1: Require driver’s education for first time licensees, regardless of age.
Timeline: Ongoing
Leaders Description Performance Measure
Community Leaders and Driver
Educational Programs
Implement driver’s education for
first time licensing, regardless of
age.
Track education resources
developed.
Strategy 2: Amish Buggy Safety Campaign
Funding Sources: <1 year
Location Description Performance Measure
Amish Congregational Leaders Enact a safety campaign to
educate drivers how to interact with
Amish Buggies.
Track education resources
developed.
HOLMES COUNTY ROAD SAFETY PLAN
Appendix – County Road Safety Plan Toolkit

COUNTY ROAD SAFETY PLAN TOOLKIT B-2
Emphasis Area & Mitigation Measures
Description & Benefits Impacts Cost Schedule Ease of
Implementation 6E
Category Performance
Metric
AMISH BUGGY
The mitigation strategies listed below focus on addressing Amish buggy crashes. Effectively engaging the Amish communities and working in partnership with them is critical to successfully implementing programs to reduce crashes involving Amish buggies.
Engage Religious Leaders
(by individual church)
Influence positive behavior changes by working with church leaders to understand specific safety issues and support identified mitigation strategies. Based on the Amish culture, one-on-one meetings with individual congregations is necessary. This approach is intended to leverage the influence church leaders have over the policies, standards and behaviors of their congregations, understanding that congregation behaviors will not change without direct and clear support of the church leaders. Successfully engaging church leaders is crucial to the implementation of other Amish Buggy mitigation strategies.
Requires understanding, cooperation and championing from local Amish religious leaders, for each identified congregation area within the community.
Low Varies (depends upon the nature of the strategies and type(s) of desired change)
Medium/Difficult (depends upon the personalities and policies of each individual church leader)
Education Encouragement
Number of crashes involving Amish buggies (overall, fatal, serious injury).
Amish Buggy Safety
Campaign
A safety campaign should be multi-faceted: 1) Educate drivers to convey understanding that Amish are
legitimate road users and should be anticipated and accommodated;
2) Educate the Amish on ways to minimize exposure and risks to their safety;
3) Remind drivers to be vigilant on roads in and near Amish communities
Requires development and deployment of an educational campaign.
Low Short/Medium Easy Education Number of crashes involving Amish buggies (overall, fatal, serious injury).
Buggy Warning Signs
(posted)
Post warning signs to notify drivers when entering Amish communities
Requires installation of new signage. Low Short Easy Engineering Number of crashes involving Amish buggies (overall, fatal, serious injury).
Enhance Driver Training
Program
Implement curriculum component designed and approved by the Bureau of Motor Vehicles that incorporates instruction on safe motor vehicle operations with vulnerable road users including Amish buggy interactions. This could be implemented via driver training programs which are required for new drivers younger than age 18.
Training drivers 18 and older requires a different method of education; an outreach campaign would likely be effective.
Anticipate assembling a task force to develop guidelines which would include key stakeholders in the Amish community and driver education and training industry experts.
Low Medium Medium Education Number of crashes involving Amish buggies (overall, fatal, serious injury).
Pull Off and/or Climbing
Lane for Buggies
Adding a lane on significant hills would allow motor vehicles to pass slow moving buggies. Additionally, providing a pull-off on roads that are popular Amish corridors would give motor vehicles safe space to pass. These features help mitigate documented safety issues resulting from motor vehicles passing buggies in an unsafe manner.
Requires additional pavement which may require right of way acquisition. Potential safety risk associated with merge where climbing lane ends.
Medium/High Medium Medium/Difficult/ Engineering Number of crashes involving Amish buggies (overall, fatal, serious injury).
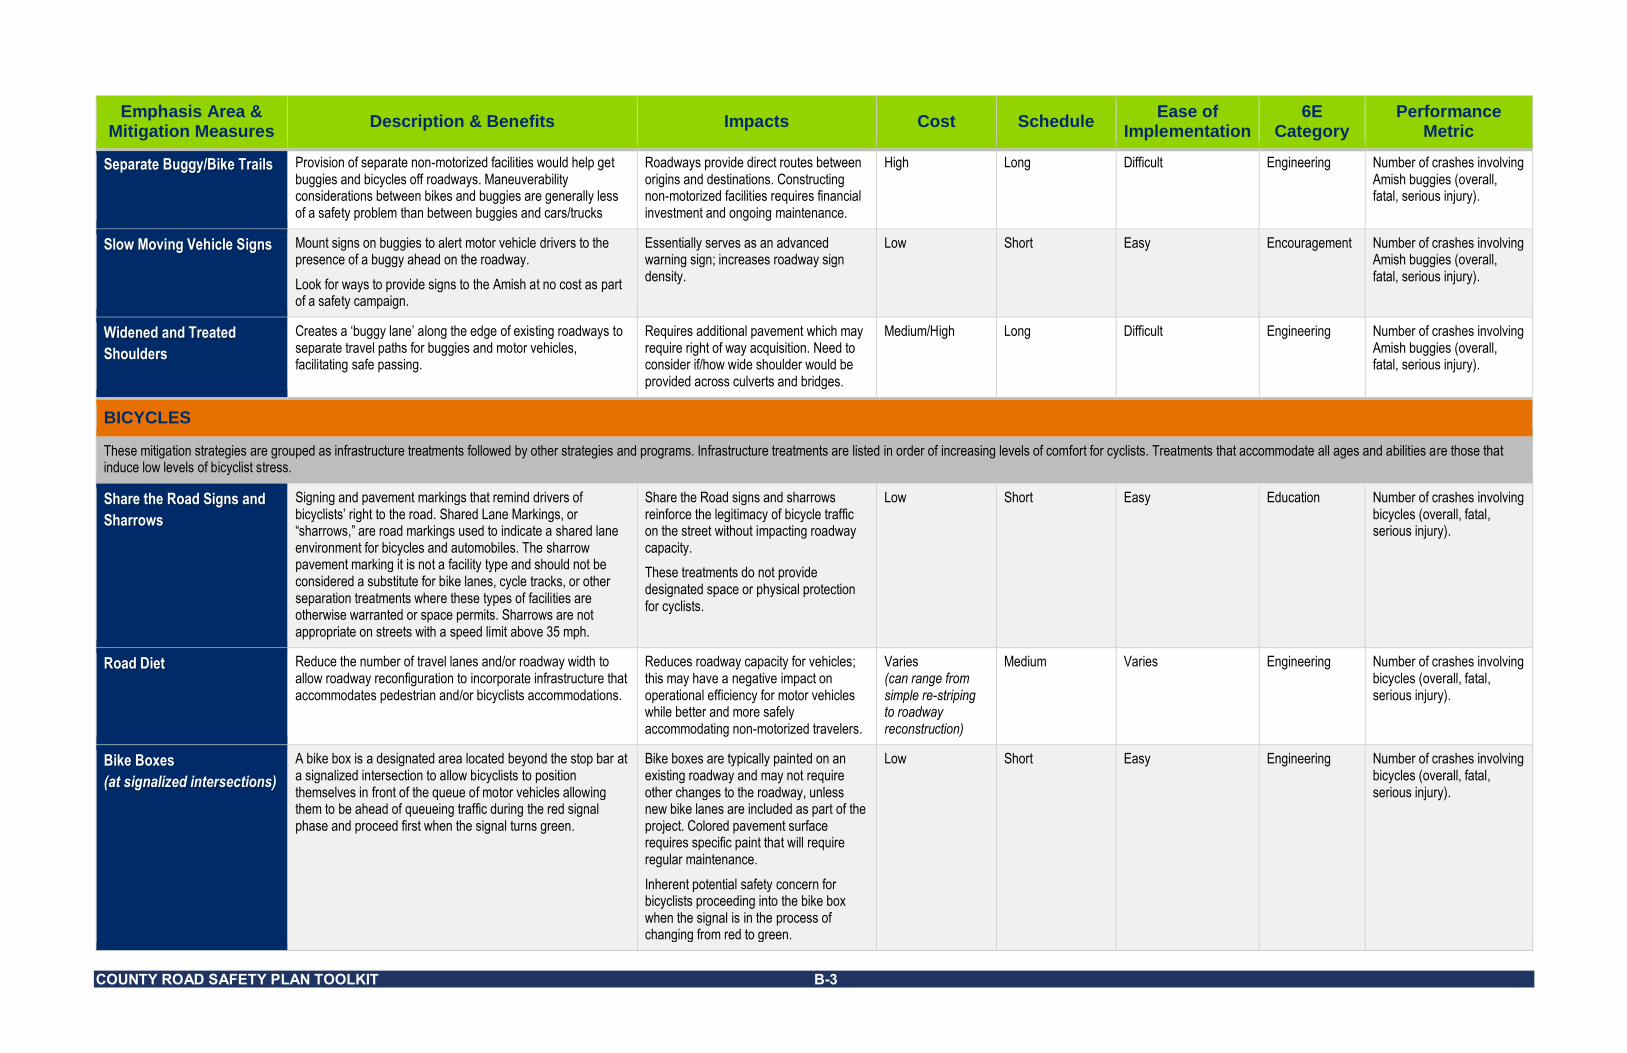
COUNTY ROAD SAFETY PLAN TOOLKIT B-3
Emphasis Area & Mitigation Measures
Description & Benefits Impacts Cost Schedule Ease of
Implementation 6E
Category Performance
Metric
Separate Buggy/Bike Trails Provision of separate non-motorized facilities would help get buggies and bicycles off roadways. Maneuverability considerations between bikes and buggies are generally less of a safety problem than between buggies and cars/trucks
Roadways provide direct routes between origins and destinations. Constructing non-motorized facilities requires financial investment and ongoing maintenance.
High Long Difficult Engineering Number of crashes involving Amish buggies (overall, fatal, serious injury).
Slow Moving Vehicle Signs Mount signs on buggies to alert motor vehicle drivers to the presence of a buggy ahead on the roadway.
Look for ways to provide signs to the Amish at no cost as part of a safety campaign.
Essentially serves as an advanced warning sign; increases roadway sign density.
Low Short Easy Encouragement Number of crashes involving Amish buggies (overall, fatal, serious injury).
Widened and Treated
Shoulders
Creates a ‘buggy lane’ along the edge of existing roadways to separate travel paths for buggies and motor vehicles, facilitating safe passing.
Requires additional pavement which may require right of way acquisition. Need to consider if/how wide shoulder would be provided across culverts and bridges.
Medium/High Long Difficult Engineering Number of crashes involving Amish buggies (overall, fatal, serious injury).
BICYCLES
These mitigation strategies are grouped as infrastructure treatments followed by other strategies and programs. Infrastructure treatments are listed in order of increasing levels of comfort for cyclists. Treatments that accommodate all ages and abilities are those that induce low levels of bicyclist stress.
Share the Road Signs and
Sharrows
Signing and pavement markings that remind drivers of bicyclists’ right to the road. Shared Lane Markings, or “sharrows,” are road markings used to indicate a shared lane environment for bicycles and automobiles. The sharrow pavement marking it is not a facility type and should not be considered a substitute for bike lanes, cycle tracks, or other separation treatments where these types of facilities are otherwise warranted or space permits. Sharrows are not appropriate on streets with a speed limit above 35 mph.
Share the Road signs and sharrows reinforce the legitimacy of bicycle traffic on the street without impacting roadway capacity.
These treatments do not provide designated space or physical protection for cyclists.
Low Short Easy Education Number of crashes involving bicycles (overall, fatal, serious injury).
Road Diet Reduce the number of travel lanes and/or roadway width to allow roadway reconfiguration to incorporate infrastructure that accommodates pedestrian and/or bicyclists accommodations.
Reduces roadway capacity for vehicles; this may have a negative impact on operational efficiency for motor vehicles while better and more safely accommodating non-motorized travelers.
Varies (can range from simple re-striping to roadway reconstruction)
Medium Varies Engineering Number of crashes involving bicycles (overall, fatal, serious injury).
Bike Boxes
(at signalized intersections)
A bike box is a designated area located beyond the stop bar at a signalized intersection to allow bicyclists to position themselves in front of the queue of motor vehicles allowing them to be ahead of queueing traffic during the red signal phase and proceed first when the signal turns green.
Bike boxes are typically painted on an existing roadway and may not require other changes to the roadway, unless new bike lanes are included as part of the project. Colored pavement surface requires specific paint that will require regular maintenance.
Inherent potential safety concern for bicyclists proceeding into the bike box when the signal is in the process of changing from red to green.
Low Short Easy Engineering Number of crashes involving bicycles (overall, fatal, serious injury).
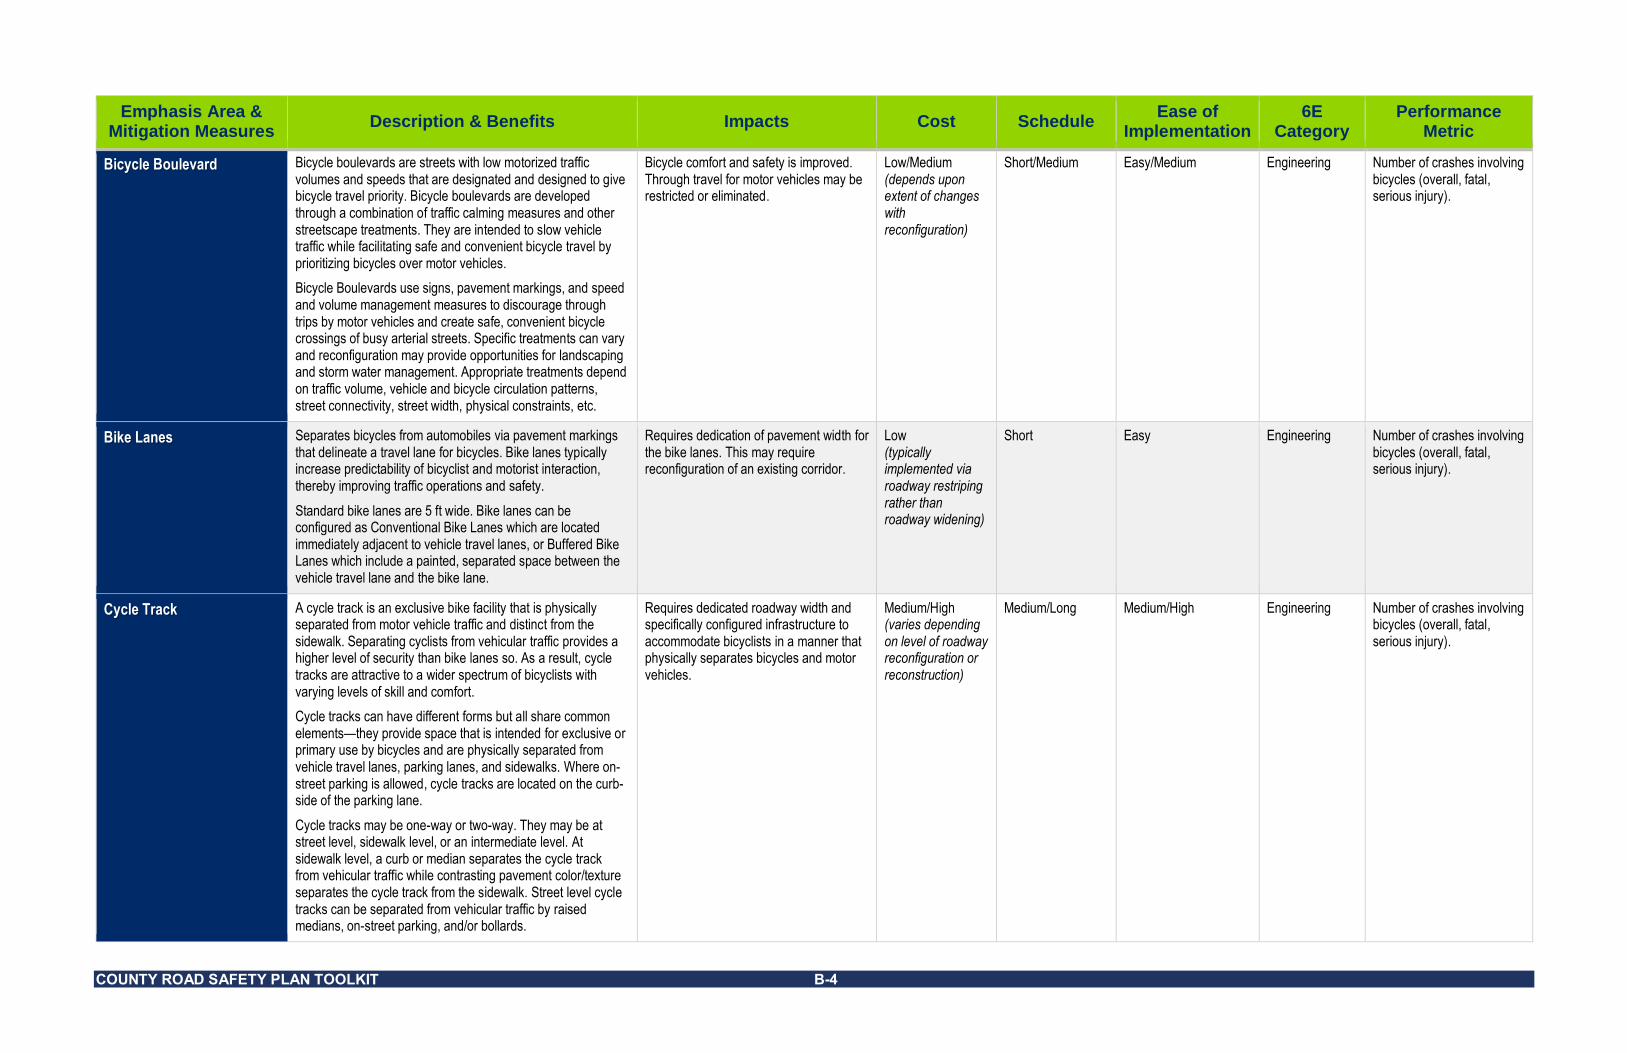
COUNTY ROAD SAFETY PLAN TOOLKIT B-4
Emphasis Area & Mitigation Measures
Description & Benefits Impacts Cost Schedule Ease of
Implementation 6E
Category Performance
Metric
Bicycle Boulevard Bicycle boulevards are streets with low motorized traffic volumes and speeds that are designated and designed to give bicycle travel priority. Bicycle boulevards are developed through a combination of traffic calming measures and other streetscape treatments. They are intended to slow vehicle traffic while facilitating safe and convenient bicycle travel by prioritizing bicycles over motor vehicles.
Bicycle Boulevards use signs, pavement markings, and speed and volume management measures to discourage through trips by motor vehicles and create safe, convenient bicycle crossings of busy arterial streets. Specific treatments can vary and reconfiguration may provide opportunities for landscaping and storm water management. Appropriate treatments depend on traffic volume, vehicle and bicycle circulation patterns, street connectivity, street width, physical constraints, etc.
Bicycle comfort and safety is improved. Through travel for motor vehicles may be restricted or eliminated.
Low/Medium (depends upon extent of changes with reconfiguration)
Short/Medium Easy/Medium Engineering Number of crashes involving bicycles (overall, fatal, serious injury).
Bike Lanes Separates bicycles from automobiles via pavement markings that delineate a travel lane for bicycles. Bike lanes typically increase predictability of bicyclist and motorist interaction, thereby improving traffic operations and safety.
Standard bike lanes are 5 ft wide. Bike lanes can be configured as Conventional Bike Lanes which are located immediately adjacent to vehicle travel lanes, or Buffered Bike Lanes which include a painted, separated space between the vehicle travel lane and the bike lane.
Requires dedication of pavement width for the bike lanes. This may require reconfiguration of an existing corridor.
Low (typically implemented via roadway restriping rather than roadway widening)
Short Easy Engineering Number of crashes involving bicycles (overall, fatal, serious injury).
Cycle Track A cycle track is an exclusive bike facility that is physically separated from motor vehicle traffic and distinct from the sidewalk. Separating cyclists from vehicular traffic provides a higher level of security than bike lanes so. As a result, cycle tracks are attractive to a wider spectrum of bicyclists with varying levels of skill and comfort.
Cycle tracks can have different forms but all share common elements—they provide space that is intended for exclusive or primary use by bicycles and are physically separated from vehicle travel lanes, parking lanes, and sidewalks. Where on-street parking is allowed, cycle tracks are located on the curb-side of the parking lane.
Cycle tracks may be one-way or two-way. They may be at street level, sidewalk level, or an intermediate level. At sidewalk level, a curb or median separates the cycle track from vehicular traffic while contrasting pavement color/texture separates the cycle track from the sidewalk. Street level cycle tracks can be separated from vehicular traffic by raised medians, on-street parking, and/or bollards.
Requires dedicated roadway width and specifically configured infrastructure to accommodate bicyclists in a manner that physically separates bicycles and motor vehicles.
Medium/High (varies depending on level of roadway reconfiguration or reconstruction)
Medium/Long Medium/High Engineering Number of crashes involving bicycles (overall, fatal, serious injury).

COUNTY ROAD SAFETY PLAN TOOLKIT B-5
Emphasis Area & Mitigation Measures
Description & Benefits Impacts Cost Schedule Ease of
Implementation 6E
Category Performance
Metric
Bike Trail / Multi-Use Trail
and Side Path
Bike Trails or Multi-Use Trails accommodate travel by both bicycles and pedestrians. They can be located near roadways or through areas that are far from roads. Trails can provide a continuous corridor but typically do not take riders all the way to their destinations. To become useful for transportation, paths work best when connected to an on-street network that meets the same level of rider comfort, and design provides bicycle-friendly geometry.
A bicycle sidepath is a path located next to a road, like a sidewalk, except that signs are posted designating it for bicycle use. They are commonly used by both pedestrians and bicycles. Urban sidepaths adjacent to a city street are essentially a specially-marked portion of the sidewalk. Sidepaths are typically easier to build than paths or trails in most other locations because they often do not require right-of-way acquisition.
Trails and side paths can be the most expensive type of bicycle infrastructure due to right-of-way acquisition cost.
High Long Difficult Engineering Number of crashes involving bicycles (overall, fatal, serious injury).
Bicycle Safety Campaign Bicycle safety campaigns should have a dual purpose:
1) Sensitize drivers to help them understand that bicyclists are legitimate road users and should always be expected on or near the roadway; and
2) Educate bicyclists on proper bike handling as well as behaviors and strategies to minimizing risks to their safety.
Campaigns can involve a variety of stakeholder organizations for development and implementation. Similarly, safety campaigns can involve a variety of methods and strategies.
Low Short Easy Encouragement Number of crashes involving bicycles (overall, fatal, serious injury).
Driver Education Include bicycle-related information in driver training to educate drivers on safe driving behaviors around bicyclists and to instruct bicyclists how to behave on the roadway.
Leverage bicycle activist organizations to educate bicyclists on safe operations and behaviors.
Increases the amount of information required to be covered in driver education programs. Will require coordination at the state level.
Low Short/Medium Medium Education Number of crashes involving bicycles (overall, fatal, serious injury).
Electric Bicycles Develop program to inform and educate both electric bicycle operators and motor vehicle drivers to improve safe operations on the roadway. This could be a supplemental component to a bicycle safety campaign.
Like bicycle safety campaigns, their development and implementation could involve a variety of stakeholder organizations. Given their prevalent use within Amish communities, the Amish should be involved.
Low Short Easy Encouragement Number of crashes involving bicycles (overall, fatal, serious injury).
Laws: Bicycle Active and
Passive Lighting
Some states have active and passive lighting laws for bicycles. Active lighting refers to bicycle lights, something the bicyclist turns on to provide illumination. Passive lighting does not require activation, typically reflectors or reflective material. Passive lighting performs as a supplement to active lighting.
Oregon example:
Active Lighting: Every bike operated during “limited visibility conditions” must have lighting equipment that shows a white light visible from a distance of at least 500 feet to the front
Requires support from law makers. Low Medium Easy Encouragement Enforcement
Number of crashes involving bicycles (overall, fatal, serious injury).
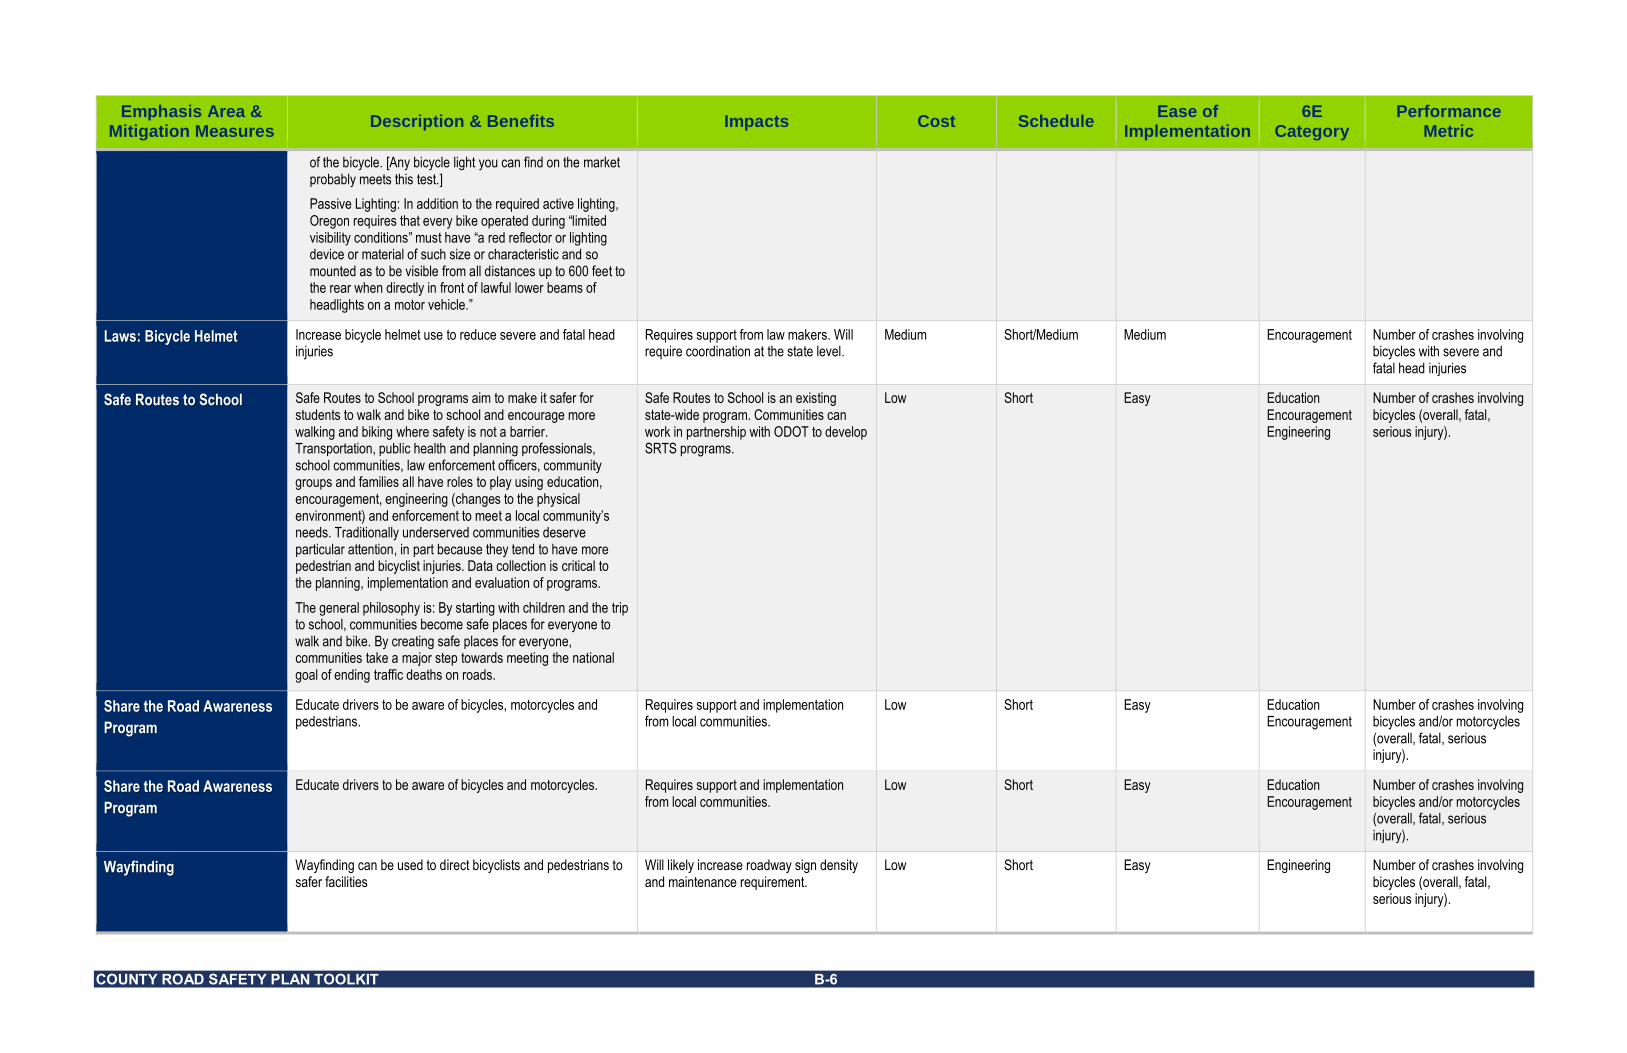
COUNTY ROAD SAFETY PLAN TOOLKIT B-6
Emphasis Area & Mitigation Measures
Description & Benefits Impacts Cost Schedule Ease of
Implementation 6E
Category Performance
Metric
of the bicycle. [Any bicycle light you can find on the market probably meets this test.]
Passive Lighting: In addition to the required active lighting, Oregon requires that every bike operated during “limited visibility conditions” must have “a red reflector or lighting device or material of such size or characteristic and so mounted as to be visible from all distances up to 600 feet to the rear when directly in front of lawful lower beams of headlights on a motor vehicle.”
Laws: Bicycle Helmet Increase bicycle helmet use to reduce severe and fatal head injuries
Requires support from law makers. Will require coordination at the state level.
Medium Short/Medium Medium Encouragement Number of crashes involving bicycles with severe and fatal head injuries
Safe Routes to School Safe Routes to School programs aim to make it safer for students to walk and bike to school and encourage more walking and biking where safety is not a barrier. Transportation, public health and planning professionals, school communities, law enforcement officers, community groups and families all have roles to play using education, encouragement, engineering (changes to the physical environment) and enforcement to meet a local community’s needs. Traditionally underserved communities deserve particular attention, in part because they tend to have more pedestrian and bicyclist injuries. Data collection is critical to the planning, implementation and evaluation of programs.
The general philosophy is: By starting with children and the trip to school, communities become safe places for everyone to walk and bike. By creating safe places for everyone, communities take a major step towards meeting the national goal of ending traffic deaths on roads.
Safe Routes to School is an existing state-wide program. Communities can work in partnership with ODOT to develop SRTS programs.
Low Short Easy Education Encouragement Engineering
Number of crashes involving bicycles (overall, fatal, serious injury).
Share the Road Awareness
Program
Educate drivers to be aware of bicycles, motorcycles and pedestrians.
Requires support and implementation from local communities.
Low Short Easy Education Encouragement
Number of crashes involving bicycles and/or motorcycles (overall, fatal, serious injury).
Share the Road Awareness
Program
Educate drivers to be aware of bicycles and motorcycles. Requires support and implementation from local communities.
Low Short Easy Education Encouragement
Number of crashes involving bicycles and/or motorcycles (overall, fatal, serious injury).
Wayfinding Wayfinding can be used to direct bicyclists and pedestrians to safer facilities
Will likely increase roadway sign density and maintenance requirement.
Low Short Easy Engineering Number of crashes involving bicycles (overall, fatal, serious injury).
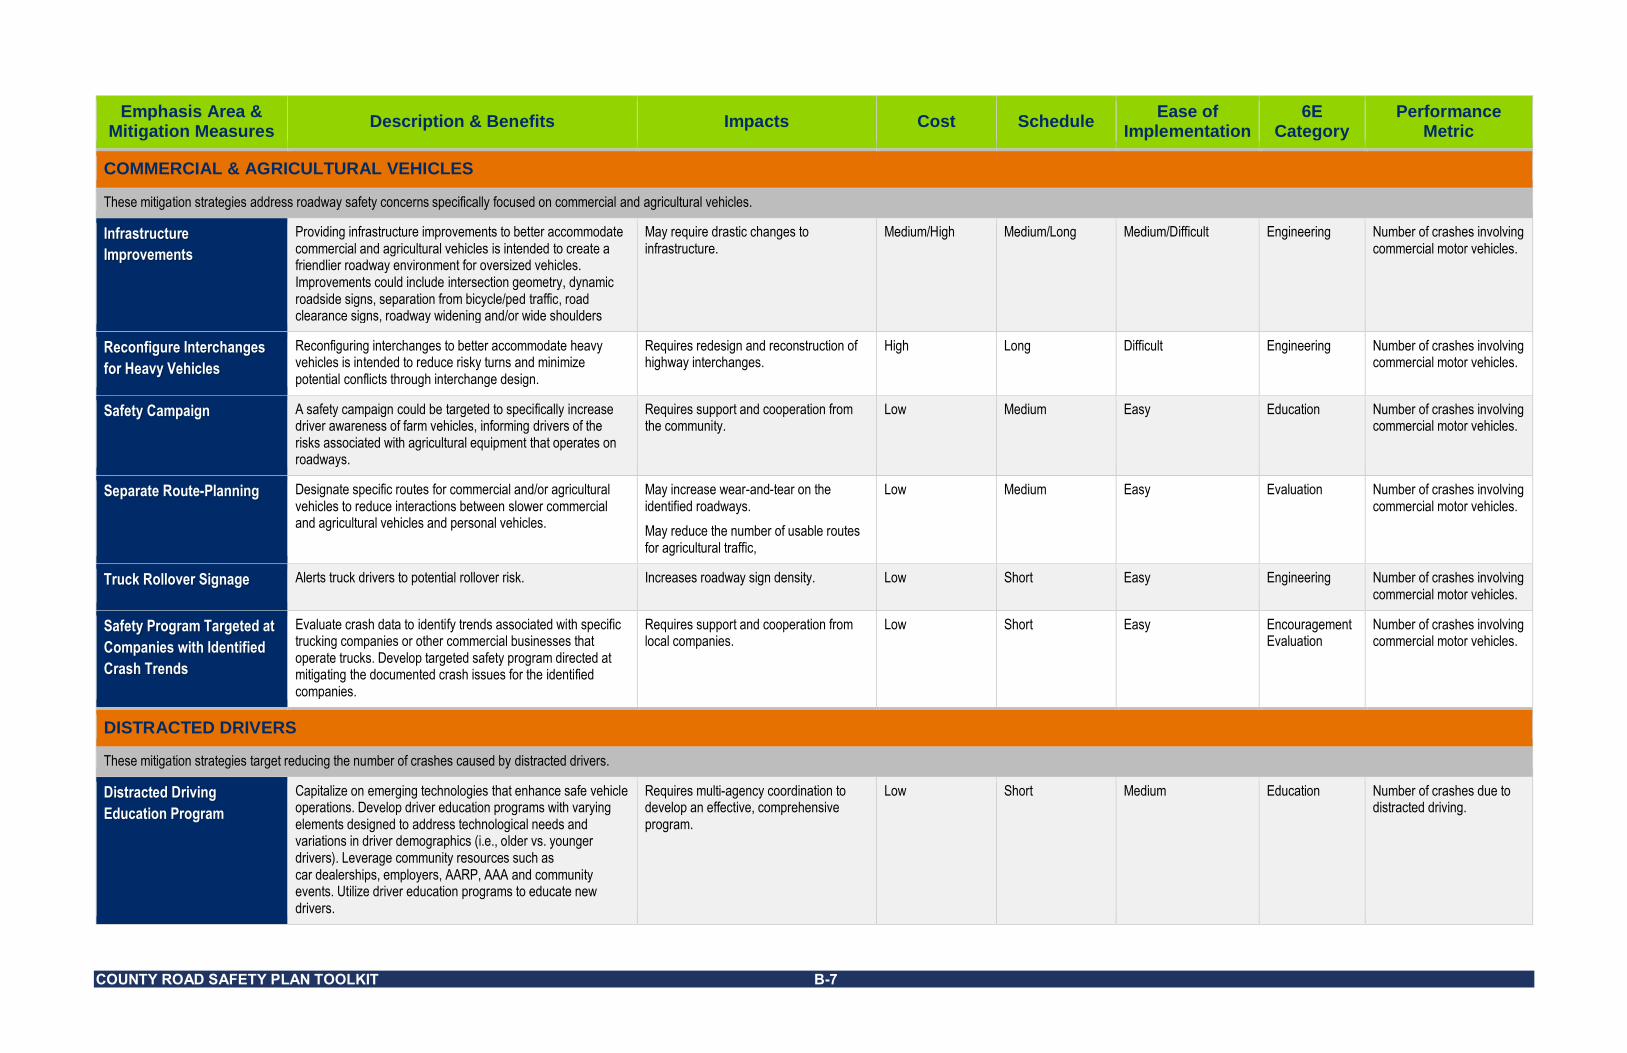
COUNTY ROAD SAFETY PLAN TOOLKIT B-7
Emphasis Area & Mitigation Measures
Description & Benefits Impacts Cost Schedule Ease of
Implementation 6E
Category Performance
Metric
COMMERCIAL & AGRICULTURAL VEHICLES
These mitigation strategies address roadway safety concerns specifically focused on commercial and agricultural vehicles.
Infrastructure
Improvements
Providing infrastructure improvements to better accommodate commercial and agricultural vehicles is intended to create a friendlier roadway environment for oversized vehicles. Improvements could include intersection geometry, dynamic roadside signs, separation from bicycle/ped traffic, road clearance signs, roadway widening and/or wide shoulders
May require drastic changes to infrastructure.
Medium/High Medium/Long Medium/Difficult Engineering Number of crashes involving commercial motor vehicles.
Reconfigure Interchanges
for Heavy Vehicles
Reconfiguring interchanges to better accommodate heavy vehicles is intended to reduce risky turns and minimize potential conflicts through interchange design.
Requires redesign and reconstruction of highway interchanges.
High Long Difficult Engineering Number of crashes involving commercial motor vehicles.
Safety Campaign A safety campaign could be targeted to specifically increase driver awareness of farm vehicles, informing drivers of the risks associated with agricultural equipment that operates on roadways.
Requires support and cooperation from the community.
Low Medium Easy Education Number of crashes involving commercial motor vehicles.
Separate Route-Planning Designate specific routes for commercial and/or agricultural vehicles to reduce interactions between slower commercial and agricultural vehicles and personal vehicles.
May increase wear-and-tear on the identified roadways.
May reduce the number of usable routes for agricultural traffic,
Low Medium Easy Evaluation Number of crashes involving commercial motor vehicles.
Truck Rollover Signage Alerts truck drivers to potential rollover risk. Increases roadway sign density. Low Short Easy Engineering Number of crashes involving commercial motor vehicles.
Safety Program Targeted at
Companies with Identified
Crash Trends
Evaluate crash data to identify trends associated with specific trucking companies or other commercial businesses that operate trucks. Develop targeted safety program directed at mitigating the documented crash issues for the identified companies.
Requires support and cooperation from local companies.
Low Short Easy Encouragement Evaluation
Number of crashes involving commercial motor vehicles.
DISTRACTED DRIVERS
These mitigation strategies target reducing the number of crashes caused by distracted drivers.
Distracted Driving
Education Program
Capitalize on emerging technologies that enhance safe vehicle operations. Develop driver education programs with varying elements designed to address technological needs and variations in driver demographics (i.e., older vs. younger drivers). Leverage community resources such as car dealerships, employers, AARP, AAA and community events. Utilize driver education programs to educate new drivers.
Requires multi-agency coordination to develop an effective, comprehensive program.
Low Short Medium Education Number of crashes due to distracted driving.

COUNTY ROAD SAFETY PLAN TOOLKIT B-8
Emphasis Area & Mitigation Measures
Description & Benefits Impacts Cost Schedule Ease of
Implementation 6E
Category Performance
Metric
Do Not Disturb Smart
Phone Apps
Use of smart phone apps that encourage distraction-free driving or discourage distracted driving. This could be integrated into a safety campaign.
Requires support from local leaders to educate and encourage the community.
Low Short Easy Education Number of crashes due to distracted driving.
Drowsy Driving Warning
Signs
Installing Drowsy Driving Warning Signs in high crash locations can alert drivers to high-risk road areas
May not be effective. Low Short Easy Engineering Number of crashes due to distracted driving.
Enhanced Pavement
Markings
Installation of enhanced pavement markings, such as raised pavement markers and delineators, provide tactile and visual reminder of roadway centerline and edges.
Requires maintenance.
May complicate snow removal.
Low Short Easy Engineering Number of roadway departure crashes and number of crashes due to distracted driving.
Flashing Beacons Installing flashing beacons at unsignalized intersections and with advanced warning signs helps call attention to conditions where drivers must pay attention to proceed safely.
Requires power (can be solar-powered). May cause distraction.
Low Short Easy Engineering Number of crashes due to distracted driving.
Guardrail Guardrail is installed to prevent roadway departure crashes, physically preventing errant vehicles from colliding with fixed objects or entering dangerous areas. Guardrail is designed to effectively absorb and deflect energy from a crash away from the vehicle. Installation of guardrail helps mitigate roadway departures.
The Crash Modification Factors for guardrail treatments show an expected 16% decrease in fatal and serious injury roadway departure crashes.
Limited to areas with suitable soil conditions.
Repair costs can be high, particularly in areas that frequently shield crashes.
Medium Medium Medium Engineering Number of roadway departure crashes and number of crashes due to distracted driving.
Laws: Cell Phone Use Laws prohibiting texting and the use of cell phones or restricting to hands-free use is likely to reduce the number of distracted driving crashes.
Requires support from law makers. Low Medium Medium Enforcement Number of crashes due to distracted driving.
Median Cable Barriers Installation of cable barriers in roadway medians provides a versatile and forgiving system to minimize roadway crossover crashes.
Ongoing maintenance requirements. Medium Medium Medium Engineering Number of roadway departure crashes and number of crashes due to distracted driving.
Roadside Pull-Offs Providing pull-off areas along the side of the road provides drivers a safe space to check phones (text or return calls) as well as accommodating emergency stops. Installing signs well in advance of these pull-offs will likely improve compliance with no texting/no cell phone use laws.
Requires right-of-way and infrastructure improvements.
High Medium Medium Engineering Number of crashes due to distracted driving.
Rumble Strips Milled rumble strips ground into roadway centerlines and shoulder edge lines provide tactile response to a distracted driver to warn drivers when they have drifted from the travel lane.
Rumble strips help decrease roadway departure crashes. NCHRP 641 reports that for rural two-lane roads shoulder
Rumble strips along shoulder edge lines can interfere with bicycle travel.
Low Short Easy Engineering Number of roadway departure crashes and fixed object crashes due to distracted driving.
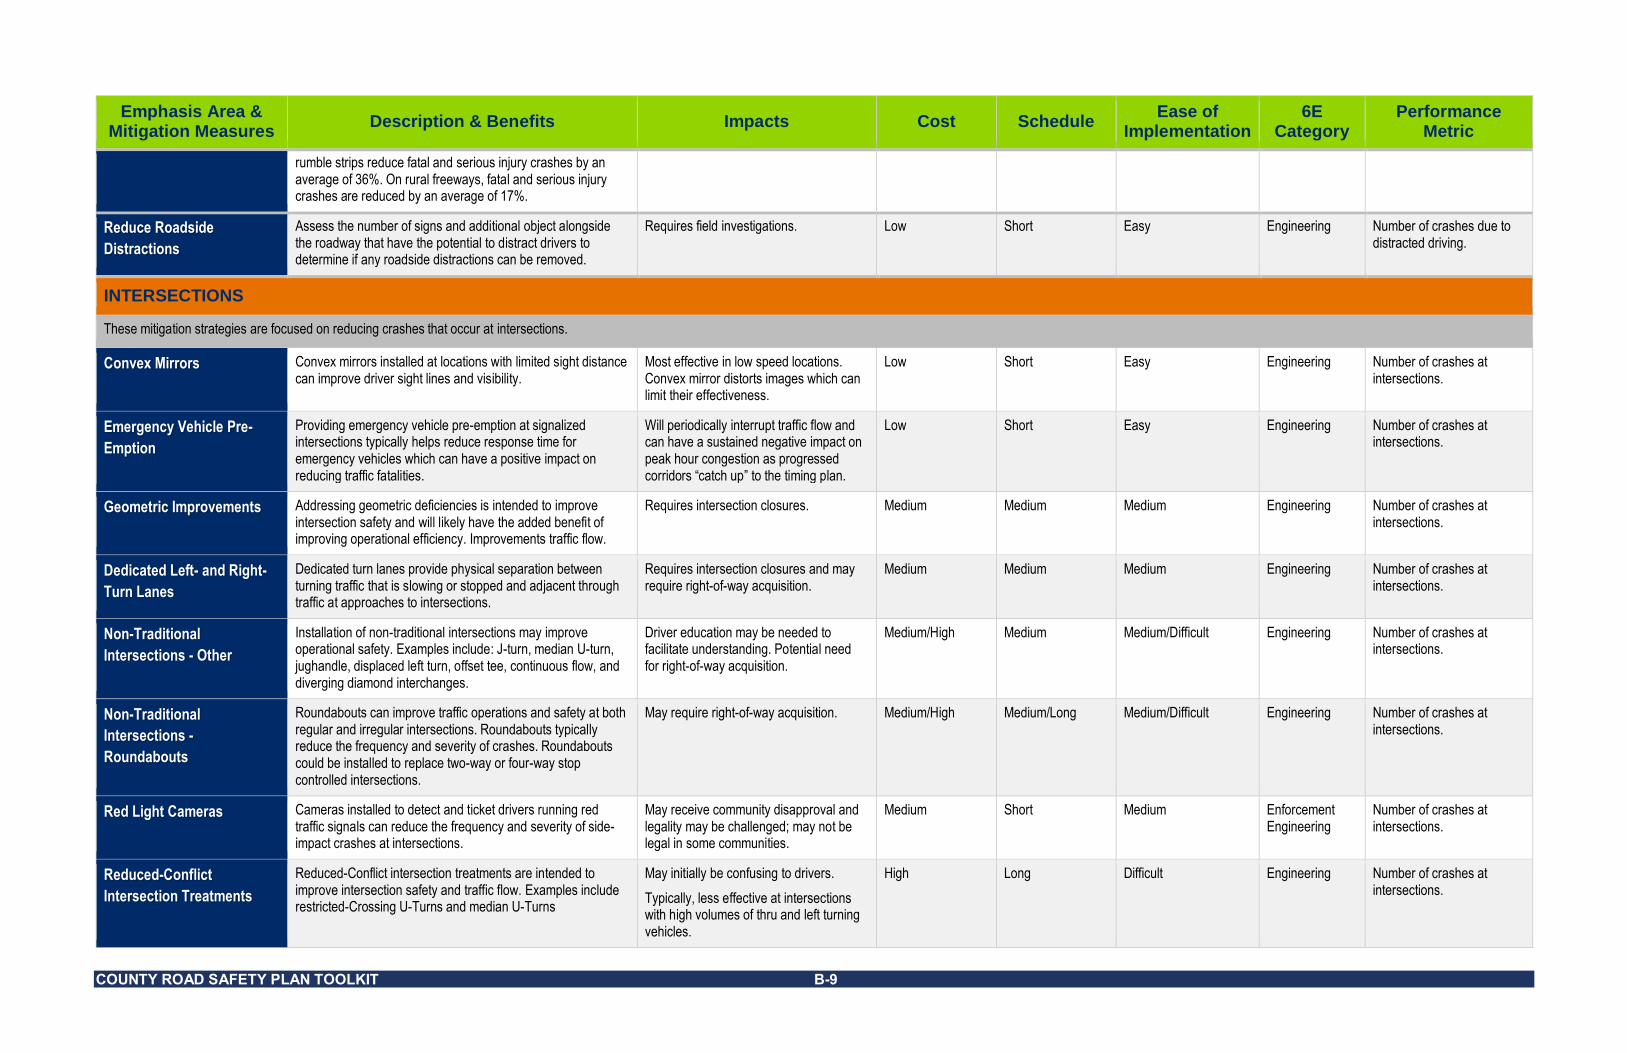
COUNTY ROAD SAFETY PLAN TOOLKIT B-9
Emphasis Area & Mitigation Measures
Description & Benefits Impacts Cost Schedule Ease of
Implementation 6E
Category Performance
Metric
rumble strips reduce fatal and serious injury crashes by an average of 36%. On rural freeways, fatal and serious injury crashes are reduced by an average of 17%.
Reduce Roadside
Distractions
Assess the number of signs and additional object alongside the roadway that have the potential to distract drivers to determine if any roadside distractions can be removed.
Requires field investigations. Low Short Easy Engineering Number of crashes due to distracted driving.
INTERSECTIONS
These mitigation strategies are focused on reducing crashes that occur at intersections.
Convex Mirrors Convex mirrors installed at locations with limited sight distance can improve driver sight lines and visibility.
Most effective in low speed locations. Convex mirror distorts images which can limit their effectiveness.
Low Short Easy Engineering Number of crashes at intersections.
Emergency Vehicle Pre-
Emption
Providing emergency vehicle pre-emption at signalized intersections typically helps reduce response time for emergency vehicles which can have a positive impact on reducing traffic fatalities.
Will periodically interrupt traffic flow and can have a sustained negative impact on peak hour congestion as progressed corridors “catch up” to the timing plan.
Low Short Easy Engineering Number of crashes at intersections.
Geometric Improvements Addressing geometric deficiencies is intended to improve intersection safety and will likely have the added benefit of improving operational efficiency. Improvements traffic flow.
Requires intersection closures. Medium Medium Medium Engineering Number of crashes at intersections.
Dedicated Left- and Right-
Turn Lanes
Dedicated turn lanes provide physical separation between turning traffic that is slowing or stopped and adjacent through traffic at approaches to intersections.
Requires intersection closures and may require right-of-way acquisition.
Medium Medium Medium Engineering Number of crashes at intersections.
Non-Traditional
Intersections - Other
Installation of non-traditional intersections may improve operational safety. Examples include: J-turn, median U-turn, jughandle, displaced left turn, offset tee, continuous flow, and diverging diamond interchanges.
Driver education may be needed to facilitate understanding. Potential need for right-of-way acquisition.
Medium/High Medium Medium/Difficult Engineering Number of crashes at intersections.
Non-Traditional
Intersections -
Roundabouts
Roundabouts can improve traffic operations and safety at both regular and irregular intersections. Roundabouts typically reduce the frequency and severity of crashes. Roundabouts could be installed to replace two-way or four-way stop controlled intersections.
May require right-of-way acquisition. Medium/High Medium/Long Medium/Difficult Engineering Number of crashes at intersections.
Red Light Cameras Cameras installed to detect and ticket drivers running red traffic signals can reduce the frequency and severity of side-impact crashes at intersections.
May receive community disapproval and legality may be challenged; may not be legal in some communities.
Medium Short Medium Enforcement Engineering
Number of crashes at intersections.
Reduced-Conflict
Intersection Treatments
Reduced-Conflict intersection treatments are intended to improve intersection safety and traffic flow. Examples include restricted-Crossing U-Turns and median U-Turns
May initially be confusing to drivers.
Typically, less effective at intersections with high volumes of thru and left turning vehicles.
High Long Difficult Engineering Number of crashes at intersections.
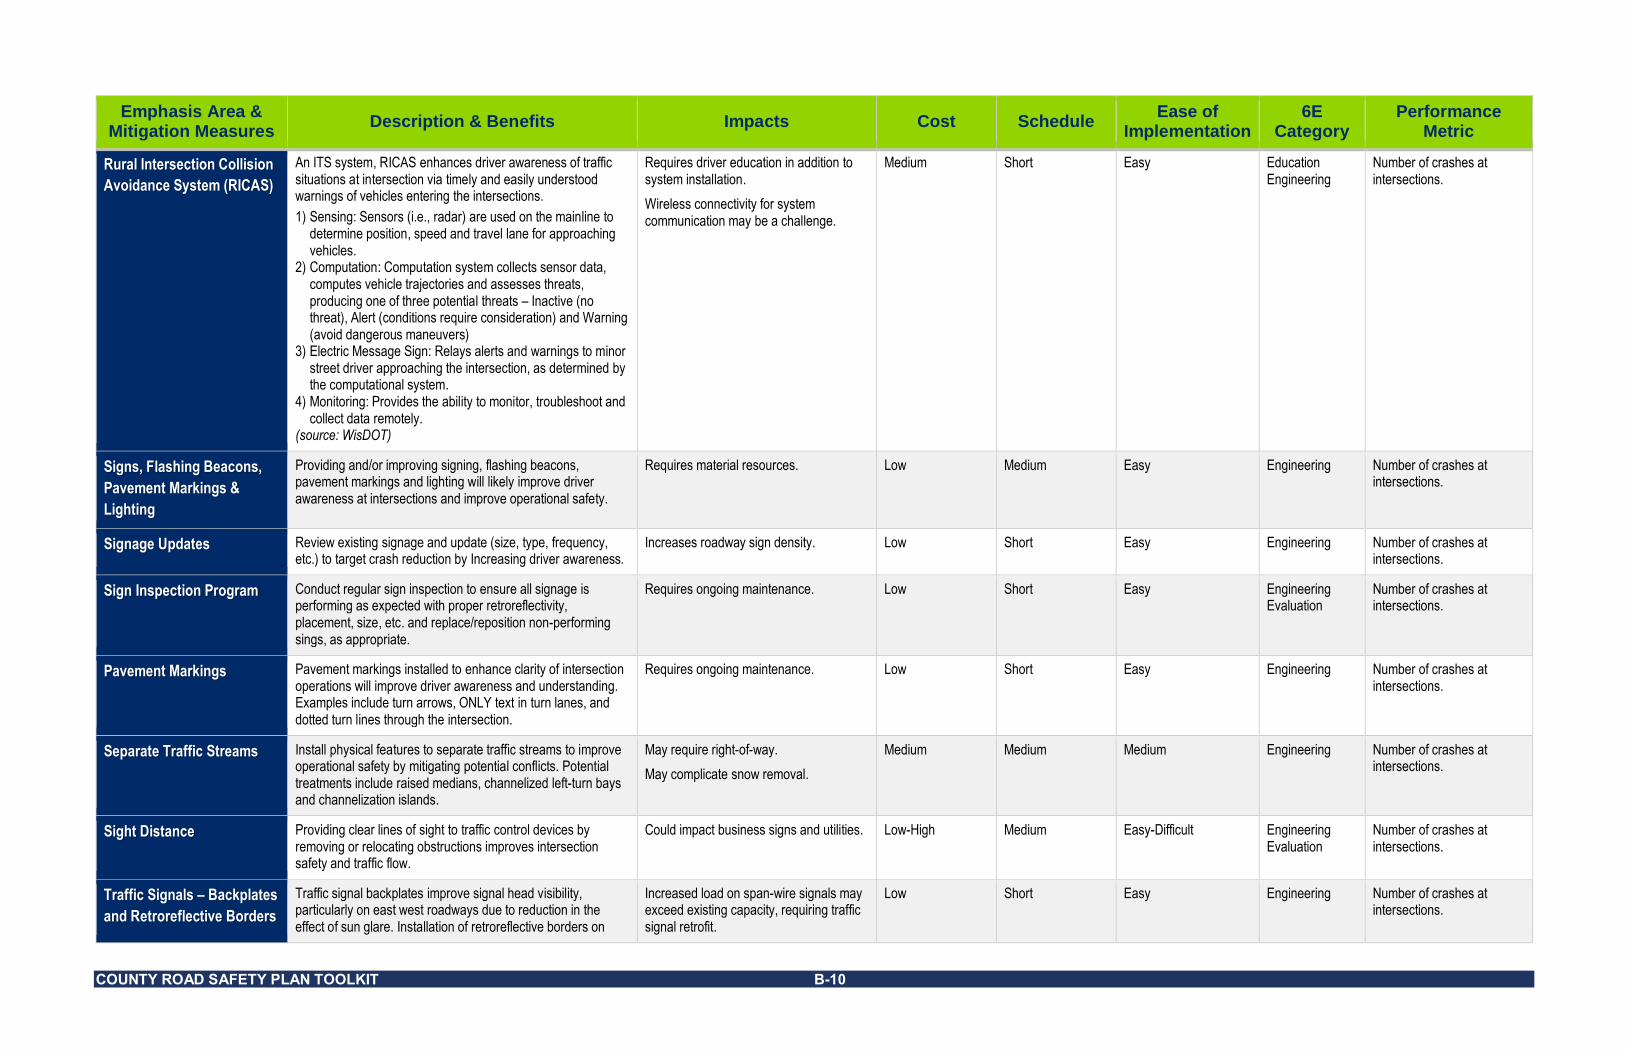
COUNTY ROAD SAFETY PLAN TOOLKIT B-10
Emphasis Area & Mitigation Measures
Description & Benefits Impacts Cost Schedule Ease of
Implementation 6E
Category Performance
Metric
Rural Intersection Collision
Avoidance System (RICAS)
An ITS system, RICAS enhances driver awareness of traffic situations at intersection via timely and easily understood warnings of vehicles entering the intersections.
1) Sensing: Sensors (i.e., radar) are used on the mainline to determine position, speed and travel lane for approaching vehicles.
2) Computation: Computation system collects sensor data, computes vehicle trajectories and assesses threats, producing one of three potential threats – Inactive (no threat), Alert (conditions require consideration) and Warning (avoid dangerous maneuvers)
3) Electric Message Sign: Relays alerts and warnings to minor street driver approaching the intersection, as determined by the computational system.
4) Monitoring: Provides the ability to monitor, troubleshoot and collect data remotely.
(source: WisDOT)
Requires driver education in addition to system installation.
Wireless connectivity for system communication may be a challenge.
Medium Short Easy Education Engineering
Number of crashes at intersections.
Signs, Flashing Beacons,
Pavement Markings &
Lighting
Providing and/or improving signing, flashing beacons, pavement markings and lighting will likely improve driver awareness at intersections and improve operational safety.
Requires material resources. Low Medium Easy Engineering Number of crashes at intersections.
Signage Updates Review existing signage and update (size, type, frequency, etc.) to target crash reduction by Increasing driver awareness.
Increases roadway sign density. Low Short Easy Engineering Number of crashes at intersections.
Sign Inspection Program Conduct regular sign inspection to ensure all signage is performing as expected with proper retroreflectivity, placement, size, etc. and replace/reposition non-performing sings, as appropriate.
Requires ongoing maintenance. Low Short Easy Engineering Evaluation
Number of crashes at intersections.
Pavement Markings Pavement markings installed to enhance clarity of intersection operations will improve driver awareness and understanding. Examples include turn arrows, ONLY text in turn lanes, and dotted turn lines through the intersection.
Requires ongoing maintenance. Low Short Easy Engineering Number of crashes at intersections.
Separate Traffic Streams Install physical features to separate traffic streams to improve operational safety by mitigating potential conflicts. Potential treatments include raised medians, channelized left-turn bays and channelization islands.
May require right-of-way.
May complicate snow removal.
Medium Medium Medium Engineering Number of crashes at intersections.
Sight Distance Providing clear lines of sight to traffic control devices by removing or relocating obstructions improves intersection safety and traffic flow.
Could impact business signs and utilities. Low-High Medium Easy-Difficult Engineering Evaluation
Number of crashes at intersections.
Traffic Signals – Backplates
and Retroreflective Borders
Traffic signal backplates improve signal head visibility, particularly on east west roadways due to reduction in the effect of sun glare. Installation of retroreflective borders on
Increased load on span-wire signals may exceed existing capacity, requiring traffic signal retrofit.
Low Short Easy Engineering Number of crashes at intersections.
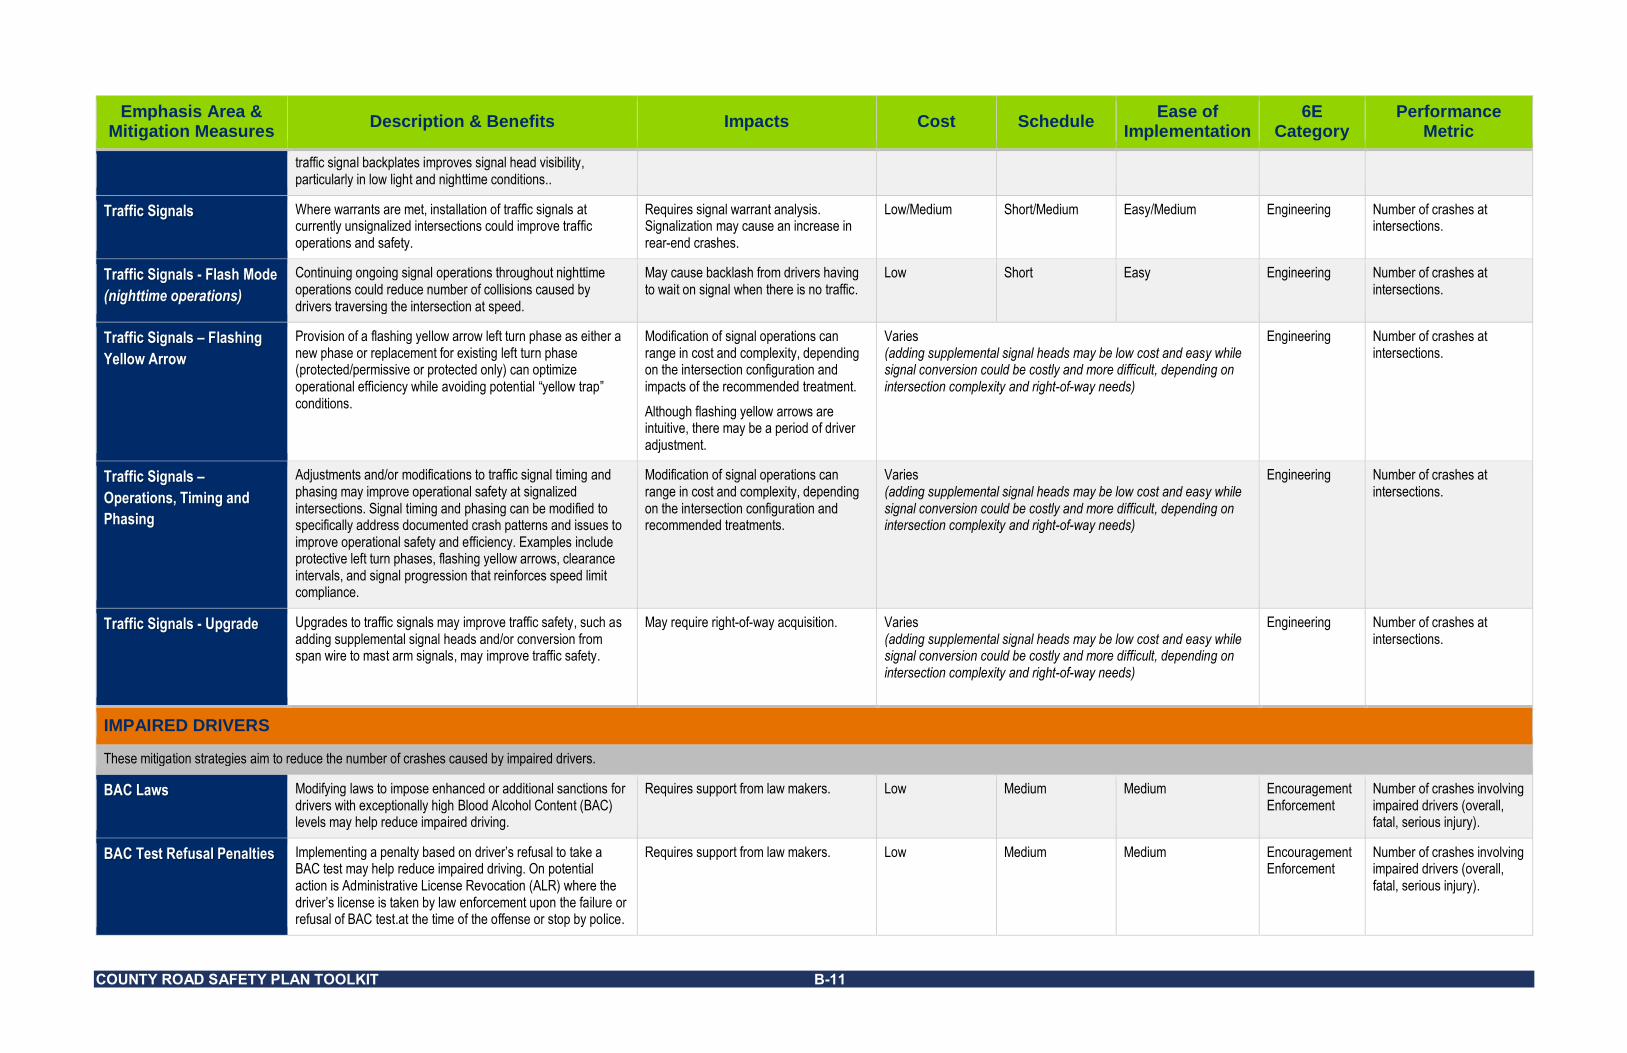
COUNTY ROAD SAFETY PLAN TOOLKIT B-11
Emphasis Area & Mitigation Measures
Description & Benefits Impacts Cost Schedule Ease of
Implementation 6E
Category Performance
Metric
traffic signal backplates improves signal head visibility, particularly in low light and nighttime conditions..
Traffic Signals Where warrants are met, installation of traffic signals at currently unsignalized intersections could improve traffic operations and safety.
Requires signal warrant analysis. Signalization may cause an increase in rear-end crashes.
Low/Medium Short/Medium Easy/Medium Engineering Number of crashes at intersections.
Traffic Signals - Flash Mode
(nighttime operations)
Continuing ongoing signal operations throughout nighttime operations could reduce number of collisions caused by drivers traversing the intersection at speed.
May cause backlash from drivers having to wait on signal when there is no traffic.
Low Short Easy Engineering Number of crashes at intersections.
Traffic Signals – Flashing
Yellow Arrow
Provision of a flashing yellow arrow left turn phase as either a new phase or replacement for existing left turn phase (protected/permissive or protected only) can optimize operational efficiency while avoiding potential “yellow trap” conditions.
Modification of signal operations can range in cost and complexity, depending on the intersection configuration and impacts of the recommended treatment.
Although flashing yellow arrows are intuitive, there may be a period of driver adjustment.
Varies (adding supplemental signal heads may be low cost and easy while signal conversion could be costly and more difficult, depending on intersection complexity and right-of-way needs)
Engineering Number of crashes at intersections.
Traffic Signals –
Operations, Timing and
Phasing
Adjustments and/or modifications to traffic signal timing and phasing may improve operational safety at signalized intersections. Signal timing and phasing can be modified to specifically address documented crash patterns and issues to improve operational safety and efficiency. Examples include protective left turn phases, flashing yellow arrows, clearance intervals, and signal progression that reinforces speed limit compliance.
Modification of signal operations can range in cost and complexity, depending on the intersection configuration and recommended treatments.
Varies (adding supplemental signal heads may be low cost and easy while signal conversion could be costly and more difficult, depending on intersection complexity and right-of-way needs)
Engineering Number of crashes at intersections.
Traffic Signals - Upgrade Upgrades to traffic signals may improve traffic safety, such as adding supplemental signal heads and/or conversion from span wire to mast arm signals, may improve traffic safety.
May require right-of-way acquisition. Varies (adding supplemental signal heads may be low cost and easy while signal conversion could be costly and more difficult, depending on intersection complexity and right-of-way needs)
Engineering Number of crashes at intersections.
IMPAIRED DRIVERS
These mitigation strategies aim to reduce the number of crashes caused by impaired drivers.
BAC Laws Modifying laws to impose enhanced or additional sanctions for drivers with exceptionally high Blood Alcohol Content (BAC) levels may help reduce impaired driving.
Requires support from law makers. Low Medium Medium Encouragement Enforcement
Number of crashes involving impaired drivers (overall, fatal, serious injury).
BAC Test Refusal Penalties Implementing a penalty based on driver’s refusal to take a BAC test may help reduce impaired driving. On potential action is Administrative License Revocation (ALR) where the driver’s license is taken by law enforcement upon the failure or refusal of BAC test.at the time of the offense or stop by police.
Requires support from law makers. Low Medium Medium Encouragement Enforcement
Number of crashes involving impaired drivers (overall, fatal, serious injury).
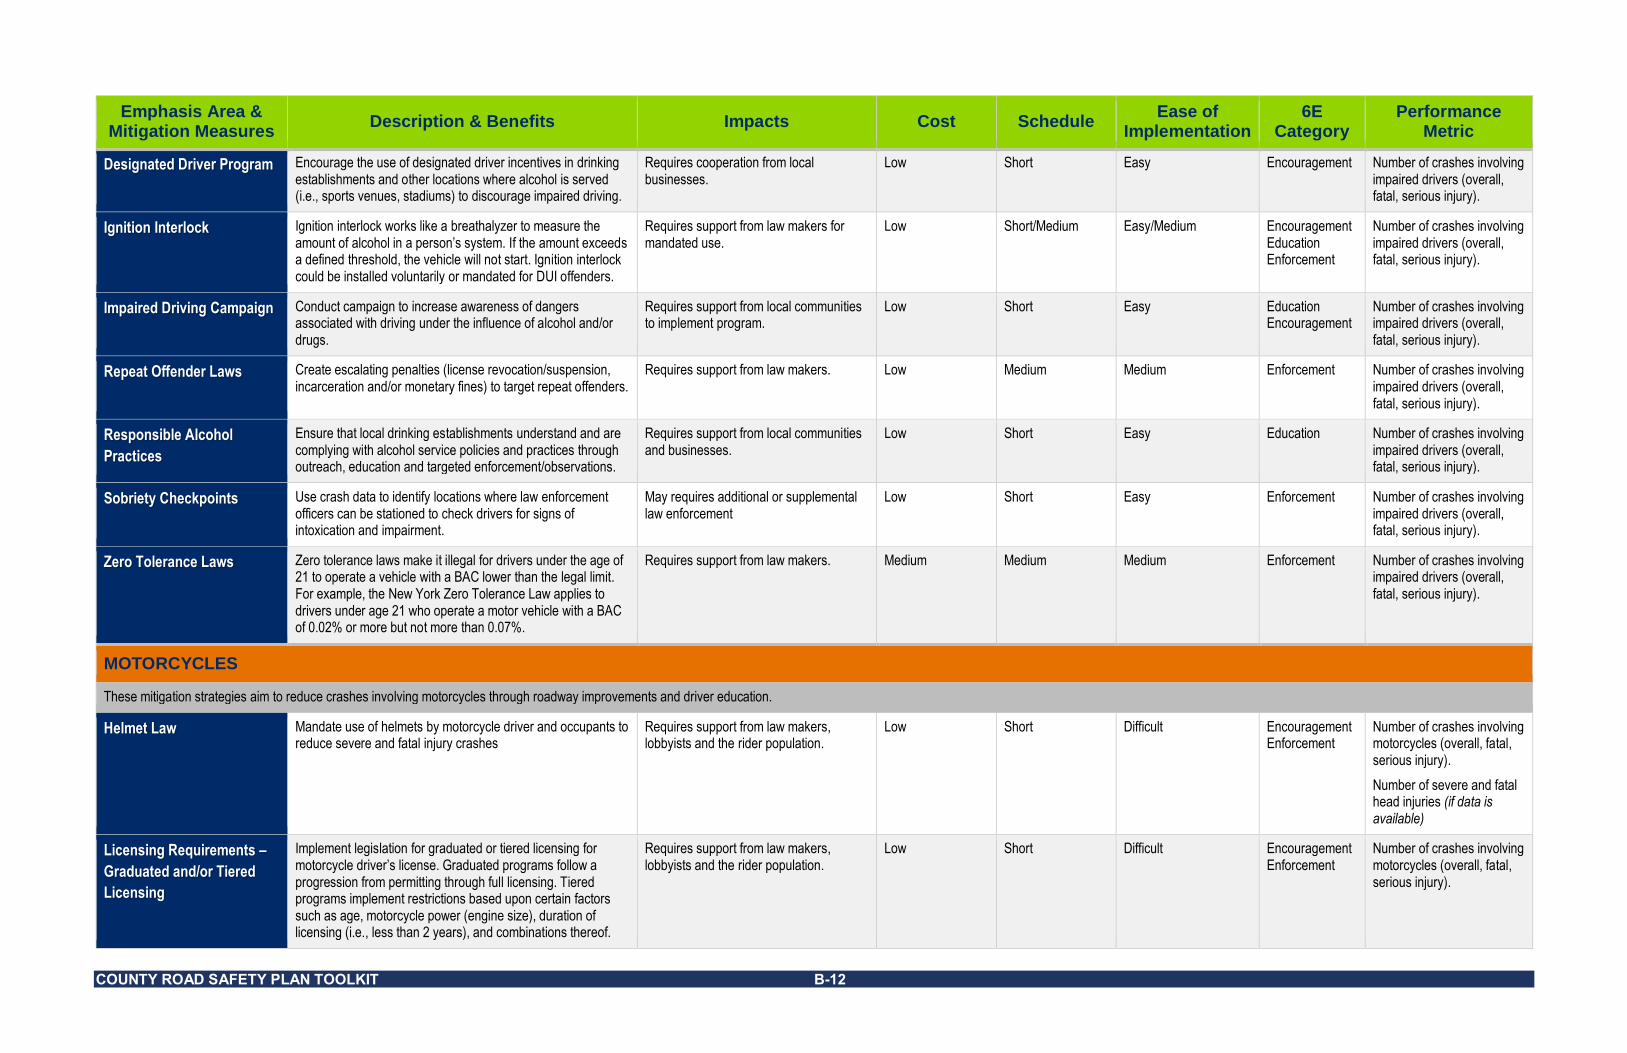
COUNTY ROAD SAFETY PLAN TOOLKIT B-12
Emphasis Area & Mitigation Measures
Description & Benefits Impacts Cost Schedule Ease of
Implementation 6E
Category Performance
Metric
Designated Driver Program Encourage the use of designated driver incentives in drinking establishments and other locations where alcohol is served (i.e., sports venues, stadiums) to discourage impaired driving.
Requires cooperation from local businesses.
Low Short Easy Encouragement Number of crashes involving impaired drivers (overall, fatal, serious injury).
Ignition Interlock Ignition interlock works like a breathalyzer to measure the amount of alcohol in a person’s system. If the amount exceeds a defined threshold, the vehicle will not start. Ignition interlock could be installed voluntarily or mandated for DUI offenders.
Requires support from law makers for mandated use.
Low Short/Medium Easy/Medium Encouragement Education Enforcement
Number of crashes involving impaired drivers (overall, fatal, serious injury).
Impaired Driving Campaign Conduct campaign to increase awareness of dangers associated with driving under the influence of alcohol and/or drugs.
Requires support from local communities to implement program.
Low Short Easy Education Encouragement
Number of crashes involving impaired drivers (overall, fatal, serious injury).
Repeat Offender Laws Create escalating penalties (license revocation/suspension, incarceration and/or monetary fines) to target repeat offenders.
Requires support from law makers. Low Medium Medium Enforcement Number of crashes involving impaired drivers (overall, fatal, serious injury).
Responsible Alcohol
Practices
Ensure that local drinking establishments understand and are complying with alcohol service policies and practices through outreach, education and targeted enforcement/observations.
Requires support from local communities and businesses.
Low Short Easy Education Number of crashes involving impaired drivers (overall, fatal, serious injury).
Sobriety Checkpoints Use crash data to identify locations where law enforcement officers can be stationed to check drivers for signs of intoxication and impairment.
May requires additional or supplemental law enforcement
Low Short Easy Enforcement Number of crashes involving impaired drivers (overall, fatal, serious injury).
Zero Tolerance Laws Zero tolerance laws make it illegal for drivers under the age of 21 to operate a vehicle with a BAC lower than the legal limit. For example, the New York Zero Tolerance Law applies to drivers under age 21 who operate a motor vehicle with a BAC of 0.02% or more but not more than 0.07%.
Requires support from law makers. Medium Medium Medium Enforcement Number of crashes involving impaired drivers (overall, fatal, serious injury).
MOTORCYCLES
These mitigation strategies aim to reduce crashes involving motorcycles through roadway improvements and driver education.
Helmet Law Mandate use of helmets by motorcycle driver and occupants to reduce severe and fatal injury crashes
Requires support from law makers, lobbyists and the rider population.
Low Short Difficult Encouragement Enforcement
Number of crashes involving motorcycles (overall, fatal, serious injury).
Number of severe and fatal head injuries (if data is available)
Licensing Requirements –
Graduated and/or Tiered
Licensing
Implement legislation for graduated or tiered licensing for motorcycle driver’s license. Graduated programs follow a progression from permitting through full licensing. Tiered programs implement restrictions based upon certain factors such as age, motorcycle power (engine size), duration of licensing (i.e., less than 2 years), and combinations thereof.
Requires support from law makers, lobbyists and the rider population.
Low Short Difficult Encouragement Enforcement
Number of crashes involving motorcycles (overall, fatal, serious injury).
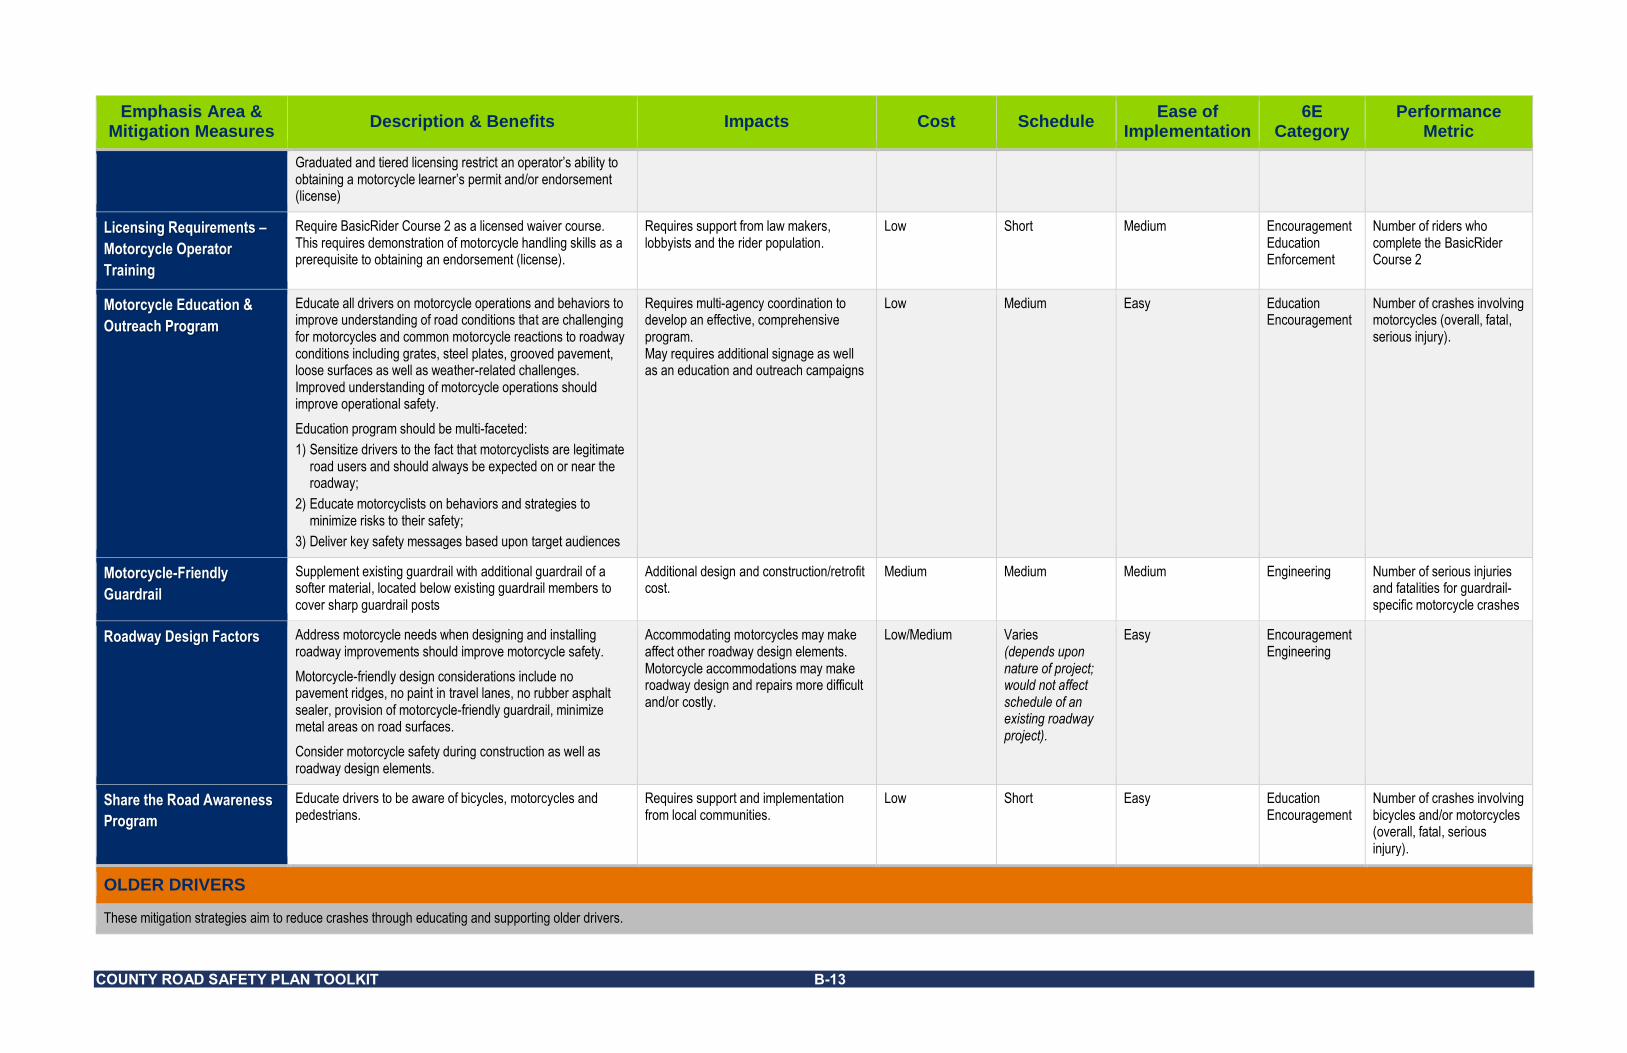
COUNTY ROAD SAFETY PLAN TOOLKIT B-13
Emphasis Area & Mitigation Measures
Description & Benefits Impacts Cost Schedule Ease of
Implementation 6E
Category Performance
Metric
Graduated and tiered licensing restrict an operator’s ability to obtaining a motorcycle learner’s permit and/or endorsement (license)
Licensing Requirements –
Motorcycle Operator
Training
Require BasicRider Course 2 as a licensed waiver course. This requires demonstration of motorcycle handling skills as a prerequisite to obtaining an endorsement (license).
Requires support from law makers, lobbyists and the rider population.
Low Short Medium Encouragement Education Enforcement
Number of riders who complete the BasicRider Course 2
Motorcycle Education &
Outreach Program
Educate all drivers on motorcycle operations and behaviors to improve understanding of road conditions that are challenging for motorcycles and common motorcycle reactions to roadway conditions including grates, steel plates, grooved pavement, loose surfaces as well as weather-related challenges. Improved understanding of motorcycle operations should improve operational safety.
Education program should be multi-faceted:
1) Sensitize drivers to the fact that motorcyclists are legitimate road users and should always be expected on or near the roadway;
2) Educate motorcyclists on behaviors and strategies to minimize risks to their safety;
3) Deliver key safety messages based upon target audiences
Requires multi-agency coordination to develop an effective, comprehensive program. May requires additional signage as well as an education and outreach campaigns
Low Medium Easy Education Encouragement
Number of crashes involving motorcycles (overall, fatal, serious injury).
Motorcycle-Friendly
Guardrail
Supplement existing guardrail with additional guardrail of a softer material, located below existing guardrail members to cover sharp guardrail posts
Additional design and construction/retrofit cost.
Medium Medium Medium Engineering Number of serious injuries and fatalities for guardrail-specific motorcycle crashes
Roadway Design Factors Address motorcycle needs when designing and installing roadway improvements should improve motorcycle safety.
Motorcycle-friendly design considerations include no pavement ridges, no paint in travel lanes, no rubber asphalt sealer, provision of motorcycle-friendly guardrail, minimize metal areas on road surfaces.
Consider motorcycle safety during construction as well as roadway design elements.
Accommodating motorcycles may make affect other roadway design elements. Motorcycle accommodations may make roadway design and repairs more difficult and/or costly.
Low/Medium Varies (depends upon nature of project; would not affect schedule of an existing roadway project).
Easy Encouragement Engineering
Share the Road Awareness
Program
Educate drivers to be aware of bicycles, motorcycles and pedestrians.
Requires support and implementation from local communities.
Low Short Easy Education Encouragement
Number of crashes involving bicycles and/or motorcycles (overall, fatal, serious injury).
OLDER DRIVERS
These mitigation strategies aim to reduce crashes through educating and supporting older drivers.
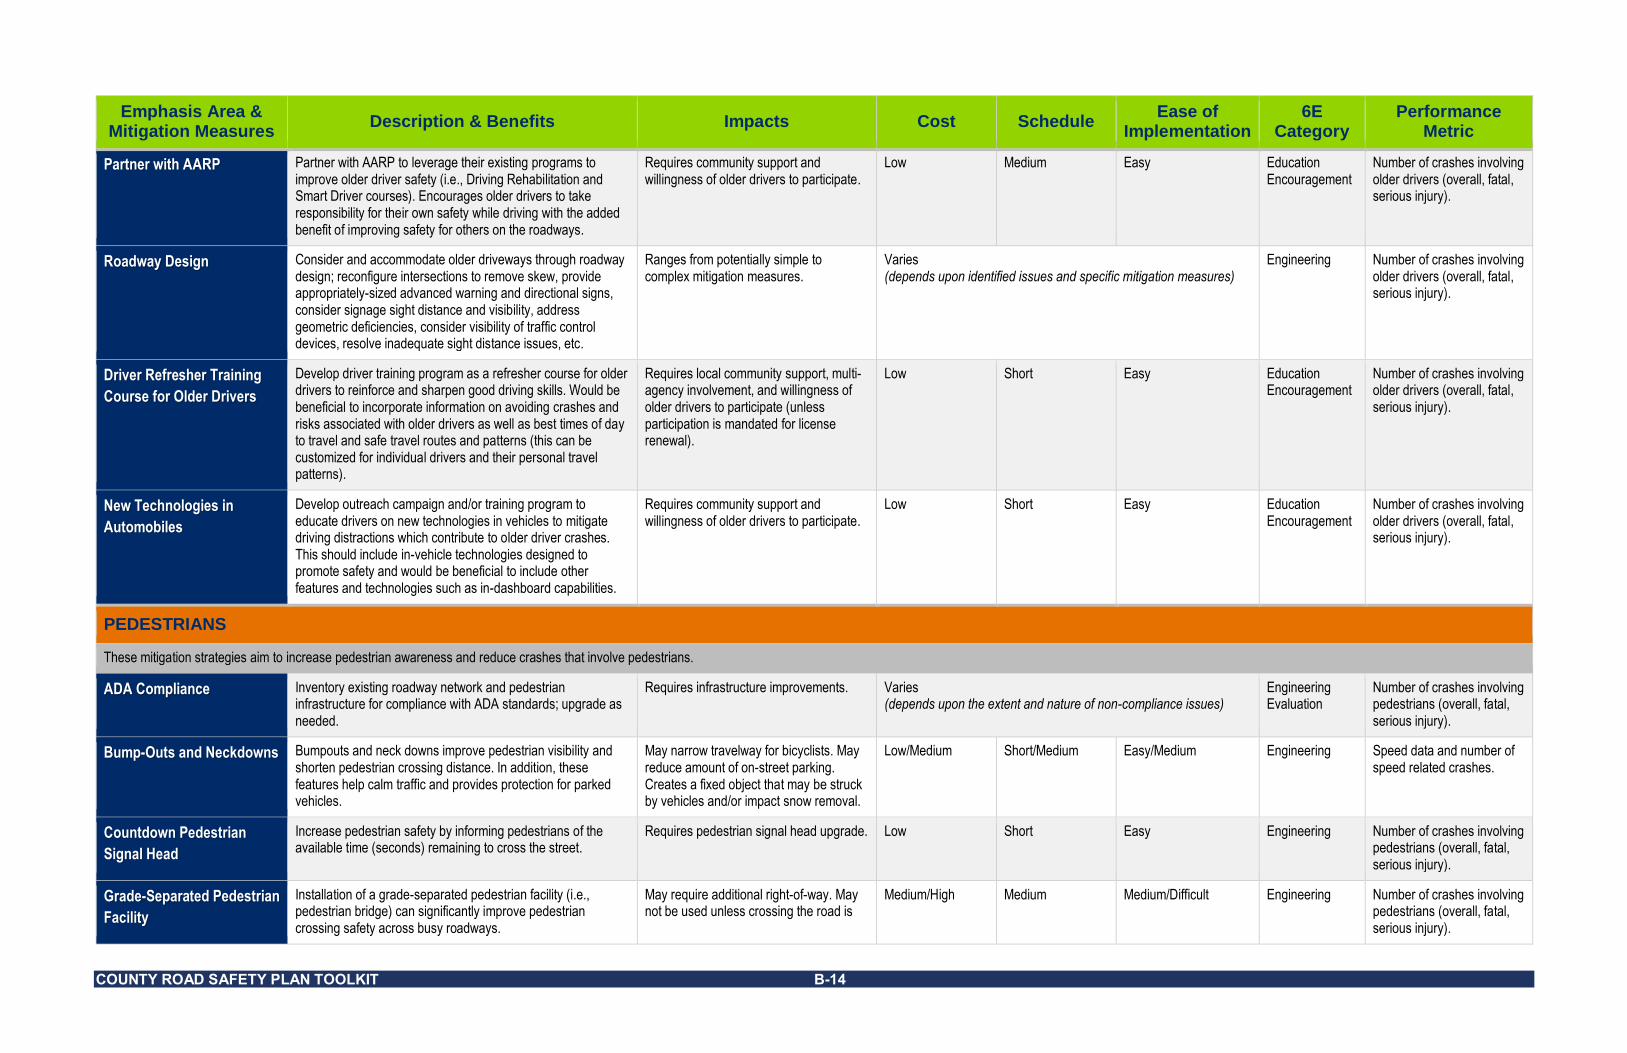
COUNTY ROAD SAFETY PLAN TOOLKIT B-14
Emphasis Area & Mitigation Measures
Description & Benefits Impacts Cost Schedule Ease of
Implementation 6E
Category Performance
Metric
Partner with AARP Partner with AARP to leverage their existing programs to improve older driver safety (i.e., Driving Rehabilitation and Smart Driver courses). Encourages older drivers to take responsibility for their own safety while driving with the added benefit of improving safety for others on the roadways.
Requires community support and willingness of older drivers to participate.
Low Medium Easy Education Encouragement
Number of crashes involving older drivers (overall, fatal, serious injury).
Roadway Design Consider and accommodate older driveways through roadway design; reconfigure intersections to remove skew, provide appropriately-sized advanced warning and directional signs, consider signage sight distance and visibility, address geometric deficiencies, consider visibility of traffic control devices, resolve inadequate sight distance issues, etc.
Ranges from potentially simple to complex mitigation measures.
Varies (depends upon identified issues and specific mitigation measures)
Engineering Number of crashes involving older drivers (overall, fatal, serious injury).
Driver Refresher Training
Course for Older Drivers
Develop driver training program as a refresher course for older drivers to reinforce and sharpen good driving skills. Would be beneficial to incorporate information on avoiding crashes and risks associated with older drivers as well as best times of day to travel and safe travel routes and patterns (this can be customized for individual drivers and their personal travel patterns).
Requires local community support, multi-agency involvement, and willingness of older drivers to participate (unless participation is mandated for license renewal).
Low Short Easy Education Encouragement
Number of crashes involving older drivers (overall, fatal, serious injury).
New Technologies in
Automobiles
Develop outreach campaign and/or training program to educate drivers on new technologies in vehicles to mitigate driving distractions which contribute to older driver crashes. This should include in-vehicle technologies designed to promote safety and would be beneficial to include other features and technologies such as in-dashboard capabilities.
Requires community support and willingness of older drivers to participate.
Low Short Easy Education Encouragement
Number of crashes involving older drivers (overall, fatal, serious injury).
PEDESTRIANS
These mitigation strategies aim to increase pedestrian awareness and reduce crashes that involve pedestrians.
ADA Compliance Inventory existing roadway network and pedestrian infrastructure for compliance with ADA standards; upgrade as needed.
Requires infrastructure improvements. Varies (depends upon the extent and nature of non-compliance issues)
Engineering Evaluation
Number of crashes involving pedestrians (overall, fatal, serious injury).
Bump-Outs and Neckdowns Bumpouts and neck downs improve pedestrian visibility and shorten pedestrian crossing distance. In addition, these features help calm traffic and provides protection for parked vehicles.
May narrow travelway for bicyclists. May reduce amount of on-street parking. Creates a fixed object that may be struck by vehicles and/or impact snow removal.
Low/Medium Short/Medium Easy/Medium Engineering Speed data and number of speed related crashes.
Countdown Pedestrian
Signal Head
Increase pedestrian safety by informing pedestrians of the available time (seconds) remaining to cross the street.
Requires pedestrian signal head upgrade. Low Short Easy Engineering Number of crashes involving pedestrians (overall, fatal, serious injury).
Grade-Separated Pedestrian
Facility
Installation of a grade-separated pedestrian facility (i.e., pedestrian bridge) can significantly improve pedestrian crossing safety across busy roadways.
May require additional right-of-way. May not be used unless crossing the road is
Medium/High Medium Medium/Difficult Engineering Number of crashes involving pedestrians (overall, fatal, serious injury).
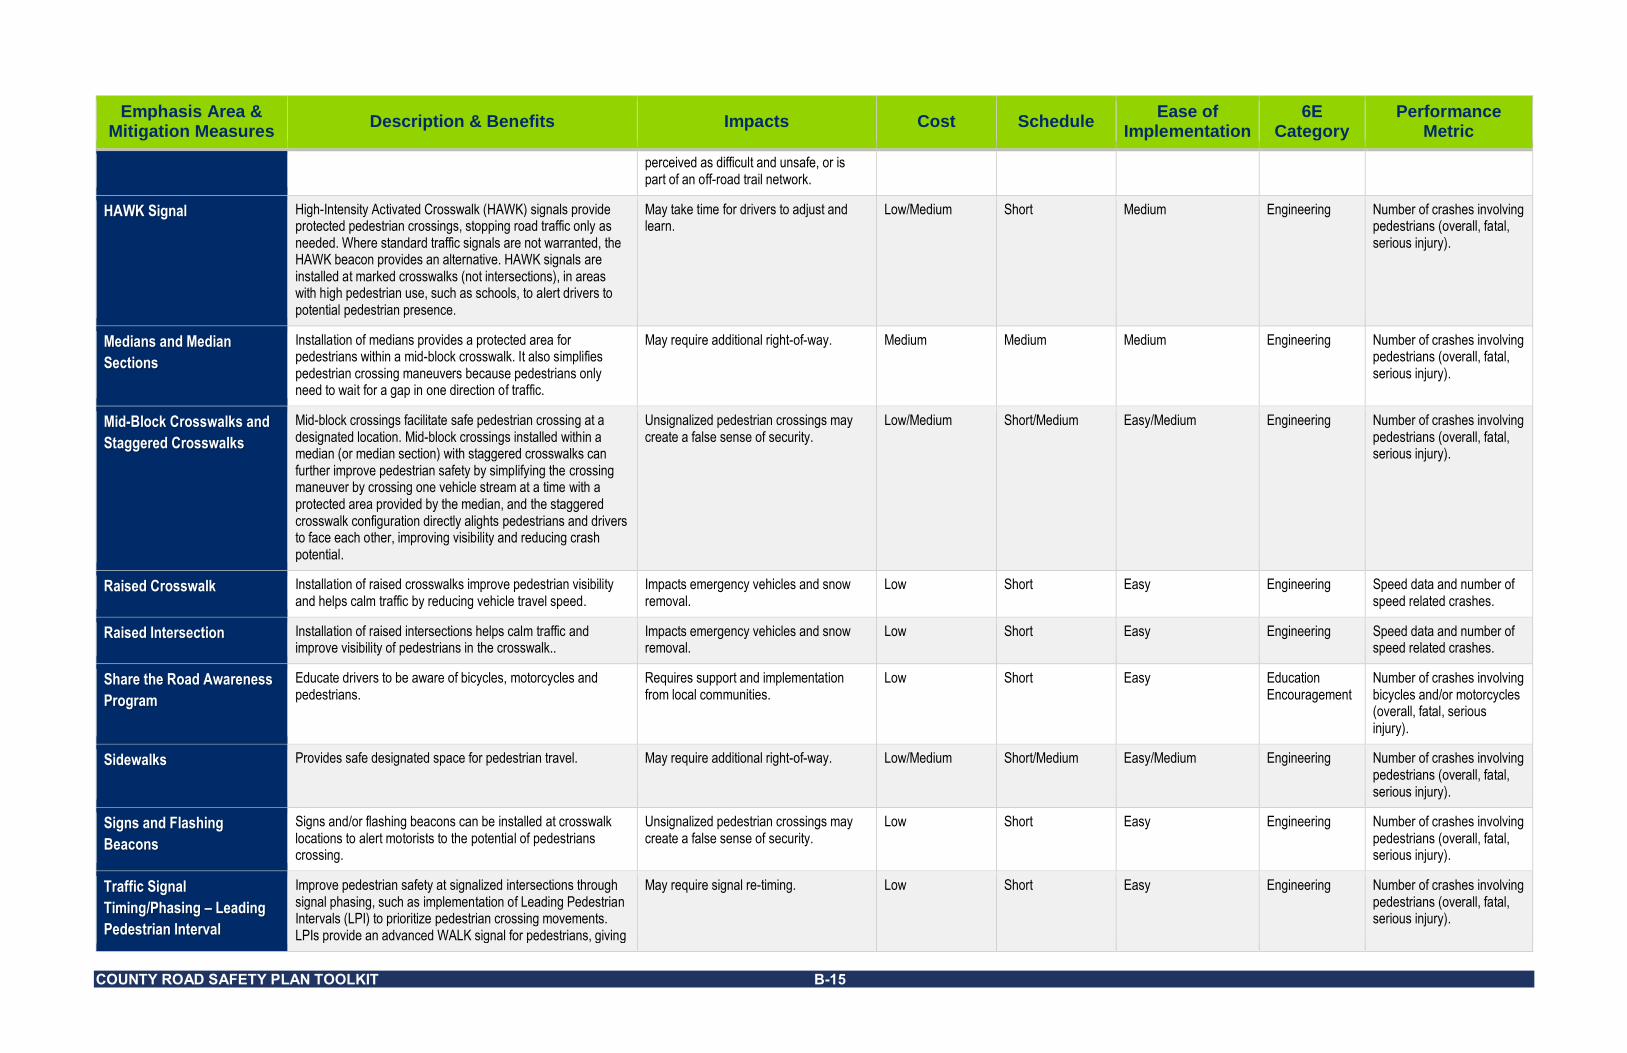
COUNTY ROAD SAFETY PLAN TOOLKIT B-15
Emphasis Area & Mitigation Measures
Description & Benefits Impacts Cost Schedule Ease of
Implementation 6E
Category Performance
Metric
perceived as difficult and unsafe, or is part of an off-road trail network.
HAWK Signal High-Intensity Activated Crosswalk (HAWK) signals provide protected pedestrian crossings, stopping road traffic only as needed. Where standard traffic signals are not warranted, the HAWK beacon provides an alternative. HAWK signals are installed at marked crosswalks (not intersections), in areas with high pedestrian use, such as schools, to alert drivers to potential pedestrian presence.
May take time for drivers to adjust and learn.
Low/Medium Short Medium Engineering Number of crashes involving pedestrians (overall, fatal, serious injury).
Medians and Median
Sections
Installation of medians provides a protected area for pedestrians within a mid-block crosswalk. It also simplifies pedestrian crossing maneuvers because pedestrians only need to wait for a gap in one direction of traffic.
May require additional right-of-way. Medium Medium Medium Engineering Number of crashes involving pedestrians (overall, fatal, serious injury).
Mid-Block Crosswalks and
Staggered Crosswalks
Mid-block crossings facilitate safe pedestrian crossing at a designated location. Mid-block crossings installed within a median (or median section) with staggered crosswalks can further improve pedestrian safety by simplifying the crossing maneuver by crossing one vehicle stream at a time with a protected area provided by the median, and the staggered crosswalk configuration directly alights pedestrians and drivers to face each other, improving visibility and reducing crash potential.
Unsignalized pedestrian crossings may create a false sense of security.
Low/Medium Short/Medium Easy/Medium Engineering Number of crashes involving pedestrians (overall, fatal, serious injury).
Raised Crosswalk Installation of raised crosswalks improve pedestrian visibility and helps calm traffic by reducing vehicle travel speed.
Impacts emergency vehicles and snow removal.
Low Short Easy Engineering Speed data and number of speed related crashes.
Raised Intersection Installation of raised intersections helps calm traffic and improve visibility of pedestrians in the crosswalk..
Impacts emergency vehicles and snow removal.
Low Short Easy Engineering Speed data and number of speed related crashes.
Share the Road Awareness
Program
Educate drivers to be aware of bicycles, motorcycles and pedestrians.
Requires support and implementation from local communities.
Low Short Easy Education Encouragement
Number of crashes involving bicycles and/or motorcycles (overall, fatal, serious injury).
Sidewalks Provides safe designated space for pedestrian travel. May require additional right-of-way. Low/Medium Short/Medium Easy/Medium Engineering Number of crashes involving pedestrians (overall, fatal, serious injury).
Signs and Flashing
Beacons
Signs and/or flashing beacons can be installed at crosswalk locations to alert motorists to the potential of pedestrians crossing.
Unsignalized pedestrian crossings may create a false sense of security.
Low Short Easy Engineering Number of crashes involving pedestrians (overall, fatal, serious injury).
Traffic Signal
Timing/Phasing – Leading
Pedestrian Interval
Improve pedestrian safety at signalized intersections through signal phasing, such as implementation of Leading Pedestrian Intervals (LPI) to prioritize pedestrian crossing movements. LPIs provide an advanced WALK signal for pedestrians, giving
May require signal re-timing. Low Short Easy Engineering Number of crashes involving pedestrians (overall, fatal, serious injury).
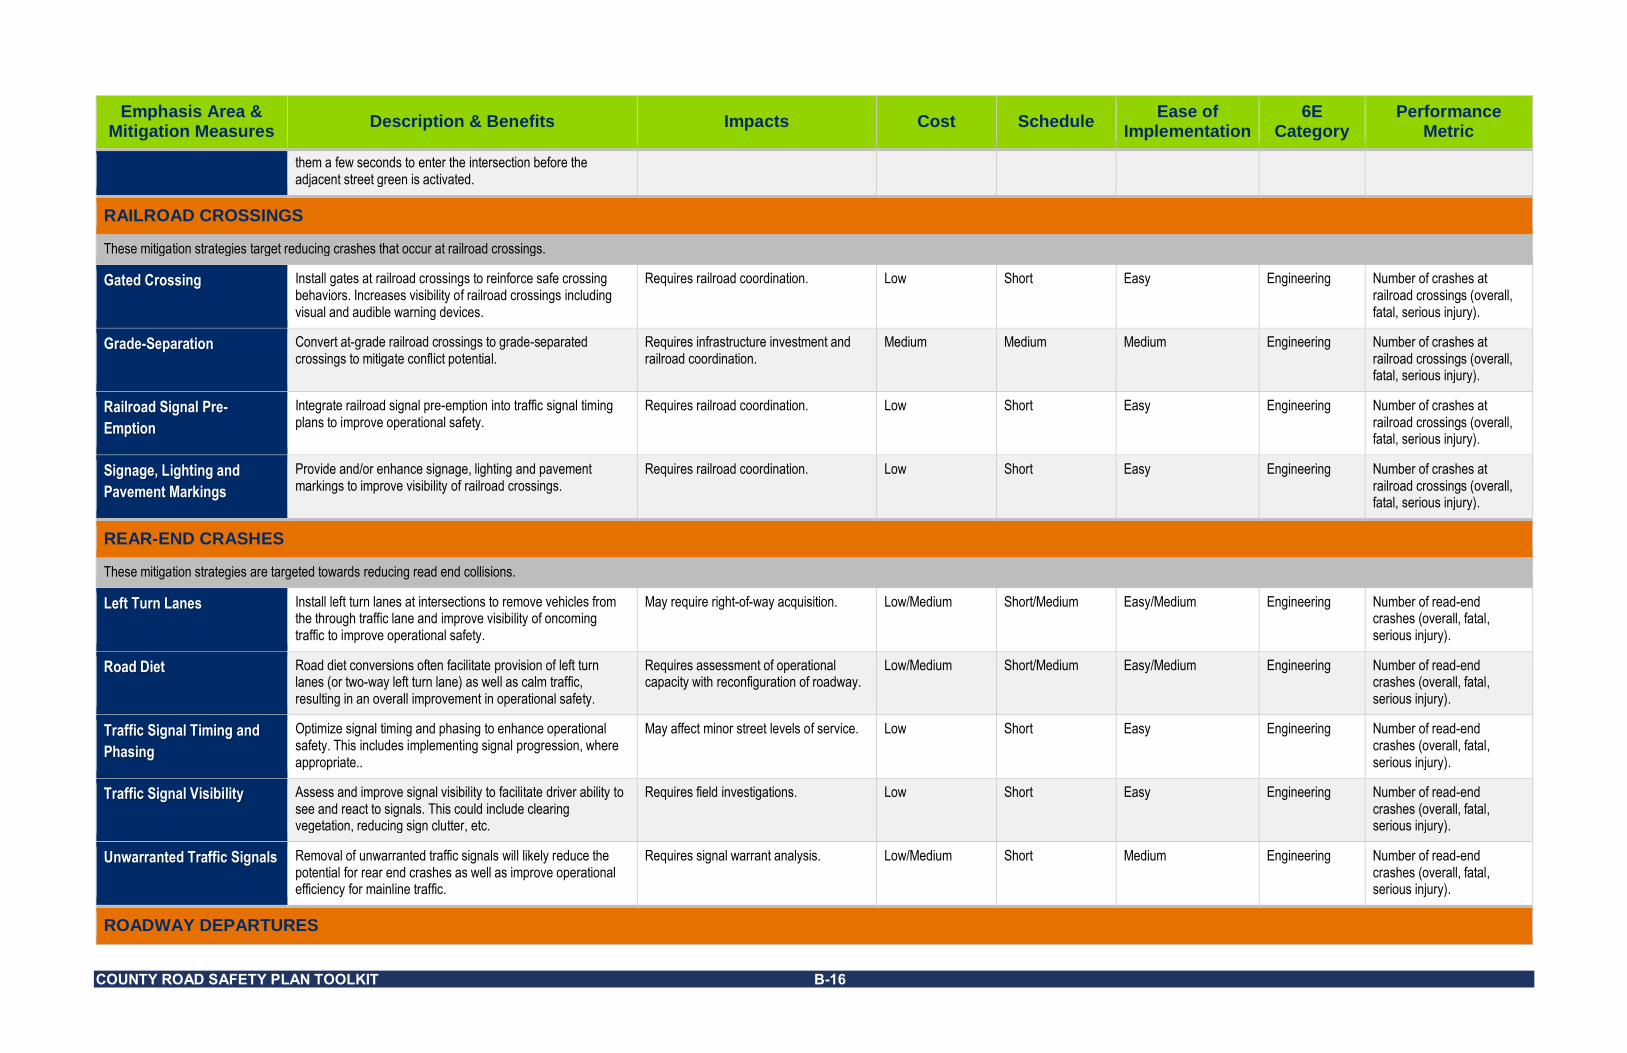
COUNTY ROAD SAFETY PLAN TOOLKIT B-16
Emphasis Area & Mitigation Measures
Description & Benefits Impacts Cost Schedule Ease of
Implementation 6E
Category Performance
Metric
them a few seconds to enter the intersection before the adjacent street green is activated.
RAILROAD CROSSINGS
These mitigation strategies target reducing crashes that occur at railroad crossings.
Gated Crossing Install gates at railroad crossings to reinforce safe crossing behaviors. Increases visibility of railroad crossings including visual and audible warning devices.
Requires railroad coordination. Low Short Easy Engineering Number of crashes at railroad crossings (overall, fatal, serious injury).
Grade-Separation Convert at-grade railroad crossings to grade-separated crossings to mitigate conflict potential.
Requires infrastructure investment and railroad coordination.
Medium Medium Medium Engineering Number of crashes at railroad crossings (overall, fatal, serious injury).
Railroad Signal Pre-
Emption
Integrate railroad signal pre-emption into traffic signal timing plans to improve operational safety.
Requires railroad coordination. Low Short Easy Engineering Number of crashes at railroad crossings (overall, fatal, serious injury).
Signage, Lighting and
Pavement Markings
Provide and/or enhance signage, lighting and pavement markings to improve visibility of railroad crossings.
Requires railroad coordination. Low Short Easy Engineering Number of crashes at railroad crossings (overall, fatal, serious injury).
REAR-END CRASHES
These mitigation strategies are targeted towards reducing read end collisions.
Left Turn Lanes Install left turn lanes at intersections to remove vehicles from the through traffic lane and improve visibility of oncoming traffic to improve operational safety.
May require right-of-way acquisition. Low/Medium Short/Medium Easy/Medium Engineering Number of read-end crashes (overall, fatal, serious injury).
Road Diet Road diet conversions often facilitate provision of left turn lanes (or two-way left turn lane) as well as calm traffic, resulting in an overall improvement in operational safety.
Requires assessment of operational capacity with reconfiguration of roadway.
Low/Medium Short/Medium Easy/Medium Engineering Number of read-end crashes (overall, fatal, serious injury).
Traffic Signal Timing and
Phasing
Optimize signal timing and phasing to enhance operational safety. This includes implementing signal progression, where appropriate..
May affect minor street levels of service. Low Short Easy Engineering Number of read-end crashes (overall, fatal, serious injury).
Traffic Signal Visibility Assess and improve signal visibility to facilitate driver ability to see and react to signals. This could include clearing vegetation, reducing sign clutter, etc.
Requires field investigations. Low Short Easy Engineering Number of read-end crashes (overall, fatal, serious injury).
Unwarranted Traffic Signals Removal of unwarranted traffic signals will likely reduce the potential for rear end crashes as well as improve operational efficiency for mainline traffic.
Requires signal warrant analysis. Low/Medium Short Medium Engineering Number of read-end crashes (overall, fatal, serious injury).
ROADWAY DEPARTURES

COUNTY ROAD SAFETY PLAN TOOLKIT B-17
Emphasis Area & Mitigation Measures
Description & Benefits Impacts Cost Schedule Ease of
Implementation 6E
Category Performance
Metric
These mitigation strategies aim to reduce the occurrence and severity of roadway departure crashes.
Fixed Objects Removal of fixed objects from areas along roadway edges mitigates the risk of vehicles striking fixed objects in event of a roadway departure. If objects cannot reasonably be removed, delineate objects to improve their visibility to drivers.
May not be possible for objects located outside of roadway right-of-way.
Low Short Medium/Difficult Engineering Number of roadway departures crashes (overall, fatal, serious injury).
Guardrail and Guardrail End
Treatments
Install guardrail to shield vehicles from risks along roadway edges (or shield roadside objects) and mitigate potential for roadway departure. Guardrail end treatments reduces fatality risk from crashes involving the ends of guardrails.
Guard rail end treatments may not operate ideally for a wide range of crash speeds.
Medium Medium Medium Engineering Number of roadway departures crashes (overall, fatal, serious injury).
High Friction Surfacing Installation of high-friction pavement surfacing (ultra-thin bonded wearing course) helps increases vehicle grip to reduce risk of slipping. This is beneficial at curves to mitigate the potential for roadway departures.
Requires specialty equipment for installation.
Low Short Easy Engineering Number of roadway departures crashes (overall, fatal, serious injury).
Median Barrier System Installation of a median barrier system mitigates the risk of head-on collisions.
May require additional right-of-way. Medium Medium Medium Engineering Number of roadway departures crashes (overall, fatal, serious injury).
Raised Pavement Markers Installation of raised pavement markers along centerlines and shoulder edgelines improves visibility of roadway limits.
Potential damage with snow removal. Low Short Easy Engineering Number of roadway departures crashes (overall, fatal, serious injury).
Rumble Strips Installation of rumble strips along center line and shoulder edgelines provides tactile warnings to drivers, physically alerting them to roadway limits.
Vibrations result in noise. Rumble strips along shoulder lines impact bicyclists.
Low Short Easy Engineering Number of roadway departures crashes (overall, fatal, serious injury).
Signage and Pavement
Markings
Provision of retroreflective warning signs and pavement markings, particularly in and around horizontal curves, alerts drivers to potential risks. This could include curve ahead with warning speed signs, chevrons and arrow signs.
Requires field investigations. Low Short Easy Engineering Number of roadway departures crashes (overall, fatal, serious injury).
Sloped Roadway Edges Sloping roadway edges beyond the roadway shoulder helps mitigate the loss of stability with roadway departures and facilitates safe re-entry into the roadway.
May require additional right-of-way. Medium Medium Medium Engineering Number of roadway departures crashes (overall, fatal, serious injury).
Slopes and Ditches Assess locations of slopes and ditches, along with crash data) to identify areas with high risk of rollovers. Mitigate potential by installing guardrail or physically changing the conditions.
Requires field investigations. Low/Medium Medium Easy/Medium Engineering Evaluation
Number of roadway departures crashes (overall, fatal, serious injury).
Superelevation and Lane
Widening
Provision of superelevation and/or lane widening through curves helps reduce risk of road departure.
Requires reconstruction. Medium Medium Medium Engineering Speed data and number of speed related crashes.
Widen Shoulders Widening roadway shoulders, where possible, increases the recovery potential for vehicles that drift out of the travel lane.
May require additional right-of-way. Medium Medium Medium Engineering Number of roadway departures crashes (overall, fatal, serious injury).

COUNTY ROAD SAFETY PLAN TOOLKIT B-18
Emphasis Area & Mitigation Measures
Description & Benefits Impacts Cost Schedule Ease of
Implementation 6E
Category Performance
Metric
Safety Edge Safety edge is a specific asphalt paving technique where the interface between the roadway and graded shoulder is paved at an optimal angle to minimize vertical drop-off and provide a safer roadway edge.
Requires fitting resurfacing equipment with a device that extrudes and compacts the shape of the pavement edge.
Medium Medium Medium Engineering Number of roadway departures crashes (overall, fatal, serious injury).
Road Safety Audits RSA is a formal safety performance examination of a roadway. It estimates and reports on potential road safety issues and identifies opportunities for improvements in safety for all road users.
Requires field investigations. Low Short Easy/Medium Engineering Evaluation
Number of roadway departures crashes (overall, fatal, serious injury).
SPEED-RELATED CRASHES
These mitigation strategies aim to reduce vehicle speeds with the correlated benefit of reducing the frequency and severity of crashes where speed is a contributing factor.
Bump-Outs and Neckdowns Installation of bumpouts and neck downs helps calm traffic and provides protection for parked vehicles. In addition, bumpouts at intersections help improve visibility and mid-block bump-outs can facilitate safe mid-block crossings.
May narrow travelway for bicyclists. May reduce amount of on-street parking. Creates a fixed object that may be struck by vehicles and/or impact snow removal.
Low/Medium Short Easy Engineering Speed data and number of speed related crashes.
Chicanes Installation of chicanes along straight roads introduces curvature that helps calm traffic and reduce vehicle travel speed. It may also improve streetscape by providing areas for landscaping.
Drivers may cross the centerline to shorten travel distance between chicanes. Chicanes may narrow the travelway for bicyclists. May reduce amount of on-street parking. Creates a fixed object that may be struck by vehicles and/or impact snow removal.
Medium Short Easy Engineering Speed data and number of speed related crashes.
High Friction Surfacing Installation of high-friction pavement surfacing (ultra-thin bonded wearing course) helps increases vehicle grip to reduce risk of slipping.
Requires specialty equipment for installation.
Low Short Easy Engineering Number of roadway departures crashes (overall, fatal, serious injury).
On-Street Parking Provision of on-street parking can help calm traffic. Requires signing to ensure compliance and avoid confusion.
Low Short Easy Engineering Speed data and number of speed related crashes.
Road Diet Road diet conversions help calm traffic and reinforce safe travel speeds. They also often facilitate provision of left turn lanes (or two-way left turn lane), resulting in an overall improvement in operational safety.
Requires assessment of operational capacity with reconfiguration of roadway.
Low/Medium Short/Medium Easy/Medium Engineering Number of read-end crashes (overall, fatal, serious injury).
Roundabouts and Mini
Circles
Installation of roundabouts or mini circles, either individually or in a series, help calm traffic and reduce vehicle travel speed. They also reduce the frequency and severity of crashes at intersections.
May require right-of-way acquisition. Low/Medium Short/Medium Easy/Medium Engineering Speed data and number of speed related crashes.
Speed Humps and Speed
Tables
Installation of speed humps or speed tables help calm traffic and reduce vehicle travel speed.
Impacts emergency vehicles and snow removal.
Low Short Easy Engineering Speed data and number of speed related crashes.
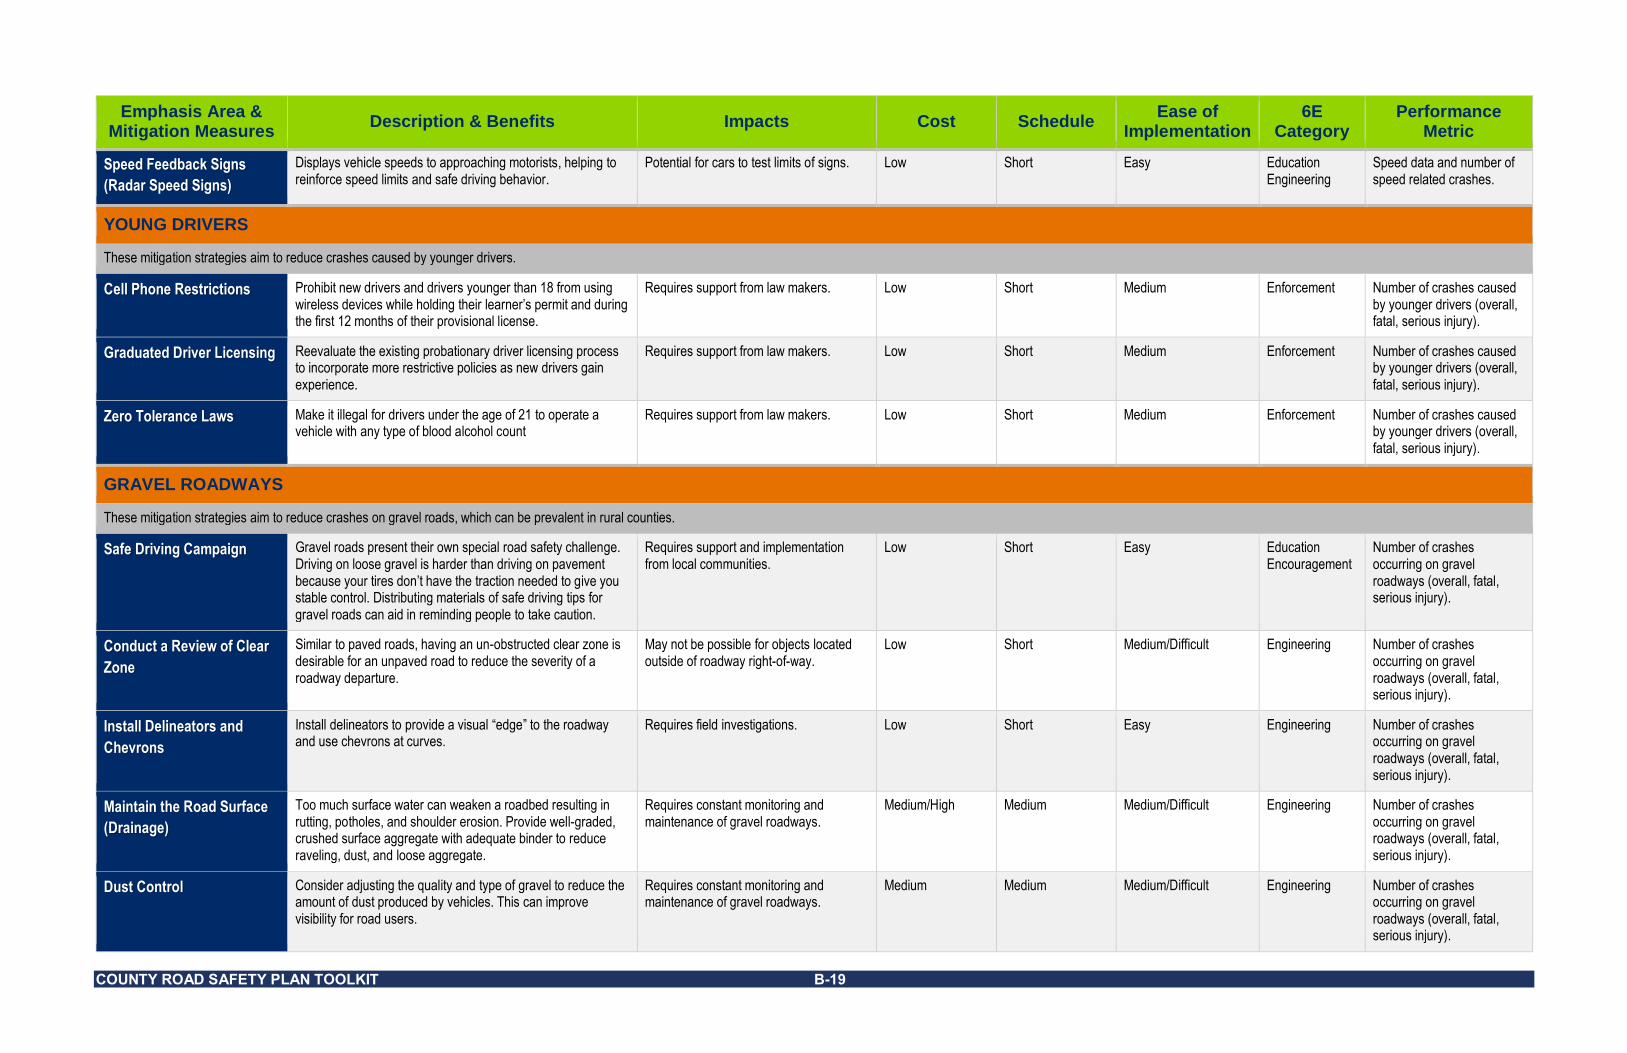
COUNTY ROAD SAFETY PLAN TOOLKIT B-19
Emphasis Area & Mitigation Measures
Description & Benefits Impacts Cost Schedule Ease of
Implementation 6E
Category Performance
Metric
Speed Feedback Signs
(Radar Speed Signs)
Displays vehicle speeds to approaching motorists, helping to reinforce speed limits and safe driving behavior.
Potential for cars to test limits of signs. Low Short Easy Education Engineering
Speed data and number of speed related crashes.
YOUNG DRIVERS
These mitigation strategies aim to reduce crashes caused by younger drivers.
Cell Phone Restrictions Prohibit new drivers and drivers younger than 18 from using wireless devices while holding their learner’s permit and during the first 12 months of their provisional license.
Requires support from law makers. Low Short Medium Enforcement Number of crashes caused by younger drivers (overall, fatal, serious injury).
Graduated Driver Licensing Reevaluate the existing probationary driver licensing process to incorporate more restrictive policies as new drivers gain experience.
Requires support from law makers. Low Short Medium Enforcement Number of crashes caused by younger drivers (overall, fatal, serious injury).
Zero Tolerance Laws Make it illegal for drivers under the age of 21 to operate a vehicle with any type of blood alcohol count
Requires support from law makers. Low Short Medium Enforcement Number of crashes caused by younger drivers (overall, fatal, serious injury).
GRAVEL ROADWAYS
These mitigation strategies aim to reduce crashes on gravel roads, which can be prevalent in rural counties.
Safe Driving Campaign Gravel roads present their own special road safety challenge. Driving on loose gravel is harder than driving on pavement because your tires don’t have the traction needed to give you stable control. Distributing materials of safe driving tips for gravel roads can aid in reminding people to take caution.
Requires support and implementation from local communities.
Low Short Easy Education Encouragement
Number of crashes occurring on gravel roadways (overall, fatal, serious injury).
Conduct a Review of Clear
Zone
Similar to paved roads, having an un-obstructed clear zone is desirable for an unpaved road to reduce the severity of a roadway departure.
May not be possible for objects located outside of roadway right-of-way.
Low Short Medium/Difficult Engineering Number of crashes occurring on gravel roadways (overall, fatal, serious injury).
Install Delineators and
Chevrons
Install delineators to provide a visual “edge” to the roadway and use chevrons at curves.
Requires field investigations. Low Short Easy Engineering Number of crashes occurring on gravel roadways (overall, fatal, serious injury).
Maintain the Road Surface
(Drainage)
Too much surface water can weaken a roadbed resulting in rutting, potholes, and shoulder erosion. Provide well-graded, crushed surface aggregate with adequate binder to reduce raveling, dust, and loose aggregate.
Requires constant monitoring and maintenance of gravel roadways.
Medium/High Medium Medium/Difficult Engineering Number of crashes occurring on gravel roadways (overall, fatal, serious injury).
Dust Control Consider adjusting the quality and type of gravel to reduce the amount of dust produced by vehicles. This can improve visibility for road users.
Requires constant monitoring and maintenance of gravel roadways.
Medium Medium Medium/Difficult Engineering Number of crashes occurring on gravel roadways (overall, fatal, serious injury).