Embed Size (px)
Citation preview

K.7
Home Country Interest Rates and International Investment in U.S. Bonds Ammer, John, Stijn Claessens, Alexandra Tabova, and Caleb Wroblewski
International Finance Discussion Papers Board of Governors of the Federal Reserve System
Number 1231 June 2018
Please cite paper as: Ammer, John, Stijn Claessens, Alexandra Tabova, and Caleb Wroblewski (2018). Home Country Interest Rates and International Investment in U.S. Bonds. International Finance Discussion Papers 1231. https://doi.org/10.17016/IFDP.2018.1231

Board of Governors of the Federal Reserve System
International Finance Discussion Papers
Number 1231
June 2018
Home Country Interest Rates and International Investment in U.S. Bonds
John Ammer, Stijn Claessens, Alexandra Tabova, and Caleb Wroblewski NOTE: International Finance Discussion Papers are preliminary materials circulated to stimulate discussion and critical comment. References to International Finance Discussion Papers (other than an acknowledgment that the writer has had access to unpublished material) should be cleared with the author or authors. Recent IFDPs are available on the Web at www.federalreserve.gov/pubs/ifdp/. This paper can be downloaded without charge from the Social Science Research Network electronic library at www.ssrn.com.
Home Country Interest Rates and International
Investment in U.S. Bonds
John Ammera, Stijn Claessensb, Alexandra Tabovaa, Caleb Wroblewskia
June 19, 2018
Abstract
We analyze how interest rates affect cross-border portfolio investments. Data on
U.S. bond holdings by foreign investors from 31 countries for the period 2003 - 2016
and a large variety in movements in interest rates in these countries provide for a
unique way to analyze shifts in investment behavior in response to interest rates.
We find that low(er) interest rates, now prevailing in many advanced countries, lead
to greater investment in general into the United States, with the effects generally
driven by investment in (higher yielding) corporate bonds, rather than in Treasury
bonds. In addition to affecting overall investments, lower interest rates at home
are associated with a greater weight on corporate bonds, consistent with search-
for-yield. The results are economically important and robust to controlling for a
number of country-specific macroeconomic and financial conditions as well as to
sample restrictions and choices of interest rate. Our findings have important policy
implications in that they suggest that low interest rates can lead to shifts in the
volume and composition of overseas investments.
JEL Classification: F21, F34, G11, G20
Keywords: low interest rates, search-for-yield, portfolio choice, safe and risky assets,
U.S. bonds
aBoard of Governors of the Federal Reserve System, Washington, DC 20551, USAbBank for International Settlements, 4051 Basel, SwitzerlandWe thank Joshua Aizenman, Pierre-Olivier Gourinchas, Galina Hale, Zheng Liu, Mark Spiegel,
Colin Weiss, and participants at the 2017 Asia Economic Policy Conference for helpful comments. Wethank Viktors Stebunovs and Wenxin Du for help with some of the data. Corresponding author: [email protected]. Wroblewski is currently at the University of Chicago Booth School of Business,most of the work was completed while he was at the Board of Governors. The views in this paper aresolely the responsibility of the authors and should not be interpreted as reflecting the views of the Boardof Governors of the Federal Reserve System or any other person associated with the Federal ReserveSystem or the Bank for International Settlements.

1 Introduction
Using data on foreign private investment in U.S. bonds from 31 countries for the pe-
riod 2003-2016, the paper studies how portfolio investment is affected by investors’ home
country macroeconomic and financial conditions. In particular, we explore how home
investment opportunities, proxied by the home country sovereign yield, affect bond in-
vestment into the United States in general, as well as the composition of this investment
in terms of riskier (corporate bonds) and safer (Treasuries) securities. We find that, in
response to a lower interest rate at home, foreign investors increase their aggregate bond
investment in the United States, and they also increase risk-taking in their U.S. portfolios
through an increased weight on corporate bonds, consistent with search-for-yield.
Our work relates to two strands of the literature: that on the push and pull drivers
of capital flows; and that on the role of country characteristics in international portfolio
allocation and the related, but more recent work on portfolio risk-taking in a low interest
rate environment. In this paper we expand on these literatures in several ways. First,
we use data on foreign countries’ holdings of U.S. bonds that distinguish between private
and official investors’ portfolios. This allows us to focus on portfolio shifts by private in-
vestors in response to domestic macroeconomic and financial conditions. The distinction
is useful because the motivations of official investors (e.g., central bank reserve managers)
for holding U.S. securities likely differ from those of private investors. Second, our em-
pirical identification is strengthened because we are able to combine long time series of
portfolio holdings with a cross-section of several dozen investor countries that exhibit
significant heterogeneity in the dynamics of their home interest rates and other financial
and macroeconomic conditions. Thus, these data allow us to study how investor-country
conditions interact with their investment choices. Related, we contribute to the limited
empirical work on the effects of interest rates on the composition of investors’ debt se-
curities portfolios (Domanski, Shin, and Sushko (2017), Choi and Kronlund (2017), di
Maggio and Kacperczyk (2017), Ammer et al. (2018)).1 The paper complements Ammer
et al. (2018), who using security-level data, find evidence of search-for-yield behavior
within foreign investors’ portfolio of U.S. corporate bonds in that when investing in U.S.
corporate bonds, investors facing declining home investment opportunities prefer higher
yielding (but riskier) securities. Here, we show that both aggregate flows and the allo-
cation between corporate bonds and safer Treasuries are also affected by home country
interest rates.
We explore these advantages in the data by comparing the drivers of investment in the
two largest classes of U.S. debt securities: corporate and Treasury bonds. This allows us
1Most of the empirical literature on risk-taking related to interest rates have focused on the effectson either bank lending and bank loan portfolios or mutual fund flows to broad asset categories.
1

to investigate both flight-for-safety and search-for-yield. The data on portfolio investment
in U.S. bonds is derived from the detailed data underlying the Treasury International
Capital (TIC) annual surveys. While much of our focus is on home country investment
opportunities, proxied mainly by the home country sovereign yield, we also analyze the
role of other country macroeconomic and financial conditions. We also control for certain
“gravity” type characteristics for investment, such as countries’ trade and financial links
with the United States.
We find that the lower the interest rate in the investor’s home country, the more
investors increase their investments in the United States as a ratio to their home GDP,
with the effects generally coming through investment in U.S. corporate sector bonds,
rather than in Treasury bonds. These regression results are consistent with international
capital flows responding to relative investment opportunities, as well as shifts in portfo-
lio composition reflecting search-for-yield motives. Importantly, regression results using
hedged and unhedged sovereign rates show that the incentives to invest in both the more
risky U.S. corporate bonds and in Treasuries depend on the (nominal) home, not on the
equivalent hedged dollar interest rate. This finding suggests that investors’ incentives
lead them to place more weight on the unhedged local rate as a measure against which to
compare the gross return on a U.S. dollar debt investment. Put differently, investors do
not appear to take hedging costs into account. Rather, they appear to compare nominal
promised rates of return among investment choices. The effects are economically impor-
tant. We estimate that when a country’s home interest rate is 100 basis-points lower, its
investment in U.S. corporate bonds rises by 3.6 to 5.3 percent of GDP. The effects for
investment in Treasuries are much smaller and only evident in the post-crises period: an
equivalent drop in the home interest rate is associated with a rise in investment of 0.2
percent of GDP.
Analyzing further the portfolio allocation within a country’s U.S. bond portfolio,
specifically the share of corporate bonds, we find further evidence suggestive of search-for-
yield in terms of foreign investors taking on relatively more credit risk. More specifically,
a lower home interest rate generally increases portfolio weights for corporate bonds within
countries’ portfolio of U.S. bonds, although we find less evidence of this during periods
of financial crises, when investors shift more toward Treasuries. The results are robust
to different choices for the domestic interest rate with which we proxy home investment
opportunities as well as to country sample choices. Results are also robust to other
controls related to the dollar exchange rate and home investment opportunities.
Overall, our findings suggest that foreign investors’ U.S. bond portfolios gravitate
toward corporate securities, as opposed to the safe Treasury bonds, when their home
interest rates reach low levels. Although, apart from investment in U.S. assets, we do
2

not know how private investors in these countries allocate their overseas investments,
our finding that a lower interest rate at home increases U.S. portfolio debt investment
disproportionately in corporate bonds, suggests that countries’ external investments may
rebalance toward riskier assets when their domestic interest rates are low.
The paper proceeds as follows. In section 2, we review the related literature. In section
3, we provide an overview of the securities holdings dataset and other data sources we use.
Section 4 presents some stylized facts and summary statistics. In section 5 we outline our
empirical methodology and in section 6 we present the empirical results on how countries’
U.S. bond portfolios vary in response to changes in home interest rates and other country
conditions and characteristics. Section 7 includes robustness tests. Section 8 concludes
and discusses possible policy implications.
2 Related Literature
Our work adds to two main strands in the literature on capital flows. The first is the
literature on push and pull factors, which has explored the role of source and destination
country conditions for capital flows (among others Forbes and Warnock (2012), Fratzscher
(2012), and Broner et al. (2013)). Among the push factors, an important one has been
(low) interest rates, especially their effect on capital inflows to emerging markets, and
more recently the effects of the use of unconventional monetary policy by several advanced
countries.2 Other papers have analyzed how banks globally reallocate loans in response to
changes in interest rates (e.g., Aramonte, Lee, and Stebunovs, 2015; Morais, Peydro, and
Ruiz (2017)). Much of this literature, however, has largely relied on aggregate balance-of-
payments data to assess international portfolio composition and capital flows.3 Research
using more granular data on investment choices typically has been limited to a narrower
set of investors for which data are available. And rarely have studies covered a broad
cross-section of investor countries.
In addition, our paper is related to the growing literature on search-for-yield. A num-
ber of papers have pointed out that there could be a search-for-yield effect for institutions
with long-term liabilities and shorter-term assets, such as life insurance companies and
pension funds.4 Incentives to reach for yield among asset managers could be greater at
low levels of the interest rate (Rajan (2010) and Stein (2013)).
2See, e.g., Chari, Dilts Stedman, and Lundblad (2017); Fratzscher, Lo Duca, and Straub (2016,2017); Ahmed and Zlate (2014); and Bowman, Londono, and Sapriza (2015).
3See also Cerutti et al. (2018) and Rey (2013). Using loan level data, Baskaya et al. (2018) linkimproving external financial conditions to capital inflows, increased local bank credit, and lower loanrates.
4Rajan (2005), Dell’Ariccia and Marquez (2013), Domanski, Shin, and Sushko (2017).
3
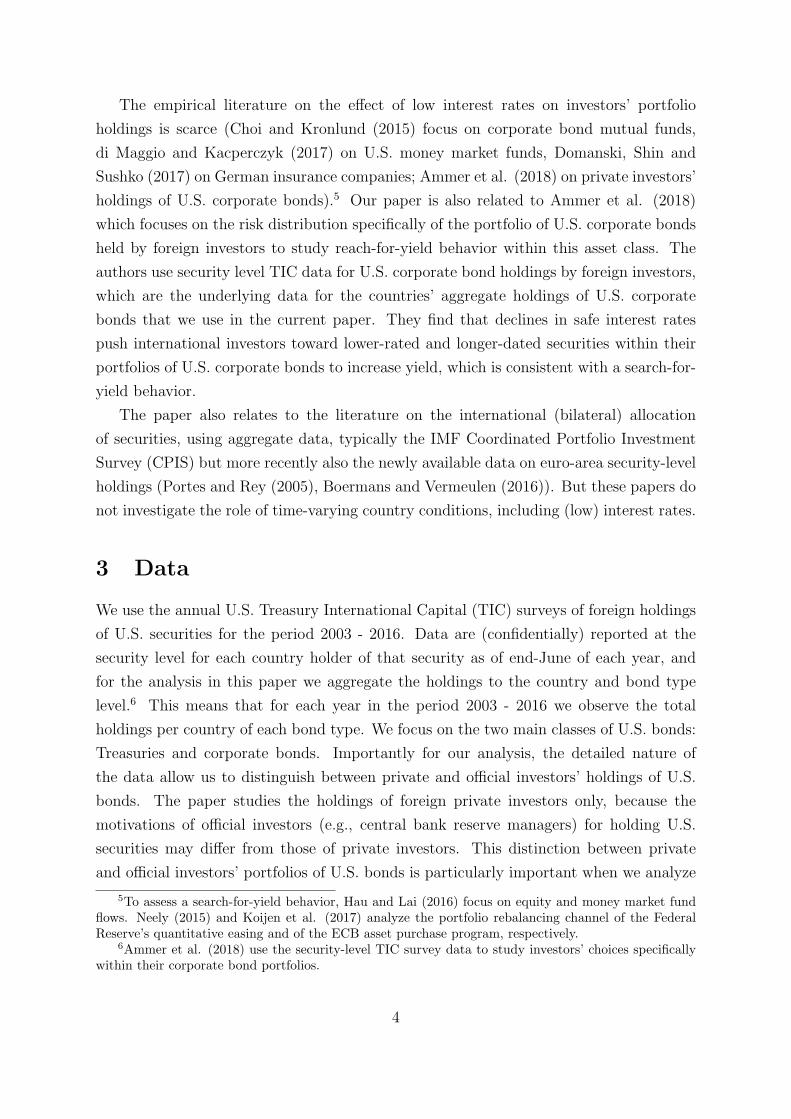
The empirical literature on the effect of low interest rates on investors’ portfolio
holdings is scarce (Choi and Kronlund (2015) focus on corporate bond mutual funds,
di Maggio and Kacperczyk (2017) on U.S. money market funds, Domanski, Shin and
Sushko (2017) on German insurance companies; Ammer et al. (2018) on private investors’
holdings of U.S. corporate bonds).5 Our paper is also related to Ammer et al. (2018)
which focuses on the risk distribution specifically of the portfolio of U.S. corporate bonds
held by foreign investors to study reach-for-yield behavior within this asset class. The
authors use security level TIC data for U.S. corporate bond holdings by foreign investors,
which are the underlying data for the countries’ aggregate holdings of U.S. corporate
bonds that we use in the current paper. They find that declines in safe interest rates
push international investors toward lower-rated and longer-dated securities within their
portfolios of U.S. corporate bonds to increase yield, which is consistent with a search-for-
yield behavior.
The paper also relates to the literature on the international (bilateral) allocation
of securities, using aggregate data, typically the IMF Coordinated Portfolio Investment
Survey (CPIS) but more recently also the newly available data on euro-area security-level
holdings (Portes and Rey (2005), Boermans and Vermeulen (2016)). But these papers do
not investigate the role of time-varying country conditions, including (low) interest rates.
3 Data
We use the annual U.S. Treasury International Capital (TIC) surveys of foreign holdings
of U.S. securities for the period 2003 - 2016. Data are (confidentially) reported at the
security level for each country holder of that security as of end-June of each year, and
for the analysis in this paper we aggregate the holdings to the country and bond type
level.6 This means that for each year in the period 2003 - 2016 we observe the total
holdings per country of each bond type. We focus on the two main classes of U.S. bonds:
Treasuries and corporate bonds. Importantly for our analysis, the detailed nature of
the data allow us to distinguish between private and official investors’ holdings of U.S.
bonds. The paper studies the holdings of foreign private investors only, because the
motivations of official investors (e.g., central bank reserve managers) for holding U.S.
securities may differ from those of private investors. This distinction between private
and official investors’ portfolios of U.S. bonds is particularly important when we analyze
5To assess a search-for-yield behavior, Hau and Lai (2016) focus on equity and money market fundflows. Neely (2015) and Koijen et al. (2017) analyze the portfolio rebalancing channel of the FederalReserve’s quantitative easing and of the ECB asset purchase program, respectively.
6Ammer et al. (2018) use the security-level TIC survey data to study investors’ choices specificallywithin their corporate bond portfolios.
4

foreign holdings of Treasury bonds since those constitute a large share of foreign official
reserves and could thus be driven by different motives. The other advantage of the TIC
surveys is that the data include both the face and market value of holdings. In order to
isolate the effect of active new investments and portfolio shifts, we use in our analysis the
face value of holdings, thus abstracting from the effect of price changes.7
For the TIC surveys the main reporters are U.S.-resident custodians which must re-
port all U.S. securities they hold on behalf of foreign residents and reporting is mandatory.
Due to the mandatory reporting of holdings by custodians, the data are comprehensive,
capturing countries’ entire portfolios of U.S. securities at the country level. Country-level
holdings data are published on the Treasury Department’s website, although without the
split between holdings by private investors and holdings by official institutions. Because
the TIC data are reported on a resident basis rather than on the basis of the ultimate
owner, this creates some data challenges because intermediaries in major custodian coun-
tries and financial centers hold securities on behalf of investors from other countries.8
Another key component of the data we deploy is investors’ home interest rates. We use
data on foreign countries’ local currency sovereign yields at 1-year and 5-year maturities.
The underlying data are from Bloomberg, and the annual rates are calculated as average
yields for the month of June of each year so the data are aligned with the holdings
data that are reported as of end-June of each year. Since the sovereign interest rate
is our key variable for evaluating country-level incentives for risk-taking, the sample
excludes bonds held by investors in Caribbean and other financial centers for which we
do not observe sovereign interest rates. In robustness checks we also include the U.S.
dollar equivalent of the home sovereign rate, which we construct using Bloomberg data
on 12-month forward premiums for the U.S. dollar against the investor countries’ home
currencies and calculate the synthetic dollar yields foreign investors would obtain if they
hedged their home-currency 1-year sovereign bonds into the U.S. dollar.
For the other investor-country characteristics we draw on a variety of data sources.
We use data from the IMF’s Direction of Trade Statistics (DOTS) for imports and exports
between the investor country and the United States based on the notion that the intensity
of trade is a good proxy for economic and other ties as well as the degree of information
asymmetry between the investor country and the United States (Portes and Rey, 2005;
Aviat and Coeurdacier, 2007; Okawa and Van Wincoop, 2012). To take into account
countries’ financial linkages to the United States we include in our specifications the share
7Estimates of monthly positions can be constructed (see Bertaut and Judson, 2014), and have beenused recently by Chari et al. (2017) to study the effect of U.S. monetary policy on emerging marketasset returns and capital inflows. We use the annual data to study adjustments to (low) interest ratesover longer periods, and because the annual survey data are more precise.
8See Bertaut, Griever, Tryon (2006) for more details about the TIC data and data collection process.
5

of U.S. dollar bank claims and liabilities for each foreign country relative to total bank
claims and liabilities, drawing on a different component of the TIC data. Countries’
exchange rates versus the U.S. dollar may influence their cross-border investments, in
part through carry-trade related motivations and deviations from (un-)covered interest
rate parity. To address this, we collect exchange rate data from the IMF’s International
Financial Statistics and include in the regressions the volatility as well as the change in
the real bilateral exchange rate.
In our specifications we also control for countries’ riskiness using their sovereign CDS
spread.9 We use the expected earnings growth of countries’ corporate sector as a proxy for
the attractiveness of domestic investment opportunities; the data are from IBES. Finally,
we obtain GDP data from the World Bank WDI database; in some of the specifications
we use home-country GDP to scale foreign countries’ bond investments in the United
States.
4 Stylized facts
4.1 Sovereign yields
Our analysis relies on the variation in sovereign yields over time and across countries.
Figure 1 captures the range of home country rates in our data panel, showing the median,
maximum and minimum for each country. For example, rates in Japan have been low
for most of the 2003 - 2016 period, while rates in many European countries have varied
considerably, falling only more recently to low levels in most cases. Rates have not been
as low in the majority of emerging markets. In addition, Figure 2 shows the evolution
of cross-sectional quartiles of sovereign rates over the sample period. Importantly, not
only is there significant variation in sovereign yields over time, but the interquartile range
remains substantial throughout, even as the median approached zero toward the end of
the period. This heterogeneity in the panel helps us considerably for identifying the
effects of low rates on risk-taking.
[Insert Figure 1 Here]
[Insert Figure 2 Here]
9In a robustness check we also used the CDS spread for the country’s banking system to controlfor overall riskiness. Since the sample size declines due to availability of bank CDS data and our mainresults are unchanged, we do not report these results.
6

4.2 Foreign holdings of U.S. bonds
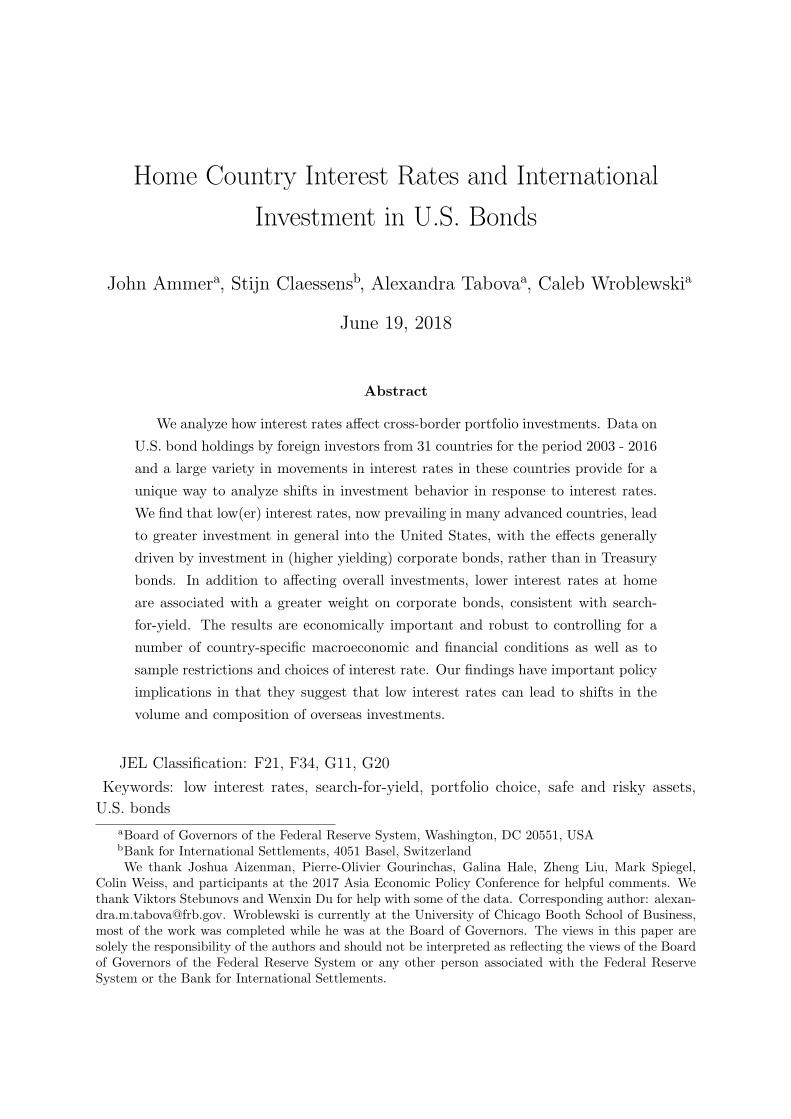
Figure 3 shows how foreign holdings of U.S. bonds have evolved over the period 2003 -
2016.10 After a sharp increase in the years leading up to the GFC, foreign holdings of U.S.
corporate debt declined during the GFC and the subsequent euro sovereign debt crisis,
reflecting the “flight home” and search-for-safety during that period that is documented in
the literature.11 However, as interest rates in many foreign countries declined after 2012,
inflows into corporate bonds rebounded, leading to a sharp increase in holdings especially
towards the end of the sample period suggesting that investors from these countries were
compensating for declining returns on safe assets at home by purchasing U.S. corporate
debt. In terms of the U.S. safe asset, holdings of Treasuries were stable pre-GFC, but
declined during the GFC, which is consistent with the “flight home” documented in
the literature. After the GFC, foreign flows into Treasuries resumed. While during the
European debt crisis the pick-up of foreign flows into Treasuries combined with a decline
in flows into corporate bonds is consistent with a general sense of risk-aversion in turbulent
times, towards the latter part of the sample period when interest rate in many advanced
countries have been low for some time, the increase in corporate bond holdings surpasses
that of Treasury holdings. Figure 4 shows the composition of the foreign portfolio of
U.S. bonds. The corporate share increased approximately 10 percentage points over the
period and stood at roughly 60 percent for the last two years of the sample period.12
[Insert Figure 3 Here]
[Insert Figure 4 Here]
4.3 U.S. bonds in foreign portfolios
Because of the data availability, the paper focuses on just one part of foreign countries’
portfolios: their holdings of U.S. bonds. Using data from the IMF’s Coordinated Portfolio
Investment Survey (CPIS), columns (1)-(2) in Table 1 give an overview of how important
U.S. bonds are in foreign countries’ aggregate bond portfolios.13 U.S. bonds constitute a
significant share of countries’ holdings of foreign bonds: as of end-2015, on average for the
10The figure plots the face value of holdings as reported in the TIC surveys, thus abstracting from theeffect of price changes. Therefore, the change in holdings from one year to the next can be interpretedas investment inflows (or outflows).
11See, for example, Giannetti and Laeven (2012) and De Haas and Van Horen (2012 and 2013). Asalso noted by Becker and Ivashina (2015), incentives to reach for yield were likely lower during the GFCfor several, related reasons: investors were likely more risk averse as owners and regulators exercisedmore oversight; there was a high general uncertainty making risk assessments more challenging; andspreads on many instruments were high in the first place, making reaching for yield less attractive.
12In Appendix we show that the share of corporate holdings that include corporate asset backedsecurities (ABS) follows a similar pattern.
13The holdings data in Table 1 include holdings of all types of U.S. bonds. The majority of countriesreporting to the CPIS do not distinguish holdings of corporate and sovereign bonds.
7
sample, that share is just under 30 percent. Because of home bias that is well-documented
in the international finance literature, this share is much smaller in the countries’ overall
portfolios that include domestic bond holdings: bond investment into the United States
constitutes just under 7 percent of total bond portfolios on average for the sample. Also
in terms of individual countries, Table 1 shows that for many countries, investment in
the United States is a large part of their overall portfolios, and in particular of their
international investments. For example, for Mexico and Canada, the CPIS data show
that the shares of overseas investment allocated to the United States are some 94 percent
and 68 percent, respectively. As such, foreign investment in the United States constitutes
a relatively large share of these countries’ international investments and could thus be
representative of their international behavior.
[Insert Table 1 Here]
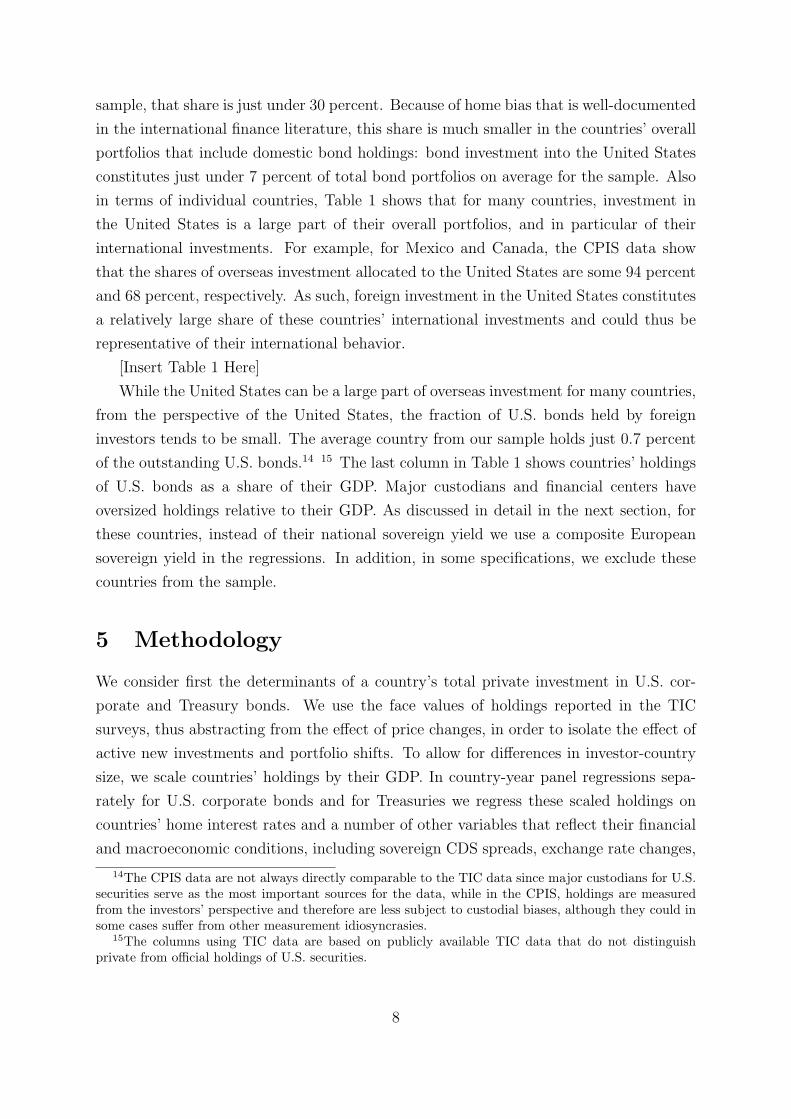
While the United States can be a large part of overseas investment for many countries,
from the perspective of the United States, the fraction of U.S. bonds held by foreign
investors tends to be small. The average country from our sample holds just 0.7 percent
of the outstanding U.S. bonds.14 15 The last column in Table 1 shows countries’ holdings
of U.S. bonds as a share of their GDP. Major custodians and financial centers have
oversized holdings relative to their GDP. As discussed in detail in the next section, for
these countries, instead of their national sovereign yield we use a composite European
sovereign yield in the regressions. In addition, in some specifications, we exclude these
countries from the sample.
5 Methodology
We consider first the determinants of a country’s total private investment in U.S. cor-
porate and Treasury bonds. We use the face values of holdings reported in the TIC
surveys, thus abstracting from the effect of price changes, in order to isolate the effect of
active new investments and portfolio shifts. To allow for differences in investor-country
size, we scale countries’ holdings by their GDP. In country-year panel regressions sepa-
rately for U.S. corporate bonds and for Treasuries we regress these scaled holdings on
countries’ home interest rates and a number of other variables that reflect their financial
and macroeconomic conditions, including sovereign CDS spreads, exchange rate changes,
14The CPIS data are not always directly comparable to the TIC data since major custodians for U.S.securities serve as the most important sources for the data, while in the CPIS, holdings are measuredfrom the investors’ perspective and therefore are less subject to custodial biases, although they could insome cases suffer from other measurement idiosyncrasies.
15The columns using TIC data are based on publicly available TIC data that do not distinguishprivate from official holdings of U.S. securities.
8

expected earnings growth of these countries’ domestic corporate sector. We also include
in the specifications countries’ ties to the United States as an investment destination:
their share in U.S. trade as well as a measure of banking sector ties that is a proxy for
the financial link between the investor country and the United States. In all regressions
we include country fixed effects, which allows us to focus on time-varying country devel-
opments. We also include time fixed effects, which means changes in the overall U.S. and
global economic and financial environment, including changes in the U.S. safe interest
rate, are already accounted for.
Following the general approach in Ammer et al. (2018), we use local currency sovereign
bond rates to represent investment opportunities in investors’ home markets. Low rates
can drive residents to invest more abroad, including in risky securities. Our sample ex-
cludes financial centers such as the Caribbean banking centers for two reasons. First,
these countries do not have significant sovereign debt outstanding and therefore lack reli-
able data on sovereign rates, which is one of our main variables. Second, their investments
are predominantly held on behalf of non-residents, for whom the interest rate to use is
ambiguous, given our focus on the effect of home investment opportunities on private
investors’ behavior. In our main specifications that include all country variables specified
above, Luxembourg, which is an important financial center, drops out as it lacks data for
all variables. That said, our baseline regressions do include the bond holdings of Belgium
and Ireland, two European financial centers that largely cater to investors from other
European countries. In terms of investors’ home interest rate for these countries, a com-
posite European yield is likely to be a better choice than the national sovereign yield.16
Accordingly, using the approach in Ammer et al. (2018), instead of using their own
sovereign rate, we assign these countries the average sovereign rates of four larger euro
zone countries: Netherlands, France, Italy, and Spain. One could also use the German
rate in the calculation of an average European rate, but one concern with this approach
is that it might reflect Germany’s safe haven status, rather than investment opportunities
in Germany.17
The empirical specification of the model we estimate is then:
16While entities resident in other countries in our sample may also hold some bonds on behalf ofultimate investors in different countries, Luxembourg, Belgium, and Ireland stand out for having TICholdings in excess of home country data on their investors’ U.S. investments. In addition, Table 1 showsthat TIC holdings as a percentage of investor-country GDP are by far the highest in these three countries,suggesting that mismeasurement of investor nationality is much less of an issue elsewhere.
17Alternatively, and as a robustness check, we kept the European financial centers’ observations, buttreated the entire euro zone as one country, instead of individual euro zone countries’ bilateral holdings.This approach might be fine for corporate bonds, but is likely less appropriate for U.S. Treasuriessince, as discussed in the text, custodian countries, such as Belgium and other financial centers, coulddisproportionately influence the reported country holdings of U.S. Treasuries, especially the breakdownof private and official investors’ holdings. Nonetheless, using this approach does not qualitatively changeour results.
9

Hj,t/GDPj,t = α + βSOV5yj,t + γXj,t + cj + vt + ϵj,t (1)
where the dependent variable, Hj,t/GDPj,t, is the share of U.S. bonds held by residents
of country j in year t in country j ’s GDP. We explore separately the holdings (H) of U.S.
corporate bonds and the holdings of Treasuries. SOV5yj,t is country j ’s sovereign yield
measured as the year-end 5-year sovereign yield. Xj,t are time varying home country
controls that may affect investment:
• the share in total trade (exports plus imports) with the United States (Trade share),
• an analogous measure of bank exposure links to the United States (Bank link),
• the home country 5-year sovereign CDS premium (Sov CDS), to control for risk-
related fluctuations in home interest rates,
• the standard deviation of the bilateral (versus U.S. dollar) exchange rate (StDev
FX),
• the change in the bilateral exchange rate (Delta FX),
• expected corporate earnings growth (ExpEarnGr), to control for domestic invest-
ment opportunities.
In a robustness check, we also controlled for domestic financial risks using the average
CDS premium of investor countries’ banks. Since the results are similar while the sample
size declines quite a bit due to the availability of data on CDS premiums for the banking
sector, the results we present in the paper do not include the bank CDS premiums as
a control variable. In another robustness check we also included the lagged dependent
variable as a control variable to account for autocorrelation. In most specifications the
coefficient on the lagged dependent variable is as expected positive and significant, but
its inclusion does not alter our main results. Because we include country fixed effects, we
do not capture cross-country relations arising from other, time-invariant variables such
as distance to and common language with the United States that are commonly used in
the literature as proxies for transaction costs and familiarity with the foreign market.
To isolate the effect of the GFC and the European debt crisis we include an interaction
term of the sovereign yield with a dummy variable for the period 2008 - 2012. In addition,
in specifications that aim to compare the effects in the pre- and post-crises periods,
we exclude the crises period of 2008 - 2012 and include an interaction of the sovereign
10

yield with a dummy for the post-crises period of 2013 - 2016. All regressions include
country and time fixed effects, denoted by cj and vt, respectively. We estimate the model
parameters by Weighted Least Squares, using for weights countries’ holdings of U.S.
corporate and Treasury bonds. Figures 1 and 2 show details on the country sovereign
rates. Table 2 presents summary statistics for the variables used in the regressions.
[Insert Table 2 Here]
Our second set of empirical exercises examines the determinants of the portfolio al-
locations that foreign investors choose within their U.S. bond holdings. In particular,
the unit of analysis here is a particular country’s holdings of U.S. corporate bonds as
a share of its total U.S. bond holdings on a given survey date. The setup is similar to
the one above: we again include the home country sovereign yield and its interaction
term with the dummy for the 2008 - 2012 crises period; as well as an interaction with a
post-crises dummy variable excluding the crises period altogether in order to compare the
period effects. We also include the same country determinants and fixed effects. Since
all regressions include time dummies, they absorb all common factors, including changes
in financial conditions in the United States. The empirical specification of the model we
estimate is then:
HCorpj,t /
∑i
Hij,t = α + βSOV5yj,t ++γXj,t + cj + vt + ϵj,t (2)
Where HCorpj,t /
∑iHj,t is the country’s holdings of corporate bonds (HCorp
j,t ) as a share
of its total U.S. bond holdings on a given survey date∑
i Hij,t.
6 Empirical Results
6.1 Determinants of International Investment in U.S. Bonds
We begin by investigating foreign private investment in U.S. corporate and Treasury
bonds following specification shown in equation (1). The first four columns of Table 3
show the results for U.S. corporate bonds. In column (1) we report the results from the
panel regression of country-level holdings of U.S. corporate bonds (scaled by home GDP)
for the entire period 2003 - 2016 on the home country 5-year sovereign bond yield and its
interaction with a 2008 - 2012 period dummy. The regression includes country and time
fixed effects, along with the other country-specific control variables as discussed above.
We find a statistically significant negative sign for the coefficient on the sovereign yield,
consistent with a “push factor” that would induce flows in the context of a portfolio
11

balance framework. More specifically, the -0.036 coefficient means that when a country’s
home interest rate is 100 basis-points lower, its investment in U.S. corporate bonds rises by
3.6 percent of its GDP. We do not find evidence that this relationship is different during
the crises period as the coefficient on the interaction of the investor-country sovereign
yield with the crises dummy is not statistically significant.
[Insert Table 3 Here]
In column (2), we consider whether the home sovereign yield effects differ in the post-
crises period compared to the pre-crises period. To do this, we exclude the crises years
from the sample completely, but retain a period-interaction. We find that the main result
is maintained, and with a larger coefficient than in column (1). However, we do not find
that in the post-crises period, when interest rate were generally low in most advanced
countries, the relation is much different, as this interaction variable is not statistically
significant.
The sample in columns (1) and (2) already excludes the Caribbean banking centers
and Luxembourg as they lack sovereign yield and other country-level data, but in columns
(3) and (4) we further exclude Belgium and Ireland from the sample. As shown in the
last column of Table 1, these countries have oversized holdings of U.S. bonds relative to
their GDP. Columns (3) and (4) show that when we exclude financial centers and major
custodians the main regression result on the relationship between investors’ home interest
rates and their investment in U.S. corporate bonds is maintained, but the coefficient does
decline considerably, suggesting that investment from the excluded countries is especially
sensitive to the composite European interest rate we assigned them. In Appendix Table
A1 we show that these results are unchanged if we include holdings of corporate asset
backed securities (ABS) in the sample of corporate bonds.
Important custodian countries such as Belgium and financial centers could have even
stronger influence on reported country holdings of U.S. Treasuries, especially when it
comes to the breakdown of private and official investors’ holdings. As pointed out in
Treasury Department reports regarding the TIC survey data, some foreign official hold-
ings likely are misclassified as private holdings because they are held through private
intermediaries, and therefore data on private holdings in major custodians may reflect
some holdings of foreign official institutions, which are usually disproportionately allo-
cated to Treasuries.18 Since in this paper we focus on private investors’ behavior, for
foreign holdings of Treasury bonds in the last two columns of Table 3 we present the
results just for the sample excluding the financial centers. We use the same two period
samples as before, the full sample and the sample excluding the crises period that com-
18Annual Treasury Department reports on the TIC survey data: see Treasury Department TIC websitehttps://www.treasury.gov/resource-center/data-chart-center/tic/Pages/index.aspx
12

pares the pre- and post-crises effects of the home sovereign rates. We find a positive and
statistically significant effect for the crises period (column (5)), indicating a decline in
Treasury holdings for foreign investors with declining home interest rates. This is con-
sistent with a “flight-home” investor behavior during crises. The insignificant effect of
the sovereign yield for the normal times period in column (5) stems from the offsetting
effects present pre- and post-crises, shown in column (6). The strong negative coefficient
on the post-crises interaction of the sovereign yield indicates that post-crises, when rates
were low in a lot of advanced economies, foreign investment in Treasury bonds rose, likely
suggesting that investors seeking safe assets were drawn to the relatively higher yielding
U.S. Treasuries, compared to home sovereign bonds. We, therefore, view this result as
another indication of search-for-yield behavior.
Turning to the other country-specific variables, the positive sign of the bank link
coefficient in column (2) suggests that stronger bank lending ties between the investor
country and the United States are associated with increased investment in U.S. corporate
bonds, but we do not find this effect once we exclude financial centers from the sample.
The coefficient on the countries’ share in U.S. trade is not statistically significant for
corporate bond investment, and the negative sign for Treasury bond investment indicates,
somewhat counterintuitively, that an increase in a country’s trade volume with the United
States is associated with less investment. However, if we define the trade variable as
country i ’s trade with the United States relative to country i ’s GDP rather than as a share
in total U.S. trade, the coefficient on this variable is statistically insignificant but positive
for both the corporate and Treasury investment specifications. Less surprising, however,
is that higher expected earnings growth at home (ExpEarnGr), which we take as a proxy
for risky domestic investment opportunities, also reduces investment in U.S. Treasuries as
investors seek higher yielding opportunities. This results could be interpreted as another
manifestation of yield searching behavior. Generally, the other country variables do not
appear to significantly affect holdings of U.S. bonds. One reason could be that there is
no sufficient time variation and the country fixed effects we include in these regressions
fully capture the cross-country variation.
6.2 Determinants of Composition of International Investment
in U.S. Bonds
We next follow specification 2 to study the composition of private investors’ portfolio of
U.S. bonds, which implicitly controls for the general incentives to invest in U.S. bonds.
The idea is to explore how the share of the riskier, and therefore higher yielding, U.S.
assets (U.S. corporate bonds) relative to the safe U.S. asset (U.S. Treasury) is affected by
13

investors’ home country interest rates. As outlined in the methodology section above, our
variable of analysis here is holdings of U.S. corporate bonds as a share of a country’s total
holdings of U.S. corporate and Treasury bonds on a given survey date.19 Table 4 reports
the results. In column (1) we include all countries in the sample; in (2)-(3) we exclude
the financial centers. The negative coefficient on the home interest rate in columns (1)-
(2) is consistent with international bond investors relatively shifting their U.S. portfolios
toward the riskier corporate bonds when domestic investment opportunities are lackluster.
The effects are statistically stronger for the sample excluding financial centers. Effects
are somewhat muted during the crises period, as the coefficient on the interaction of
the interest rate with the crises dummy is statistically significant positive. As such, the
effects may be smaller and not even present in crises period.
[Insert Table 4 Here]
In column (3), we find that post-crises the effects do not differ in a statistically
significant way from those for the pre-crises period. Mirroring the positive sign on the
expected earnings growth for Treasury holdings in Table 3, the expected earnings growth
effect is negative in Table 4, consistent with Treasuries being a defensive investment when
prospects for riskier investments are weaker.
The estimated effects imply that international bond investors increasingly shift their
U.S. bond portfolios toward corporate securities as home rates reach low levels, with
economically meaningful effects: a 100 basis points decline in the home interest rate
entails an estimated shift toward corporates of about 2.3 - 2.7 percentage points.
7 Robustness
7.1 Sample restrictions and choice of interest rate
Table 5 shows that the baseline results on the effect of countries’ sovereign rates on their
holdings of U.S. corporate and Treasury bonds are similar when the regressions exclude
the country controls. The specifications are the same as in the baseline Table 3, i.e. using
investment in U.S. corporate and Treasury bonds as ratio to the home country GDP as
the dependent variable, but the sample is much larger than in Table 3 as some countries
lack data for all controls. The larger coefficient on the sovereign yield variable in Table
5 is driven by the inclusion of Luxembourg in the sample.
[Insert Table 5 Here]
In Table 6 we report robustness checks to further restrictions to the country sample
19Results are similar if we instead scale by country’s total holdings of all types of U.S. bonds, whichinclude U.S. Agencies.
14

and to using a different maturity for the home country interest rate. The sample in Table
6 excludes the financial centers, and it therefore corresponds to the results in columns
(3)-(6) of baseline Table 3. As a first robustness test, in columns (1)-(2) for U.S. corporate
bonds and (4)-(5) for Treasuries, we exclude observations where countries’ sovereign CDS
spread is in the top 5th percentile over the sample period.20 We find that that main
regression results are confirmed and the size of the coefficients is very similar to the ones
reported in baseline Table 3. As another robustness check, to explore the sensitivity to
the specific interest rate used, columns (3) and (6) of Table 6 report estimates of total
private investment in U.S. corporate and Treasury bonds, respectively, with regard to the
1-year home sovereign rate, instead of the 5-year rate we use in the baseline. The main
results carry through, with slightly smaller estimated effects on investment from a lower
home interest rate.21
[Insert Table 6 Here]
Table 7 presents the same robustness checks but now for the Table 4 baseline results
on the effects of home country drivers of the corporate share. The sample excludes the
financial centers so it is comparable to the one used in columns (2)-(3) of Table 4. In
columns (1)-(2) we exclude high sovereign CDS countries, while in column (3) we use the
shorter 1-year maturity home sovereign yield. The main story is preserved. As we saw
with total investment as a percent of GDP, the coefficient on the 1-year sovereign yield
is smaller than on the 5-year yield.
[Insert Table 7 Here]
7.2 Hedged and Unhedged Investment in U.S. Bonds
So far, we have used countries’ local currency sovereign yields. Now, we examine if and
to what extent the country’s private investment in U.S. corporate and Treasury bonds
also responds to the U.S. dollar equivalent of the home sovereign rate (Y$), and how the
effects differ compared to the home sovereign yield measured in local currency (YHC). We
test for this by calculating home country yields in U.S. dollar terms. For this, we collect
12-month forward premiums (FP) for the U.S. dollar against the home currencies of each
of the investor countries in our sample. We calculate the synthetic dollar yields foreign
investors would obtain if each of them hedged their home-currency 1-year sovereign bonds
into the common currency, the U.S. dollar (Y $ ≡ Y HC − FP ). This allows us to test
for the role of the synthetic dollar yields (Y$) on foreign investments, while at the same
20Results are similar if we instead altogether exclude countries whose sovereign CDS spread has everbeen in the top 5th percentile over the sample period. Results are also similar for a different cut-off forsovereign CDS spreads.
21Results are also robust if for the weights in the estimation we use countries’ total U.S. bond holdingsrather than holdings of U.S. corporate and Treasuries bonds only.
15

also being able to include both the home-currency yield (YHC) and the synthetic dollar
yield (Y$) as two distinct competing factors affecting international investment choices.
As before, in this set of results we control for the standard set of linkages and country
economic and financial conditions.
Table 8 presents the results for the sub-sample excluding the financial centers. Since
here we use the 1-year synthetic dollar rate, these results have to be compared to the
results in Table 6 where as a robustness check we use countries’ 1-year local currency
sovereign rates instead of their 5-year rates. In column (1) of Table 8 we include only
the synthetic dollar yield (Sov1y synth. USD), i.e. the hedged sovereign rate, along
with our set of controls, and find that it does not appear to affect investment in U.S.
corporate bonds in a statistically significant way. This is in contrast to the findings so
far that the local currency sovereign yield negatively and in a statistically significant
way affects investment in U.S. corporate bonds. However, we get more insights when
we include both the hedged and the unhedged rate. In column (2) we report the results
including both the hedged and unhedged rate in a specification that excludes the crises
period. The hedged rate (Sov1y synth. USD) is again statistically insignificant, and the
coefficient on the unhedged rate (Sov1y) is similar to the one reported in Table 6 column
(3) where we use the 1-year unhedged rate on its own in the same type of specification.
The story is similar in the case of investment in Treasury bonds. As reported in columns
(3)-(4) of Table 8, the hedged rate does not appear to affect investment in Treasuries in
a statistically significant way, while the effect of the unhedged rate is preserved. These
results imply that investment is more sensitive to the unhedged rate, consistent with
institutional incentives not to hedge exchange rate exposure. We also interpret these
results as consistent with investors being aware of the limited predictive power of forward
premiums for future exchange rates. Put differently, investors do not appear to take
hedging costs into account nor expect uncovered interest rate parity to hold. Rather,
they appear to compare nominal promised rates of return among investment choices.22
[Insert Table 8 Here]
8 Conclusion
We analyze how interest rates affect international investments and cross-border risk-
taking by examining the extent to which investors have shifted toward riskier assets
overseas in response to low interest rates at home. Data on foreign investors’ holdings of
22Focusing on unhedged interest rate differential is arguably rational for informed investors who aretolerant of exchange rate risk; the forward premium puzzle has been well known at least since the 1980s.See, for example, Fama (1984).
16

U.S. bonds for 31 countries for the period 2003 - 2016 and a large variety in movements in
interest rates in these countries provide for a unique way to analyze risk-taking behavior
of investors in response to their home interest rates. Our analytical framework largely
avoids concerns that the results might be driven instead by reverse causality from U.S.
credit markets to foreign interest rates. For example, although an increase in the supply
of U.S. bonds would likely draw in more cross-border investment, it likely would have
only second-order effects on rates in other countries, and would tend to raise rates, while
our finding is that increased U.S. investment is associated with lower investor-country
rates. And, while these foreign investments are likely to have been affected by economic
and financial conditions at home, because they are small from a U.S. perspective, they
are unlikely to have affected the financing conditions of the issuers.
We find that the lower the interest rate in the investor’s home country, the more
investors increase their investments in the United States as a ratio to their home GDP,
with the effects generally coming through investment in U.S. corporate sector bonds,
rather than Treasury bonds. The results show that when a country’s home interest
rate is 100 basis-points lower, its investment in U.S. corporate bonds rises by 3.6 to
5.3 percent of GDP. Furthermore, in terms of portfolio composition, international bond
investors increasingly shift their U.S. bond portfolios toward corporate securities as home
rates reach low levels, with economically meaningful effects. Since increased foreign
investment in the United States is disproportionately allocated to corporate bonds, the
results imply that low rates at home induce international investors to assume more credit
risk in their U.S. bond portfolios. We find further evidence that the search-for-yield is a
function of the home interest rates and not of the hedged dollar equivalent rates.
Our findings have important policy implications in that they suggest that low interest
rates can lead to shifts in overseas investments. Although we control for investor country
characteristics, since we do not have comparable data on domestic investment portfolios
as we do for holdings of U.S. bonds, we cannot say whether the investor behavior we
observe is the same or differs from the domestic investment patterns. It could be that
these investors invest more aggressively abroad and more conservatively at home, and as
such their overall portfolio need not be more risky. Or, extrapolating from the small part
of their behavior we observe, one could conjecture that foreign investors likely have made
risk-increasing shifts elsewhere in their portfolios that could pose financial stability risks
abroad, particularly if the low-rate environment persists. Our results are also consistent
with central banks’ balance sheet policies having a significant effect on demand for foreign
financial assets. Regardless, our findings suggest that there are spillover effects from low
interest rates through cross-border capital flows.
17

References
Ahmed, Shaghil, and Andrei Zlate. 2014. “Capital Flows to Emerging Market
Economies: A Brave New World?” Journal of International Money and Finance,
48: 221 – 248.
Ammer, John, Stijn Claessens, Alexandra Tabova, and Caleb Wroblewski.
2018. “Searching for Yield Abroad: Risk-Taking through Foreign Investment in U.S.
Bonds.” International Finance Discussion Papers 1224, Board of Governors of the
Federal Reserve.
Aramonte, Sirio, Seung Jung Lee, and Viktors Stebunovs. 2015. “Risk-Taking
and Low Longer-Term Interest Rates: Evidence from the U.S. Syndicated Loan
Market.” Finance and Economics Discussion Series 2015-068.
Aviat, Antonin, and Nicolas Coeurdacier. 2007. “The Geography of Trade in Goods
and Asset Holdings.” Journal of International Economics, 71(1): 22 – 51.
Baskaya, Yusuf Soner, Julian di Giovanni, Sebnem Kalemli-Ozcan, and
Mehmet Fatih Ulu. 2018. “International Spillovers and Local Credit Cycles.”
NBER Working Paper No. 23149.
Becker, Bo, and Victoria Ivashina. 2015. “Reaching for Yield in the Bond Market.”
Journal of Finance, 70(5): 1863–1902.
Bertaut, Carol, and Ruth Judson. 2014. “Estimating U.S. Cross-Border Securities
Positions: New Data and New Methods.” International Finance Discussion Papers
1113, Board of Governors of the Federal Reserve.
Bertaut, Carol, William Griever, and Ralph Tryon. 2006. “Understanding U.S.
Cross-Border Securities Data.” Federal Reserve Bulletin.
Boermans, Martijn, and Robert Vermeulen. 2016. “International Investment Po-
sitions Revisited: Investor Heterogeneity and Individual Security Characteristics.”
DNB Working Papers 531, Netherlands Central Bank.
Bowman, David, Juan M. Londono, and Horacio Sapriza. 2015. “U.S. Unconven-
tional Monetary Policy and Transmission to Emerging Market Economies.” Journal
of International Money and Finance, 55(C): 27–59.
Broner, Fernando, Tatiana Didier, Aitor Erce, and Sergio L. Schmukler. 2013.
“Gross Capital Flows: Dynamics and Crises.” Journal of Monetary Economics,
60(1): 113 – 133. Carnegie-NYU-Rochester Conference.
18

Cerutti, Eugenio, Stijn Claessens, and Andrew K. Rose. Forthcoming. “How
Important is the Global Financial Cycle? Evidence from Capital Flows.” IMF Eco-
nomic Review.
Chari, Anusha, Karlye Dilts Stedman, and Christian Lundblad. 2017. “Taper
Tantrums: QE, its Aftermath and Emerging Market Capital Flows.” NBER Working
Paper No. 23474.
Choi, Jaewon, and Mathias Kronlund. 2018. “Reaching for Yield in Corporate Bond
Mutual Funds.” The Review of Financial Studies, 31(5): 1930–1965.
De Haas, Ralph, and Neeltje Van Horen. 2012. “International Shock Transmission
after the Lehman Brothers Collapse: Evidence from Syndicated Lending.” American
Economic Review, 102(3): 231–37.
Dell’Ariccia, Giovanni, and Robert Marquez. 2013. “Interest Rates and the Bank
Risk-Taking Channel.” Annual Review of Financial Economics, 5(1): 123–141.
Domanski, Dietrich, Hyun Song Shin, and Vladyslav Sushko. 2017. “The Hunt
for Duration: Not Waving but Drowning?” IMF Economic Review, 65(1): 113–153.
Fama, Eugene F. 1984. “Forward and Spot Exchange Rates.” Journal of Monetary
Economics, 14(3): 319 – 338.
Forbes, Kristin J., and Francis E. Warnock. 2012. “Capital Flow Waves: Surges,
Stops, Flight, and Retrenchment.” Journal of International Economics, 88(2): 235
– 251.
Fratzscher, Marcel. 2012. “Capital Flows, Push versus Pull Factors and the Global
Financial Crisis.” Journal of International Economics, 88(2): 341–356.
Fratzscher, Marcel, Marco Lo Duca, and Roland Straub. 2016. “ECB Uncon-
ventional Monetary Policy: Market Impact and International Spillovers.” IMF Eco-
nomic Review, 64(1): 36–74.
Fratzscher, Marcel, Marco Lo Duca, and Roland Straub. 2018. “On the Interna-
tional Spillovers of US Quantitative Easing.” The Economic Journal, 128(608): 330–
377.
Giannetti, Mariassunta, and Luc Laeven. 2012. “Flight Home, Flight Abroad, and
International Credit Cycles.” American Economic Review, 102(3): 219–24.
19

Hau, Harald, and Sandy Lai. 2016. “Asset Allocation and Monetary Policy: Evidence
from the Eurozone.” Journal of Financial Economics, 120(2): 309 – 329.
Koijen, Ralph S.J., Francois Koulischer, Benoit Nguyen, and Motohiro Yogo.
2017. “Euro-Area Quantitative Easing and Portfolio Rebalancing.” American Eco-
nomic Review: Papers & Proceedings, 107(5): 621–627.
Maggio, Marco Di, and Marcin Kacperczyk. 2017. “The Unintended Consequences
of the Zero Lower Bound Policy.” Journal of Financial Economics, 123(1): 59 – 80.
Morais, Bernardo, Jose-Luis Peydro, and Claudia Ruiz Ortega. Forthcoming.
“The International Bank Lending Channel of Monetary Policy Rates and QE: Credit
Supply, Reach-for-Yield, and Real Effects.” Journal of Finance.
Neely, Christopher J. 2015. “Unconventional Monetary Policy Had Large International
Effects.” Journal of Banking and Finance, 52: 101–111.
Okawa, Yohei, and Eric van Wincoop. 2012. “Gravity in International Finance.”
Journal of International Economics, 87(2): 205 – 215.
Portes, Richard, and Helene Rey. 2005. “The Determinants of Cross-Border Equity
Flows.” Journal of International Economics, 65(2): 269–296.
Rajan, Raghuram G. 2005. “Has financial development made the world riskier?” Pro-
ceedings - Economic Policy Symposium - Jackson Hole, August, 313–369.
Rajan, Raghuram G. 2010. Fault Lines: How Hidden Fractures Still Threaten the
World Economy. Princeton University Press.
Rey, Helene. 2013. “Dilemma not Trilemma: The Global Financial Cycle and Monetary
Policy Independence.” Proceedings - Federal Reserve Bank of Kansas City Economic
Symposium - Jackson Hole, 285–333.
Stein, Jeremy. 2013. “Overheating in Credit Markets: Origins, Measurement, and Pol-
icy Responses.” At the “Restoring Household Financial Stability after the Great
Recession: Why Household Balance Sheets Matter” research symposium sponsored
by the Federal Reserve Bank of St. Louis, St. Louis, Missouri.
20

Figure 1: Sovereign Yields by Country (2003-2016)
BRAZILPHILIPPINES
COLOMBIAMEXICO
PERUCHILE
AUSTRALIAGREECE
ISRAELKOREA, SOUTH
PORTUGALIRELAND
SPAINMALAYSIA
ITALYCHINA, MAINLAND
NORWAYBELGIUMAUSTRIACANADAFRANCE
SWEDENNETHERLANDS
FINLANDUNITED KINGDOM
DENMARKGERMANY
HONG KONGSINGAPORE
SWITZERLANDJAPAN
0 4 8 12 16+
5−year sovereign yield, range: 2003 − 2016
The figure plots the 5-year sovereign yield for the countries in our sample. For each country we plotthe median (dot) and the min and the max (boundaries of the box) of the sovereign yield for the period2003-2016. Last value on x-axis refers to values of 16+ for the sovereign yield. Chart includes thecountries in the baseline sample. Authors’ calculations using data from Bloomberg.
Figure 2: Sovereign Yields over time (2003-2016)
02
46
Fiv
e−ye
ar s
over
eign
yie
ld
2004 2006 2008 2010 2012 2014 2016Year (end−June)
75th Percentile 25th Percentile Median
The figure plots the interquartile range of the 5-year sovereign yield (in%) for the countries in the baselinesample. Authors’ calculations using data from Bloomberg.
21

Figure 3: Foreign Holdings of U.S. Bonds (2003-2016)
0
500
1,000
1,500
2,000
Hol
ding
s, B
illio
n of
US
D
2003
2004
2005
2006
2007
2008
2009
2010
2011
2012
2013
2014
2015
2016
Treasuries
Corporate Bonds
The figure plots annual holdings of U.S. corporate bonds (black bars) and U.S. Treasury bonds (graybars) by foreign private investors. We include all countries in the baseline sample. Corporate bondsexclude corporate ABS. The figure plots the face value of holdings as reported in the TIC surveys.Authors’ calculations using data from the Treasury International Capital annual surveys.
Figure 4: Corporate Share in Foreign Holdings of U.S. Bonds (2003-2016)
.5
.6
.7
.8
.9
Cor
pora
te B
ond
Sha
re
2003 2004 2005 2006 2007 2008 2009 2010 2011 2012 2013 2014 2015 2016
Year
The figure plots the corporate bond share of foreign private investors’ holdings of Treasuries and U.S.corporate bonds. We include all countries in the baseline sample. Corporate bonds exclude corporateABS. Authors’ calculations using data from the Treasury International Capital annual surveys.
22

Table 1: U.S. share in foreign countries’ bond portfolios (as of end-2015)
CPIS: U.S. bonds % of: TIC: U.S. bonds % of:
Foreign Total Out- GDP
Portfolio Portfolio standing
Australia 38.8 5.3 0.15 4.0
Austria 8.3 4.3 0.02 2.4
Belgium 6.2 3.2 1.50 107
Brazil 57.4 0.1 0.65 13.6
Canada 68.3 10.6 0.56 13.6
Chile 44.4 8.0 0.07 9.6
China 49.4 0.6 4.08 13.2
Colombia 61.5 6.1 0.11 13.5
Denmark 16.9 4.3 0.12 14.5
France 10.0 4.2 0.27 4.0
Germany 10.4 5.7 0.49 5.2
Greece 0.7 0.3 0.00 0.8
Ireland 20.7 13.2 1.31 178
Israel 50.5 10.7 0.06 8.7
Italy 10.4 2.1 0.11 2.4
Japan 43.7 7.4 3.89 31.3
Luxembourg 23.5 19.8 1.84 1175
Malaysia 10.8 0.8 0.06 6.7
Mexico 94.2 8.0 0.27 6.5
Netherlands 14.6 7.9 0.29 14.8
Norway 27.2 17.2 0.30 28.7
Peru 34.0 4.2 0.04 9.1
Philippines 29.2 2.1 0.11 14.6
Portugal 3.6 1.2 0.01 2.1
Singapore 33.2 20.2 0.47 56.9
Spain 8.1 1.6 0.10 3.2
Sweden 22.5 4.5 0.12 9.1
Switzerland 23.9 18.2 0.91 50.1
United Kingdom 19.8 6.1 1.55 20.8
Average 29.0 6.8 0.7 62.7
Median 23.5 5.3 0.3 13.2
Authors’ calculations based on IMF CPIS, BIS, TIC data. CPIS: total bond holdings
by private residents of that country as reported in the CPIS data. TIC: total
bond holdings (private and official) as reported in TIC. Outstanding: U.S. bond
market capitalization. Table includes countries from baseline sample for which
CPIS data are available. Luxembourg is included in the table for illustration.
23

Table 2: Summary Statistics (2003-2016)
Median Mean St.Dev 1st p. 10th p. 95th p. 99th p.
Sovereign 5-year LC Yield (%) 3.39 3.77 2.99 -0.35 0.57 10.70 13.70
Sovereign 1-year LC Yield (%) 2.33 2.85 2.83 -0.54 0.07 8.17 13.23
Sovereign 1-Year USD Yield (%) 1.38 2.27 2.23 -0.13 0.28 5.69 7.83
Expected Earnings Growth 0.12 0.16 0.32 -0.30 0.01 0.38 1.61
Bank Exposure Share (Bank link) 0.01 0.03 0.07 0.000 0.001 0.08 0.43
Trade Share 0.01 0.03 0.04 0.000 0.002 0.14 0.18
Sovereign CDS spread 5-year 0.43 1.03 2.16 0.01 0.03 3.63 9.98
Sovereign CDS spread 1-year 0.18 0.81 3.98 0.01 0.01 1.94 10.85
Exchange Rate St. Dev. 0.06 0.07 0.12 0.01 0.03 0.13 0.15
Exchange Rate Change -0.02 -0.003 0.10 -0.23 -0.14 0.19 0.24
Treasury Holdings/GDP (%) 0.51 2.41 7.40 0.00 0.02 8.82 40.32
Corporate Bond Holdings/GDP(%)
0.85 5.62 14.2 0.01 0.08 38.8 75.9
Corporate Share in Holdings 0.66 0.62 0.24 0.05 0.25 0.95 0.98
Notes: The table reports summary statistics for the country specific variables. The statistics are overthe entire sample period 2003-2016. The exchange rate statistics refer to countries’ bilateral (versus theU.S. dollar) exchange rate. The exchange rate change is calculated as the log difference. The bank andtrade exposure are reported as shares. Sovereign 1-Year USD Yield refers to the 1-year synthetic dollaryield calculated by the authors as explained in the text. In this table bond holdings to GDP statisticsare reported in percent; in the regressions they are included as shares.
24

Table 3: Holdings of U.S. Bonds as a Share of Countries’ GDPThe table shows the estimated coefficients for equation (1) in the text. The dependent variable incolumns (1)-(4) is country j ’s holdings of U.S. corporate bonds at time t scaled by country j ’s GDP.The dependent variable in columns (5)-(6) is country j ’s holdings of U.S. Treasuries at time t scaled bycountry j ’s GDP. Luxembourg drops out of the sample as it lacks data for all controls. In columns (1)-(2)we include all countries in the sample; in addition to Luxembourg, columns (3)-(6) also exclude Belgiumand Ireland. The sample period in columns (1), (3), and (5) is 2003-2016; in columns (2), (4), and (6)we exclude the crises years 2008-2012. 2008-2012 is a dummy variable equal to 1 for the crises period2008-2012. Post is a dummy variable equal to 1 for the period 2013-2016 and 0 for the period 2003-2007.Countries’ sovereign rates are the year-end 5-year sovereign local currency yields. The sovereign rate forBelgium and Ireland is the average of the sovereign rates of the Netherlands, France, Italy, and Spain.Weighted regression where the weights are countries’ holdings of U.S. corporate and Treasury bonds.For brevity the coefficients for fixed effects and the constant are not reported. * p < 0.10, ** p < 0.05,*** p < 0.01. Heteroscedasticity-consistent standard errors are reported in parentheses.
U.S. Corporate Bonds / GDP Treasuries / GDP
All countries Excl. Fin. Centers Excl. Fin. Centers(1) (2) (3) (4) (5) (6)
Sov5y -0.036∗∗∗ -0.053∗∗∗ -0.010∗∗∗ -0.008∗∗ 0.002 0.006∗∗
(0.011) (0.015) (0.003) (0.004) (0.002) (0.003)
2008-12=1 × Sov5y -0.003 -0.000 0.002∗∗
(0.006) (0.003) (0.001)
Post=1 × Sov5y -0.009 -0.003 -0.007∗∗∗
(0.015) (0.009) (0.002)
Bank link 0.358 0.687∗∗ 0.001 -0.073 0.010 -0.074∗∗
(0.229) (0.281) (0.070) (0.090) (0.030) (0.032)
Trade share 1.222 1.860 -0.145 -0.257 -0.403∗∗∗ -0.337∗∗
(1.166) (1.214) (0.178) (0.266) (0.135) (0.137)
Sov CDS spr (5-year) -1.975 5.951∗ 0.586 0.387 -0.341 0.094(1.260) (3.215) (0.475) (1.376) (0.212) (0.308)
StDev FX 0.426 0.428 0.062 -0.131 0.078∗ 0.019(0.328) (0.457) (0.117) (0.198) (0.042) (0.048)
Delta FX 0.111 0.163 0.043∗ 0.062∗ 0.007 -0.006(0.082) (0.103) (0.024) (0.036) (0.013) (0.017)
ExpEarnGr 0.066∗ -0.016 -0.010 -0.020 -0.015∗∗∗ -0.011∗∗
(0.039) (0.041) (0.009) (0.015) (0.004) (0.005)Observations 376 236 349 218 349 218Adj. R-sq 0.92 0.91 0.89 0.89 0.92 0.93Country FE Yes Yes Yes Yes Yes YesTime FE Yes Yes Yes Yes Yes Yes
25

Table 4: Corporate Bond ShareThe table shows the estimated coefficients for equation (2) in the text. The dependent variable is countryj ’s holdings of U.S. corporate bonds at time t relative to its holdings of U.S. Treasuries and corporatebonds. Luxembourg drops out of the sample as it lacks data for all controls. In column (1) we include allcountries in the sample; in addition to Luxembourg, columns (2)-(3) also exclude Belgium and Ireland.The sample period in (1)-(2) is 2003-2016; in column (3) we exclude the crises years 2008-2012. 2008-2012 is a dummy variable equal to 1 for the crises period 2008-2012. Post is a dummy variable equal to1 for the period 2013-2016 and 0 for the period 2003-2007. Countries’ sovereign rates are the year-end5-year sovereign local currency yields. The sovereign rate for Belgium and Ireland is the average of thesovereign rates of the Netherlands, France, Italy, and Spain. Weighted regression where the weights arecountries’ holdings of U.S. corporate and Treasury bonds. For brevity the coefficients for fixed effectsand the constant are not reported. * p < 0.10, ** p < 0.05, *** p < 0.01. Heteroscedasticity-consistentstandard errors are reported in parentheses.
All countries Excl. Fin. Centers
(1) (2) (3)
Sov5y -0.027∗ -0.023∗∗∗ -0.027∗∗
(0.014) (0.009) (0.013)
2008-12=1 × Sov5y 0.018∗∗ 0.016∗∗
(0.009) (0.007)
Post=1 × Sov5y 0.001(0.013)
Bank link -0.135 0.199 0.212(0.253) (0.128) (0.182)
Trade share -5.556∗∗∗ -0.918 -1.518(1.407) (0.950) (1.161)
Sov CDS spr (5-year) 0.094 0.498 -0.200(1.085) (1.132) (2.602)
StDev FX 0.514 -0.054 -0.057(0.353) (0.179) (0.245)
Delta FX -0.117 -0.032 -0.073(0.093) (0.049) (0.068)
ExpEarnGr 0.035 0.084∗∗∗ 0.134∗∗∗
(0.031) (0.032) (0.045)Observations 376 349 218Adj. R-sq 0.83 0.91 0.90Country FE Yes Yes YesTime FE Yes Yes Yes
26

Table 5: Robustness: Holdings of U.S. Bonds as a Share of Countries’ GDPThe table shows the estimated coefficients for equation (1) in the text. The dependent variable incolumns (1)-(4) is country j ’s holdings of U.S. corporate bonds at time t scaled by country j ’s GDP.The dependent variable in columns (5)-(6) is country j ’s holdings of U.S. Treasuries at time t scaled bycountry j ’s GDP. In addition to the baseline sample, the sample here includes the following countries:Hungary, Jamaica, Luxembourg, New Zealand, Sri Lanka, and Thailand. In columns (1)-(2) we includeall countries in the sample; columns (3)-(6) also exclude Belgium, Ireland, and Luxembourg. The sampleperiod in columns (1), (3), and (5) is 2003-2016; in columns (2), (4), and (6) we exclude the crises years2008-2012. 2008-2012 is a dummy variable equal to 1 for the crises period 2008-2012. Post is a dummyvariable equal to 1 for the period 2013-2016 and 0 for the period 2003-2007. Countries’ sovereign ratesare the year-end 5-year sovereign local currency yields. The sovereign rate for Belgium, Ireland, andLuxembourg is the average of the sovereign rates of the Netherlands, France, Italy, and Spain. Weightedregression where the weights are countries’ holdings of U.S. corporate and Treasury bonds. For brevitythe coefficients for fixed effects and the constant are not reported. * p < 0.10, ** p < 0.05, *** p < 0.01.Heteroscedasticity-consistent standard errors are reported in parentheses.
U.S. Corporate Bonds / GDP Treasuries / GDP
All countries Excl. Fin. Centers Excl. Fin. Centers(1) (2) (3) (4) (5) (6)
Sov5y -0.157∗∗ -0.162∗∗ -0.013∗∗∗ -0.016∗∗∗ 0.002∗ 0.005∗∗∗
(0.066) (0.074) (0.003) (0.004) (0.001) (0.002)
2008-12=1 × Sov5y -0.018 0.004 0.003∗∗
(0.033) (0.002) (0.001)
Post=1 × Sov5y -0.016 -0.002 -0.009∗∗∗
(0.063) (0.006) (0.001)Observations 466 297 424 270 424 270Adj. R-sq 0.93 0.92 0.88 0.88 0.88 0.91Country FE Yes Yes Yes Yes Yes YesTime FE Yes Yes Yes Yes Yes Yes
27

Table 6: Robustness: Holdings of U.S. Bonds as a Share of Countries’ GDPThe dependent variable in columns (1)-(3) is country j ’s holdings of U.S. corporate bonds at time t scaledby country j ’s GDP. The dependent variable in columns (4)-(6) is country j ’s holdings of U.S. Treasurybonds at time t scaled by country j ’s GDP. The sample excludes Belgium, Ireland, and Luxembourg.The sample period in columns (1) and (4) is 2003-2016. 2008-2012 is a dummy variable equal to 1 forthe crises period 2008-2012. Columns (2)-(3) and (5)-(6) exclude the crises period 2008-2012. Post is adummy variable equal to 1 for the period 2013-2016 and 0 for 2003-2007. In columns (1)-(2) and (4)-(5)we exclude countries whose sovereign CDS spread is in the top 5th percentile over the sample period anduse countries’ 5-year sovereign rate. In columns (3) and (6) countries’ sovereign rates are the year-end1-year sovereign local currency yields. Weighted regression where the weights are countries’ holdings ofU.S. corporate and Treasury bonds. For brevity the coefficients for fixed effects and the constant arenot reported. * p < 0.10, ** p < 0.05, *** p < 0.01. Heteroscedasticity-consistent standard errors arereported in parentheses.
U.S. Corporate Bonds / GDP Treasuries / GDP
Excl. High CDS 1-year Sov. Excl. High CDS 1-year Sov.(1) (2) (3) (4) (5) (6)
Sov5y -0.010∗∗∗ -0.006∗∗ 0.003 0.007∗∗∗
(0.003) (0.003) (0.002) (0.003)
2008-12=1 × Sov5y -0.001 0.002∗∗
(0.003) (0.001)
Post=1 × Sov5y -0.001 -0.008∗∗∗
(0.009) (0.002)
Sov1y -0.007∗ 0.005∗∗∗
(0.004) (0.001)
Post=1 × Sov1y 0.003 -0.004∗∗∗
(0.011) (0.002)
Bank link 0.005 -0.091 0.329∗ 0.009 -0.076∗∗ 0.173∗∗∗
(0.075) (0.094) (0.181) (0.030) (0.033) (0.047)
Trade share -0.156 -0.245 -0.220 -0.380∗∗∗ -0.323∗∗ -0.380∗∗∗
(0.181) (0.291) (0.396) (0.139) (0.144) (0.137)
Sov CDS spr (5-year) 0.496 0.012 -0.595 0.086(1.433) (2.025) (0.447) (0.558)
StDev FX 0.068 -0.110 -0.111 0.077∗ 0.014 0.041(0.110) (0.165) (0.180) (0.043) (0.049) (0.043)
Delta FX 0.043 0.056 0.126∗∗∗ 0.009 -0.005 0.027∗∗
(0.026) (0.037) (0.050) (0.013) (0.017) (0.014)
ExpEarnGr -0.010 -0.017 -0.027 -0.017∗∗∗ -0.012∗∗ -0.018∗∗∗
(0.009) (0.013) (0.019) (0.004) (0.006) (0.005)
Sov CDS spr (1-year) 0.408 0.152∗∗∗
(0.344) (0.061)Observations 332 209 198 332 209 198Adj. R-sq 0.89 0.89 0.89 0.92 0.93 0.95Country FE Yes Yes Yes Yes Yes YesTime FE Yes Yes Yes Yes Yes Yes
28

Table 7: Robustness: Corporate Bond ShareThe table shows the estimated coefficients for equation (2) in the text. The sample excludes Belgium,Ireland, and Luxembourg. The sample period in columns (1) is 2003-2016. 2008-2012 is a dummyvariable equal to 1 for the crises period 2008-2012. Columns (2)-(3) exclude the crises period 2008-2012.Post is a dummy variable equal to 1 for the period 2013-2016 and 0 for 2003-2007. In columns (1)-(2)we exclude countries whose sovereign CDS spread is in the top 5th percentile over the sample periodand use countries’ 5-year sovereign rate. In column (3) countries’ sovereign rates are the year-end 1-yearsovereign local currency yields. Weighted regression where the weights are countries’ holdings of U.S.corporate and Treasury bonds. For brevity the coefficients for fixed effects and the constant are notreported. * p < 0.10, ** p < 0.05, *** p < 0.01. Heteroscedasticity-consistent standard errors arereported in parentheses.
Excl. High CDS 1-year Sov.
(1) (2) (3)
Sov5y -0.026∗∗∗ -0.031∗∗
(0.010) (0.015)
2008-12=1 × Sov5y 0.016∗∗
(0.007)
Post=1 × Sov5y -0.003(0.015)
Sov1y -0.042∗∗∗
(0.013)
Post=1 × Sov1y 0.024(0.015)
Bank link 0.193 0.175 -0.532∗
(0.130) (0.190) (0.302)
Trade share -1.013 -1.658 -5.069∗∗∗
(0.963) (1.172) (1.170)
Sov CDS spr (5-year) 1.569 2.194(2.383) (4.476)
StDev FX -0.020 -0.023 -0.278(0.180) (0.270) (0.277)
Delta FX -0.048 -0.106 -0.108∗
(0.051) (0.077) (0.062)
ExpEarnGr 0.091∗∗∗ 0.151∗∗∗ 0.217∗∗∗
(0.034) (0.049) (0.039)
Sov CDS spr (1-year) -1.767∗∗∗
(0.565)Observations 332 195 198Adj. R-sq 0.91 0.90 0.90Country FE Yes Yes YesTime FE Yes Yes Yes
29

Table 8: Hedged and Unhedged Investment in U.S. BondsThe dependent variable in columns (1)-(3) is country j ’s holdings of U.S. corporate bonds at time t scaledby country j ’s GDP. The dependent variable in column (4) is country j ’s holdings of U.S. Treasury bondsat time t scaled by country j ’s GDP. The sample period is 2003-2016. 2008-2012 is a dummy variableequal to 1 for the crises period 2008-2012. Sample excludes Belgium, Ireland, and Luxembourg. Weightedregression where the weights are countries’ holdings of U.S. corporate and Treasury bonds. For brevitythe coefficients for fixed effects and the constant are not reported. * p < 0.10, ** p < 0.05, *** p < 0.01.Heteroscedasticity-consistent standard errors are reported in parentheses.
U.S. Corporate Bonds / GDP Treasuries / GDP
(1) (2) (3) (4)
Sov1y synth. USD 0.028 0.007 0.002 0.000(0.020) (0.010) (0.002) (0.004)
2008-12=1 × Sov1y synth. USD -0.023 0.001(0.015) (0.002)
Post=1 × Sov1y synth. USD 0.031 0.004(0.027) (0.004)
Sov1y -0.010∗ 0.005∗∗∗
(0.006) (0.001)
Post=1 × Sov1y -0.000 -0.004∗∗∗
(0.008) (0.001)
Bank link -0.030 -0.096 0.073∗∗ 0.094∗∗
(0.051) (0.115) (0.035) (0.048)
Trade share 0.493 -0.178 -0.595∗∗∗ -0.427∗∗
(0.337) (0.539) (0.136) (0.180)
Sov CDS spr (1-year) 0.068 0.203 0.043 0.110∗
(0.207) (0.314) (0.079) (0.063)
StDev FX 0.098 0.125 0.098∗∗∗ 0.083∗
(0.083) (0.140) (0.040) (0.047)
ExpEarnGr -0.005 -0.004 -0.015∗∗∗ -0.012∗∗∗
(0.007) (0.012) (0.005) (0.005)Observations 325 196 325 196Adj. R-sq 0.90 0.90 0.93 0.95Country FE Yes Yes Yes YesTime FE Yes Yes Yes Yes
30

A Appendix: Corporate Bond Sample Including ABS
31

Table A.1: Holdings of U.S. Corporate Bonds and Corporate ABS as a Share of Countries’GDPThe table shows the estimated coefficients for equation (1) in the text. The dependent variable is countryj ’s holdings of U.S. corporate bonds and corporate ABS at time t scaled by country j ’s GDP. Luxembourgdrops out of the sample as it lacks data for all controls. Columns (1)-(2) include all countries in thesample; columns (3)-(4) exclude Belgium and Ireland. The sample period in columns (1) and (3) is2003-2016; in columns (2) and (4) we exclude the crises years 2008-2012. 2008-2012 is a dummy variableequal to 1 for the crises period 2008-2012. Post is a dummy variable equal to 1 for the period 2013-2016 and 0 for the period 2003-2007. Countries’ sovereign rates are the year-end 5-year sovereign localcurrency yields. The sovereign rate for Belgium and Ireland is the average of the sovereign rates ofthe Netherlands, France, Italy, and Spain. Weighted regression where the weights are countries’ totalholdings of U.S. bonds. For brevity the coefficients for fixed effects and the constant are not reported.* p < 0.10, ** p < 0.05, *** p < 0.01. Heteroscedasticity-consistent standard errors are reported inparentheses.
All countries Excl. Fin. Centers
(1) (2) (3) (4)
Sov5y -0.036∗∗∗ -0.049∗∗∗ -0.007∗∗ -0.006∗
(0.011) (0.017) (0.003) (0.003)
2008-12=1 × Sov5y -0.003 -0.004(0.008) (0.003)
Post=1 × Sov5y -0.004 0.004(0.016) (0.008)
Bank link 0.498∗∗ 0.837∗∗∗ 0.085 0.057(0.245) (0.314) (0.077) (0.102)
Trade share 0.602 0.913 -0.175 -0.403∗
(1.224) (1.365) (0.188) (0.242)
Sov CDS spr (5-year) -1.238 5.097 0.448 -0.449(1.346) (3.705) (0.473) (1.159)
StDev FX 0.372 0.214 0.089 -0.120(0.382) (0.564) (0.101) (0.170)
Delta FX 0.129 0.232∗∗ 0.046∗∗ 0.070∗∗
(0.094) (0.110) (0.023) (0.034)
ExpEarnGr 0.097∗∗∗ 0.027 -0.006 -0.016(0.035) (0.049) (0.010) (0.012)
Observations 376 236 349 218Adj. R-sq 0.92 0.91 0.89 0.89Country FE Yes Yes Yes YesTime FE Yes Yes Yes Yes
32