Embed Size (px)
Citation preview
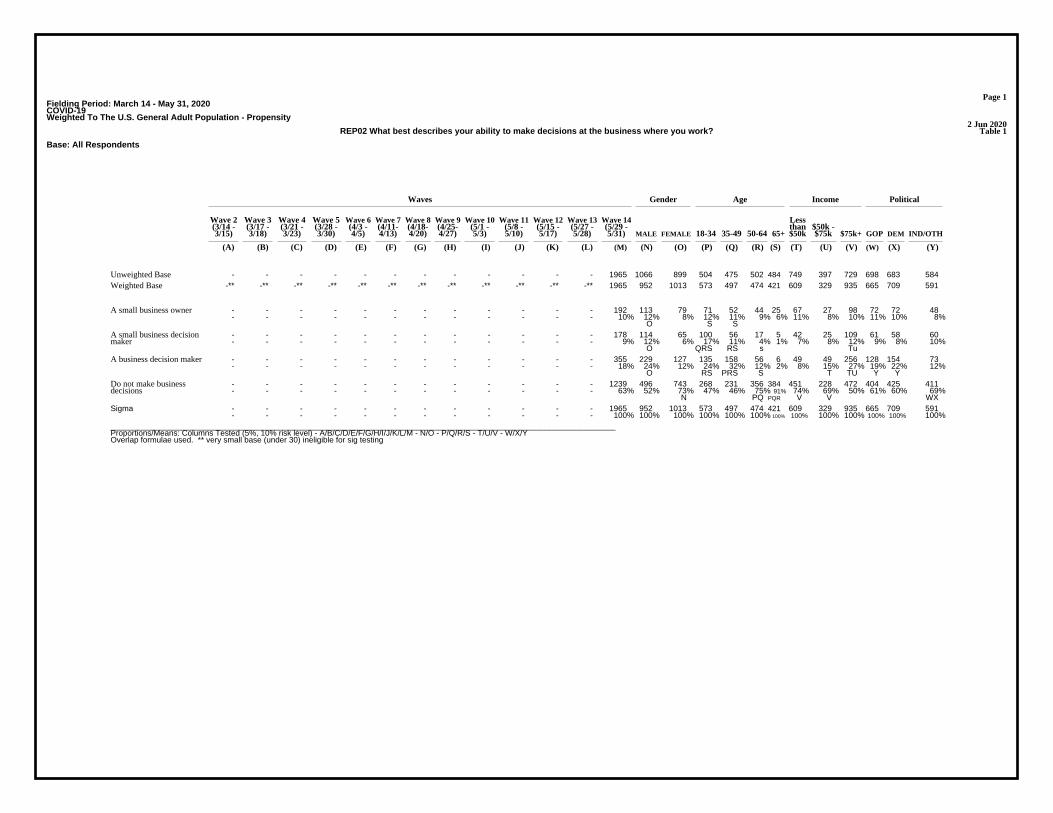
Page 1Fielding Period: March 14 - May 31, 2020COVID-19Weighted To The U.S. General Adult Population - Propensity
2 Jun 2020Table 1REP02 What best describes your ability to make decisions at the business where you work?
Base: All Respondents
Waves Gender Age Income Political
Wave 2 Wave 3 Wave 4 Wave 5 Wave 6 Wave 7 Wave 8 Wave 9 Wave 10 Wave 11 Wave 12 Wave 13 Wave 14 Less(3/14 - (3/17 - (3/21 - (3/28 - (4/3 - (4/11- (4/18- (4/25- (5/1 - (5/8 - (5/15 - (5/27 - (5/29 - than $50k -3/15) 3/18) 3/23) 3/30) 4/5) 4/13) 4/20) 4/27) 5/3) 5/10) 5/17) 5/28) 5/31) MALE FEMALE 18-34 35-49 50-64 65+ $50k $75k $75k+ GOP DEM IND/OTH
(A) (B) (C) (D) (E) (F) (G) (H) (I) (J) (K) (L) (M) (N) (O) (P) (Q) (R) (S) (T) (U) (V) (W) (X) (Y)
- - - - - - - - - - - - 1965 1066 899 504 475 502 484 749 397 729 698 683 584Unweighted Base-** -** -** -** -** -** -** -** -** -** -** -** 1965 952 1013 573 497 474 421 609 329 935 665 709 591Weighted Base
- - - - - - - - - - - - 192 113 79 71 52 44 25 67 27 98 72 72 48- - - - - - - - - - - - 10% 12% 8% 12% 11% 9% 6% 11% 8% 10% 11% 10% 8%
O S S
A small business owner
- - - - - - - - - - - - 178 114 65 100 56 17 5 42 25 109 61 58 60- - - - - - - - - - - - 9% 12% 6% 17% 11% 4% 1% 7% 8% 12% 9% 8% 10%
O QRS RS s Tu
A small business decisionmaker
- - - - - - - - - - - - 355 229 127 135 158 56 6 49 49 256 128 154 73- - - - - - - - - - - - 18% 24% 12% 24% 32% 12% 2% 8% 15% 27% 19% 22% 12%
O RS PRS S T TU Y Y
A business decision maker
- - - - - - - - - - - - 1239 496 743 268 231 356 384 451 228 472 404 425 411- - - - - - - - - - - - 63% 52% 73% 47% 46% 75% 91% 74% 69% 50% 61% 60% 69%
N PQ PQR V V WX
Do not make businessdecisions
- - - - - - - - - - - - 1965 952 1013 573 497 474 421 609 329 935 665 709 591- - - - - - - - - - - - 100% 100% 100% 100% 100% 100% 100% 100% 100% 100% 100% 100% 100%
Sigma
__________________________________________________________________________________________________________________Proportions/Means: Columns Tested (5%, 10% risk level) - A/B/C/D/E/F/G/H/I/J/K/L/M - N/O - P/Q/R/S - T/U/V - W/X/YOverlap formulae used. ** very small base (under 30) ineligible for sig testing

Page 2Fielding Period: March 14 - May 31, 2020COVID-19Weighted To The U.S. General Adult Population - Propensity
2 Jun 2020Table 2REP03 Which of the following best describes your employment status?
Base: All Respondents
Waves Gender Age Income Political
Wave 2 Wave 3 Wave 4 Wave 5 Wave 6 Wave 7 Wave 8 Wave 9 Wave 10 Wave 11 Wave 12 Wave 13 Wave 14 Less(3/14 - (3/17 - (3/21 - (3/28 - (4/3 - (4/11- (4/18- (4/25- (5/1 - (5/8 - (5/15 - (5/27 - (5/29 - than $50k -3/15) 3/18) 3/23) 3/30) 4/5) 4/13) 4/20) 4/27) 5/3) 5/10) 5/17) 5/28) 5/31) MALE FEMALE 18-34 35-49 50-64 65+ $50k $75k $75k+ GOP DEM IND/OTH
(A) (B) (C) (D) (E) (F) (G) (H) (I) (J) (K) (L) (M) (N) (O) (P) (Q) (R) (S) (T) (U) (V) (W) (X) (Y)
- - - - - - - - - - - - 1965 1066 899 504 475 502 484 749 397 729 698 683 584Unweighted Base-** -** -** -** -** -** -** -** -** -** -** -** 1965 952 1013 573 497 474 421 609 329 935 665 709 591Weighted Base
- - - - - - - - - - - - 1395 627 768 277 324 393 401 428 242 651 483 488 424- - - - - - - - - - - - 71% 66% 76% 48% 65% 83% 95% 70% 74% 70% 73% 69% 72%
N P PQ PQR
I am not seekingemployment at this time
- - - - - - - - - - - - 570 324 246 296 174 80 19 181 87 284 181 221 167- - - - - - - - - - - - 29% 34% 24% 52% 35% 17% 5% 30% 26% 30% 27% 31% 28%
O QRS RS S
I am actively seekingemployment
- - - - - - - - - - - - 1965 952 1013 573 497 474 421 609 329 935 665 709 591- - - - - - - - - - - - 100% 100% 100% 100% 100% 100% 100% 100% 100% 100% 100% 100% 100%
Sigma
__________________________________________________________________________________________________________________Proportions/Means: Columns Tested (5%, 10% risk level) - A/B/C/D/E/F/G/H/I/J/K/L/M - N/O - P/Q/R/S - T/U/V - W/X/YOverlap formulae used. ** very small base (under 30) ineligible for sig testing
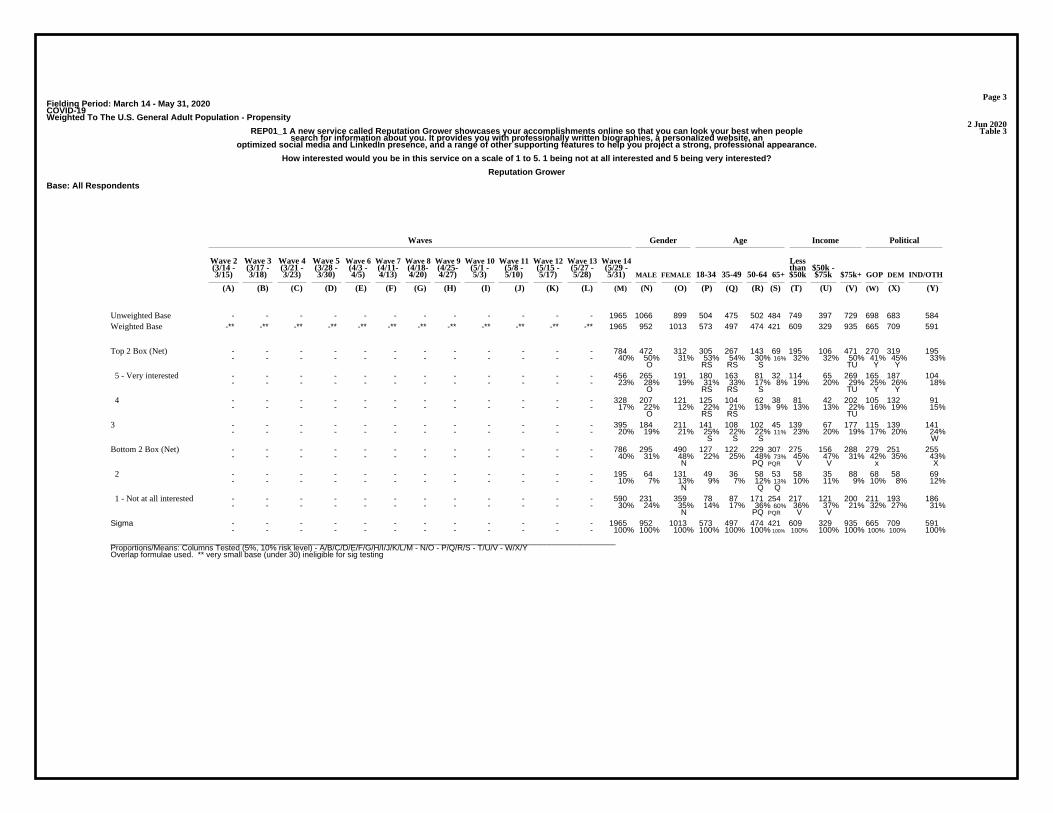
Page 3Fielding Period: March 14 - May 31, 2020COVID-19Weighted To The U.S. General Adult Population - Propensity
2 Jun 2020Table 3REP01_1 A new service called Reputation Grower showcases your accomplishments online so that you can look your best when people
search for information about you. It provides you with professionally written biographies, a personalized website, anoptimized social media and LinkedIn presence, and a range of other supporting features to help you project a strong, professional appearance.
How interested would you be in this service on a scale of 1 to 5. 1 being not at all interested and 5 being very interested?
Reputation Grower
Base: All Respondents
Waves Gender Age Income Political
Wave 2 Wave 3 Wave 4 Wave 5 Wave 6 Wave 7 Wave 8 Wave 9 Wave 10 Wave 11 Wave 12 Wave 13 Wave 14 Less(3/14 - (3/17 - (3/21 - (3/28 - (4/3 - (4/11- (4/18- (4/25- (5/1 - (5/8 - (5/15 - (5/27 - (5/29 - than $50k -3/15) 3/18) 3/23) 3/30) 4/5) 4/13) 4/20) 4/27) 5/3) 5/10) 5/17) 5/28) 5/31) MALE FEMALE 18-34 35-49 50-64 65+ $50k $75k $75k+ GOP DEM IND/OTH
(A) (B) (C) (D) (E) (F) (G) (H) (I) (J) (K) (L) (M) (N) (O) (P) (Q) (R) (S) (T) (U) (V) (W) (X) (Y)
- - - - - - - - - - - - 1965 1066 899 504 475 502 484 749 397 729 698 683 584Unweighted Base-** -** -** -** -** -** -** -** -** -** -** -** 1965 952 1013 573 497 474 421 609 329 935 665 709 591Weighted Base
- - - - - - - - - - - - 784 472 312 305 267 143 69 195 106 471 270 319 195- - - - - - - - - - - - 40% 50% 31% 53% 54% 30% 16% 32% 32% 50% 41% 45% 33%
O RS RS S TU Y Y
Top 2 Box (Net)
- - - - - - - - - - - - 456 265 191 180 163 81 32 114 65 269 165 187 104- - - - - - - - - - - - 23% 28% 19% 31% 33% 17% 8% 19% 20% 29% 25% 26% 18%
O RS RS S TU Y Y
5 - Very interested
- - - - - - - - - - - - 328 207 121 125 104 62 38 81 42 202 105 132 91- - - - - - - - - - - - 17% 22% 12% 22% 21% 13% 9% 13% 13% 22% 16% 19% 15%
O RS RS TU
4
- - - - - - - - - - - - 395 184 211 141 108 102 45 139 67 177 115 139 141- - - - - - - - - - - - 20% 19% 21% 25% 22% 22% 11% 23% 20% 19% 17% 20% 24%
S S S W
3
- - - - - - - - - - - - 786 295 490 127 122 229 307 275 156 288 279 251 255- - - - - - - - - - - - 40% 31% 48% 22% 25% 48% 73% 45% 47% 31% 42% 35% 43%
N PQ PQR V V x X
Bottom 2 Box (Net)
- - - - - - - - - - - - 195 64 131 49 36 58 53 58 35 88 68 58 69- - - - - - - - - - - - 10% 7% 13% 9% 7% 12% 13% 10% 11% 9% 10% 8% 12%
N Q Q
2
- - - - - - - - - - - - 590 231 359 78 87 171 254 217 121 200 211 193 186- - - - - - - - - - - - 30% 24% 35% 14% 17% 36% 60% 36% 37% 21% 32% 27% 31%
N PQ PQR V V
1 - Not at all interested
- - - - - - - - - - - - 1965 952 1013 573 497 474 421 609 329 935 665 709 591- - - - - - - - - - - - 100% 100% 100% 100% 100% 100% 100% 100% 100% 100% 100% 100% 100%
Sigma
__________________________________________________________________________________________________________________Proportions/Means: Columns Tested (5%, 10% risk level) - A/B/C/D/E/F/G/H/I/J/K/L/M - N/O - P/Q/R/S - T/U/V - W/X/YOverlap formulae used. ** very small base (under 30) ineligible for sig testing

Page 4Fielding Period: March 14 - May 31, 2020COVID-19Weighted To The U.S. General Adult Population - Propensity
2 Jun 2020Table 4REP01_2 A new service called Reputation Launcher showcases your accomplishments online so that you can look your best when people
search for information about you. It provides you with professionally written biographies, a personalized website, anoptimized social media and LinkedIn presence, and a range of other supporting features to help you project a strong, professional appearance.
How interested would you be in this service on a scale of 1 to 5. 1 being not at all interested and 5 being very interested?
Reputation Launcher
Base: All Respondents
Waves Gender Age Income Political
Wave 2 Wave 3 Wave 4 Wave 5 Wave 6 Wave 7 Wave 8 Wave 9 Wave 10 Wave 11 Wave 12 Wave 13 Wave 14 Less(3/14 - (3/17 - (3/21 - (3/28 - (4/3 - (4/11- (4/18- (4/25- (5/1 - (5/8 - (5/15 - (5/27 - (5/29 - than $50k -3/15) 3/18) 3/23) 3/30) 4/5) 4/13) 4/20) 4/27) 5/3) 5/10) 5/17) 5/28) 5/31) MALE FEMALE 18-34 35-49 50-64 65+ $50k $75k $75k+ GOP DEM IND/OTH
(A) (B) (C) (D) (E) (F) (G) (H) (I) (J) (K) (L) (M) (N) (O) (P) (Q) (R) (S) (T) (U) (V) (W) (X) (Y)
- - - - - - - - - - - - 1965 1066 899 504 475 502 484 749 397 729 698 683 584Unweighted Base-** -** -** -** -** -** -** -** -** -** -** -** 1965 952 1013 573 497 474 421 609 329 935 665 709 591Weighted Base
- - - - - - - - - - - - 759 443 316 293 268 137 60 197 106 444 267 304 188- - - - - - - - - - - - 39% 47% 31% 51% 54% 29% 14% 32% 32% 47% 40% 43% 32%
O RS RS S TU Y Y
Top 2 Box (Net)
- - - - - - - - - - - - 448 241 207 182 173 66 27 108 56 274 169 172 107- - - - - - - - - - - - 23% 25% 20% 32% 35% 14% 6% 18% 17% 29% 25% 24% 18%
O RS RS S TU Y Y
5 - Very interested
- - - - - - - - - - - - 311 202 110 111 95 72 33 90 50 170 98 132 82- - - - - - - - - - - - 16% 21% 11% 19% 19% 15% 8% 15% 15% 18% 15% 19% 14%
O S S S y
4
- - - - - - - - - - - - 430 203 227 163 104 104 60 144 69 202 120 156 154- - - - - - - - - - - - 22% 21% 22% 29% 21% 22% 14% 24% 21% 22% 18% 22% 26%
QrS S S W
3
- - - - - - - - - - - - 775 306 470 117 125 232 301 267 154 289 278 249 249- - - - - - - - - - - - 39% 32% 46% 20% 25% 49% 72% 44% 47% 31% 42% 35% 42%
N PQ PQR V V X X
Bottom 2 Box (Net)
- - - - - - - - - - - - 186 74 112 51 33 52 50 55 31 93 73 56 56- - - - - - - - - - - - 9% 8% 11% 9% 7% 11% 12% 9% 9% 10% 11% 8% 10%
n q Q
2
- - - - - - - - - - - - 590 232 358 66 92 180 251 212 123 196 205 192 192- - - - - - - - - - - - 30% 24% 35% 11% 19% 38% 60% 35% 37% 21% 31% 27% 33%
N P PQ PQR V V
1 - Not at all interested
- - - - - - - - - - - - 1965 952 1013 573 497 474 421 609 329 935 665 709 591- - - - - - - - - - - - 100% 100% 100% 100% 100% 100% 100% 100% 100% 100% 100% 100% 100%
Sigma
__________________________________________________________________________________________________________________Proportions/Means: Columns Tested (5%, 10% risk level) - A/B/C/D/E/F/G/H/I/J/K/L/M - N/O - P/Q/R/S - T/U/V - W/X/YOverlap formulae used. ** very small base (under 30) ineligible for sig testing

Page 5Fielding Period: March 14 - May 31, 2020COVID-19Weighted To The U.S. General Adult Population - Propensity
2 Jun 2020Table 5REP01_3 A new service called Reputation Designer showcases your accomplishments online so that you can look your best when people
search for information about you. It provides you with professionally written biographies, a personalized website, anoptimized social media and LinkedIn presence, and a range of other supporting features to help you project a strong, professional appearance.
How interested would you be in this service on a scale of 1 to 5. 1 being not at all interested and 5 being very interested?
Reputation Designer
Base: All Respondents
Waves Gender Age Income Political
Wave 2 Wave 3 Wave 4 Wave 5 Wave 6 Wave 7 Wave 8 Wave 9 Wave 10 Wave 11 Wave 12 Wave 13 Wave 14 Less(3/14 - (3/17 - (3/21 - (3/28 - (4/3 - (4/11- (4/18- (4/25- (5/1 - (5/8 - (5/15 - (5/27 - (5/29 - than $50k -3/15) 3/18) 3/23) 3/30) 4/5) 4/13) 4/20) 4/27) 5/3) 5/10) 5/17) 5/28) 5/31) MALE FEMALE 18-34 35-49 50-64 65+ $50k $75k $75k+ GOP DEM IND/OTH
(A) (B) (C) (D) (E) (F) (G) (H) (I) (J) (K) (L) (M) (N) (O) (P) (Q) (R) (S) (T) (U) (V) (W) (X) (Y)
- - - - - - - - - - - - 1965 1066 899 504 475 502 484 749 397 729 698 683 584Unweighted Base-** -** -** -** -** -** -** -** -** -** -** -** 1965 952 1013 573 497 474 421 609 329 935 665 709 591Weighted Base
- - - - - - - - - - - - 796 474 322 321 260 152 63 205 104 466 260 324 212- - - - - - - - - - - - 40% 50% 32% 56% 52% 32% 15% 34% 32% 50% 39% 46% 36%
O RS RS S TU wY
Top 2 Box (Net)
- - - - - - - - - - - - 463 266 197 187 181 71 25 119 56 280 157 182 124- - - - - - - - - - - - 24% 28% 19% 33% 36% 15% 6% 19% 17% 30% 24% 26% 21%
O RS RS S TU
5 - Very interested
- - - - - - - - - - - - 332 208 125 134 79 81 38 86 48 186 104 141 88- - - - - - - - - - - - 17% 22% 12% 23% 16% 17% 9% 14% 15% 20% 16% 20% 15%
O QrS S S Tu y
4
- - - - - - - - - - - - 394 180 214 131 114 102 47 130 62 190 142 118 133- - - - - - - - - - - - 20% 19% 21% 23% 23% 22% 11% 21% 19% 20% 21% 17% 23%
S S S x X
3
- - - - - - - - - - - - 776 298 478 121 124 220 311 274 163 279 262 267 246- - - - - - - - - - - - 39% 31% 47% 21% 25% 46% 74% 45% 50% 30% 39% 38% 42%
N PQ PQR V V
Bottom 2 Box (Net)
- - - - - - - - - - - - 194 74 119 52 41 48 52 60 40 88 65 71 58- - - - - - - - - - - - 10% 8% 12% 9% 8% 10% 12% 10% 12% 9% 10% 10% 10%
N
2
- - - - - - - - - - - - 582 224 358 68 82 172 259 214 123 191 197 197 188- - - - - - - - - - - - 30% 23% 35% 12% 17% 36% 62% 35% 37% 20% 30% 28% 32%
N PQ PQR V V
1 - Not at all interested
- - - - - - - - - - - - 1965 952 1013 573 497 474 421 609 329 935 665 709 591- - - - - - - - - - - - 100% 100% 100% 100% 100% 100% 100% 100% 100% 100% 100% 100% 100%
Sigma
__________________________________________________________________________________________________________________Proportions/Means: Columns Tested (5%, 10% risk level) - A/B/C/D/E/F/G/H/I/J/K/L/M - N/O - P/Q/R/S - T/U/V - W/X/YOverlap formulae used. ** very small base (under 30) ineligible for sig testing

Page 6Fielding Period: March 14 - May 31, 2020COVID-19Weighted To The U.S. General Adult Population - Propensity
2 Jun 2020Table 6REP01_4 A new service called Reputation Spotlight showcases your accomplishments online so that you can look your best when people
search for information about you. It provides you with professionally written biographies, a personalized website, anoptimized social media and LinkedIn presence, and a range of other supporting features to help you project a strong, professional appearance.
How interested would you be in this service on a scale of 1 to 5. 1 being not at all interested and 5 being very interested?
Reputation Spotlight
Base: All Respondents
Waves Gender Age Income Political
Wave 2 Wave 3 Wave 4 Wave 5 Wave 6 Wave 7 Wave 8 Wave 9 Wave 10 Wave 11 Wave 12 Wave 13 Wave 14 Less(3/14 - (3/17 - (3/21 - (3/28 - (4/3 - (4/11- (4/18- (4/25- (5/1 - (5/8 - (5/15 - (5/27 - (5/29 - than $50k -3/15) 3/18) 3/23) 3/30) 4/5) 4/13) 4/20) 4/27) 5/3) 5/10) 5/17) 5/28) 5/31) MALE FEMALE 18-34 35-49 50-64 65+ $50k $75k $75k+ GOP DEM IND/OTH
(A) (B) (C) (D) (E) (F) (G) (H) (I) (J) (K) (L) (M) (N) (O) (P) (Q) (R) (S) (T) (U) (V) (W) (X) (Y)
- - - - - - - - - - - - 1965 1066 899 504 475 502 484 749 397 729 698 683 584Unweighted Base-** -** -** -** -** -** -** -** -** -** -** -** 1965 952 1013 573 497 474 421 609 329 935 665 709 591Weighted Base
- - - - - - - - - - - - 779 451 328 314 267 137 61 193 115 460 267 309 204- - - - - - - - - - - - 40% 47% 32% 55% 54% 29% 15% 32% 35% 49% 40% 44% 34%
O RS RS S TU Y
Top 2 Box (Net)
- - - - - - - - - - - - 453 251 202 177 171 76 30 120 63 261 157 186 109- - - - - - - - - - - - 23% 26% 20% 31% 34% 16% 7% 20% 19% 28% 24% 26% 19%
O RS RS S TU y Y
5 - Very interested
- - - - - - - - - - - - 326 201 126 137 96 62 32 74 52 199 110 122 94- - - - - - - - - - - - 17% 21% 12% 24% 19% 13% 8% 12% 16% 21% 17% 17% 16%
O RS RS S Tu
4
- - - - - - - - - - - - 402 182 220 139 102 114 46 144 61 177 116 142 144- - - - - - - - - - - - 20% 19% 22% 24% 21% 24% 11% 24% 18% 19% 17% 20% 24%
S S S v W
3
- - - - - - - - - - - - 784 319 465 120 128 222 314 272 154 298 282 259 243- - - - - - - - - - - - 40% 33% 46% 21% 26% 47% 75% 45% 47% 32% 42% 37% 41%
N PQ PQR V V x
Bottom 2 Box (Net)
- - - - - - - - - - - - 187 77 110 49 40 53 44 54 32 95 75 55 57- - - - - - - - - - - - 10% 8% 11% 9% 8% 11% 11% 9% 10% 10% 11% 8% 10%
x
2
- - - - - - - - - - - - 597 242 356 71 88 169 270 217 122 203 207 204 186- - - - - - - - - - - - 30% 25% 35% 12% 18% 36% 64% 36% 37% 22% 31% 29% 31%
N p PQ PQR V V
1 - Not at all interested
- - - - - - - - - - - - 1965 952 1013 573 497 474 421 609 329 935 665 709 591- - - - - - - - - - - - 100% 100% 100% 100% 100% 100% 100% 100% 100% 100% 100% 100% 100%
Sigma
__________________________________________________________________________________________________________________Proportions/Means: Columns Tested (5%, 10% risk level) - A/B/C/D/E/F/G/H/I/J/K/L/M - N/O - P/Q/R/S - T/U/V - W/X/YOverlap formulae used. ** very small base (under 30) ineligible for sig testing
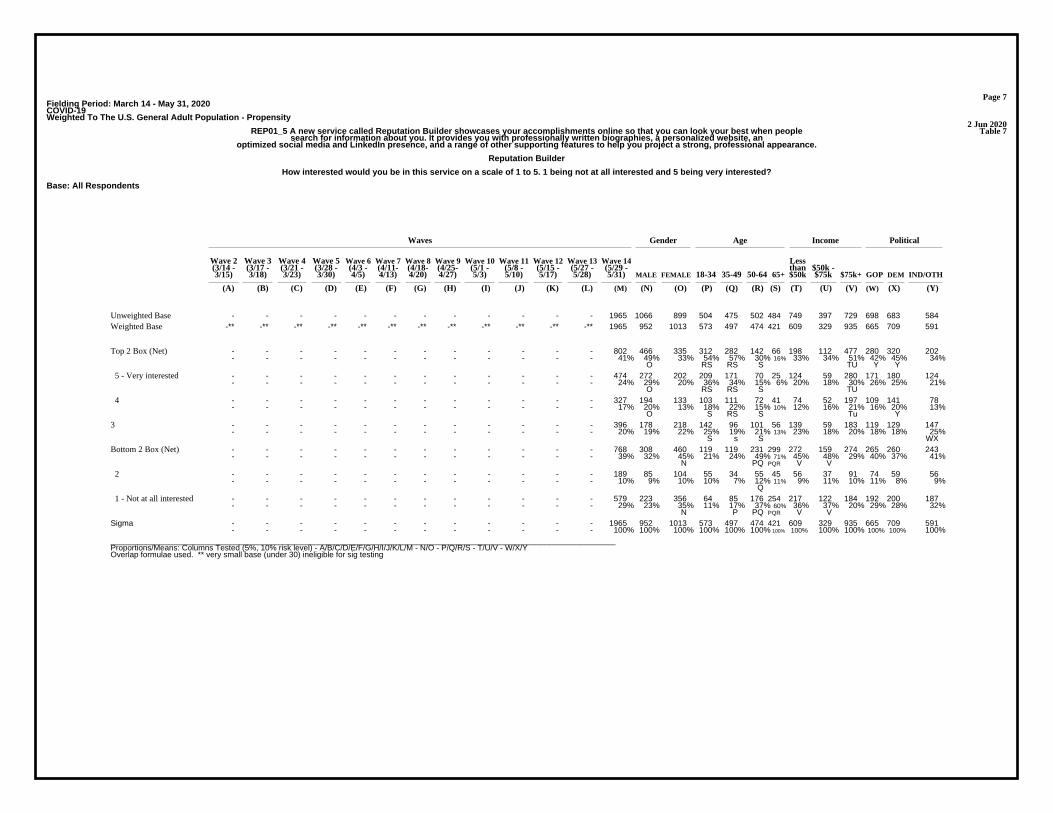
Page 7Fielding Period: March 14 - May 31, 2020COVID-19Weighted To The U.S. General Adult Population - Propensity
2 Jun 2020Table 7REP01_5 A new service called Reputation Builder showcases your accomplishments online so that you can look your best when people
search for information about you. It provides you with professionally written biographies, a personalized website, anoptimized social media and LinkedIn presence, and a range of other supporting features to help you project a strong, professional appearance.
Reputation Builder
How interested would you be in this service on a scale of 1 to 5. 1 being not at all interested and 5 being very interested?
Base: All Respondents
Waves Gender Age Income Political
Wave 2 Wave 3 Wave 4 Wave 5 Wave 6 Wave 7 Wave 8 Wave 9 Wave 10 Wave 11 Wave 12 Wave 13 Wave 14 Less(3/14 - (3/17 - (3/21 - (3/28 - (4/3 - (4/11- (4/18- (4/25- (5/1 - (5/8 - (5/15 - (5/27 - (5/29 - than $50k -3/15) 3/18) 3/23) 3/30) 4/5) 4/13) 4/20) 4/27) 5/3) 5/10) 5/17) 5/28) 5/31) MALE FEMALE 18-34 35-49 50-64 65+ $50k $75k $75k+ GOP DEM IND/OTH
(A) (B) (C) (D) (E) (F) (G) (H) (I) (J) (K) (L) (M) (N) (O) (P) (Q) (R) (S) (T) (U) (V) (W) (X) (Y)
- - - - - - - - - - - - 1965 1066 899 504 475 502 484 749 397 729 698 683 584Unweighted Base-** -** -** -** -** -** -** -** -** -** -** -** 1965 952 1013 573 497 474 421 609 329 935 665 709 591Weighted Base
- - - - - - - - - - - - 802 466 335 312 282 142 66 198 112 477 280 320 202- - - - - - - - - - - - 41% 49% 33% 54% 57% 30% 16% 33% 34% 51% 42% 45% 34%
O RS RS S TU Y Y
Top 2 Box (Net)
- - - - - - - - - - - - 474 272 202 209 171 70 25 124 59 280 171 180 124- - - - - - - - - - - - 24% 29% 20% 36% 34% 15% 6% 20% 18% 30% 26% 25% 21%
O RS RS S TU
5 - Very interested
- - - - - - - - - - - - 327 194 133 103 111 72 41 74 52 197 109 141 78- - - - - - - - - - - - 17% 20% 13% 18% 22% 15% 10% 12% 16% 21% 16% 20% 13%
O S RS S Tu Y
4
- - - - - - - - - - - - 396 178 218 142 96 101 56 139 59 183 119 129 147- - - - - - - - - - - - 20% 19% 22% 25% 19% 21% 13% 23% 18% 20% 18% 18% 25%
S s S WX
3
- - - - - - - - - - - - 768 308 460 119 119 231 299 272 159 274 265 260 243- - - - - - - - - - - - 39% 32% 45% 21% 24% 49% 71% 45% 48% 29% 40% 37% 41%
N PQ PQR V V
Bottom 2 Box (Net)
- - - - - - - - - - - - 189 85 104 55 34 55 45 56 37 91 74 59 56- - - - - - - - - - - - 10% 9% 10% 10% 7% 12% 11% 9% 11% 10% 11% 8% 9%
Q
2
- - - - - - - - - - - - 579 223 356 64 85 176 254 217 122 184 192 200 187- - - - - - - - - - - - 29% 23% 35% 11% 17% 37% 60% 36% 37% 20% 29% 28% 32%
N P PQ PQR V V
1 - Not at all interested
- - - - - - - - - - - - 1965 952 1013 573 497 474 421 609 329 935 665 709 591- - - - - - - - - - - - 100% 100% 100% 100% 100% 100% 100% 100% 100% 100% 100% 100% 100%
Sigma
__________________________________________________________________________________________________________________Proportions/Means: Columns Tested (5%, 10% risk level) - A/B/C/D/E/F/G/H/I/J/K/L/M - N/O - P/Q/R/S - T/U/V - W/X/YOverlap formulae used. ** very small base (under 30) ineligible for sig testing
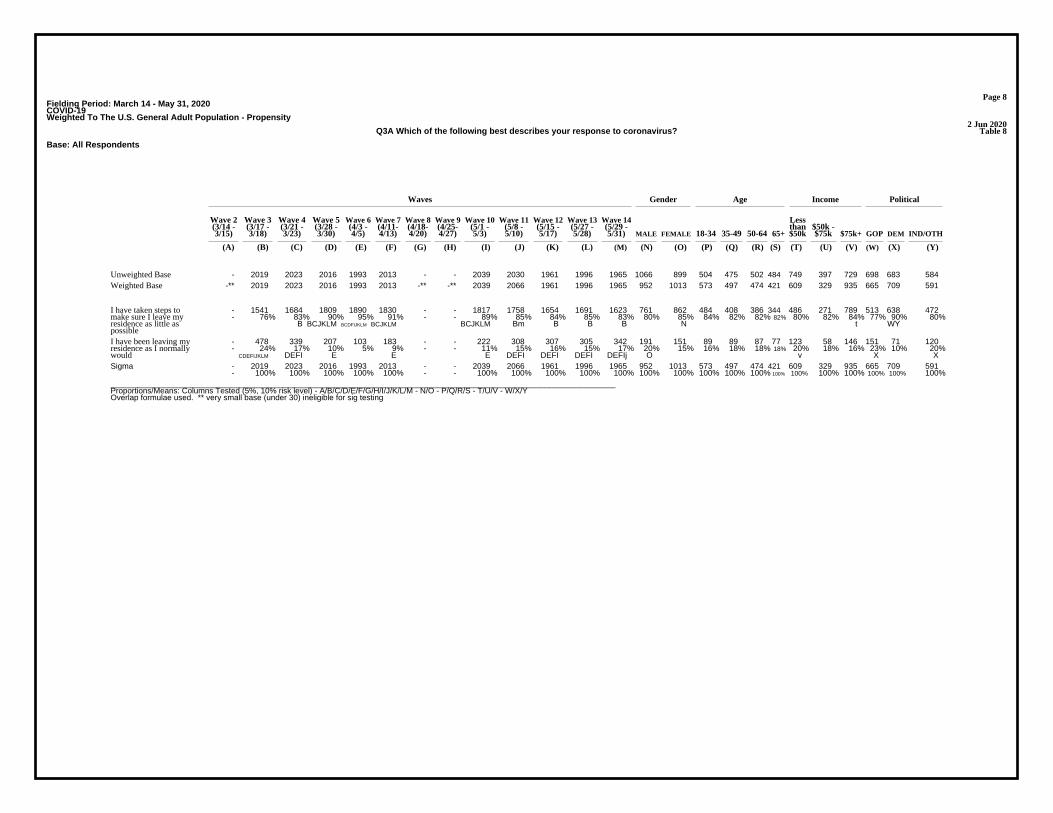
Page 8Fielding Period: March 14 - May 31, 2020COVID-19Weighted To The U.S. General Adult Population - Propensity
2 Jun 2020Table 8Q3A Which of the following best describes your response to coronavirus?
Base: All Respondents
Waves Gender Age Income Political
Wave 2 Wave 3 Wave 4 Wave 5 Wave 6 Wave 7 Wave 8 Wave 9 Wave 10 Wave 11 Wave 12 Wave 13 Wave 14 Less(3/14 - (3/17 - (3/21 - (3/28 - (4/3 - (4/11- (4/18- (4/25- (5/1 - (5/8 - (5/15 - (5/27 - (5/29 - than $50k -3/15) 3/18) 3/23) 3/30) 4/5) 4/13) 4/20) 4/27) 5/3) 5/10) 5/17) 5/28) 5/31) MALE FEMALE 18-34 35-49 50-64 65+ $50k $75k $75k+ GOP DEM IND/OTH
(A) (B) (C) (D) (E) (F) (G) (H) (I) (J) (K) (L) (M) (N) (O) (P) (Q) (R) (S) (T) (U) (V) (W) (X) (Y)
- 2019 2023 2016 1993 2013 - - 2039 2030 1961 1996 1965 1066 899 504 475 502 484 749 397 729 698 683 584Unweighted Base-** 2019 2023 2016 1993 2013 -** -** 2039 2066 1961 1996 1965 952 1013 573 497 474 421 609 329 935 665 709 591Weighted Base
- 1541 1684 1809 1890 1830 - - 1817 1758 1654 1691 1623 761 862 484 408 386 344 486 271 789 513 638 472- 76% 83% 90% 95% 91% - - 89% 85% 84% 85% 83% 80% 85% 84% 82% 82% 82% 80% 82% 84% 77% 90% 80%
B BCJKLM BCDFIJKLM BCJKLM BCJKLM Bm B B B N t WY
I have taken steps tomake sure I leave myresidence as little aspossible
- 478 339 207 103 183 - - 222 308 307 305 342 191 151 89 89 87 77 123 58 146 151 71 120- 24% 17% 10% 5% 9% - - 11% 15% 16% 15% 17% 20% 15% 16% 18% 18% 18% 20% 18% 16% 23% 10% 20%
CDEFIJKLM DEFI E E E DEFI DEFI DEFI DEFIj O v X X
I have been leaving myresidence as I normallywould
- 2019 2023 2016 1993 2013 - - 2039 2066 1961 1996 1965 952 1013 573 497 474 421 609 329 935 665 709 591- 100% 100% 100% 100% 100% - - 100% 100% 100% 100% 100% 100% 100% 100% 100% 100% 100% 100% 100% 100% 100% 100% 100%
Sigma
__________________________________________________________________________________________________________________Proportions/Means: Columns Tested (5%, 10% risk level) - A/B/C/D/E/F/G/H/I/J/K/L/M - N/O - P/Q/R/S - T/U/V - W/X/YOverlap formulae used. ** very small base (under 30) ineligible for sig testing

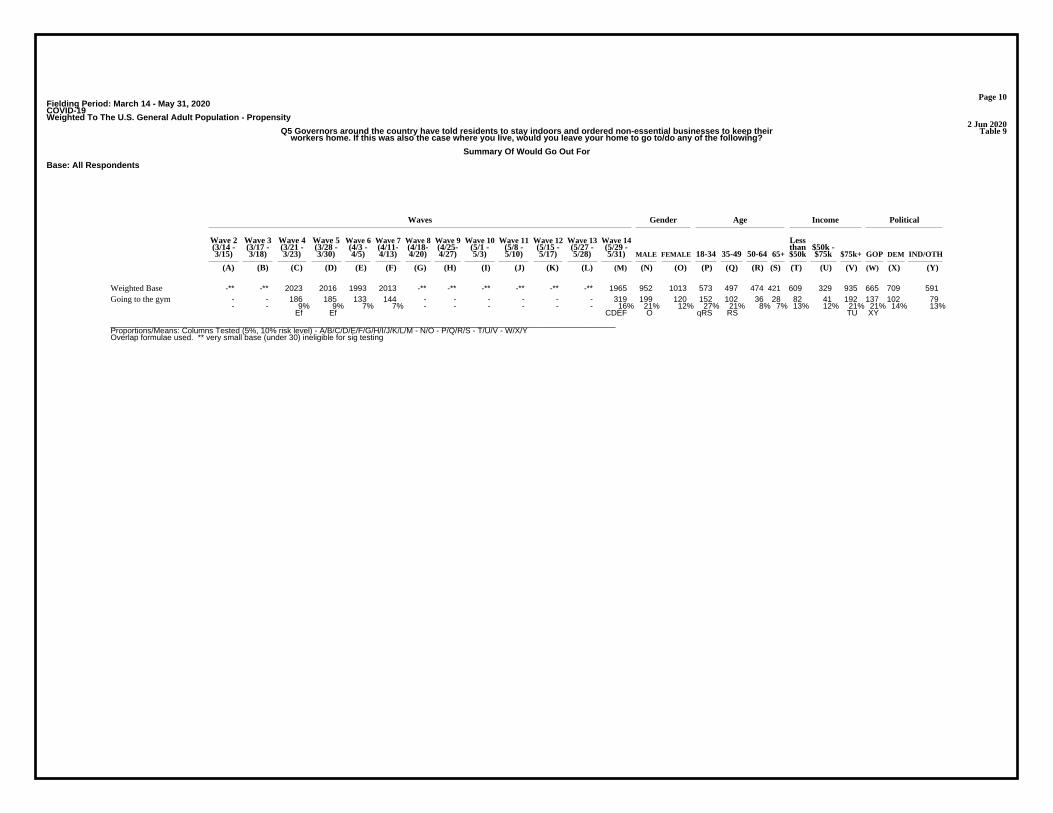
Page 9Fielding Period: March 14 - May 31, 2020COVID-19Weighted To The U.S. General Adult Population - Propensity
2 Jun 2020Table 9Q5 Governors around the country have told residents to stay indoors and ordered non-essential businesses to keep their
workers home. If this was also the case where you live, would you leave your home to go to/do any of the following?
Summary Of Would Go Out For
Base: All Respondents
Waves Gender Age Income Political
Wave 2 Wave 3 Wave 4 Wave 5 Wave 6 Wave 7 Wave 8 Wave 9 Wave 10 Wave 11 Wave 12 Wave 13 Wave 14 Less(3/14 - (3/17 - (3/21 - (3/28 - (4/3 - (4/11- (4/18- (4/25- (5/1 - (5/8 - (5/15 - (5/27 - (5/29 - than $50k -3/15) 3/18) 3/23) 3/30) 4/5) 4/13) 4/20) 4/27) 5/3) 5/10) 5/17) 5/28) 5/31) MALE FEMALE 18-34 35-49 50-64 65+ $50k $75k $75k+ GOP DEM IND/OTH
(A) (B) (C) (D) (E) (F) (G) (H) (I) (J) (K) (L) (M) (N) (O) (P) (Q) (R) (S) (T) (U) (V) (W) (X) (Y)
- - 2023 2016 1993 2013 - - - - - - 1965 1066 899 504 475 502 484 749 397 729 698 683 584Unweighted Base-** -** 2023 2016 1993 2013 -** -** -** -** -** -** 1965 952 1013 573 497 474 421 609 329 935 665 709 591Weighted Base
- - 1728 1744 1744 1689 - - - - - - 1650 802 848 458 400 421 371 527 280 768 556 590 504- - 85% 87% 88% 84% - - - - - - 84% 84% 84% 80% 80% 89% 88% 87% 85% 82% 84% 83% 85%
fm FM PQ PQ v
Grocery store
- - 1630 1626 1619 1557 - - - - - - 1539 766 774 406 388 400 346 473 255 747 533 558 448- - 81% 81% 81% 77% - - - - - - 78% 80% 76% 71% 78% 84% 82% 78% 78% 80% 80% 79% 76%
F F Fm o P PQ P
Pharmacy
- - 1338 1299 1323 1329 - - - - - - 1352 672 679 374 328 330 319 404 222 667 480 473 399- - 66% 64% 66% 66% - - - - - - 69% 71% 67% 65% 66% 70% 76% 66% 67% 71% 72% 67% 68%
D PQ x
Hospital/doctor’s office
- - 1355 1265 1144 1168 - - - - - - 1217 602 615 360 304 303 249 387 207 591 414 445 358- - 67% 63% 57% 58% - - - - - - 62% 63% 61% 63% 61% 64% 59% 64% 63% 63% 62% 63% 60%
DEFM EF Ef
Caring for a familymember in anotherhousehold
- - 1070 1111 948 1017 - - - - - - 1160 582 578 315 284 310 252 332 192 583 390 414 356- - 53% 55% 48% 51% - - - - - - 59% 61% 57% 55% 57% 65% 60% 54% 58% 62% 59% 58% 60%
E EF CdEF PQ T
Restaurants for carry-out
- - 1288 1220 1106 1107 - - - - - - 1118 565 553 321 275 305 217 357 192 535 367 427 323- - 64% 61% 56% 55% - - - - - - 57% 59% 55% 56% 55% 64% 52% 59% 58% 57% 55% 60% 55%
EFM EFm PQS
Caring for elderly
- - 1220 1165 1077 1037 - - - - - - 1095 530 565 316 285 283 210 353 187 518 358 417 320- - 60% 58% 54% 51% - - - - - - 56% 56% 56% 55% 57% 60% 50% 58% 57% 55% 54% 59% 54%
EFM eF F s S
Caring for people withdisabilities
- - 972 1091 944 945 - - - - - - 1093 573 520 318 281 265 229 290 179 582 399 376 318- - 48% 54% 47% 47% - - - - - - 56% 60% 51% 56% 57% 56% 54% 48% 54% 62% 60% 53% 54%
CEF CEF O t TU Xy
Daily exercise
- - 960 986 954 972 - - - - - - 1087 554 534 295 271 264 256 351 188 511 398 366 323- - 47% 49% 48% 48% - - - - - - 55% 58% 53% 52% 55% 56% 61% 58% 57% 55% 60% 52% 55%
CDEF o P X
Banks
- - 1177 1071 1009 1023 - - - - - - 1085 553 532 348 321 251 165 324 180 548 361 402 322- - 58% 53% 51% 51% - - - - - - 55% 58% 53% 61% 65% 53% 39% 53% 55% 59% 54% 57% 54%
DEF EF o rS RS S t
Caring for children
- - 393 328 230 234 - - - - - - 524 313 211 195 150 103 76 163 72 273 208 155 161- - 19% 16% 12% 12% - - - - - - 27% 33% 21% 34% 30% 22% 18% 27% 22% 29% 31% 22% 27%
DEF EF CDEF O RS RS U X x
Visit friends
- - 360 278 197 207 - - - - - - 481 277 204 169 142 93 77 159 71 236 192 139 151- - 18% 14% 10% 10% - - - - - - 24% 29% 20% 29% 29% 20% 18% 26% 22% 25% 29% 20% 25%
DEF EF CDEF O RS RS X x
Having dinner at a friend’shouse
- - 235 233 146 183 - - - - - - 392 244 149 159 136 56 41 98 58 227 178 111 103- - 12% 12% 7% 9% - - - - - - 20% 26% 15% 28% 27% 12% 10% 16% 18% 24% 27% 16% 17%
EF EF CDEF O RS RS TU XY
Schools
- - 222 227 132 150 - - - - - - 325 191 134 134 96 53 42 87 49 183 143 101 81- - 11% 11% 7% 7% - - - - - - 17% 20% 13% 23% 19% 11% 10% 14% 15% 20% 21% 14% 14%
EF EF CDEF O RS RS T XY
Hosting people for dinner
__________________________________________________________________________________________________________________Proportions/Means: Columns Tested (5%, 10% risk level) - A/B/C/D/E/F/G/H/I/J/K/L/M - N/O - P/Q/R/S - T/U/V - W/X/YOverlap formulae used. ** very small base (under 30) ineligible for sig testing
Page 10Fielding Period: March 14 - May 31, 2020COVID-19Weighted To The U.S. General Adult Population - Propensity
2 Jun 2020Table 9Q5 Governors around the country have told residents to stay indoors and ordered non-essential businesses to keep their
workers home. If this was also the case where you live, would you leave your home to go to/do any of the following?
Summary Of Would Go Out For
Base: All Respondents
Waves Gender Age Income Political
Wave 2 Wave 3 Wave 4 Wave 5 Wave 6 Wave 7 Wave 8 Wave 9 Wave 10 Wave 11 Wave 12 Wave 13 Wave 14 Less(3/14 - (3/17 - (3/21 - (3/28 - (4/3 - (4/11- (4/18- (4/25- (5/1 - (5/8 - (5/15 - (5/27 - (5/29 - than $50k -3/15) 3/18) 3/23) 3/30) 4/5) 4/13) 4/20) 4/27) 5/3) 5/10) 5/17) 5/28) 5/31) MALE FEMALE 18-34 35-49 50-64 65+ $50k $75k $75k+ GOP DEM IND/OTH
(A) (B) (C) (D) (E) (F) (G) (H) (I) (J) (K) (L) (M) (N) (O) (P) (Q) (R) (S) (T) (U) (V) (W) (X) (Y)
-** -** 2023 2016 1993 2013 -** -** -** -** -** -** 1965 952 1013 573 497 474 421 609 329 935 665 709 591Weighted Base- - 186 185 133 144 - - - - - - 319 199 120 152 102 36 28 82 41 192 137 102 79- - 9% 9% 7% 7% - - - - - - 16% 21% 12% 27% 21% 8% 7% 13% 12% 21% 21% 14% 13%
Ef Ef CDEF O qRS RS TU XY
Going to the gym
__________________________________________________________________________________________________________________Proportions/Means: Columns Tested (5%, 10% risk level) - A/B/C/D/E/F/G/H/I/J/K/L/M - N/O - P/Q/R/S - T/U/V - W/X/YOverlap formulae used. ** very small base (under 30) ineligible for sig testing

Page 11Fielding Period: March 14 - May 31, 2020COVID-19Weighted To The U.S. General Adult Population - Propensity
2 Jun 2020Table 10Q5 Governors around the country have told residents to stay indoors and ordered non-essential businesses to keep their
workers home. If this was also the case where you live, would you leave your home to go to/do any of the following?
Summary Of Would Not Go Out For
Base: All Respondents
Waves Gender Age Income Political
Wave 2 Wave 3 Wave 4 Wave 5 Wave 6 Wave 7 Wave 8 Wave 9 Wave 10 Wave 11 Wave 12 Wave 13 Wave 14 Less(3/14 - (3/17 - (3/21 - (3/28 - (4/3 - (4/11- (4/18- (4/25- (5/1 - (5/8 - (5/15 - (5/27 - (5/29 - than $50k -3/15) 3/18) 3/23) 3/30) 4/5) 4/13) 4/20) 4/27) 5/3) 5/10) 5/17) 5/28) 5/31) MALE FEMALE 18-34 35-49 50-64 65+ $50k $75k $75k+ GOP DEM IND/OTH
(A) (B) (C) (D) (E) (F) (G) (H) (I) (J) (K) (L) (M) (N) (O) (P) (Q) (R) (S) (T) (U) (V) (W) (X) (Y)
- - 2023 2016 1993 2013 - - - - - - 1965 1066 899 504 475 502 484 749 397 729 698 683 584Unweighted Base-** -** 2023 2016 1993 2013 -** -** -** -** -** -** 1965 952 1013 573 497 474 421 609 329 935 665 709 591Weighted Base
- - 1837 1831 1860 1869 - - - - - - 1646 753 894 421 395 437 393 527 288 743 528 607 512- - 91% 91% 93% 93% - - - - - - 84% 79% 88% 73% 79% 92% 93% 87% 88% 79% 79% 86% 87%
M M CDM cdM N p PQ PQ V V W W
Going to the gym
- - 1801 1789 1861 1863 - - - - - - 1640 760 880 439 402 420 379 522 280 752 522 608 510- - 89% 89% 93% 93% - - - - - - 83% 80% 87% 77% 81% 89% 90% 86% 85% 80% 79% 86% 86%
M M CDM CDM N PQ PQ V W W
Hosting people for dinner
- - 1788 1783 1847 1830 - - - - - - 1573 708 865 414 361 418 380 510 271 708 487 598 488- - 88% 88% 93% 91% - - - - - - 80% 74% 85% 72% 73% 88% 90% 84% 82% 76% 73% 84% 83%
M M CDM CDM N PQ PQ V V W W
Schools
- - 1663 1738 1796 1806 - - - - - - 1484 674 809 404 355 380 344 450 258 699 473 570 441- - 82% 86% 90% 90% - - - - - - 76% 71% 80% 71% 71% 80% 82% 74% 78% 75% 71% 80% 75%
M CM CDM CDM N PQ PQ Wy
Having dinner at a friend’shouse
- - 1630 1688 1763 1779 - - - - - - 1441 639 802 378 348 370 345 445 257 662 457 554 431- - 81% 84% 88% 88% - - - - - - 73% 67% 79% 66% 70% 78% 82% 73% 78% 71% 69% 78% 73%
M CM CDM CDM N PQ PQ V Wy
Visit friends
- - 846 945 984 990 - - - - - - 880 399 481 225 176 223 256 285 148 387 303 307 269- - 42% 47% 49% 49% - - - - - - 45% 42% 47% 39% 35% 47% 61% 47% 45% 41% 46% 43% 46%
C CM CM n pQ PQR v
Caring for children
- - 1063 1030 1039 1041 - - - - - - 878 398 480 278 226 209 165 258 141 424 267 343 268- - 53% 51% 52% 52% - - - - - - 45% 42% 47% 48% 45% 44% 39% 42% 43% 45% 40% 48% 45%
M M M M n S W
Banks
- - 1051 925 1049 1068 - - - - - - 872 378 494 255 216 209 192 319 150 353 266 333 273- - 52% 46% 53% 53% - - - - - - 44% 40% 49% 44% 43% 44% 46% 52% 46% 38% 40% 47% 46%
DM DM DM N uV V W w
Daily exercise
- - 803 851 916 976 - - - - - - 870 421 449 257 212 190 211 256 142 417 307 292 271- - 40% 42% 46% 49% - - - - - - 44% 44% 44% 45% 43% 40% 50% 42% 43% 45% 46% 41% 46%
Cd CDM C qR
Caring for people withdisabilities
- - 735 796 887 906 - - - - - - 847 387 460 252 223 168 204 252 137 400 297 282 268- - 36% 39% 44% 45% - - - - - - 43% 41% 45% 44% 45% 36% 48% 41% 42% 43% 45% 40% 45%
CD CD Cd R R R
Caring for elderly
- - 953 905 1045 996 - - - - - - 805 369 435 258 214 164 169 277 137 352 275 295 235- - 47% 45% 52% 49% - - - - - - 41% 39% 43% 45% 43% 35% 40% 46% 42% 38% 41% 42% 40%
M m CDM DM R R V
Restaurants for carry-out
- - 668 751 849 845 - - - - - - 748 350 399 213 193 170 172 222 122 343 251 264 234- - 33% 37% 43% 42% - - - - - - 38% 37% 39% 37% 39% 36% 41% 36% 37% 37% 38% 37% 40%
C CDM CDm C
Caring for a familymember in anotherhousehold
- - 685 717 670 684 - - - - - - 613 279 334 199 169 143 102 205 107 268 184 237 192- - 34% 36% 34% 34% - - - - - - 31% 29% 33% 35% 34% 30% 24% 34% 33% 29% 28% 33% 32%
M S S w
Hospital/doctor’s office
- - 393 390 374 456 - - - - - - 426 186 240 168 110 74 75 135 74 188 131 151 143- - 19% 19% 19% 23% - - - - - - 22% 20% 24% 29% 22% 16% 18% 22% 22% 20% 20% 21% 24%
CDE e n QRS R
Pharmacy
__________________________________________________________________________________________________________________Proportions/Means: Columns Tested (5%, 10% risk level) - A/B/C/D/E/F/G/H/I/J/K/L/M - N/O - P/Q/R/S - T/U/V - W/X/YOverlap formulae used. ** very small base (under 30) ineligible for sig testing
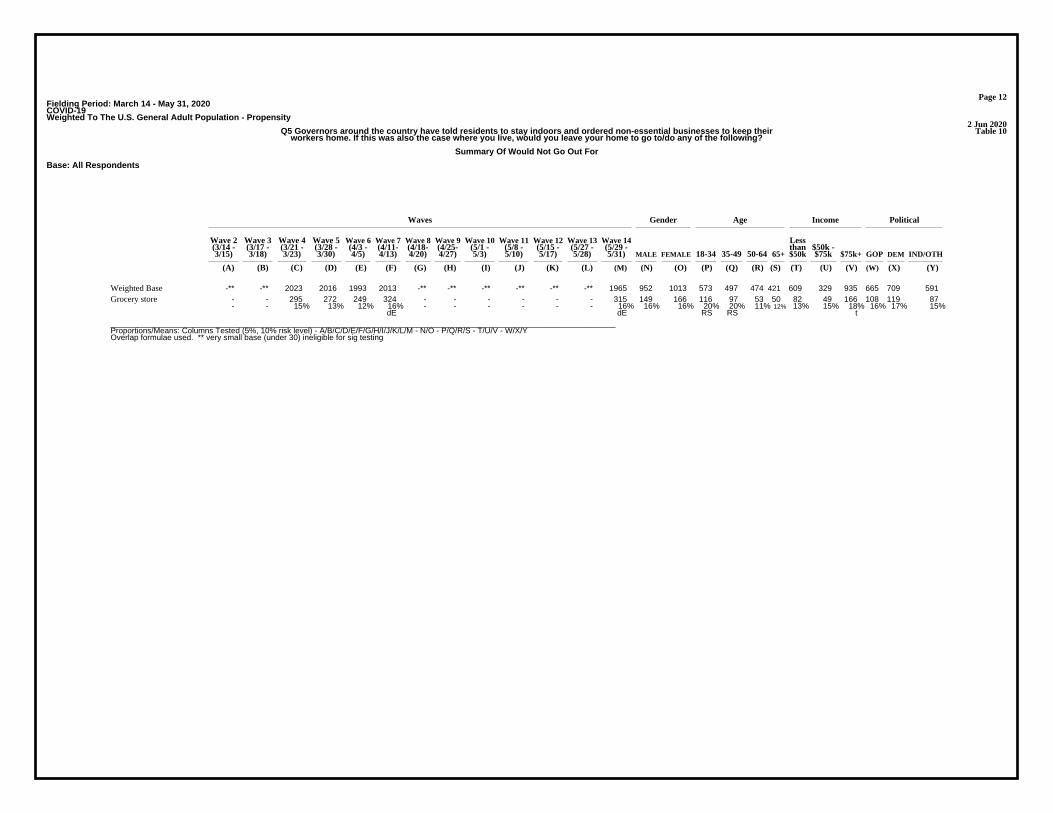
Page 12Fielding Period: March 14 - May 31, 2020COVID-19Weighted To The U.S. General Adult Population - Propensity
2 Jun 2020Table 10Q5 Governors around the country have told residents to stay indoors and ordered non-essential businesses to keep their
workers home. If this was also the case where you live, would you leave your home to go to/do any of the following?
Summary Of Would Not Go Out For
Base: All Respondents
Waves Gender Age Income Political
Wave 2 Wave 3 Wave 4 Wave 5 Wave 6 Wave 7 Wave 8 Wave 9 Wave 10 Wave 11 Wave 12 Wave 13 Wave 14 Less(3/14 - (3/17 - (3/21 - (3/28 - (4/3 - (4/11- (4/18- (4/25- (5/1 - (5/8 - (5/15 - (5/27 - (5/29 - than $50k -3/15) 3/18) 3/23) 3/30) 4/5) 4/13) 4/20) 4/27) 5/3) 5/10) 5/17) 5/28) 5/31) MALE FEMALE 18-34 35-49 50-64 65+ $50k $75k $75k+ GOP DEM IND/OTH
(A) (B) (C) (D) (E) (F) (G) (H) (I) (J) (K) (L) (M) (N) (O) (P) (Q) (R) (S) (T) (U) (V) (W) (X) (Y)
-** -** 2023 2016 1993 2013 -** -** -** -** -** -** 1965 952 1013 573 497 474 421 609 329 935 665 709 591Weighted Base- - 295 272 249 324 - - - - - - 315 149 166 116 97 53 50 82 49 166 108 119 87- - 15% 13% 12% 16% - - - - - - 16% 16% 16% 20% 20% 11% 12% 13% 15% 18% 16% 17% 15%
dE dE RS RS t
Grocery store
__________________________________________________________________________________________________________________Proportions/Means: Columns Tested (5%, 10% risk level) - A/B/C/D/E/F/G/H/I/J/K/L/M - N/O - P/Q/R/S - T/U/V - W/X/YOverlap formulae used. ** very small base (under 30) ineligible for sig testing
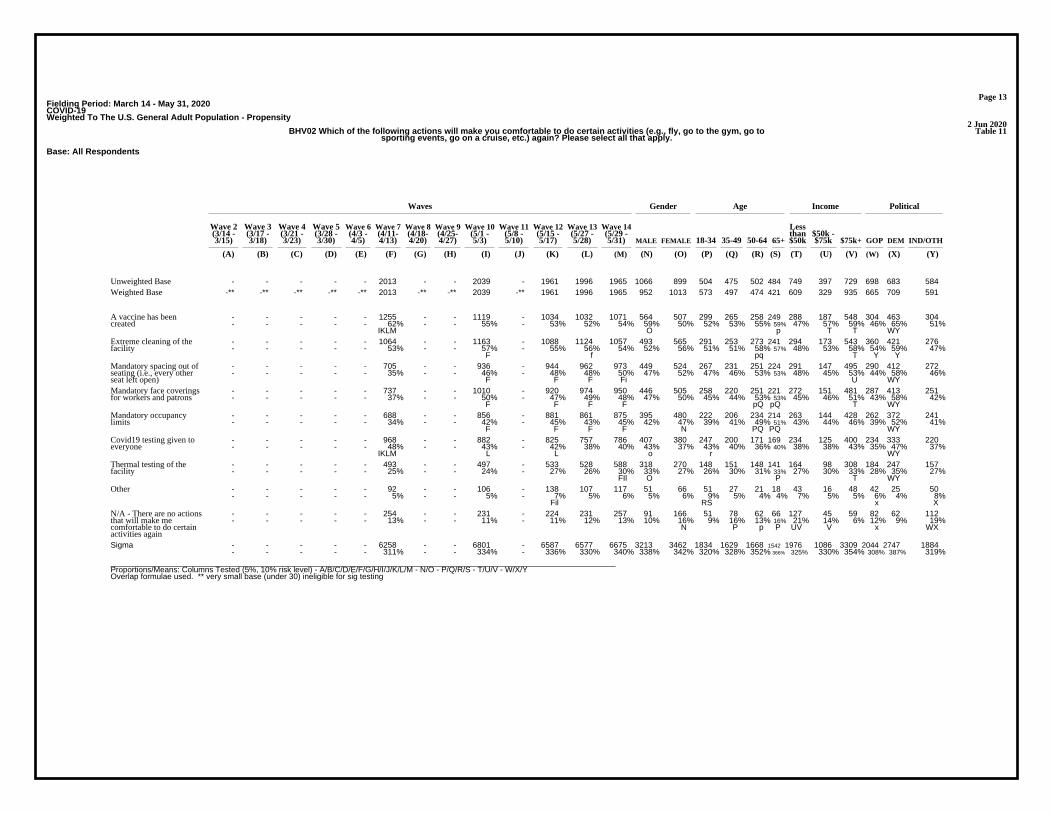
Page 13Fielding Period: March 14 - May 31, 2020COVID-19Weighted To The U.S. General Adult Population - Propensity
2 Jun 2020Table 11BHV02 Which of the following actions will make you comfortable to do certain activities (e.g., fly, go to the gym, go to
sporting events, go on a cruise, etc.) again? Please select all that apply.
Base: All Respondents
Waves Gender Age Income Political
Wave 2 Wave 3 Wave 4 Wave 5 Wave 6 Wave 7 Wave 8 Wave 9 Wave 10 Wave 11 Wave 12 Wave 13 Wave 14 Less(3/14 - (3/17 - (3/21 - (3/28 - (4/3 - (4/11- (4/18- (4/25- (5/1 - (5/8 - (5/15 - (5/27 - (5/29 - than $50k -3/15) 3/18) 3/23) 3/30) 4/5) 4/13) 4/20) 4/27) 5/3) 5/10) 5/17) 5/28) 5/31) MALE FEMALE 18-34 35-49 50-64 65+ $50k $75k $75k+ GOP DEM IND/OTH
(A) (B) (C) (D) (E) (F) (G) (H) (I) (J) (K) (L) (M) (N) (O) (P) (Q) (R) (S) (T) (U) (V) (W) (X) (Y)
- - - - - 2013 - - 2039 - 1961 1996 1965 1066 899 504 475 502 484 749 397 729 698 683 584Unweighted Base-** -** -** -** -** 2013 -** -** 2039 -** 1961 1996 1965 952 1013 573 497 474 421 609 329 935 665 709 591Weighted Base
- - - - - 1255 - - 1119 - 1034 1032 1071 564 507 299 265 258 249 288 187 548 304 463 304- - - - - 62% - - 55% - 53% 52% 54% 59% 50% 52% 53% 55% 59% 47% 57% 59% 46% 65% 51%
IKLM O p T T WY
A vaccine has beencreated
- - - - - 1064 - - 1163 - 1088 1124 1057 493 565 291 253 273 241 294 173 543 360 421 276- - - - - 53% - - 57% - 55% 56% 54% 52% 56% 51% 51% 58% 57% 48% 53% 58% 54% 59% 47%
F f pq T Y Y
Extreme cleaning of thefacility
- - - - - 705 - - 936 - 944 962 973 449 524 267 231 251 224 291 147 495 290 412 272- - - - - 35% - - 46% - 48% 48% 50% 47% 52% 47% 46% 53% 53% 48% 45% 53% 44% 58% 46%
F F F Fi U WY
Mandatory spacing out ofseating (i.e., every otherseat left open)
- - - - - 737 - - 1010 - 920 974 950 446 505 258 220 251 221 272 151 481 287 413 251- - - - - 37% - - 50% - 47% 49% 48% 47% 50% 45% 44% 53% 53% 45% 46% 51% 43% 58% 42%
F F F F pQ pQ T WY
Mandatory face coveringsfor workers and patrons
- - - - - 688 - - 856 - 881 861 875 395 480 222 206 234 214 263 144 428 262 372 241- - - - - 34% - - 42% - 45% 43% 45% 42% 47% 39% 41% 49% 51% 43% 44% 46% 39% 52% 41%
F F F F N PQ PQ WY
Mandatory occupancylimits
- - - - - 968 - - 882 - 825 757 786 407 380 247 200 171 169 234 125 400 234 333 220- - - - - 48% - - 43% - 42% 38% 40% 43% 37% 43% 40% 36% 40% 38% 38% 43% 35% 47% 37%
IKLM L L o r WY
Covid19 testing given toeveryone
- - - - - 493 - - 497 - 533 528 588 318 270 148 151 148 141 164 98 308 184 247 157- - - - - 25% - - 24% - 27% 26% 30% 33% 27% 26% 30% 31% 33% 27% 30% 33% 28% 35% 27%
FIl O P T WY
Thermal testing of thefacility
- - - - - 92 - - 106 - 138 107 117 51 66 51 27 21 18 43 16 48 42 25 50- - - - - 5% - - 5% - 7% 5% 6% 5% 6% 9% 5% 4% 4% 7% 5% 5% 6% 4% 8%
Fil RS x X
Other
- - - - - 254 - - 231 - 224 231 257 91 166 51 78 62 66 127 45 59 82 62 112- - - - - 13% - - 11% - 11% 12% 13% 10% 16% 9% 16% 13% 16% 21% 14% 6% 12% 9% 19%
N P p P UV V x WX
N/A - There are no actionsthat will make mecomfortable to do certainactivities again
- - - - - 6258 - - 6801 - 6587 6577 6675 3213 3462 1834 1629 1668 1542 1976 1086 3309 2044 2747 1884- - - - - 311% - - 334% - 336% 330% 340% 338% 342% 320% 328% 352% 366% 325% 330% 354% 308% 387% 319%
Sigma
__________________________________________________________________________________________________________________Proportions/Means: Columns Tested (5%, 10% risk level) - A/B/C/D/E/F/G/H/I/J/K/L/M - N/O - P/Q/R/S - T/U/V - W/X/YOverlap formulae used. ** very small base (under 30) ineligible for sig testing
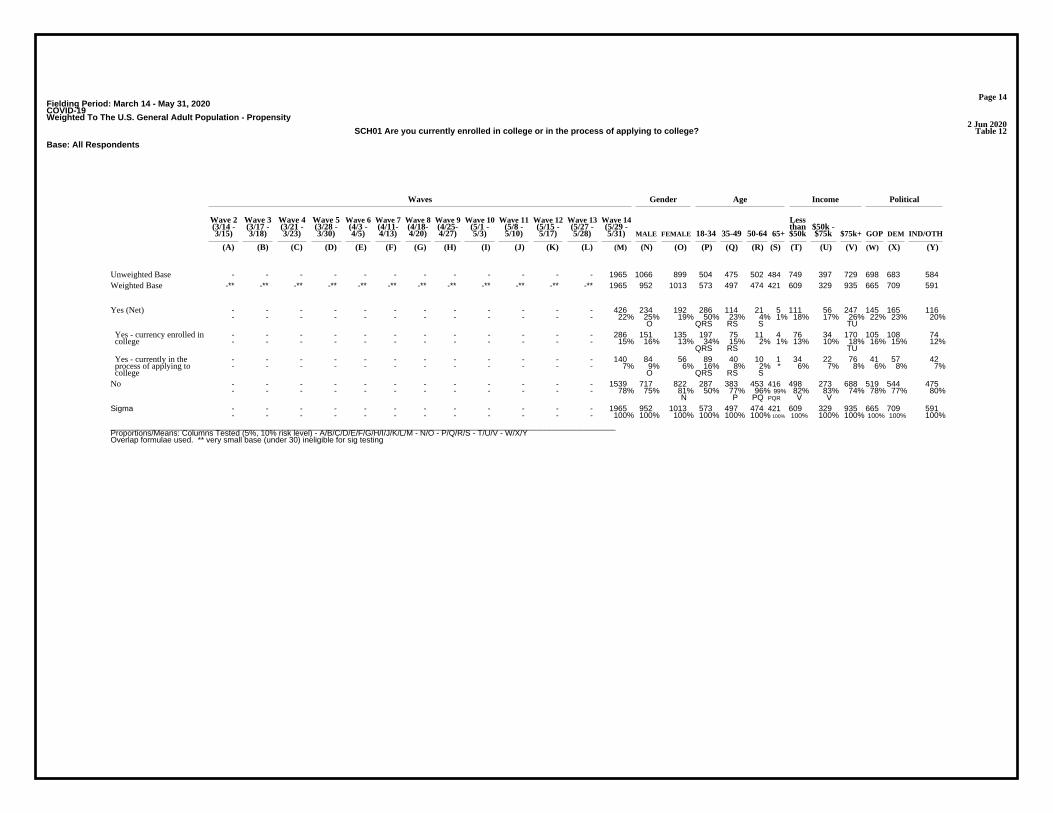
Page 14Fielding Period: March 14 - May 31, 2020COVID-19Weighted To The U.S. General Adult Population - Propensity
2 Jun 2020Table 12SCH01 Are you currently enrolled in college or in the process of applying to college?
Base: All Respondents
Waves Gender Age Income Political
Wave 2 Wave 3 Wave 4 Wave 5 Wave 6 Wave 7 Wave 8 Wave 9 Wave 10 Wave 11 Wave 12 Wave 13 Wave 14 Less(3/14 - (3/17 - (3/21 - (3/28 - (4/3 - (4/11- (4/18- (4/25- (5/1 - (5/8 - (5/15 - (5/27 - (5/29 - than $50k -3/15) 3/18) 3/23) 3/30) 4/5) 4/13) 4/20) 4/27) 5/3) 5/10) 5/17) 5/28) 5/31) MALE FEMALE 18-34 35-49 50-64 65+ $50k $75k $75k+ GOP DEM IND/OTH
(A) (B) (C) (D) (E) (F) (G) (H) (I) (J) (K) (L) (M) (N) (O) (P) (Q) (R) (S) (T) (U) (V) (W) (X) (Y)
- - - - - - - - - - - - 1965 1066 899 504 475 502 484 749 397 729 698 683 584Unweighted Base-** -** -** -** -** -** -** -** -** -** -** -** 1965 952 1013 573 497 474 421 609 329 935 665 709 591Weighted Base
- - - - - - - - - - - - 426 234 192 286 114 21 5 111 56 247 145 165 116- - - - - - - - - - - - 22% 25% 19% 50% 23% 4% 1% 18% 17% 26% 22% 23% 20%
O QRS RS S TU
Yes (Net)
- - - - - - - - - - - - 286 151 135 197 75 11 4 76 34 170 105 108 74- - - - - - - - - - - - 15% 16% 13% 34% 15% 2% 1% 13% 10% 18% 16% 15% 12%
QRS RS TU
Yes - currency enrolled in college
- - - - - - - - - - - - 140 84 56 89 40 10 1 34 22 76 41 57 42- - - - - - - - - - - - 7% 9% 6% 16% 8% 2% * 6% 7% 8% 6% 8% 7%
O QRS RS S
Yes - currently in the process of applying to college
- - - - - - - - - - - - 1539 717 822 287 383 453 416 498 273 688 519 544 475- - - - - - - - - - - - 78% 75% 81% 50% 77% 96% 99% 82% 83% 74% 78% 77% 80%
N P PQ PQR V V
No
- - - - - - - - - - - - 1965 952 1013 573 497 474 421 609 329 935 665 709 591- - - - - - - - - - - - 100% 100% 100% 100% 100% 100% 100% 100% 100% 100% 100% 100% 100%
Sigma
__________________________________________________________________________________________________________________Proportions/Means: Columns Tested (5%, 10% risk level) - A/B/C/D/E/F/G/H/I/J/K/L/M - N/O - P/Q/R/S - T/U/V - W/X/YOverlap formulae used. ** very small base (under 30) ineligible for sig testing
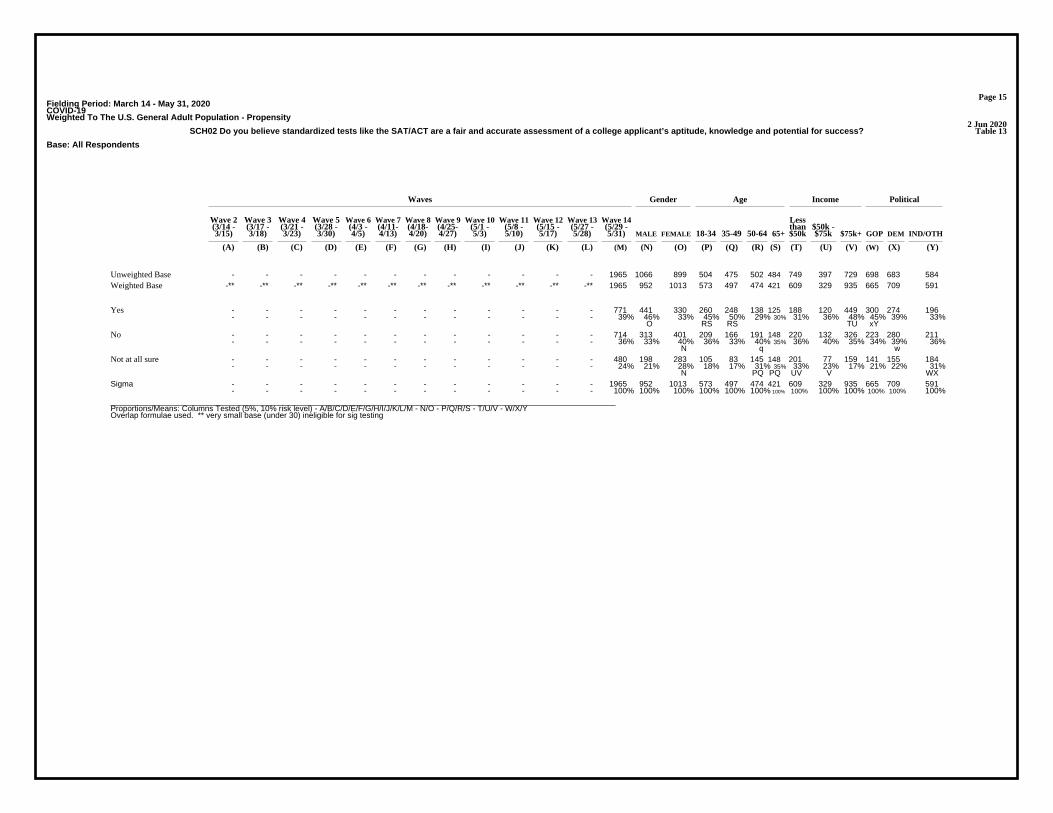
Page 15Fielding Period: March 14 - May 31, 2020COVID-19Weighted To The U.S. General Adult Population - Propensity
2 Jun 2020Table 13SCH02 Do you believe standardized tests like the SAT/ACT are a fair and accurate assessment of a college applicant’s aptitude, knowledge and potential for success?
Base: All Respondents
Waves Gender Age Income Political
Wave 2 Wave 3 Wave 4 Wave 5 Wave 6 Wave 7 Wave 8 Wave 9 Wave 10 Wave 11 Wave 12 Wave 13 Wave 14 Less(3/14 - (3/17 - (3/21 - (3/28 - (4/3 - (4/11- (4/18- (4/25- (5/1 - (5/8 - (5/15 - (5/27 - (5/29 - than $50k -3/15) 3/18) 3/23) 3/30) 4/5) 4/13) 4/20) 4/27) 5/3) 5/10) 5/17) 5/28) 5/31) MALE FEMALE 18-34 35-49 50-64 65+ $50k $75k $75k+ GOP DEM IND/OTH
(A) (B) (C) (D) (E) (F) (G) (H) (I) (J) (K) (L) (M) (N) (O) (P) (Q) (R) (S) (T) (U) (V) (W) (X) (Y)
- - - - - - - - - - - - 1965 1066 899 504 475 502 484 749 397 729 698 683 584Unweighted Base-** -** -** -** -** -** -** -** -** -** -** -** 1965 952 1013 573 497 474 421 609 329 935 665 709 591Weighted Base
- - - - - - - - - - - - 771 441 330 260 248 138 125 188 120 449 300 274 196- - - - - - - - - - - - 39% 46% 33% 45% 50% 29% 30% 31% 36% 48% 45% 39% 33%
O RS RS TU xY
Yes
- - - - - - - - - - - - 714 313 401 209 166 191 148 220 132 326 223 280 211- - - - - - - - - - - - 36% 33% 40% 36% 33% 40% 35% 36% 40% 35% 34% 39% 36%
N q w
No
- - - - - - - - - - - - 480 198 283 105 83 145 148 201 77 159 141 155 184- - - - - - - - - - - - 24% 21% 28% 18% 17% 31% 35% 33% 23% 17% 21% 22% 31%
N PQ PQ UV V WX
Not at all sure
- - - - - - - - - - - - 1965 952 1013 573 497 474 421 609 329 935 665 709 591- - - - - - - - - - - - 100% 100% 100% 100% 100% 100% 100% 100% 100% 100% 100% 100% 100%
Sigma
__________________________________________________________________________________________________________________Proportions/Means: Columns Tested (5%, 10% risk level) - A/B/C/D/E/F/G/H/I/J/K/L/M - N/O - P/Q/R/S - T/U/V - W/X/YOverlap formulae used. ** very small base (under 30) ineligible for sig testing
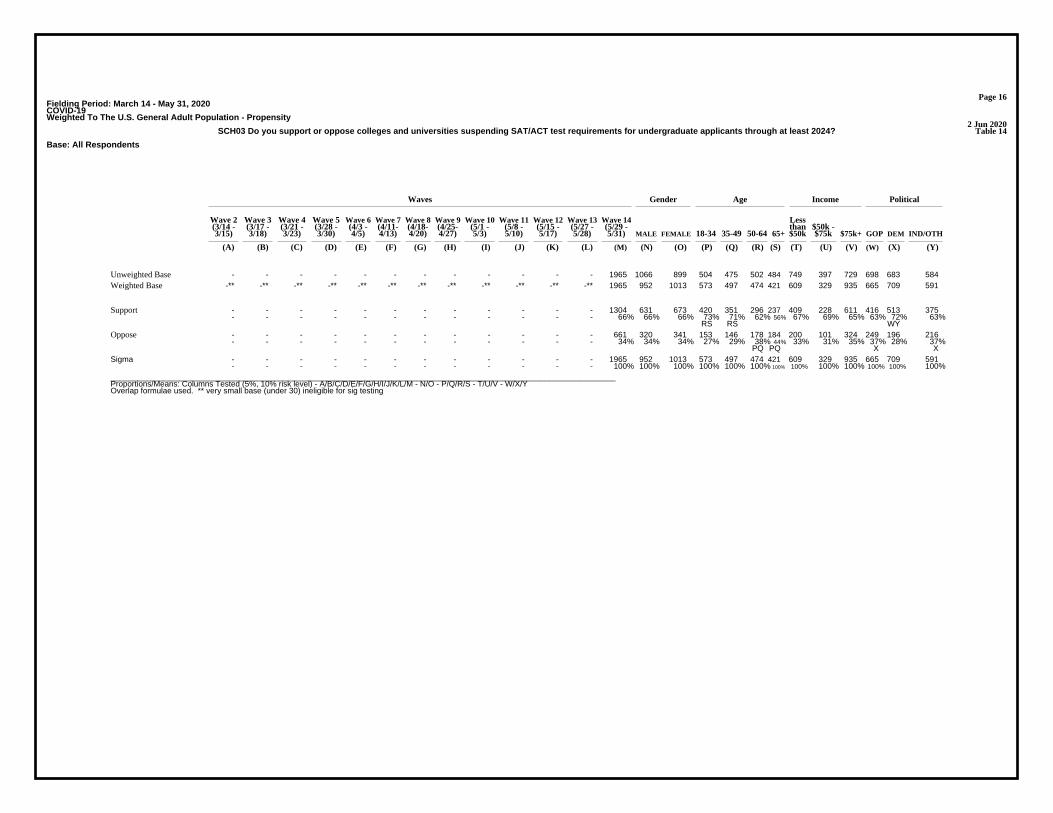
Page 16Fielding Period: March 14 - May 31, 2020COVID-19Weighted To The U.S. General Adult Population - Propensity
2 Jun 2020Table 14SCH03 Do you support or oppose colleges and universities suspending SAT/ACT test requirements for undergraduate applicants through at least 2024?
Base: All Respondents
Waves Gender Age Income Political
Wave 2 Wave 3 Wave 4 Wave 5 Wave 6 Wave 7 Wave 8 Wave 9 Wave 10 Wave 11 Wave 12 Wave 13 Wave 14 Less(3/14 - (3/17 - (3/21 - (3/28 - (4/3 - (4/11- (4/18- (4/25- (5/1 - (5/8 - (5/15 - (5/27 - (5/29 - than $50k -3/15) 3/18) 3/23) 3/30) 4/5) 4/13) 4/20) 4/27) 5/3) 5/10) 5/17) 5/28) 5/31) MALE FEMALE 18-34 35-49 50-64 65+ $50k $75k $75k+ GOP DEM IND/OTH
(A) (B) (C) (D) (E) (F) (G) (H) (I) (J) (K) (L) (M) (N) (O) (P) (Q) (R) (S) (T) (U) (V) (W) (X) (Y)
- - - - - - - - - - - - 1965 1066 899 504 475 502 484 749 397 729 698 683 584Unweighted Base-** -** -** -** -** -** -** -** -** -** -** -** 1965 952 1013 573 497 474 421 609 329 935 665 709 591Weighted Base
- - - - - - - - - - - - 1304 631 673 420 351 296 237 409 228 611 416 513 375- - - - - - - - - - - - 66% 66% 66% 73% 71% 62% 56% 67% 69% 65% 63% 72% 63%
RS RS WY
Support
- - - - - - - - - - - - 661 320 341 153 146 178 184 200 101 324 249 196 216- - - - - - - - - - - - 34% 34% 34% 27% 29% 38% 44% 33% 31% 35% 37% 28% 37%
PQ PQ X X
Oppose
- - - - - - - - - - - - 1965 952 1013 573 497 474 421 609 329 935 665 709 591- - - - - - - - - - - - 100% 100% 100% 100% 100% 100% 100% 100% 100% 100% 100% 100% 100%
Sigma
__________________________________________________________________________________________________________________Proportions/Means: Columns Tested (5%, 10% risk level) - A/B/C/D/E/F/G/H/I/J/K/L/M - N/O - P/Q/R/S - T/U/V - W/X/YOverlap formulae used. ** very small base (under 30) ineligible for sig testing

Page 17Fielding Period: March 14 - May 31, 2020COVID-19Weighted To The U.S. General Adult Population - Propensity
2 Jun 2020Table 15SCH05 Do you believe that SAT/ACT test scores should be suspended from college applications permanently?
Base: All Respondents
Waves Gender Age Income Political
Wave 2 Wave 3 Wave 4 Wave 5 Wave 6 Wave 7 Wave 8 Wave 9 Wave 10 Wave 11 Wave 12 Wave 13 Wave 14 Less(3/14 - (3/17 - (3/21 - (3/28 - (4/3 - (4/11- (4/18- (4/25- (5/1 - (5/8 - (5/15 - (5/27 - (5/29 - than $50k -3/15) 3/18) 3/23) 3/30) 4/5) 4/13) 4/20) 4/27) 5/3) 5/10) 5/17) 5/28) 5/31) MALE FEMALE 18-34 35-49 50-64 65+ $50k $75k $75k+ GOP DEM IND/OTH
(A) (B) (C) (D) (E) (F) (G) (H) (I) (J) (K) (L) (M) (N) (O) (P) (Q) (R) (S) (T) (U) (V) (W) (X) (Y)
- - - - - - - - - - - - 1965 1066 899 504 475 502 484 749 397 729 698 683 584Unweighted Base-** -** -** -** -** -** -** -** -** -** -** -** 1965 952 1013 573 497 474 421 609 329 935 665 709 591Weighted Base
- - - - - - - - - - - - 743 363 379 263 219 152 109 240 116 367 249 290 205- - - - - - - - - - - - 38% 38% 37% 46% 44% 32% 26% 39% 35% 39% 37% 41% 35%
RS RS y
Yes
- - - - - - - - - - - - 697 371 326 210 169 174 144 176 114 386 271 240 186- - - - - - - - - - - - 35% 39% 32% 37% 34% 37% 34% 29% 35% 41% 41% 34% 31%
O t Tu XY
No
- - - - - - - - - - - - 525 217 308 100 109 148 168 194 99 182 145 179 201- - - - - - - - - - - - 27% 23% 30% 17% 22% 31% 40% 32% 30% 19% 22% 25% 34%
N PQ PQR V V WX
Not at all sure
- - - - - - - - - - - - 1965 952 1013 573 497 474 421 609 329 935 665 709 591- - - - - - - - - - - - 100% 100% 100% 100% 100% 100% 100% 100% 100% 100% 100% 100% 100%
Sigma
__________________________________________________________________________________________________________________Proportions/Means: Columns Tested (5%, 10% risk level) - A/B/C/D/E/F/G/H/I/J/K/L/M - N/O - P/Q/R/S - T/U/V - W/X/YOverlap formulae used. ** very small base (under 30) ineligible for sig testing
Page 18Fielding Period: March 14 - May 31, 2020COVID-19Weighted To The U.S. General Adult Population - Propensity
2 Jun 2020Table 16SCH06 Do you think colleges and university should create their own entrance exams that are customized to the university’s
expectations of applicants’ knowledge and aligns with university values?
Base: All Respondents
Waves Gender Age Income Political
Wave 2 Wave 3 Wave 4 Wave 5 Wave 6 Wave 7 Wave 8 Wave 9 Wave 10 Wave 11 Wave 12 Wave 13 Wave 14 Less(3/14 - (3/17 - (3/21 - (3/28 - (4/3 - (4/11- (4/18- (4/25- (5/1 - (5/8 - (5/15 - (5/27 - (5/29 - than $50k -3/15) 3/18) 3/23) 3/30) 4/5) 4/13) 4/20) 4/27) 5/3) 5/10) 5/17) 5/28) 5/31) MALE FEMALE 18-34 35-49 50-64 65+ $50k $75k $75k+ GOP DEM IND/OTH
(A) (B) (C) (D) (E) (F) (G) (H) (I) (J) (K) (L) (M) (N) (O) (P) (Q) (R) (S) (T) (U) (V) (W) (X) (Y)
- - - - - - - - - - - - 1965 1066 899 504 475 502 484 749 397 729 698 683 584Unweighted Base-** -** -** -** -** -** -** -** -** -** -** -** 1965 952 1013 573 497 474 421 609 329 935 665 709 591Weighted Base
- - - - - - - - - - - - 1140 554 586 370 337 216 218 336 200 568 383 442 315- - - - - - - - - - - - 58% 58% 58% 64% 68% 46% 52% 55% 61% 61% 58% 62% 53%
RS RS t Y
Yes
- - - - - - - - - - - - 376 195 181 101 83 110 83 112 63 186 136 113 127- - - - - - - - - - - - 19% 21% 18% 18% 17% 23% 20% 18% 19% 20% 21% 16% 21%
pQ x x
No
- - - - - - - - - - - - 448 202 246 103 78 148 120 161 66 181 145 154 149- - - - - - - - - - - - 23% 21% 24% 18% 16% 31% 29% 26% 20% 19% 22% 22% 25%
PQ PQ uV
Not sure
- - - - - - - - - - - - 1965 952 1013 573 497 474 421 609 329 935 665 709 591- - - - - - - - - - - - 100% 100% 100% 100% 100% 100% 100% 100% 100% 100% 100% 100% 100%
Sigma
__________________________________________________________________________________________________________________Proportions/Means: Columns Tested (5%, 10% risk level) - A/B/C/D/E/F/G/H/I/J/K/L/M - N/O - P/Q/R/S - T/U/V - W/X/YOverlap formulae used. ** very small base (under 30) ineligible for sig testing

Page 19Fielding Period: March 14 - May 31, 2020COVID-19Weighted To The U.S. General Adult Population - Propensity
2 Jun 2020Table 17SCH07 Do you think that SAT/ACT exams hurt or help the college entrance chances of low-income and some minority students?
Base: All Respondents
Waves Gender Age Income Political
Wave 2 Wave 3 Wave 4 Wave 5 Wave 6 Wave 7 Wave 8 Wave 9 Wave 10 Wave 11 Wave 12 Wave 13 Wave 14 Less(3/14 - (3/17 - (3/21 - (3/28 - (4/3 - (4/11- (4/18- (4/25- (5/1 - (5/8 - (5/15 - (5/27 - (5/29 - than $50k -3/15) 3/18) 3/23) 3/30) 4/5) 4/13) 4/20) 4/27) 5/3) 5/10) 5/17) 5/28) 5/31) MALE FEMALE 18-34 35-49 50-64 65+ $50k $75k $75k+ GOP DEM IND/OTH
(A) (B) (C) (D) (E) (F) (G) (H) (I) (J) (K) (L) (M) (N) (O) (P) (Q) (R) (S) (T) (U) (V) (W) (X) (Y)
- - - - - - - - - - - - 1965 1066 899 504 475 502 484 749 397 729 698 683 584Unweighted Base-** -** -** -** -** -** -** -** -** -** -** -** 1965 952 1013 573 497 474 421 609 329 935 665 709 591Weighted Base
- - - - - - - - - - - - 842 371 472 234 196 215 197 269 148 393 243 355 244- - - - - - - - - - - - 43% 39% 47% 41% 39% 45% 47% 44% 45% 42% 37% 50% 41%
N q WY
Hurt their chances
- - - - - - - - - - - - 577 337 239 215 201 94 67 146 86 324 208 224 145- - - - - - - - - - - - 29% 35% 24% 38% 40% 20% 16% 24% 26% 35% 31% 32% 25%
O RS RS TU Y Y
Help their chances
- - - - - - - - - - - - 546 243 302 124 101 165 156 194 95 218 214 131 202- - - - - - - - - - - - 28% 26% 30% 22% 20% 35% 37% 32% 29% 23% 32% 18% 34%
PQ PQ V v X X
No impact
- - - - - - - - - - - - 1965 952 1013 573 497 474 421 609 329 935 665 709 591- - - - - - - - - - - - 100% 100% 100% 100% 100% 100% 100% 100% 100% 100% 100% 100% 100%
Sigma
__________________________________________________________________________________________________________________Proportions/Means: Columns Tested (5%, 10% risk level) - A/B/C/D/E/F/G/H/I/J/K/L/M - N/O - P/Q/R/S - T/U/V - W/X/YOverlap formulae used. ** very small base (under 30) ineligible for sig testing

Page 20Fielding Period: March 14 - May 31, 2020COVID-19Weighted To The U.S. General Adult Population - Propensity
2 Jun 2020Table 18SCH04 Which of the following action(s) would make you feel safe to go to colleges/universities post COVID-19? Please select all that apply.
Base: All Respondents
Waves Gender Age Income Political
Wave 2 Wave 3 Wave 4 Wave 5 Wave 6 Wave 7 Wave 8 Wave 9 Wave 10 Wave 11 Wave 12 Wave 13 Wave 14 Less(3/14 - (3/17 - (3/21 - (3/28 - (4/3 - (4/11- (4/18- (4/25- (5/1 - (5/8 - (5/15 - (5/27 - (5/29 - than $50k -3/15) 3/18) 3/23) 3/30) 4/5) 4/13) 4/20) 4/27) 5/3) 5/10) 5/17) 5/28) 5/31) MALE FEMALE 18-34 35-49 50-64 65+ $50k $75k $75k+ GOP DEM IND/OTH
(A) (B) (C) (D) (E) (F) (G) (H) (I) (J) (K) (L) (M) (N) (O) (P) (Q) (R) (S) (T) (U) (V) (W) (X) (Y)
- - - - - - - - - - - - 1965 1066 899 504 475 502 484 749 397 729 698 683 584Unweighted Base-** -** -** -** -** -** -** -** -** -** -** -** 1965 952 1013 573 497 474 421 609 329 935 665 709 591Weighted Base
- - - - - - - - - - - - 995 474 521 285 244 242 223 271 140 546 342 386 267- - - - - - - - - - - - 51% 50% 51% 50% 49% 51% 53% 45% 43% 58% 51% 54% 45%
TU y Y
Guarantee of hygieniccleaning of shared spaces(e.g., dining halls,classrooms, dorm rooms)
- - - - - - - - - - - - 907 461 446 253 231 222 202 240 142 501 261 391 256- - - - - - - - - - - - 46% 48% 44% 44% 46% 47% 48% 39% 43% 54% 39% 55% 43%
TU WY
Mandatory COVID-19testing/vaccine for allstaff/students
- - - - - - - - - - - - 906 415 490 255 216 222 213 270 143 465 293 356 257- - - - - - - - - - - - 46% 44% 48% 44% 43% 47% 51% 44% 44% 50% 44% 50% 43%
q t wy
Smaller class sizes
- - - - - - - - - - - - 895 426 469 259 216 211 209 254 146 466 278 371 246- - - - - - - - - - - - 46% 45% 46% 45% 43% 44% 50% 42% 44% 50% 42% 52% 42%
T WY
Mandatory face masks forall staff/students
- - - - - - - - - - - - 807 385 422 253 190 190 174 229 127 425 256 330 222- - - - - - - - - - - - 41% 40% 42% 44% 38% 40% 41% 38% 39% 45% 38% 46% 38%
Tu WY
Limited capacity at schoolevents (e.g., sportingevents, concerts,performances)
- - - - - - - - - - - - 778 360 417 209 177 197 194 219 139 391 252 326 201- - - - - - - - - - - - 40% 38% 41% 37% 36% 42% 46% 36% 42% 42% 38% 46% 34%
PQ t WY
Shared spaces configuredfor social distancing (i.e.,spacing out seating six feetapart)
- - - - - - - - - - - - 719 345 374 196 170 188 165 220 117 362 233 293 192- - - - - - - - - - - - 37% 36% 37% 34% 34% 40% 39% 36% 35% 39% 35% 41% 33%
wY
Mandatory temperaturetests before entering anybuildings on campus
- - - - - - - - - - - - 664 308 356 165 161 176 163 210 88 337 221 266 177- - - - - - - - - - - - 34% 32% 35% 29% 32% 37% 39% 34% 27% 36% 33% 37% 30%
P P U U Y
Private dorm rooms
- - - - - - - - - - - - 97 53 45 35 23 18 21 30 17 45 31 20 46- - - - - - - - - - - - 5% 6% 4% 6% 5% 4% 5% 5% 5% 5% 5% 3% 8%
wX
Other
- - - - - - - - - - - - 388 159 229 63 90 125 110 162 80 97 120 119 149- - - - - - - - - - - - 20% 17% 23% 11% 18% 26% 26% 27% 24% 10% 18% 17% 25%
N P PQ PQ V V WX
None - There is nothingthat would make me feelsafe to go tocolleges/universities postCOVID-19
- - - - - - - - - - - - 7156 3387 3769 1973 1718 1790 1674 2103 1140 3636 2285 2858 2013- - - - - - - - - - - - 364% 356% 372% 344% 345% 378% 398% 345% 347% 389% 344% 403% 340%
Sigma
__________________________________________________________________________________________________________________Proportions/Means: Columns Tested (5%, 10% risk level) - A/B/C/D/E/F/G/H/I/J/K/L/M - N/O - P/Q/R/S - T/U/V - W/X/YOverlap formulae used. ** very small base (under 30) ineligible for sig testing

Page 21Fielding Period: March 14 - May 31, 2020COVID-19Weighted To The U.S. General Adult Population - Propensity
2 Jun 2020Table 19BUS02 Are you more or less likely to do business with a company if they require all customers and employees to wear a face mask during the pandemic?
Base: All Respondents
Waves Gender Age Income Political
Wave 2 Wave 3 Wave 4 Wave 5 Wave 6 Wave 7 Wave 8 Wave 9 Wave 10 Wave 11 Wave 12 Wave 13 Wave 14 Less(3/14 - (3/17 - (3/21 - (3/28 - (4/3 - (4/11- (4/18- (4/25- (5/1 - (5/8 - (5/15 - (5/27 - (5/29 - than $50k -3/15) 3/18) 3/23) 3/30) 4/5) 4/13) 4/20) 4/27) 5/3) 5/10) 5/17) 5/28) 5/31) MALE FEMALE 18-34 35-49 50-64 65+ $50k $75k $75k+ GOP DEM IND/OTH
(A) (B) (C) (D) (E) (F) (G) (H) (I) (J) (K) (L) (M) (N) (O) (P) (Q) (R) (S) (T) (U) (V) (W) (X) (Y)
- - - - - - - - - 2030 - 1996 - - - - - - - - - - - - -Unweighted Base-** -** -** -** -** -** -** -** -** 2066 -** 1996 -** -** -** -** -** -** -** -** -** -** -** -** -**Weighted Base
- - - - - - - - - 1625 - 1592 - - - - - - - - - - - - -- - - - - - - - - 79% - 80% - - - - - - - - - - - - -
Much/Somewhat MoreLikely (Net)
- - - - - - - - - 785 - 861 - - - - - - - - - - - - -- - - - - - - - - 38% - 43% - - - - - - - - - - - - -
J
Much more likely
- - - - - - - - - 840 - 731 - - - - - - - - - - - - -- - - - - - - - - 41% - 37% - - - - - - - - - - - - -
L
Somewhat more likely
- - - - - - - - - 441 - 404 - - - - - - - - - - - - -- - - - - - - - - 21% - 20% - - - - - - - - - - - - -
Much/Somewhat LessLikely (Net)
- - - - - - - - - 276 - 231 - - - - - - - - - - - - -- - - - - - - - - 13% - 12% - - - - - - - - - - - - -
Somewhat less likely
- - - - - - - - - 165 - 173 - - - - - - - - - - - - -- - - - - - - - - 8% - 9% - - - - - - - - - - - - -
Much less likely
- - - - - - - - - 2066 - 1996 - - - - - - - - - - - - -- - - - - - - - - 100% - 100% - - - - - - - - - - - - -
Sigma
__________________________________________________________________________________________________________________Proportions/Means: Columns Tested (5%, 10% risk level) - A/B/C/D/E/F/G/H/I/J/K/L/M - N/O - P/Q/R/S - T/U/V - W/X/YOverlap formulae used. ** very small base (under 30) ineligible for sig testing
Page 22Fielding Period: March 14 - May 31, 2020COVID-19Weighted To The U.S. General Adult Population - Propensity
2 Jun 2020Table 20GEN01 Are you currently in a relationship?
Base: All Respondents
Waves Gender Age Income Political
Wave 2 Wave 3 Wave 4 Wave 5 Wave 6 Wave 7 Wave 8 Wave 9 Wave 10 Wave 11 Wave 12 Wave 13 Wave 14 Less(3/14 - (3/17 - (3/21 - (3/28 - (4/3 - (4/11- (4/18- (4/25- (5/1 - (5/8 - (5/15 - (5/27 - (5/29 - than $50k -3/15) 3/18) 3/23) 3/30) 4/5) 4/13) 4/20) 4/27) 5/3) 5/10) 5/17) 5/28) 5/31) MALE FEMALE 18-34 35-49 50-64 65+ $50k $75k $75k+ GOP DEM IND/OTH
(A) (B) (C) (D) (E) (F) (G) (H) (I) (J) (K) (L) (M) (N) (O) (P) (Q) (R) (S) (T) (U) (V) (W) (X) (Y)
- - - - - - - - - - - - 1965 1066 899 504 475 502 484 749 397 729 698 683 584Unweighted Base-** -** -** -** -** -** -** -** -** -** -** -** 1965 952 1013 573 497 474 421 609 329 935 665 709 591Weighted Base
- - - - - - - - - - - - 1246 635 612 301 375 291 279 288 218 705 462 444 340- - - - - - - - - - - - 63% 67% 60% 53% 75% 61% 66% 47% 66% 75% 70% 63% 58%
O PRS P P T TU XY
Yes
- - - - - - - - - - - - 661 284 377 247 110 168 136 299 103 211 191 250 220- - - - - - - - - - - - 34% 30% 37% 43% 22% 35% 32% 49% 31% 23% 29% 35% 37%
N QrS Q Q UV V W W
No
- - - - - - - - - - - - 58 33 25 25 12 15 6 22 8 19 11 16 31- - - - - - - - - - - - 3% 3% 2% 4% 2% 3% 1% 4% 2% 2% 2% 2% 5%
S WX
Decline to answer
- - - - - - - - - - - - 1965 952 1013 573 497 474 421 609 329 935 665 709 591- - - - - - - - - - - - 100% 100% 100% 100% 100% 100% 100% 100% 100% 100% 100% 100% 100%
Sigma
__________________________________________________________________________________________________________________Proportions/Means: Columns Tested (5%, 10% risk level) - A/B/C/D/E/F/G/H/I/J/K/L/M - N/O - P/Q/R/S - T/U/V - W/X/YOverlap formulae used. ** very small base (under 30) ineligible for sig testing

Page 23Fielding Period: March 14 - May 31, 2020COVID-19Weighted To The U.S. General Adult Population - Propensity
2 Jun 2020Table 21GEN02 Who is more likely to do each of the following during the coronavirus pandemic?
Summary Of Them
Base: Currently In A Relationship
Waves Gender Age Income Political
Wave 2 Wave 3 Wave 4 Wave 5 Wave 6 Wave 7 Wave 8 Wave 9 Wave 10 Wave 11 Wave 12 Wave 13 Wave 14 Less(3/14 - (3/17 - (3/21 - (3/28 - (4/3 - (4/11- (4/18- (4/25- (5/1 - (5/8 - (5/15 - (5/27 - (5/29 - than $50k -3/15) 3/18) 3/23) 3/30) 4/5) 4/13) 4/20) 4/27) 5/3) 5/10) 5/17) 5/28) 5/31) MALE FEMALE 18-34 35-49 50-64 65+ $50k $75k $75k+ GOP DEM IND/OTH
(A) (B) (C) (D) (E) (F) (G) (H) (I) (J) (K) (L) (M) (N) (O) (P) (Q) (R) (S) (T) (U) (V) (W) (X) (Y)
- - - - - - - - - - - - 1266 737 529 280 349 315 322 363 280 583 498 423 345Unweighted Base-** -** -** -** -** -** -** -** -** -** -** -** 1246 635 612 301 375 291 279 288 218 705 462 444 340Weighted Base
- - - - - - - - - - - - 721 323 398 169 212 185 155 187 121 390 269 264 188- - - - - - - - - - - - 58% 51% 65% 56% 56% 64% 56% 65% 56% 55% 58% 60% 55%
N uV
Keep six feet apart fromothers
- - - - - - - - - - - - 711 296 415 178 209 185 139 177 123 391 263 277 170- - - - - - - - - - - - 57% 47% 68% 59% 56% 64% 50% 62% 56% 55% 57% 63% 50%
N s qS Y
Wash hands for 30 secondsafter going out in public
- - - - - - - - - - - - 700 311 389 161 210 179 150 173 110 393 268 256 176- - - - - - - - - - - - 56% 49% 64% 53% 56% 61% 54% 60% 51% 56% 58% 58% 52%
N u
Strictly follow socialdistancing guidelines
- - - - - - - - - - - - 695 317 379 181 215 168 132 159 118 398 267 266 162- - - - - - - - - - - - 56% 50% 62% 60% 57% 58% 47% 55% 54% 56% 58% 60% 48%
N S S S Y Y
Wear a face mask
- - - - - - - - - - - - 627 296 332 168 189 161 109 156 113 343 235 232 160- - - - - - - - - - - - 50% 47% 54% 56% 50% 55% 39% 54% 52% 49% 51% 52% 47%
N S S S
Wait to go shopping until alot of items are needed
- - - - - - - - - - - - 619 230 389 166 200 150 104 152 99 354 245 235 139- - - - - - - - - - - - 50% 36% 64% 55% 53% 52% 37% 53% 45% 50% 53% 53% 41%
N S S S Y Y
Bring hand sanitizer whenleaving home
- - - - - - - - - - - - 450 245 205 124 146 96 83 111 82 242 183 142 124- - - - - - - - - - - - 36% 39% 33% 41% 39% 33% 30% 39% 38% 34% 40% 32% 37%
S s x
Go shopping when onlyone item is needed
- - - - - - - - - - - - 388 223 165 112 121 80 75 96 65 217 169 113 106- - - - - - - - - - - - 31% 35% 27% 37% 32% 27% 27% 33% 30% 31% 37% 25% 31%
O RS X
Complain about having towear a face mask
- - - - - - - - - - - - 343 180 163 118 101 67 58 91 51 193 155 101 88- - - - - - - - - - - - 28% 28% 27% 39% 27% 23% 21% 32% 23% 27% 34% 23% 26%
QRS u Xy
Visit family/friends despitesocial distancing
- - - - - - - - - - - - 283 171 112 105 86 49 43 69 42 168 118 79 87- - - - - - - - - - - - 23% 27% 18% 35% 23% 17% 15% 24% 19% 24% 25% 18% 25%
O QRS s X X
Disobey social distancingguidelines
__________________________________________________________________________________________________________________Proportions/Means: Columns Tested (5%, 10% risk level) - A/B/C/D/E/F/G/H/I/J/K/L/M - N/O - P/Q/R/S - T/U/V - W/X/YOverlap formulae used. ** very small base (under 30) ineligible for sig testing

Page 24Fielding Period: March 14 - May 31, 2020COVID-19Weighted To The U.S. General Adult Population - Propensity
2 Jun 2020Table 22GEN02 Who is more likely to do each of the following during the coronavirus pandemic?
Summary Of Their Spouse/Partner
Base: Currently In A Relationship
Waves Gender Age Income Political
Wave 2 Wave 3 Wave 4 Wave 5 Wave 6 Wave 7 Wave 8 Wave 9 Wave 10 Wave 11 Wave 12 Wave 13 Wave 14 Less(3/14 - (3/17 - (3/21 - (3/28 - (4/3 - (4/11- (4/18- (4/25- (5/1 - (5/8 - (5/15 - (5/27 - (5/29 - than $50k -3/15) 3/18) 3/23) 3/30) 4/5) 4/13) 4/20) 4/27) 5/3) 5/10) 5/17) 5/28) 5/31) MALE FEMALE 18-34 35-49 50-64 65+ $50k $75k $75k+ GOP DEM IND/OTH
(A) (B) (C) (D) (E) (F) (G) (H) (I) (J) (K) (L) (M) (N) (O) (P) (Q) (R) (S) (T) (U) (V) (W) (X) (Y)
- - - - - - - - - - - - 1266 737 529 280 349 315 322 363 280 583 498 423 345Unweighted Base-** -** -** -** -** -** -** -** -** -** -** -** 1246 635 612 301 375 291 279 288 218 705 462 444 340Weighted Base
- - - - - - - - - - - - 482 330 151 106 138 105 132 92 85 286 156 172 153- - - - - - - - - - - - 39% 52% 25% 35% 37% 36% 48% 32% 39% 41% 34% 39% 45%
O PQR T W
Bring hand sanitizer whenleaving home
- - - - - - - - - - - - 428 279 150 104 139 76 111 76 76 266 152 132 145- - - - - - - - - - - - 34% 44% 24% 34% 37% 26% 40% 27% 35% 38% 33% 30% 43%
O r R R t T WX
Wash hands for 30 secondsafter going out in public
- - - - - - - - - - - - 419 257 163 89 126 87 118 85 77 247 127 156 137- - - - - - - - - - - - 34% 40% 27% 29% 34% 30% 42% 30% 35% 35% 27% 35% 40%
O PqR W W
Wear a face mask
- - - - - - - - - - - - 388 250 138 103 121 78 87 77 68 236 134 145 108- - - - - - - - - - - - 31% 39% 23% 34% 32% 27% 31% 27% 31% 33% 29% 33% 32%
O t
Strictly follow socialdistancing guidelines
- - - - - - - - - - - - 374 237 138 92 113 70 100 63 60 244 133 134 107- - - - - - - - - - - - 30% 37% 22% 30% 30% 24% 36% 22% 28% 35% 29% 30% 31%
O R T
Keep six feet apart fromothers
- - - - - - - - - - - - 373 214 159 90 119 75 89 81 65 216 123 140 110- - - - - - - - - - - - 30% 34% 26% 30% 32% 26% 32% 28% 30% 31% 27% 32% 32%
O
Wait to go shopping until alot of items are needed
- - - - - - - - - - - - 342 169 173 103 121 72 47 63 50 216 112 127 103- - - - - - - - - - - - 27% 27% 28% 34% 32% 25% 17% 22% 23% 31% 24% 29% 30%
rS rS s Tu
Go shopping when onlyone item is needed
- - - - - - - - - - - - 304 128 176 92 101 66 45 74 54 169 116 100 88- - - - - - - - - - - - 24% 20% 29% 30% 27% 23% 16% 26% 25% 24% 25% 23% 26%
N S S
Complain about having towear a face mask
- - - - - - - - - - - - 292 154 139 95 88 64 45 67 53 160 81 111 100- - - - - - - - - - - - 23% 24% 23% 32% 24% 22% 16% 23% 24% 23% 18% 25% 29%
qRS s W W
Visit family/friends despitesocial distancing
- - - - - - - - - - - - 204 97 107 65 66 43 31 50 37 115 68 79 57- - - - - - - - - - - - 16% 15% 18% 21% 18% 15% 11% 17% 17% 16% 15% 18% 17%
S s
Disobey social distancingguidelines
__________________________________________________________________________________________________________________Proportions/Means: Columns Tested (5%, 10% risk level) - A/B/C/D/E/F/G/H/I/J/K/L/M - N/O - P/Q/R/S - T/U/V - W/X/YOverlap formulae used. ** very small base (under 30) ineligible for sig testing

Page 25Fielding Period: March 14 - May 31, 2020COVID-19Weighted To The U.S. General Adult Population - Propensity
2 Jun 2020Table 23GEN02_1 Who is more likely to do each of the following during the coronavirus pandemic?
Wear a face mask
Base: Currently In A Relationship
Waves Gender Age Income Political
Wave 2 Wave 3 Wave 4 Wave 5 Wave 6 Wave 7 Wave 8 Wave 9 Wave 10 Wave 11 Wave 12 Wave 13 Wave 14 Less(3/14 - (3/17 - (3/21 - (3/28 - (4/3 - (4/11- (4/18- (4/25- (5/1 - (5/8 - (5/15 - (5/27 - (5/29 - than $50k -3/15) 3/18) 3/23) 3/30) 4/5) 4/13) 4/20) 4/27) 5/3) 5/10) 5/17) 5/28) 5/31) MALE FEMALE 18-34 35-49 50-64 65+ $50k $75k $75k+ GOP DEM IND/OTH
(A) (B) (C) (D) (E) (F) (G) (H) (I) (J) (K) (L) (M) (N) (O) (P) (Q) (R) (S) (T) (U) (V) (W) (X) (Y)
- - - - - - - - - - - - 1266 737 529 280 349 315 322 363 280 583 498 423 345Unweighted Base-** -** -** -** -** -** -** -** -** -** -** -** 1246 635 612 301 375 291 279 288 218 705 462 444 340Weighted Base
- - - - - - - - - - - - 695 317 379 181 215 168 132 159 118 398 267 266 162- - - - - - - - - - - - 56% 50% 62% 60% 57% 58% 47% 55% 54% 56% 58% 60% 48%
N S S S Y Y
Me
- - - - - - - - - - - - 419 257 163 89 126 87 118 85 77 247 127 156 137- - - - - - - - - - - - 34% 40% 27% 29% 34% 30% 42% 30% 35% 35% 27% 35% 40%
O PqR W W
My spouse/partner
- - - - - - - - - - - - 131 61 70 32 35 35 29 43 23 60 68 21 42- - - - - - - - - - - - 11% 10% 11% 11% 9% 12% 11% 15% 10% 9% 15% 5% 12%
V X X
Neither of us
- - - - - - - - - - - - 1246 635 612 301 375 291 279 288 218 705 462 444 340- - - - - - - - - - - - 100% 100% 100% 100% 100% 100% 100% 100% 100% 100% 100% 100% 100%
Sigma
__________________________________________________________________________________________________________________Proportions/Means: Columns Tested (5%, 10% risk level) - A/B/C/D/E/F/G/H/I/J/K/L/M - N/O - P/Q/R/S - T/U/V - W/X/YOverlap formulae used. ** very small base (under 30) ineligible for sig testing

Page 26Fielding Period: March 14 - May 31, 2020COVID-19Weighted To The U.S. General Adult Population - Propensity
2 Jun 2020Table 24GEN02_2 Who is more likely to do each of the following during the coronavirus pandemic?
Complain about having to wear a face mask
Base: Currently In A Relationship
Waves Gender Age Income Political
Wave 2 Wave 3 Wave 4 Wave 5 Wave 6 Wave 7 Wave 8 Wave 9 Wave 10 Wave 11 Wave 12 Wave 13 Wave 14 Less(3/14 - (3/17 - (3/21 - (3/28 - (4/3 - (4/11- (4/18- (4/25- (5/1 - (5/8 - (5/15 - (5/27 - (5/29 - than $50k -3/15) 3/18) 3/23) 3/30) 4/5) 4/13) 4/20) 4/27) 5/3) 5/10) 5/17) 5/28) 5/31) MALE FEMALE 18-34 35-49 50-64 65+ $50k $75k $75k+ GOP DEM IND/OTH
(A) (B) (C) (D) (E) (F) (G) (H) (I) (J) (K) (L) (M) (N) (O) (P) (Q) (R) (S) (T) (U) (V) (W) (X) (Y)
- - - - - - - - - - - - 1266 737 529 280 349 315 322 363 280 583 498 423 345Unweighted Base-** -** -** -** -** -** -** -** -** -** -** -** 1246 635 612 301 375 291 279 288 218 705 462 444 340Weighted Base
- - - - - - - - - - - - 388 223 165 112 121 80 75 96 65 217 169 113 106- - - - - - - - - - - - 31% 35% 27% 37% 32% 27% 27% 33% 30% 31% 37% 25% 31%
O RS X
Me
- - - - - - - - - - - - 304 128 176 92 101 66 45 74 54 169 116 100 88- - - - - - - - - - - - 24% 20% 29% 30% 27% 23% 16% 26% 25% 24% 25% 23% 26%
N S S
My spouse/partner
- - - - - - - - - - - - 554 284 271 97 154 145 159 118 99 319 177 231 146- - - - - - - - - - - - 44% 45% 44% 32% 41% 50% 57% 41% 45% 45% 38% 52% 43%
p Pq PQ Wy
Neither of us
- - - - - - - - - - - - 1246 635 612 301 375 291 279 288 218 705 462 444 340- - - - - - - - - - - - 100% 100% 100% 100% 100% 100% 100% 100% 100% 100% 100% 100% 100%
Sigma
__________________________________________________________________________________________________________________Proportions/Means: Columns Tested (5%, 10% risk level) - A/B/C/D/E/F/G/H/I/J/K/L/M - N/O - P/Q/R/S - T/U/V - W/X/YOverlap formulae used. ** very small base (under 30) ineligible for sig testing

Page 27Fielding Period: March 14 - May 31, 2020COVID-19Weighted To The U.S. General Adult Population - Propensity
2 Jun 2020Table 25GEN02_3 Who is more likely to do each of the following during the coronavirus pandemic?
Keep six feet apart from others
Base: Currently In A Relationship
Waves Gender Age Income Political
Wave 2 Wave 3 Wave 4 Wave 5 Wave 6 Wave 7 Wave 8 Wave 9 Wave 10 Wave 11 Wave 12 Wave 13 Wave 14 Less(3/14 - (3/17 - (3/21 - (3/28 - (4/3 - (4/11- (4/18- (4/25- (5/1 - (5/8 - (5/15 - (5/27 - (5/29 - than $50k -3/15) 3/18) 3/23) 3/30) 4/5) 4/13) 4/20) 4/27) 5/3) 5/10) 5/17) 5/28) 5/31) MALE FEMALE 18-34 35-49 50-64 65+ $50k $75k $75k+ GOP DEM IND/OTH
(A) (B) (C) (D) (E) (F) (G) (H) (I) (J) (K) (L) (M) (N) (O) (P) (Q) (R) (S) (T) (U) (V) (W) (X) (Y)
- - - - - - - - - - - - 1266 737 529 280 349 315 322 363 280 583 498 423 345Unweighted Base-** -** -** -** -** -** -** -** -** -** -** -** 1246 635 612 301 375 291 279 288 218 705 462 444 340Weighted Base
- - - - - - - - - - - - 721 323 398 169 212 185 155 187 121 390 269 264 188- - - - - - - - - - - - 58% 51% 65% 56% 56% 64% 56% 65% 56% 55% 58% 60% 55%
N uV
Me
- - - - - - - - - - - - 374 237 138 92 113 70 100 63 60 244 133 134 107- - - - - - - - - - - - 30% 37% 22% 30% 30% 24% 36% 22% 28% 35% 29% 30% 31%
O R T
My spouse/partner
- - - - - - - - - - - - 151 75 76 41 51 35 24 37 36 71 61 45 46- - - - - - - - - - - - 12% 12% 12% 14% 13% 12% 9% 13% 17% 10% 13% 10% 13%
V
Neither of us
- - - - - - - - - - - - 1246 635 612 301 375 291 279 288 218 705 462 444 340- - - - - - - - - - - - 100% 100% 100% 100% 100% 100% 100% 100% 100% 100% 100% 100% 100%
Sigma
__________________________________________________________________________________________________________________Proportions/Means: Columns Tested (5%, 10% risk level) - A/B/C/D/E/F/G/H/I/J/K/L/M - N/O - P/Q/R/S - T/U/V - W/X/YOverlap formulae used. ** very small base (under 30) ineligible for sig testing

Page 28Fielding Period: March 14 - May 31, 2020COVID-19Weighted To The U.S. General Adult Population - Propensity
2 Jun 2020Table 26GEN02_4 Who is more likely to do each of the following during the coronavirus pandemic?
Visit family/friends despite social distancing
Base: Currently In A Relationship
Waves Gender Age Income Political
Wave 2 Wave 3 Wave 4 Wave 5 Wave 6 Wave 7 Wave 8 Wave 9 Wave 10 Wave 11 Wave 12 Wave 13 Wave 14 Less(3/14 - (3/17 - (3/21 - (3/28 - (4/3 - (4/11- (4/18- (4/25- (5/1 - (5/8 - (5/15 - (5/27 - (5/29 - than $50k -3/15) 3/18) 3/23) 3/30) 4/5) 4/13) 4/20) 4/27) 5/3) 5/10) 5/17) 5/28) 5/31) MALE FEMALE 18-34 35-49 50-64 65+ $50k $75k $75k+ GOP DEM IND/OTH
(A) (B) (C) (D) (E) (F) (G) (H) (I) (J) (K) (L) (M) (N) (O) (P) (Q) (R) (S) (T) (U) (V) (W) (X) (Y)
- - - - - - - - - - - - 1266 737 529 280 349 315 322 363 280 583 498 423 345Unweighted Base-** -** -** -** -** -** -** -** -** -** -** -** 1246 635 612 301 375 291 279 288 218 705 462 444 340Weighted Base
- - - - - - - - - - - - 343 180 163 118 101 67 58 91 51 193 155 101 88- - - - - - - - - - - - 28% 28% 27% 39% 27% 23% 21% 32% 23% 27% 34% 23% 26%
QRS u Xy
Me
- - - - - - - - - - - - 292 154 139 95 88 64 45 67 53 160 81 111 100- - - - - - - - - - - - 23% 24% 23% 32% 24% 22% 16% 23% 24% 23% 18% 25% 29%
qRS s W W
My spouse/partner
- - - - - - - - - - - - 611 301 310 88 186 160 176 130 115 352 226 232 153- - - - - - - - - - - - 49% 47% 51% 29% 49% 55% 63% 45% 53% 50% 49% 52% 45%
P P PQ
Neither of us
- - - - - - - - - - - - 1246 635 612 301 375 291 279 288 218 705 462 444 340- - - - - - - - - - - - 100% 100% 100% 100% 100% 100% 100% 100% 100% 100% 100% 100% 100%
Sigma
__________________________________________________________________________________________________________________Proportions/Means: Columns Tested (5%, 10% risk level) - A/B/C/D/E/F/G/H/I/J/K/L/M - N/O - P/Q/R/S - T/U/V - W/X/YOverlap formulae used. ** very small base (under 30) ineligible for sig testing
Page 29Fielding Period: March 14 - May 31, 2020COVID-19Weighted To The U.S. General Adult Population - Propensity
2 Jun 2020Table 27GEN02_5 Who is more likely to do each of the following during the coronavirus pandemic?
Bring hand sanitizer when leaving home
Base: Currently In A Relationship
Waves Gender Age Income Political
Wave 2 Wave 3 Wave 4 Wave 5 Wave 6 Wave 7 Wave 8 Wave 9 Wave 10 Wave 11 Wave 12 Wave 13 Wave 14 Less(3/14 - (3/17 - (3/21 - (3/28 - (4/3 - (4/11- (4/18- (4/25- (5/1 - (5/8 - (5/15 - (5/27 - (5/29 - than $50k -3/15) 3/18) 3/23) 3/30) 4/5) 4/13) 4/20) 4/27) 5/3) 5/10) 5/17) 5/28) 5/31) MALE FEMALE 18-34 35-49 50-64 65+ $50k $75k $75k+ GOP DEM IND/OTH
(A) (B) (C) (D) (E) (F) (G) (H) (I) (J) (K) (L) (M) (N) (O) (P) (Q) (R) (S) (T) (U) (V) (W) (X) (Y)
- - - - - - - - - - - - 1266 737 529 280 349 315 322 363 280 583 498 423 345Unweighted Base-** -** -** -** -** -** -** -** -** -** -** -** 1246 635 612 301 375 291 279 288 218 705 462 444 340Weighted Base
- - - - - - - - - - - - 619 230 389 166 200 150 104 152 99 354 245 235 139- - - - - - - - - - - - 50% 36% 64% 55% 53% 52% 37% 53% 45% 50% 53% 53% 41%
N S S S Y Y
Me
- - - - - - - - - - - - 482 330 151 106 138 105 132 92 85 286 156 172 153- - - - - - - - - - - - 39% 52% 25% 35% 37% 36% 48% 32% 39% 41% 34% 39% 45%
O PQR T W
My spouse/partner
- - - - - - - - - - - - 146 74 71 29 38 36 42 44 34 65 61 37 48- - - - - - - - - - - - 12% 12% 12% 10% 10% 12% 15% 15% 16% 9% 13% 8% 14%
V V x X
Neither of us
- - - - - - - - - - - - 1246 635 612 301 375 291 279 288 218 705 462 444 340- - - - - - - - - - - - 100% 100% 100% 100% 100% 100% 100% 100% 100% 100% 100% 100% 100%
Sigma
__________________________________________________________________________________________________________________Proportions/Means: Columns Tested (5%, 10% risk level) - A/B/C/D/E/F/G/H/I/J/K/L/M - N/O - P/Q/R/S - T/U/V - W/X/YOverlap formulae used. ** very small base (under 30) ineligible for sig testing

Page 30Fielding Period: March 14 - May 31, 2020COVID-19Weighted To The U.S. General Adult Population - Propensity
2 Jun 2020Table 28GEN02_6 Who is more likely to do each of the following during the coronavirus pandemic?
Go shopping when only one item is needed
Base: Currently In A Relationship
Waves Gender Age Income Political
Wave 2 Wave 3 Wave 4 Wave 5 Wave 6 Wave 7 Wave 8 Wave 9 Wave 10 Wave 11 Wave 12 Wave 13 Wave 14 Less(3/14 - (3/17 - (3/21 - (3/28 - (4/3 - (4/11- (4/18- (4/25- (5/1 - (5/8 - (5/15 - (5/27 - (5/29 - than $50k -3/15) 3/18) 3/23) 3/30) 4/5) 4/13) 4/20) 4/27) 5/3) 5/10) 5/17) 5/28) 5/31) MALE FEMALE 18-34 35-49 50-64 65+ $50k $75k $75k+ GOP DEM IND/OTH
(A) (B) (C) (D) (E) (F) (G) (H) (I) (J) (K) (L) (M) (N) (O) (P) (Q) (R) (S) (T) (U) (V) (W) (X) (Y)
- - - - - - - - - - - - 1266 737 529 280 349 315 322 363 280 583 498 423 345Unweighted Base-** -** -** -** -** -** -** -** -** -** -** -** 1246 635 612 301 375 291 279 288 218 705 462 444 340Weighted Base
- - - - - - - - - - - - 450 245 205 124 146 96 83 111 82 242 183 142 124- - - - - - - - - - - - 36% 39% 33% 41% 39% 33% 30% 39% 38% 34% 40% 32% 37%
S s x
Me
- - - - - - - - - - - - 342 169 173 103 121 72 47 63 50 216 112 127 103- - - - - - - - - - - - 27% 27% 28% 34% 32% 25% 17% 22% 23% 31% 24% 29% 30%
rS rS s Tu
My spouse/partner
- - - - - - - - - - - - 454 221 234 75 109 123 148 113 86 247 167 174 113- - - - - - - - - - - - 36% 35% 38% 25% 29% 42% 53% 39% 40% 35% 36% 39% 33%
PQ PQR
Neither of us
- - - - - - - - - - - - 1246 635 612 301 375 291 279 288 218 705 462 444 340- - - - - - - - - - - - 100% 100% 100% 100% 100% 100% 100% 100% 100% 100% 100% 100% 100%
Sigma
__________________________________________________________________________________________________________________Proportions/Means: Columns Tested (5%, 10% risk level) - A/B/C/D/E/F/G/H/I/J/K/L/M - N/O - P/Q/R/S - T/U/V - W/X/YOverlap formulae used. ** very small base (under 30) ineligible for sig testing

Page 31Fielding Period: March 14 - May 31, 2020COVID-19Weighted To The U.S. General Adult Population - Propensity
2 Jun 2020Table 29GEN02_7 Who is more likely to do each of the following during the coronavirus pandemic?
Wait to go shopping until a lot of items are needed
Base: Currently In A Relationship
Waves Gender Age Income Political
Wave 2 Wave 3 Wave 4 Wave 5 Wave 6 Wave 7 Wave 8 Wave 9 Wave 10 Wave 11 Wave 12 Wave 13 Wave 14 Less(3/14 - (3/17 - (3/21 - (3/28 - (4/3 - (4/11- (4/18- (4/25- (5/1 - (5/8 - (5/15 - (5/27 - (5/29 - than $50k -3/15) 3/18) 3/23) 3/30) 4/5) 4/13) 4/20) 4/27) 5/3) 5/10) 5/17) 5/28) 5/31) MALE FEMALE 18-34 35-49 50-64 65+ $50k $75k $75k+ GOP DEM IND/OTH
(A) (B) (C) (D) (E) (F) (G) (H) (I) (J) (K) (L) (M) (N) (O) (P) (Q) (R) (S) (T) (U) (V) (W) (X) (Y)
- - - - - - - - - - - - 1266 737 529 280 349 315 322 363 280 583 498 423 345Unweighted Base-** -** -** -** -** -** -** -** -** -** -** -** 1246 635 612 301 375 291 279 288 218 705 462 444 340Weighted Base
- - - - - - - - - - - - 627 296 332 168 189 161 109 156 113 343 235 232 160- - - - - - - - - - - - 50% 47% 54% 56% 50% 55% 39% 54% 52% 49% 51% 52% 47%
N S S S
Me
- - - - - - - - - - - - 373 214 159 90 119 75 89 81 65 216 123 140 110- - - - - - - - - - - - 30% 34% 26% 30% 32% 26% 32% 28% 30% 31% 27% 32% 32%
O
My spouse/partner
- - - - - - - - - - - - 246 124 121 43 67 55 80 50 39 146 105 72 69- - - - - - - - - - - - 20% 20% 20% 14% 18% 19% 29% 17% 18% 21% 23% 16% 20%
PQR x
Neither of us
- - - - - - - - - - - - 1246 635 612 301 375 291 279 288 218 705 462 444 340- - - - - - - - - - - - 100% 100% 100% 100% 100% 100% 100% 100% 100% 100% 100% 100% 100%
Sigma
__________________________________________________________________________________________________________________Proportions/Means: Columns Tested (5%, 10% risk level) - A/B/C/D/E/F/G/H/I/J/K/L/M - N/O - P/Q/R/S - T/U/V - W/X/YOverlap formulae used. ** very small base (under 30) ineligible for sig testing

Page 32Fielding Period: March 14 - May 31, 2020COVID-19Weighted To The U.S. General Adult Population - Propensity
2 Jun 2020Table 30GEN02_8 Who is more likely to do each of the following during the coronavirus pandemic?
Strictly follow social distancing guidelines
Base: Currently In A Relationship
Waves Gender Age Income Political
Wave 2 Wave 3 Wave 4 Wave 5 Wave 6 Wave 7 Wave 8 Wave 9 Wave 10 Wave 11 Wave 12 Wave 13 Wave 14 Less(3/14 - (3/17 - (3/21 - (3/28 - (4/3 - (4/11- (4/18- (4/25- (5/1 - (5/8 - (5/15 - (5/27 - (5/29 - than $50k -3/15) 3/18) 3/23) 3/30) 4/5) 4/13) 4/20) 4/27) 5/3) 5/10) 5/17) 5/28) 5/31) MALE FEMALE 18-34 35-49 50-64 65+ $50k $75k $75k+ GOP DEM IND/OTH
(A) (B) (C) (D) (E) (F) (G) (H) (I) (J) (K) (L) (M) (N) (O) (P) (Q) (R) (S) (T) (U) (V) (W) (X) (Y)
- - - - - - - - - - - - 1266 737 529 280 349 315 322 363 280 583 498 423 345Unweighted Base-** -** -** -** -** -** -** -** -** -** -** -** 1246 635 612 301 375 291 279 288 218 705 462 444 340Weighted Base
- - - - - - - - - - - - 700 311 389 161 210 179 150 173 110 393 268 256 176- - - - - - - - - - - - 56% 49% 64% 53% 56% 61% 54% 60% 51% 56% 58% 58% 52%
N u
Me
- - - - - - - - - - - - 388 250 138 103 121 78 87 77 68 236 134 145 108- - - - - - - - - - - - 31% 39% 23% 34% 32% 27% 31% 27% 31% 33% 29% 33% 32%
O t
My spouse/partner
- - - - - - - - - - - - 158 74 84 37 44 35 42 38 40 77 60 42 56- - - - - - - - - - - - 13% 12% 14% 12% 12% 12% 15% 13% 18% 11% 13% 9% 16%
V X
Neither of us
- - - - - - - - - - - - 1246 635 612 301 375 291 279 288 218 705 462 444 340- - - - - - - - - - - - 100% 100% 100% 100% 100% 100% 100% 100% 100% 100% 100% 100% 100%
Sigma
__________________________________________________________________________________________________________________Proportions/Means: Columns Tested (5%, 10% risk level) - A/B/C/D/E/F/G/H/I/J/K/L/M - N/O - P/Q/R/S - T/U/V - W/X/YOverlap formulae used. ** very small base (under 30) ineligible for sig testing
Page 33Fielding Period: March 14 - May 31, 2020COVID-19Weighted To The U.S. General Adult Population - Propensity
2 Jun 2020Table 31GEN02_9 Who is more likely to do each of the following during the coronavirus pandemic?
Disobey social distancing guidelines
Base: Currently In A Relationship
Waves Gender Age Income Political
Wave 2 Wave 3 Wave 4 Wave 5 Wave 6 Wave 7 Wave 8 Wave 9 Wave 10 Wave 11 Wave 12 Wave 13 Wave 14 Less(3/14 - (3/17 - (3/21 - (3/28 - (4/3 - (4/11- (4/18- (4/25- (5/1 - (5/8 - (5/15 - (5/27 - (5/29 - than $50k -3/15) 3/18) 3/23) 3/30) 4/5) 4/13) 4/20) 4/27) 5/3) 5/10) 5/17) 5/28) 5/31) MALE FEMALE 18-34 35-49 50-64 65+ $50k $75k $75k+ GOP DEM IND/OTH
(A) (B) (C) (D) (E) (F) (G) (H) (I) (J) (K) (L) (M) (N) (O) (P) (Q) (R) (S) (T) (U) (V) (W) (X) (Y)
- - - - - - - - - - - - 1266 737 529 280 349 315 322 363 280 583 498 423 345Unweighted Base-** -** -** -** -** -** -** -** -** -** -** -** 1246 635 612 301 375 291 279 288 218 705 462 444 340Weighted Base
- - - - - - - - - - - - 283 171 112 105 86 49 43 69 42 168 118 79 87- - - - - - - - - - - - 23% 27% 18% 35% 23% 17% 15% 24% 19% 24% 25% 18% 25%
O QRS s X X
Me
- - - - - - - - - - - - 204 97 107 65 66 43 31 50 37 115 68 79 57- - - - - - - - - - - - 16% 15% 18% 21% 18% 15% 11% 17% 17% 16% 15% 18% 17%
S s
My spouse/partner
- - - - - - - - - - - - 759 367 392 132 223 199 205 169 139 422 277 286 197- - - - - - - - - - - - 61% 58% 64% 44% 59% 68% 74% 59% 64% 60% 60% 64% 58%
n P Pq PQ
Neither of us
- - - - - - - - - - - - 1246 635 612 301 375 291 279 288 218 705 462 444 340- - - - - - - - - - - - 100% 100% 100% 100% 100% 100% 100% 100% 100% 100% 100% 100% 100%
Sigma
__________________________________________________________________________________________________________________Proportions/Means: Columns Tested (5%, 10% risk level) - A/B/C/D/E/F/G/H/I/J/K/L/M - N/O - P/Q/R/S - T/U/V - W/X/YOverlap formulae used. ** very small base (under 30) ineligible for sig testing

Page 34Fielding Period: March 14 - May 31, 2020COVID-19Weighted To The U.S. General Adult Population - Propensity
2 Jun 2020Table 32GEN02_10 Who is more likely to do each of the following during the coronavirus pandemic?
Wash hands for 30 seconds after going out in public
Base: Currently In A Relationship
Waves Gender Age Income Political
Wave 2 Wave 3 Wave 4 Wave 5 Wave 6 Wave 7 Wave 8 Wave 9 Wave 10 Wave 11 Wave 12 Wave 13 Wave 14 Less(3/14 - (3/17 - (3/21 - (3/28 - (4/3 - (4/11- (4/18- (4/25- (5/1 - (5/8 - (5/15 - (5/27 - (5/29 - than $50k -3/15) 3/18) 3/23) 3/30) 4/5) 4/13) 4/20) 4/27) 5/3) 5/10) 5/17) 5/28) 5/31) MALE FEMALE 18-34 35-49 50-64 65+ $50k $75k $75k+ GOP DEM IND/OTH
(A) (B) (C) (D) (E) (F) (G) (H) (I) (J) (K) (L) (M) (N) (O) (P) (Q) (R) (S) (T) (U) (V) (W) (X) (Y)
- - - - - - - - - - - - 1266 737 529 280 349 315 322 363 280 583 498 423 345Unweighted Base-** -** -** -** -** -** -** -** -** -** -** -** 1246 635 612 301 375 291 279 288 218 705 462 444 340Weighted Base
- - - - - - - - - - - - 711 296 415 178 209 185 139 177 123 391 263 277 170- - - - - - - - - - - - 57% 47% 68% 59% 56% 64% 50% 62% 56% 55% 57% 63% 50%
N s qS Y
Me
- - - - - - - - - - - - 428 279 150 104 139 76 111 76 76 266 152 132 145- - - - - - - - - - - - 34% 44% 24% 34% 37% 26% 40% 27% 35% 38% 33% 30% 43%
O r R R t T WX
My spouse/partner
- - - - - - - - - - - - 107 60 47 20 28 30 29 34 19 48 47 34 25- - - - - - - - - - - - 9% 9% 8% 7% 7% 10% 10% 12% 9% 7% 10% 8% 7%
V
Neither of us
- - - - - - - - - - - - 1246 635 612 301 375 291 279 288 218 705 462 444 340- - - - - - - - - - - - 100% 100% 100% 100% 100% 100% 100% 100% 100% 100% 100% 100% 100%
Sigma
__________________________________________________________________________________________________________________Proportions/Means: Columns Tested (5%, 10% risk level) - A/B/C/D/E/F/G/H/I/J/K/L/M - N/O - P/Q/R/S - T/U/V - W/X/YOverlap formulae used. ** very small base (under 30) ineligible for sig testing
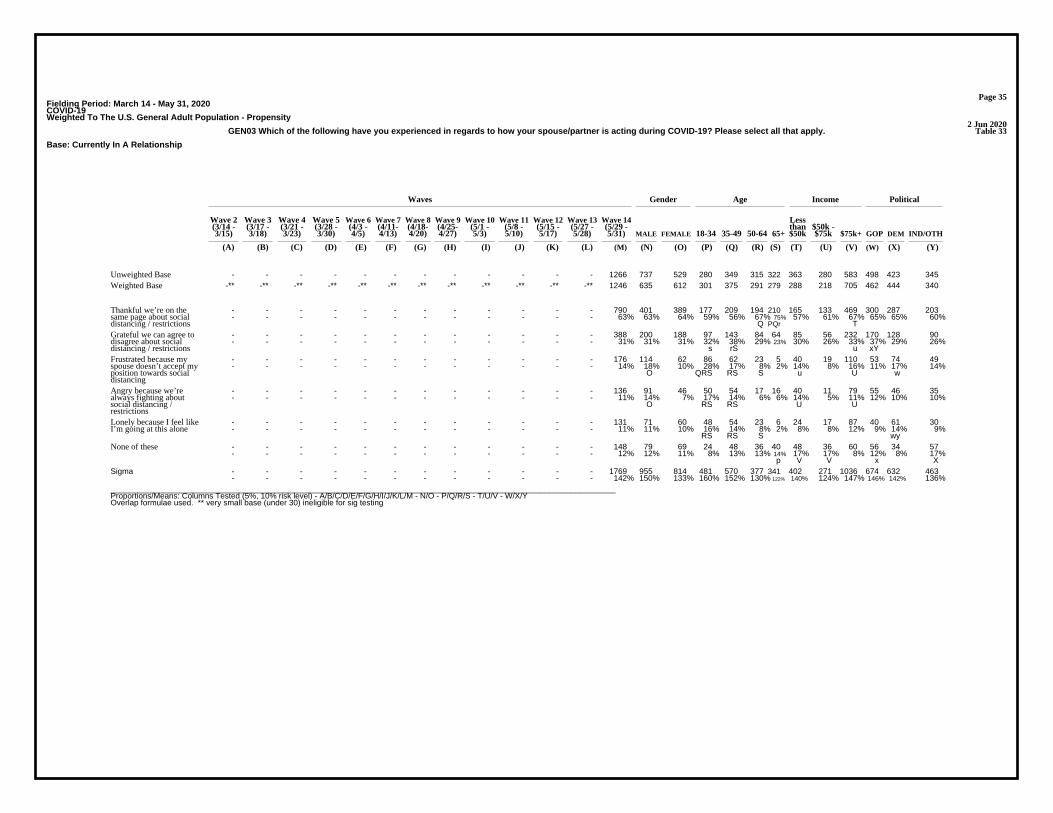
Page 35Fielding Period: March 14 - May 31, 2020COVID-19Weighted To The U.S. General Adult Population - Propensity
2 Jun 2020Table 33GEN03 Which of the following have you experienced in regards to how your spouse/partner is acting during COVID-19? Please select all that apply.
Base: Currently In A Relationship
Waves Gender Age Income Political
Wave 2 Wave 3 Wave 4 Wave 5 Wave 6 Wave 7 Wave 8 Wave 9 Wave 10 Wave 11 Wave 12 Wave 13 Wave 14 Less(3/14 - (3/17 - (3/21 - (3/28 - (4/3 - (4/11- (4/18- (4/25- (5/1 - (5/8 - (5/15 - (5/27 - (5/29 - than $50k -3/15) 3/18) 3/23) 3/30) 4/5) 4/13) 4/20) 4/27) 5/3) 5/10) 5/17) 5/28) 5/31) MALE FEMALE 18-34 35-49 50-64 65+ $50k $75k $75k+ GOP DEM IND/OTH
(A) (B) (C) (D) (E) (F) (G) (H) (I) (J) (K) (L) (M) (N) (O) (P) (Q) (R) (S) (T) (U) (V) (W) (X) (Y)
- - - - - - - - - - - - 1266 737 529 280 349 315 322 363 280 583 498 423 345Unweighted Base-** -** -** -** -** -** -** -** -** -** -** -** 1246 635 612 301 375 291 279 288 218 705 462 444 340Weighted Base
- - - - - - - - - - - - 790 401 389 177 209 194 210 165 133 469 300 287 203- - - - - - - - - - - - 63% 63% 64% 59% 56% 67% 75% 57% 61% 67% 65% 65% 60%
Q PQr T
Thankful we’re on thesame page about socialdistancing / restrictions
- - - - - - - - - - - - 388 200 188 97 143 84 64 85 56 232 170 128 90- - - - - - - - - - - - 31% 31% 31% 32% 38% 29% 23% 30% 26% 33% 37% 29% 26%
s rS u xY
Grateful we can agree todisagree about socialdistancing / restrictions
- - - - - - - - - - - - 176 114 62 86 62 23 5 40 19 110 53 74 49- - - - - - - - - - - - 14% 18% 10% 28% 17% 8% 2% 14% 8% 16% 11% 17% 14%
O QRS RS S u U w
Frustrated because myspouse doesn’t accept myposition towards socialdistancing
- - - - - - - - - - - - 136 91 46 50 54 17 16 40 11 79 55 46 35- - - - - - - - - - - - 11% 14% 7% 17% 14% 6% 6% 14% 5% 11% 12% 10% 10%
O RS RS U U
Angry because we’realways fighting aboutsocial distancing /restrictions
- - - - - - - - - - - - 131 71 60 48 54 23 6 24 17 87 40 61 30- - - - - - - - - - - - 11% 11% 10% 16% 14% 8% 2% 8% 8% 12% 9% 14% 9%
RS RS S wy
Lonely because I feel likeI’m going at this alone
- - - - - - - - - - - - 148 79 69 24 48 36 40 48 36 60 56 34 57- - - - - - - - - - - - 12% 12% 11% 8% 13% 13% 14% 17% 17% 8% 12% 8% 17%
p V V x X
None of these
- - - - - - - - - - - - 1769 955 814 481 570 377 341 402 271 1036 674 632 463- - - - - - - - - - - - 142% 150% 133% 160% 152% 130% 122% 140% 124% 147% 146% 142% 136%
Sigma
__________________________________________________________________________________________________________________Proportions/Means: Columns Tested (5%, 10% risk level) - A/B/C/D/E/F/G/H/I/J/K/L/M - N/O - P/Q/R/S - T/U/V - W/X/YOverlap formulae used. ** very small base (under 30) ineligible for sig testing
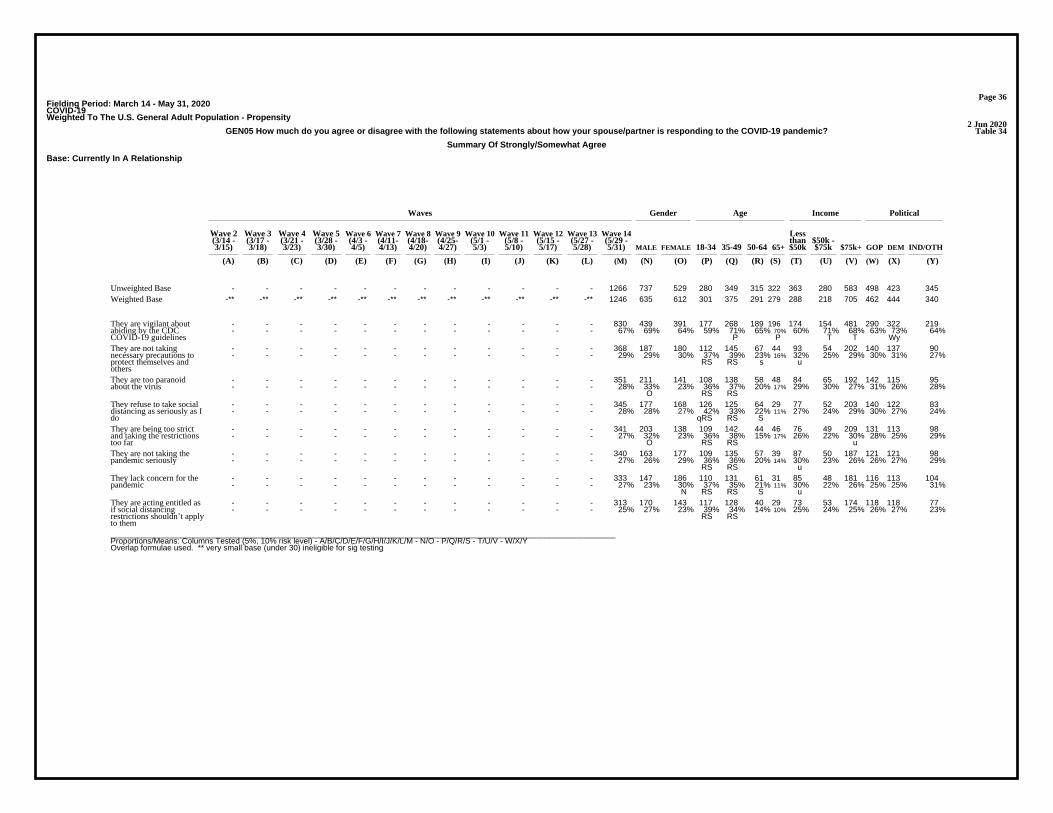
Page 36Fielding Period: March 14 - May 31, 2020COVID-19Weighted To The U.S. General Adult Population - Propensity
2 Jun 2020Table 34GEN05 How much do you agree or disagree with the following statements about how your spouse/partner is responding to the COVID-19 pandemic?
Summary Of Strongly/Somewhat Agree
Base: Currently In A Relationship
Waves Gender Age Income Political
Wave 2 Wave 3 Wave 4 Wave 5 Wave 6 Wave 7 Wave 8 Wave 9 Wave 10 Wave 11 Wave 12 Wave 13 Wave 14 Less(3/14 - (3/17 - (3/21 - (3/28 - (4/3 - (4/11- (4/18- (4/25- (5/1 - (5/8 - (5/15 - (5/27 - (5/29 - than $50k -3/15) 3/18) 3/23) 3/30) 4/5) 4/13) 4/20) 4/27) 5/3) 5/10) 5/17) 5/28) 5/31) MALE FEMALE 18-34 35-49 50-64 65+ $50k $75k $75k+ GOP DEM IND/OTH
(A) (B) (C) (D) (E) (F) (G) (H) (I) (J) (K) (L) (M) (N) (O) (P) (Q) (R) (S) (T) (U) (V) (W) (X) (Y)
- - - - - - - - - - - - 1266 737 529 280 349 315 322 363 280 583 498 423 345Unweighted Base-** -** -** -** -** -** -** -** -** -** -** -** 1246 635 612 301 375 291 279 288 218 705 462 444 340Weighted Base
- - - - - - - - - - - - 830 439 391 177 268 189 196 174 154 481 290 322 219- - - - - - - - - - - - 67% 69% 64% 59% 71% 65% 70% 60% 71% 68% 63% 73% 64%
P P T T Wy
They are vigilant aboutabiding by the CDCCOVID-19 guidelines
- - - - - - - - - - - - 368 187 180 112 145 67 44 93 54 202 140 137 90- - - - - - - - - - - - 29% 29% 30% 37% 39% 23% 16% 32% 25% 29% 30% 31% 27%
RS RS s u
They are not takingnecessary precautions toprotect themselves andothers
- - - - - - - - - - - - 351 211 141 108 138 58 48 84 65 192 142 115 95- - - - - - - - - - - - 28% 33% 23% 36% 37% 20% 17% 29% 30% 27% 31% 26% 28%
O RS RS
They are too paranoidabout the virus
- - - - - - - - - - - - 345 177 168 126 125 64 29 77 52 203 140 122 83- - - - - - - - - - - - 28% 28% 27% 42% 33% 22% 11% 27% 24% 29% 30% 27% 24%
qRS RS S
They refuse to take socialdistancing as seriously as Ido
- - - - - - - - - - - - 341 203 138 109 142 44 46 76 49 209 131 113 98- - - - - - - - - - - - 27% 32% 23% 36% 38% 15% 17% 26% 22% 30% 28% 25% 29%
O RS RS u
They are being too strictand taking the restrictionstoo far
- - - - - - - - - - - - 340 163 177 109 135 57 39 87 50 187 121 121 98- - - - - - - - - - - - 27% 26% 29% 36% 36% 20% 14% 30% 23% 26% 26% 27% 29%
RS RS u
They are not taking thepandemic seriously
- - - - - - - - - - - - 333 147 186 110 131 61 31 85 48 181 116 113 104- - - - - - - - - - - - 27% 23% 30% 37% 35% 21% 11% 30% 22% 26% 25% 25% 31%
N RS RS S u
They lack concern for thepandemic
- - - - - - - - - - - - 313 170 143 117 128 40 29 73 53 174 118 118 77- - - - - - - - - - - - 25% 27% 23% 39% 34% 14% 10% 25% 24% 25% 26% 27% 23%
RS RS
They are acting entitled asif social distancingrestrictions shouldn’t applyto them__________________________________________________________________________________________________________________Proportions/Means: Columns Tested (5%, 10% risk level) - A/B/C/D/E/F/G/H/I/J/K/L/M - N/O - P/Q/R/S - T/U/V - W/X/YOverlap formulae used. ** very small base (under 30) ineligible for sig testing

Page 37Fielding Period: March 14 - May 31, 2020COVID-19Weighted To The U.S. General Adult Population - Propensity
2 Jun 2020Table 35GEN05 How much do you agree or disagree with the following statements about how your spouse/partner is responding to the COVID-19 pandemic?
Summary Of Strongly/Somewhat Disagree
Base: Currently In A Relationship
Waves Gender Age Income Political
Wave 2 Wave 3 Wave 4 Wave 5 Wave 6 Wave 7 Wave 8 Wave 9 Wave 10 Wave 11 Wave 12 Wave 13 Wave 14 Less(3/14 - (3/17 - (3/21 - (3/28 - (4/3 - (4/11- (4/18- (4/25- (5/1 - (5/8 - (5/15 - (5/27 - (5/29 - than $50k -3/15) 3/18) 3/23) 3/30) 4/5) 4/13) 4/20) 4/27) 5/3) 5/10) 5/17) 5/28) 5/31) MALE FEMALE 18-34 35-49 50-64 65+ $50k $75k $75k+ GOP DEM IND/OTH
(A) (B) (C) (D) (E) (F) (G) (H) (I) (J) (K) (L) (M) (N) (O) (P) (Q) (R) (S) (T) (U) (V) (W) (X) (Y)
- - - - - - - - - - - - 1266 737 529 280 349 315 322 363 280 583 498 423 345Unweighted Base-** -** -** -** -** -** -** -** -** -** -** -** 1246 635 612 301 375 291 279 288 218 705 462 444 340Weighted Base
- - - - - - - - - - - - 933 465 468 185 248 251 250 215 165 531 344 326 263- - - - - - - - - - - - 75% 73% 77% 61% 66% 86% 90% 75% 76% 75% 74% 73% 77%
PQ PQ
They are acting entitled asif social distancingrestrictions shouldn’t applyto them
- - - - - - - - - - - - 913 487 426 191 244 230 248 202 170 524 347 331 236- - - - - - - - - - - - 73% 77% 70% 63% 65% 79% 89% 70% 78% 74% 75% 75% 69%
O PQ PQR t
They lack concern for thepandemic
- - - - - - - - - - - - 907 472 435 193 241 234 240 200 169 518 341 323 243- - - - - - - - - - - - 73% 74% 71% 64% 64% 80% 86% 70% 77% 74% 74% 73% 71%
PQ PQ t
They are not taking thepandemic seriously
- - - - - - - - - - - - 905 432 473 193 233 247 232 212 169 496 331 331 243- - - - - - - - - - - - 73% 68% 77% 64% 62% 85% 83% 74% 78% 70% 72% 75% 71%
N PQ PQ v
They are being too strictand taking the restrictionstoo far
- - - - - - - - - - - - 901 458 444 175 250 227 249 211 166 502 323 322 257- - - - - - - - - - - - 72% 72% 73% 58% 67% 78% 89% 73% 76% 71% 70% 73% 76%
p PQ PQR
They refuse to take socialdistancing as seriously as Ido
- - - - - - - - - - - - 895 424 471 193 238 233 231 204 153 513 321 329 245- - - - - - - - - - - - 72% 67% 77% 64% 63% 80% 83% 71% 70% 73% 69% 74% 72%
N PQ PQ
They are too paranoidabout the virus
- - - - - - - - - - - - 879 448 431 190 230 224 235 195 164 503 322 307 250- - - - - - - - - - - - 71% 71% 70% 63% 61% 77% 84% 68% 75% 71% 70% 69% 73%
PQ PQr t
They are not takingnecessary precautions toprotect themselves andothers
- - - - - - - - - - - - 416 195 221 124 107 102 82 114 64 224 173 121 122- - - - - - - - - - - - 33% 31% 36% 41% 29% 35% 30% 40% 29% 32% 37% 27% 36%
QS UV X x
They are vigilant aboutabiding by the CDCCOVID-19 guidelines__________________________________________________________________________________________________________________Proportions/Means: Columns Tested (5%, 10% risk level) - A/B/C/D/E/F/G/H/I/J/K/L/M - N/O - P/Q/R/S - T/U/V - W/X/YOverlap formulae used. ** very small base (under 30) ineligible for sig testing

Page 38Fielding Period: March 14 - May 31, 2020COVID-19Weighted To The U.S. General Adult Population - Propensity
2 Jun 2020Table 36GEN05_1 How much do you agree or disagree with the following statements about how your spouse/partner is responding to the COVID-19 pandemic?
They are not taking the pandemic seriously
Base: Currently In A Relationship
Waves Gender Age Income Political
Wave 2 Wave 3 Wave 4 Wave 5 Wave 6 Wave 7 Wave 8 Wave 9 Wave 10 Wave 11 Wave 12 Wave 13 Wave 14 Less(3/14 - (3/17 - (3/21 - (3/28 - (4/3 - (4/11- (4/18- (4/25- (5/1 - (5/8 - (5/15 - (5/27 - (5/29 - than $50k -3/15) 3/18) 3/23) 3/30) 4/5) 4/13) 4/20) 4/27) 5/3) 5/10) 5/17) 5/28) 5/31) MALE FEMALE 18-34 35-49 50-64 65+ $50k $75k $75k+ GOP DEM IND/OTH
(A) (B) (C) (D) (E) (F) (G) (H) (I) (J) (K) (L) (M) (N) (O) (P) (Q) (R) (S) (T) (U) (V) (W) (X) (Y)
- - - - - - - - - - - - 1266 737 529 280 349 315 322 363 280 583 498 423 345Unweighted Base-** -** -** -** -** -** -** -** -** -** -** -** 1246 635 612 301 375 291 279 288 218 705 462 444 340Weighted Base
- - - - - - - - - - - - 340 163 177 109 135 57 39 87 50 187 121 121 98- - - - - - - - - - - - 27% 26% 29% 36% 36% 20% 14% 30% 23% 26% 26% 27% 29%
RS RS u
Strongly/Somewhat Agree(Net)
- - - - - - - - - - - - 136 61 75 49 61 15 11 39 21 74 47 52 37- - - - - - - - - - - - 11% 10% 12% 16% 16% 5% 4% 14% 10% 11% 10% 12% 11%
RS RS
Strongly agree
- - - - - - - - - - - - 204 102 102 59 74 43 28 48 28 112 74 69 60- - - - - - - - - - - - 16% 16% 17% 20% 20% 15% 10% 17% 13% 16% 16% 16% 18%
S S
Somewhat agree
- - - - - - - - - - - - 907 472 435 193 241 234 240 200 169 518 341 323 243- - - - - - - - - - - - 73% 74% 71% 64% 64% 80% 86% 70% 77% 74% 74% 73% 71%
PQ PQ t
Strongly/SomewhatDisagree (Net)
- - - - - - - - - - - - 267 139 128 89 69 57 53 66 45 150 108 85 74- - - - - - - - - - - - 21% 22% 21% 30% 18% 19% 19% 23% 21% 21% 23% 19% 22%
QRS
Somewhat disagree
- - - - - - - - - - - - 640 333 307 104 172 177 187 134 124 368 233 238 168- - - - - - - - - - - - 51% 52% 50% 34% 46% 61% 67% 47% 57% 52% 50% 54% 50%
P PQ PQ T
Strongly disagree
- - - - - - - - - - - - 1246 635 612 301 375 291 279 288 218 705 462 444 340- - - - - - - - - - - - 100% 100% 100% 100% 100% 100% 100% 100% 100% 100% 100% 100% 100%
Sigma
__________________________________________________________________________________________________________________Proportions/Means: Columns Tested (5%, 10% risk level) - A/B/C/D/E/F/G/H/I/J/K/L/M - N/O - P/Q/R/S - T/U/V - W/X/YOverlap formulae used. ** very small base (under 30) ineligible for sig testing

Page 39Fielding Period: March 14 - May 31, 2020COVID-19Weighted To The U.S. General Adult Population - Propensity
2 Jun 2020Table 37GEN05_2 How much do you agree or disagree with the following statements about how your spouse/partner is responding to the COVID-19 pandemic?
They are being too strict and taking the restrictions too far
Base: Currently In A Relationship
Waves Gender Age Income Political
Wave 2 Wave 3 Wave 4 Wave 5 Wave 6 Wave 7 Wave 8 Wave 9 Wave 10 Wave 11 Wave 12 Wave 13 Wave 14 Less(3/14 - (3/17 - (3/21 - (3/28 - (4/3 - (4/11- (4/18- (4/25- (5/1 - (5/8 - (5/15 - (5/27 - (5/29 - than $50k -3/15) 3/18) 3/23) 3/30) 4/5) 4/13) 4/20) 4/27) 5/3) 5/10) 5/17) 5/28) 5/31) MALE FEMALE 18-34 35-49 50-64 65+ $50k $75k $75k+ GOP DEM IND/OTH
(A) (B) (C) (D) (E) (F) (G) (H) (I) (J) (K) (L) (M) (N) (O) (P) (Q) (R) (S) (T) (U) (V) (W) (X) (Y)
- - - - - - - - - - - - 1266 737 529 280 349 315 322 363 280 583 498 423 345Unweighted Base-** -** -** -** -** -** -** -** -** -** -** -** 1246 635 612 301 375 291 279 288 218 705 462 444 340Weighted Base
- - - - - - - - - - - - 341 203 138 109 142 44 46 76 49 209 131 113 98- - - - - - - - - - - - 27% 32% 23% 36% 38% 15% 17% 26% 22% 30% 28% 25% 29%
O RS RS u
Strongly/Somewhat Agree(Net)
- - - - - - - - - - - - 114 70 44 35 50 12 16 22 25 64 50 33 31- - - - - - - - - - - - 9% 11% 7% 12% 13% 4% 6% 8% 11% 9% 11% 7% 9%
o RS RS
Strongly agree
- - - - - - - - - - - - 227 133 95 74 92 32 30 53 24 145 81 79 67- - - - - - - - - - - - 18% 21% 15% 24% 25% 11% 11% 19% 11% 21% 18% 18% 20%
o RS RS U U
Somewhat agree
- - - - - - - - - - - - 905 432 473 193 233 247 232 212 169 496 331 331 243- - - - - - - - - - - - 73% 68% 77% 64% 62% 85% 83% 74% 78% 70% 72% 75% 71%
N PQ PQ v
Strongly/SomewhatDisagree (Net)
- - - - - - - - - - - - 330 164 166 75 82 85 88 86 76 155 126 121 83- - - - - - - - - - - - 26% 26% 27% 25% 22% 29% 31% 30% 35% 22% 27% 27% 24%
q Q V V
Somewhat disagree
- - - - - - - - - - - - 575 268 307 118 151 161 145 126 93 341 205 210 160- - - - - - - - - - - - 46% 42% 50% 39% 40% 56% 52% 44% 43% 48% 44% 47% 47%
N PQ PQ
Strongly disagree
- - - - - - - - - - - - 1246 635 612 301 375 291 279 288 218 705 462 444 340- - - - - - - - - - - - 100% 100% 100% 100% 100% 100% 100% 100% 100% 100% 100% 100% 100%
Sigma
__________________________________________________________________________________________________________________Proportions/Means: Columns Tested (5%, 10% risk level) - A/B/C/D/E/F/G/H/I/J/K/L/M - N/O - P/Q/R/S - T/U/V - W/X/YOverlap formulae used. ** very small base (under 30) ineligible for sig testing

Page 40Fielding Period: March 14 - May 31, 2020COVID-19Weighted To The U.S. General Adult Population - Propensity
2 Jun 2020Table 38GEN05_3 How much do you agree or disagree with the following statements about how your spouse/partner is responding to the COVID-19 pandemic?
They lack concern for the pandemic
Base: Currently In A Relationship
Waves Gender Age Income Political
Wave 2 Wave 3 Wave 4 Wave 5 Wave 6 Wave 7 Wave 8 Wave 9 Wave 10 Wave 11 Wave 12 Wave 13 Wave 14 Less(3/14 - (3/17 - (3/21 - (3/28 - (4/3 - (4/11- (4/18- (4/25- (5/1 - (5/8 - (5/15 - (5/27 - (5/29 - than $50k -3/15) 3/18) 3/23) 3/30) 4/5) 4/13) 4/20) 4/27) 5/3) 5/10) 5/17) 5/28) 5/31) MALE FEMALE 18-34 35-49 50-64 65+ $50k $75k $75k+ GOP DEM IND/OTH
(A) (B) (C) (D) (E) (F) (G) (H) (I) (J) (K) (L) (M) (N) (O) (P) (Q) (R) (S) (T) (U) (V) (W) (X) (Y)
- - - - - - - - - - - - 1266 737 529 280 349 315 322 363 280 583 498 423 345Unweighted Base-** -** -** -** -** -** -** -** -** -** -** -** 1246 635 612 301 375 291 279 288 218 705 462 444 340Weighted Base
- - - - - - - - - - - - 333 147 186 110 131 61 31 85 48 181 116 113 104- - - - - - - - - - - - 27% 23% 30% 37% 35% 21% 11% 30% 22% 26% 25% 25% 31%
N RS RS S u
Strongly/Somewhat Agree(Net)
- - - - - - - - - - - - 136 64 72 49 61 16 10 39 22 74 42 49 45- - - - - - - - - - - - 11% 10% 12% 16% 16% 5% 4% 14% 10% 10% 9% 11% 13%
RS RS
Strongly agree
- - - - - - - - - - - - 197 83 114 61 70 45 21 46 27 107 73 64 60- - - - - - - - - - - - 16% 13% 19% 20% 19% 15% 7% 16% 12% 15% 16% 14% 18%
N S S S
Somewhat agree
- - - - - - - - - - - - 913 487 426 191 244 230 248 202 170 524 347 331 236- - - - - - - - - - - - 73% 77% 70% 63% 65% 79% 89% 70% 78% 74% 75% 75% 69%
O PQ PQR t
Strongly/SomewhatDisagree (Net)
- - - - - - - - - - - - 254 137 117 75 73 60 45 69 44 137 115 76 63- - - - - - - - - - - - 20% 22% 19% 25% 19% 21% 16% 24% 20% 19% 25% 17% 19%
S Xy
Somewhat disagree
- - - - - - - - - - - - 660 350 309 116 171 170 202 134 126 387 232 255 173- - - - - - - - - - - - 53% 55% 51% 39% 46% 58% 73% 46% 58% 55% 50% 58% 51%
PQ PQR T T w
Strongly disagree
- - - - - - - - - - - - 1246 635 612 301 375 291 279 288 218 705 462 444 340- - - - - - - - - - - - 100% 100% 100% 100% 100% 100% 100% 100% 100% 100% 100% 100% 100%
Sigma
__________________________________________________________________________________________________________________Proportions/Means: Columns Tested (5%, 10% risk level) - A/B/C/D/E/F/G/H/I/J/K/L/M - N/O - P/Q/R/S - T/U/V - W/X/YOverlap formulae used. ** very small base (under 30) ineligible for sig testing

Page 41Fielding Period: March 14 - May 31, 2020COVID-19Weighted To The U.S. General Adult Population - Propensity
2 Jun 2020Table 39GEN05_4 How much do you agree or disagree with the following statements about how your spouse/partner is responding to the COVID-19 pandemic?
They are acting entitled as if social distancing restrictions shouldn’t apply to them
Base: Currently In A Relationship
Waves Gender Age Income Political
Wave 2 Wave 3 Wave 4 Wave 5 Wave 6 Wave 7 Wave 8 Wave 9 Wave 10 Wave 11 Wave 12 Wave 13 Wave 14 Less(3/14 - (3/17 - (3/21 - (3/28 - (4/3 - (4/11- (4/18- (4/25- (5/1 - (5/8 - (5/15 - (5/27 - (5/29 - than $50k -3/15) 3/18) 3/23) 3/30) 4/5) 4/13) 4/20) 4/27) 5/3) 5/10) 5/17) 5/28) 5/31) MALE FEMALE 18-34 35-49 50-64 65+ $50k $75k $75k+ GOP DEM IND/OTH
(A) (B) (C) (D) (E) (F) (G) (H) (I) (J) (K) (L) (M) (N) (O) (P) (Q) (R) (S) (T) (U) (V) (W) (X) (Y)
- - - - - - - - - - - - 1266 737 529 280 349 315 322 363 280 583 498 423 345Unweighted Base-** -** -** -** -** -** -** -** -** -** -** -** 1246 635 612 301 375 291 279 288 218 705 462 444 340Weighted Base
- - - - - - - - - - - - 313 170 143 117 128 40 29 73 53 174 118 118 77- - - - - - - - - - - - 25% 27% 23% 39% 34% 14% 10% 25% 24% 25% 26% 27% 23%
RS RS
Strongly/Somewhat Agree(Net)
- - - - - - - - - - - - 131 64 68 56 52 15 9 35 22 72 52 44 36- - - - - - - - - - - - 11% 10% 11% 18% 14% 5% 3% 12% 10% 10% 11% 10% 11%
RS RS
Strongly agree
- - - - - - - - - - - - 182 106 76 61 76 25 20 38 31 102 67 74 41- - - - - - - - - - - - 15% 17% 12% 20% 20% 9% 7% 13% 14% 14% 14% 17% 12%
o RS RS
Somewhat agree
- - - - - - - - - - - - 933 465 468 185 248 251 250 215 165 531 344 326 263- - - - - - - - - - - - 75% 73% 77% 61% 66% 86% 90% 75% 76% 75% 74% 73% 77%
PQ PQ
Strongly/SomewhatDisagree (Net)
- - - - - - - - - - - - 257 132 126 75 72 60 50 78 41 129 100 75 82- - - - - - - - - - - - 21% 21% 21% 25% 19% 21% 18% 27% 19% 18% 22% 17% 24%
uV x
Somewhat disagree
- - - - - - - - - - - - 676 333 343 110 176 190 200 137 124 402 244 251 181- - - - - - - - - - - - 54% 52% 56% 37% 47% 65% 72% 48% 57% 57% 53% 57% 53%
p PQ PQ t T
Strongly disagree
- - - - - - - - - - - - 1246 635 612 301 375 291 279 288 218 705 462 444 340- - - - - - - - - - - - 100% 100% 100% 100% 100% 100% 100% 100% 100% 100% 100% 100% 100%
Sigma
__________________________________________________________________________________________________________________Proportions/Means: Columns Tested (5%, 10% risk level) - A/B/C/D/E/F/G/H/I/J/K/L/M - N/O - P/Q/R/S - T/U/V - W/X/YOverlap formulae used. ** very small base (under 30) ineligible for sig testing

Page 42Fielding Period: March 14 - May 31, 2020COVID-19Weighted To The U.S. General Adult Population - Propensity
2 Jun 2020Table 40GEN05_5 How much do you agree or disagree with the following statements about how your spouse/partner is responding to the COVID-19 pandemic?
They are not taking necessary precautions to protect themselves and others
Base: Currently In A Relationship
Waves Gender Age Income Political
Wave 2 Wave 3 Wave 4 Wave 5 Wave 6 Wave 7 Wave 8 Wave 9 Wave 10 Wave 11 Wave 12 Wave 13 Wave 14 Less(3/14 - (3/17 - (3/21 - (3/28 - (4/3 - (4/11- (4/18- (4/25- (5/1 - (5/8 - (5/15 - (5/27 - (5/29 - than $50k -3/15) 3/18) 3/23) 3/30) 4/5) 4/13) 4/20) 4/27) 5/3) 5/10) 5/17) 5/28) 5/31) MALE FEMALE 18-34 35-49 50-64 65+ $50k $75k $75k+ GOP DEM IND/OTH
(A) (B) (C) (D) (E) (F) (G) (H) (I) (J) (K) (L) (M) (N) (O) (P) (Q) (R) (S) (T) (U) (V) (W) (X) (Y)
- - - - - - - - - - - - 1266 737 529 280 349 315 322 363 280 583 498 423 345Unweighted Base-** -** -** -** -** -** -** -** -** -** -** -** 1246 635 612 301 375 291 279 288 218 705 462 444 340Weighted Base
- - - - - - - - - - - - 368 187 180 112 145 67 44 93 54 202 140 137 90- - - - - - - - - - - - 29% 29% 30% 37% 39% 23% 16% 32% 25% 29% 30% 31% 27%
RS RS s u
Strongly/Somewhat Agree(Net)
- - - - - - - - - - - - 150 71 79 51 59 24 16 36 28 84 59 59 32- - - - - - - - - - - - 12% 11% 13% 17% 16% 8% 6% 12% 13% 12% 13% 13% 9%
RS RS
Strongly agree
- - - - - - - - - - - - 218 116 102 61 86 43 28 57 26 117 82 78 59- - - - - - - - - - - - 17% 18% 17% 20% 23% 15% 10% 20% 12% 17% 18% 17% 17%
S RS U
Somewhat agree
- - - - - - - - - - - - 879 448 431 190 230 224 235 195 164 503 322 307 250- - - - - - - - - - - - 71% 71% 70% 63% 61% 77% 84% 68% 75% 71% 70% 69% 73%
PQ PQr t
Strongly/SomewhatDisagree (Net)
- - - - - - - - - - - - 271 124 147 82 72 55 63 71 49 146 112 81 78- - - - - - - - - - - - 22% 20% 24% 27% 19% 19% 22% 25% 22% 21% 24% 18% 23%
qr x
Somewhat disagree
- - - - - - - - - - - - 607 324 284 108 159 169 172 124 116 357 210 225 172- - - - - - - - - - - - 49% 51% 46% 36% 42% 58% 62% 43% 53% 51% 45% 51% 51%
PQ PQ T t
Strongly disagree
- - - - - - - - - - - - 1246 635 612 301 375 291 279 288 218 705 462 444 340- - - - - - - - - - - - 100% 100% 100% 100% 100% 100% 100% 100% 100% 100% 100% 100% 100%
Sigma
__________________________________________________________________________________________________________________Proportions/Means: Columns Tested (5%, 10% risk level) - A/B/C/D/E/F/G/H/I/J/K/L/M - N/O - P/Q/R/S - T/U/V - W/X/YOverlap formulae used. ** very small base (under 30) ineligible for sig testing

Page 43Fielding Period: March 14 - May 31, 2020COVID-19Weighted To The U.S. General Adult Population - Propensity
2 Jun 2020Table 41GEN05_6 How much do you agree or disagree with the following statements about how your spouse/partner is responding to the COVID-19 pandemic?
They are too paranoid about the virus
Base: Currently In A Relationship
Waves Gender Age Income Political
Wave 2 Wave 3 Wave 4 Wave 5 Wave 6 Wave 7 Wave 8 Wave 9 Wave 10 Wave 11 Wave 12 Wave 13 Wave 14 Less(3/14 - (3/17 - (3/21 - (3/28 - (4/3 - (4/11- (4/18- (4/25- (5/1 - (5/8 - (5/15 - (5/27 - (5/29 - than $50k -3/15) 3/18) 3/23) 3/30) 4/5) 4/13) 4/20) 4/27) 5/3) 5/10) 5/17) 5/28) 5/31) MALE FEMALE 18-34 35-49 50-64 65+ $50k $75k $75k+ GOP DEM IND/OTH
(A) (B) (C) (D) (E) (F) (G) (H) (I) (J) (K) (L) (M) (N) (O) (P) (Q) (R) (S) (T) (U) (V) (W) (X) (Y)
- - - - - - - - - - - - 1266 737 529 280 349 315 322 363 280 583 498 423 345Unweighted Base-** -** -** -** -** -** -** -** -** -** -** -** 1246 635 612 301 375 291 279 288 218 705 462 444 340Weighted Base
- - - - - - - - - - - - 351 211 141 108 138 58 48 84 65 192 142 115 95- - - - - - - - - - - - 28% 33% 23% 36% 37% 20% 17% 29% 30% 27% 31% 26% 28%
O RS RS
Strongly/Somewhat Agree(Net)
- - - - - - - - - - - - 110 53 57 34 51 19 6 33 25 51 49 28 33- - - - - - - - - - - - 9% 8% 9% 11% 13% 7% 2% 11% 11% 7% 11% 6% 10%
S RS S v v x
Strongly agree
- - - - - - - - - - - - 241 157 84 74 87 39 42 51 40 141 92 87 62- - - - - - - - - - - - 19% 25% 14% 25% 23% 13% 15% 18% 19% 20% 20% 20% 18%
O RS RS
Somewhat agree
- - - - - - - - - - - - 895 424 471 193 238 233 231 204 153 513 321 329 245- - - - - - - - - - - - 72% 67% 77% 64% 63% 80% 83% 71% 70% 73% 69% 74% 72%
N PQ PQ
Strongly/SomewhatDisagree (Net)
- - - - - - - - - - - - 323 156 167 100 73 75 75 81 63 164 116 107 100- - - - - - - - - - - - 26% 25% 27% 33% 19% 26% 27% 28% 29% 23% 25% 24% 29%
Q q
Somewhat disagree
- - - - - - - - - - - - 572 268 303 94 165 158 155 123 90 350 205 222 145- - - - - - - - - - - - 46% 42% 50% 31% 44% 54% 56% 43% 41% 50% 44% 50% 43%
N P PQ PQ u
Strongly disagree
- - - - - - - - - - - - 1246 635 612 301 375 291 279 288 218 705 462 444 340- - - - - - - - - - - - 100% 100% 100% 100% 100% 100% 100% 100% 100% 100% 100% 100% 100%
Sigma
__________________________________________________________________________________________________________________Proportions/Means: Columns Tested (5%, 10% risk level) - A/B/C/D/E/F/G/H/I/J/K/L/M - N/O - P/Q/R/S - T/U/V - W/X/YOverlap formulae used. ** very small base (under 30) ineligible for sig testing
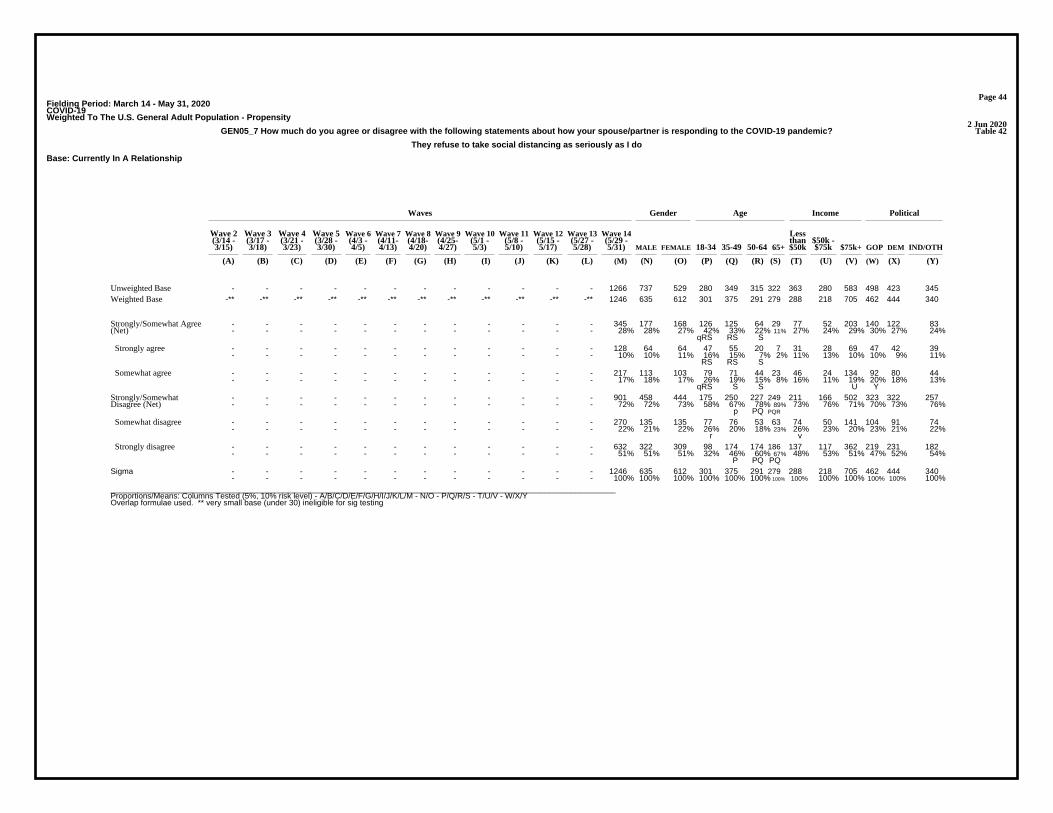
Page 44Fielding Period: March 14 - May 31, 2020COVID-19Weighted To The U.S. General Adult Population - Propensity
2 Jun 2020Table 42GEN05_7 How much do you agree or disagree with the following statements about how your spouse/partner is responding to the COVID-19 pandemic?
They refuse to take social distancing as seriously as I do
Base: Currently In A Relationship
Waves Gender Age Income Political
Wave 2 Wave 3 Wave 4 Wave 5 Wave 6 Wave 7 Wave 8 Wave 9 Wave 10 Wave 11 Wave 12 Wave 13 Wave 14 Less(3/14 - (3/17 - (3/21 - (3/28 - (4/3 - (4/11- (4/18- (4/25- (5/1 - (5/8 - (5/15 - (5/27 - (5/29 - than $50k -3/15) 3/18) 3/23) 3/30) 4/5) 4/13) 4/20) 4/27) 5/3) 5/10) 5/17) 5/28) 5/31) MALE FEMALE 18-34 35-49 50-64 65+ $50k $75k $75k+ GOP DEM IND/OTH
(A) (B) (C) (D) (E) (F) (G) (H) (I) (J) (K) (L) (M) (N) (O) (P) (Q) (R) (S) (T) (U) (V) (W) (X) (Y)
- - - - - - - - - - - - 1266 737 529 280 349 315 322 363 280 583 498 423 345Unweighted Base-** -** -** -** -** -** -** -** -** -** -** -** 1246 635 612 301 375 291 279 288 218 705 462 444 340Weighted Base
- - - - - - - - - - - - 345 177 168 126 125 64 29 77 52 203 140 122 83- - - - - - - - - - - - 28% 28% 27% 42% 33% 22% 11% 27% 24% 29% 30% 27% 24%
qRS RS S
Strongly/Somewhat Agree(Net)
- - - - - - - - - - - - 128 64 64 47 55 20 7 31 28 69 47 42 39- - - - - - - - - - - - 10% 10% 11% 16% 15% 7% 2% 11% 13% 10% 10% 9% 11%
RS RS S
Strongly agree
- - - - - - - - - - - - 217 113 103 79 71 44 23 46 24 134 92 80 44- - - - - - - - - - - - 17% 18% 17% 26% 19% 15% 8% 16% 11% 19% 20% 18% 13%
qRS S S U Y
Somewhat agree
- - - - - - - - - - - - 901 458 444 175 250 227 249 211 166 502 323 322 257- - - - - - - - - - - - 72% 72% 73% 58% 67% 78% 89% 73% 76% 71% 70% 73% 76%
p PQ PQR
Strongly/SomewhatDisagree (Net)
- - - - - - - - - - - - 270 135 135 77 76 53 63 74 50 141 104 91 74- - - - - - - - - - - - 22% 21% 22% 26% 20% 18% 23% 26% 23% 20% 23% 21% 22%
r v
Somewhat disagree
- - - - - - - - - - - - 632 322 309 98 174 174 186 137 117 362 219 231 182- - - - - - - - - - - - 51% 51% 51% 32% 46% 60% 67% 48% 53% 51% 47% 52% 54%
P PQ PQ
Strongly disagree
- - - - - - - - - - - - 1246 635 612 301 375 291 279 288 218 705 462 444 340- - - - - - - - - - - - 100% 100% 100% 100% 100% 100% 100% 100% 100% 100% 100% 100% 100%
Sigma
__________________________________________________________________________________________________________________Proportions/Means: Columns Tested (5%, 10% risk level) - A/B/C/D/E/F/G/H/I/J/K/L/M - N/O - P/Q/R/S - T/U/V - W/X/YOverlap formulae used. ** very small base (under 30) ineligible for sig testing

Page 45Fielding Period: March 14 - May 31, 2020COVID-19Weighted To The U.S. General Adult Population - Propensity
2 Jun 2020Table 43GEN05_8 How much do you agree or disagree with the following statements about how your spouse/partner is responding to the COVID-19 pandemic?
They are vigilant about abiding by the CDC COVID-19 guidelines
Base: Currently In A Relationship
Waves Gender Age Income Political
Wave 2 Wave 3 Wave 4 Wave 5 Wave 6 Wave 7 Wave 8 Wave 9 Wave 10 Wave 11 Wave 12 Wave 13 Wave 14 Less(3/14 - (3/17 - (3/21 - (3/28 - (4/3 - (4/11- (4/18- (4/25- (5/1 - (5/8 - (5/15 - (5/27 - (5/29 - than $50k -3/15) 3/18) 3/23) 3/30) 4/5) 4/13) 4/20) 4/27) 5/3) 5/10) 5/17) 5/28) 5/31) MALE FEMALE 18-34 35-49 50-64 65+ $50k $75k $75k+ GOP DEM IND/OTH
(A) (B) (C) (D) (E) (F) (G) (H) (I) (J) (K) (L) (M) (N) (O) (P) (Q) (R) (S) (T) (U) (V) (W) (X) (Y)
- - - - - - - - - - - - 1266 737 529 280 349 315 322 363 280 583 498 423 345Unweighted Base-** -** -** -** -** -** -** -** -** -** -** -** 1246 635 612 301 375 291 279 288 218 705 462 444 340Weighted Base
- - - - - - - - - - - - 830 439 391 177 268 189 196 174 154 481 290 322 219- - - - - - - - - - - - 67% 69% 64% 59% 71% 65% 70% 60% 71% 68% 63% 73% 64%
P P T T Wy
Strongly/Somewhat Agree(Net)
- - - - - - - - - - - - 453 242 211 85 151 103 115 81 76 283 153 179 121- - - - - - - - - - - - 36% 38% 35% 28% 40% 36% 41% 28% 35% 40% 33% 40% 36%
P P T w
Strongly agree
- - - - - - - - - - - - 377 197 179 92 117 86 82 92 78 198 136 143 97- - - - - - - - - - - - 30% 31% 29% 31% 31% 29% 29% 32% 36% 28% 30% 32% 29%
v
Somewhat agree
- - - - - - - - - - - - 416 195 221 124 107 102 82 114 64 224 173 121 122- - - - - - - - - - - - 33% 31% 36% 41% 29% 35% 30% 40% 29% 32% 37% 27% 36%
QS UV X x
Strongly/SomewhatDisagree (Net)
- - - - - - - - - - - - 225 109 116 75 59 57 35 51 33 129 97 65 63- - - - - - - - - - - - 18% 17% 19% 25% 16% 20% 12% 18% 15% 18% 21% 15% 19%
QS s x
Somewhat disagree
- - - - - - - - - - - - 191 86 105 50 49 45 48 63 31 95 76 56 59- - - - - - - - - - - - 15% 14% 17% 16% 13% 15% 17% 22% 14% 13% 17% 13% 17%
uV
Strongly disagree
- - - - - - - - - - - - 1246 635 612 301 375 291 279 288 218 705 462 444 340- - - - - - - - - - - - 100% 100% 100% 100% 100% 100% 100% 100% 100% 100% 100% 100% 100%
Sigma
__________________________________________________________________________________________________________________Proportions/Means: Columns Tested (5%, 10% risk level) - A/B/C/D/E/F/G/H/I/J/K/L/M - N/O - P/Q/R/S - T/U/V - W/X/YOverlap formulae used. ** very small base (under 30) ineligible for sig testing
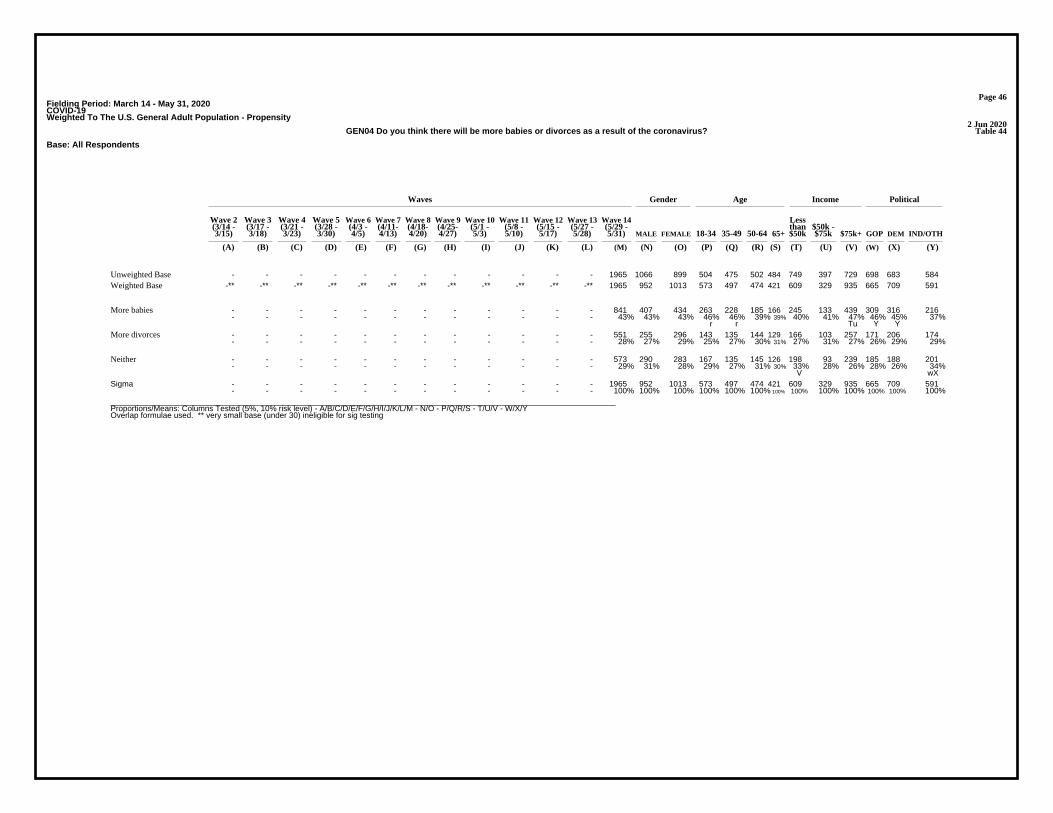
Page 46Fielding Period: March 14 - May 31, 2020COVID-19Weighted To The U.S. General Adult Population - Propensity
2 Jun 2020Table 44GEN04 Do you think there will be more babies or divorces as a result of the coronavirus?
Base: All Respondents
Waves Gender Age Income Political
Wave 2 Wave 3 Wave 4 Wave 5 Wave 6 Wave 7 Wave 8 Wave 9 Wave 10 Wave 11 Wave 12 Wave 13 Wave 14 Less(3/14 - (3/17 - (3/21 - (3/28 - (4/3 - (4/11- (4/18- (4/25- (5/1 - (5/8 - (5/15 - (5/27 - (5/29 - than $50k -3/15) 3/18) 3/23) 3/30) 4/5) 4/13) 4/20) 4/27) 5/3) 5/10) 5/17) 5/28) 5/31) MALE FEMALE 18-34 35-49 50-64 65+ $50k $75k $75k+ GOP DEM IND/OTH
(A) (B) (C) (D) (E) (F) (G) (H) (I) (J) (K) (L) (M) (N) (O) (P) (Q) (R) (S) (T) (U) (V) (W) (X) (Y)
- - - - - - - - - - - - 1965 1066 899 504 475 502 484 749 397 729 698 683 584Unweighted Base-** -** -** -** -** -** -** -** -** -** -** -** 1965 952 1013 573 497 474 421 609 329 935 665 709 591Weighted Base
- - - - - - - - - - - - 841 407 434 263 228 185 166 245 133 439 309 316 216- - - - - - - - - - - - 43% 43% 43% 46% 46% 39% 39% 40% 41% 47% 46% 45% 37%
r r Tu Y Y
More babies
- - - - - - - - - - - - 551 255 296 143 135 144 129 166 103 257 171 206 174- - - - - - - - - - - - 28% 27% 29% 25% 27% 30% 31% 27% 31% 27% 26% 29% 29%
More divorces
- - - - - - - - - - - - 573 290 283 167 135 145 126 198 93 239 185 188 201- - - - - - - - - - - - 29% 31% 28% 29% 27% 31% 30% 33% 28% 26% 28% 26% 34%
V wX
Neither
- - - - - - - - - - - - 1965 952 1013 573 497 474 421 609 329 935 665 709 591- - - - - - - - - - - - 100% 100% 100% 100% 100% 100% 100% 100% 100% 100% 100% 100% 100%
Sigma
__________________________________________________________________________________________________________________Proportions/Means: Columns Tested (5%, 10% risk level) - A/B/C/D/E/F/G/H/I/J/K/L/M - N/O - P/Q/R/S - T/U/V - W/X/YOverlap formulae used. ** very small base (under 30) ineligible for sig testing
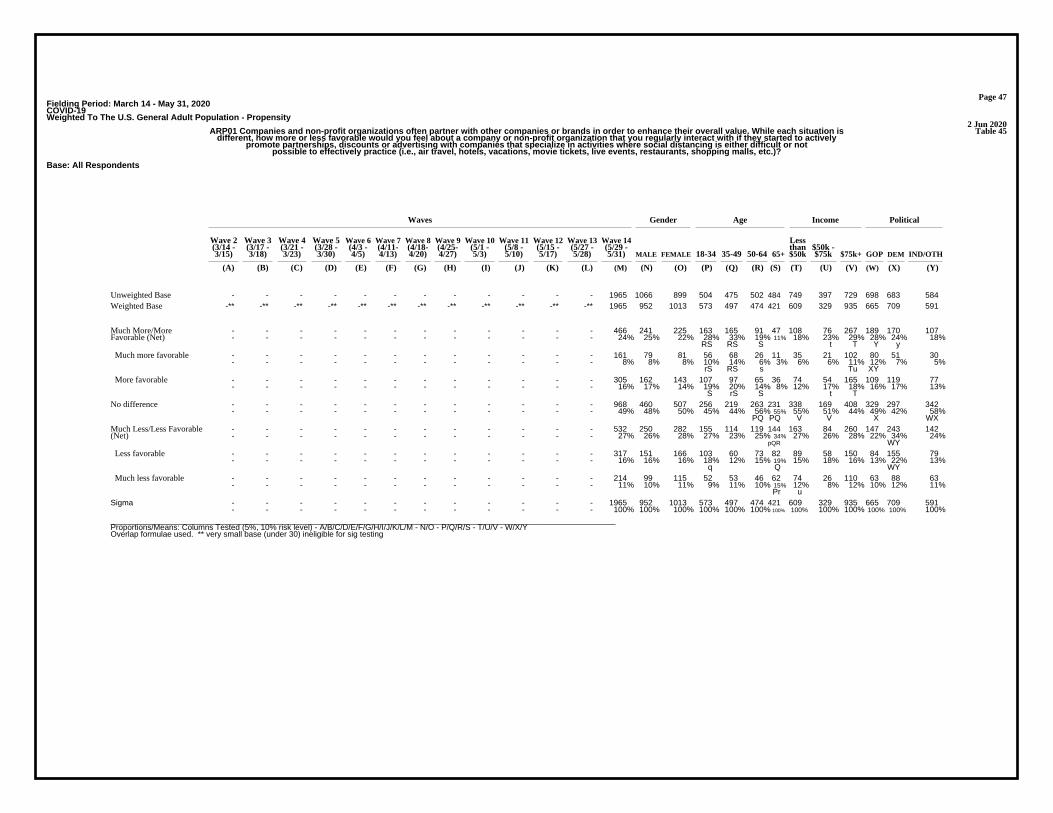
Page 47Fielding Period: March 14 - May 31, 2020COVID-19Weighted To The U.S. General Adult Population - Propensity
2 Jun 2020Table 45ARP01 Companies and non-profit organizations often partner with other companies or brands in order to enhance their overall value. While each situation is
different, how more or less favorable would you feel about a company or non-profit organization that you regularly interact with if they started to activelypromote partnerships, discounts or advertising with companies that specialize in activities where social distancing is either difficult or not
possible to effectively practice (i.e., air travel, hotels, vacations, movie tickets, live events, restaurants, shopping malls, etc.)?
Base: All Respondents
Waves Gender Age Income Political
Wave 2 Wave 3 Wave 4 Wave 5 Wave 6 Wave 7 Wave 8 Wave 9 Wave 10 Wave 11 Wave 12 Wave 13 Wave 14 Less(3/14 - (3/17 - (3/21 - (3/28 - (4/3 - (4/11- (4/18- (4/25- (5/1 - (5/8 - (5/15 - (5/27 - (5/29 - than $50k -3/15) 3/18) 3/23) 3/30) 4/5) 4/13) 4/20) 4/27) 5/3) 5/10) 5/17) 5/28) 5/31) MALE FEMALE 18-34 35-49 50-64 65+ $50k $75k $75k+ GOP DEM IND/OTH
(A) (B) (C) (D) (E) (F) (G) (H) (I) (J) (K) (L) (M) (N) (O) (P) (Q) (R) (S) (T) (U) (V) (W) (X) (Y)
- - - - - - - - - - - - 1965 1066 899 504 475 502 484 749 397 729 698 683 584Unweighted Base-** -** -** -** -** -** -** -** -** -** -** -** 1965 952 1013 573 497 474 421 609 329 935 665 709 591Weighted Base
- - - - - - - - - - - - 466 241 225 163 165 91 47 108 76 267 189 170 107- - - - - - - - - - - - 24% 25% 22% 28% 33% 19% 11% 18% 23% 29% 28% 24% 18%
RS RS S t T Y y
Much More/MoreFavorable (Net)
- - - - - - - - - - - - 161 79 81 56 68 26 11 35 21 102 80 51 30- - - - - - - - - - - - 8% 8% 8% 10% 14% 6% 3% 6% 6% 11% 12% 7% 5%
rS RS s Tu XY
Much more favorable
- - - - - - - - - - - - 305 162 143 107 97 65 36 74 54 165 109 119 77- - - - - - - - - - - - 16% 17% 14% 19% 20% 14% 8% 12% 17% 18% 16% 17% 13%
S rS S t T
More favorable
- - - - - - - - - - - - 968 460 507 256 219 263 231 338 169 408 329 297 342- - - - - - - - - - - - 49% 48% 50% 45% 44% 56% 55% 55% 51% 44% 49% 42% 58%
PQ PQ V V X WX
No difference
- - - - - - - - - - - - 532 250 282 155 114 119 144 163 84 260 147 243 142- - - - - - - - - - - - 27% 26% 28% 27% 23% 25% 34% 27% 26% 28% 22% 34% 24%
pQR WY
Much Less/Less Favorable(Net)
- - - - - - - - - - - - 317 151 166 103 60 73 82 89 58 150 84 155 79- - - - - - - - - - - - 16% 16% 16% 18% 12% 15% 19% 15% 18% 16% 13% 22% 13%
q Q WY
Less favorable
- - - - - - - - - - - - 214 99 115 52 53 46 62 74 26 110 63 88 63- - - - - - - - - - - - 11% 10% 11% 9% 11% 10% 15% 12% 8% 12% 10% 12% 11%
Pr u
Much less favorable
- - - - - - - - - - - - 1965 952 1013 573 497 474 421 609 329 935 665 709 591- - - - - - - - - - - - 100% 100% 100% 100% 100% 100% 100% 100% 100% 100% 100% 100% 100%
Sigma
__________________________________________________________________________________________________________________Proportions/Means: Columns Tested (5%, 10% risk level) - A/B/C/D/E/F/G/H/I/J/K/L/M - N/O - P/Q/R/S - T/U/V - W/X/YOverlap formulae used. ** very small base (under 30) ineligible for sig testing
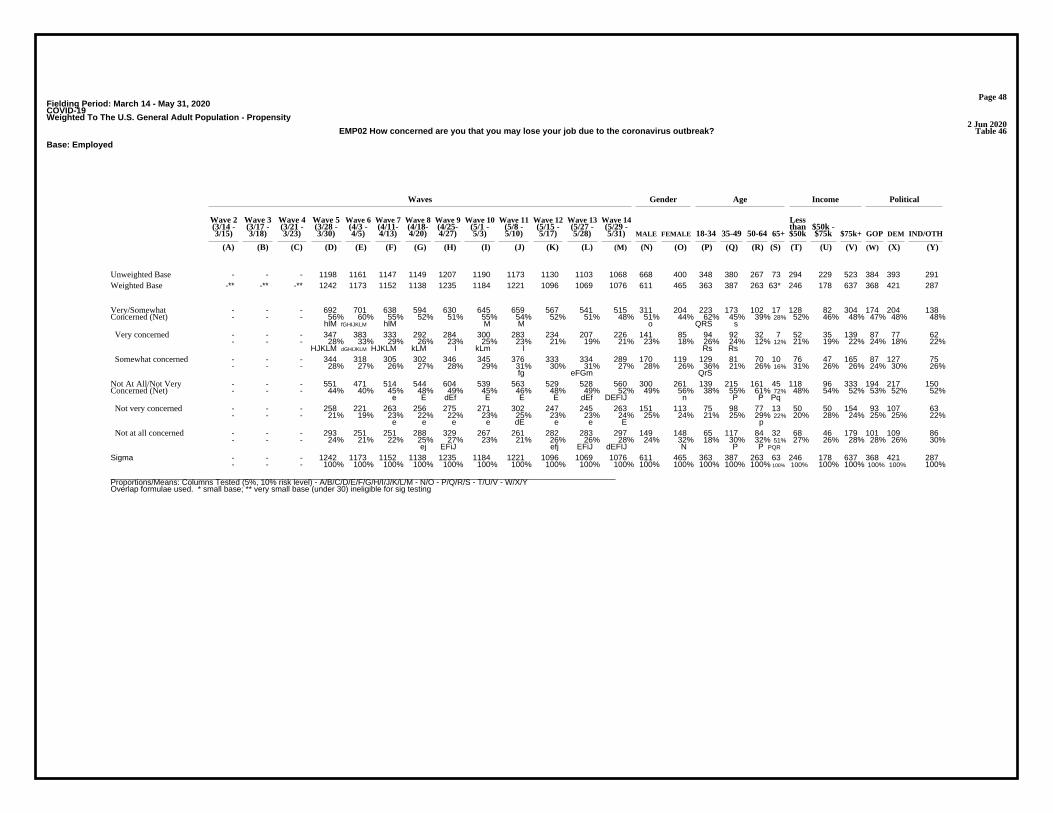
Page 48Fielding Period: March 14 - May 31, 2020COVID-19Weighted To The U.S. General Adult Population - Propensity
2 Jun 2020Table 46EMP02 How concerned are you that you may lose your job due to the coronavirus outbreak?
Base: Employed
Waves Gender Age Income Political
Wave 2 Wave 3 Wave 4 Wave 5 Wave 6 Wave 7 Wave 8 Wave 9 Wave 10 Wave 11 Wave 12 Wave 13 Wave 14 Less(3/14 - (3/17 - (3/21 - (3/28 - (4/3 - (4/11- (4/18- (4/25- (5/1 - (5/8 - (5/15 - (5/27 - (5/29 - than $50k -3/15) 3/18) 3/23) 3/30) 4/5) 4/13) 4/20) 4/27) 5/3) 5/10) 5/17) 5/28) 5/31) MALE FEMALE 18-34 35-49 50-64 65+ $50k $75k $75k+ GOP DEM IND/OTH
(A) (B) (C) (D) (E) (F) (G) (H) (I) (J) (K) (L) (M) (N) (O) (P) (Q) (R) (S) (T) (U) (V) (W) (X) (Y)
- - - 1198 1161 1147 1149 1207 1190 1173 1130 1103 1068 668 400 348 380 267 73 294 229 523 384 393 291Unweighted Base-** -** -** 1242 1173 1152 1138 1235 1184 1221 1096 1069 1076 611 465 363 387 263 63* 246 178 637 368 421 287Weighted Base
- - - 692 701 638 594 630 645 659 567 541 515 311 204 223 173 102 17 128 82 304 174 204 138- - - 56% 60% 55% 52% 51% 55% 54% 52% 51% 48% 51% 44% 62% 45% 39% 28% 52% 46% 48% 47% 48% 48%
hlM fGHIJKLM hlM M M o QRS s
Very/SomewhatConcerned (Net)
- - - 347 383 333 292 284 300 283 234 207 226 141 85 94 92 32 7 52 35 139 87 77 62- - - 28% 33% 29% 26% 23% 25% 23% 21% 19% 21% 23% 18% 26% 24% 12% 12% 21% 19% 22% 24% 18% 22%
HJKLM dGHIJKLM HJKLM kLM l kLm l Rs Rs
Very concerned
- - - 344 318 305 302 346 345 376 333 334 289 170 119 129 81 70 10 76 47 165 87 127 75- - - 28% 27% 26% 27% 28% 29% 31% 30% 31% 27% 28% 26% 36% 21% 26% 16% 31% 26% 26% 24% 30% 26%
fg eFGm QrS
Somewhat concerned
- - - 551 471 514 544 604 539 563 529 528 560 300 261 139 215 161 45 118 96 333 194 217 150- - - 44% 40% 45% 48% 49% 45% 46% 48% 49% 52% 49% 56% 38% 55% 61% 72% 48% 54% 52% 53% 52% 52%
e E dEf E E E dEf DEFIJ n P P Pq
Not At All/Not VeryConcerned (Net)
- - - 258 221 263 256 275 271 302 247 245 263 151 113 75 98 77 13 50 50 154 93 107 63- - - 21% 19% 23% 22% 22% 23% 25% 23% 23% 24% 25% 24% 21% 25% 29% 22% 20% 28% 24% 25% 25% 22%
e e e e dE e e E p
Not very concerned
- - - 293 251 251 288 329 267 261 282 283 297 149 148 65 117 84 32 68 46 179 101 109 86- - - 24% 21% 22% 25% 27% 23% 21% 26% 26% 28% 24% 32% 18% 30% 32% 51% 27% 26% 28% 28% 26% 30%
ej EFiJ efj EFiJ dEFIJ N P P PQR
Not at all concerned
- - - 1242 1173 1152 1138 1235 1184 1221 1096 1069 1076 611 465 363 387 263 63 246 178 637 368 421 287- - - 100% 100% 100% 100% 100% 100% 100% 100% 100% 100% 100% 100% 100% 100% 100% 100% 100% 100% 100% 100% 100% 100%
Sigma
__________________________________________________________________________________________________________________Proportions/Means: Columns Tested (5%, 10% risk level) - A/B/C/D/E/F/G/H/I/J/K/L/M - N/O - P/Q/R/S - T/U/V - W/X/YOverlap formulae used. * small base; ** very small base (under 30) ineligible for sig testing
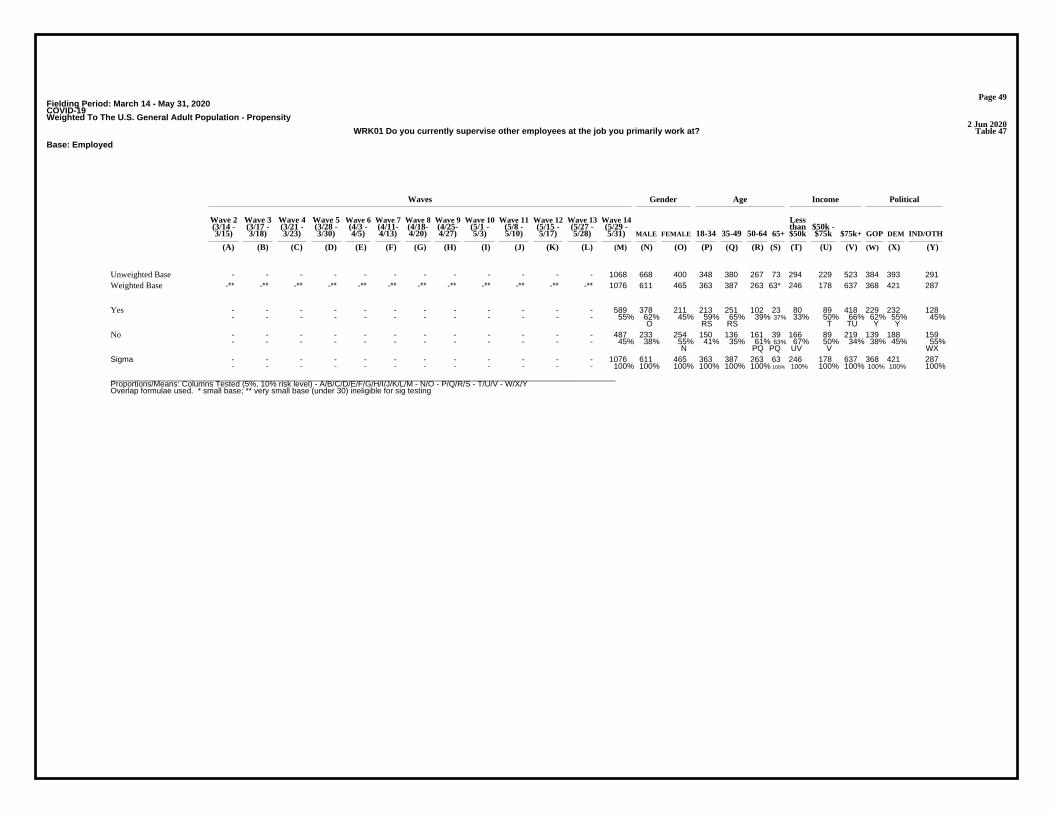
Page 49Fielding Period: March 14 - May 31, 2020COVID-19Weighted To The U.S. General Adult Population - Propensity
2 Jun 2020Table 47WRK01 Do you currently supervise other employees at the job you primarily work at?
Base: Employed
Waves Gender Age Income Political
Wave 2 Wave 3 Wave 4 Wave 5 Wave 6 Wave 7 Wave 8 Wave 9 Wave 10 Wave 11 Wave 12 Wave 13 Wave 14 Less(3/14 - (3/17 - (3/21 - (3/28 - (4/3 - (4/11- (4/18- (4/25- (5/1 - (5/8 - (5/15 - (5/27 - (5/29 - than $50k -3/15) 3/18) 3/23) 3/30) 4/5) 4/13) 4/20) 4/27) 5/3) 5/10) 5/17) 5/28) 5/31) MALE FEMALE 18-34 35-49 50-64 65+ $50k $75k $75k+ GOP DEM IND/OTH
(A) (B) (C) (D) (E) (F) (G) (H) (I) (J) (K) (L) (M) (N) (O) (P) (Q) (R) (S) (T) (U) (V) (W) (X) (Y)
- - - - - - - - - - - - 1068 668 400 348 380 267 73 294 229 523 384 393 291Unweighted Base-** -** -** -** -** -** -** -** -** -** -** -** 1076 611 465 363 387 263 63* 246 178 637 368 421 287Weighted Base
- - - - - - - - - - - - 589 378 211 213 251 102 23 80 89 418 229 232 128- - - - - - - - - - - - 55% 62% 45% 59% 65% 39% 37% 33% 50% 66% 62% 55% 45%
O RS RS T TU Y Y
Yes
- - - - - - - - - - - - 487 233 254 150 136 161 39 166 89 219 139 188 159- - - - - - - - - - - - 45% 38% 55% 41% 35% 61% 63% 67% 50% 34% 38% 45% 55%
N PQ PQ UV V WX
No
- - - - - - - - - - - - 1076 611 465 363 387 263 63 246 178 637 368 421 287- - - - - - - - - - - - 100% 100% 100% 100% 100% 100% 100% 100% 100% 100% 100% 100% 100%
Sigma
__________________________________________________________________________________________________________________Proportions/Means: Columns Tested (5%, 10% risk level) - A/B/C/D/E/F/G/H/I/J/K/L/M - N/O - P/Q/R/S - T/U/V - W/X/YOverlap formulae used. * small base; ** very small base (under 30) ineligible for sig testing

Page 50Fielding Period: March 14 - May 31, 2020COVID-19Weighted To The U.S. General Adult Population - Propensity
2 Jun 2020Table 48WRK02 How willing would you be to work the same hours you typically do, but work a 4 day work week instead of a 5 day work week?
Base: Employed
Waves Gender Age Income Political
Wave 2 Wave 3 Wave 4 Wave 5 Wave 6 Wave 7 Wave 8 Wave 9 Wave 10 Wave 11 Wave 12 Wave 13 Wave 14 Less(3/14 - (3/17 - (3/21 - (3/28 - (4/3 - (4/11- (4/18- (4/25- (5/1 - (5/8 - (5/15 - (5/27 - (5/29 - than $50k -3/15) 3/18) 3/23) 3/30) 4/5) 4/13) 4/20) 4/27) 5/3) 5/10) 5/17) 5/28) 5/31) MALE FEMALE 18-34 35-49 50-64 65+ $50k $75k $75k+ GOP DEM IND/OTH
(A) (B) (C) (D) (E) (F) (G) (H) (I) (J) (K) (L) (M) (N) (O) (P) (Q) (R) (S) (T) (U) (V) (W) (X) (Y)
- - - - - - - - - - - - 1068 668 400 348 380 267 73 294 229 523 384 393 291Unweighted Base-** -** -** -** -** -** -** -** -** -** -** -** 1076 611 465 363 387 263 63* 246 178 637 368 421 287Weighted Base
- - - - - - - - - - - - 878 487 392 283 322 222 52 191 155 522 295 369 215- - - - - - - - - - - - 82% 80% 84% 78% 83% 84% 82% 78% 87% 82% 80% 88% 75%
T WY
Very/Somewhat Willing(Net)
- - - - - - - - - - - - 506 282 224 139 186 144 37 106 92 303 175 209 121- - - - - - - - - - - - 47% 46% 48% 38% 48% 55% 59% 43% 52% 48% 48% 50% 42%
P P P
Very willing
- - - - - - - - - - - - 373 205 168 144 136 78 15 85 63 220 120 160 93- - - - - - - - - - - - 35% 34% 36% 40% 35% 29% 24% 34% 35% 34% 33% 38% 32%
Rs
Somewhat willing
- - - - - - - - - - - - 198 124 73 80 65 42 11 55 23 115 73 52 73- - - - - - - - - - - - 18% 20% 16% 22% 17% 16% 18% 22% 13% 18% 20% 12% 25%
U X X
Not At All/Not VeryWilling (Net)
- - - - - - - - - - - - 137 82 55 63 43 30 2 39 19 75 47 37 53- - - - - - - - - - - - 13% 13% 12% 17% 11% 11% 3% 16% 11% 12% 13% 9% 18%
qS s X
Not very willing
- - - - - - - - - - - - 61 42 18 17 22 12 9 16 4 40 26 14 20- - - - - - - - - - - - 6% 7% 4% 5% 6% 4% 15% 7% 2% 6% 7% 3% 7%
PQR u u x
Not at all willing
- - - - - - - - - - - - 1076 611 465 363 387 263 63 246 178 637 368 421 287- - - - - - - - - - - - 100% 100% 100% 100% 100% 100% 100% 100% 100% 100% 100% 100% 100%
Sigma
__________________________________________________________________________________________________________________Proportions/Means: Columns Tested (5%, 10% risk level) - A/B/C/D/E/F/G/H/I/J/K/L/M - N/O - P/Q/R/S - T/U/V - W/X/YOverlap formulae used. * small base; ** very small base (under 30) ineligible for sig testing

Page 51Fielding Period: March 14 - May 31, 2020COVID-19Weighted To The U.S. General Adult Population - Propensity
2 Jun 2020Table 49WRK03 Do you believe you would be more or less productive if you worked a 4 day work week instead of a 5 day work week?
Base: Employed
Waves Gender Age Income Political
Wave 2 Wave 3 Wave 4 Wave 5 Wave 6 Wave 7 Wave 8 Wave 9 Wave 10 Wave 11 Wave 12 Wave 13 Wave 14 Less(3/14 - (3/17 - (3/21 - (3/28 - (4/3 - (4/11- (4/18- (4/25- (5/1 - (5/8 - (5/15 - (5/27 - (5/29 - than $50k -3/15) 3/18) 3/23) 3/30) 4/5) 4/13) 4/20) 4/27) 5/3) 5/10) 5/17) 5/28) 5/31) MALE FEMALE 18-34 35-49 50-64 65+ $50k $75k $75k+ GOP DEM IND/OTH
(A) (B) (C) (D) (E) (F) (G) (H) (I) (J) (K) (L) (M) (N) (O) (P) (Q) (R) (S) (T) (U) (V) (W) (X) (Y)
- - - - - - - - - - - - 1068 668 400 348 380 267 73 294 229 523 384 393 291Unweighted Base-** -** -** -** -** -** -** -** -** -** -** -** 1076 611 465 363 387 263 63* 246 178 637 368 421 287Weighted Base
- - - - - - - - - - - - 762 413 349 240 283 192 47 163 133 456 259 312 191- - - - - - - - - - - - 71% 68% 75% 66% 73% 73% 75% 66% 75% 72% 70% 74% 66%
N t y
Much/Somewhat MoreProductive (Net)
- - - - - - - - - - - - 299 172 126 102 114 69 14 58 52 186 115 127 57- - - - - - - - - - - - 28% 28% 27% 28% 29% 26% 22% 24% 29% 29% 31% 30% 20%
Y Y
Much more productive
- - - - - - - - - - - - 463 241 223 138 169 123 33 105 81 270 144 186 134- - - - - - - - - - - - 43% 39% 48% 38% 44% 47% 53% 43% 46% 42% 39% 44% 47%
N p p
Somewhat more productive
- - - - - - - - - - - - 314 198 116 123 104 71 16 83 45 181 109 108 96- - - - - - - - - - - - 29% 32% 25% 34% 27% 27% 25% 34% 25% 28% 30% 26% 34%
O u x
Much/Somewhat LessProductive (Net)
- - - - - - - - - - - - 243 151 92 90 85 58 9 56 39 144 75 92 76- - - - - - - - - - - - 23% 25% 20% 25% 22% 22% 15% 23% 22% 23% 20% 22% 26%
Somewhat less productive
- - - - - - - - - - - - 71 47 24 32 19 13 6 27 6 37 34 16 21- - - - - - - - - - - - 7% 8% 5% 9% 5% 5% 10% 11% 3% 6% 9% 4% 7%
UV X
Much less productive
- - - - - - - - - - - - 1076 611 465 363 387 263 63 246 178 637 368 421 287- - - - - - - - - - - - 100% 100% 100% 100% 100% 100% 100% 100% 100% 100% 100% 100% 100%
Sigma
__________________________________________________________________________________________________________________Proportions/Means: Columns Tested (5%, 10% risk level) - A/B/C/D/E/F/G/H/I/J/K/L/M - N/O - P/Q/R/S - T/U/V - W/X/YOverlap formulae used. * small base; ** very small base (under 30) ineligible for sig testing

Page 52Fielding Period: March 14 - May 31, 2020COVID-19Weighted To The U.S. General Adult Population - Propensity
2 Jun 2020Table 50Q9 Do you think your income in 2020 will be lower, higher or about the same as it was in 2019?
Base: All Respondents
Waves Gender Age Income Political
Wave 2 Wave 3 Wave 4 Wave 5 Wave 6 Wave 7 Wave 8 Wave 9 Wave 10 Wave 11 Wave 12 Wave 13 Wave 14 Less(3/14 - (3/17 - (3/21 - (3/28 - (4/3 - (4/11- (4/18- (4/25- (5/1 - (5/8 - (5/15 - (5/27 - (5/29 - than $50k -3/15) 3/18) 3/23) 3/30) 4/5) 4/13) 4/20) 4/27) 5/3) 5/10) 5/17) 5/28) 5/31) MALE FEMALE 18-34 35-49 50-64 65+ $50k $75k $75k+ GOP DEM IND/OTH
(A) (B) (C) (D) (E) (F) (G) (H) (I) (J) (K) (L) (M) (N) (O) (P) (Q) (R) (S) (T) (U) (V) (W) (X) (Y)
- - - 2016 1993 2013 2029 - - - - - 1965 1066 899 504 475 502 484 749 397 729 698 683 584Unweighted Base-** -** -** 2016 1993 2013 2029 -** -** -** -** -** 1965 952 1013 573 497 474 421 609 329 935 665 709 591Weighted Base
- - - 864 816 895 921 - - - - - 909 389 520 199 204 250 257 302 154 390 304 304 301- - - 43% 41% 44% 45% - - - - - 46% 41% 51% 35% 41% 53% 61% 50% 47% 42% 46% 43% 51%
e E dE N PQ PQR V X
About the same
- - - 791 862 826 726 - - - - - 625 304 321 188 153 164 120 185 104 310 194 229 202- - - 39% 43% 41% 36% - - - - - 32% 32% 32% 33% 31% 35% 29% 30% 32% 33% 29% 32% 34%
gM DGM GM M
Lower
- - - 362 315 291 382 - - - - - 431 258 173 187 140 60 44 122 71 234 167 176 88- - - 18% 16% 14% 19% - - - - - 22% 27% 17% 33% 28% 13% 10% 20% 22% 25% 25% 25% 15%
F EF DEFg O RS RS t Y Y
Higher
- - - 2016 1993 2013 2029 - - - - - 1965 952 1013 573 497 474 421 609 329 935 665 709 591- - - 100% 100% 100% 100% - - - - - 100% 100% 100% 100% 100% 100% 100% 100% 100% 100% 100% 100% 100%
Sigma
__________________________________________________________________________________________________________________Proportions/Means: Columns Tested (5%, 10% risk level) - A/B/C/D/E/F/G/H/I/J/K/L/M - N/O - P/Q/R/S - T/U/V - W/X/YOverlap formulae used. ** very small base (under 30) ineligible for sig testing
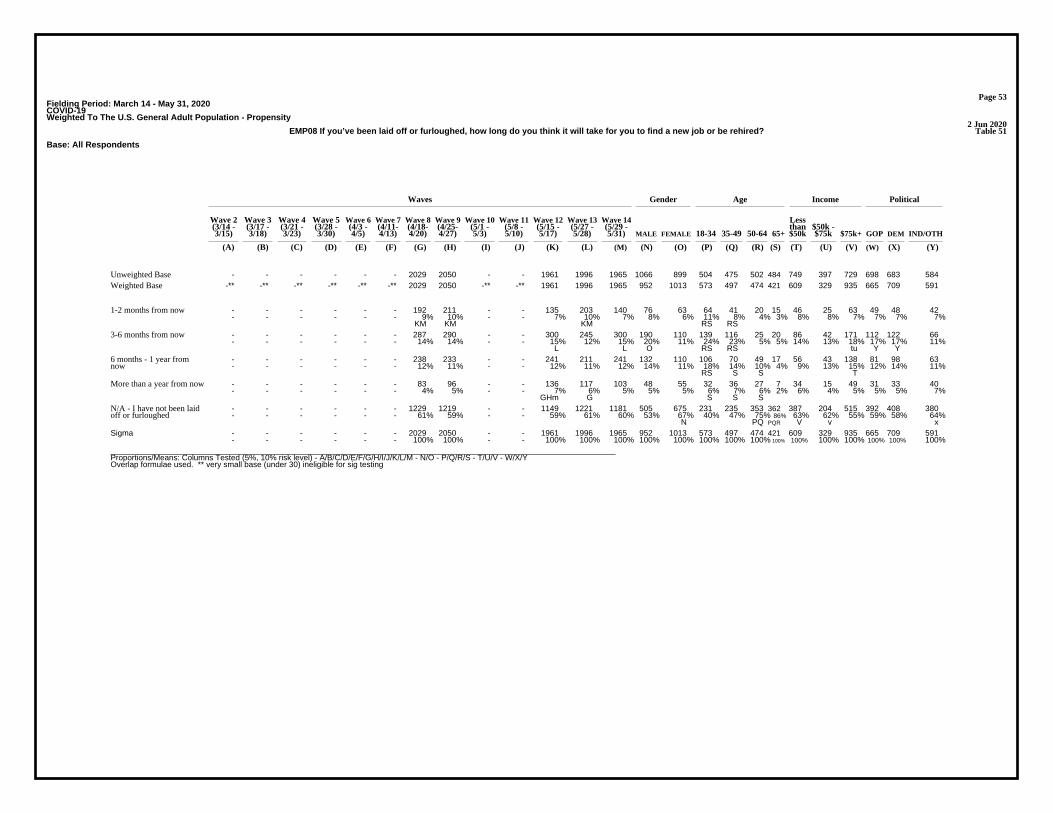
Page 53Fielding Period: March 14 - May 31, 2020COVID-19Weighted To The U.S. General Adult Population - Propensity
2 Jun 2020Table 51EMP08 If you’ve been laid off or furloughed, how long do you think it will take for you to find a new job or be rehired?
Base: All Respondents
Waves Gender Age Income Political
Wave 2 Wave 3 Wave 4 Wave 5 Wave 6 Wave 7 Wave 8 Wave 9 Wave 10 Wave 11 Wave 12 Wave 13 Wave 14 Less(3/14 - (3/17 - (3/21 - (3/28 - (4/3 - (4/11- (4/18- (4/25- (5/1 - (5/8 - (5/15 - (5/27 - (5/29 - than $50k -3/15) 3/18) 3/23) 3/30) 4/5) 4/13) 4/20) 4/27) 5/3) 5/10) 5/17) 5/28) 5/31) MALE FEMALE 18-34 35-49 50-64 65+ $50k $75k $75k+ GOP DEM IND/OTH
(A) (B) (C) (D) (E) (F) (G) (H) (I) (J) (K) (L) (M) (N) (O) (P) (Q) (R) (S) (T) (U) (V) (W) (X) (Y)
- - - - - - 2029 2050 - - 1961 1996 1965 1066 899 504 475 502 484 749 397 729 698 683 584Unweighted Base-** -** -** -** -** -** 2029 2050 -** -** 1961 1996 1965 952 1013 573 497 474 421 609 329 935 665 709 591Weighted Base
- - - - - - 192 211 - - 135 203 140 76 63 64 41 20 15 46 25 63 49 48 42- - - - - - 9% 10% - - 7% 10% 7% 8% 6% 11% 8% 4% 3% 8% 8% 7% 7% 7% 7%
KM KM KM RS RS
1-2 months from now
- - - - - - 287 290 - - 300 245 300 190 110 139 116 25 20 86 42 171 112 122 66- - - - - - 14% 14% - - 15% 12% 15% 20% 11% 24% 23% 5% 5% 14% 13% 18% 17% 17% 11%
L L O RS RS tu Y Y
3-6 months from now
- - - - - - 238 233 - - 241 211 241 132 110 106 70 49 17 56 43 138 81 98 63- - - - - - 12% 11% - - 12% 11% 12% 14% 11% 18% 14% 10% 4% 9% 13% 15% 12% 14% 11%
RS S S T
6 months - 1 year fromnow
- - - - - - 83 96 - - 136 117 103 48 55 32 36 27 7 34 15 49 31 33 40- - - - - - 4% 5% - - 7% 6% 5% 5% 5% 6% 7% 6% 2% 6% 4% 5% 5% 5% 7%
GHm G S S S
More than a year from now
- - - - - - 1229 1219 - - 1149 1221 1181 505 675 231 235 353 362 387 204 515 392 408 380- - - - - - 61% 59% - - 59% 61% 60% 53% 67% 40% 47% 75% 86% 63% 62% 55% 59% 58% 64%
N PQ PQR V v x
N/A - I have not been laidoff or furloughed
- - - - - - 2029 2050 - - 1961 1996 1965 952 1013 573 497 474 421 609 329 935 665 709 591- - - - - - 100% 100% - - 100% 100% 100% 100% 100% 100% 100% 100% 100% 100% 100% 100% 100% 100% 100%
Sigma
__________________________________________________________________________________________________________________Proportions/Means: Columns Tested (5%, 10% risk level) - A/B/C/D/E/F/G/H/I/J/K/L/M - N/O - P/Q/R/S - T/U/V - W/X/YOverlap formulae used. ** very small base (under 30) ineligible for sig testing
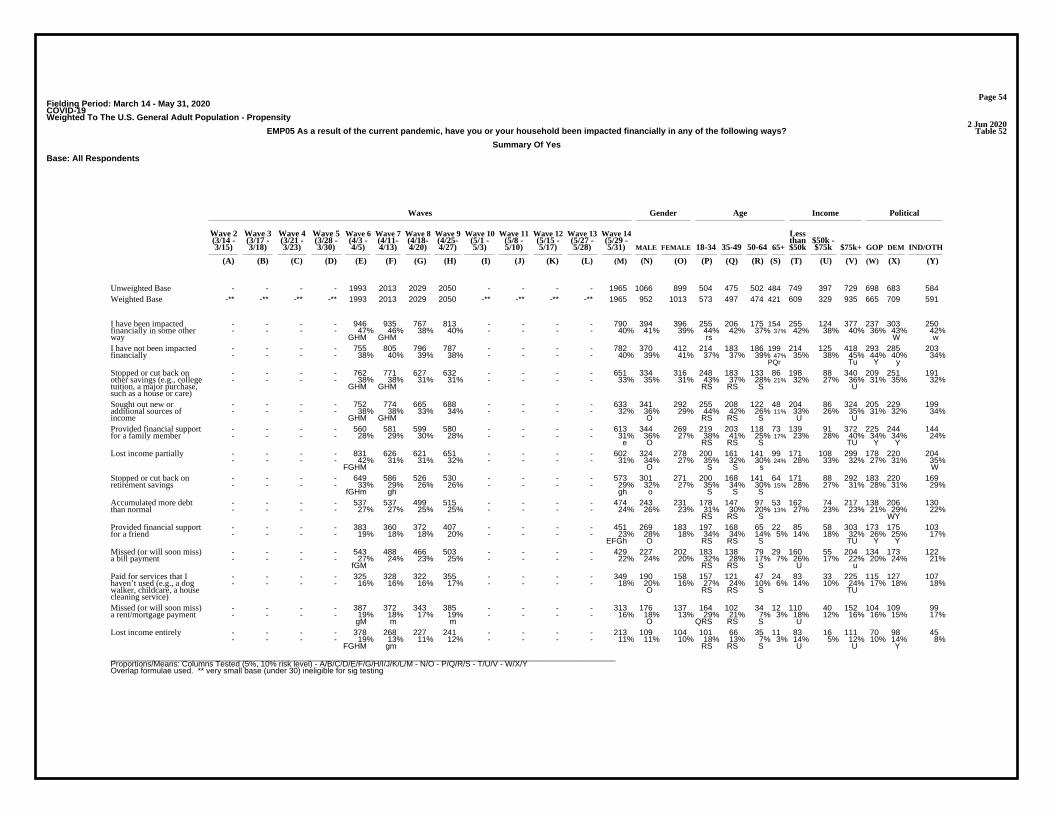
Page 54Fielding Period: March 14 - May 31, 2020COVID-19Weighted To The U.S. General Adult Population - Propensity
2 Jun 2020Table 52EMP05 As a result of the current pandemic, have you or your household been impacted financially in any of the following ways?
Summary Of Yes
Base: All Respondents
Waves Gender Age Income Political
Wave 2 Wave 3 Wave 4 Wave 5 Wave 6 Wave 7 Wave 8 Wave 9 Wave 10 Wave 11 Wave 12 Wave 13 Wave 14 Less(3/14 - (3/17 - (3/21 - (3/28 - (4/3 - (4/11- (4/18- (4/25- (5/1 - (5/8 - (5/15 - (5/27 - (5/29 - than $50k -3/15) 3/18) 3/23) 3/30) 4/5) 4/13) 4/20) 4/27) 5/3) 5/10) 5/17) 5/28) 5/31) MALE FEMALE 18-34 35-49 50-64 65+ $50k $75k $75k+ GOP DEM IND/OTH
(A) (B) (C) (D) (E) (F) (G) (H) (I) (J) (K) (L) (M) (N) (O) (P) (Q) (R) (S) (T) (U) (V) (W) (X) (Y)
- - - - 1993 2013 2029 2050 - - - - 1965 1066 899 504 475 502 484 749 397 729 698 683 584Unweighted Base-** -** -** -** 1993 2013 2029 2050 -** -** -** -** 1965 952 1013 573 497 474 421 609 329 935 665 709 591Weighted Base
- - - - 946 935 767 813 - - - - 790 394 396 255 206 175 154 255 124 377 237 303 250- - - - 47% 46% 38% 40% - - - - 40% 41% 39% 44% 42% 37% 37% 42% 38% 40% 36% 43% 42%
GHM GHM rs W w
I have been impactedfinancially in some otherway
- - - - 755 805 796 787 - - - - 782 370 412 214 183 186 199 214 125 418 293 285 203- - - - 38% 40% 39% 38% - - - - 40% 39% 41% 37% 37% 39% 47% 35% 38% 45% 44% 40% 34%
PQr Tu Y y
I have not been impactedfinancially
- - - - 762 771 627 632 - - - - 651 334 316 248 183 133 86 198 88 340 209 251 191- - - - 38% 38% 31% 31% - - - - 33% 35% 31% 43% 37% 28% 21% 32% 27% 36% 31% 35% 32%
GHM GHM RS RS S U
Stopped or cut back onother savings (e.g., collegetuition, a major purchase,such as a house or care)
- - - - 752 774 665 688 - - - - 633 341 292 255 208 122 48 204 86 324 205 229 199- - - - 38% 38% 33% 34% - - - - 32% 36% 29% 44% 42% 26% 11% 33% 26% 35% 31% 32% 34%
GHM GHM O RS RS S U U
Sought out new oradditional sources ofincome
- - - - 560 581 599 580 - - - - 613 344 269 219 203 118 73 139 91 372 225 244 144- - - - 28% 29% 30% 28% - - - - 31% 36% 27% 38% 41% 25% 17% 23% 28% 40% 34% 34% 24%
e O RS RS S TU Y Y
Provided financial supportfor a family member
- - - - 831 626 621 651 - - - - 602 324 278 200 161 141 99 171 108 299 178 220 204- - - - 42% 31% 31% 32% - - - - 31% 34% 27% 35% 32% 30% 24% 28% 33% 32% 27% 31% 35%
FGHM O S S s W
Lost income partially
- - - - 649 586 526 530 - - - - 573 301 271 200 168 141 64 171 88 292 183 220 169- - - - 33% 29% 26% 26% - - - - 29% 32% 27% 35% 34% 30% 15% 28% 27% 31% 28% 31% 29%
fGHm gh gh o S S S
Stopped or cut back onretirement savings
- - - - 537 537 499 515 - - - - 474 243 231 178 147 97 53 162 74 217 138 206 130- - - - 27% 27% 25% 25% - - - - 24% 26% 23% 31% 30% 20% 13% 27% 23% 23% 21% 29% 22%
RS RS S WY
Accumulated more debtthan normal
- - - - 383 360 372 407 - - - - 451 269 183 197 168 65 22 85 58 303 173 175 103- - - - 19% 18% 18% 20% - - - - 23% 28% 18% 34% 34% 14% 5% 14% 18% 32% 26% 25% 17%
EFGh O RS RS S TU Y Y
Provided financial supportfor a friend
- - - - 543 488 466 503 - - - - 429 227 202 183 138 79 29 160 55 204 134 173 122- - - - 27% 24% 23% 25% - - - - 22% 24% 20% 32% 28% 17% 7% 26% 17% 22% 20% 24% 21%
fGM RS RS S U u
Missed (or will soon miss)a bill payment
- - - - 325 328 322 355 - - - - 349 190 158 157 121 47 24 83 33 225 115 127 107- - - - 16% 16% 16% 17% - - - - 18% 20% 16% 27% 24% 10% 6% 14% 10% 24% 17% 18% 18%
O RS RS S TU
Paid for services that Ihaven’t used (e.g., a dogwalker, childcare, a housecleaning service)
- - - - 387 372 343 385 - - - - 313 176 137 164 102 34 12 110 40 152 104 109 99- - - - 19% 18% 17% 19% - - - - 16% 18% 13% 29% 21% 7% 3% 18% 12% 16% 16% 15% 17%
gM m m O QRS RS S U
Missed (or will soon miss)a rent/mortgage payment
- - - - 378 268 227 241 - - - - 213 109 104 101 66 35 11 83 16 111 70 98 45- - - - 19% 13% 11% 12% - - - - 11% 11% 10% 18% 13% 7% 3% 14% 5% 12% 10% 14% 8%
FGHM gm RS RS S U U Y
Lost income entirely
__________________________________________________________________________________________________________________Proportions/Means: Columns Tested (5%, 10% risk level) - A/B/C/D/E/F/G/H/I/J/K/L/M - N/O - P/Q/R/S - T/U/V - W/X/YOverlap formulae used. ** very small base (under 30) ineligible for sig testing

Page 55Fielding Period: March 14 - May 31, 2020COVID-19Weighted To The U.S. General Adult Population - Propensity
2 Jun 2020Table 53EMP05_1 As a result of the current pandemic, have you or your household been impacted financially in any of the following ways?
Missed (or will soon miss) a rent/mortgage payment
Base: All Respondents
Waves Gender Age Income Political
Wave 2 Wave 3 Wave 4 Wave 5 Wave 6 Wave 7 Wave 8 Wave 9 Wave 10 Wave 11 Wave 12 Wave 13 Wave 14 Less(3/14 - (3/17 - (3/21 - (3/28 - (4/3 - (4/11- (4/18- (4/25- (5/1 - (5/8 - (5/15 - (5/27 - (5/29 - than $50k -3/15) 3/18) 3/23) 3/30) 4/5) 4/13) 4/20) 4/27) 5/3) 5/10) 5/17) 5/28) 5/31) MALE FEMALE 18-34 35-49 50-64 65+ $50k $75k $75k+ GOP DEM IND/OTH
(A) (B) (C) (D) (E) (F) (G) (H) (I) (J) (K) (L) (M) (N) (O) (P) (Q) (R) (S) (T) (U) (V) (W) (X) (Y)
- - - - 1993 2013 2029 2050 - - - - 1965 1066 899 504 475 502 484 749 397 729 698 683 584Unweighted Base-** -** -** -** 1993 2013 2029 2050 -** -** -** -** 1965 952 1013 573 497 474 421 609 329 935 665 709 591Weighted Base
- - - - 387 372 343 385 - - - - 313 176 137 164 102 34 12 110 40 152 104 109 99- - - - 19% 18% 17% 19% - - - - 16% 18% 13% 29% 21% 7% 3% 18% 12% 16% 16% 15% 17%
gM m m O QRS RS S U
Yes
- - - - 1606 1641 1686 1665 - - - - 1652 776 877 409 395 439 409 498 289 783 560 600 492- - - - 81% 82% 83% 81% - - - - 84% 82% 87% 71% 79% 93% 97% 82% 88% 84% 84% 85% 83%
e Efh N P PQ PQR T
No
- - - - 1993 2013 2029 2050 - - - - 1965 952 1013 573 497 474 421 609 329 935 665 709 591- - - - 100% 100% 100% 100% - - - - 100% 100% 100% 100% 100% 100% 100% 100% 100% 100% 100% 100% 100%
Sigma
__________________________________________________________________________________________________________________Proportions/Means: Columns Tested (5%, 10% risk level) - A/B/C/D/E/F/G/H/I/J/K/L/M - N/O - P/Q/R/S - T/U/V - W/X/YOverlap formulae used. ** very small base (under 30) ineligible for sig testing
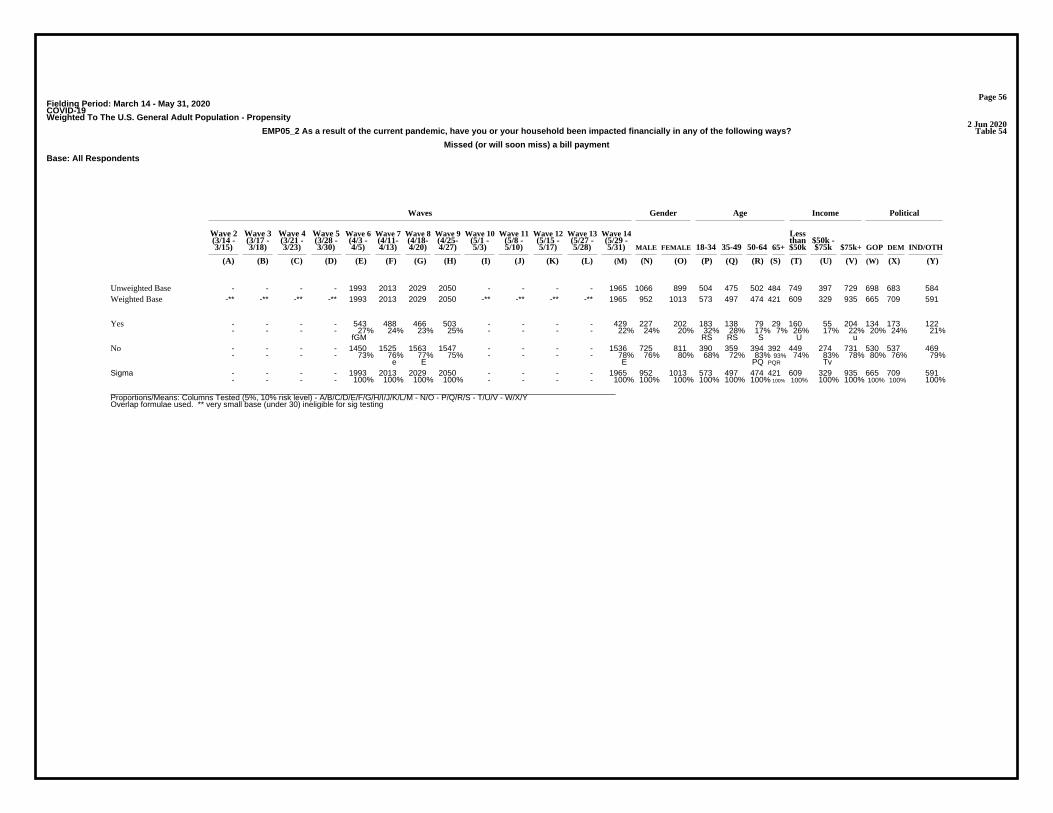
Page 56Fielding Period: March 14 - May 31, 2020COVID-19Weighted To The U.S. General Adult Population - Propensity
2 Jun 2020Table 54EMP05_2 As a result of the current pandemic, have you or your household been impacted financially in any of the following ways?
Missed (or will soon miss) a bill payment
Base: All Respondents
Waves Gender Age Income Political
Wave 2 Wave 3 Wave 4 Wave 5 Wave 6 Wave 7 Wave 8 Wave 9 Wave 10 Wave 11 Wave 12 Wave 13 Wave 14 Less(3/14 - (3/17 - (3/21 - (3/28 - (4/3 - (4/11- (4/18- (4/25- (5/1 - (5/8 - (5/15 - (5/27 - (5/29 - than $50k -3/15) 3/18) 3/23) 3/30) 4/5) 4/13) 4/20) 4/27) 5/3) 5/10) 5/17) 5/28) 5/31) MALE FEMALE 18-34 35-49 50-64 65+ $50k $75k $75k+ GOP DEM IND/OTH
(A) (B) (C) (D) (E) (F) (G) (H) (I) (J) (K) (L) (M) (N) (O) (P) (Q) (R) (S) (T) (U) (V) (W) (X) (Y)
- - - - 1993 2013 2029 2050 - - - - 1965 1066 899 504 475 502 484 749 397 729 698 683 584Unweighted Base-** -** -** -** 1993 2013 2029 2050 -** -** -** -** 1965 952 1013 573 497 474 421 609 329 935 665 709 591Weighted Base
- - - - 543 488 466 503 - - - - 429 227 202 183 138 79 29 160 55 204 134 173 122- - - - 27% 24% 23% 25% - - - - 22% 24% 20% 32% 28% 17% 7% 26% 17% 22% 20% 24% 21%
fGM RS RS S U u
Yes
- - - - 1450 1525 1563 1547 - - - - 1536 725 811 390 359 394 392 449 274 731 530 537 469- - - - 73% 76% 77% 75% - - - - 78% 76% 80% 68% 72% 83% 93% 74% 83% 78% 80% 76% 79%
e E E PQ PQR Tv
No
- - - - 1993 2013 2029 2050 - - - - 1965 952 1013 573 497 474 421 609 329 935 665 709 591- - - - 100% 100% 100% 100% - - - - 100% 100% 100% 100% 100% 100% 100% 100% 100% 100% 100% 100% 100%
Sigma
__________________________________________________________________________________________________________________Proportions/Means: Columns Tested (5%, 10% risk level) - A/B/C/D/E/F/G/H/I/J/K/L/M - N/O - P/Q/R/S - T/U/V - W/X/YOverlap formulae used. ** very small base (under 30) ineligible for sig testing

Page 57Fielding Period: March 14 - May 31, 2020COVID-19Weighted To The U.S. General Adult Population - Propensity
2 Jun 2020Table 55EMP05_3 As a result of the current pandemic, have you or your household been impacted financially in any of the following ways?
Provided financial support for a family member
Base: All Respondents
Waves Gender Age Income Political
Wave 2 Wave 3 Wave 4 Wave 5 Wave 6 Wave 7 Wave 8 Wave 9 Wave 10 Wave 11 Wave 12 Wave 13 Wave 14 Less(3/14 - (3/17 - (3/21 - (3/28 - (4/3 - (4/11- (4/18- (4/25- (5/1 - (5/8 - (5/15 - (5/27 - (5/29 - than $50k -3/15) 3/18) 3/23) 3/30) 4/5) 4/13) 4/20) 4/27) 5/3) 5/10) 5/17) 5/28) 5/31) MALE FEMALE 18-34 35-49 50-64 65+ $50k $75k $75k+ GOP DEM IND/OTH
(A) (B) (C) (D) (E) (F) (G) (H) (I) (J) (K) (L) (M) (N) (O) (P) (Q) (R) (S) (T) (U) (V) (W) (X) (Y)
- - - - 1993 2013 2029 2050 - - - - 1965 1066 899 504 475 502 484 749 397 729 698 683 584Unweighted Base-** -** -** -** 1993 2013 2029 2050 -** -** -** -** 1965 952 1013 573 497 474 421 609 329 935 665 709 591Weighted Base
- - - - 560 581 599 580 - - - - 613 344 269 219 203 118 73 139 91 372 225 244 144- - - - 28% 29% 30% 28% - - - - 31% 36% 27% 38% 41% 25% 17% 23% 28% 40% 34% 34% 24%
e O RS RS S TU Y Y
Yes
- - - - 1433 1432 1430 1470 - - - - 1352 607 745 354 294 356 348 470 238 563 440 465 447- - - - 72% 71% 70% 72% - - - - 69% 64% 73% 62% 59% 75% 83% 77% 72% 60% 66% 66% 76%
m N PQ PQR V V WX
No
- - - - 1993 2013 2029 2050 - - - - 1965 952 1013 573 497 474 421 609 329 935 665 709 591- - - - 100% 100% 100% 100% - - - - 100% 100% 100% 100% 100% 100% 100% 100% 100% 100% 100% 100% 100%
Sigma
__________________________________________________________________________________________________________________Proportions/Means: Columns Tested (5%, 10% risk level) - A/B/C/D/E/F/G/H/I/J/K/L/M - N/O - P/Q/R/S - T/U/V - W/X/YOverlap formulae used. ** very small base (under 30) ineligible for sig testing

Page 58Fielding Period: March 14 - May 31, 2020COVID-19Weighted To The U.S. General Adult Population - Propensity
2 Jun 2020Table 56EMP05_4 As a result of the current pandemic, have you or your household been impacted financially in any of the following ways?
Provided financial support for a friend
Base: All Respondents
Waves Gender Age Income Political
Wave 2 Wave 3 Wave 4 Wave 5 Wave 6 Wave 7 Wave 8 Wave 9 Wave 10 Wave 11 Wave 12 Wave 13 Wave 14 Less(3/14 - (3/17 - (3/21 - (3/28 - (4/3 - (4/11- (4/18- (4/25- (5/1 - (5/8 - (5/15 - (5/27 - (5/29 - than $50k -3/15) 3/18) 3/23) 3/30) 4/5) 4/13) 4/20) 4/27) 5/3) 5/10) 5/17) 5/28) 5/31) MALE FEMALE 18-34 35-49 50-64 65+ $50k $75k $75k+ GOP DEM IND/OTH
(A) (B) (C) (D) (E) (F) (G) (H) (I) (J) (K) (L) (M) (N) (O) (P) (Q) (R) (S) (T) (U) (V) (W) (X) (Y)
- - - - 1993 2013 2029 2050 - - - - 1965 1066 899 504 475 502 484 749 397 729 698 683 584Unweighted Base-** -** -** -** 1993 2013 2029 2050 -** -** -** -** 1965 952 1013 573 497 474 421 609 329 935 665 709 591Weighted Base
- - - - 383 360 372 407 - - - - 451 269 183 197 168 65 22 85 58 303 173 175 103- - - - 19% 18% 18% 20% - - - - 23% 28% 18% 34% 34% 14% 5% 14% 18% 32% 26% 25% 17%
EFGh O RS RS S TU Y Y
Yes
- - - - 1610 1653 1657 1643 - - - - 1514 683 831 376 330 409 399 524 271 632 491 534 488- - - - 81% 82% 82% 80% - - - - 77% 72% 82% 66% 66% 86% 95% 86% 82% 68% 74% 75% 83%
M M M m N PQ PQR V V WX
No
- - - - 1993 2013 2029 2050 - - - - 1965 952 1013 573 497 474 421 609 329 935 665 709 591- - - - 100% 100% 100% 100% - - - - 100% 100% 100% 100% 100% 100% 100% 100% 100% 100% 100% 100% 100%
Sigma
__________________________________________________________________________________________________________________Proportions/Means: Columns Tested (5%, 10% risk level) - A/B/C/D/E/F/G/H/I/J/K/L/M - N/O - P/Q/R/S - T/U/V - W/X/YOverlap formulae used. ** very small base (under 30) ineligible for sig testing

Page 59Fielding Period: March 14 - May 31, 2020COVID-19Weighted To The U.S. General Adult Population - Propensity
2 Jun 2020Table 57EMP05_5 As a result of the current pandemic, have you or your household been impacted financially in any of the following ways?
Sought out new or additional sources of income
Base: All Respondents
Waves Gender Age Income Political
Wave 2 Wave 3 Wave 4 Wave 5 Wave 6 Wave 7 Wave 8 Wave 9 Wave 10 Wave 11 Wave 12 Wave 13 Wave 14 Less(3/14 - (3/17 - (3/21 - (3/28 - (4/3 - (4/11- (4/18- (4/25- (5/1 - (5/8 - (5/15 - (5/27 - (5/29 - than $50k -3/15) 3/18) 3/23) 3/30) 4/5) 4/13) 4/20) 4/27) 5/3) 5/10) 5/17) 5/28) 5/31) MALE FEMALE 18-34 35-49 50-64 65+ $50k $75k $75k+ GOP DEM IND/OTH
(A) (B) (C) (D) (E) (F) (G) (H) (I) (J) (K) (L) (M) (N) (O) (P) (Q) (R) (S) (T) (U) (V) (W) (X) (Y)
- - - - 1993 2013 2029 2050 - - - - 1965 1066 899 504 475 502 484 749 397 729 698 683 584Unweighted Base-** -** -** -** 1993 2013 2029 2050 -** -** -** -** 1965 952 1013 573 497 474 421 609 329 935 665 709 591Weighted Base
- - - - 752 774 665 688 - - - - 633 341 292 255 208 122 48 204 86 324 205 229 199- - - - 38% 38% 33% 34% - - - - 32% 36% 29% 44% 42% 26% 11% 33% 26% 35% 31% 32% 34%
GHM GHM O RS RS S U U
Yes
- - - - 1241 1239 1364 1362 - - - - 1332 610 722 319 289 351 373 405 243 611 460 481 392- - - - 62% 62% 67% 66% - - - - 68% 64% 71% 56% 58% 74% 89% 67% 74% 65% 69% 68% 66%
EF EF EF N PQ PQR TV
No
- - - - 1993 2013 2029 2050 - - - - 1965 952 1013 573 497 474 421 609 329 935 665 709 591- - - - 100% 100% 100% 100% - - - - 100% 100% 100% 100% 100% 100% 100% 100% 100% 100% 100% 100% 100%
Sigma
__________________________________________________________________________________________________________________Proportions/Means: Columns Tested (5%, 10% risk level) - A/B/C/D/E/F/G/H/I/J/K/L/M - N/O - P/Q/R/S - T/U/V - W/X/YOverlap formulae used. ** very small base (under 30) ineligible for sig testing

Page 60Fielding Period: March 14 - May 31, 2020COVID-19Weighted To The U.S. General Adult Population - Propensity
2 Jun 2020Table 58EMP05_6 As a result of the current pandemic, have you or your household been impacted financially in any of the following ways?
Lost income partially
Base: All Respondents
Waves Gender Age Income Political
Wave 2 Wave 3 Wave 4 Wave 5 Wave 6 Wave 7 Wave 8 Wave 9 Wave 10 Wave 11 Wave 12 Wave 13 Wave 14 Less(3/14 - (3/17 - (3/21 - (3/28 - (4/3 - (4/11- (4/18- (4/25- (5/1 - (5/8 - (5/15 - (5/27 - (5/29 - than $50k -3/15) 3/18) 3/23) 3/30) 4/5) 4/13) 4/20) 4/27) 5/3) 5/10) 5/17) 5/28) 5/31) MALE FEMALE 18-34 35-49 50-64 65+ $50k $75k $75k+ GOP DEM IND/OTH
(A) (B) (C) (D) (E) (F) (G) (H) (I) (J) (K) (L) (M) (N) (O) (P) (Q) (R) (S) (T) (U) (V) (W) (X) (Y)
- - - - 1993 2013 2029 2050 - - - - 1965 1066 899 504 475 502 484 749 397 729 698 683 584Unweighted Base-** -** -** -** 1993 2013 2029 2050 -** -** -** -** 1965 952 1013 573 497 474 421 609 329 935 665 709 591Weighted Base
- - - - 831 626 621 651 - - - - 602 324 278 200 161 141 99 171 108 299 178 220 204- - - - 42% 31% 31% 32% - - - - 31% 34% 27% 35% 32% 30% 24% 28% 33% 32% 27% 31% 35%
FGHM O S S s W
Yes
- - - - 1162 1387 1408 1399 - - - - 1363 628 735 373 336 332 322 438 221 636 487 489 387- - - - 58% 69% 69% 68% - - - - 69% 66% 73% 65% 68% 70% 76% 72% 67% 68% 73% 69% 65%
E E E E N PQr Y
No
- - - - 1993 2013 2029 2050 - - - - 1965 952 1013 573 497 474 421 609 329 935 665 709 591- - - - 100% 100% 100% 100% - - - - 100% 100% 100% 100% 100% 100% 100% 100% 100% 100% 100% 100% 100%
Sigma
__________________________________________________________________________________________________________________Proportions/Means: Columns Tested (5%, 10% risk level) - A/B/C/D/E/F/G/H/I/J/K/L/M - N/O - P/Q/R/S - T/U/V - W/X/YOverlap formulae used. ** very small base (under 30) ineligible for sig testing

Page 61Fielding Period: March 14 - May 31, 2020COVID-19Weighted To The U.S. General Adult Population - Propensity
2 Jun 2020Table 59EMP05_7 As a result of the current pandemic, have you or your household been impacted financially in any of the following ways?
Lost income entirely
Base: All Respondents
Waves Gender Age Income Political
Wave 2 Wave 3 Wave 4 Wave 5 Wave 6 Wave 7 Wave 8 Wave 9 Wave 10 Wave 11 Wave 12 Wave 13 Wave 14 Less(3/14 - (3/17 - (3/21 - (3/28 - (4/3 - (4/11- (4/18- (4/25- (5/1 - (5/8 - (5/15 - (5/27 - (5/29 - than $50k -3/15) 3/18) 3/23) 3/30) 4/5) 4/13) 4/20) 4/27) 5/3) 5/10) 5/17) 5/28) 5/31) MALE FEMALE 18-34 35-49 50-64 65+ $50k $75k $75k+ GOP DEM IND/OTH
(A) (B) (C) (D) (E) (F) (G) (H) (I) (J) (K) (L) (M) (N) (O) (P) (Q) (R) (S) (T) (U) (V) (W) (X) (Y)
- - - - 1993 2013 2029 2050 - - - - 1965 1066 899 504 475 502 484 749 397 729 698 683 584Unweighted Base-** -** -** -** 1993 2013 2029 2050 -** -** -** -** 1965 952 1013 573 497 474 421 609 329 935 665 709 591Weighted Base
- - - - 378 268 227 241 - - - - 213 109 104 101 66 35 11 83 16 111 70 98 45- - - - 19% 13% 11% 12% - - - - 11% 11% 10% 18% 13% 7% 3% 14% 5% 12% 10% 14% 8%
FGHM gm RS RS S U U Y
Yes
- - - - 1615 1745 1802 1809 - - - - 1752 843 909 472 432 439 410 526 313 824 595 612 546- - - - 81% 87% 89% 88% - - - - 89% 89% 90% 82% 87% 93% 97% 86% 95% 88% 90% 86% 92%
E Ef E Ef PQ PQR TV X
No
- - - - 1993 2013 2029 2050 - - - - 1965 952 1013 573 497 474 421 609 329 935 665 709 591- - - - 100% 100% 100% 100% - - - - 100% 100% 100% 100% 100% 100% 100% 100% 100% 100% 100% 100% 100%
Sigma
__________________________________________________________________________________________________________________Proportions/Means: Columns Tested (5%, 10% risk level) - A/B/C/D/E/F/G/H/I/J/K/L/M - N/O - P/Q/R/S - T/U/V - W/X/YOverlap formulae used. ** very small base (under 30) ineligible for sig testing
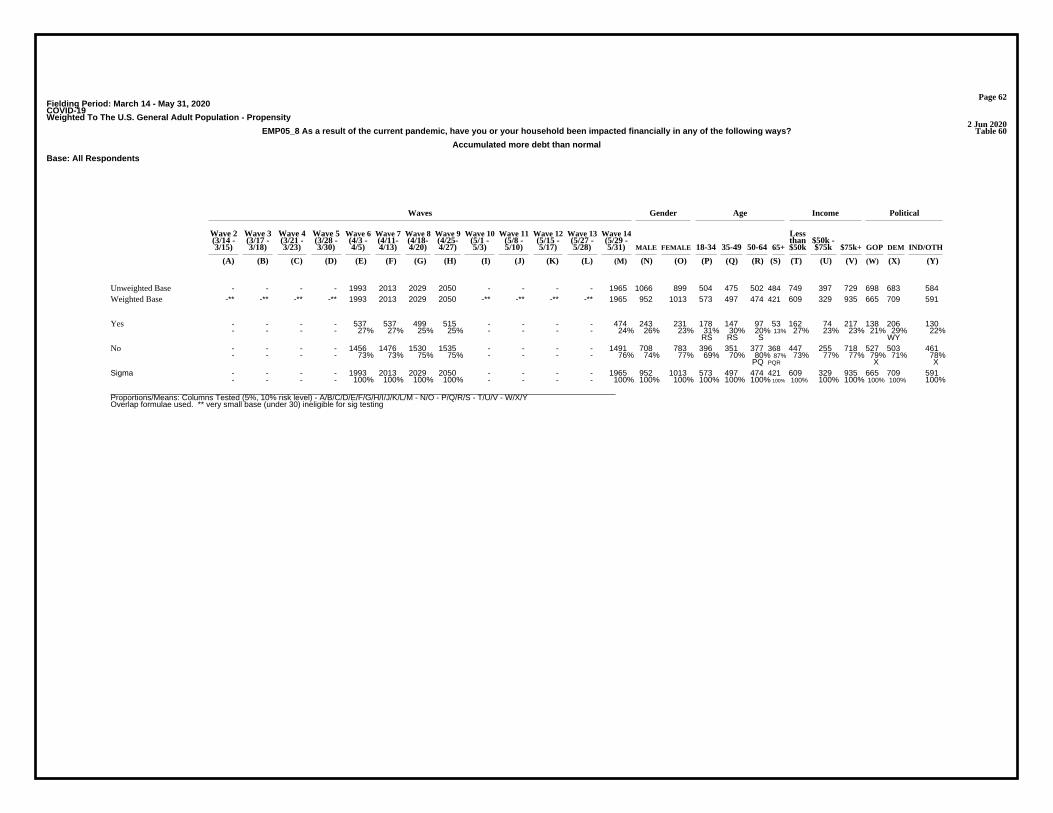
Page 62Fielding Period: March 14 - May 31, 2020COVID-19Weighted To The U.S. General Adult Population - Propensity
2 Jun 2020Table 60EMP05_8 As a result of the current pandemic, have you or your household been impacted financially in any of the following ways?
Accumulated more debt than normal
Base: All Respondents
Waves Gender Age Income Political
Wave 2 Wave 3 Wave 4 Wave 5 Wave 6 Wave 7 Wave 8 Wave 9 Wave 10 Wave 11 Wave 12 Wave 13 Wave 14 Less(3/14 - (3/17 - (3/21 - (3/28 - (4/3 - (4/11- (4/18- (4/25- (5/1 - (5/8 - (5/15 - (5/27 - (5/29 - than $50k -3/15) 3/18) 3/23) 3/30) 4/5) 4/13) 4/20) 4/27) 5/3) 5/10) 5/17) 5/28) 5/31) MALE FEMALE 18-34 35-49 50-64 65+ $50k $75k $75k+ GOP DEM IND/OTH
(A) (B) (C) (D) (E) (F) (G) (H) (I) (J) (K) (L) (M) (N) (O) (P) (Q) (R) (S) (T) (U) (V) (W) (X) (Y)
- - - - 1993 2013 2029 2050 - - - - 1965 1066 899 504 475 502 484 749 397 729 698 683 584Unweighted Base-** -** -** -** 1993 2013 2029 2050 -** -** -** -** 1965 952 1013 573 497 474 421 609 329 935 665 709 591Weighted Base
- - - - 537 537 499 515 - - - - 474 243 231 178 147 97 53 162 74 217 138 206 130- - - - 27% 27% 25% 25% - - - - 24% 26% 23% 31% 30% 20% 13% 27% 23% 23% 21% 29% 22%
RS RS S WY
Yes
- - - - 1456 1476 1530 1535 - - - - 1491 708 783 396 351 377 368 447 255 718 527 503 461- - - - 73% 73% 75% 75% - - - - 76% 74% 77% 69% 70% 80% 87% 73% 77% 77% 79% 71% 78%
PQ PQR X X
No
- - - - 1993 2013 2029 2050 - - - - 1965 952 1013 573 497 474 421 609 329 935 665 709 591- - - - 100% 100% 100% 100% - - - - 100% 100% 100% 100% 100% 100% 100% 100% 100% 100% 100% 100% 100%
Sigma
__________________________________________________________________________________________________________________Proportions/Means: Columns Tested (5%, 10% risk level) - A/B/C/D/E/F/G/H/I/J/K/L/M - N/O - P/Q/R/S - T/U/V - W/X/YOverlap formulae used. ** very small base (under 30) ineligible for sig testing

Page 63Fielding Period: March 14 - May 31, 2020COVID-19Weighted To The U.S. General Adult Population - Propensity
2 Jun 2020Table 61EMP05_9 As a result of the current pandemic, have you or your household been impacted financially in any of the following ways?
Stopped or cut back on retirement savings
Base: All Respondents
Waves Gender Age Income Political
Wave 2 Wave 3 Wave 4 Wave 5 Wave 6 Wave 7 Wave 8 Wave 9 Wave 10 Wave 11 Wave 12 Wave 13 Wave 14 Less(3/14 - (3/17 - (3/21 - (3/28 - (4/3 - (4/11- (4/18- (4/25- (5/1 - (5/8 - (5/15 - (5/27 - (5/29 - than $50k -3/15) 3/18) 3/23) 3/30) 4/5) 4/13) 4/20) 4/27) 5/3) 5/10) 5/17) 5/28) 5/31) MALE FEMALE 18-34 35-49 50-64 65+ $50k $75k $75k+ GOP DEM IND/OTH
(A) (B) (C) (D) (E) (F) (G) (H) (I) (J) (K) (L) (M) (N) (O) (P) (Q) (R) (S) (T) (U) (V) (W) (X) (Y)
- - - - 1993 2013 2029 2050 - - - - 1965 1066 899 504 475 502 484 749 397 729 698 683 584Unweighted Base-** -** -** -** 1993 2013 2029 2050 -** -** -** -** 1965 952 1013 573 497 474 421 609 329 935 665 709 591Weighted Base
- - - - 649 586 526 530 - - - - 573 301 271 200 168 141 64 171 88 292 183 220 169- - - - 33% 29% 26% 26% - - - - 29% 32% 27% 35% 34% 30% 15% 28% 27% 31% 28% 31% 29%
fGHm gh gh o S S S
Yes
- - - - 1344 1427 1503 1520 - - - - 1392 650 742 373 330 333 357 438 241 643 481 489 422- - - - 67% 71% 74% 74% - - - - 71% 68% 73% 65% 66% 70% 85% 72% 73% 69% 72% 69% 71%
e Efm Efm e n PQR
No
- - - - 1993 2013 2029 2050 - - - - 1965 952 1013 573 497 474 421 609 329 935 665 709 591- - - - 100% 100% 100% 100% - - - - 100% 100% 100% 100% 100% 100% 100% 100% 100% 100% 100% 100% 100%
Sigma
__________________________________________________________________________________________________________________Proportions/Means: Columns Tested (5%, 10% risk level) - A/B/C/D/E/F/G/H/I/J/K/L/M - N/O - P/Q/R/S - T/U/V - W/X/YOverlap formulae used. ** very small base (under 30) ineligible for sig testing

Page 64Fielding Period: March 14 - May 31, 2020COVID-19Weighted To The U.S. General Adult Population - Propensity
2 Jun 2020Table 62EMP05_10 As a result of the current pandemic, have you or your household been impacted financially in any of the following ways?
Stopped or cut back on other savings (e.g., college tuition, a major purchase, such as a house or care)
Base: All Respondents
Waves Gender Age Income Political
Wave 2 Wave 3 Wave 4 Wave 5 Wave 6 Wave 7 Wave 8 Wave 9 Wave 10 Wave 11 Wave 12 Wave 13 Wave 14 Less(3/14 - (3/17 - (3/21 - (3/28 - (4/3 - (4/11- (4/18- (4/25- (5/1 - (5/8 - (5/15 - (5/27 - (5/29 - than $50k -3/15) 3/18) 3/23) 3/30) 4/5) 4/13) 4/20) 4/27) 5/3) 5/10) 5/17) 5/28) 5/31) MALE FEMALE 18-34 35-49 50-64 65+ $50k $75k $75k+ GOP DEM IND/OTH
(A) (B) (C) (D) (E) (F) (G) (H) (I) (J) (K) (L) (M) (N) (O) (P) (Q) (R) (S) (T) (U) (V) (W) (X) (Y)
- - - - 1993 2013 2029 2050 - - - - 1965 1066 899 504 475 502 484 749 397 729 698 683 584Unweighted Base-** -** -** -** 1993 2013 2029 2050 -** -** -** -** 1965 952 1013 573 497 474 421 609 329 935 665 709 591Weighted Base
- - - - 762 771 627 632 - - - - 651 334 316 248 183 133 86 198 88 340 209 251 191- - - - 38% 38% 31% 31% - - - - 33% 35% 31% 43% 37% 28% 21% 32% 27% 36% 31% 35% 32%
GHM GHM RS RS S U
Yes
- - - - 1231 1242 1402 1418 - - - - 1314 617 697 325 314 341 334 411 241 595 456 459 400- - - - 62% 62% 69% 69% - - - - 67% 65% 69% 57% 63% 72% 79% 68% 73% 64% 69% 65% 68%
EF EF EF PQ PQR V
No
- - - - 1993 2013 2029 2050 - - - - 1965 952 1013 573 497 474 421 609 329 935 665 709 591- - - - 100% 100% 100% 100% - - - - 100% 100% 100% 100% 100% 100% 100% 100% 100% 100% 100% 100% 100%
Sigma
__________________________________________________________________________________________________________________Proportions/Means: Columns Tested (5%, 10% risk level) - A/B/C/D/E/F/G/H/I/J/K/L/M - N/O - P/Q/R/S - T/U/V - W/X/YOverlap formulae used. ** very small base (under 30) ineligible for sig testing
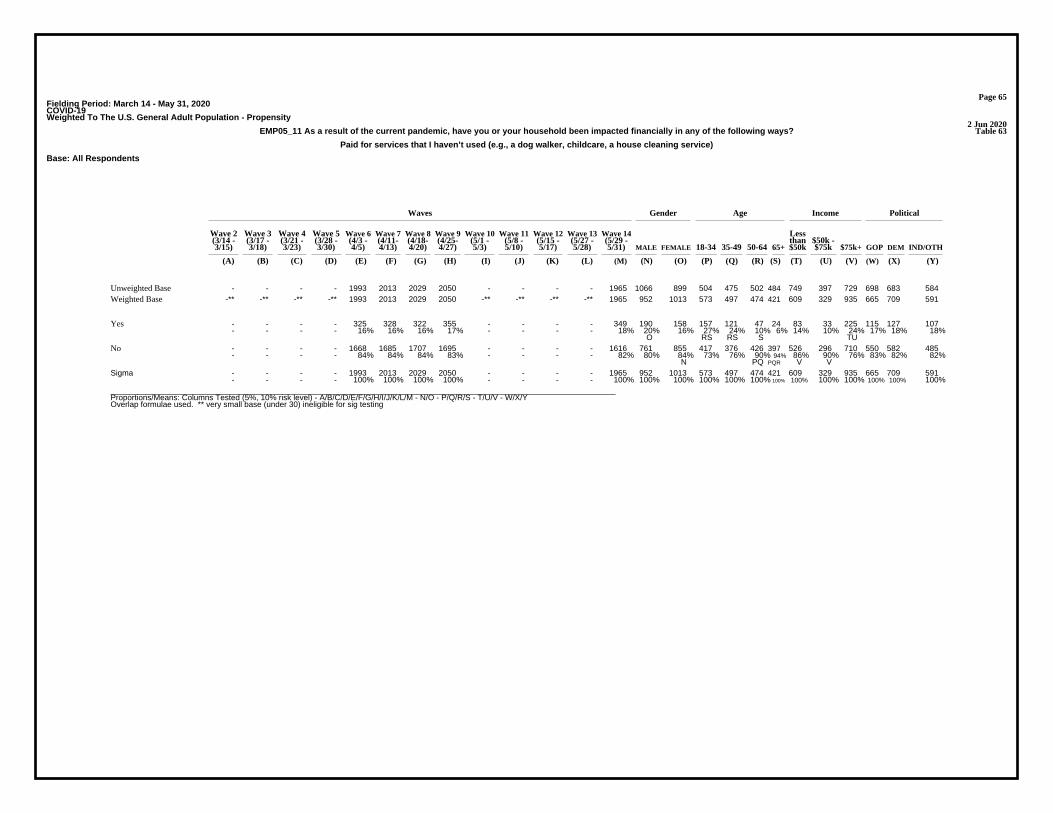
Page 65Fielding Period: March 14 - May 31, 2020COVID-19Weighted To The U.S. General Adult Population - Propensity
2 Jun 2020Table 63EMP05_11 As a result of the current pandemic, have you or your household been impacted financially in any of the following ways?
Paid for services that I haven’t used (e.g., a dog walker, childcare, a house cleaning service)
Base: All Respondents
Waves Gender Age Income Political
Wave 2 Wave 3 Wave 4 Wave 5 Wave 6 Wave 7 Wave 8 Wave 9 Wave 10 Wave 11 Wave 12 Wave 13 Wave 14 Less(3/14 - (3/17 - (3/21 - (3/28 - (4/3 - (4/11- (4/18- (4/25- (5/1 - (5/8 - (5/15 - (5/27 - (5/29 - than $50k -3/15) 3/18) 3/23) 3/30) 4/5) 4/13) 4/20) 4/27) 5/3) 5/10) 5/17) 5/28) 5/31) MALE FEMALE 18-34 35-49 50-64 65+ $50k $75k $75k+ GOP DEM IND/OTH
(A) (B) (C) (D) (E) (F) (G) (H) (I) (J) (K) (L) (M) (N) (O) (P) (Q) (R) (S) (T) (U) (V) (W) (X) (Y)
- - - - 1993 2013 2029 2050 - - - - 1965 1066 899 504 475 502 484 749 397 729 698 683 584Unweighted Base-** -** -** -** 1993 2013 2029 2050 -** -** -** -** 1965 952 1013 573 497 474 421 609 329 935 665 709 591Weighted Base
- - - - 325 328 322 355 - - - - 349 190 158 157 121 47 24 83 33 225 115 127 107- - - - 16% 16% 16% 17% - - - - 18% 20% 16% 27% 24% 10% 6% 14% 10% 24% 17% 18% 18%
O RS RS S TU
Yes
- - - - 1668 1685 1707 1695 - - - - 1616 761 855 417 376 426 397 526 296 710 550 582 485- - - - 84% 84% 84% 83% - - - - 82% 80% 84% 73% 76% 90% 94% 86% 90% 76% 83% 82% 82%
N PQ PQR V V
No
- - - - 1993 2013 2029 2050 - - - - 1965 952 1013 573 497 474 421 609 329 935 665 709 591- - - - 100% 100% 100% 100% - - - - 100% 100% 100% 100% 100% 100% 100% 100% 100% 100% 100% 100% 100%
Sigma
__________________________________________________________________________________________________________________Proportions/Means: Columns Tested (5%, 10% risk level) - A/B/C/D/E/F/G/H/I/J/K/L/M - N/O - P/Q/R/S - T/U/V - W/X/YOverlap formulae used. ** very small base (under 30) ineligible for sig testing
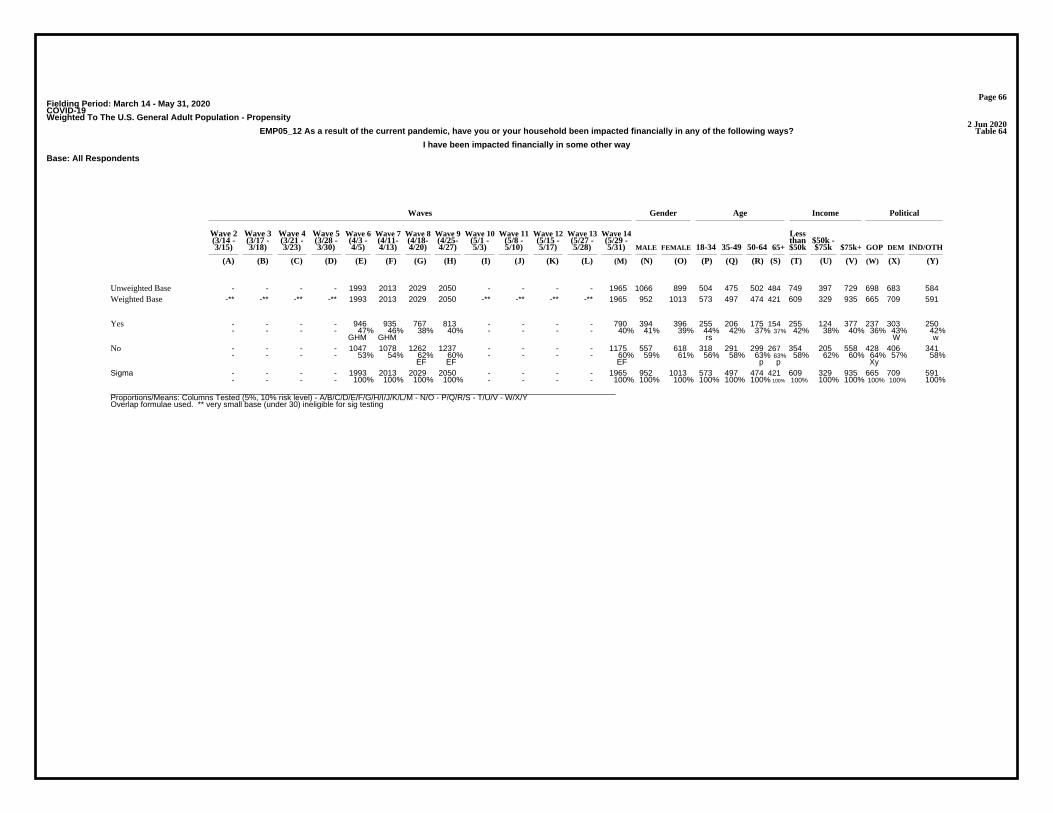
Page 66Fielding Period: March 14 - May 31, 2020COVID-19Weighted To The U.S. General Adult Population - Propensity
2 Jun 2020Table 64EMP05_12 As a result of the current pandemic, have you or your household been impacted financially in any of the following ways?
I have been impacted financially in some other way
Base: All Respondents
Waves Gender Age Income Political
Wave 2 Wave 3 Wave 4 Wave 5 Wave 6 Wave 7 Wave 8 Wave 9 Wave 10 Wave 11 Wave 12 Wave 13 Wave 14 Less(3/14 - (3/17 - (3/21 - (3/28 - (4/3 - (4/11- (4/18- (4/25- (5/1 - (5/8 - (5/15 - (5/27 - (5/29 - than $50k -3/15) 3/18) 3/23) 3/30) 4/5) 4/13) 4/20) 4/27) 5/3) 5/10) 5/17) 5/28) 5/31) MALE FEMALE 18-34 35-49 50-64 65+ $50k $75k $75k+ GOP DEM IND/OTH
(A) (B) (C) (D) (E) (F) (G) (H) (I) (J) (K) (L) (M) (N) (O) (P) (Q) (R) (S) (T) (U) (V) (W) (X) (Y)
- - - - 1993 2013 2029 2050 - - - - 1965 1066 899 504 475 502 484 749 397 729 698 683 584Unweighted Base-** -** -** -** 1993 2013 2029 2050 -** -** -** -** 1965 952 1013 573 497 474 421 609 329 935 665 709 591Weighted Base
- - - - 946 935 767 813 - - - - 790 394 396 255 206 175 154 255 124 377 237 303 250- - - - 47% 46% 38% 40% - - - - 40% 41% 39% 44% 42% 37% 37% 42% 38% 40% 36% 43% 42%
GHM GHM rs W w
Yes
- - - - 1047 1078 1262 1237 - - - - 1175 557 618 318 291 299 267 354 205 558 428 406 341- - - - 53% 54% 62% 60% - - - - 60% 59% 61% 56% 58% 63% 63% 58% 62% 60% 64% 57% 58%
EF EF EF p p Xy
No
- - - - 1993 2013 2029 2050 - - - - 1965 952 1013 573 497 474 421 609 329 935 665 709 591- - - - 100% 100% 100% 100% - - - - 100% 100% 100% 100% 100% 100% 100% 100% 100% 100% 100% 100% 100%
Sigma
__________________________________________________________________________________________________________________Proportions/Means: Columns Tested (5%, 10% risk level) - A/B/C/D/E/F/G/H/I/J/K/L/M - N/O - P/Q/R/S - T/U/V - W/X/YOverlap formulae used. ** very small base (under 30) ineligible for sig testing

Page 67Fielding Period: March 14 - May 31, 2020COVID-19Weighted To The U.S. General Adult Population - Propensity
2 Jun 2020Table 65EMP05_13 As a result of the current pandemic, have you or your household been impacted financially in any of the following ways?
I have not been impacted financially
Base: All Respondents
Waves Gender Age Income Political
Wave 2 Wave 3 Wave 4 Wave 5 Wave 6 Wave 7 Wave 8 Wave 9 Wave 10 Wave 11 Wave 12 Wave 13 Wave 14 Less(3/14 - (3/17 - (3/21 - (3/28 - (4/3 - (4/11- (4/18- (4/25- (5/1 - (5/8 - (5/15 - (5/27 - (5/29 - than $50k -3/15) 3/18) 3/23) 3/30) 4/5) 4/13) 4/20) 4/27) 5/3) 5/10) 5/17) 5/28) 5/31) MALE FEMALE 18-34 35-49 50-64 65+ $50k $75k $75k+ GOP DEM IND/OTH
(A) (B) (C) (D) (E) (F) (G) (H) (I) (J) (K) (L) (M) (N) (O) (P) (Q) (R) (S) (T) (U) (V) (W) (X) (Y)
- - - - 1993 2013 2029 2050 - - - - 1965 1066 899 504 475 502 484 749 397 729 698 683 584Unweighted Base-** -** -** -** 1993 2013 2029 2050 -** -** -** -** 1965 952 1013 573 497 474 421 609 329 935 665 709 591Weighted Base
- - - - 755 805 796 787 - - - - 782 370 412 214 183 186 199 214 125 418 293 285 203- - - - 38% 40% 39% 38% - - - - 40% 39% 41% 37% 37% 39% 47% 35% 38% 45% 44% 40% 34%
PQr Tu Y y
Yes
- - - - 1238 1208 1233 1263 - - - - 1183 582 601 360 314 287 222 395 204 517 371 424 388- - - - 62% 60% 61% 62% - - - - 60% 61% 59% 63% 63% 61% 53% 65% 62% 55% 56% 60% 66%
S S s V v Wx
No
- - - - 1993 2013 2029 2050 - - - - 1965 952 1013 573 497 474 421 609 329 935 665 709 591- - - - 100% 100% 100% 100% - - - - 100% 100% 100% 100% 100% 100% 100% 100% 100% 100% 100% 100% 100%
Sigma
__________________________________________________________________________________________________________________Proportions/Means: Columns Tested (5%, 10% risk level) - A/B/C/D/E/F/G/H/I/J/K/L/M - N/O - P/Q/R/S - T/U/V - W/X/YOverlap formulae used. ** very small base (under 30) ineligible for sig testing
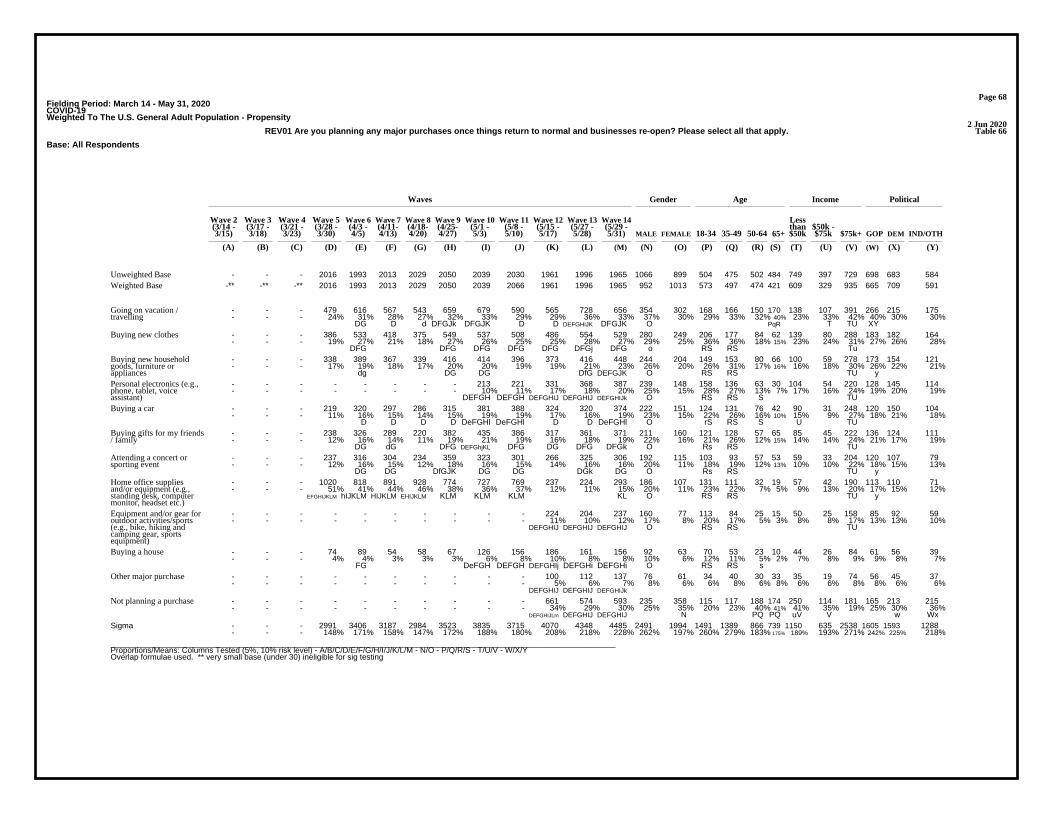
Page 68Fielding Period: March 14 - May 31, 2020COVID-19Weighted To The U.S. General Adult Population - Propensity
2 Jun 2020Table 66REV01 Are you planning any major purchases once things return to normal and businesses re-open? Please select all that apply.
Base: All Respondents
Waves Gender Age Income Political
Wave 2 Wave 3 Wave 4 Wave 5 Wave 6 Wave 7 Wave 8 Wave 9 Wave 10 Wave 11 Wave 12 Wave 13 Wave 14 Less(3/14 - (3/17 - (3/21 - (3/28 - (4/3 - (4/11- (4/18- (4/25- (5/1 - (5/8 - (5/15 - (5/27 - (5/29 - than $50k -3/15) 3/18) 3/23) 3/30) 4/5) 4/13) 4/20) 4/27) 5/3) 5/10) 5/17) 5/28) 5/31) MALE FEMALE 18-34 35-49 50-64 65+ $50k $75k $75k+ GOP DEM IND/OTH
(A) (B) (C) (D) (E) (F) (G) (H) (I) (J) (K) (L) (M) (N) (O) (P) (Q) (R) (S) (T) (U) (V) (W) (X) (Y)
- - - 2016 1993 2013 2029 2050 2039 2030 1961 1996 1965 1066 899 504 475 502 484 749 397 729 698 683 584Unweighted Base-** -** -** 2016 1993 2013 2029 2050 2039 2066 1961 1996 1965 952 1013 573 497 474 421 609 329 935 665 709 591Weighted Base
- - - 479 616 567 543 659 679 590 565 728 656 354 302 168 166 150 170 138 107 391 266 215 175- - - 24% 31% 28% 27% 32% 33% 29% 29% 36% 33% 37% 30% 29% 33% 32% 40% 23% 33% 42% 40% 30% 30%
DG D d DFGJk DFGJK D D DEFGHiJK DFGJK O PqR T TU XY
Going on vacation /travelling
- - - 386 533 418 375 549 537 508 486 554 529 280 249 206 177 84 62 139 80 288 183 182 164- - - 19% 27% 21% 18% 27% 26% 25% 25% 28% 27% 29% 25% 36% 36% 18% 15% 23% 24% 31% 27% 26% 28%
DFG DFG DFG DFG DFG DFGj DFG o RS RS Tu
Buying new clothes
- - - 338 389 367 339 416 414 396 373 416 448 244 204 149 153 80 66 100 59 278 173 154 121- - - 17% 19% 18% 17% 20% 20% 19% 19% 21% 23% 26% 20% 26% 31% 17% 16% 16% 18% 30% 26% 22% 21%
dg DG DG DfG DEFGJK O RS RS TU y
Buying new householdgoods, furniture orappliances
- - - - - - - - 213 221 331 368 387 239 148 158 136 63 30 104 54 220 128 145 114- - - - - - - - 10% 11% 17% 18% 20% 25% 15% 28% 27% 13% 7% 17% 16% 24% 19% 20% 19%
DEFGH DEFGH DEFGHIJ DEFGHIJ DEFGHIJk O RS RS S TU
Personal electronics (e.g.,phone, tablet, voiceassistant)
- - - 219 320 297 286 315 381 388 324 320 374 222 151 124 131 76 42 90 31 248 120 150 104- - - 11% 16% 15% 14% 15% 19% 19% 17% 16% 19% 23% 15% 22% 26% 16% 10% 15% 9% 27% 18% 21% 18%
D D D D DeFGHl DeFGHl D D DeFGHl O rS RS S U TU
Buying a car
- - - 238 326 289 220 382 435 386 317 361 371 211 160 121 128 57 65 85 45 222 136 124 111- - - 12% 16% 14% 11% 19% 21% 19% 16% 18% 19% 22% 16% 21% 26% 12% 15% 14% 14% 24% 21% 17% 19%
DG dG DFG DEFGhjKL DFG DG DFG DFGk O Rs RS TU
Buying gifts for my friends/ family
- - - 237 316 304 234 359 323 301 266 325 306 192 115 103 93 57 53 59 33 204 120 107 79- - - 12% 16% 15% 12% 18% 16% 15% 14% 16% 16% 20% 11% 18% 19% 12% 13% 10% 10% 22% 18% 15% 13%
DG DG DfGJK DG DG DGk DG O Rs RS TU y
Attending a concert orsporting event
- - - 1020 818 891 928 774 727 769 237 224 293 186 107 131 111 32 19 57 42 190 113 110 71- - - 51% 41% 44% 46% 38% 36% 37% 12% 11% 15% 20% 11% 23% 22% 7% 5% 9% 13% 20% 17% 15% 12%
EFGHIJKLM hIJKLM HIJKLM EHIJKLM KLM KLM KLM KL O RS RS TU y
Home office suppliesand/or equipment (e.g.,standing desk, computermonitor, headset etc.)
- - - - - - - - - - 224 204 237 160 77 113 84 25 15 50 25 158 85 92 59- - - - - - - - - - 11% 10% 12% 17% 8% 20% 17% 5% 3% 8% 8% 17% 13% 13% 10%
DEFGHIJ DEFGHIJ DEFGHIJ O RS RS TU
Equipment and/or gear foroutdoor activities/sports(e.g., bike, hiking andcamping gear, sportsequipment)
- - - 74 89 54 58 67 126 156 186 161 156 92 63 70 53 23 10 44 26 84 61 56 39- - - 4% 4% 3% 3% 3% 6% 8% 10% 8% 8% 10% 6% 12% 11% 5% 2% 7% 8% 9% 9% 8% 7%
FG DeFGH DEFGH DEFGHIj DEFGHi DEFGHi O RS RS s
Buying a house
- - - - - - - - - - 100 112 137 76 61 34 40 30 33 35 19 74 56 45 37- - - - - - - - - - 5% 6% 7% 8% 6% 6% 8% 6% 8% 6% 6% 8% 8% 6% 6%
DEFGHIJ DEFGHIJ DEFGHIJk
Other major purchase
- - - - - - - - - - 661 574 593 235 358 115 117 188 174 250 114 181 165 213 215- - - - - - - - - - 34% 29% 30% 25% 35% 20% 23% 40% 41% 41% 35% 19% 25% 30% 36%
DEFGHIJLm DEFGHIJ DEFGHIJ N PQ PQ uV V w Wx
Not planning a purchase
- - - 2991 3406 3187 2984 3523 3835 3715 4070 4348 4485 2491 1994 1491 1389 866 739 1150 635 2538 1605 1593 1288- - - 148% 171% 158% 147% 172% 188% 180% 208% 218% 228% 262% 197% 260% 279% 183% 175% 189% 193% 271% 242% 225% 218%
Sigma
__________________________________________________________________________________________________________________Proportions/Means: Columns Tested (5%, 10% risk level) - A/B/C/D/E/F/G/H/I/J/K/L/M - N/O - P/Q/R/S - T/U/V - W/X/YOverlap formulae used. ** very small base (under 30) ineligible for sig testing
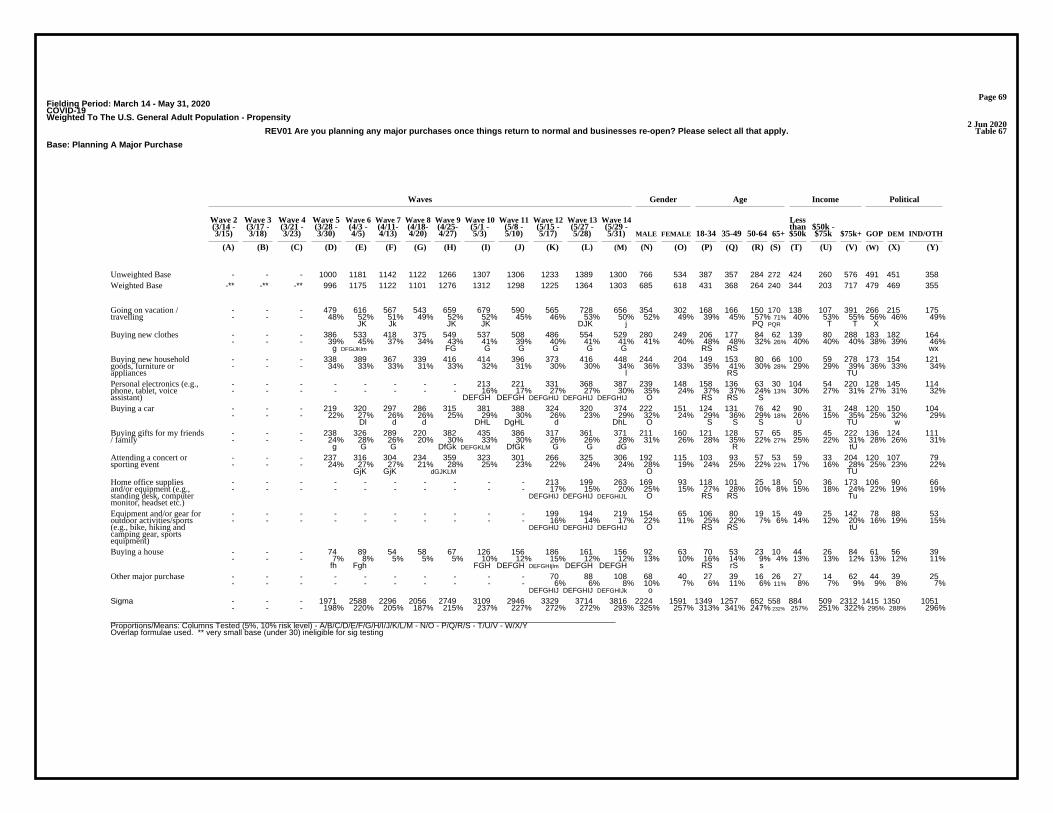
Page 69Fielding Period: March 14 - May 31, 2020COVID-19Weighted To The U.S. General Adult Population - Propensity
2 Jun 2020Table 67REV01 Are you planning any major purchases once things return to normal and businesses re-open? Please select all that apply.
Base: Planning A Major Purchase
Waves Gender Age Income Political
Wave 2 Wave 3 Wave 4 Wave 5 Wave 6 Wave 7 Wave 8 Wave 9 Wave 10 Wave 11 Wave 12 Wave 13 Wave 14 Less(3/14 - (3/17 - (3/21 - (3/28 - (4/3 - (4/11- (4/18- (4/25- (5/1 - (5/8 - (5/15 - (5/27 - (5/29 - than $50k -3/15) 3/18) 3/23) 3/30) 4/5) 4/13) 4/20) 4/27) 5/3) 5/10) 5/17) 5/28) 5/31) MALE FEMALE 18-34 35-49 50-64 65+ $50k $75k $75k+ GOP DEM IND/OTH
(A) (B) (C) (D) (E) (F) (G) (H) (I) (J) (K) (L) (M) (N) (O) (P) (Q) (R) (S) (T) (U) (V) (W) (X) (Y)
- - - 1000 1181 1142 1122 1266 1307 1306 1233 1389 1300 766 534 387 357 284 272 424 260 576 491 451 358Unweighted Base-** -** -** 996 1175 1122 1101 1276 1312 1298 1225 1364 1303 685 618 431 368 264 240 344 203 717 479 469 355Weighted Base
- - - 479 616 567 543 659 679 590 565 728 656 354 302 168 166 150 170 138 107 391 266 215 175- - - 48% 52% 51% 49% 52% 52% 45% 46% 53% 50% 52% 49% 39% 45% 57% 71% 40% 53% 55% 56% 46% 49%
JK Jk JK JK DJK j PQ PQR T T X
Going on vacation /travelling
- - - 386 533 418 375 549 537 508 486 554 529 280 249 206 177 84 62 139 80 288 183 182 164- - - 39% 45% 37% 34% 43% 41% 39% 40% 41% 41% 41% 40% 48% 48% 32% 26% 40% 40% 40% 38% 39% 46%
g DFGiJKlm FG G G G G G RS RS wx
Buying new clothes
- - - 338 389 367 339 416 414 396 373 416 448 244 204 149 153 80 66 100 59 278 173 154 121- - - 34% 33% 33% 31% 33% 32% 31% 30% 30% 34% 36% 33% 35% 41% 30% 28% 29% 29% 39% 36% 33% 34%
l RS TU
Buying new householdgoods, furniture orappliances
- - - - - - - - 213 221 331 368 387 239 148 158 136 63 30 104 54 220 128 145 114- - - - - - - - 16% 17% 27% 27% 30% 35% 24% 37% 37% 24% 13% 30% 27% 31% 27% 31% 32%
DEFGH DEFGH DEFGHIJ DEFGHIJ DEFGHIJ O RS RS S
Personal electronics (e.g.,phone, tablet, voiceassistant)
- - - 219 320 297 286 315 381 388 324 320 374 222 151 124 131 76 42 90 31 248 120 150 104- - - 22% 27% 26% 26% 25% 29% 30% 26% 23% 29% 32% 24% 29% 36% 29% 18% 26% 15% 35% 25% 32% 29%
Dl d d DHL DgHL d DhL O S S S U TU w
Buying a car
- - - 238 326 289 220 382 435 386 317 361 371 211 160 121 128 57 65 85 45 222 136 124 111- - - 24% 28% 26% 20% 30% 33% 30% 26% 26% 28% 31% 26% 28% 35% 22% 27% 25% 22% 31% 28% 26% 31%
g G G DfGk DEFGKLM DfGk G G dG R tU
Buying gifts for my friends/ family
- - - 237 316 304 234 359 323 301 266 325 306 192 115 103 93 57 53 59 33 204 120 107 79- - - 24% 27% 27% 21% 28% 25% 23% 22% 24% 24% 28% 19% 24% 25% 22% 22% 17% 16% 28% 25% 23% 22%
GjK GjK dGJKLM O TU
Attending a concert orsporting event
- - - - - - - - - - 213 199 263 169 93 118 101 25 18 50 36 173 106 90 66- - - - - - - - - - 17% 15% 20% 25% 15% 27% 28% 10% 8% 15% 18% 24% 22% 19% 19%
DEFGHIJ DEFGHIJ DEFGHIJL O RS RS Tu
Home office suppliesand/or equipment (e.g.,standing desk, computermonitor, headset etc.)
- - - - - - - - - - 199 194 219 154 65 106 80 19 15 49 25 142 78 88 53- - - - - - - - - - 16% 14% 17% 22% 11% 25% 22% 7% 6% 14% 12% 20% 16% 19% 15%
DEFGHIJ DEFGHIJ DEFGHIJ O RS RS tU
Equipment and/or gear foroutdoor activities/sports(e.g., bike, hiking andcamping gear, sportsequipment)
- - - 74 89 54 58 67 126 156 186 161 156 92 63 70 53 23 10 44 26 84 61 56 39- - - 7% 8% 5% 5% 5% 10% 12% 15% 12% 12% 13% 10% 16% 14% 9% 4% 13% 13% 12% 13% 12% 11%
fh Fgh FGH DEFGH DEFGHIjlm DEFGH DEFGH RS rS s
Buying a house
- - - - - - - - - - 70 88 108 68 40 27 39 16 26 27 14 62 44 39 25- - - - - - - - - - 6% 6% 8% 10% 7% 6% 11% 6% 11% 8% 7% 9% 9% 8% 7%
DEFGHIJ DEFGHIJ DEFGHIJk o
Other major purchase
- - - 1971 2588 2296 2056 2749 3109 2946 3329 3714 3816 2224 1591 1349 1257 652 558 884 509 2312 1415 1350 1051- - - 198% 220% 205% 187% 215% 237% 227% 272% 272% 293% 325% 257% 313% 341% 247% 232% 257% 251% 322% 295% 288% 296%
Sigma
__________________________________________________________________________________________________________________Proportions/Means: Columns Tested (5%, 10% risk level) - A/B/C/D/E/F/G/H/I/J/K/L/M - N/O - P/Q/R/S - T/U/V - W/X/YOverlap formulae used. ** very small base (under 30) ineligible for sig testing
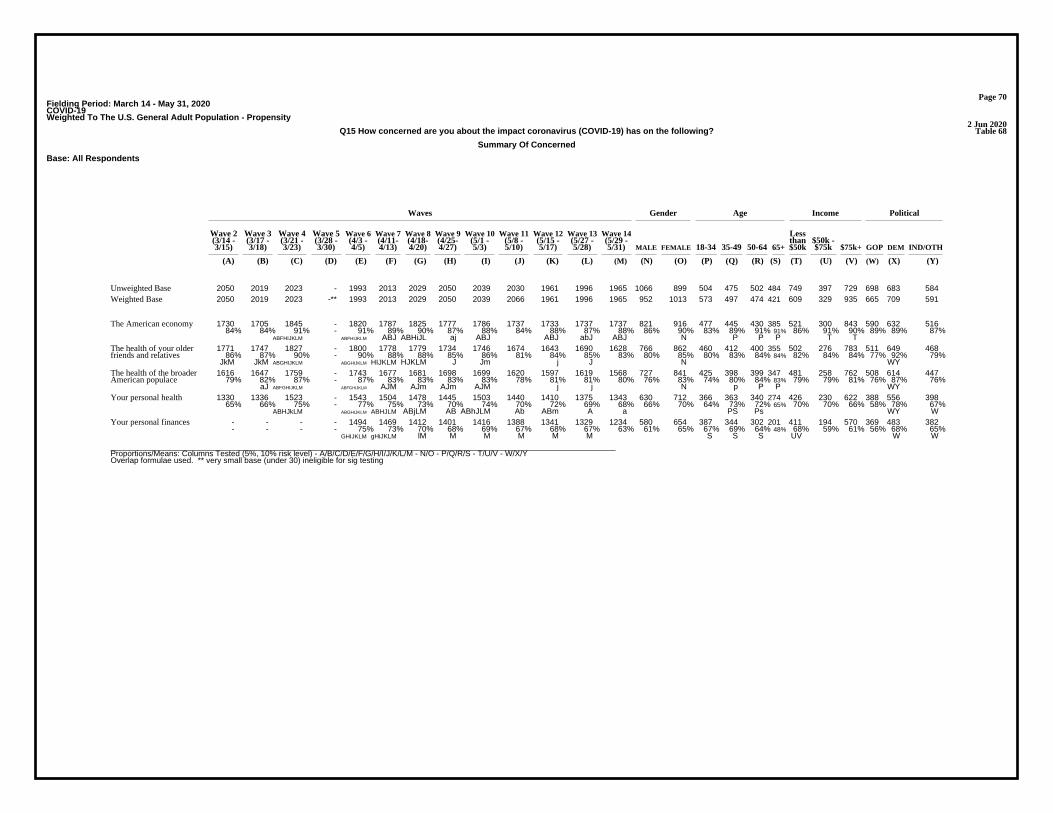
Page 70Fielding Period: March 14 - May 31, 2020COVID-19Weighted To The U.S. General Adult Population - Propensity
2 Jun 2020Table 68Q15 How concerned are you about the impact coronavirus (COVID-19) has on the following?
Summary Of Concerned
Base: All Respondents
Waves Gender Age Income Political
Wave 2 Wave 3 Wave 4 Wave 5 Wave 6 Wave 7 Wave 8 Wave 9 Wave 10 Wave 11 Wave 12 Wave 13 Wave 14 Less(3/14 - (3/17 - (3/21 - (3/28 - (4/3 - (4/11- (4/18- (4/25- (5/1 - (5/8 - (5/15 - (5/27 - (5/29 - than $50k -3/15) 3/18) 3/23) 3/30) 4/5) 4/13) 4/20) 4/27) 5/3) 5/10) 5/17) 5/28) 5/31) MALE FEMALE 18-34 35-49 50-64 65+ $50k $75k $75k+ GOP DEM IND/OTH
(A) (B) (C) (D) (E) (F) (G) (H) (I) (J) (K) (L) (M) (N) (O) (P) (Q) (R) (S) (T) (U) (V) (W) (X) (Y)
2050 2019 2023 - 1993 2013 2029 2050 2039 2030 1961 1996 1965 1066 899 504 475 502 484 749 397 729 698 683 584Unweighted Base2050 2019 2023 -** 1993 2013 2029 2050 2039 2066 1961 1996 1965 952 1013 573 497 474 421 609 329 935 665 709 591Weighted Base
1730 1705 1845 - 1820 1787 1825 1777 1786 1737 1733 1737 1737 821 916 477 445 430 385 521 300 843 590 632 51684% 84% 91% - 91% 89% 90% 87% 88% 84% 88% 87% 88% 86% 90% 83% 89% 91% 91% 86% 91% 90% 89% 89% 87%
ABFHIJKLM ABFHIJKLM ABJ ABHiJL aj ABJ ABJ abJ ABJ N P P P T T
The American economy
1771 1747 1827 - 1800 1778 1779 1734 1746 1674 1643 1690 1628 766 862 460 412 400 355 502 276 783 511 649 46886% 87% 90% - 90% 88% 88% 85% 86% 81% 84% 85% 83% 80% 85% 80% 83% 84% 84% 82% 84% 84% 77% 92% 79%
JkM JkM ABGHIJKLM ABGHIJKLM HIJKLM HJKLM J Jm j J N WY
The health of your olderfriends and relatives
1616 1647 1759 - 1743 1677 1681 1698 1699 1620 1597 1619 1568 727 841 425 398 399 347 481 258 762 508 614 44779% 82% 87% - 87% 83% 83% 83% 83% 78% 81% 81% 80% 76% 83% 74% 80% 84% 83% 79% 79% 81% 76% 87% 76%
aJ ABFGHIJKLM ABFGHIJKLM AJM AJm AJm AJM j j N p P P WY
The health of the broaderAmerican populace
1330 1336 1523 - 1543 1504 1478 1445 1503 1440 1410 1375 1343 630 712 366 363 340 274 426 230 622 388 556 39865% 66% 75% - 77% 75% 73% 70% 74% 70% 72% 69% 68% 66% 70% 64% 73% 72% 65% 70% 70% 66% 58% 78% 67%
ABHJkLM ABGHIJKLM ABHJLM ABjLM AB ABhJLM Ab ABm A a PS Ps WY W
Your personal health
- - - - 1494 1469 1412 1401 1416 1388 1341 1329 1234 580 654 387 344 302 201 411 194 570 369 483 382- - - - 75% 73% 70% 68% 69% 67% 68% 67% 63% 61% 65% 67% 69% 64% 48% 68% 59% 61% 56% 68% 65%
GHIJKLM gHiJKLM lM M M M M M S S S UV W W
Your personal finances
__________________________________________________________________________________________________________________Proportions/Means: Columns Tested (5%, 10% risk level) - A/B/C/D/E/F/G/H/I/J/K/L/M - N/O - P/Q/R/S - T/U/V - W/X/YOverlap formulae used. ** very small base (under 30) ineligible for sig testing

Page 71Fielding Period: March 14 - May 31, 2020COVID-19Weighted To The U.S. General Adult Population - Propensity
2 Jun 2020Table 69Q15 How concerned are you about the impact coronavirus (COVID-19) has on the following?
Summary Of Not At All/Not Very Concerned
Base: All Respondents
Waves Gender Age Income Political
Wave 2 Wave 3 Wave 4 Wave 5 Wave 6 Wave 7 Wave 8 Wave 9 Wave 10 Wave 11 Wave 12 Wave 13 Wave 14 Less(3/14 - (3/17 - (3/21 - (3/28 - (4/3 - (4/11- (4/18- (4/25- (5/1 - (5/8 - (5/15 - (5/27 - (5/29 - than $50k -3/15) 3/18) 3/23) 3/30) 4/5) 4/13) 4/20) 4/27) 5/3) 5/10) 5/17) 5/28) 5/31) MALE FEMALE 18-34 35-49 50-64 65+ $50k $75k $75k+ GOP DEM IND/OTH
(A) (B) (C) (D) (E) (F) (G) (H) (I) (J) (K) (L) (M) (N) (O) (P) (Q) (R) (S) (T) (U) (V) (W) (X) (Y)
2050 2019 2023 - 1993 2013 2029 2050 2039 2030 1961 1996 1965 1066 899 504 475 502 484 749 397 729 698 683 584Unweighted Base2050 2019 2023 -** 1993 2013 2029 2050 2039 2066 1961 1996 1965 952 1013 573 497 474 421 609 329 935 665 709 591Weighted Base
- - - - 499 544 617 649 623 679 620 667 731 372 360 186 153 172 220 198 135 365 295 227 209- - - - 25% 27% 30% 32% 31% 33% 32% 33% 37% 39% 35% 33% 31% 36% 52% 32% 41% 39% 44% 32% 35%
Ef EF Ef EF EF EFg EFGHIJKL PQR T T XY
Your personal finances
720 683 500 - 450 509 551 605 536 626 551 621 622 321 301 207 135 134 147 183 99 313 276 153 19335% 34% 25% - 23% 25% 27% 30% 26% 30% 28% 31% 32% 34% 30% 36% 27% 28% 35% 30% 30% 34% 42% 22% 33%
CEFGHIJKLm CEFGHIjK E CEFi E CEFgI cE CEFGI CEFGIk QR Qr XY X
Your personal health
434 372 264 - 250 336 348 352 340 447 364 377 397 224 172 149 100 75 74 127 71 173 157 96 14521% 18% 13% - 13% 17% 17% 17% 17% 22% 19% 19% 20% 24% 17% 26% 20% 16% 17% 21% 21% 19% 24% 13% 24%
bCEFGHI CE CE CE CE CE BCEFGHIkl CE CE CEFghI O qRS X X
The health of the broaderAmerican populace
279 272 196 - 193 235 250 316 293 392 318 306 337 186 152 113 85 73 65 107 53 152 154 60 12414% 13% 10% - 10% 12% 12% 15% 14% 19% 16% 15% 17% 20% 15% 20% 17% 16% 16% 18% 16% 16% 23% 8% 21%CE CE CE CEFG CEF ABCEFGHIkL abCEFG CEFG ABCEFGi O X X
The health of your olderfriends and relatives
320 314 178 - 173 226 204 273 253 329 228 259 228 130 97 96 53 43 36 88 29 92 75 78 7516% 16% 9% - 9% 11% 10% 13% 12% 16% 12% 13% 12% 14% 10% 17% 11% 9% 9% 14% 9% 10% 11% 11% 13%
CEFGhIKlM CEFGIKlM CE CEG CEg CEFGhIKLM CE CEG CE O QRS UV
The American economy
__________________________________________________________________________________________________________________Proportions/Means: Columns Tested (5%, 10% risk level) - A/B/C/D/E/F/G/H/I/J/K/L/M - N/O - P/Q/R/S - T/U/V - W/X/YOverlap formulae used. ** very small base (under 30) ineligible for sig testing
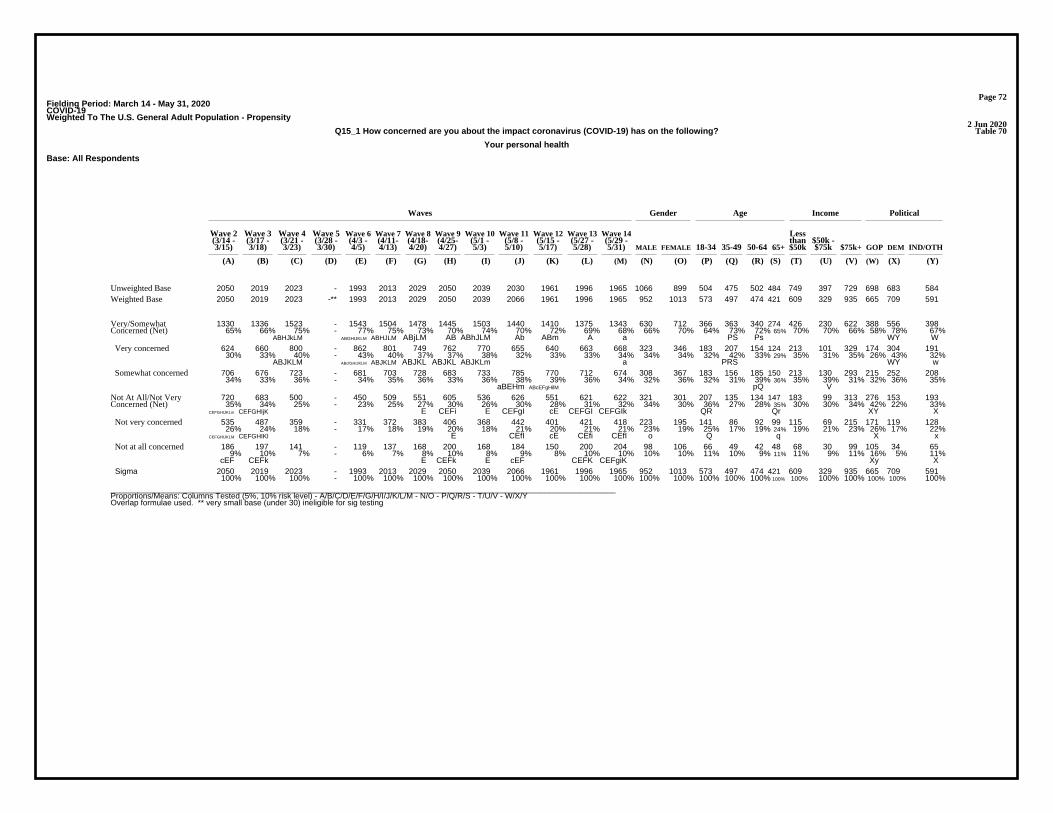
Page 72Fielding Period: March 14 - May 31, 2020COVID-19Weighted To The U.S. General Adult Population - Propensity
2 Jun 2020Table 70Q15_1 How concerned are you about the impact coronavirus (COVID-19) has on the following?
Your personal health
Base: All Respondents
Waves Gender Age Income Political
Wave 2 Wave 3 Wave 4 Wave 5 Wave 6 Wave 7 Wave 8 Wave 9 Wave 10 Wave 11 Wave 12 Wave 13 Wave 14 Less(3/14 - (3/17 - (3/21 - (3/28 - (4/3 - (4/11- (4/18- (4/25- (5/1 - (5/8 - (5/15 - (5/27 - (5/29 - than $50k -3/15) 3/18) 3/23) 3/30) 4/5) 4/13) 4/20) 4/27) 5/3) 5/10) 5/17) 5/28) 5/31) MALE FEMALE 18-34 35-49 50-64 65+ $50k $75k $75k+ GOP DEM IND/OTH
(A) (B) (C) (D) (E) (F) (G) (H) (I) (J) (K) (L) (M) (N) (O) (P) (Q) (R) (S) (T) (U) (V) (W) (X) (Y)
2050 2019 2023 - 1993 2013 2029 2050 2039 2030 1961 1996 1965 1066 899 504 475 502 484 749 397 729 698 683 584Unweighted Base2050 2019 2023 -** 1993 2013 2029 2050 2039 2066 1961 1996 1965 952 1013 573 497 474 421 609 329 935 665 709 591Weighted Base
1330 1336 1523 - 1543 1504 1478 1445 1503 1440 1410 1375 1343 630 712 366 363 340 274 426 230 622 388 556 39865% 66% 75% - 77% 75% 73% 70% 74% 70% 72% 69% 68% 66% 70% 64% 73% 72% 65% 70% 70% 66% 58% 78% 67%
ABHJkLM ABGHIJKLM ABHJLM ABjLM AB ABhJLM Ab ABm A a PS Ps WY W
Very/SomewhatConcerned (Net)
624 660 800 - 862 801 749 762 770 655 640 663 668 323 346 183 207 154 124 213 101 329 174 304 19130% 33% 40% - 43% 40% 37% 37% 38% 32% 33% 33% 34% 34% 34% 32% 42% 33% 29% 35% 31% 35% 26% 43% 32%
ABJKLM ABcfGHIJKLM ABJKLM ABJKL ABJKL ABJKLm a PRS WY w
Very concerned
706 676 723 - 681 703 728 683 733 785 770 712 674 308 367 183 156 185 150 213 130 293 215 252 20834% 33% 36% - 34% 35% 36% 33% 36% 38% 39% 36% 34% 32% 36% 32% 31% 39% 36% 35% 39% 31% 32% 36% 35%
aBEHm ABcEFgHilM pQ V
Somewhat concerned
720 683 500 - 450 509 551 605 536 626 551 621 622 321 301 207 135 134 147 183 99 313 276 153 19335% 34% 25% - 23% 25% 27% 30% 26% 30% 28% 31% 32% 34% 30% 36% 27% 28% 35% 30% 30% 34% 42% 22% 33%
CEFGHIJKLm CEFGHIjK E CEFi E CEFgI cE CEFGI CEFGIk QR Qr XY X
Not At All/Not VeryConcerned (Net)
535 487 359 - 331 372 383 406 368 442 401 421 418 223 195 141 86 92 99 115 69 215 171 119 12826% 24% 18% - 17% 18% 19% 20% 18% 21% 20% 21% 21% 23% 19% 25% 17% 19% 24% 19% 21% 23% 26% 17% 22%
CEFGHIJKLM CEFGHIKl E CEfI cE CEfi CEfI o Q q X x
Not very concerned
186 197 141 - 119 137 168 200 168 184 150 200 204 98 106 66 49 42 48 68 30 99 105 34 659% 10% 7% - 6% 7% 8% 10% 8% 9% 8% 10% 10% 10% 10% 11% 10% 9% 11% 11% 9% 11% 16% 5% 11%
cEF CEFk E CEFk E cEF CEFK CEFgiK Xy X
Not at all concerned
2050 2019 2023 - 1993 2013 2029 2050 2039 2066 1961 1996 1965 952 1013 573 497 474 421 609 329 935 665 709 591100% 100% 100% - 100% 100% 100% 100% 100% 100% 100% 100% 100% 100% 100% 100% 100% 100% 100% 100% 100% 100% 100% 100% 100%
Sigma
__________________________________________________________________________________________________________________Proportions/Means: Columns Tested (5%, 10% risk level) - A/B/C/D/E/F/G/H/I/J/K/L/M - N/O - P/Q/R/S - T/U/V - W/X/YOverlap formulae used. ** very small base (under 30) ineligible for sig testing

Page 73Fielding Period: March 14 - May 31, 2020COVID-19Weighted To The U.S. General Adult Population - Propensity
2 Jun 2020Table 71Q15_2 How concerned are you about the impact coronavirus (COVID-19) has on the following?
The health of your older friends and relatives
Base: All Respondents
Waves Gender Age Income Political
Wave 2 Wave 3 Wave 4 Wave 5 Wave 6 Wave 7 Wave 8 Wave 9 Wave 10 Wave 11 Wave 12 Wave 13 Wave 14 Less(3/14 - (3/17 - (3/21 - (3/28 - (4/3 - (4/11- (4/18- (4/25- (5/1 - (5/8 - (5/15 - (5/27 - (5/29 - than $50k -3/15) 3/18) 3/23) 3/30) 4/5) 4/13) 4/20) 4/27) 5/3) 5/10) 5/17) 5/28) 5/31) MALE FEMALE 18-34 35-49 50-64 65+ $50k $75k $75k+ GOP DEM IND/OTH
(A) (B) (C) (D) (E) (F) (G) (H) (I) (J) (K) (L) (M) (N) (O) (P) (Q) (R) (S) (T) (U) (V) (W) (X) (Y)
2050 2019 2023 - 1993 2013 2029 2050 2039 2030 1961 1996 1965 1066 899 504 475 502 484 749 397 729 698 683 584Unweighted Base2050 2019 2023 -** 1993 2013 2029 2050 2039 2066 1961 1996 1965 952 1013 573 497 474 421 609 329 935 665 709 591Weighted Base
1771 1747 1827 - 1800 1778 1779 1734 1746 1674 1643 1690 1628 766 862 460 412 400 355 502 276 783 511 649 46886% 87% 90% - 90% 88% 88% 85% 86% 81% 84% 85% 83% 80% 85% 80% 83% 84% 84% 82% 84% 84% 77% 92% 79%
JkM JkM ABGHIJKLM ABGHIJKLM HIJKLM HJKLM J Jm j J N WY
Very/SomewhatConcerned (Net)
1034 1089 1251 - 1211 1124 1091 1040 1075 953 955 1021 936 436 500 272 256 239 169 285 146 466 264 395 27750% 54% 62% - 61% 56% 54% 51% 53% 46% 49% 51% 48% 46% 49% 47% 51% 50% 40% 47% 44% 50% 40% 56% 47%
J aJKM ABFGHIJKLM ABFGHIJKLM AHJKLM aJKM J JKM Jm s S S WY w
Very concerned
737 658 576 - 588 654 687 694 670 721 688 669 692 330 362 188 156 161 186 217 130 317 247 254 19136% 33% 28% - 30% 32% 34% 34% 33% 35% 35% 33% 35% 35% 36% 33% 31% 34% 44% 36% 39% 34% 37% 36% 32%
bCEf C C CE CE Ce CE CE CE CE PQR
Somewhat concerned
279 272 196 - 193 235 250 316 293 392 318 306 337 186 152 113 85 73 65 107 53 152 154 60 12414% 13% 10% - 10% 12% 12% 15% 14% 19% 16% 15% 17% 20% 15% 20% 17% 16% 16% 18% 16% 16% 23% 8% 21%CE CE CE CEFG CEF ABCEFGHIkL abCEFG CEFG ABCEFGi O X X
Not At All/Not VeryConcerned (Net)
183 176 129 - 136 173 167 192 218 269 224 189 233 127 106 71 60 57 45 60 38 114 102 45 869% 9% 6% - 7% 9% 8% 9% 11% 13% 11% 9% 12% 13% 10% 12% 12% 12% 11% 10% 11% 12% 15% 6% 15%
Ce Ce Ce c CE CEfG ABCEFGHiL ABCEFG CE ABCEFGHl X X
Not very concerned
96 95 67 - 57 62 84 124 76 123 94 117 104 59 45 42 26 16 20 47 16 37 52 15 375% 5% 3% - 3% 3% 4% 6% 4% 6% 5% 6% 5% 6% 4% 7% 5% 3% 5% 8% 5% 4% 8% 2% 6%
cEF cEF e CEFGI CEFGI cEF CEFGI CEFi R V X X
Not at all concerned
2050 2019 2023 - 1993 2013 2029 2050 2039 2066 1961 1996 1965 952 1013 573 497 474 421 609 329 935 665 709 591100% 100% 100% - 100% 100% 100% 100% 100% 100% 100% 100% 100% 100% 100% 100% 100% 100% 100% 100% 100% 100% 100% 100% 100%
Sigma
__________________________________________________________________________________________________________________Proportions/Means: Columns Tested (5%, 10% risk level) - A/B/C/D/E/F/G/H/I/J/K/L/M - N/O - P/Q/R/S - T/U/V - W/X/YOverlap formulae used. ** very small base (under 30) ineligible for sig testing
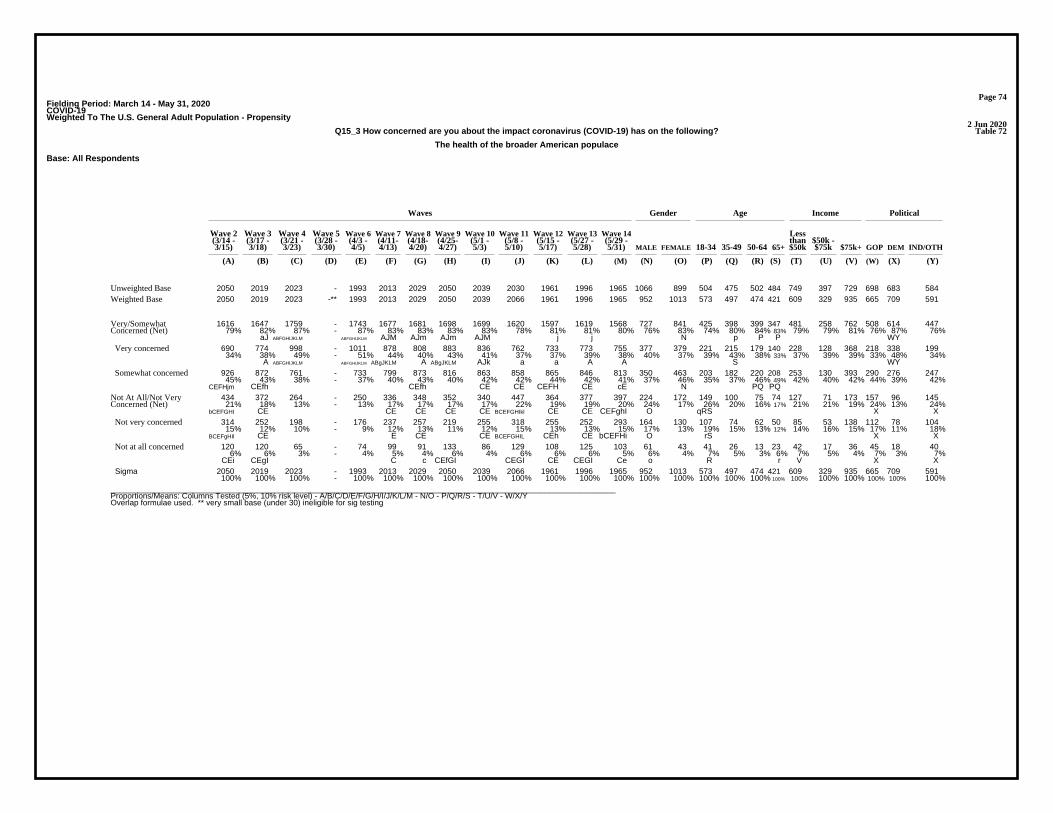
Page 74Fielding Period: March 14 - May 31, 2020COVID-19Weighted To The U.S. General Adult Population - Propensity
2 Jun 2020Table 72Q15_3 How concerned are you about the impact coronavirus (COVID-19) has on the following?
The health of the broader American populace
Base: All Respondents
Waves Gender Age Income Political
Wave 2 Wave 3 Wave 4 Wave 5 Wave 6 Wave 7 Wave 8 Wave 9 Wave 10 Wave 11 Wave 12 Wave 13 Wave 14 Less(3/14 - (3/17 - (3/21 - (3/28 - (4/3 - (4/11- (4/18- (4/25- (5/1 - (5/8 - (5/15 - (5/27 - (5/29 - than $50k -3/15) 3/18) 3/23) 3/30) 4/5) 4/13) 4/20) 4/27) 5/3) 5/10) 5/17) 5/28) 5/31) MALE FEMALE 18-34 35-49 50-64 65+ $50k $75k $75k+ GOP DEM IND/OTH
(A) (B) (C) (D) (E) (F) (G) (H) (I) (J) (K) (L) (M) (N) (O) (P) (Q) (R) (S) (T) (U) (V) (W) (X) (Y)
2050 2019 2023 - 1993 2013 2029 2050 2039 2030 1961 1996 1965 1066 899 504 475 502 484 749 397 729 698 683 584Unweighted Base2050 2019 2023 -** 1993 2013 2029 2050 2039 2066 1961 1996 1965 952 1013 573 497 474 421 609 329 935 665 709 591Weighted Base
1616 1647 1759 - 1743 1677 1681 1698 1699 1620 1597 1619 1568 727 841 425 398 399 347 481 258 762 508 614 44779% 82% 87% - 87% 83% 83% 83% 83% 78% 81% 81% 80% 76% 83% 74% 80% 84% 83% 79% 79% 81% 76% 87% 76%
aJ ABFGHIJKLM ABFGHIJKLM AJM AJm AJm AJM j j N p P P WY
Very/SomewhatConcerned (Net)
690 774 998 - 1011 878 808 883 836 762 733 773 755 377 379 221 215 179 140 228 128 368 218 338 19934% 38% 49% - 51% 44% 40% 43% 41% 37% 37% 39% 38% 40% 37% 39% 43% 38% 33% 37% 39% 39% 33% 48% 34%
A ABFGHIJKLM ABFGHIJKLM ABgJKLM A ABgJKLM AJk a a A A S WY
Very concerned
926 872 761 - 733 799 873 816 863 858 865 846 813 350 463 203 182 220 208 253 130 393 290 276 24745% 43% 38% - 37% 40% 43% 40% 42% 42% 44% 42% 41% 37% 46% 35% 37% 46% 49% 42% 40% 42% 44% 39% 42%
CEFHjm CEfh CEfh CE CE CEFH CE cE N PQ PQ
Somewhat concerned
434 372 264 - 250 336 348 352 340 447 364 377 397 224 172 149 100 75 74 127 71 173 157 96 14521% 18% 13% - 13% 17% 17% 17% 17% 22% 19% 19% 20% 24% 17% 26% 20% 16% 17% 21% 21% 19% 24% 13% 24%
bCEFGHI CE CE CE CE CE BCEFGHIkl CE CE CEFghI O qRS X X
Not At All/Not VeryConcerned (Net)
314 252 198 - 176 237 257 219 255 318 255 252 293 164 130 107 74 62 50 85 53 138 112 78 10415% 12% 10% - 9% 12% 13% 11% 12% 15% 13% 13% 15% 17% 13% 19% 15% 13% 12% 14% 16% 15% 17% 11% 18%
BCEFgHIl CE E CE CE BCEFGHIL CEh CE bCEFHi O rS X X
Not very concerned
120 120 65 - 74 99 91 133 86 129 108 125 103 61 43 41 26 13 23 42 17 36 45 18 406% 6% 3% - 4% 5% 4% 6% 4% 6% 6% 6% 5% 6% 4% 7% 5% 3% 6% 7% 5% 4% 7% 3% 7%
CEi CEgI C c CEfGI CEGI CE CEGI Ce o R r V X X
Not at all concerned
2050 2019 2023 - 1993 2013 2029 2050 2039 2066 1961 1996 1965 952 1013 573 497 474 421 609 329 935 665 709 591100% 100% 100% - 100% 100% 100% 100% 100% 100% 100% 100% 100% 100% 100% 100% 100% 100% 100% 100% 100% 100% 100% 100% 100%
Sigma
__________________________________________________________________________________________________________________Proportions/Means: Columns Tested (5%, 10% risk level) - A/B/C/D/E/F/G/H/I/J/K/L/M - N/O - P/Q/R/S - T/U/V - W/X/YOverlap formulae used. ** very small base (under 30) ineligible for sig testing

Page 75Fielding Period: March 14 - May 31, 2020COVID-19Weighted To The U.S. General Adult Population - Propensity
2 Jun 2020Table 73Q15_4 How concerned are you about the impact coronavirus (COVID-19) has on the following?
The American economy
Base: All Respondents
Waves Gender Age Income Political
Wave 2 Wave 3 Wave 4 Wave 5 Wave 6 Wave 7 Wave 8 Wave 9 Wave 10 Wave 11 Wave 12 Wave 13 Wave 14 Less(3/14 - (3/17 - (3/21 - (3/28 - (4/3 - (4/11- (4/18- (4/25- (5/1 - (5/8 - (5/15 - (5/27 - (5/29 - than $50k -3/15) 3/18) 3/23) 3/30) 4/5) 4/13) 4/20) 4/27) 5/3) 5/10) 5/17) 5/28) 5/31) MALE FEMALE 18-34 35-49 50-64 65+ $50k $75k $75k+ GOP DEM IND/OTH
(A) (B) (C) (D) (E) (F) (G) (H) (I) (J) (K) (L) (M) (N) (O) (P) (Q) (R) (S) (T) (U) (V) (W) (X) (Y)
2050 2019 2023 - 1993 2013 2029 2050 2039 2030 1961 1996 1965 1066 899 504 475 502 484 749 397 729 698 683 584Unweighted Base2050 2019 2023 -** 1993 2013 2029 2050 2039 2066 1961 1996 1965 952 1013 573 497 474 421 609 329 935 665 709 591Weighted Base
1730 1705 1845 - 1820 1787 1825 1777 1786 1737 1733 1737 1737 821 916 477 445 430 385 521 300 843 590 632 51684% 84% 91% - 91% 89% 90% 87% 88% 84% 88% 87% 88% 86% 90% 83% 89% 91% 91% 86% 91% 90% 89% 89% 87%
ABFHIJKLM ABFHIJKLM ABJ ABHiJL aj ABJ ABJ abJ ABJ N P P P T T
Very/SomewhatConcerned (Net)
893 986 1287 - 1251 1184 1139 1170 1106 1053 1140 1069 1084 505 579 257 279 307 242 319 184 531 364 410 31144% 49% 64% - 63% 59% 56% 57% 54% 51% 58% 54% 55% 53% 57% 45% 56% 65% 57% 52% 56% 57% 55% 58% 53%
A ABFGHIJKLM ABFGHIJKLM ABIJLm ABJ ABJl ABj A ABiJL AB ABJ P PQs P
Very concerned
836 719 558 - 569 603 685 607 680 684 592 668 653 316 337 221 166 123 143 202 116 311 226 222 20541% 36% 28% - 29% 30% 34% 30% 33% 33% 30% 33% 33% 33% 33% 38% 33% 26% 34% 33% 35% 33% 34% 31% 35%
BCEFGHIJKLM CEFHK CEFHk CEfHk CEfh CEfHk CEfh R r R
Somewhat concerned
320 314 178 - 173 226 204 273 253 329 228 259 228 130 97 96 53 43 36 88 29 92 75 78 7516% 16% 9% - 9% 11% 10% 13% 12% 16% 12% 13% 12% 14% 10% 17% 11% 9% 9% 14% 9% 10% 11% 11% 13%
CEFGhIKlM CEFGIKlM CE CEG CEg CEFGhIKLM CE CEG CE O QRS UV
Not At All/Not VeryConcerned (Net)
225 220 99 - 116 170 132 170 183 221 175 171 160 96 63 64 36 31 29 56 24 65 45 63 5111% 11% 5% - 6% 8% 7% 8% 9% 11% 9% 9% 8% 10% 6% 11% 7% 7% 7% 9% 7% 7% 7% 9% 9%
CEFGHikLM CEFGHlM CEg c CEg CEG CEfGHlM CEG CEG CE O Rs
Not very concerned
95 94 80 - 57 55 72 103 71 108 53 89 68 34 34 32 17 12 7 32 5 27 30 14 245% 5% 4% - 3% 3% 4% 5% 3% 5% 3% 4% 3% 4% 3% 6% 3% 3% 2% 5% 2% 3% 4% 2% 4%
EFK EFK fk EFgIKm EFGIKM EFK rS Uv X x
Not at all concerned
2050 2019 2023 - 1993 2013 2029 2050 2039 2066 1961 1996 1965 952 1013 573 497 474 421 609 329 935 665 709 591100% 100% 100% - 100% 100% 100% 100% 100% 100% 100% 100% 100% 100% 100% 100% 100% 100% 100% 100% 100% 100% 100% 100% 100%
Sigma
__________________________________________________________________________________________________________________Proportions/Means: Columns Tested (5%, 10% risk level) - A/B/C/D/E/F/G/H/I/J/K/L/M - N/O - P/Q/R/S - T/U/V - W/X/YOverlap formulae used. ** very small base (under 30) ineligible for sig testing
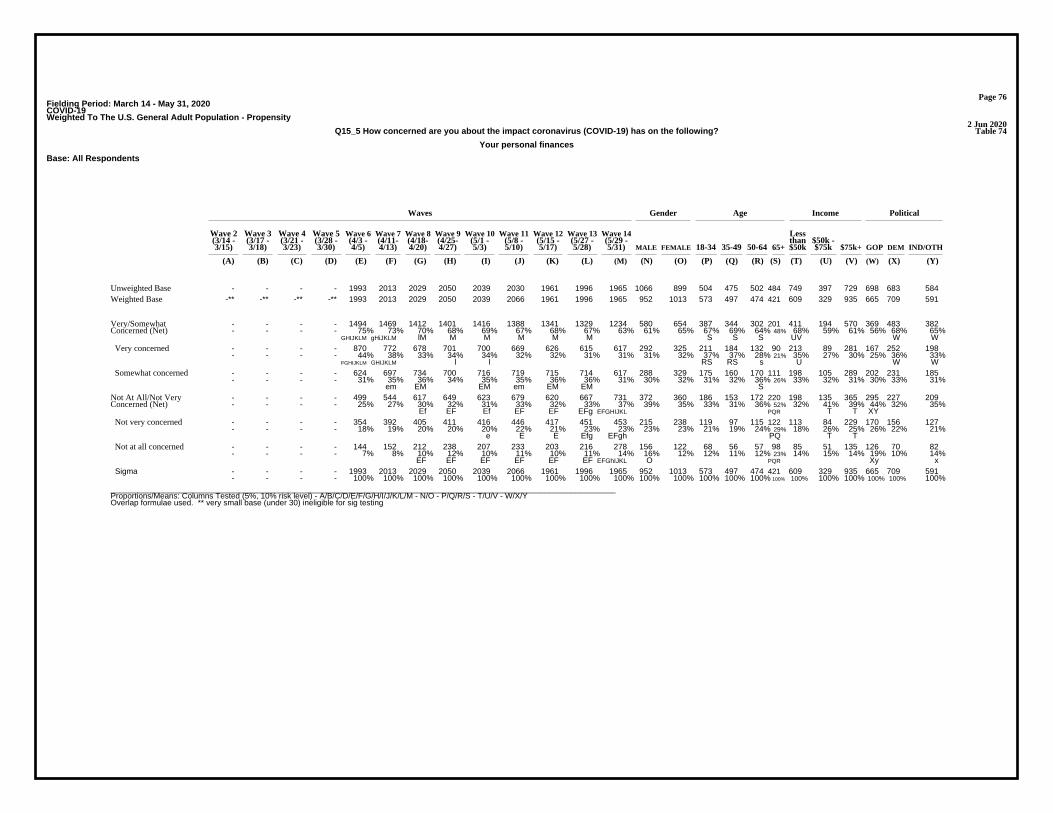
Page 76Fielding Period: March 14 - May 31, 2020COVID-19Weighted To The U.S. General Adult Population - Propensity
2 Jun 2020Table 74Q15_5 How concerned are you about the impact coronavirus (COVID-19) has on the following?
Your personal finances
Base: All Respondents
Waves Gender Age Income Political
Wave 2 Wave 3 Wave 4 Wave 5 Wave 6 Wave 7 Wave 8 Wave 9 Wave 10 Wave 11 Wave 12 Wave 13 Wave 14 Less(3/14 - (3/17 - (3/21 - (3/28 - (4/3 - (4/11- (4/18- (4/25- (5/1 - (5/8 - (5/15 - (5/27 - (5/29 - than $50k -3/15) 3/18) 3/23) 3/30) 4/5) 4/13) 4/20) 4/27) 5/3) 5/10) 5/17) 5/28) 5/31) MALE FEMALE 18-34 35-49 50-64 65+ $50k $75k $75k+ GOP DEM IND/OTH
(A) (B) (C) (D) (E) (F) (G) (H) (I) (J) (K) (L) (M) (N) (O) (P) (Q) (R) (S) (T) (U) (V) (W) (X) (Y)
- - - - 1993 2013 2029 2050 2039 2030 1961 1996 1965 1066 899 504 475 502 484 749 397 729 698 683 584Unweighted Base-** -** -** -** 1993 2013 2029 2050 2039 2066 1961 1996 1965 952 1013 573 497 474 421 609 329 935 665 709 591Weighted Base
- - - - 1494 1469 1412 1401 1416 1388 1341 1329 1234 580 654 387 344 302 201 411 194 570 369 483 382- - - - 75% 73% 70% 68% 69% 67% 68% 67% 63% 61% 65% 67% 69% 64% 48% 68% 59% 61% 56% 68% 65%
GHIJKLM gHiJKLM lM M M M M M S S S UV W W
Very/SomewhatConcerned (Net)
- - - - 870 772 678 701 700 669 626 615 617 292 325 211 184 132 90 213 89 281 167 252 198- - - - 44% 38% 33% 34% 34% 32% 32% 31% 31% 31% 32% 37% 37% 28% 21% 35% 27% 30% 25% 36% 33%
FGHIJKLM GHIJKLM l l RS RS s U W W
Very concerned
- - - - 624 697 734 700 716 719 715 714 617 288 329 175 160 170 111 198 105 289 202 231 185- - - - 31% 35% 36% 34% 35% 35% 36% 36% 31% 30% 32% 31% 32% 36% 26% 33% 32% 31% 30% 33% 31%
em EM EM em EM EM S
Somewhat concerned
- - - - 499 544 617 649 623 679 620 667 731 372 360 186 153 172 220 198 135 365 295 227 209- - - - 25% 27% 30% 32% 31% 33% 32% 33% 37% 39% 35% 33% 31% 36% 52% 32% 41% 39% 44% 32% 35%
Ef EF Ef EF EF EFg EFGHIJKL PQR T T XY
Not At All/Not VeryConcerned (Net)
- - - - 354 392 405 411 416 446 417 451 453 215 238 119 97 115 122 113 84 229 170 156 127- - - - 18% 19% 20% 20% 20% 22% 21% 23% 23% 23% 23% 21% 19% 24% 29% 18% 26% 25% 26% 22% 21%
e E E Efg EFgh PQ T T
Not very concerned
- - - - 144 152 212 238 207 233 203 216 278 156 122 68 56 57 98 85 51 135 126 70 82- - - - 7% 8% 10% 12% 10% 11% 10% 11% 14% 16% 12% 12% 11% 12% 23% 14% 15% 14% 19% 10% 14%
EF EF EF EF EF EF EFGhIJKL O PQR Xy x
Not at all concerned
- - - - 1993 2013 2029 2050 2039 2066 1961 1996 1965 952 1013 573 497 474 421 609 329 935 665 709 591- - - - 100% 100% 100% 100% 100% 100% 100% 100% 100% 100% 100% 100% 100% 100% 100% 100% 100% 100% 100% 100% 100%
Sigma
__________________________________________________________________________________________________________________Proportions/Means: Columns Tested (5%, 10% risk level) - A/B/C/D/E/F/G/H/I/J/K/L/M - N/O - P/Q/R/S - T/U/V - W/X/YOverlap formulae used. ** very small base (under 30) ineligible for sig testing

Page 77Fielding Period: March 14 - May 31, 2020COVID-19Weighted To The U.S. General Adult Population - Propensity
2 Jun 2020Table 75Q18 Which of the following is true for you?
Base: All Respondents
Waves Gender Age Income Political
Wave 2 Wave 3 Wave 4 Wave 5 Wave 6 Wave 7 Wave 8 Wave 9 Wave 10 Wave 11 Wave 12 Wave 13 Wave 14 Less(3/14 - (3/17 - (3/21 - (3/28 - (4/3 - (4/11- (4/18- (4/25- (5/1 - (5/8 - (5/15 - (5/27 - (5/29 - than $50k -3/15) 3/18) 3/23) 3/30) 4/5) 4/13) 4/20) 4/27) 5/3) 5/10) 5/17) 5/28) 5/31) MALE FEMALE 18-34 35-49 50-64 65+ $50k $75k $75k+ GOP DEM IND/OTH
(A) (B) (C) (D) (E) (F) (G) (H) (I) (J) (K) (L) (M) (N) (O) (P) (Q) (R) (S) (T) (U) (V) (W) (X) (Y)
2050 2019 2023 2016 1993 2013 2029 2050 2039 2030 1961 1996 1965 1066 899 504 475 502 484 749 397 729 698 683 584Unweighted Base2050 2019 2023 2016 1993 2013 2029 2050 2039 2066 1961 1996 1965 952 1013 573 497 474 421 609 329 935 665 709 591Weighted Base
563 572 712 865 1113 950 897 1055 1036 1032 965 962 959 445 514 243 227 253 235 299 171 440 270 403 28627% 28% 35% 43% 56% 47% 44% 51% 51% 50% 49% 48% 49% 47% 51% 42% 46% 53% 56% 49% 52% 47% 41% 57% 48%
AB ABC ABCDFGHIJKLM ABCD ABC ABCDFGl ABCDfG ABCDG ABCDG ABCDG ABCDG Pq PQ WY W
I fear I could die as aresult of contractingcoronavirus
1487 1447 1311 1151 880 1063 1132 995 1003 1034 996 1034 1006 507 499 330 270 221 186 310 158 495 394 306 30573% 72% 65% 57% 44% 53% 56% 49% 49% 50% 51% 52% 51% 53% 49% 58% 54% 47% 44% 51% 48% 53% 59% 43% 52%
CDEFGHIJKLM CDEFGHIJKLM DEFGHIJKLM EFHIJKLM EHi EHIJKLM E E E E Eh E RS rS XY X
I do not fear that I coulddie as a result ofcontracting coronavirus
2050 2019 2023 2016 1993 2013 2029 2050 2039 2066 1961 1996 1965 952 1013 573 497 474 421 609 329 935 665 709 591100% 100% 100% 100% 100% 100% 100% 100% 100% 100% 100% 100% 100% 100% 100% 100% 100% 100% 100% 100% 100% 100% 100% 100% 100%
Sigma
__________________________________________________________________________________________________________________Proportions/Means: Columns Tested (5%, 10% risk level) - A/B/C/D/E/F/G/H/I/J/K/L/M - N/O - P/Q/R/S - T/U/V - W/X/YOverlap formulae used.
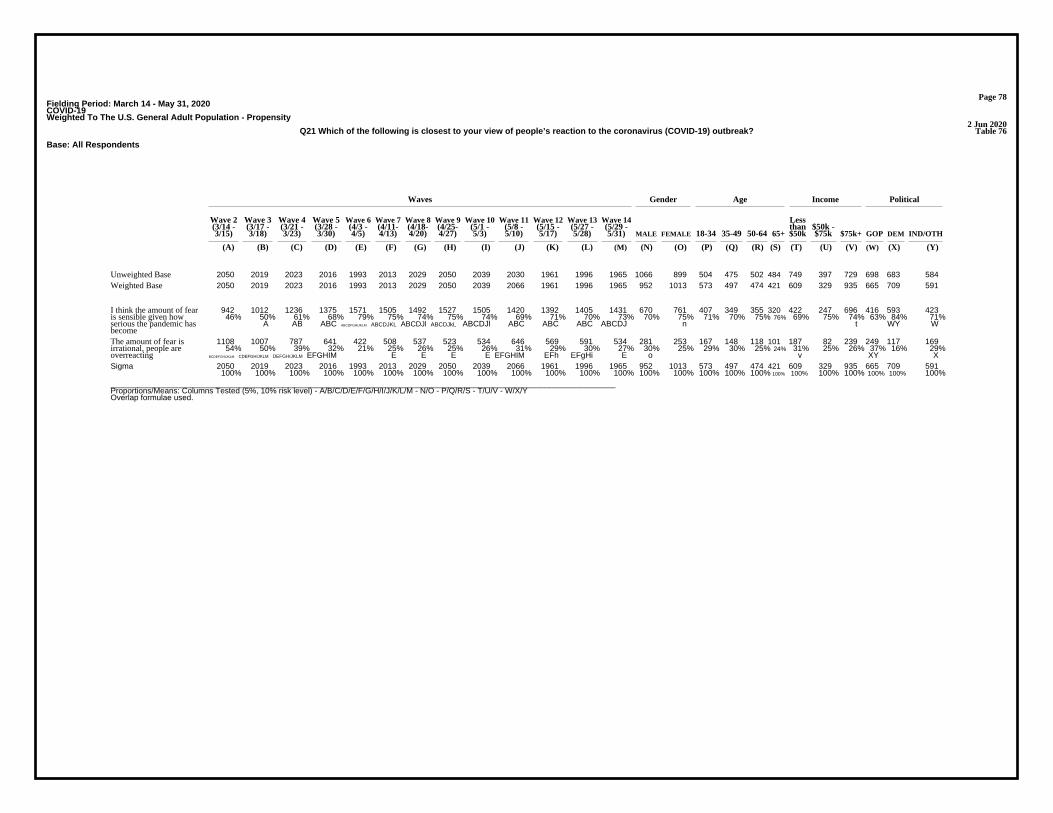
Page 78Fielding Period: March 14 - May 31, 2020COVID-19Weighted To The U.S. General Adult Population - Propensity
2 Jun 2020Table 76Q21 Which of the following is closest to your view of people’s reaction to the coronavirus (COVID-19) outbreak?
Base: All Respondents
Waves Gender Age Income Political
Wave 2 Wave 3 Wave 4 Wave 5 Wave 6 Wave 7 Wave 8 Wave 9 Wave 10 Wave 11 Wave 12 Wave 13 Wave 14 Less(3/14 - (3/17 - (3/21 - (3/28 - (4/3 - (4/11- (4/18- (4/25- (5/1 - (5/8 - (5/15 - (5/27 - (5/29 - than $50k -3/15) 3/18) 3/23) 3/30) 4/5) 4/13) 4/20) 4/27) 5/3) 5/10) 5/17) 5/28) 5/31) MALE FEMALE 18-34 35-49 50-64 65+ $50k $75k $75k+ GOP DEM IND/OTH
(A) (B) (C) (D) (E) (F) (G) (H) (I) (J) (K) (L) (M) (N) (O) (P) (Q) (R) (S) (T) (U) (V) (W) (X) (Y)
2050 2019 2023 2016 1993 2013 2029 2050 2039 2030 1961 1996 1965 1066 899 504 475 502 484 749 397 729 698 683 584Unweighted Base2050 2019 2023 2016 1993 2013 2029 2050 2039 2066 1961 1996 1965 952 1013 573 497 474 421 609 329 935 665 709 591Weighted Base
942 1012 1236 1375 1571 1505 1492 1527 1505 1420 1392 1405 1431 670 761 407 349 355 320 422 247 696 416 593 42346% 50% 61% 68% 79% 75% 74% 75% 74% 69% 71% 70% 73% 70% 75% 71% 70% 75% 76% 69% 75% 74% 63% 84% 71%
A AB ABC ABCDFGHIJKLM ABCDJKL ABCDJl ABCDJkL ABCDJl ABC ABC ABC ABCDJ n t WY W
I think the amount of fearis sensible given howserious the pandemic hasbecome
1108 1007 787 641 422 508 537 523 534 646 569 591 534 281 253 167 148 118 101 187 82 239 249 117 16954% 50% 39% 32% 21% 25% 26% 25% 26% 31% 29% 30% 27% 30% 25% 29% 30% 25% 24% 31% 25% 26% 37% 16% 29%
BCDEFGHIJKLM CDEFGHIJKLM DEFGHIJKLM EFGHIM E E E E EFGHIM EFh EFgHi E o v XY X
The amount of fear isirrational, people areoverreacting
2050 2019 2023 2016 1993 2013 2029 2050 2039 2066 1961 1996 1965 952 1013 573 497 474 421 609 329 935 665 709 591100% 100% 100% 100% 100% 100% 100% 100% 100% 100% 100% 100% 100% 100% 100% 100% 100% 100% 100% 100% 100% 100% 100% 100% 100%
Sigma
__________________________________________________________________________________________________________________Proportions/Means: Columns Tested (5%, 10% risk level) - A/B/C/D/E/F/G/H/I/J/K/L/M - N/O - P/Q/R/S - T/U/V - W/X/YOverlap formulae used.

Page 79Fielding Period: March 14 - May 31, 2020COVID-19Weighted To The U.S. General Adult Population - Propensity
2 Jun 2020Table 77Q12 Do you have a positive or negative view when people use Personal Protective Equipment (gloves, face-masks, goggles, etc.) in public spaces?
Base: All Respondents
Waves Gender Age Income Political
Wave 2 Wave 3 Wave 4 Wave 5 Wave 6 Wave 7 Wave 8 Wave 9 Wave 10 Wave 11 Wave 12 Wave 13 Wave 14 Less(3/14 - (3/17 - (3/21 - (3/28 - (4/3 - (4/11- (4/18- (4/25- (5/1 - (5/8 - (5/15 - (5/27 - (5/29 - than $50k -3/15) 3/18) 3/23) 3/30) 4/5) 4/13) 4/20) 4/27) 5/3) 5/10) 5/17) 5/28) 5/31) MALE FEMALE 18-34 35-49 50-64 65+ $50k $75k $75k+ GOP DEM IND/OTH
(A) (B) (C) (D) (E) (F) (G) (H) (I) (J) (K) (L) (M) (N) (O) (P) (Q) (R) (S) (T) (U) (V) (W) (X) (Y)
- - - 2016 - - - - - 2030 1961 1996 1965 1066 899 504 475 502 484 749 397 729 698 683 584Unweighted Base-** -** -** 2016 -** -** -** -** -** 2066 1961 1996 1965 952 1013 573 497 474 421 609 329 935 665 709 591Weighted Base
- - - 1098 - - - - - 1398 1343 1329 1391 669 722 377 350 329 335 404 234 692 439 578 374- - - 54% - - - - - 68% 68% 67% 71% 70% 71% 66% 70% 70% 80% 66% 71% 74% 66% 82% 63%
D D D DjL PQR T WY
Positive
- - - 663 - - - - - 384 354 433 362 173 189 113 82 102 64 133 63 143 144 80 138- - - 33% - - - - - 19% 18% 22% 18% 18% 19% 20% 17% 22% 15% 22% 19% 15% 22% 11% 23%
JKLM JKM S V X X
Neither
- - - 255 - - - - - 284 264 233 212 110 103 83 65 42 22 71 31 101 82 51 79- - - 13% - - - - - 14% 13% 12% 11% 12% 10% 14% 13% 9% 5% 12% 10% 11% 12% 7% 13%
M m RS S s X X
Negative
- - - 2016 - - - - - 2066 1961 1996 1965 952 1013 573 497 474 421 609 329 935 665 709 591- - - 100% - - - - - 100% 100% 100% 100% 100% 100% 100% 100% 100% 100% 100% 100% 100% 100% 100% 100%
Sigma
__________________________________________________________________________________________________________________Proportions/Means: Columns Tested (5%, 10% risk level) - A/B/C/D/E/F/G/H/I/J/K/L/M - N/O - P/Q/R/S - T/U/V - W/X/YOverlap formulae used. ** very small base (under 30) ineligible for sig testing
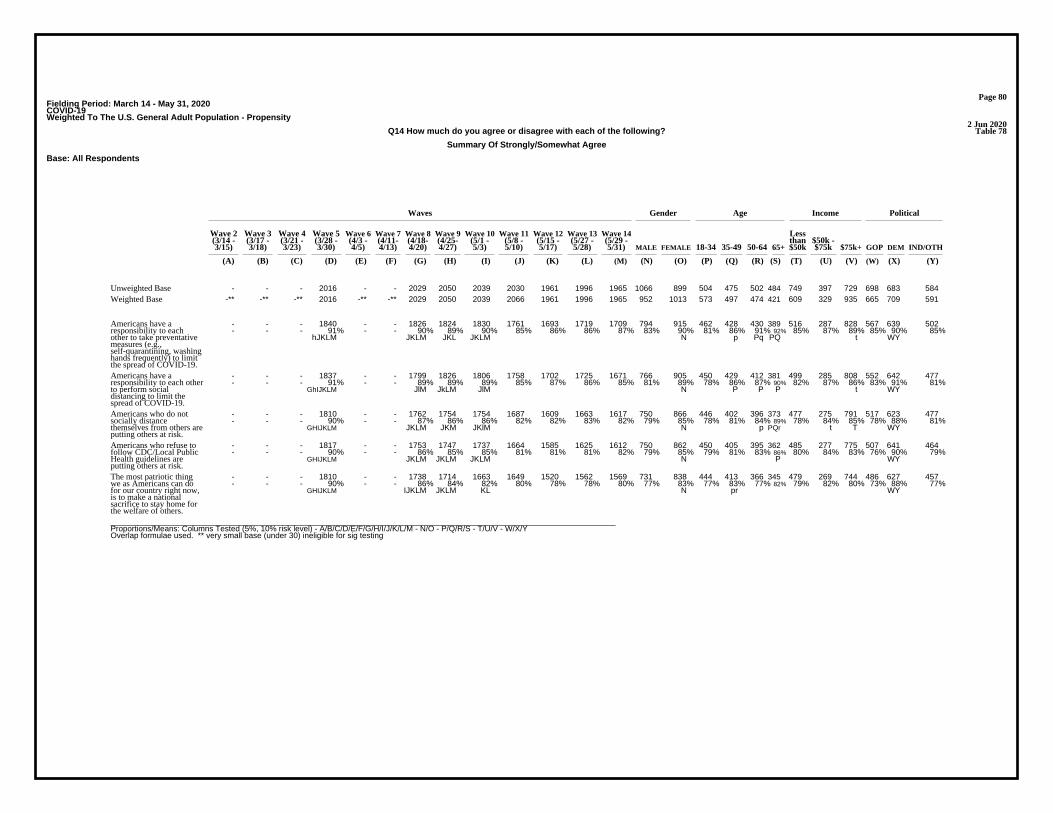
Page 80Fielding Period: March 14 - May 31, 2020COVID-19Weighted To The U.S. General Adult Population - Propensity
2 Jun 2020Table 78Q14 How much do you agree or disagree with each of the following?
Summary Of Strongly/Somewhat Agree
Base: All Respondents
Waves Gender Age Income Political
Wave 2 Wave 3 Wave 4 Wave 5 Wave 6 Wave 7 Wave 8 Wave 9 Wave 10 Wave 11 Wave 12 Wave 13 Wave 14 Less(3/14 - (3/17 - (3/21 - (3/28 - (4/3 - (4/11- (4/18- (4/25- (5/1 - (5/8 - (5/15 - (5/27 - (5/29 - than $50k -3/15) 3/18) 3/23) 3/30) 4/5) 4/13) 4/20) 4/27) 5/3) 5/10) 5/17) 5/28) 5/31) MALE FEMALE 18-34 35-49 50-64 65+ $50k $75k $75k+ GOP DEM IND/OTH
(A) (B) (C) (D) (E) (F) (G) (H) (I) (J) (K) (L) (M) (N) (O) (P) (Q) (R) (S) (T) (U) (V) (W) (X) (Y)
- - - 2016 - - 2029 2050 2039 2030 1961 1996 1965 1066 899 504 475 502 484 749 397 729 698 683 584Unweighted Base-** -** -** 2016 -** -** 2029 2050 2039 2066 1961 1996 1965 952 1013 573 497 474 421 609 329 935 665 709 591Weighted Base
- - - 1840 - - 1826 1824 1830 1761 1693 1719 1709 794 915 462 428 430 389 516 287 828 567 639 502- - - 91% - - 90% 89% 90% 85% 86% 86% 87% 83% 90% 81% 86% 91% 92% 85% 87% 89% 85% 90% 85%
hJKLM JKLM JKL JKLM N p Pq PQ t WY
Americans have aresponsibility to eachother to take preventativemeasures (e.g.,self-quarantining, washinghands frequently) to limitthe spread of COVID-19.
- - - 1837 - - 1799 1826 1806 1758 1702 1725 1671 766 905 450 429 412 381 499 285 808 552 642 477- - - 91% - - 89% 89% 89% 85% 87% 86% 85% 81% 89% 78% 86% 87% 90% 82% 87% 86% 83% 91% 81%
GhIJKLM JlM JkLM JlM N P P P t WY
Americans have aresponsibility to each otherto perform socialdistancing to limit thespread of COVID-19.
- - - 1810 - - 1762 1754 1754 1687 1609 1663 1617 750 866 446 402 396 373 477 275 791 517 623 477- - - 90% - - 87% 86% 86% 82% 82% 83% 82% 79% 85% 78% 81% 84% 89% 78% 84% 85% 78% 88% 81%
GHIJKLM JKLM JKM JKlM N p PQr t T WY
Americans who do notsocially distancethemselves from others areputting others at risk.
- - - 1817 - - 1753 1747 1737 1664 1585 1625 1612 750 862 450 405 395 362 485 277 775 507 641 464- - - 90% - - 86% 85% 85% 81% 81% 81% 82% 79% 85% 79% 81% 83% 86% 80% 84% 83% 76% 90% 79%
GHIJKLM JKLM JKLM JKLM N P WY
Americans who refuse tofollow CDC/Local PublicHealth guidelines areputting others at risk.
- - - 1810 - - 1738 1714 1663 1649 1520 1562 1569 731 838 444 413 366 345 479 269 744 486 627 457- - - 90% - - 86% 84% 82% 80% 78% 78% 80% 77% 83% 77% 83% 77% 82% 79% 82% 80% 73% 88% 77%
GHIJKLM IJKLM JKLM KL N pr WY
The most patriotic thingwe as Americans can dofor our country right now,is to make a nationalsacrifice to stay home forthe welfare of others.__________________________________________________________________________________________________________________Proportions/Means: Columns Tested (5%, 10% risk level) - A/B/C/D/E/F/G/H/I/J/K/L/M - N/O - P/Q/R/S - T/U/V - W/X/YOverlap formulae used. ** very small base (under 30) ineligible for sig testing
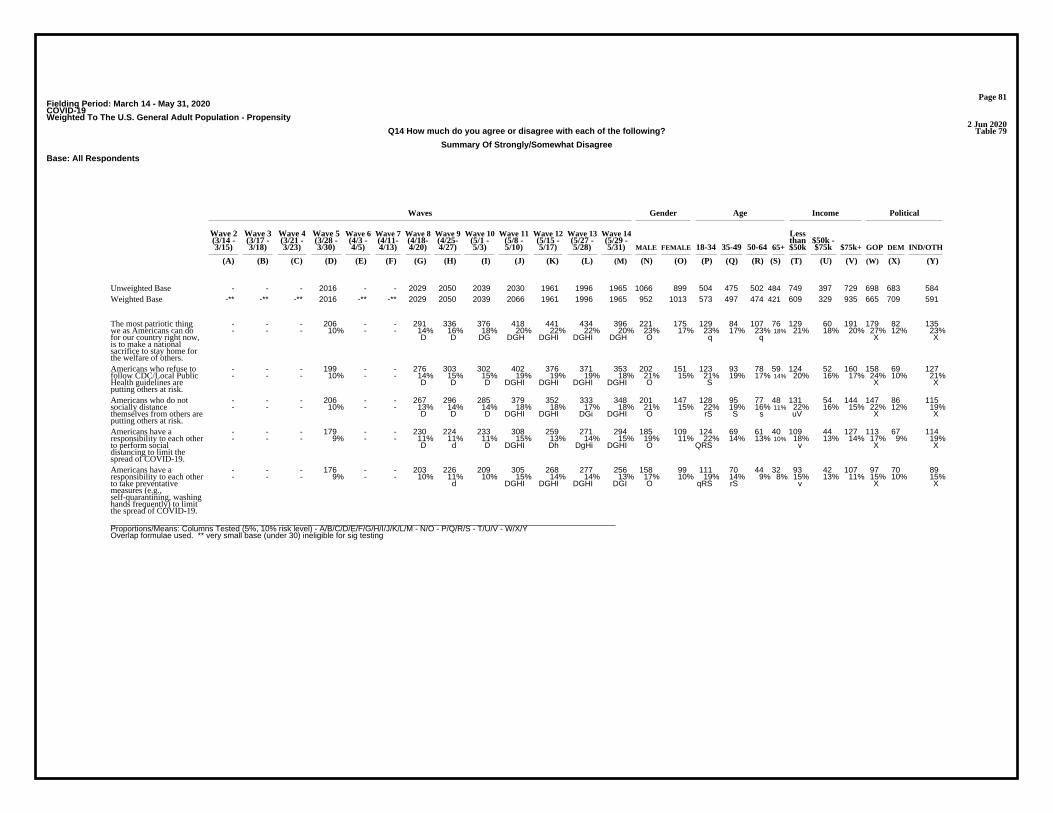
Page 81Fielding Period: March 14 - May 31, 2020COVID-19Weighted To The U.S. General Adult Population - Propensity
2 Jun 2020Table 79Q14 How much do you agree or disagree with each of the following?
Summary Of Strongly/Somewhat Disagree
Base: All Respondents
Waves Gender Age Income Political
Wave 2 Wave 3 Wave 4 Wave 5 Wave 6 Wave 7 Wave 8 Wave 9 Wave 10 Wave 11 Wave 12 Wave 13 Wave 14 Less(3/14 - (3/17 - (3/21 - (3/28 - (4/3 - (4/11- (4/18- (4/25- (5/1 - (5/8 - (5/15 - (5/27 - (5/29 - than $50k -3/15) 3/18) 3/23) 3/30) 4/5) 4/13) 4/20) 4/27) 5/3) 5/10) 5/17) 5/28) 5/31) MALE FEMALE 18-34 35-49 50-64 65+ $50k $75k $75k+ GOP DEM IND/OTH
(A) (B) (C) (D) (E) (F) (G) (H) (I) (J) (K) (L) (M) (N) (O) (P) (Q) (R) (S) (T) (U) (V) (W) (X) (Y)
- - - 2016 - - 2029 2050 2039 2030 1961 1996 1965 1066 899 504 475 502 484 749 397 729 698 683 584Unweighted Base-** -** -** 2016 -** -** 2029 2050 2039 2066 1961 1996 1965 952 1013 573 497 474 421 609 329 935 665 709 591Weighted Base
- - - 206 - - 291 336 376 418 441 434 396 221 175 129 84 107 76 129 60 191 179 82 135- - - 10% - - 14% 16% 18% 20% 22% 22% 20% 23% 17% 23% 17% 23% 18% 21% 18% 20% 27% 12% 23%
D D DG DGH DGHI DGHI DGH O q q X X
The most patriotic thingwe as Americans can dofor our country right now,is to make a nationalsacrifice to stay home forthe welfare of others.
- - - 199 - - 276 303 302 402 376 371 353 202 151 123 93 78 59 124 52 160 158 69 127- - - 10% - - 14% 15% 15% 19% 19% 19% 18% 21% 15% 21% 19% 17% 14% 20% 16% 17% 24% 10% 21%
D D D DGHI DGHI DGHI DGHI O S X X
Americans who refuse tofollow CDC/Local PublicHealth guidelines areputting others at risk.
- - - 206 - - 267 296 285 379 352 333 348 201 147 128 95 77 48 131 54 144 147 86 115- - - 10% - - 13% 14% 14% 18% 18% 17% 18% 21% 15% 22% 19% 16% 11% 22% 16% 15% 22% 12% 19%
D D D DGHI DGHI DGi DGHI O rS S s uV X X
Americans who do notsocially distancethemselves from others areputting others at risk.
- - - 179 - - 230 224 233 308 259 271 294 185 109 124 69 61 40 109 44 127 113 67 114- - - 9% - - 11% 11% 11% 15% 13% 14% 15% 19% 11% 22% 14% 13% 10% 18% 13% 14% 17% 9% 19%
D d D DGHI Dh DgHi DGHI O QRS v X X
Americans have aresponsibility to each otherto perform socialdistancing to limit thespread of COVID-19.
- - - 176 - - 203 226 209 305 268 277 256 158 99 111 70 44 32 93 42 107 97 70 89- - - 9% - - 10% 11% 10% 15% 14% 14% 13% 17% 10% 19% 14% 9% 8% 15% 13% 11% 15% 10% 15%
d DGHI DGHI DGHI DGI O qRS rS v X X
Americans have aresponsibility to each otherto take preventativemeasures (e.g.,self-quarantining, washinghands frequently) to limitthe spread of COVID-19.__________________________________________________________________________________________________________________Proportions/Means: Columns Tested (5%, 10% risk level) - A/B/C/D/E/F/G/H/I/J/K/L/M - N/O - P/Q/R/S - T/U/V - W/X/YOverlap formulae used. ** very small base (under 30) ineligible for sig testing

Page 82Fielding Period: March 14 - May 31, 2020COVID-19Weighted To The U.S. General Adult Population - Propensity
2 Jun 2020Table 80Q14_1 How much do you agree or disagree with each of the following?
Americans have a responsibility to each other to perform social distancing to limit the spread of COVID-19.
Base: All Respondents
Waves Gender Age Income Political
Wave 2 Wave 3 Wave 4 Wave 5 Wave 6 Wave 7 Wave 8 Wave 9 Wave 10 Wave 11 Wave 12 Wave 13 Wave 14 Less(3/14 - (3/17 - (3/21 - (3/28 - (4/3 - (4/11- (4/18- (4/25- (5/1 - (5/8 - (5/15 - (5/27 - (5/29 - than $50k -3/15) 3/18) 3/23) 3/30) 4/5) 4/13) 4/20) 4/27) 5/3) 5/10) 5/17) 5/28) 5/31) MALE FEMALE 18-34 35-49 50-64 65+ $50k $75k $75k+ GOP DEM IND/OTH
(A) (B) (C) (D) (E) (F) (G) (H) (I) (J) (K) (L) (M) (N) (O) (P) (Q) (R) (S) (T) (U) (V) (W) (X) (Y)
- - - 2016 - - 2029 2050 2039 2030 1961 1996 1965 1066 899 504 475 502 484 749 397 729 698 683 584Unweighted Base-** -** -** 2016 -** -** 2029 2050 2039 2066 1961 1996 1965 952 1013 573 497 474 421 609 329 935 665 709 591Weighted Base
- - - 1837 - - 1799 1826 1806 1758 1702 1725 1671 766 905 450 429 412 381 499 285 808 552 642 477- - - 91% - - 89% 89% 89% 85% 87% 86% 85% 81% 89% 78% 86% 87% 90% 82% 87% 86% 83% 91% 81%
GhIJKLM JlM JkLM JlM N P P P t WY
Strongly/Somewhat Agree(Net)
- - - 1449 - - 1343 1320 1251 1166 1060 1164 1145 501 644 249 295 310 292 341 207 540 329 503 313- - - 72% - - 66% 64% 61% 56% 54% 58% 58% 53% 64% 43% 59% 65% 69% 56% 63% 58% 50% 71% 53%
GHIJKLM IJKLM JKLM JK K K N P P PQ t WY
Strongly agree
- - - 387 - - 455 506 556 593 642 561 526 265 261 200 134 102 89 158 78 268 223 139 164- - - 19% - - 22% 25% 27% 29% 33% 28% 27% 28% 26% 35% 27% 22% 21% 26% 24% 29% 34% 20% 28%
D D DG DGH DGHIJLM DGH DG QRS Xy X
Somewhat agree
- - - 179 - - 230 224 233 308 259 271 294 185 109 124 69 61 40 109 44 127 113 67 114- - - 9% - - 11% 11% 11% 15% 13% 14% 15% 19% 11% 22% 14% 13% 10% 18% 13% 14% 17% 9% 19%
D d D DGHI Dh DgHi DGHI O QRS v X X
Strongly/SomewhatDisagree (Net)
- - - 110 - - 136 122 146 180 173 159 193 119 75 91 41 42 19 73 29 83 63 43 88- - - 5% - - 7% 6% 7% 9% 9% 8% 10% 12% 7% 16% 8% 9% 5% 12% 9% 9% 9% 6% 15%
d DGH DGH DH DGHI O QRS s S x WX
Somewhat disagree
- - - 69 - - 95 102 87 128 86 112 100 67 34 32 28 20 21 36 16 44 50 24 27- - - 3% - - 5% 5% 4% 6% 4% 6% 5% 7% 3% 6% 6% 4% 5% 6% 5% 5% 8% 3% 4%
D DgIk D D O Xy
Strongly disagree
- - - 2016 - - 2029 2050 2039 2066 1961 1996 1965 952 1013 573 497 474 421 609 329 935 665 709 591- - - 100% - - 100% 100% 100% 100% 100% 100% 100% 100% 100% 100% 100% 100% 100% 100% 100% 100% 100% 100% 100%
Sigma
__________________________________________________________________________________________________________________Proportions/Means: Columns Tested (5%, 10% risk level) - A/B/C/D/E/F/G/H/I/J/K/L/M - N/O - P/Q/R/S - T/U/V - W/X/YOverlap formulae used. ** very small base (under 30) ineligible for sig testing
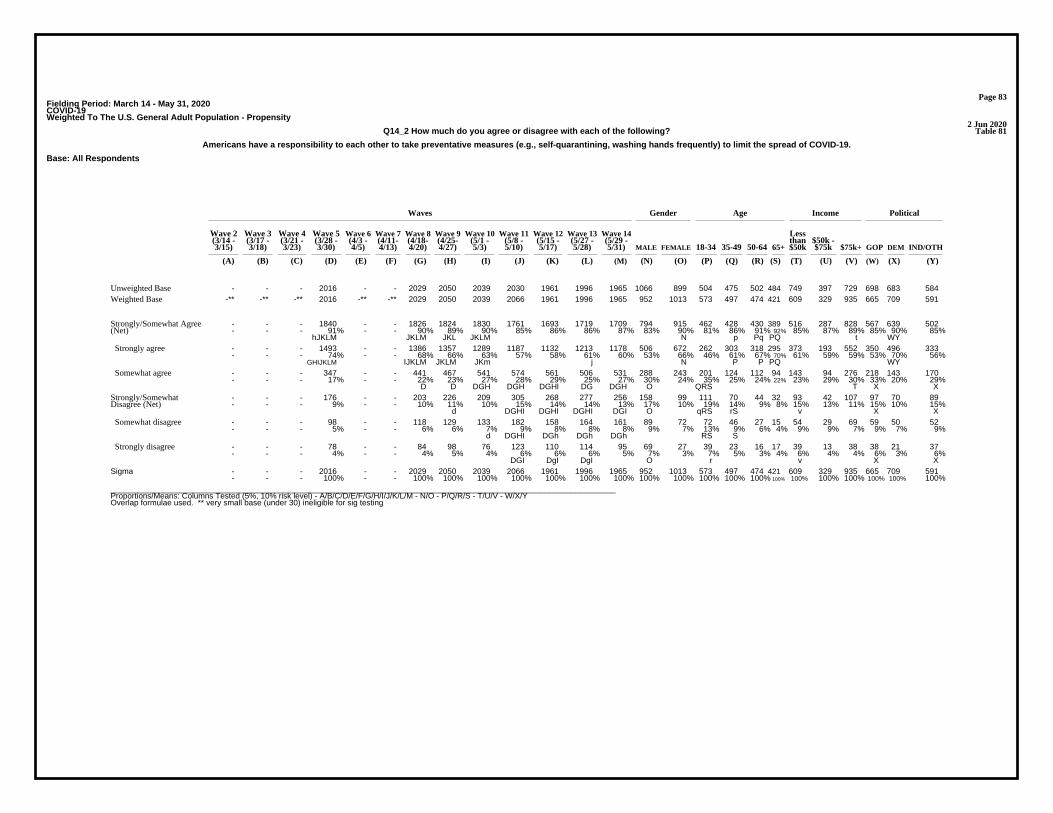
Page 83Fielding Period: March 14 - May 31, 2020COVID-19Weighted To The U.S. General Adult Population - Propensity
2 Jun 2020Table 81Q14_2 How much do you agree or disagree with each of the following?
Americans have a responsibility to each other to take preventative measures (e.g., self-quarantining, washing hands frequently) to limit the spread of COVID-19.
Base: All Respondents
Waves Gender Age Income Political
Wave 2 Wave 3 Wave 4 Wave 5 Wave 6 Wave 7 Wave 8 Wave 9 Wave 10 Wave 11 Wave 12 Wave 13 Wave 14 Less(3/14 - (3/17 - (3/21 - (3/28 - (4/3 - (4/11- (4/18- (4/25- (5/1 - (5/8 - (5/15 - (5/27 - (5/29 - than $50k -3/15) 3/18) 3/23) 3/30) 4/5) 4/13) 4/20) 4/27) 5/3) 5/10) 5/17) 5/28) 5/31) MALE FEMALE 18-34 35-49 50-64 65+ $50k $75k $75k+ GOP DEM IND/OTH
(A) (B) (C) (D) (E) (F) (G) (H) (I) (J) (K) (L) (M) (N) (O) (P) (Q) (R) (S) (T) (U) (V) (W) (X) (Y)
- - - 2016 - - 2029 2050 2039 2030 1961 1996 1965 1066 899 504 475 502 484 749 397 729 698 683 584Unweighted Base-** -** -** 2016 -** -** 2029 2050 2039 2066 1961 1996 1965 952 1013 573 497 474 421 609 329 935 665 709 591Weighted Base
- - - 1840 - - 1826 1824 1830 1761 1693 1719 1709 794 915 462 428 430 389 516 287 828 567 639 502- - - 91% - - 90% 89% 90% 85% 86% 86% 87% 83% 90% 81% 86% 91% 92% 85% 87% 89% 85% 90% 85%
hJKLM JKLM JKL JKLM N p Pq PQ t WY
Strongly/Somewhat Agree(Net)
- - - 1493 - - 1386 1357 1289 1187 1132 1213 1178 506 672 262 303 318 295 373 193 552 350 496 333- - - 74% - - 68% 66% 63% 57% 58% 61% 60% 53% 66% 46% 61% 67% 70% 61% 59% 59% 53% 70% 56%
GHIJKLM IJKLM JKLM JKm j N P P PQ WY
Strongly agree
- - - 347 - - 441 467 541 574 561 506 531 288 243 201 124 112 94 143 94 276 218 143 170- - - 17% - - 22% 23% 27% 28% 29% 25% 27% 30% 24% 35% 25% 24% 22% 23% 29% 30% 33% 20% 29%
D D DGH DGH DGHl DG DGH O QRS T X X
Somewhat agree
- - - 176 - - 203 226 209 305 268 277 256 158 99 111 70 44 32 93 42 107 97 70 89- - - 9% - - 10% 11% 10% 15% 14% 14% 13% 17% 10% 19% 14% 9% 8% 15% 13% 11% 15% 10% 15%
d DGHI DGHI DGHI DGI O qRS rS v X X
Strongly/SomewhatDisagree (Net)
- - - 98 - - 118 129 133 182 158 164 161 89 72 72 46 27 15 54 29 69 59 50 52- - - 5% - - 6% 6% 7% 9% 8% 8% 8% 9% 7% 13% 9% 6% 4% 9% 9% 7% 9% 7% 9%
d DGHI DGh DGh DGh RS S
Somewhat disagree
- - - 78 - - 84 98 76 123 110 114 95 69 27 39 23 16 17 39 13 38 38 21 37- - - 4% - - 4% 5% 4% 6% 6% 6% 5% 7% 3% 7% 5% 3% 4% 6% 4% 4% 6% 3% 6%
DGI DgI DgI O r v X X
Strongly disagree
- - - 2016 - - 2029 2050 2039 2066 1961 1996 1965 952 1013 573 497 474 421 609 329 935 665 709 591- - - 100% - - 100% 100% 100% 100% 100% 100% 100% 100% 100% 100% 100% 100% 100% 100% 100% 100% 100% 100% 100%
Sigma
__________________________________________________________________________________________________________________Proportions/Means: Columns Tested (5%, 10% risk level) - A/B/C/D/E/F/G/H/I/J/K/L/M - N/O - P/Q/R/S - T/U/V - W/X/YOverlap formulae used. ** very small base (under 30) ineligible for sig testing
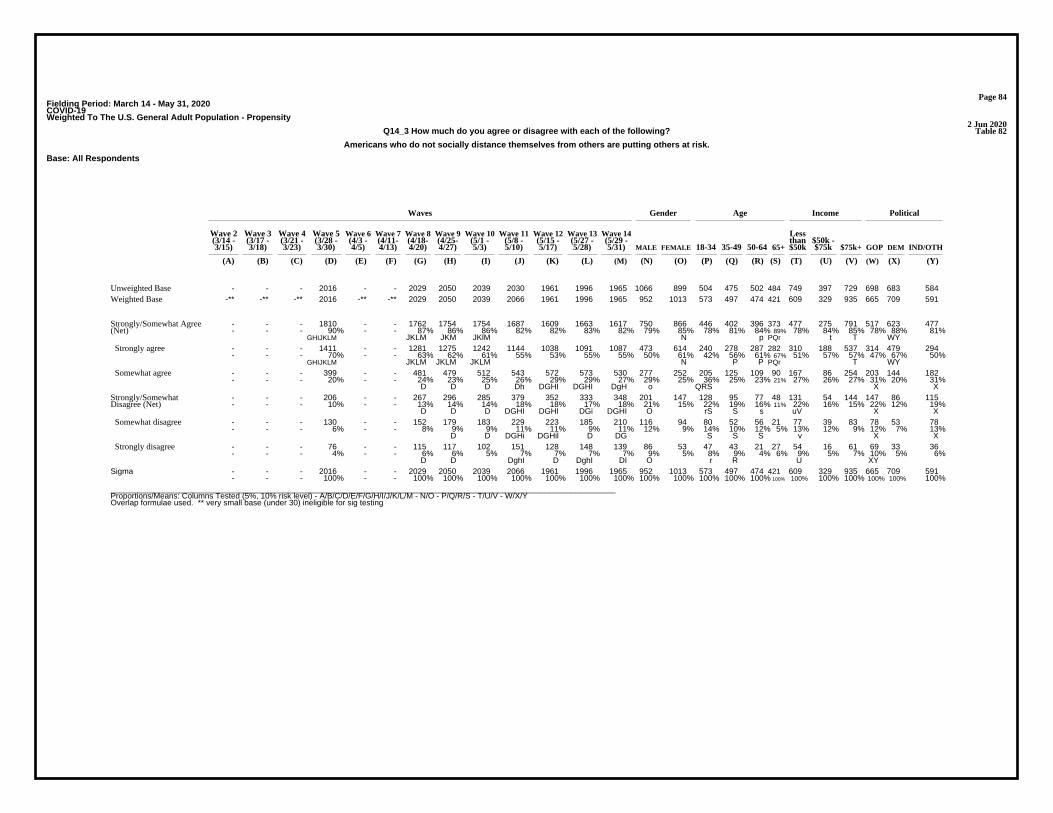
Page 84Fielding Period: March 14 - May 31, 2020COVID-19Weighted To The U.S. General Adult Population - Propensity
2 Jun 2020Table 82Q14_3 How much do you agree or disagree with each of the following?
Americans who do not socially distance themselves from others are putting others at risk.
Base: All Respondents
Waves Gender Age Income Political
Wave 2 Wave 3 Wave 4 Wave 5 Wave 6 Wave 7 Wave 8 Wave 9 Wave 10 Wave 11 Wave 12 Wave 13 Wave 14 Less(3/14 - (3/17 - (3/21 - (3/28 - (4/3 - (4/11- (4/18- (4/25- (5/1 - (5/8 - (5/15 - (5/27 - (5/29 - than $50k -3/15) 3/18) 3/23) 3/30) 4/5) 4/13) 4/20) 4/27) 5/3) 5/10) 5/17) 5/28) 5/31) MALE FEMALE 18-34 35-49 50-64 65+ $50k $75k $75k+ GOP DEM IND/OTH
(A) (B) (C) (D) (E) (F) (G) (H) (I) (J) (K) (L) (M) (N) (O) (P) (Q) (R) (S) (T) (U) (V) (W) (X) (Y)
- - - 2016 - - 2029 2050 2039 2030 1961 1996 1965 1066 899 504 475 502 484 749 397 729 698 683 584Unweighted Base-** -** -** 2016 -** -** 2029 2050 2039 2066 1961 1996 1965 952 1013 573 497 474 421 609 329 935 665 709 591Weighted Base
- - - 1810 - - 1762 1754 1754 1687 1609 1663 1617 750 866 446 402 396 373 477 275 791 517 623 477- - - 90% - - 87% 86% 86% 82% 82% 83% 82% 79% 85% 78% 81% 84% 89% 78% 84% 85% 78% 88% 81%
GHIJKLM JKLM JKM JKlM N p PQr t T WY
Strongly/Somewhat Agree(Net)
- - - 1411 - - 1281 1275 1242 1144 1038 1091 1087 473 614 240 278 287 282 310 188 537 314 479 294- - - 70% - - 63% 62% 61% 55% 53% 55% 55% 50% 61% 42% 56% 61% 67% 51% 57% 57% 47% 67% 50%
GHIJKLM JKLM JKLM JKLM N P P PQr T WY
Strongly agree
- - - 399 - - 481 479 512 543 572 573 530 277 252 205 125 109 90 167 86 254 203 144 182- - - 20% - - 24% 23% 25% 26% 29% 29% 27% 29% 25% 36% 25% 23% 21% 27% 26% 27% 31% 20% 31%
D D D Dh DGHI DGHI DgH o QRS X X
Somewhat agree
- - - 206 - - 267 296 285 379 352 333 348 201 147 128 95 77 48 131 54 144 147 86 115- - - 10% - - 13% 14% 14% 18% 18% 17% 18% 21% 15% 22% 19% 16% 11% 22% 16% 15% 22% 12% 19%
D D D DGHI DGHI DGi DGHI O rS S s uV X X
Strongly/SomewhatDisagree (Net)
- - - 130 - - 152 179 183 229 223 185 210 116 94 80 52 56 21 77 39 83 78 53 78- - - 6% - - 8% 9% 9% 11% 11% 9% 11% 12% 9% 14% 10% 12% 5% 13% 12% 9% 12% 7% 13%
D D DGHi DGHil D DG S S S v X X
Somewhat disagree
- - - 76 - - 115 117 102 151 128 148 139 86 53 47 43 21 27 54 16 61 69 33 36- - - 4% - - 6% 6% 5% 7% 7% 7% 7% 9% 5% 8% 9% 4% 6% 9% 5% 7% 10% 5% 6%
D D DghI D DghI DI O r R U XY
Strongly disagree
- - - 2016 - - 2029 2050 2039 2066 1961 1996 1965 952 1013 573 497 474 421 609 329 935 665 709 591- - - 100% - - 100% 100% 100% 100% 100% 100% 100% 100% 100% 100% 100% 100% 100% 100% 100% 100% 100% 100% 100%
Sigma
__________________________________________________________________________________________________________________Proportions/Means: Columns Tested (5%, 10% risk level) - A/B/C/D/E/F/G/H/I/J/K/L/M - N/O - P/Q/R/S - T/U/V - W/X/YOverlap formulae used. ** very small base (under 30) ineligible for sig testing

Page 85Fielding Period: March 14 - May 31, 2020COVID-19Weighted To The U.S. General Adult Population - Propensity
2 Jun 2020Table 83Q14_4 How much do you agree or disagree with each of the following?
Americans who refuse to follow CDC/Local Public Health guidelines are putting others at risk.
Base: All Respondents
Waves Gender Age Income Political
Wave 2 Wave 3 Wave 4 Wave 5 Wave 6 Wave 7 Wave 8 Wave 9 Wave 10 Wave 11 Wave 12 Wave 13 Wave 14 Less(3/14 - (3/17 - (3/21 - (3/28 - (4/3 - (4/11- (4/18- (4/25- (5/1 - (5/8 - (5/15 - (5/27 - (5/29 - than $50k -3/15) 3/18) 3/23) 3/30) 4/5) 4/13) 4/20) 4/27) 5/3) 5/10) 5/17) 5/28) 5/31) MALE FEMALE 18-34 35-49 50-64 65+ $50k $75k $75k+ GOP DEM IND/OTH
(A) (B) (C) (D) (E) (F) (G) (H) (I) (J) (K) (L) (M) (N) (O) (P) (Q) (R) (S) (T) (U) (V) (W) (X) (Y)
- - - 2016 - - 2029 2050 2039 2030 1961 1996 1965 1066 899 504 475 502 484 749 397 729 698 683 584Unweighted Base-** -** -** 2016 -** -** 2029 2050 2039 2066 1961 1996 1965 952 1013 573 497 474 421 609 329 935 665 709 591Weighted Base
- - - 1817 - - 1753 1747 1737 1664 1585 1625 1612 750 862 450 405 395 362 485 277 775 507 641 464- - - 90% - - 86% 85% 85% 81% 81% 81% 82% 79% 85% 79% 81% 83% 86% 80% 84% 83% 76% 90% 79%
GHIJKLM JKLM JKLM JKLM N P WY
Strongly/Somewhat Agree(Net)
- - - 1425 - - 1314 1280 1217 1152 1031 1130 1099 492 607 258 272 292 277 320 192 533 285 495 319- - - 71% - - 65% 62% 60% 56% 53% 57% 56% 52% 60% 45% 55% 62% 66% 53% 58% 57% 43% 70% 54%
GHIJKLM IJKLM JKLM JKm K N P Pq PQ WY W
Strongly agree
- - - 392 - - 440 467 520 512 554 495 513 258 255 192 133 103 85 165 85 243 222 145 146- - - 19% - - 22% 23% 25% 25% 28% 25% 26% 27% 25% 33% 27% 22% 20% 27% 26% 26% 33% 20% 25%
D DG Dg DGHjl Dg DGh qRS s XY
Somewhat agree
- - - 199 - - 276 303 302 402 376 371 353 202 151 123 93 78 59 124 52 160 158 69 127- - - 10% - - 14% 15% 15% 19% 19% 19% 18% 21% 15% 21% 19% 17% 14% 20% 16% 17% 24% 10% 21%
D D D DGHI DGHI DGHI DGHI O S X X
Strongly/SomewhatDisagree (Net)
- - - 129 - - 175 181 199 268 245 224 228 135 94 69 72 55 32 70 38 109 106 41 82- - - 6% - - 9% 9% 10% 13% 12% 11% 12% 14% 9% 12% 14% 12% 8% 12% 11% 12% 16% 6% 14%
D D D DGHI DGHI DGH DGH O s S X X
Somewhat disagree
- - - 70 - - 101 122 103 135 131 147 125 67 58 54 21 23 27 54 14 51 52 28 45- - - 3% - - 5% 6% 5% 7% 7% 7% 6% 7% 6% 9% 4% 5% 6% 9% 4% 5% 8% 4% 8%
d D D Dg Dgi DGI D QR UV X X
Strongly disagree
- - - 2016 - - 2029 2050 2039 2066 1961 1996 1965 952 1013 573 497 474 421 609 329 935 665 709 591- - - 100% - - 100% 100% 100% 100% 100% 100% 100% 100% 100% 100% 100% 100% 100% 100% 100% 100% 100% 100% 100%
Sigma
__________________________________________________________________________________________________________________Proportions/Means: Columns Tested (5%, 10% risk level) - A/B/C/D/E/F/G/H/I/J/K/L/M - N/O - P/Q/R/S - T/U/V - W/X/YOverlap formulae used. ** very small base (under 30) ineligible for sig testing
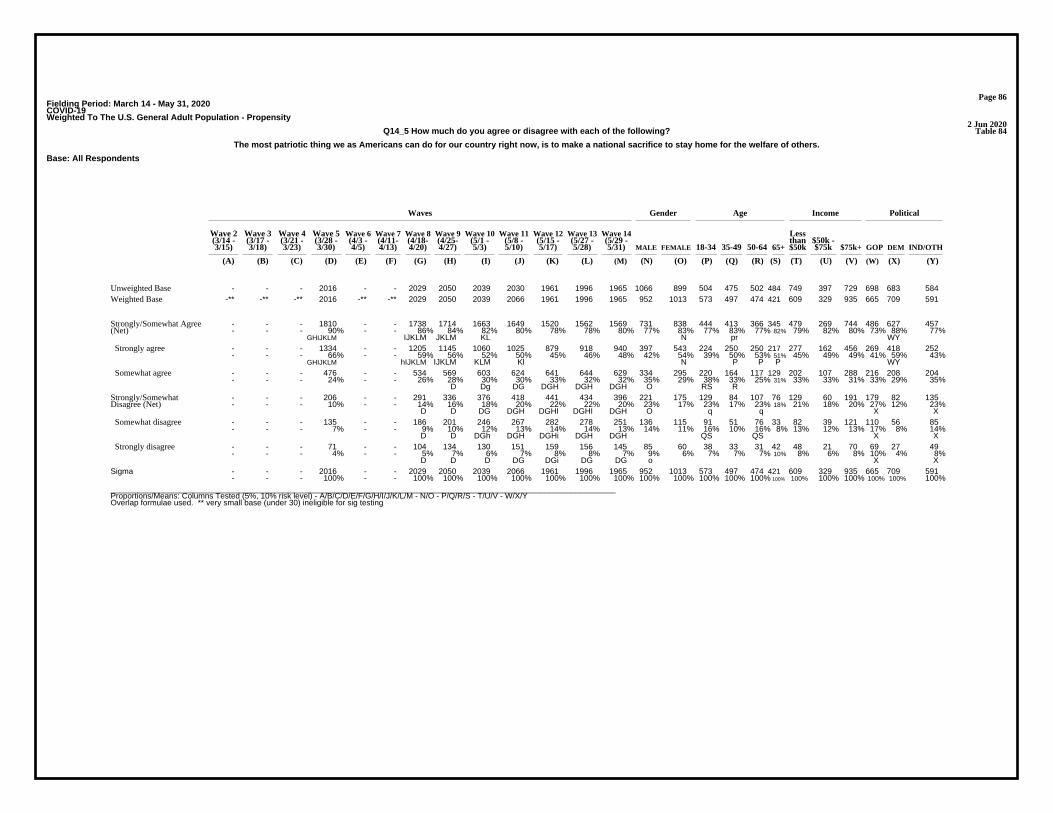
Page 86Fielding Period: March 14 - May 31, 2020COVID-19Weighted To The U.S. General Adult Population - Propensity
2 Jun 2020Table 84Q14_5 How much do you agree or disagree with each of the following?
The most patriotic thing we as Americans can do for our country right now, is to make a national sacrifice to stay home for the welfare of others.
Base: All Respondents
Waves Gender Age Income Political
Wave 2 Wave 3 Wave 4 Wave 5 Wave 6 Wave 7 Wave 8 Wave 9 Wave 10 Wave 11 Wave 12 Wave 13 Wave 14 Less(3/14 - (3/17 - (3/21 - (3/28 - (4/3 - (4/11- (4/18- (4/25- (5/1 - (5/8 - (5/15 - (5/27 - (5/29 - than $50k -3/15) 3/18) 3/23) 3/30) 4/5) 4/13) 4/20) 4/27) 5/3) 5/10) 5/17) 5/28) 5/31) MALE FEMALE 18-34 35-49 50-64 65+ $50k $75k $75k+ GOP DEM IND/OTH
(A) (B) (C) (D) (E) (F) (G) (H) (I) (J) (K) (L) (M) (N) (O) (P) (Q) (R) (S) (T) (U) (V) (W) (X) (Y)
- - - 2016 - - 2029 2050 2039 2030 1961 1996 1965 1066 899 504 475 502 484 749 397 729 698 683 584Unweighted Base-** -** -** 2016 -** -** 2029 2050 2039 2066 1961 1996 1965 952 1013 573 497 474 421 609 329 935 665 709 591Weighted Base
- - - 1810 - - 1738 1714 1663 1649 1520 1562 1569 731 838 444 413 366 345 479 269 744 486 627 457- - - 90% - - 86% 84% 82% 80% 78% 78% 80% 77% 83% 77% 83% 77% 82% 79% 82% 80% 73% 88% 77%
GHIJKLM IJKLM JKLM KL N pr WY
Strongly/Somewhat Agree(Net)
- - - 1334 - - 1205 1145 1060 1025 879 918 940 397 543 224 250 250 217 277 162 456 269 418 252- - - 66% - - 59% 56% 52% 50% 45% 46% 48% 42% 54% 39% 50% 53% 51% 45% 49% 49% 41% 59% 43%
GHIJKLM hIJKLM IJKLM KLM Kl N P P P WY
Strongly agree
- - - 476 - - 534 569 603 624 641 644 629 334 295 220 164 117 129 202 107 288 216 208 204- - - 24% - - 26% 28% 30% 30% 33% 32% 32% 35% 29% 38% 33% 25% 31% 33% 33% 31% 33% 29% 35%
D Dg DG DGH DGH DGH O RS R
Somewhat agree
- - - 206 - - 291 336 376 418 441 434 396 221 175 129 84 107 76 129 60 191 179 82 135- - - 10% - - 14% 16% 18% 20% 22% 22% 20% 23% 17% 23% 17% 23% 18% 21% 18% 20% 27% 12% 23%
D D DG DGH DGHI DGHI DGH O q q X X
Strongly/SomewhatDisagree (Net)
- - - 135 - - 186 201 246 267 282 278 251 136 115 91 51 76 33 82 39 121 110 56 85- - - 7% - - 9% 10% 12% 13% 14% 14% 13% 14% 11% 16% 10% 16% 8% 13% 12% 13% 17% 8% 14%
D D DGh DGH DGHi DGH DGH QS QS X X
Somewhat disagree
- - - 71 - - 104 134 130 151 159 156 145 85 60 38 33 31 42 48 21 70 69 27 49- - - 4% - - 5% 7% 6% 7% 8% 8% 7% 9% 6% 7% 7% 7% 10% 8% 6% 8% 10% 4% 8%
D D D DG DGi DG DG o X X
Strongly disagree
- - - 2016 - - 2029 2050 2039 2066 1961 1996 1965 952 1013 573 497 474 421 609 329 935 665 709 591- - - 100% - - 100% 100% 100% 100% 100% 100% 100% 100% 100% 100% 100% 100% 100% 100% 100% 100% 100% 100% 100%
Sigma
__________________________________________________________________________________________________________________Proportions/Means: Columns Tested (5%, 10% risk level) - A/B/C/D/E/F/G/H/I/J/K/L/M - N/O - P/Q/R/S - T/U/V - W/X/YOverlap formulae used. ** very small base (under 30) ineligible for sig testing
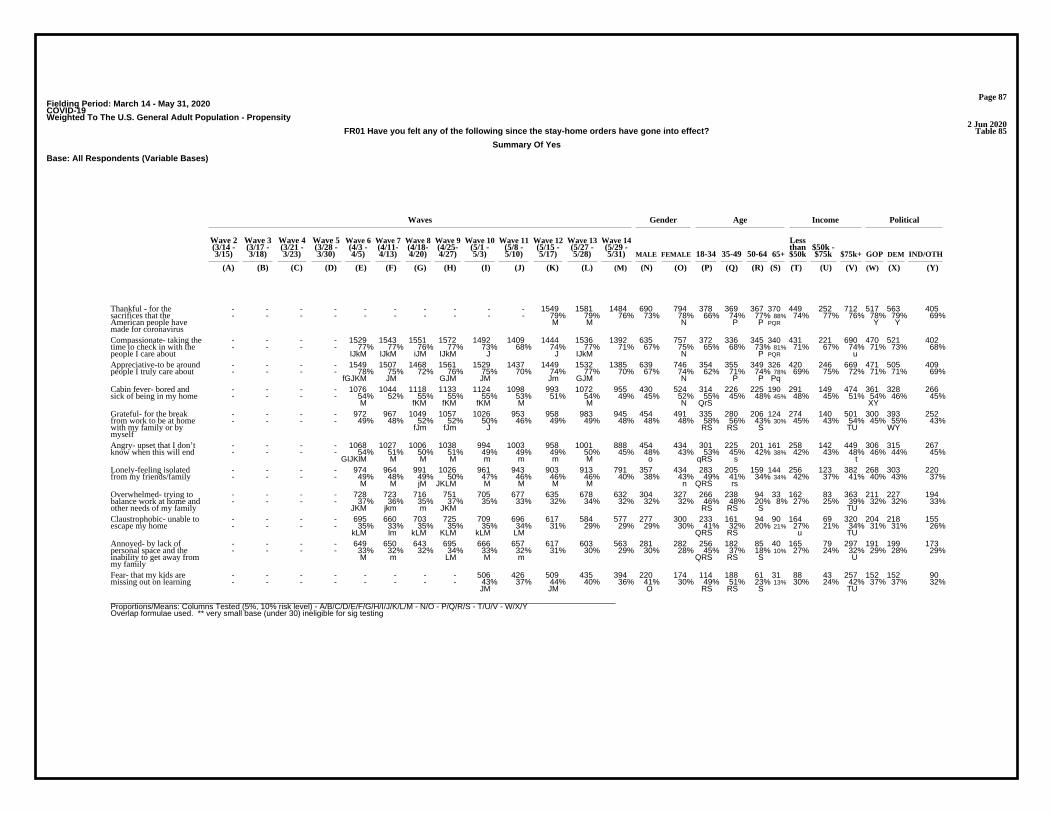
Page 87Fielding Period: March 14 - May 31, 2020COVID-19Weighted To The U.S. General Adult Population - Propensity
2 Jun 2020Table 85FR01 Have you felt any of the following since the stay-home orders have gone into effect?
Summary Of Yes
Base: All Respondents (Variable Bases)
Waves Gender Age Income Political
Wave 2 Wave 3 Wave 4 Wave 5 Wave 6 Wave 7 Wave 8 Wave 9 Wave 10 Wave 11 Wave 12 Wave 13 Wave 14 Less(3/14 - (3/17 - (3/21 - (3/28 - (4/3 - (4/11- (4/18- (4/25- (5/1 - (5/8 - (5/15 - (5/27 - (5/29 - than $50k -3/15) 3/18) 3/23) 3/30) 4/5) 4/13) 4/20) 4/27) 5/3) 5/10) 5/17) 5/28) 5/31) MALE FEMALE 18-34 35-49 50-64 65+ $50k $75k $75k+ GOP DEM IND/OTH
(A) (B) (C) (D) (E) (F) (G) (H) (I) (J) (K) (L) (M) (N) (O) (P) (Q) (R) (S) (T) (U) (V) (W) (X) (Y)
- - - - - - - - - - 1549 1581 1484 690 794 378 369 367 370 449 252 712 517 563 405- - - - - - - - - - 79% 79% 76% 73% 78% 66% 74% 77% 88% 74% 77% 76% 78% 79% 69%
M M N P P PQR Y Y
Thankful - for thesacrifices that theAmerican people havemade for coronavirus
- - - - 1529 1543 1551 1572 1492 1409 1444 1536 1392 635 757 372 336 345 340 431 221 690 470 521 402- - - - 77% 77% 76% 77% 73% 68% 74% 77% 71% 67% 75% 65% 68% 73% 81% 71% 67% 74% 71% 73% 68%
IJkM IJkM iJM IJkM J J IJkM N P PQR u
Compassionate- taking thetime to check in with thepeople I care about
- - - - 1549 1507 1468 1561 1529 1437 1449 1532 1385 639 746 354 355 349 326 420 246 669 471 505 409- - - - 78% 75% 72% 76% 75% 70% 74% 77% 70% 67% 74% 62% 71% 74% 78% 69% 75% 72% 71% 71% 69%
fGJKM JM GJM JM Jm GJM N P P Pq
Appreciative-to be aroundpeople I truly care about
- - - - 1076 1044 1118 1133 1124 1098 993 1072 955 430 524 314 226 225 190 291 149 474 361 328 266- - - - 54% 52% 55% 55% 55% 53% 51% 54% 49% 45% 52% 55% 45% 48% 45% 48% 45% 51% 54% 46% 45%
M fKM fKM fKM M M N QrS XY
Cabin fever- bored andsick of being in my home
- - - - 972 967 1049 1057 1026 953 958 983 945 454 491 335 280 206 124 274 140 501 300 393 252- - - - 49% 48% 52% 52% 50% 46% 49% 49% 48% 48% 48% 58% 56% 43% 30% 45% 43% 54% 45% 55% 43%
fJm fJm J RS RS S TU WY
Grateful- for the breakfrom work to be at homewith my family or bymyself
- - - - 1068 1027 1006 1038 994 1003 958 1001 888 454 434 301 225 201 161 258 142 449 306 315 267- - - - 54% 51% 50% 51% 49% 49% 49% 50% 45% 48% 43% 53% 45% 42% 38% 42% 43% 48% 46% 44% 45%
GIJKlM M M M m m m M o qRS s t
Angry- upset that I don’tknow when this will end
- - - - 974 964 991 1026 961 943 903 913 791 357 434 283 205 159 144 256 123 382 268 303 220- - - - 49% 48% 49% 50% 47% 46% 46% 46% 40% 38% 43% 49% 41% 34% 34% 42% 37% 41% 40% 43% 37%
M M jM JKLM M M M M n QRS rs
Lonely-feeling isolatedfrom my friends/family
- - - - 728 723 716 751 705 677 635 678 632 304 327 266 238 94 33 162 83 363 211 227 194- - - - 37% 36% 35% 37% 35% 33% 32% 34% 32% 32% 32% 46% 48% 20% 8% 27% 25% 39% 32% 32% 33%
JKM jkm m JKM RS RS S TU
Overwhelmed- trying tobalance work at home andother needs of my family
- - - - 695 660 703 725 709 696 617 584 577 277 300 233 161 94 90 164 69 320 204 218 155- - - - 35% 33% 35% 35% 35% 34% 31% 29% 29% 29% 30% 41% 32% 20% 21% 27% 21% 34% 31% 31% 26%
kLM lm kLM KLM kLM LM QRS RS u TU
Claustrophobic- unable toescape my home
- - - - 649 650 643 695 666 657 617 603 563 281 282 256 182 85 40 165 79 297 191 199 173- - - - 33% 32% 32% 34% 33% 32% 31% 30% 29% 30% 28% 45% 37% 18% 10% 27% 24% 32% 29% 28% 29%
M m LM M m QRS RS S U
Annoyed- by lack ofpersonal space and theinability to get away frommy family
- - - - - - - - 506 426 509 435 394 220 174 114 188 61 31 88 43 257 152 152 90- - - - - - - - 43% 37% 44% 40% 36% 41% 30% 49% 51% 23% 13% 30% 24% 42% 37% 37% 32%
JM JM O RS RS S TU
Fear- that my kids aremissing out on learning
__________________________________________________________________________________________________________________Proportions/Means: Columns Tested (5%, 10% risk level) - A/B/C/D/E/F/G/H/I/J/K/L/M - N/O - P/Q/R/S - T/U/V - W/X/YOverlap formulae used. ** very small base (under 30) ineligible for sig testing

Page 88Fielding Period: March 14 - May 31, 2020COVID-19Weighted To The U.S. General Adult Population - Propensity
2 Jun 2020Table 86FR01_1 Have you felt any of the following since the stay-home orders have gone into effect?
Cabin fever- bored and sick of being in my home
Base: All Respondents
Waves Gender Age Income Political
Wave 2 Wave 3 Wave 4 Wave 5 Wave 6 Wave 7 Wave 8 Wave 9 Wave 10 Wave 11 Wave 12 Wave 13 Wave 14 Less(3/14 - (3/17 - (3/21 - (3/28 - (4/3 - (4/11- (4/18- (4/25- (5/1 - (5/8 - (5/15 - (5/27 - (5/29 - than $50k -3/15) 3/18) 3/23) 3/30) 4/5) 4/13) 4/20) 4/27) 5/3) 5/10) 5/17) 5/28) 5/31) MALE FEMALE 18-34 35-49 50-64 65+ $50k $75k $75k+ GOP DEM IND/OTH
(A) (B) (C) (D) (E) (F) (G) (H) (I) (J) (K) (L) (M) (N) (O) (P) (Q) (R) (S) (T) (U) (V) (W) (X) (Y)
- - - - 1993 2013 2029 2050 2039 2030 1961 1996 1965 1066 899 504 475 502 484 749 397 729 698 683 584Unweighted Base-** -** -** -** 1993 2013 2029 2050 2039 2066 1961 1996 1965 952 1013 573 497 474 421 609 329 935 665 709 591Weighted Base
- - - - 1076 1044 1118 1133 1124 1098 993 1072 955 430 524 314 226 225 190 291 149 474 361 328 266- - - - 54% 52% 55% 55% 55% 53% 51% 54% 49% 45% 52% 55% 45% 48% 45% 48% 45% 51% 54% 46% 45%
M fKM fKM fKM M M N QrS XY
Yes
- - - - 917 969 911 917 915 969 968 924 1010 521 489 259 272 248 231 318 180 461 303 382 326- - - - 46% 48% 45% 45% 45% 47% 49% 46% 51% 55% 48% 45% 55% 52% 55% 52% 55% 49% 46% 54% 55%
ghi GHI EGHIJL O P p P W W
No
- - - - 1993 2013 2029 2050 2039 2066 1961 1996 1965 952 1013 573 497 474 421 609 329 935 665 709 591- - - - 100% 100% 100% 100% 100% 100% 100% 100% 100% 100% 100% 100% 100% 100% 100% 100% 100% 100% 100% 100% 100%
Sigma
__________________________________________________________________________________________________________________Proportions/Means: Columns Tested (5%, 10% risk level) - A/B/C/D/E/F/G/H/I/J/K/L/M - N/O - P/Q/R/S - T/U/V - W/X/YOverlap formulae used. ** very small base (under 30) ineligible for sig testing

Page 89Fielding Period: March 14 - May 31, 2020COVID-19Weighted To The U.S. General Adult Population - Propensity
2 Jun 2020Table 87FR01_2 Have you felt any of the following since the stay-home orders have gone into effect?
Claustrophobic- unable to escape my home
Base: All Respondents
Waves Gender Age Income Political
Wave 2 Wave 3 Wave 4 Wave 5 Wave 6 Wave 7 Wave 8 Wave 9 Wave 10 Wave 11 Wave 12 Wave 13 Wave 14 Less(3/14 - (3/17 - (3/21 - (3/28 - (4/3 - (4/11- (4/18- (4/25- (5/1 - (5/8 - (5/15 - (5/27 - (5/29 - than $50k -3/15) 3/18) 3/23) 3/30) 4/5) 4/13) 4/20) 4/27) 5/3) 5/10) 5/17) 5/28) 5/31) MALE FEMALE 18-34 35-49 50-64 65+ $50k $75k $75k+ GOP DEM IND/OTH
(A) (B) (C) (D) (E) (F) (G) (H) (I) (J) (K) (L) (M) (N) (O) (P) (Q) (R) (S) (T) (U) (V) (W) (X) (Y)
- - - - 1993 2013 2029 2050 2039 2030 1961 1996 1965 1066 899 504 475 502 484 749 397 729 698 683 584Unweighted Base-** -** -** -** 1993 2013 2029 2050 2039 2066 1961 1996 1965 952 1013 573 497 474 421 609 329 935 665 709 591Weighted Base
- - - - 695 660 703 725 709 696 617 584 577 277 300 233 161 94 90 164 69 320 204 218 155- - - - 35% 33% 35% 35% 35% 34% 31% 29% 29% 29% 30% 41% 32% 20% 21% 27% 21% 34% 31% 31% 26%
kLM lm kLM KLM kLM LM QRS RS u TU
Yes
- - - - 1298 1353 1326 1325 1330 1371 1344 1412 1388 674 713 340 336 380 331 445 260 615 460 491 436- - - - 65% 67% 65% 65% 65% 66% 69% 71% 71% 71% 70% 59% 68% 80% 79% 73% 79% 66% 69% 69% 74%
egHi EfGHIJ EfGHIJ P PQ PQ V tV
No
- - - - 1993 2013 2029 2050 2039 2066 1961 1996 1965 952 1013 573 497 474 421 609 329 935 665 709 591- - - - 100% 100% 100% 100% 100% 100% 100% 100% 100% 100% 100% 100% 100% 100% 100% 100% 100% 100% 100% 100% 100%
Sigma
__________________________________________________________________________________________________________________Proportions/Means: Columns Tested (5%, 10% risk level) - A/B/C/D/E/F/G/H/I/J/K/L/M - N/O - P/Q/R/S - T/U/V - W/X/YOverlap formulae used. ** very small base (under 30) ineligible for sig testing

Page 90Fielding Period: March 14 - May 31, 2020COVID-19Weighted To The U.S. General Adult Population - Propensity
2 Jun 2020Table 88FR01_3 Have you felt any of the following since the stay-home orders have gone into effect?
Grateful- for the break from work to be at home with my family or by myself
Base: All Respondents
Waves Gender Age Income Political
Wave 2 Wave 3 Wave 4 Wave 5 Wave 6 Wave 7 Wave 8 Wave 9 Wave 10 Wave 11 Wave 12 Wave 13 Wave 14 Less(3/14 - (3/17 - (3/21 - (3/28 - (4/3 - (4/11- (4/18- (4/25- (5/1 - (5/8 - (5/15 - (5/27 - (5/29 - than $50k -3/15) 3/18) 3/23) 3/30) 4/5) 4/13) 4/20) 4/27) 5/3) 5/10) 5/17) 5/28) 5/31) MALE FEMALE 18-34 35-49 50-64 65+ $50k $75k $75k+ GOP DEM IND/OTH
(A) (B) (C) (D) (E) (F) (G) (H) (I) (J) (K) (L) (M) (N) (O) (P) (Q) (R) (S) (T) (U) (V) (W) (X) (Y)
- - - - 1993 2013 2029 2050 2039 2030 1961 1996 1965 1066 899 504 475 502 484 749 397 729 698 683 584Unweighted Base-** -** -** -** 1993 2013 2029 2050 2039 2066 1961 1996 1965 952 1013 573 497 474 421 609 329 935 665 709 591Weighted Base
- - - - 972 967 1049 1057 1026 953 958 983 945 454 491 335 280 206 124 274 140 501 300 393 252- - - - 49% 48% 52% 52% 50% 46% 49% 49% 48% 48% 48% 58% 56% 43% 30% 45% 43% 54% 45% 55% 43%
fJm fJm J RS RS S TU WY
Yes
- - - - 1021 1046 980 993 1013 1113 1003 1013 1020 498 522 238 218 268 297 335 189 434 364 316 340- - - - 51% 52% 48% 48% 50% 54% 51% 51% 52% 52% 52% 42% 44% 57% 70% 55% 57% 46% 55% 45% 57%
gh GHI gh PQ PQR V V X X
No
- - - - 1993 2013 2029 2050 2039 2066 1961 1996 1965 952 1013 573 497 474 421 609 329 935 665 709 591- - - - 100% 100% 100% 100% 100% 100% 100% 100% 100% 100% 100% 100% 100% 100% 100% 100% 100% 100% 100% 100% 100%
Sigma
__________________________________________________________________________________________________________________Proportions/Means: Columns Tested (5%, 10% risk level) - A/B/C/D/E/F/G/H/I/J/K/L/M - N/O - P/Q/R/S - T/U/V - W/X/YOverlap formulae used. ** very small base (under 30) ineligible for sig testing

Page 91Fielding Period: March 14 - May 31, 2020COVID-19Weighted To The U.S. General Adult Population - Propensity
2 Jun 2020Table 89FR01_4 Have you felt any of the following since the stay-home orders have gone into effect?
Appreciative-to be around people I truly care about
Base: All Respondents
Waves Gender Age Income Political
Wave 2 Wave 3 Wave 4 Wave 5 Wave 6 Wave 7 Wave 8 Wave 9 Wave 10 Wave 11 Wave 12 Wave 13 Wave 14 Less(3/14 - (3/17 - (3/21 - (3/28 - (4/3 - (4/11- (4/18- (4/25- (5/1 - (5/8 - (5/15 - (5/27 - (5/29 - than $50k -3/15) 3/18) 3/23) 3/30) 4/5) 4/13) 4/20) 4/27) 5/3) 5/10) 5/17) 5/28) 5/31) MALE FEMALE 18-34 35-49 50-64 65+ $50k $75k $75k+ GOP DEM IND/OTH
(A) (B) (C) (D) (E) (F) (G) (H) (I) (J) (K) (L) (M) (N) (O) (P) (Q) (R) (S) (T) (U) (V) (W) (X) (Y)
- - - - 1993 2013 2029 2050 2039 2030 1961 1996 1965 1066 899 504 475 502 484 749 397 729 698 683 584Unweighted Base-** -** -** -** 1993 2013 2029 2050 2039 2066 1961 1996 1965 952 1013 573 497 474 421 609 329 935 665 709 591Weighted Base
- - - - 1549 1507 1468 1561 1529 1437 1449 1532 1385 639 746 354 355 349 326 420 246 669 471 505 409- - - - 78% 75% 72% 76% 75% 70% 74% 77% 70% 67% 74% 62% 71% 74% 78% 69% 75% 72% 71% 71% 69%
fGJKM JM GJM JM Jm GJM N P P Pq
Yes
- - - - 444 506 561 489 510 629 512 464 580 313 268 219 142 124 95 189 83 266 193 205 182- - - - 22% 25% 28% 24% 25% 30% 26% 23% 30% 33% 26% 38% 29% 26% 22% 31% 25% 28% 29% 29% 31%
e EHL EFHIKL E EFHIkL O QRS s
No
- - - - 1993 2013 2029 2050 2039 2066 1961 1996 1965 952 1013 573 497 474 421 609 329 935 665 709 591- - - - 100% 100% 100% 100% 100% 100% 100% 100% 100% 100% 100% 100% 100% 100% 100% 100% 100% 100% 100% 100% 100%
Sigma
__________________________________________________________________________________________________________________Proportions/Means: Columns Tested (5%, 10% risk level) - A/B/C/D/E/F/G/H/I/J/K/L/M - N/O - P/Q/R/S - T/U/V - W/X/YOverlap formulae used. ** very small base (under 30) ineligible for sig testing
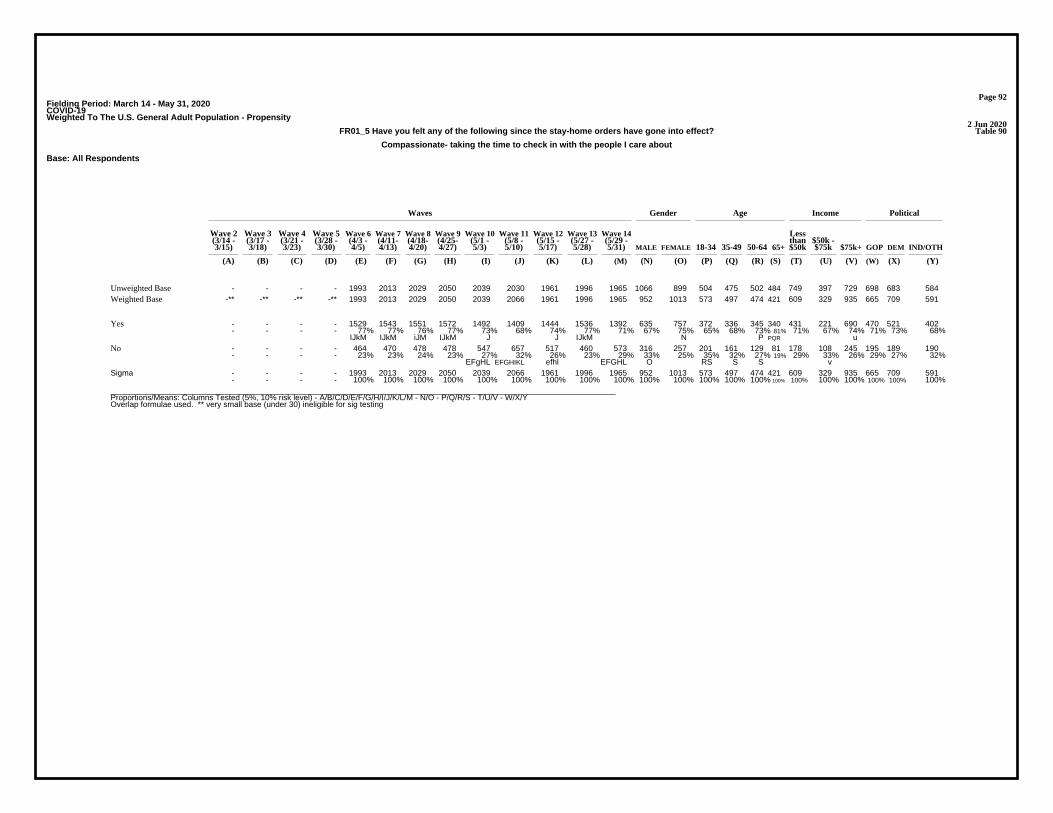
Page 92Fielding Period: March 14 - May 31, 2020COVID-19Weighted To The U.S. General Adult Population - Propensity
2 Jun 2020Table 90FR01_5 Have you felt any of the following since the stay-home orders have gone into effect?
Compassionate- taking the time to check in with the people I care about
Base: All Respondents
Waves Gender Age Income Political
Wave 2 Wave 3 Wave 4 Wave 5 Wave 6 Wave 7 Wave 8 Wave 9 Wave 10 Wave 11 Wave 12 Wave 13 Wave 14 Less(3/14 - (3/17 - (3/21 - (3/28 - (4/3 - (4/11- (4/18- (4/25- (5/1 - (5/8 - (5/15 - (5/27 - (5/29 - than $50k -3/15) 3/18) 3/23) 3/30) 4/5) 4/13) 4/20) 4/27) 5/3) 5/10) 5/17) 5/28) 5/31) MALE FEMALE 18-34 35-49 50-64 65+ $50k $75k $75k+ GOP DEM IND/OTH
(A) (B) (C) (D) (E) (F) (G) (H) (I) (J) (K) (L) (M) (N) (O) (P) (Q) (R) (S) (T) (U) (V) (W) (X) (Y)
- - - - 1993 2013 2029 2050 2039 2030 1961 1996 1965 1066 899 504 475 502 484 749 397 729 698 683 584Unweighted Base-** -** -** -** 1993 2013 2029 2050 2039 2066 1961 1996 1965 952 1013 573 497 474 421 609 329 935 665 709 591Weighted Base
- - - - 1529 1543 1551 1572 1492 1409 1444 1536 1392 635 757 372 336 345 340 431 221 690 470 521 402- - - - 77% 77% 76% 77% 73% 68% 74% 77% 71% 67% 75% 65% 68% 73% 81% 71% 67% 74% 71% 73% 68%
IJkM IJkM iJM IJkM J J IJkM N P PQR u
Yes
- - - - 464 470 478 478 547 657 517 460 573 316 257 201 161 129 81 178 108 245 195 189 190- - - - 23% 23% 24% 23% 27% 32% 26% 23% 29% 33% 25% 35% 32% 27% 19% 29% 33% 26% 29% 27% 32%
EFgHL EFGHIKL efhl EFGHL O RS S S v
No
- - - - 1993 2013 2029 2050 2039 2066 1961 1996 1965 952 1013 573 497 474 421 609 329 935 665 709 591- - - - 100% 100% 100% 100% 100% 100% 100% 100% 100% 100% 100% 100% 100% 100% 100% 100% 100% 100% 100% 100% 100%
Sigma
__________________________________________________________________________________________________________________Proportions/Means: Columns Tested (5%, 10% risk level) - A/B/C/D/E/F/G/H/I/J/K/L/M - N/O - P/Q/R/S - T/U/V - W/X/YOverlap formulae used. ** very small base (under 30) ineligible for sig testing

Page 93Fielding Period: March 14 - May 31, 2020COVID-19Weighted To The U.S. General Adult Population - Propensity
2 Jun 2020Table 91FR01_6 Have you felt any of the following since the stay-home orders have gone into effect?
Lonely-feeling isolated from my friends/family
Base: All Respondents
Waves Gender Age Income Political
Wave 2 Wave 3 Wave 4 Wave 5 Wave 6 Wave 7 Wave 8 Wave 9 Wave 10 Wave 11 Wave 12 Wave 13 Wave 14 Less(3/14 - (3/17 - (3/21 - (3/28 - (4/3 - (4/11- (4/18- (4/25- (5/1 - (5/8 - (5/15 - (5/27 - (5/29 - than $50k -3/15) 3/18) 3/23) 3/30) 4/5) 4/13) 4/20) 4/27) 5/3) 5/10) 5/17) 5/28) 5/31) MALE FEMALE 18-34 35-49 50-64 65+ $50k $75k $75k+ GOP DEM IND/OTH
(A) (B) (C) (D) (E) (F) (G) (H) (I) (J) (K) (L) (M) (N) (O) (P) (Q) (R) (S) (T) (U) (V) (W) (X) (Y)
- - - - 1993 2013 2029 2050 2039 2030 1961 1996 1965 1066 899 504 475 502 484 749 397 729 698 683 584Unweighted Base-** -** -** -** 1993 2013 2029 2050 2039 2066 1961 1996 1965 952 1013 573 497 474 421 609 329 935 665 709 591Weighted Base
- - - - 974 964 991 1026 961 943 903 913 791 357 434 283 205 159 144 256 123 382 268 303 220- - - - 49% 48% 49% 50% 47% 46% 46% 46% 40% 38% 43% 49% 41% 34% 34% 42% 37% 41% 40% 43% 37%
M M jM JKLM M M M M n QRS rs
Yes
- - - - 1019 1049 1038 1024 1078 1124 1058 1083 1174 594 579 290 293 314 277 353 206 553 396 406 371- - - - 51% 52% 51% 50% 53% 54% 54% 54% 60% 62% 57% 51% 59% 66% 66% 58% 63% 59% 60% 57% 63%
gH H H EFGHIJKL o P Pq Pq
No
- - - - 1993 2013 2029 2050 2039 2066 1961 1996 1965 952 1013 573 497 474 421 609 329 935 665 709 591- - - - 100% 100% 100% 100% 100% 100% 100% 100% 100% 100% 100% 100% 100% 100% 100% 100% 100% 100% 100% 100% 100%
Sigma
__________________________________________________________________________________________________________________Proportions/Means: Columns Tested (5%, 10% risk level) - A/B/C/D/E/F/G/H/I/J/K/L/M - N/O - P/Q/R/S - T/U/V - W/X/YOverlap formulae used. ** very small base (under 30) ineligible for sig testing

Page 94Fielding Period: March 14 - May 31, 2020COVID-19Weighted To The U.S. General Adult Population - Propensity
2 Jun 2020Table 92FR01_7 Have you felt any of the following since the stay-home orders have gone into effect?
Overwhelmed- trying to balance work at home and other needs of my family
Base: All Respondents
Waves Gender Age Income Political
Wave 2 Wave 3 Wave 4 Wave 5 Wave 6 Wave 7 Wave 8 Wave 9 Wave 10 Wave 11 Wave 12 Wave 13 Wave 14 Less(3/14 - (3/17 - (3/21 - (3/28 - (4/3 - (4/11- (4/18- (4/25- (5/1 - (5/8 - (5/15 - (5/27 - (5/29 - than $50k -3/15) 3/18) 3/23) 3/30) 4/5) 4/13) 4/20) 4/27) 5/3) 5/10) 5/17) 5/28) 5/31) MALE FEMALE 18-34 35-49 50-64 65+ $50k $75k $75k+ GOP DEM IND/OTH
(A) (B) (C) (D) (E) (F) (G) (H) (I) (J) (K) (L) (M) (N) (O) (P) (Q) (R) (S) (T) (U) (V) (W) (X) (Y)
- - - - 1993 2013 2029 2050 2039 2030 1961 1996 1965 1066 899 504 475 502 484 749 397 729 698 683 584Unweighted Base-** -** -** -** 1993 2013 2029 2050 2039 2066 1961 1996 1965 952 1013 573 497 474 421 609 329 935 665 709 591Weighted Base
- - - - 728 723 716 751 705 677 635 678 632 304 327 266 238 94 33 162 83 363 211 227 194- - - - 37% 36% 35% 37% 35% 33% 32% 34% 32% 32% 32% 46% 48% 20% 8% 27% 25% 39% 32% 32% 33%
JKM jkm m JKM RS RS S TU
Yes
- - - - 1265 1290 1313 1299 1334 1389 1326 1318 1333 647 686 307 259 379 388 447 246 572 454 482 398- - - - 63% 64% 65% 63% 65% 67% 68% 66% 68% 68% 68% 54% 52% 80% 92% 73% 75% 61% 68% 68% 67%
EfH EfH EfgH PQ PQR V V
No
- - - - 1993 2013 2029 2050 2039 2066 1961 1996 1965 952 1013 573 497 474 421 609 329 935 665 709 591- - - - 100% 100% 100% 100% 100% 100% 100% 100% 100% 100% 100% 100% 100% 100% 100% 100% 100% 100% 100% 100% 100%
Sigma
__________________________________________________________________________________________________________________Proportions/Means: Columns Tested (5%, 10% risk level) - A/B/C/D/E/F/G/H/I/J/K/L/M - N/O - P/Q/R/S - T/U/V - W/X/YOverlap formulae used. ** very small base (under 30) ineligible for sig testing

Page 95Fielding Period: March 14 - May 31, 2020COVID-19Weighted To The U.S. General Adult Population - Propensity
2 Jun 2020Table 93FR01_8 Have you felt any of the following since the stay-home orders have gone into effect?
Angry- upset that I don’t know when this will end
Base: All Respondents
Waves Gender Age Income Political
Wave 2 Wave 3 Wave 4 Wave 5 Wave 6 Wave 7 Wave 8 Wave 9 Wave 10 Wave 11 Wave 12 Wave 13 Wave 14 Less(3/14 - (3/17 - (3/21 - (3/28 - (4/3 - (4/11- (4/18- (4/25- (5/1 - (5/8 - (5/15 - (5/27 - (5/29 - than $50k -3/15) 3/18) 3/23) 3/30) 4/5) 4/13) 4/20) 4/27) 5/3) 5/10) 5/17) 5/28) 5/31) MALE FEMALE 18-34 35-49 50-64 65+ $50k $75k $75k+ GOP DEM IND/OTH
(A) (B) (C) (D) (E) (F) (G) (H) (I) (J) (K) (L) (M) (N) (O) (P) (Q) (R) (S) (T) (U) (V) (W) (X) (Y)
- - - - 1993 2013 2029 2050 2039 2030 1961 1996 1965 1066 899 504 475 502 484 749 397 729 698 683 584Unweighted Base-** -** -** -** 1993 2013 2029 2050 2039 2066 1961 1996 1965 952 1013 573 497 474 421 609 329 935 665 709 591Weighted Base
- - - - 1068 1027 1006 1038 994 1003 958 1001 888 454 434 301 225 201 161 258 142 449 306 315 267- - - - 54% 51% 50% 51% 49% 49% 49% 50% 45% 48% 43% 53% 45% 42% 38% 42% 43% 48% 46% 44% 45%
GIJKlM M M M m m m M o qRS s t
Yes
- - - - 925 986 1023 1012 1045 1063 1003 995 1077 498 579 272 272 273 260 351 187 486 359 395 324- - - - 46% 49% 50% 49% 51% 51% 51% 50% 55% 52% 57% 47% 55% 58% 62% 58% 57% 52% 54% 56% 55%
E E E E e EFGHijkL n p P Pq v
No
- - - - 1993 2013 2029 2050 2039 2066 1961 1996 1965 952 1013 573 497 474 421 609 329 935 665 709 591- - - - 100% 100% 100% 100% 100% 100% 100% 100% 100% 100% 100% 100% 100% 100% 100% 100% 100% 100% 100% 100% 100%
Sigma
__________________________________________________________________________________________________________________Proportions/Means: Columns Tested (5%, 10% risk level) - A/B/C/D/E/F/G/H/I/J/K/L/M - N/O - P/Q/R/S - T/U/V - W/X/YOverlap formulae used. ** very small base (under 30) ineligible for sig testing

Page 96Fielding Period: March 14 - May 31, 2020COVID-19Weighted To The U.S. General Adult Population - Propensity
2 Jun 2020Table 94FR01_9 Have you felt any of the following since the stay-home orders have gone into effect?
Annoyed- by lack of personal space and the inability to get away from my family
Base: All Respondents
Waves Gender Age Income Political
Wave 2 Wave 3 Wave 4 Wave 5 Wave 6 Wave 7 Wave 8 Wave 9 Wave 10 Wave 11 Wave 12 Wave 13 Wave 14 Less(3/14 - (3/17 - (3/21 - (3/28 - (4/3 - (4/11- (4/18- (4/25- (5/1 - (5/8 - (5/15 - (5/27 - (5/29 - than $50k -3/15) 3/18) 3/23) 3/30) 4/5) 4/13) 4/20) 4/27) 5/3) 5/10) 5/17) 5/28) 5/31) MALE FEMALE 18-34 35-49 50-64 65+ $50k $75k $75k+ GOP DEM IND/OTH
(A) (B) (C) (D) (E) (F) (G) (H) (I) (J) (K) (L) (M) (N) (O) (P) (Q) (R) (S) (T) (U) (V) (W) (X) (Y)
- - - - 1993 2013 2029 2050 2039 2030 1961 1996 1965 1066 899 504 475 502 484 749 397 729 698 683 584Unweighted Base-** -** -** -** 1993 2013 2029 2050 2039 2066 1961 1996 1965 952 1013 573 497 474 421 609 329 935 665 709 591Weighted Base
- - - - 649 650 643 695 666 657 617 603 563 281 282 256 182 85 40 165 79 297 191 199 173- - - - 33% 32% 32% 34% 33% 32% 31% 30% 29% 30% 28% 45% 37% 18% 10% 27% 24% 32% 29% 28% 29%
M m LM M m QRS RS S U
Yes
- - - - 1344 1363 1386 1355 1373 1409 1344 1393 1402 670 732 317 316 389 380 444 250 638 474 510 418- - - - 67% 68% 68% 66% 67% 68% 69% 70% 71% 70% 72% 55% 63% 82% 90% 73% 76% 68% 71% 72% 71%
H EfHIj P PQ PQR V
No
- - - - 1993 2013 2029 2050 2039 2066 1961 1996 1965 952 1013 573 497 474 421 609 329 935 665 709 591- - - - 100% 100% 100% 100% 100% 100% 100% 100% 100% 100% 100% 100% 100% 100% 100% 100% 100% 100% 100% 100% 100%
Sigma
__________________________________________________________________________________________________________________Proportions/Means: Columns Tested (5%, 10% risk level) - A/B/C/D/E/F/G/H/I/J/K/L/M - N/O - P/Q/R/S - T/U/V - W/X/YOverlap formulae used. ** very small base (under 30) ineligible for sig testing
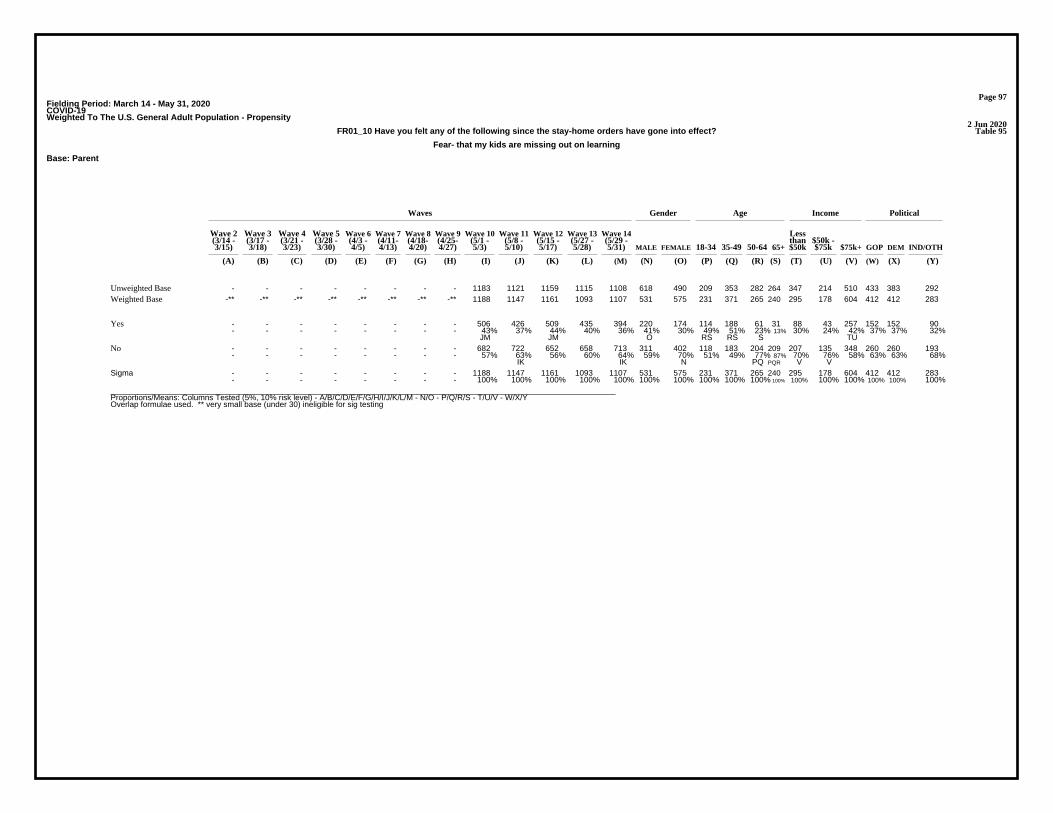
Page 97Fielding Period: March 14 - May 31, 2020COVID-19Weighted To The U.S. General Adult Population - Propensity
2 Jun 2020Table 95FR01_10 Have you felt any of the following since the stay-home orders have gone into effect?
Fear- that my kids are missing out on learning
Base: Parent
Waves Gender Age Income Political
Wave 2 Wave 3 Wave 4 Wave 5 Wave 6 Wave 7 Wave 8 Wave 9 Wave 10 Wave 11 Wave 12 Wave 13 Wave 14 Less(3/14 - (3/17 - (3/21 - (3/28 - (4/3 - (4/11- (4/18- (4/25- (5/1 - (5/8 - (5/15 - (5/27 - (5/29 - than $50k -3/15) 3/18) 3/23) 3/30) 4/5) 4/13) 4/20) 4/27) 5/3) 5/10) 5/17) 5/28) 5/31) MALE FEMALE 18-34 35-49 50-64 65+ $50k $75k $75k+ GOP DEM IND/OTH
(A) (B) (C) (D) (E) (F) (G) (H) (I) (J) (K) (L) (M) (N) (O) (P) (Q) (R) (S) (T) (U) (V) (W) (X) (Y)
- - - - - - - - 1183 1121 1159 1115 1108 618 490 209 353 282 264 347 214 510 433 383 292Unweighted Base-** -** -** -** -** -** -** -** 1188 1147 1161 1093 1107 531 575 231 371 265 240 295 178 604 412 412 283Weighted Base
- - - - - - - - 506 426 509 435 394 220 174 114 188 61 31 88 43 257 152 152 90- - - - - - - - 43% 37% 44% 40% 36% 41% 30% 49% 51% 23% 13% 30% 24% 42% 37% 37% 32%
JM JM O RS RS S TU
Yes
- - - - - - - - 682 722 652 658 713 311 402 118 183 204 209 207 135 348 260 260 193- - - - - - - - 57% 63% 56% 60% 64% 59% 70% 51% 49% 77% 87% 70% 76% 58% 63% 63% 68%
IK IK N PQ PQR V V
No
- - - - - - - - 1188 1147 1161 1093 1107 531 575 231 371 265 240 295 178 604 412 412 283- - - - - - - - 100% 100% 100% 100% 100% 100% 100% 100% 100% 100% 100% 100% 100% 100% 100% 100% 100%
Sigma
__________________________________________________________________________________________________________________Proportions/Means: Columns Tested (5%, 10% risk level) - A/B/C/D/E/F/G/H/I/J/K/L/M - N/O - P/Q/R/S - T/U/V - W/X/YOverlap formulae used. ** very small base (under 30) ineligible for sig testing
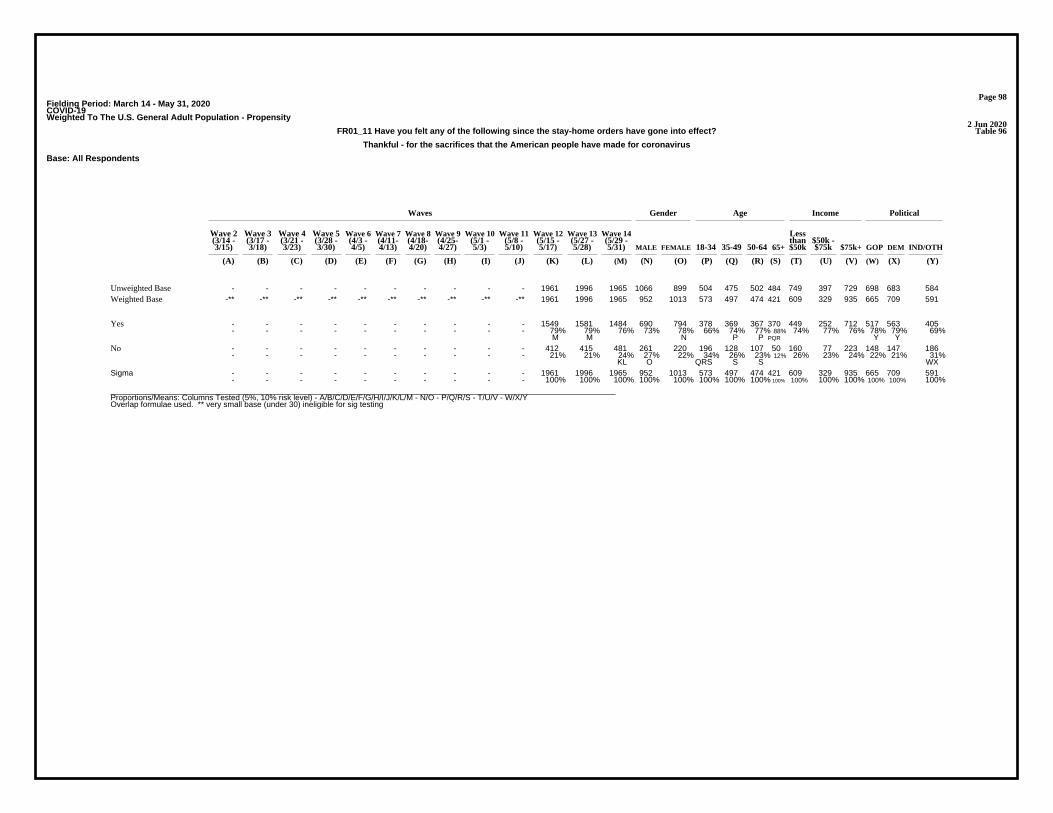
Page 98Fielding Period: March 14 - May 31, 2020COVID-19Weighted To The U.S. General Adult Population - Propensity
2 Jun 2020Table 96FR01_11 Have you felt any of the following since the stay-home orders have gone into effect?
Thankful - for the sacrifices that the American people have made for coronavirus
Base: All Respondents
Waves Gender Age Income Political
Wave 2 Wave 3 Wave 4 Wave 5 Wave 6 Wave 7 Wave 8 Wave 9 Wave 10 Wave 11 Wave 12 Wave 13 Wave 14 Less(3/14 - (3/17 - (3/21 - (3/28 - (4/3 - (4/11- (4/18- (4/25- (5/1 - (5/8 - (5/15 - (5/27 - (5/29 - than $50k -3/15) 3/18) 3/23) 3/30) 4/5) 4/13) 4/20) 4/27) 5/3) 5/10) 5/17) 5/28) 5/31) MALE FEMALE 18-34 35-49 50-64 65+ $50k $75k $75k+ GOP DEM IND/OTH
(A) (B) (C) (D) (E) (F) (G) (H) (I) (J) (K) (L) (M) (N) (O) (P) (Q) (R) (S) (T) (U) (V) (W) (X) (Y)
- - - - - - - - - - 1961 1996 1965 1066 899 504 475 502 484 749 397 729 698 683 584Unweighted Base-** -** -** -** -** -** -** -** -** -** 1961 1996 1965 952 1013 573 497 474 421 609 329 935 665 709 591Weighted Base
- - - - - - - - - - 1549 1581 1484 690 794 378 369 367 370 449 252 712 517 563 405- - - - - - - - - - 79% 79% 76% 73% 78% 66% 74% 77% 88% 74% 77% 76% 78% 79% 69%
M M N P P PQR Y Y
Yes
- - - - - - - - - - 412 415 481 261 220 196 128 107 50 160 77 223 148 147 186- - - - - - - - - - 21% 21% 24% 27% 22% 34% 26% 23% 12% 26% 23% 24% 22% 21% 31%
KL O QRS S S WX
No
- - - - - - - - - - 1961 1996 1965 952 1013 573 497 474 421 609 329 935 665 709 591- - - - - - - - - - 100% 100% 100% 100% 100% 100% 100% 100% 100% 100% 100% 100% 100% 100% 100%
Sigma
__________________________________________________________________________________________________________________Proportions/Means: Columns Tested (5%, 10% risk level) - A/B/C/D/E/F/G/H/I/J/K/L/M - N/O - P/Q/R/S - T/U/V - W/X/YOverlap formulae used. ** very small base (under 30) ineligible for sig testing

Page 99Fielding Period: March 14 - May 31, 2020COVID-19Weighted To The U.S. General Adult Population - Propensity
2 Jun 2020Table 97FR02_1 While working from home, are you more likely to...
Roll out of bed and start working/Maintain your morning routine (e.g., shower etc)
Base: Working From Home Since The Coronavirus Pandemic
Waves Gender Age Income Political
Wave 2 Wave 3 Wave 4 Wave 5 Wave 6 Wave 7 Wave 8 Wave 9 Wave 10 Wave 11 Wave 12 Wave 13 Wave 14 Less(3/14 - (3/17 - (3/21 - (3/28 - (4/3 - (4/11- (4/18- (4/25- (5/1 - (5/8 - (5/15 - (5/27 - (5/29 - than $50k -3/15) 3/18) 3/23) 3/30) 4/5) 4/13) 4/20) 4/27) 5/3) 5/10) 5/17) 5/28) 5/31) MALE FEMALE 18-34 35-49 50-64 65+ $50k $75k $75k+ GOP DEM IND/OTH
(A) (B) (C) (D) (E) (F) (G) (H) (I) (J) (K) (L) (M) (N) (O) (P) (Q) (R) (S) (T) (U) (V) (W) (X) (Y)
- - - - 731 655 724 - - - - - 1965 1066 899 504 475 502 484 749 397 729 698 683 584Unweighted Base-** -** -** -** 726 661 713 -** -** -** -** -** 1965 952 1013 573 497 474 421 609 329 935 665 709 591Weighted Base
- - - - 335 319 350 - - - - - 1008 463 545 272 264 237 235 299 183 486 331 390 287- - - - 46% 48% 49% - - - - - 51% 49% 54% 47% 53% 50% 56% 49% 56% 52% 50% 55% 48%
e n P t y
Maintain your morningroutine (e.g., shower etc)
- - - - 390 342 363 - - - - - 957 488 469 301 234 237 185 310 146 449 333 319 305- - - - 54% 52% 51% - - - - - 49% 51% 46% 53% 47% 50% 44% 51% 44% 48% 50% 45% 52%
m o S u x
Roll out of bed and startworking
- - - - 726 661 713 - - - - - 1965 952 1013 573 497 474 421 609 329 935 665 709 591- - - - 100% 100% 100% - - - - - 100% 100% 100% 100% 100% 100% 100% 100% 100% 100% 100% 100% 100%
Sigma
__________________________________________________________________________________________________________________Proportions/Means: Columns Tested (5%, 10% risk level) - A/B/C/D/E/F/G/H/I/J/K/L/M - N/O - P/Q/R/S - T/U/V - W/X/YOverlap formulae used. ** very small base (under 30) ineligible for sig testing

Page 100Fielding Period: March 14 - May 31, 2020COVID-19Weighted To The U.S. General Adult Population - Propensity
2 Jun 2020Table 98FR02_2 While working from home, are you more likely to...
Get properly dressed/Wear PJs/sweatpants
Base: Working From Home Since The Coronavirus Pandemic
Waves Gender Age Income Political
Wave 2 Wave 3 Wave 4 Wave 5 Wave 6 Wave 7 Wave 8 Wave 9 Wave 10 Wave 11 Wave 12 Wave 13 Wave 14 Less(3/14 - (3/17 - (3/21 - (3/28 - (4/3 - (4/11- (4/18- (4/25- (5/1 - (5/8 - (5/15 - (5/27 - (5/29 - than $50k -3/15) 3/18) 3/23) 3/30) 4/5) 4/13) 4/20) 4/27) 5/3) 5/10) 5/17) 5/28) 5/31) MALE FEMALE 18-34 35-49 50-64 65+ $50k $75k $75k+ GOP DEM IND/OTH
(A) (B) (C) (D) (E) (F) (G) (H) (I) (J) (K) (L) (M) (N) (O) (P) (Q) (R) (S) (T) (U) (V) (W) (X) (Y)
- - - - 731 655 724 - - - - - 1965 1066 899 504 475 502 484 749 397 729 698 683 584Unweighted Base-** -** -** -** 726 661 713 -** -** -** -** -** 1965 952 1013 573 497 474 421 609 329 935 665 709 591Weighted Base
- - - - 370 338 352 - - - - - 1063 528 535 292 280 254 238 340 159 513 367 368 328- - - - 51% 51% 49% - - - - - 54% 56% 53% 51% 56% 54% 57% 56% 48% 55% 55% 52% 55%
g u u
Get properly dressed
- - - - 356 323 361 - - - - - 902 423 478 281 218 220 183 269 170 422 297 341 264- - - - 49% 49% 51% - - - - - 46% 44% 47% 49% 44% 46% 43% 44% 52% 45% 45% 48% 45%
m tv
Wear PJs/sweatpants
- - - - 726 661 713 - - - - - 1965 952 1013 573 497 474 421 609 329 935 665 709 591- - - - 100% 100% 100% - - - - - 100% 100% 100% 100% 100% 100% 100% 100% 100% 100% 100% 100% 100%
Sigma
__________________________________________________________________________________________________________________Proportions/Means: Columns Tested (5%, 10% risk level) - A/B/C/D/E/F/G/H/I/J/K/L/M - N/O - P/Q/R/S - T/U/V - W/X/YOverlap formulae used. ** very small base (under 30) ineligible for sig testing
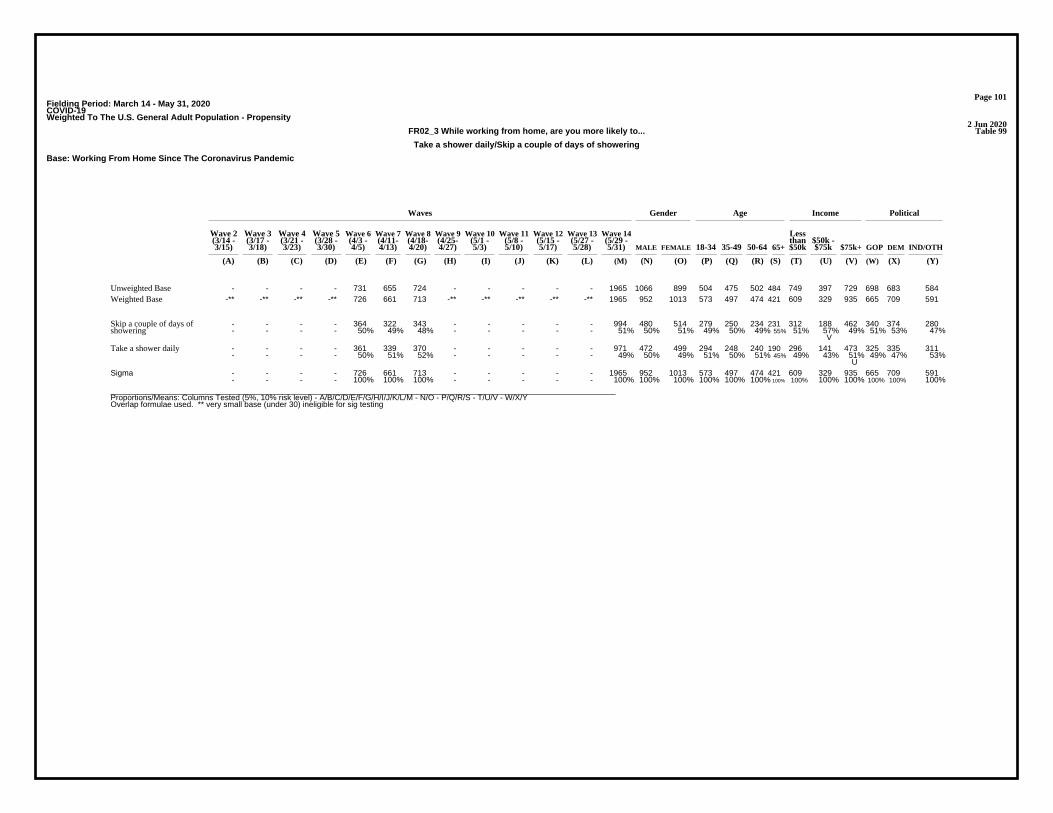
Page 101Fielding Period: March 14 - May 31, 2020COVID-19Weighted To The U.S. General Adult Population - Propensity
2 Jun 2020Table 99FR02_3 While working from home, are you more likely to...
Take a shower daily/Skip a couple of days of showering
Base: Working From Home Since The Coronavirus Pandemic
Waves Gender Age Income Political
Wave 2 Wave 3 Wave 4 Wave 5 Wave 6 Wave 7 Wave 8 Wave 9 Wave 10 Wave 11 Wave 12 Wave 13 Wave 14 Less(3/14 - (3/17 - (3/21 - (3/28 - (4/3 - (4/11- (4/18- (4/25- (5/1 - (5/8 - (5/15 - (5/27 - (5/29 - than $50k -3/15) 3/18) 3/23) 3/30) 4/5) 4/13) 4/20) 4/27) 5/3) 5/10) 5/17) 5/28) 5/31) MALE FEMALE 18-34 35-49 50-64 65+ $50k $75k $75k+ GOP DEM IND/OTH
(A) (B) (C) (D) (E) (F) (G) (H) (I) (J) (K) (L) (M) (N) (O) (P) (Q) (R) (S) (T) (U) (V) (W) (X) (Y)
- - - - 731 655 724 - - - - - 1965 1066 899 504 475 502 484 749 397 729 698 683 584Unweighted Base-** -** -** -** 726 661 713 -** -** -** -** -** 1965 952 1013 573 497 474 421 609 329 935 665 709 591Weighted Base
- - - - 364 322 343 - - - - - 994 480 514 279 250 234 231 312 188 462 340 374 280- - - - 50% 49% 48% - - - - - 51% 50% 51% 49% 50% 49% 55% 51% 57% 49% 51% 53% 47%
V
Skip a couple of days ofshowering
- - - - 361 339 370 - - - - - 971 472 499 294 248 240 190 296 141 473 325 335 311- - - - 50% 51% 52% - - - - - 49% 50% 49% 51% 50% 51% 45% 49% 43% 51% 49% 47% 53%
U
Take a shower daily
- - - - 726 661 713 - - - - - 1965 952 1013 573 497 474 421 609 329 935 665 709 591- - - - 100% 100% 100% - - - - - 100% 100% 100% 100% 100% 100% 100% 100% 100% 100% 100% 100% 100%
Sigma
__________________________________________________________________________________________________________________Proportions/Means: Columns Tested (5%, 10% risk level) - A/B/C/D/E/F/G/H/I/J/K/L/M - N/O - P/Q/R/S - T/U/V - W/X/YOverlap formulae used. ** very small base (under 30) ineligible for sig testing
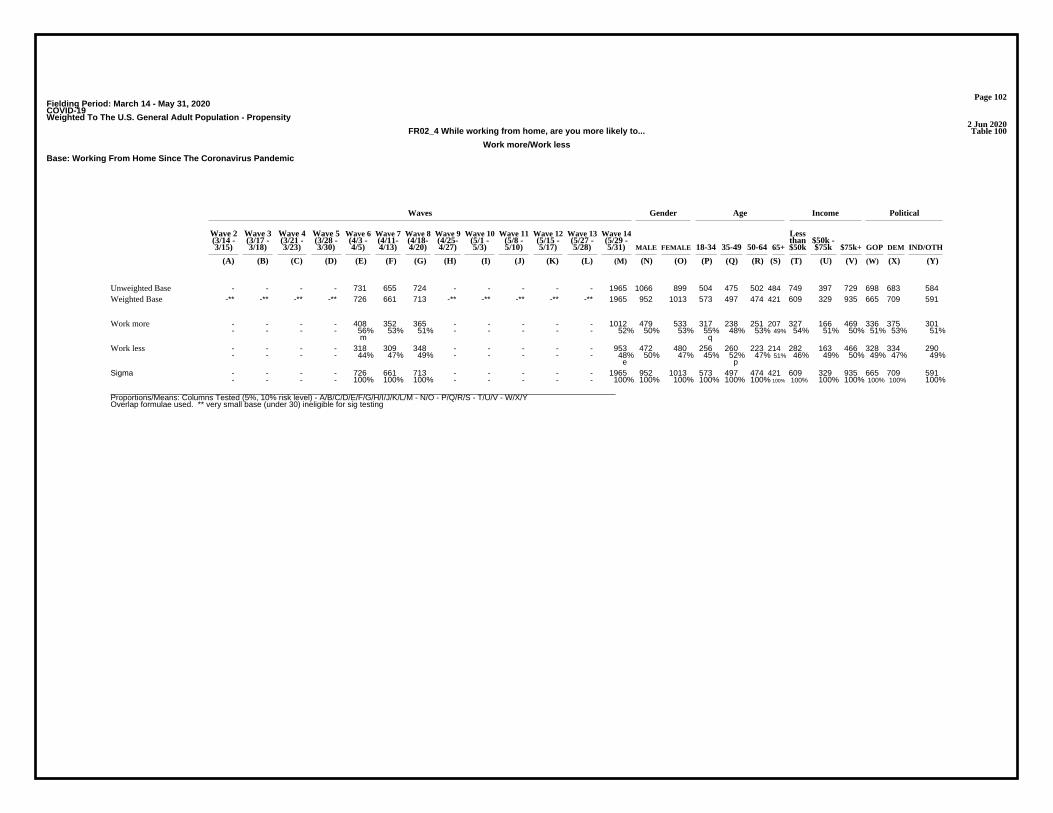
Page 102Fielding Period: March 14 - May 31, 2020COVID-19Weighted To The U.S. General Adult Population - Propensity
2 Jun 2020Table 100FR02_4 While working from home, are you more likely to...
Work more/Work less
Base: Working From Home Since The Coronavirus Pandemic
Waves Gender Age Income Political
Wave 2 Wave 3 Wave 4 Wave 5 Wave 6 Wave 7 Wave 8 Wave 9 Wave 10 Wave 11 Wave 12 Wave 13 Wave 14 Less(3/14 - (3/17 - (3/21 - (3/28 - (4/3 - (4/11- (4/18- (4/25- (5/1 - (5/8 - (5/15 - (5/27 - (5/29 - than $50k -3/15) 3/18) 3/23) 3/30) 4/5) 4/13) 4/20) 4/27) 5/3) 5/10) 5/17) 5/28) 5/31) MALE FEMALE 18-34 35-49 50-64 65+ $50k $75k $75k+ GOP DEM IND/OTH
(A) (B) (C) (D) (E) (F) (G) (H) (I) (J) (K) (L) (M) (N) (O) (P) (Q) (R) (S) (T) (U) (V) (W) (X) (Y)
- - - - 731 655 724 - - - - - 1965 1066 899 504 475 502 484 749 397 729 698 683 584Unweighted Base-** -** -** -** 726 661 713 -** -** -** -** -** 1965 952 1013 573 497 474 421 609 329 935 665 709 591Weighted Base
- - - - 408 352 365 - - - - - 1012 479 533 317 238 251 207 327 166 469 336 375 301- - - - 56% 53% 51% - - - - - 52% 50% 53% 55% 48% 53% 49% 54% 51% 50% 51% 53% 51%
m q
Work more
- - - - 318 309 348 - - - - - 953 472 480 256 260 223 214 282 163 466 328 334 290- - - - 44% 47% 49% - - - - - 48% 50% 47% 45% 52% 47% 51% 46% 49% 50% 49% 47% 49%
e p
Work less
- - - - 726 661 713 - - - - - 1965 952 1013 573 497 474 421 609 329 935 665 709 591- - - - 100% 100% 100% - - - - - 100% 100% 100% 100% 100% 100% 100% 100% 100% 100% 100% 100% 100%
Sigma
__________________________________________________________________________________________________________________Proportions/Means: Columns Tested (5%, 10% risk level) - A/B/C/D/E/F/G/H/I/J/K/L/M - N/O - P/Q/R/S - T/U/V - W/X/YOverlap formulae used. ** very small base (under 30) ineligible for sig testing

Page 103Fielding Period: March 14 - May 31, 2020COVID-19Weighted To The U.S. General Adult Population - Propensity
2 Jun 2020Table 101FR02_5 While working from home, are you more likely to...
Maintain clear time boundaries (e.g., 9-5)/Work anytime that is needed
Base: Working From Home Since The Coronavirus Pandemic
Waves Gender Age Income Political
Wave 2 Wave 3 Wave 4 Wave 5 Wave 6 Wave 7 Wave 8 Wave 9 Wave 10 Wave 11 Wave 12 Wave 13 Wave 14 Less(3/14 - (3/17 - (3/21 - (3/28 - (4/3 - (4/11- (4/18- (4/25- (5/1 - (5/8 - (5/15 - (5/27 - (5/29 - than $50k -3/15) 3/18) 3/23) 3/30) 4/5) 4/13) 4/20) 4/27) 5/3) 5/10) 5/17) 5/28) 5/31) MALE FEMALE 18-34 35-49 50-64 65+ $50k $75k $75k+ GOP DEM IND/OTH
(A) (B) (C) (D) (E) (F) (G) (H) (I) (J) (K) (L) (M) (N) (O) (P) (Q) (R) (S) (T) (U) (V) (W) (X) (Y)
- - - - 731 655 724 - - - - - 1965 1066 899 504 475 502 484 749 397 729 698 683 584Unweighted Base-** -** -** -** 726 661 713 -** -** -** -** -** 1965 952 1013 573 497 474 421 609 329 935 665 709 591Weighted Base
- - - - 355 290 340 - - - - - 1007 479 528 303 243 224 236 293 172 486 317 355 334- - - - 49% 44% 48% - - - - - 51% 50% 52% 53% 49% 47% 56% 48% 52% 52% 48% 50% 56%
F qR Wx
Work anytime that isneeded
- - - - 371 371 372 - - - - - 958 473 486 270 255 249 184 315 157 449 347 354 257- - - - 51% 56% 52% - - - - - 49% 50% 48% 47% 51% 53% 44% 52% 48% 48% 52% 50% 44%
M s S Y y
Maintain clear timeboundaries (e.g., 9-5)
- - - - 726 661 713 - - - - - 1965 952 1013 573 497 474 421 609 329 935 665 709 591- - - - 100% 100% 100% - - - - - 100% 100% 100% 100% 100% 100% 100% 100% 100% 100% 100% 100% 100%
Sigma
__________________________________________________________________________________________________________________Proportions/Means: Columns Tested (5%, 10% risk level) - A/B/C/D/E/F/G/H/I/J/K/L/M - N/O - P/Q/R/S - T/U/V - W/X/YOverlap formulae used. ** very small base (under 30) ineligible for sig testing
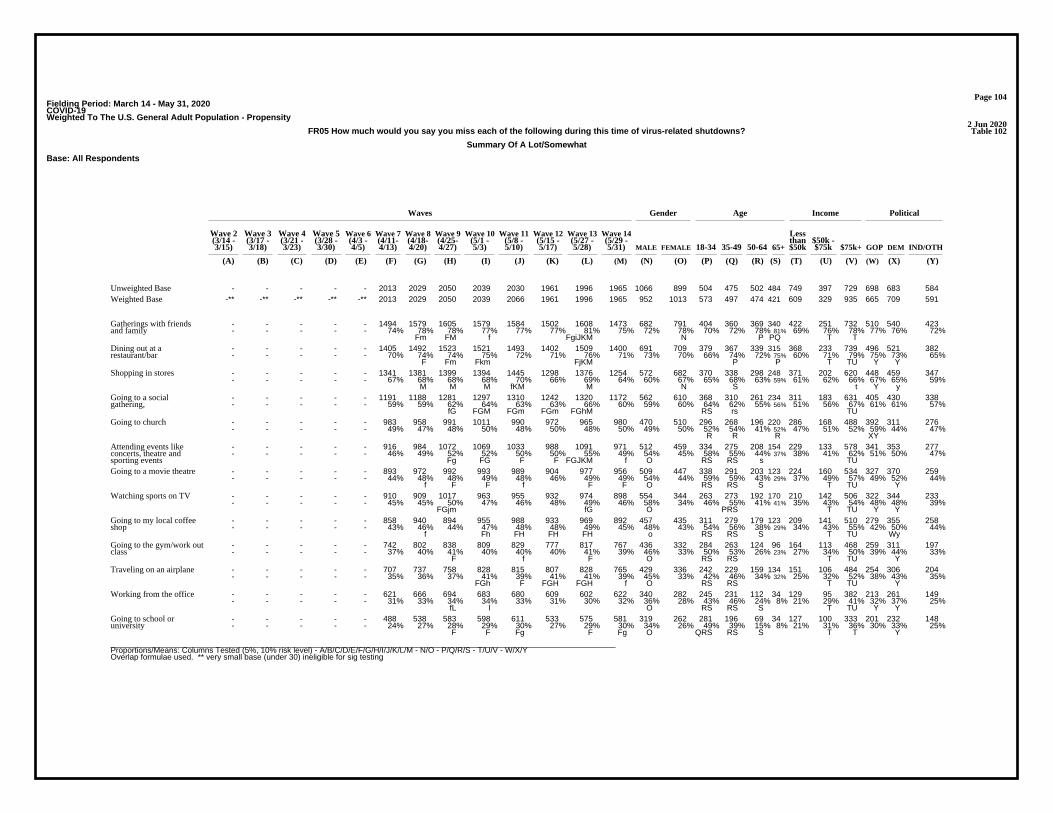
Page 104Fielding Period: March 14 - May 31, 2020COVID-19Weighted To The U.S. General Adult Population - Propensity
2 Jun 2020Table 102FR05 How much would you say you miss each of the following during this time of virus-related shutdowns?
Summary Of A Lot/Somewhat
Base: All Respondents
Waves Gender Age Income Political
Wave 2 Wave 3 Wave 4 Wave 5 Wave 6 Wave 7 Wave 8 Wave 9 Wave 10 Wave 11 Wave 12 Wave 13 Wave 14 Less(3/14 - (3/17 - (3/21 - (3/28 - (4/3 - (4/11- (4/18- (4/25- (5/1 - (5/8 - (5/15 - (5/27 - (5/29 - than $50k -3/15) 3/18) 3/23) 3/30) 4/5) 4/13) 4/20) 4/27) 5/3) 5/10) 5/17) 5/28) 5/31) MALE FEMALE 18-34 35-49 50-64 65+ $50k $75k $75k+ GOP DEM IND/OTH
(A) (B) (C) (D) (E) (F) (G) (H) (I) (J) (K) (L) (M) (N) (O) (P) (Q) (R) (S) (T) (U) (V) (W) (X) (Y)
- - - - - 2013 2029 2050 2039 2030 1961 1996 1965 1066 899 504 475 502 484 749 397 729 698 683 584Unweighted Base-** -** -** -** -** 2013 2029 2050 2039 2066 1961 1996 1965 952 1013 573 497 474 421 609 329 935 665 709 591Weighted Base
- - - - - 1494 1579 1605 1579 1584 1502 1608 1473 682 791 404 360 369 340 422 251 732 510 540 423- - - - - 74% 78% 78% 77% 77% 77% 81% 75% 72% 78% 70% 72% 78% 81% 69% 76% 78% 77% 76% 72%
Fm FM f FgiJKM N P PQ T T
Gatherings with friendsand family
- - - - - 1405 1492 1523 1521 1493 1402 1509 1400 691 709 379 367 339 315 368 233 739 496 521 382- - - - - 70% 74% 74% 75% 72% 71% 76% 71% 73% 70% 66% 74% 72% 75% 60% 71% 79% 75% 73% 65%
F Fm Fkm FjKM P P T TU Y Y
Dining out at arestaurant/bar
- - - - - 1341 1381 1399 1394 1445 1298 1376 1254 572 682 370 338 298 248 371 202 620 448 459 347- - - - - 67% 68% 68% 68% 70% 66% 69% 64% 60% 67% 65% 68% 63% 59% 61% 62% 66% 67% 65% 59%
M M M fKM M N S t Y y
Shopping in stores
- - - - - 1191 1188 1281 1297 1310 1242 1320 1172 562 610 368 310 261 234 311 183 631 405 430 338- - - - - 59% 59% 62% 64% 63% 63% 66% 60% 59% 60% 64% 62% 55% 56% 51% 56% 67% 61% 61% 57%
fG FGM FGm FGm FGhM RS rs TU
Going to a socialgathering,
- - - - - 983 958 991 1011 990 972 965 980 470 510 296 268 196 220 286 168 488 392 311 276- - - - - 49% 47% 48% 50% 48% 50% 48% 50% 49% 50% 52% 54% 41% 52% 47% 51% 52% 59% 44% 47%
R R R XY
Going to church
- - - - - 916 984 1072 1069 1033 988 1091 971 512 459 334 275 208 154 229 133 578 341 353 277- - - - - 46% 49% 52% 52% 50% 50% 55% 49% 54% 45% 58% 55% 44% 37% 38% 41% 62% 51% 50% 47%
Fg FG F F FGJKM f O RS RS s TU
Attending events likeconcerts, theatre andsporting events
- - - - - 893 972 992 993 989 904 977 956 509 447 338 291 203 123 224 160 534 327 370 259- - - - - 44% 48% 48% 49% 48% 46% 49% 49% 54% 44% 59% 59% 43% 29% 37% 49% 57% 49% 52% 44%
f F F f F F O RS RS S T TU Y
Going to a movie theatre
- - - - - 910 909 1017 963 955 932 974 898 554 344 263 273 192 170 210 142 506 322 344 233- - - - - 45% 45% 50% 47% 46% 48% 49% 46% 58% 34% 46% 55% 41% 41% 35% 43% 54% 48% 48% 39%
FGjm fG O PRS T TU Y Y
Watching sports on TV
- - - - - 858 940 894 955 988 933 969 892 457 435 311 279 179 123 209 141 510 279 355 258- - - - - 43% 46% 44% 47% 48% 48% 49% 45% 48% 43% 54% 56% 38% 29% 34% 43% 55% 42% 50% 44%
f Fh FH FH FH o RS RS S T TU Wy
Going to my local coffeeshop
- - - - - 742 802 838 809 829 777 817 767 436 332 284 263 124 96 164 113 468 259 311 197- - - - - 37% 40% 41% 40% 40% 40% 41% 39% 46% 33% 50% 53% 26% 23% 27% 34% 50% 39% 44% 33%
F f F O RS RS T TU Y
Going to the gym/work outclass
- - - - - 707 737 758 828 815 807 828 765 429 336 242 229 159 134 151 106 484 254 306 204- - - - - 35% 36% 37% 41% 39% 41% 41% 39% 45% 33% 42% 46% 34% 32% 25% 32% 52% 38% 43% 35%
FGh F FGH FGH f O RS RS T TU Y
Traveling on an airplane
- - - - - 621 666 694 683 680 609 602 622 340 282 245 231 112 34 129 95 382 213 261 149- - - - - 31% 33% 34% 34% 33% 31% 30% 32% 36% 28% 43% 46% 24% 8% 21% 29% 41% 32% 37% 25%
fL l O RS RS S T TU Y Y
Working from the office
- - - - - 488 538 583 598 611 533 575 581 319 262 281 196 69 34 127 100 333 201 232 148- - - - - 24% 27% 28% 29% 30% 27% 29% 30% 34% 26% 49% 39% 15% 8% 21% 31% 36% 30% 33% 25%
F F Fg F Fg O QRS RS S T T Y
Going to school oruniversity
__________________________________________________________________________________________________________________Proportions/Means: Columns Tested (5%, 10% risk level) - A/B/C/D/E/F/G/H/I/J/K/L/M - N/O - P/Q/R/S - T/U/V - W/X/YOverlap formulae used. ** very small base (under 30) ineligible for sig testing
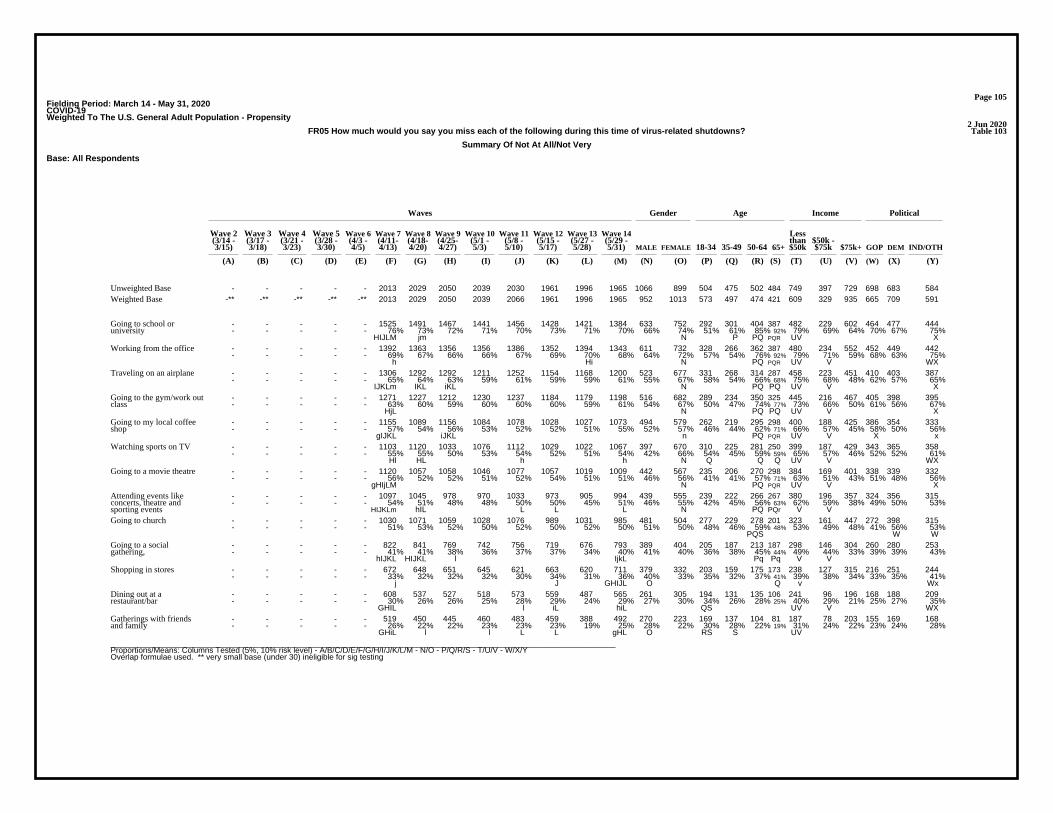
Page 105Fielding Period: March 14 - May 31, 2020COVID-19Weighted To The U.S. General Adult Population - Propensity
2 Jun 2020Table 103FR05 How much would you say you miss each of the following during this time of virus-related shutdowns?
Summary Of Not At All/Not Very
Base: All Respondents
Waves Gender Age Income Political
Wave 2 Wave 3 Wave 4 Wave 5 Wave 6 Wave 7 Wave 8 Wave 9 Wave 10 Wave 11 Wave 12 Wave 13 Wave 14 Less(3/14 - (3/17 - (3/21 - (3/28 - (4/3 - (4/11- (4/18- (4/25- (5/1 - (5/8 - (5/15 - (5/27 - (5/29 - than $50k -3/15) 3/18) 3/23) 3/30) 4/5) 4/13) 4/20) 4/27) 5/3) 5/10) 5/17) 5/28) 5/31) MALE FEMALE 18-34 35-49 50-64 65+ $50k $75k $75k+ GOP DEM IND/OTH
(A) (B) (C) (D) (E) (F) (G) (H) (I) (J) (K) (L) (M) (N) (O) (P) (Q) (R) (S) (T) (U) (V) (W) (X) (Y)
- - - - - 2013 2029 2050 2039 2030 1961 1996 1965 1066 899 504 475 502 484 749 397 729 698 683 584Unweighted Base-** -** -** -** -** 2013 2029 2050 2039 2066 1961 1996 1965 952 1013 573 497 474 421 609 329 935 665 709 591Weighted Base
- - - - - 1525 1491 1467 1441 1456 1428 1421 1384 633 752 292 301 404 387 482 229 602 464 477 444- - - - - 76% 73% 72% 71% 70% 73% 71% 70% 66% 74% 51% 61% 85% 92% 79% 69% 64% 70% 67% 75%
HIJLM jm N P PQ PQR UV X
Going to school oruniversity
- - - - - 1392 1363 1356 1356 1386 1352 1394 1343 611 732 328 266 362 387 480 234 552 452 449 442- - - - - 69% 67% 66% 66% 67% 69% 70% 68% 64% 72% 57% 54% 76% 92% 79% 71% 59% 68% 63% 75%
h Hi N PQ PQR UV V WX
Working from the office
- - - - - 1306 1292 1292 1211 1252 1154 1168 1200 523 677 331 268 314 287 458 223 451 410 403 387- - - - - 65% 64% 63% 59% 61% 59% 59% 61% 55% 67% 58% 54% 66% 68% 75% 68% 48% 62% 57% 65%
IJKLm IKL iKL N PQ PQ UV V X
Traveling on an airplane
- - - - - 1271 1227 1212 1230 1237 1184 1179 1198 516 682 289 234 350 325 445 216 467 405 398 395- - - - - 63% 60% 59% 60% 60% 60% 59% 61% 54% 67% 50% 47% 74% 77% 73% 66% 50% 61% 56% 67%
HjL N PQ PQ UV V X
Going to the gym/work outclass
- - - - - 1155 1089 1156 1084 1078 1028 1027 1073 494 579 262 219 295 298 400 188 425 386 354 333- - - - - 57% 54% 56% 53% 52% 52% 51% 55% 52% 57% 46% 44% 62% 71% 66% 57% 45% 58% 50% 56%
gIJKL iJKL n PQ PQR UV V X x
Going to my local coffeeshop
- - - - - 1103 1120 1033 1076 1112 1029 1022 1067 397 670 310 225 281 250 399 187 429 343 365 358- - - - - 55% 55% 50% 53% 54% 52% 51% 54% 42% 66% 54% 45% 59% 59% 65% 57% 46% 52% 52% 61%
Hl HL h h N Q Q Q UV V WX
Watching sports on TV
- - - - - 1120 1057 1058 1046 1077 1057 1019 1009 442 567 235 206 270 298 384 169 401 338 339 332- - - - - 56% 52% 52% 51% 52% 54% 51% 51% 46% 56% 41% 41% 57% 71% 63% 51% 43% 51% 48% 56%
gHIjLM N PQ PQR UV V X
Going to a movie theatre
- - - - - 1097 1045 978 970 1033 973 905 994 439 555 239 222 266 267 380 196 357 324 356 315- - - - - 54% 51% 48% 48% 50% 50% 45% 51% 46% 55% 42% 45% 56% 63% 62% 59% 38% 49% 50% 53%
HIJKLm hIL L L L N PQ PQr V V
Attending events likeconcerts, theatre andsporting events
- - - - - 1030 1071 1059 1028 1076 989 1031 985 481 504 277 229 278 201 323 161 447 272 398 315- - - - - 51% 53% 52% 50% 52% 50% 52% 50% 51% 50% 48% 46% 59% 48% 53% 49% 48% 41% 56% 53%
PQS W W
Going to church
- - - - - 822 841 769 742 756 719 676 793 389 404 205 187 213 187 298 146 304 260 280 253- - - - - 41% 41% 38% 36% 37% 37% 34% 40% 41% 40% 36% 38% 45% 44% 49% 44% 33% 39% 39% 43%
hIJKL HIJKL l IjkL Pq Pq V V
Going to a socialgathering,
- - - - - 672 648 651 645 621 663 620 711 379 332 203 159 175 173 238 127 315 216 251 244- - - - - 33% 32% 32% 32% 30% 34% 31% 36% 40% 33% 35% 32% 37% 41% 39% 38% 34% 33% 35% 41%
j J GHIJL O Q v Wx
Shopping in stores
- - - - - 608 537 527 518 573 559 487 565 261 305 194 131 135 106 241 96 196 168 188 209- - - - - 30% 26% 26% 25% 28% 29% 24% 29% 27% 30% 34% 26% 28% 25% 40% 29% 21% 25% 27% 35%
GHIL l iL hiL QS UV V WX
Dining out at arestaurant/bar
- - - - - 519 450 445 460 483 459 388 492 270 223 169 137 104 81 187 78 203 155 169 168- - - - - 26% 22% 22% 23% 23% 23% 19% 25% 28% 22% 30% 28% 22% 19% 31% 24% 22% 23% 24% 28%
GHiL l l L L gHL O RS S UV
Gatherings with friendsand family
__________________________________________________________________________________________________________________Proportions/Means: Columns Tested (5%, 10% risk level) - A/B/C/D/E/F/G/H/I/J/K/L/M - N/O - P/Q/R/S - T/U/V - W/X/YOverlap formulae used. ** very small base (under 30) ineligible for sig testing

Page 106Fielding Period: March 14 - May 31, 2020COVID-19Weighted To The U.S. General Adult Population - Propensity
2 Jun 2020Table 104FR05_1 How much would you say you miss each of the following during this time of virus-related shutdowns?
Traveling on an airplane
Base: All Respondents
Waves Gender Age Income Political
Wave 2 Wave 3 Wave 4 Wave 5 Wave 6 Wave 7 Wave 8 Wave 9 Wave 10 Wave 11 Wave 12 Wave 13 Wave 14 Less(3/14 - (3/17 - (3/21 - (3/28 - (4/3 - (4/11- (4/18- (4/25- (5/1 - (5/8 - (5/15 - (5/27 - (5/29 - than $50k -3/15) 3/18) 3/23) 3/30) 4/5) 4/13) 4/20) 4/27) 5/3) 5/10) 5/17) 5/28) 5/31) MALE FEMALE 18-34 35-49 50-64 65+ $50k $75k $75k+ GOP DEM IND/OTH
(A) (B) (C) (D) (E) (F) (G) (H) (I) (J) (K) (L) (M) (N) (O) (P) (Q) (R) (S) (T) (U) (V) (W) (X) (Y)
- - - - - 2013 2029 2050 2039 2030 1961 1996 1965 1066 899 504 475 502 484 749 397 729 698 683 584Unweighted Base-** -** -** -** -** 2013 2029 2050 2039 2066 1961 1996 1965 952 1013 573 497 474 421 609 329 935 665 709 591Weighted Base
- - - - - 707 737 758 828 815 807 828 765 429 336 242 229 159 134 151 106 484 254 306 204- - - - - 35% 36% 37% 41% 39% 41% 41% 39% 45% 33% 42% 46% 34% 32% 25% 32% 52% 38% 43% 35%
FGh F FGH FGH f O RS RS T TU Y
A Lot/Somewhat (Net)
- - - - - 301 308 304 355 356 312 334 372 215 158 105 139 60 68 58 50 255 137 147 89- - - - - 15% 15% 15% 17% 17% 16% 17% 19% 23% 16% 18% 28% 13% 16% 10% 15% 27% 21% 21% 15%
fh h FGHk O r PRS T TU Y Y
A lot
- - - - - 406 429 454 473 459 495 494 392 214 178 137 90 99 66 93 56 229 117 160 116- - - - - 20% 21% 22% 23% 22% 25% 25% 20% 23% 18% 24% 18% 21% 16% 15% 17% 24% 18% 22% 20%
fm FGhjM FGM O qS s TU w
Somewhat
- - - - - 1306 1292 1292 1211 1252 1154 1168 1200 523 677 331 268 314 287 458 223 451 410 403 387- - - - - 65% 64% 63% 59% 61% 59% 59% 61% 55% 67% 58% 54% 66% 68% 75% 68% 48% 62% 57% 65%
IJKLm IKL iKL N PQ PQ UV V X
Not At All/Not Very (Net)
- - - - - 343 405 352 360 422 375 374 322 177 145 122 77 56 67 93 53 167 100 114 108- - - - - 17% 20% 17% 18% 20% 19% 19% 16% 19% 14% 21% 16% 12% 16% 15% 16% 18% 15% 16% 18%
fhM FHiM m o qRs
Not very
- - - - - 963 887 940 852 830 779 794 878 346 532 209 191 258 220 365 170 285 310 289 279- - - - - 48% 44% 46% 42% 40% 40% 40% 45% 36% 52% 36% 38% 55% 52% 60% 52% 30% 47% 41% 47%
GIJKL jKL IJKL JKL N PQ PQ UV V x x
Not at all
- - - - - 2013 2029 2050 2039 2066 1961 1996 1965 952 1013 573 497 474 421 609 329 935 665 709 591- - - - - 100% 100% 100% 100% 100% 100% 100% 100% 100% 100% 100% 100% 100% 100% 100% 100% 100% 100% 100% 100%
Sigma
__________________________________________________________________________________________________________________Proportions/Means: Columns Tested (5%, 10% risk level) - A/B/C/D/E/F/G/H/I/J/K/L/M - N/O - P/Q/R/S - T/U/V - W/X/YOverlap formulae used. ** very small base (under 30) ineligible for sig testing

Page 107Fielding Period: March 14 - May 31, 2020COVID-19Weighted To The U.S. General Adult Population - Propensity
2 Jun 2020Table 105FR05_2 How much would you say you miss each of the following during this time of virus-related shutdowns?
Going to a movie theatre
Base: All Respondents
Waves Gender Age Income Political
Wave 2 Wave 3 Wave 4 Wave 5 Wave 6 Wave 7 Wave 8 Wave 9 Wave 10 Wave 11 Wave 12 Wave 13 Wave 14 Less(3/14 - (3/17 - (3/21 - (3/28 - (4/3 - (4/11- (4/18- (4/25- (5/1 - (5/8 - (5/15 - (5/27 - (5/29 - than $50k -3/15) 3/18) 3/23) 3/30) 4/5) 4/13) 4/20) 4/27) 5/3) 5/10) 5/17) 5/28) 5/31) MALE FEMALE 18-34 35-49 50-64 65+ $50k $75k $75k+ GOP DEM IND/OTH
(A) (B) (C) (D) (E) (F) (G) (H) (I) (J) (K) (L) (M) (N) (O) (P) (Q) (R) (S) (T) (U) (V) (W) (X) (Y)
- - - - - 2013 2029 2050 2039 2030 1961 1996 1965 1066 899 504 475 502 484 749 397 729 698 683 584Unweighted Base-** -** -** -** -** 2013 2029 2050 2039 2066 1961 1996 1965 952 1013 573 497 474 421 609 329 935 665 709 591Weighted Base
- - - - - 893 972 992 993 989 904 977 956 509 447 338 291 203 123 224 160 534 327 370 259- - - - - 44% 48% 48% 49% 48% 46% 49% 49% 54% 44% 59% 59% 43% 29% 37% 49% 57% 49% 52% 44%
f F F f F F O RS RS S T TU Y
A Lot/Somewhat (Net)
- - - - - 396 345 423 447 411 379 402 411 231 180 151 144 72 44 83 75 245 139 172 100- - - - - 20% 17% 21% 22% 20% 19% 20% 21% 24% 18% 26% 29% 15% 10% 14% 23% 26% 21% 24% 17%
g G G g G G O RS RS s T T Y
A lot
- - - - - 496 627 569 546 578 525 575 546 279 267 187 147 131 80 141 85 289 188 199 159- - - - - 25% 31% 28% 27% 28% 27% 29% 28% 29% 26% 33% 30% 28% 19% 23% 26% 31% 28% 28% 27%
FhIjKm f f F f S S S T
Somewhat
- - - - - 1120 1057 1058 1046 1077 1057 1019 1009 442 567 235 206 270 298 384 169 401 338 339 332- - - - - 56% 52% 52% 51% 52% 54% 51% 51% 46% 56% 41% 41% 57% 71% 63% 51% 43% 51% 48% 56%
gHIjLM N PQ PQR UV V X
Not At All/Not Very (Net)
- - - - - 358 361 350 364 375 383 379 333 167 167 102 70 74 88 105 47 166 98 129 106- - - - - 18% 18% 17% 18% 18% 20% 19% 17% 18% 16% 18% 14% 16% 21% 17% 14% 18% 15% 18% 18%
Qr
Not very
- - - - - 762 696 707 682 703 674 640 675 275 400 133 136 196 210 279 122 234 240 210 226- - - - - 38% 34% 35% 33% 34% 34% 32% 34% 29% 39% 23% 27% 41% 50% 46% 37% 25% 36% 30% 38%
ghIJkLm N PQ PQR UV V X X
Not at all
- - - - - 2013 2029 2050 2039 2066 1961 1996 1965 952 1013 573 497 474 421 609 329 935 665 709 591- - - - - 100% 100% 100% 100% 100% 100% 100% 100% 100% 100% 100% 100% 100% 100% 100% 100% 100% 100% 100% 100%
Sigma
__________________________________________________________________________________________________________________Proportions/Means: Columns Tested (5%, 10% risk level) - A/B/C/D/E/F/G/H/I/J/K/L/M - N/O - P/Q/R/S - T/U/V - W/X/YOverlap formulae used. ** very small base (under 30) ineligible for sig testing

Page 108Fielding Period: March 14 - May 31, 2020COVID-19Weighted To The U.S. General Adult Population - Propensity
2 Jun 2020Table 106FR05_3 How much would you say you miss each of the following during this time of virus-related shutdowns?
Shopping in stores
Base: All Respondents
Waves Gender Age Income Political
Wave 2 Wave 3 Wave 4 Wave 5 Wave 6 Wave 7 Wave 8 Wave 9 Wave 10 Wave 11 Wave 12 Wave 13 Wave 14 Less(3/14 - (3/17 - (3/21 - (3/28 - (4/3 - (4/11- (4/18- (4/25- (5/1 - (5/8 - (5/15 - (5/27 - (5/29 - than $50k -3/15) 3/18) 3/23) 3/30) 4/5) 4/13) 4/20) 4/27) 5/3) 5/10) 5/17) 5/28) 5/31) MALE FEMALE 18-34 35-49 50-64 65+ $50k $75k $75k+ GOP DEM IND/OTH
(A) (B) (C) (D) (E) (F) (G) (H) (I) (J) (K) (L) (M) (N) (O) (P) (Q) (R) (S) (T) (U) (V) (W) (X) (Y)
- - - - - 2013 2029 2050 2039 2030 1961 1996 1965 1066 899 504 475 502 484 749 397 729 698 683 584Unweighted Base-** -** -** -** -** 2013 2029 2050 2039 2066 1961 1996 1965 952 1013 573 497 474 421 609 329 935 665 709 591Weighted Base
- - - - - 1341 1381 1399 1394 1445 1298 1376 1254 572 682 370 338 298 248 371 202 620 448 459 347- - - - - 67% 68% 68% 68% 70% 66% 69% 64% 60% 67% 65% 68% 63% 59% 61% 62% 66% 67% 65% 59%
M M M fKM M N S t Y y
A Lot/Somewhat (Net)
- - - - - 625 577 557 558 576 497 577 512 207 305 179 162 94 77 156 79 257 177 200 135- - - - - 31% 28% 27% 27% 28% 25% 29% 26% 22% 30% 31% 33% 20% 18% 26% 24% 28% 27% 28% 23%
HIjKM k k N RS RS y
A lot
- - - - - 716 804 842 836 869 801 799 742 365 377 191 176 204 171 215 123 362 272 259 212- - - - - 36% 40% 41% 41% 42% 41% 40% 38% 38% 37% 33% 35% 43% 41% 35% 37% 39% 41% 36% 36%
F Fm Fm FM F F Pq p
Somewhat
- - - - - 672 648 651 645 621 663 620 711 379 332 203 159 175 173 238 127 315 216 251 244- - - - - 33% 32% 32% 32% 30% 34% 31% 36% 40% 33% 35% 32% 37% 41% 39% 38% 34% 33% 35% 41%
j J GHIJL O Q v Wx
Not At All/Not Very (Net)
- - - - - 396 365 363 405 362 400 384 427 230 197 138 78 104 107 137 76 200 134 152 141- - - - - 20% 18% 18% 20% 18% 20% 19% 22% 24% 19% 24% 16% 22% 25% 22% 23% 21% 20% 21% 24%
hj GHJ O Q Q Q
Not very
- - - - - 275 283 287 239 259 263 236 284 149 134 65 81 71 66 101 51 116 82 98 103- - - - - 14% 14% 14% 12% 13% 13% 12% 14% 16% 13% 11% 16% 15% 16% 17% 15% 12% 12% 14% 17%
i il Il p v w
Not at all
- - - - - 2013 2029 2050 2039 2066 1961 1996 1965 952 1013 573 497 474 421 609 329 935 665 709 591- - - - - 100% 100% 100% 100% 100% 100% 100% 100% 100% 100% 100% 100% 100% 100% 100% 100% 100% 100% 100% 100%
Sigma
__________________________________________________________________________________________________________________Proportions/Means: Columns Tested (5%, 10% risk level) - A/B/C/D/E/F/G/H/I/J/K/L/M - N/O - P/Q/R/S - T/U/V - W/X/YOverlap formulae used. ** very small base (under 30) ineligible for sig testing

Page 109Fielding Period: March 14 - May 31, 2020COVID-19Weighted To The U.S. General Adult Population - Propensity
2 Jun 2020Table 107FR05_4 How much would you say you miss each of the following during this time of virus-related shutdowns?
Working from the office
Base: All Respondents
Waves Gender Age Income Political
Wave 2 Wave 3 Wave 4 Wave 5 Wave 6 Wave 7 Wave 8 Wave 9 Wave 10 Wave 11 Wave 12 Wave 13 Wave 14 Less(3/14 - (3/17 - (3/21 - (3/28 - (4/3 - (4/11- (4/18- (4/25- (5/1 - (5/8 - (5/15 - (5/27 - (5/29 - than $50k -3/15) 3/18) 3/23) 3/30) 4/5) 4/13) 4/20) 4/27) 5/3) 5/10) 5/17) 5/28) 5/31) MALE FEMALE 18-34 35-49 50-64 65+ $50k $75k $75k+ GOP DEM IND/OTH
(A) (B) (C) (D) (E) (F) (G) (H) (I) (J) (K) (L) (M) (N) (O) (P) (Q) (R) (S) (T) (U) (V) (W) (X) (Y)
- - - - - 2013 2029 2050 2039 2030 1961 1996 1965 1066 899 504 475 502 484 749 397 729 698 683 584Unweighted Base-** -** -** -** -** 2013 2029 2050 2039 2066 1961 1996 1965 952 1013 573 497 474 421 609 329 935 665 709 591Weighted Base
- - - - - 621 666 694 683 680 609 602 622 340 282 245 231 112 34 129 95 382 213 261 149- - - - - 31% 33% 34% 34% 33% 31% 30% 32% 36% 28% 43% 46% 24% 8% 21% 29% 41% 32% 37% 25%
fL l O RS RS S T TU Y Y
A Lot/Somewhat (Net)
- - - - - 261 246 301 268 266 213 223 253 155 98 106 103 37 7 49 38 161 99 100 54- - - - - 13% 12% 15% 13% 13% 11% 11% 13% 16% 10% 19% 21% 8% 2% 8% 12% 17% 15% 14% 9%
GKL k O RS RS S Tu Y Y
A lot
- - - - - 360 420 393 415 414 395 379 369 185 184 139 128 75 28 80 57 221 114 160 95- - - - - 18% 21% 19% 20% 20% 20% 19% 19% 19% 18% 24% 26% 16% 7% 13% 17% 24% 17% 23% 16%
f RS RS S TU WY
Somewhat
- - - - - 1392 1363 1356 1356 1386 1352 1394 1343 611 732 328 266 362 387 480 234 552 452 449 442- - - - - 69% 67% 66% 66% 67% 69% 70% 68% 64% 72% 57% 54% 76% 92% 79% 71% 59% 68% 63% 75%
h Hi N PQ PQR UV V WX
Not At All/Not Very (Net)
- - - - - 270 296 323 333 325 321 289 380 214 166 149 88 100 43 101 61 206 122 133 125- - - - - 13% 15% 16% 16% 16% 16% 14% 19% 22% 16% 26% 18% 21% 10% 17% 18% 22% 18% 19% 21%
f F f F FGHiJkL O QS S S T
Not very
- - - - - 1123 1067 1033 1023 1061 1031 1105 963 398 565 179 179 262 343 379 173 346 330 316 317- - - - - 56% 53% 50% 50% 51% 53% 55% 49% 42% 56% 31% 36% 55% 82% 62% 53% 37% 50% 45% 54%
HIJM m m HIJM N PQ PQR UV V X
Not at all
- - - - - 2013 2029 2050 2039 2066 1961 1996 1965 952 1013 573 497 474 421 609 329 935 665 709 591- - - - - 100% 100% 100% 100% 100% 100% 100% 100% 100% 100% 100% 100% 100% 100% 100% 100% 100% 100% 100% 100%
Sigma
__________________________________________________________________________________________________________________Proportions/Means: Columns Tested (5%, 10% risk level) - A/B/C/D/E/F/G/H/I/J/K/L/M - N/O - P/Q/R/S - T/U/V - W/X/YOverlap formulae used. ** very small base (under 30) ineligible for sig testing

Page 110Fielding Period: March 14 - May 31, 2020COVID-19Weighted To The U.S. General Adult Population - Propensity
2 Jun 2020Table 108FR05_5 How much would you say you miss each of the following during this time of virus-related shutdowns?
Attending events like concerts, theatre and sporting events
Base: All Respondents
Waves Gender Age Income Political
Wave 2 Wave 3 Wave 4 Wave 5 Wave 6 Wave 7 Wave 8 Wave 9 Wave 10 Wave 11 Wave 12 Wave 13 Wave 14 Less(3/14 - (3/17 - (3/21 - (3/28 - (4/3 - (4/11- (4/18- (4/25- (5/1 - (5/8 - (5/15 - (5/27 - (5/29 - than $50k -3/15) 3/18) 3/23) 3/30) 4/5) 4/13) 4/20) 4/27) 5/3) 5/10) 5/17) 5/28) 5/31) MALE FEMALE 18-34 35-49 50-64 65+ $50k $75k $75k+ GOP DEM IND/OTH
(A) (B) (C) (D) (E) (F) (G) (H) (I) (J) (K) (L) (M) (N) (O) (P) (Q) (R) (S) (T) (U) (V) (W) (X) (Y)
- - - - - 2013 2029 2050 2039 2030 1961 1996 1965 1066 899 504 475 502 484 749 397 729 698 683 584Unweighted Base-** -** -** -** -** 2013 2029 2050 2039 2066 1961 1996 1965 952 1013 573 497 474 421 609 329 935 665 709 591Weighted Base
- - - - - 916 984 1072 1069 1033 988 1091 971 512 459 334 275 208 154 229 133 578 341 353 277- - - - - 46% 49% 52% 52% 50% 50% 55% 49% 54% 45% 58% 55% 44% 37% 38% 41% 62% 51% 50% 47%
Fg FG F F FGJKM f O RS RS s TU
A Lot/Somewhat (Net)
- - - - - 430 426 503 473 438 422 467 457 239 218 158 147 86 66 95 65 286 173 159 126- - - - - 21% 21% 25% 23% 21% 22% 23% 23% 25% 22% 28% 30% 18% 16% 16% 20% 31% 26% 22% 21%
fGJk RS RS TU
A lot
- - - - - 486 558 569 595 596 566 624 514 273 240 176 128 121 88 134 68 293 168 194 151- - - - - 24% 27% 28% 29% 29% 29% 31% 26% 29% 24% 31% 26% 26% 21% 22% 21% 31% 25% 27% 26%
f F Fm F F FGhM o S TU
Somewhat
- - - - - 1097 1045 978 970 1033 973 905 994 439 555 239 222 266 267 380 196 357 324 356 315- - - - - 54% 51% 48% 48% 50% 50% 45% 51% 46% 55% 42% 45% 56% 63% 62% 59% 38% 49% 50% 53%
HIJKLm hIL L L L N PQ PQr V V
Not At All/Not Very (Net)
- - - - - 394 357 304 362 375 344 331 324 163 160 105 75 73 71 104 62 145 107 127 90- - - - - 20% 18% 15% 18% 18% 18% 17% 16% 17% 16% 18% 15% 15% 17% 17% 19% 16% 16% 18% 15%
HlM h H H h
Not very
- - - - - 703 688 674 608 658 629 574 670 276 395 134 148 193 195 276 134 211 217 229 225- - - - - 35% 34% 33% 30% 32% 32% 29% 34% 29% 39% 23% 30% 41% 46% 45% 41% 23% 33% 32% 38%
IL IL iL l l IL N p PQ PQ V V x
Not at all
- - - - - 2013 2029 2050 2039 2066 1961 1996 1965 952 1013 573 497 474 421 609 329 935 665 709 591- - - - - 100% 100% 100% 100% 100% 100% 100% 100% 100% 100% 100% 100% 100% 100% 100% 100% 100% 100% 100% 100%
Sigma
__________________________________________________________________________________________________________________Proportions/Means: Columns Tested (5%, 10% risk level) - A/B/C/D/E/F/G/H/I/J/K/L/M - N/O - P/Q/R/S - T/U/V - W/X/YOverlap formulae used. ** very small base (under 30) ineligible for sig testing

Page 111Fielding Period: March 14 - May 31, 2020COVID-19Weighted To The U.S. General Adult Population - Propensity
2 Jun 2020Table 109FR05_6 How much would you say you miss each of the following during this time of virus-related shutdowns?
Dining out at a restaurant/bar
Base: All Respondents
Waves Gender Age Income Political
Wave 2 Wave 3 Wave 4 Wave 5 Wave 6 Wave 7 Wave 8 Wave 9 Wave 10 Wave 11 Wave 12 Wave 13 Wave 14 Less(3/14 - (3/17 - (3/21 - (3/28 - (4/3 - (4/11- (4/18- (4/25- (5/1 - (5/8 - (5/15 - (5/27 - (5/29 - than $50k -3/15) 3/18) 3/23) 3/30) 4/5) 4/13) 4/20) 4/27) 5/3) 5/10) 5/17) 5/28) 5/31) MALE FEMALE 18-34 35-49 50-64 65+ $50k $75k $75k+ GOP DEM IND/OTH
(A) (B) (C) (D) (E) (F) (G) (H) (I) (J) (K) (L) (M) (N) (O) (P) (Q) (R) (S) (T) (U) (V) (W) (X) (Y)
- - - - - 2013 2029 2050 2039 2030 1961 1996 1965 1066 899 504 475 502 484 749 397 729 698 683 584Unweighted Base-** -** -** -** -** 2013 2029 2050 2039 2066 1961 1996 1965 952 1013 573 497 474 421 609 329 935 665 709 591Weighted Base
- - - - - 1405 1492 1523 1521 1493 1402 1509 1400 691 709 379 367 339 315 368 233 739 496 521 382- - - - - 70% 74% 74% 75% 72% 71% 76% 71% 73% 70% 66% 74% 72% 75% 60% 71% 79% 75% 73% 65%
F Fm Fkm FjKM P P T TU Y Y
A Lot/Somewhat (Net)
- - - - - 670 708 737 757 785 656 734 696 331 365 182 175 177 162 167 106 394 257 263 175- - - - - 33% 35% 36% 37% 38% 33% 37% 35% 35% 36% 32% 35% 37% 38% 27% 32% 42% 39% 37% 30%
Fk FgK fk p TU Y Y
A lot
- - - - - 735 783 786 764 707 746 775 704 360 344 197 192 162 153 201 127 345 239 258 207- - - - - 37% 39% 38% 37% 34% 38% 39% 36% 38% 34% 34% 39% 34% 36% 33% 39% 37% 36% 36% 35%
J J j j J
Somewhat
- - - - - 608 537 527 518 573 559 487 565 261 305 194 131 135 106 241 96 196 168 188 209- - - - - 30% 26% 26% 25% 28% 29% 24% 29% 27% 30% 34% 26% 28% 25% 40% 29% 21% 25% 27% 35%
GHIL l iL hiL QS UV V WX
Not At All/Not Very (Net)
- - - - - 287 251 225 261 273 278 260 252 121 131 93 60 45 54 80 47 109 81 86 85- - - - - 14% 12% 11% 13% 13% 14% 13% 13% 13% 13% 16% 12% 10% 13% 13% 14% 12% 12% 12% 14%
H h H R
Not very
- - - - - 321 286 301 256 300 281 226 313 140 174 101 70 90 52 161 49 87 88 102 124- - - - - 16% 14% 15% 13% 15% 14% 11% 16% 15% 17% 18% 14% 19% 12% 26% 15% 9% 13% 14% 21%
IL L L L L IL s S UV V WX
Not at all
- - - - - 2013 2029 2050 2039 2066 1961 1996 1965 952 1013 573 497 474 421 609 329 935 665 709 591- - - - - 100% 100% 100% 100% 100% 100% 100% 100% 100% 100% 100% 100% 100% 100% 100% 100% 100% 100% 100% 100%
Sigma
__________________________________________________________________________________________________________________Proportions/Means: Columns Tested (5%, 10% risk level) - A/B/C/D/E/F/G/H/I/J/K/L/M - N/O - P/Q/R/S - T/U/V - W/X/YOverlap formulae used. ** very small base (under 30) ineligible for sig testing
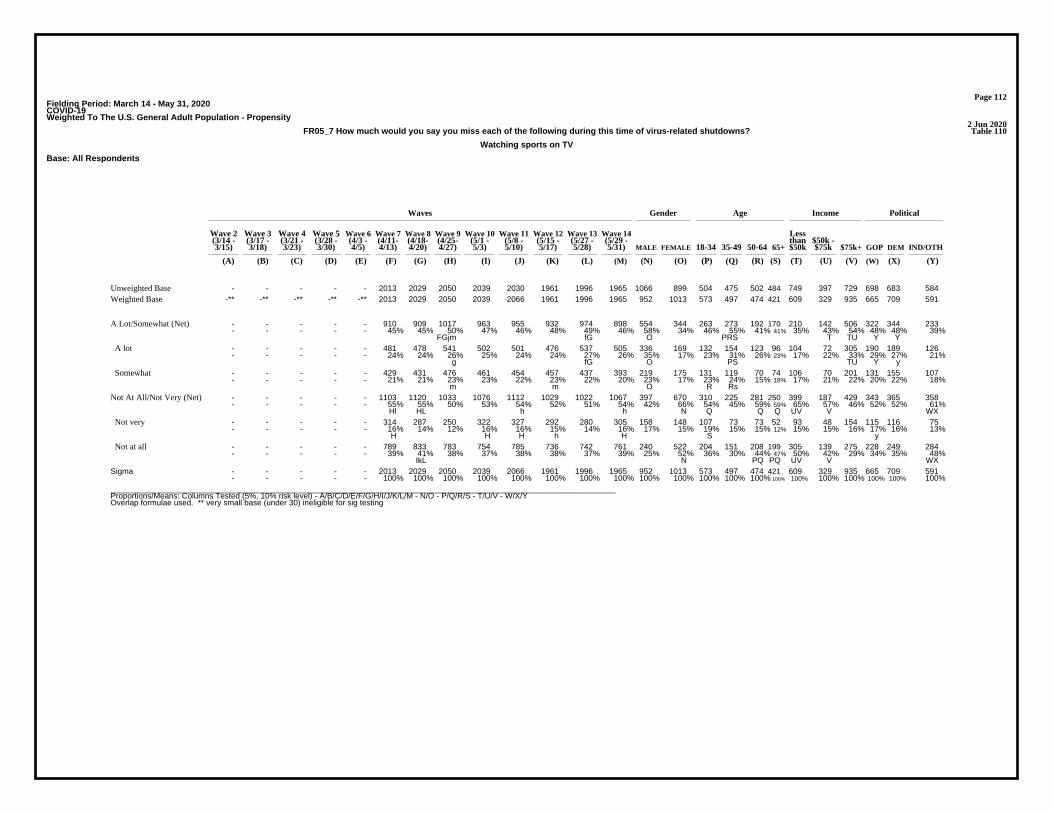
Page 112Fielding Period: March 14 - May 31, 2020COVID-19Weighted To The U.S. General Adult Population - Propensity
2 Jun 2020Table 110FR05_7 How much would you say you miss each of the following during this time of virus-related shutdowns?
Watching sports on TV
Base: All Respondents
Waves Gender Age Income Political
Wave 2 Wave 3 Wave 4 Wave 5 Wave 6 Wave 7 Wave 8 Wave 9 Wave 10 Wave 11 Wave 12 Wave 13 Wave 14 Less(3/14 - (3/17 - (3/21 - (3/28 - (4/3 - (4/11- (4/18- (4/25- (5/1 - (5/8 - (5/15 - (5/27 - (5/29 - than $50k -3/15) 3/18) 3/23) 3/30) 4/5) 4/13) 4/20) 4/27) 5/3) 5/10) 5/17) 5/28) 5/31) MALE FEMALE 18-34 35-49 50-64 65+ $50k $75k $75k+ GOP DEM IND/OTH
(A) (B) (C) (D) (E) (F) (G) (H) (I) (J) (K) (L) (M) (N) (O) (P) (Q) (R) (S) (T) (U) (V) (W) (X) (Y)
- - - - - 2013 2029 2050 2039 2030 1961 1996 1965 1066 899 504 475 502 484 749 397 729 698 683 584Unweighted Base-** -** -** -** -** 2013 2029 2050 2039 2066 1961 1996 1965 952 1013 573 497 474 421 609 329 935 665 709 591Weighted Base
- - - - - 910 909 1017 963 955 932 974 898 554 344 263 273 192 170 210 142 506 322 344 233- - - - - 45% 45% 50% 47% 46% 48% 49% 46% 58% 34% 46% 55% 41% 41% 35% 43% 54% 48% 48% 39%
FGjm fG O PRS T TU Y Y
A Lot/Somewhat (Net)
- - - - - 481 478 541 502 501 476 537 505 336 169 132 154 123 96 104 72 305 190 189 126- - - - - 24% 24% 26% 25% 24% 24% 27% 26% 35% 17% 23% 31% 26% 23% 17% 22% 33% 29% 27% 21%
g fG O PS TU Y y
A lot
- - - - - 429 431 476 461 454 457 437 393 219 175 131 119 70 74 106 70 201 131 155 107- - - - - 21% 21% 23% 23% 22% 23% 22% 20% 23% 17% 23% 24% 15% 18% 17% 21% 22% 20% 22% 18%
m m O R Rs
Somewhat
- - - - - 1103 1120 1033 1076 1112 1029 1022 1067 397 670 310 225 281 250 399 187 429 343 365 358- - - - - 55% 55% 50% 53% 54% 52% 51% 54% 42% 66% 54% 45% 59% 59% 65% 57% 46% 52% 52% 61%
Hl HL h h N Q Q Q UV V WX
Not At All/Not Very (Net)
- - - - - 314 287 250 322 327 292 280 305 158 148 107 73 73 52 93 48 154 115 116 75- - - - - 16% 14% 12% 16% 16% 15% 14% 16% 17% 15% 19% 15% 15% 12% 15% 15% 16% 17% 16% 13%
H H H h H S y
Not very
- - - - - 789 833 783 754 785 736 742 761 240 522 204 151 208 199 305 139 275 228 249 284- - - - - 39% 41% 38% 37% 38% 38% 37% 39% 25% 52% 36% 30% 44% 47% 50% 42% 29% 34% 35% 48%
IkL N PQ PQ UV V WX
Not at all
- - - - - 2013 2029 2050 2039 2066 1961 1996 1965 952 1013 573 497 474 421 609 329 935 665 709 591- - - - - 100% 100% 100% 100% 100% 100% 100% 100% 100% 100% 100% 100% 100% 100% 100% 100% 100% 100% 100% 100%
Sigma
__________________________________________________________________________________________________________________Proportions/Means: Columns Tested (5%, 10% risk level) - A/B/C/D/E/F/G/H/I/J/K/L/M - N/O - P/Q/R/S - T/U/V - W/X/YOverlap formulae used. ** very small base (under 30) ineligible for sig testing
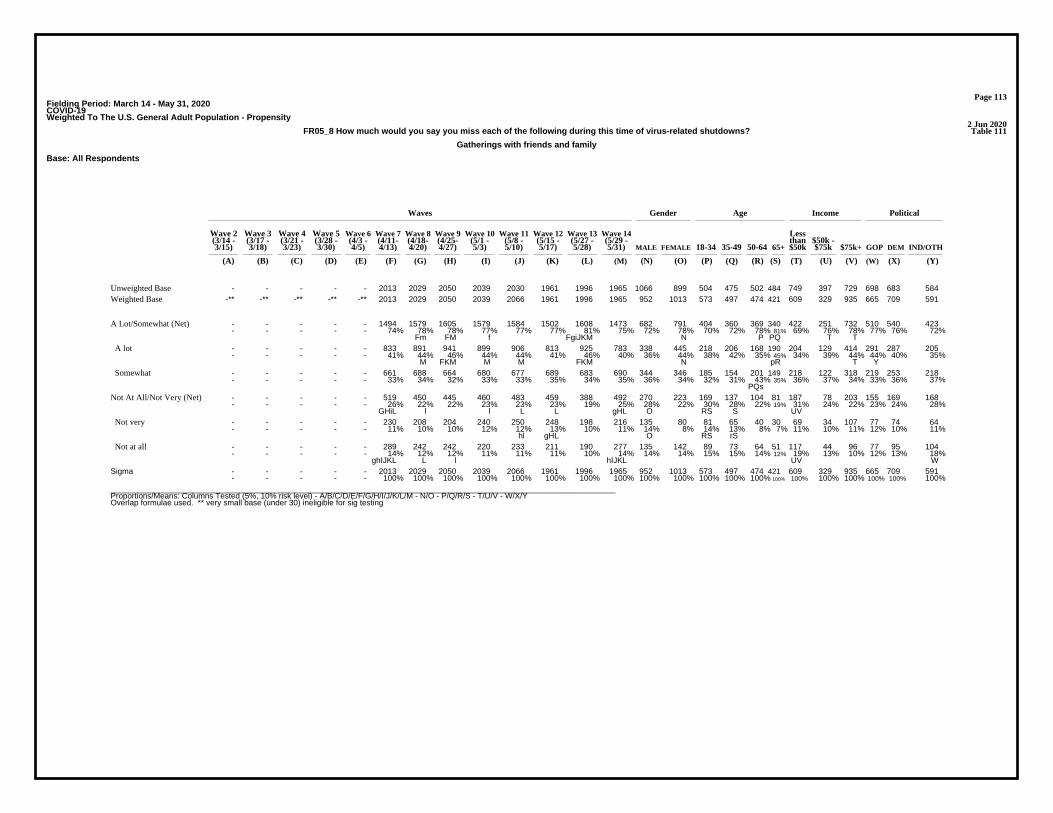
Page 113Fielding Period: March 14 - May 31, 2020COVID-19Weighted To The U.S. General Adult Population - Propensity
2 Jun 2020Table 111FR05_8 How much would you say you miss each of the following during this time of virus-related shutdowns?
Gatherings with friends and family
Base: All Respondents
Waves Gender Age Income Political
Wave 2 Wave 3 Wave 4 Wave 5 Wave 6 Wave 7 Wave 8 Wave 9 Wave 10 Wave 11 Wave 12 Wave 13 Wave 14 Less(3/14 - (3/17 - (3/21 - (3/28 - (4/3 - (4/11- (4/18- (4/25- (5/1 - (5/8 - (5/15 - (5/27 - (5/29 - than $50k -3/15) 3/18) 3/23) 3/30) 4/5) 4/13) 4/20) 4/27) 5/3) 5/10) 5/17) 5/28) 5/31) MALE FEMALE 18-34 35-49 50-64 65+ $50k $75k $75k+ GOP DEM IND/OTH
(A) (B) (C) (D) (E) (F) (G) (H) (I) (J) (K) (L) (M) (N) (O) (P) (Q) (R) (S) (T) (U) (V) (W) (X) (Y)
- - - - - 2013 2029 2050 2039 2030 1961 1996 1965 1066 899 504 475 502 484 749 397 729 698 683 584Unweighted Base-** -** -** -** -** 2013 2029 2050 2039 2066 1961 1996 1965 952 1013 573 497 474 421 609 329 935 665 709 591Weighted Base
- - - - - 1494 1579 1605 1579 1584 1502 1608 1473 682 791 404 360 369 340 422 251 732 510 540 423- - - - - 74% 78% 78% 77% 77% 77% 81% 75% 72% 78% 70% 72% 78% 81% 69% 76% 78% 77% 76% 72%
Fm FM f FgiJKM N P PQ T T
A Lot/Somewhat (Net)
- - - - - 833 891 941 899 906 813 925 783 338 445 218 206 168 190 204 129 414 291 287 205- - - - - 41% 44% 46% 44% 44% 41% 46% 40% 36% 44% 38% 42% 35% 45% 34% 39% 44% 44% 40% 35%
M FKM M M FKM N pR T Y
A lot
- - - - - 661 688 664 680 677 689 683 690 344 346 185 154 201 149 218 122 318 219 253 218- - - - - 33% 34% 32% 33% 33% 35% 34% 35% 36% 34% 32% 31% 43% 35% 36% 37% 34% 33% 36% 37%
PQs
Somewhat
- - - - - 519 450 445 460 483 459 388 492 270 223 169 137 104 81 187 78 203 155 169 168- - - - - 26% 22% 22% 23% 23% 23% 19% 25% 28% 22% 30% 28% 22% 19% 31% 24% 22% 23% 24% 28%
GHiL l l L L gHL O RS S UV
Not At All/Not Very (Net)
- - - - - 230 208 204 240 250 248 198 216 135 80 81 65 40 30 69 34 107 77 74 64- - - - - 11% 10% 10% 12% 12% 13% 10% 11% 14% 8% 14% 13% 8% 7% 11% 10% 11% 12% 10% 11%
hl gHL O RS rS
Not very
- - - - - 289 242 242 220 233 211 190 277 135 142 89 73 64 51 117 44 96 77 95 104- - - - - 14% 12% 12% 11% 11% 11% 10% 14% 14% 14% 15% 15% 14% 12% 19% 13% 10% 12% 13% 18%
ghIJKL L l hIJKL UV W
Not at all
- - - - - 2013 2029 2050 2039 2066 1961 1996 1965 952 1013 573 497 474 421 609 329 935 665 709 591- - - - - 100% 100% 100% 100% 100% 100% 100% 100% 100% 100% 100% 100% 100% 100% 100% 100% 100% 100% 100% 100%
Sigma
__________________________________________________________________________________________________________________Proportions/Means: Columns Tested (5%, 10% risk level) - A/B/C/D/E/F/G/H/I/J/K/L/M - N/O - P/Q/R/S - T/U/V - W/X/YOverlap formulae used. ** very small base (under 30) ineligible for sig testing
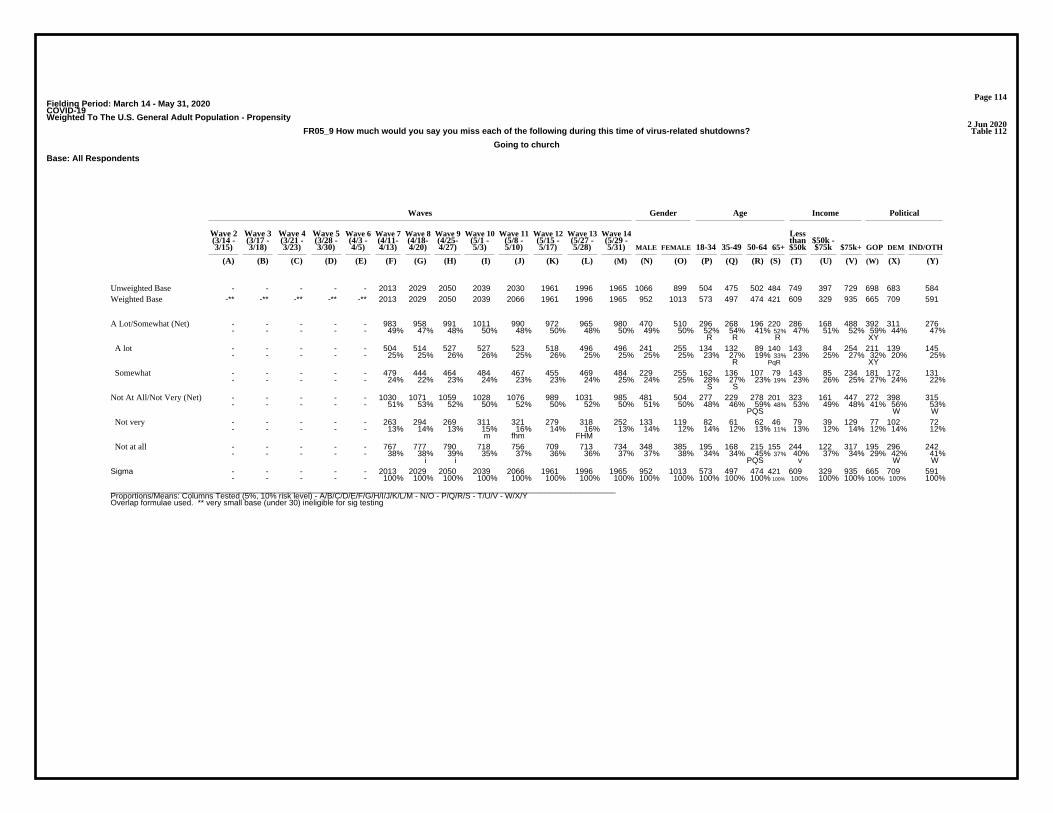
Page 114Fielding Period: March 14 - May 31, 2020COVID-19Weighted To The U.S. General Adult Population - Propensity
2 Jun 2020Table 112FR05_9 How much would you say you miss each of the following during this time of virus-related shutdowns?
Going to church
Base: All Respondents
Waves Gender Age Income Political
Wave 2 Wave 3 Wave 4 Wave 5 Wave 6 Wave 7 Wave 8 Wave 9 Wave 10 Wave 11 Wave 12 Wave 13 Wave 14 Less(3/14 - (3/17 - (3/21 - (3/28 - (4/3 - (4/11- (4/18- (4/25- (5/1 - (5/8 - (5/15 - (5/27 - (5/29 - than $50k -3/15) 3/18) 3/23) 3/30) 4/5) 4/13) 4/20) 4/27) 5/3) 5/10) 5/17) 5/28) 5/31) MALE FEMALE 18-34 35-49 50-64 65+ $50k $75k $75k+ GOP DEM IND/OTH
(A) (B) (C) (D) (E) (F) (G) (H) (I) (J) (K) (L) (M) (N) (O) (P) (Q) (R) (S) (T) (U) (V) (W) (X) (Y)
- - - - - 2013 2029 2050 2039 2030 1961 1996 1965 1066 899 504 475 502 484 749 397 729 698 683 584Unweighted Base-** -** -** -** -** 2013 2029 2050 2039 2066 1961 1996 1965 952 1013 573 497 474 421 609 329 935 665 709 591Weighted Base
- - - - - 983 958 991 1011 990 972 965 980 470 510 296 268 196 220 286 168 488 392 311 276- - - - - 49% 47% 48% 50% 48% 50% 48% 50% 49% 50% 52% 54% 41% 52% 47% 51% 52% 59% 44% 47%
R R R XY
A Lot/Somewhat (Net)
- - - - - 504 514 527 527 523 518 496 496 241 255 134 132 89 140 143 84 254 211 139 145- - - - - 25% 25% 26% 26% 25% 26% 25% 25% 25% 25% 23% 27% 19% 33% 23% 25% 27% 32% 20% 25%
R PqR XY
A lot
- - - - - 479 444 464 484 467 455 469 484 229 255 162 136 107 79 143 85 234 181 172 131- - - - - 24% 22% 23% 24% 23% 23% 24% 25% 24% 25% 28% 27% 23% 19% 23% 26% 25% 27% 24% 22%
S S
Somewhat
- - - - - 1030 1071 1059 1028 1076 989 1031 985 481 504 277 229 278 201 323 161 447 272 398 315- - - - - 51% 53% 52% 50% 52% 50% 52% 50% 51% 50% 48% 46% 59% 48% 53% 49% 48% 41% 56% 53%
PQS W W
Not At All/Not Very (Net)
- - - - - 263 294 269 311 321 279 318 252 133 119 82 61 62 46 79 39 129 77 102 72- - - - - 13% 14% 13% 15% 16% 14% 16% 13% 14% 12% 14% 12% 13% 11% 13% 12% 14% 12% 14% 12%
m fhm FHM
Not very
- - - - - 767 777 790 718 756 709 713 734 348 385 195 168 215 155 244 122 317 195 296 242- - - - - 38% 38% 39% 35% 37% 36% 36% 37% 37% 38% 34% 34% 45% 37% 40% 37% 34% 29% 42% 41%
i i PQS v W W
Not at all
- - - - - 2013 2029 2050 2039 2066 1961 1996 1965 952 1013 573 497 474 421 609 329 935 665 709 591- - - - - 100% 100% 100% 100% 100% 100% 100% 100% 100% 100% 100% 100% 100% 100% 100% 100% 100% 100% 100% 100%
Sigma
__________________________________________________________________________________________________________________Proportions/Means: Columns Tested (5%, 10% risk level) - A/B/C/D/E/F/G/H/I/J/K/L/M - N/O - P/Q/R/S - T/U/V - W/X/YOverlap formulae used. ** very small base (under 30) ineligible for sig testing

Page 115Fielding Period: March 14 - May 31, 2020COVID-19Weighted To The U.S. General Adult Population - Propensity
2 Jun 2020Table 113FR05_10 How much would you say you miss each of the following during this time of virus-related shutdowns?
Going to school or university
Base: All Respondents
Waves Gender Age Income Political
Wave 2 Wave 3 Wave 4 Wave 5 Wave 6 Wave 7 Wave 8 Wave 9 Wave 10 Wave 11 Wave 12 Wave 13 Wave 14 Less(3/14 - (3/17 - (3/21 - (3/28 - (4/3 - (4/11- (4/18- (4/25- (5/1 - (5/8 - (5/15 - (5/27 - (5/29 - than $50k -3/15) 3/18) 3/23) 3/30) 4/5) 4/13) 4/20) 4/27) 5/3) 5/10) 5/17) 5/28) 5/31) MALE FEMALE 18-34 35-49 50-64 65+ $50k $75k $75k+ GOP DEM IND/OTH
(A) (B) (C) (D) (E) (F) (G) (H) (I) (J) (K) (L) (M) (N) (O) (P) (Q) (R) (S) (T) (U) (V) (W) (X) (Y)
- - - - - 2013 2029 2050 2039 2030 1961 1996 1965 1066 899 504 475 502 484 749 397 729 698 683 584Unweighted Base-** -** -** -** -** 2013 2029 2050 2039 2066 1961 1996 1965 952 1013 573 497 474 421 609 329 935 665 709 591Weighted Base
- - - - - 488 538 583 598 611 533 575 581 319 262 281 196 69 34 127 100 333 201 232 148- - - - - 24% 27% 28% 29% 30% 27% 29% 30% 34% 26% 49% 39% 15% 8% 21% 31% 36% 30% 33% 25%
F F Fg F Fg O QRS RS S T T Y
A Lot/Somewhat (Net)
- - - - - 233 219 275 267 274 220 263 255 149 106 128 95 24 8 55 32 158 98 109 47- - - - - 12% 11% 13% 13% 13% 11% 13% 13% 16% 10% 22% 19% 5% 2% 9% 10% 17% 15% 15% 8%
Gk g g g g O RS RS S TU Y Y
A lot
- - - - - 255 319 308 331 336 313 312 326 170 155 153 102 45 26 72 69 175 103 123 100- - - - - 13% 16% 15% 16% 16% 16% 16% 17% 18% 15% 27% 20% 10% 6% 12% 21% 19% 15% 17% 17%
F f F F F F F qRS RS T T
Somewhat
- - - - - 1525 1491 1467 1441 1456 1428 1421 1384 633 752 292 301 404 387 482 229 602 464 477 444- - - - - 76% 73% 72% 71% 70% 73% 71% 70% 66% 74% 51% 61% 85% 92% 79% 69% 64% 70% 67% 75%
HIJLM jm N P PQ PQR UV X
Not At All/Not Very (Net)
- - - - - 225 277 263 287 278 311 254 261 158 102 102 71 56 32 86 33 138 80 98 83- - - - - 11% 14% 13% 14% 13% 16% 13% 13% 17% 10% 18% 14% 12% 8% 14% 10% 15% 12% 14% 14%
f F f FHjLm O RS S s u
Not very
- - - - - 1300 1214 1205 1154 1178 1117 1167 1124 474 649 190 231 348 356 396 196 464 384 378 361- - - - - 65% 60% 59% 57% 57% 57% 58% 57% 50% 64% 33% 46% 73% 84% 65% 59% 50% 58% 53% 61%
GHIJKLM i N P PQ PQR V V X
Not at all
- - - - - 2013 2029 2050 2039 2066 1961 1996 1965 952 1013 573 497 474 421 609 329 935 665 709 591- - - - - 100% 100% 100% 100% 100% 100% 100% 100% 100% 100% 100% 100% 100% 100% 100% 100% 100% 100% 100% 100%
Sigma
__________________________________________________________________________________________________________________Proportions/Means: Columns Tested (5%, 10% risk level) - A/B/C/D/E/F/G/H/I/J/K/L/M - N/O - P/Q/R/S - T/U/V - W/X/YOverlap formulae used. ** very small base (under 30) ineligible for sig testing

Page 116Fielding Period: March 14 - May 31, 2020COVID-19Weighted To The U.S. General Adult Population - Propensity
2 Jun 2020Table 114FR05_13 How much would you say you miss each of the following during this time of virus-related shutdowns?
Going to the gym/work out class
Base: All Respondents
Waves Gender Age Income Political
Wave 2 Wave 3 Wave 4 Wave 5 Wave 6 Wave 7 Wave 8 Wave 9 Wave 10 Wave 11 Wave 12 Wave 13 Wave 14 Less(3/14 - (3/17 - (3/21 - (3/28 - (4/3 - (4/11- (4/18- (4/25- (5/1 - (5/8 - (5/15 - (5/27 - (5/29 - than $50k -3/15) 3/18) 3/23) 3/30) 4/5) 4/13) 4/20) 4/27) 5/3) 5/10) 5/17) 5/28) 5/31) MALE FEMALE 18-34 35-49 50-64 65+ $50k $75k $75k+ GOP DEM IND/OTH
(A) (B) (C) (D) (E) (F) (G) (H) (I) (J) (K) (L) (M) (N) (O) (P) (Q) (R) (S) (T) (U) (V) (W) (X) (Y)
- - - - - 2013 2029 2050 2039 2030 1961 1996 1965 1066 899 504 475 502 484 749 397 729 698 683 584Unweighted Base-** -** -** -** -** 2013 2029 2050 2039 2066 1961 1996 1965 952 1013 573 497 474 421 609 329 935 665 709 591Weighted Base
- - - - - 742 802 838 809 829 777 817 767 436 332 284 263 124 96 164 113 468 259 311 197- - - - - 37% 40% 41% 40% 40% 40% 41% 39% 46% 33% 50% 53% 26% 23% 27% 34% 50% 39% 44% 33%
F f F O RS RS T TU Y
A Lot/Somewhat (Net)
- - - - - 347 352 430 408 415 374 380 380 219 161 151 112 67 50 78 51 241 137 140 102- - - - - 17% 17% 21% 20% 20% 19% 19% 19% 23% 16% 26% 23% 14% 12% 13% 16% 26% 21% 20% 17%
FG fg fg O RS RS TU
A lot
- - - - - 395 450 409 400 414 403 437 388 217 171 134 151 57 46 87 61 228 123 171 94- - - - - 20% 22% 20% 20% 20% 21% 22% 20% 23% 17% 23% 30% 12% 11% 14% 19% 24% 18% 24% 16%
O RS pRS Tu WY
Somewhat
- - - - - 1271 1227 1212 1230 1237 1184 1179 1198 516 682 289 234 350 325 445 216 467 405 398 395- - - - - 63% 60% 59% 60% 60% 60% 59% 61% 54% 67% 50% 47% 74% 77% 73% 66% 50% 61% 56% 67%
HjL N PQ PQ UV V X
Not At All/Not Very (Net)
- - - - - 294 305 299 359 313 323 344 302 146 155 117 61 73 51 97 42 154 108 99 95- - - - - 15% 15% 15% 18% 15% 16% 17% 15% 15% 15% 20% 12% 15% 12% 16% 13% 16% 16% 14% 16%
FgHj fh QS
Not very
- - - - - 977 923 913 872 924 861 836 896 369 526 172 173 277 274 347 174 313 298 299 299- - - - - 49% 45% 45% 43% 45% 44% 42% 46% 39% 52% 30% 35% 59% 65% 57% 53% 33% 45% 42% 51%
HIjKL l l N PQ PQ V V X
Not at all
- - - - - 2013 2029 2050 2039 2066 1961 1996 1965 952 1013 573 497 474 421 609 329 935 665 709 591- - - - - 100% 100% 100% 100% 100% 100% 100% 100% 100% 100% 100% 100% 100% 100% 100% 100% 100% 100% 100% 100%
Sigma
__________________________________________________________________________________________________________________Proportions/Means: Columns Tested (5%, 10% risk level) - A/B/C/D/E/F/G/H/I/J/K/L/M - N/O - P/Q/R/S - T/U/V - W/X/YOverlap formulae used. ** very small base (under 30) ineligible for sig testing

Page 117Fielding Period: March 14 - May 31, 2020COVID-19Weighted To The U.S. General Adult Population - Propensity
2 Jun 2020Table 115FR05_14 How much would you say you miss each of the following during this time of virus-related shutdowns?
Going to a social gathering,
Base: All Respondents
Waves Gender Age Income Political
Wave 2 Wave 3 Wave 4 Wave 5 Wave 6 Wave 7 Wave 8 Wave 9 Wave 10 Wave 11 Wave 12 Wave 13 Wave 14 Less(3/14 - (3/17 - (3/21 - (3/28 - (4/3 - (4/11- (4/18- (4/25- (5/1 - (5/8 - (5/15 - (5/27 - (5/29 - than $50k -3/15) 3/18) 3/23) 3/30) 4/5) 4/13) 4/20) 4/27) 5/3) 5/10) 5/17) 5/28) 5/31) MALE FEMALE 18-34 35-49 50-64 65+ $50k $75k $75k+ GOP DEM IND/OTH
(A) (B) (C) (D) (E) (F) (G) (H) (I) (J) (K) (L) (M) (N) (O) (P) (Q) (R) (S) (T) (U) (V) (W) (X) (Y)
- - - - - 2013 2029 2050 2039 2030 1961 1996 1965 1066 899 504 475 502 484 749 397 729 698 683 584Unweighted Base-** -** -** -** -** 2013 2029 2050 2039 2066 1961 1996 1965 952 1013 573 497 474 421 609 329 935 665 709 591Weighted Base
- - - - - 1191 1188 1281 1297 1310 1242 1320 1172 562 610 368 310 261 234 311 183 631 405 430 338- - - - - 59% 59% 62% 64% 63% 63% 66% 60% 59% 60% 64% 62% 55% 56% 51% 56% 67% 61% 61% 57%
fG FGM FGm FGm FGhM RS rs TU
A Lot/Somewhat (Net)
- - - - - 509 524 544 583 586 505 551 495 237 258 183 143 87 82 103 81 298 181 186 128- - - - - 25% 26% 27% 29% 28% 26% 28% 25% 25% 25% 32% 29% 18% 19% 17% 25% 32% 27% 26% 22%
fm fm RS RS T TU y
A lot
- - - - - 682 664 737 713 724 737 769 677 326 352 185 167 173 152 208 102 333 224 244 210- - - - - 34% 33% 36% 35% 35% 38% 39% 34% 34% 35% 32% 34% 37% 36% 34% 31% 36% 34% 34% 35%
g fG FGijM
Somewhat
- - - - - 822 841 769 742 756 719 676 793 389 404 205 187 213 187 298 146 304 260 280 253- - - - - 41% 41% 38% 36% 37% 37% 34% 40% 41% 40% 36% 38% 45% 44% 49% 44% 33% 39% 39% 43%
hIJKL HIJKL l IjkL Pq Pq V V
Not At All/Not Very (Net)
- - - - - 356 359 330 343 309 336 318 290 163 127 90 59 69 72 98 65 117 93 106 91- - - - - 18% 18% 16% 17% 15% 17% 16% 15% 17% 12% 16% 12% 15% 17% 16% 20% 13% 14% 15% 15%
jm jM O q V
Not very
- - - - - 466 483 439 399 447 383 358 503 226 277 115 129 144 116 199 81 187 167 173 163- - - - - 23% 24% 21% 20% 22% 20% 18% 26% 24% 27% 20% 26% 30% 27% 33% 25% 20% 25% 24% 28%
IKL IKL L L HIJKL p P P UV
Not at all
- - - - - 2013 2029 2050 2039 2066 1961 1996 1965 952 1013 573 497 474 421 609 329 935 665 709 591- - - - - 100% 100% 100% 100% 100% 100% 100% 100% 100% 100% 100% 100% 100% 100% 100% 100% 100% 100% 100% 100%
Sigma
__________________________________________________________________________________________________________________Proportions/Means: Columns Tested (5%, 10% risk level) - A/B/C/D/E/F/G/H/I/J/K/L/M - N/O - P/Q/R/S - T/U/V - W/X/YOverlap formulae used. ** very small base (under 30) ineligible for sig testing

Page 118Fielding Period: March 14 - May 31, 2020COVID-19Weighted To The U.S. General Adult Population - Propensity
2 Jun 2020Table 116FR05_15 How much would you say you miss each of the following during this time of virus-related shutdowns?
Going to my local coffee shop
Base: All Respondents
Waves Gender Age Income Political
Wave 2 Wave 3 Wave 4 Wave 5 Wave 6 Wave 7 Wave 8 Wave 9 Wave 10 Wave 11 Wave 12 Wave 13 Wave 14 Less(3/14 - (3/17 - (3/21 - (3/28 - (4/3 - (4/11- (4/18- (4/25- (5/1 - (5/8 - (5/15 - (5/27 - (5/29 - than $50k -3/15) 3/18) 3/23) 3/30) 4/5) 4/13) 4/20) 4/27) 5/3) 5/10) 5/17) 5/28) 5/31) MALE FEMALE 18-34 35-49 50-64 65+ $50k $75k $75k+ GOP DEM IND/OTH
(A) (B) (C) (D) (E) (F) (G) (H) (I) (J) (K) (L) (M) (N) (O) (P) (Q) (R) (S) (T) (U) (V) (W) (X) (Y)
- - - - - 2013 2029 2050 2039 2030 1961 1996 1965 1066 899 504 475 502 484 749 397 729 698 683 584Unweighted Base-** -** -** -** -** 2013 2029 2050 2039 2066 1961 1996 1965 952 1013 573 497 474 421 609 329 935 665 709 591Weighted Base
- - - - - 858 940 894 955 988 933 969 892 457 435 311 279 179 123 209 141 510 279 355 258- - - - - 43% 46% 44% 47% 48% 48% 49% 45% 48% 43% 54% 56% 38% 29% 34% 43% 55% 42% 50% 44%
f Fh FH FH FH o RS RS S T TU Wy
A Lot/Somewhat (Net)
- - - - - 360 381 376 379 417 357 386 376 182 194 131 136 63 46 92 52 221 116 163 97- - - - - 18% 19% 18% 19% 20% 18% 19% 19% 19% 19% 23% 27% 13% 11% 15% 16% 24% 17% 23% 16%
RS RS TU WY
A lot
- - - - - 498 558 518 576 571 576 583 516 275 241 180 143 116 77 117 89 289 163 192 161- - - - - 25% 28% 25% 28% 28% 29% 29% 26% 29% 24% 31% 29% 24% 18% 19% 27% 31% 25% 27% 27%
Fh f FHm FH O rS S s T T
Somewhat
- - - - - 1155 1089 1156 1084 1078 1028 1027 1073 494 579 262 219 295 298 400 188 425 386 354 333- - - - - 57% 54% 56% 53% 52% 52% 51% 55% 52% 57% 46% 44% 62% 71% 66% 57% 45% 58% 50% 56%
gIJKL iJKL n PQ PQR UV V X x
Not At All/Not Very (Net)
- - - - - 342 350 366 380 351 360 338 366 182 184 131 81 84 70 109 61 182 133 132 101- - - - - 17% 17% 18% 19% 17% 18% 17% 19% 19% 18% 23% 16% 18% 17% 18% 19% 19% 20% 19% 17%
qs
Not very
- - - - - 813 740 790 704 727 668 688 707 312 395 131 137 211 227 291 127 242 252 222 233- - - - - 40% 36% 39% 35% 35% 34% 34% 36% 33% 39% 23% 28% 45% 54% 48% 39% 26% 38% 31% 39%
GIJKLM IjKL N PQ PQR UV V X X
Not at all
- - - - - 2013 2029 2050 2039 2066 1961 1996 1965 952 1013 573 497 474 421 609 329 935 665 709 591- - - - - 100% 100% 100% 100% 100% 100% 100% 100% 100% 100% 100% 100% 100% 100% 100% 100% 100% 100% 100% 100%
Sigma
__________________________________________________________________________________________________________________Proportions/Means: Columns Tested (5%, 10% risk level) - A/B/C/D/E/F/G/H/I/J/K/L/M - N/O - P/Q/R/S - T/U/V - W/X/YOverlap formulae used. ** very small base (under 30) ineligible for sig testing

Page 119Fielding Period: March 14 - May 31, 2020COVID-19Weighted To The U.S. General Adult Population - Propensity
2 Jun 2020Table 117Q22 How concerned are you about each of the following potential shortages from coronavirus (COVID-19) in the healthcare
system?
Summary Of Concerned
Base: All Respondents
Waves Gender Age Income Political
Wave 2 Wave 3 Wave 4 Wave 5 Wave 6 Wave 7 Wave 8 Wave 9 Wave 10 Wave 11 Wave 12 Wave 13 Wave 14 Less(3/14 - (3/17 - (3/21 - (3/28 - (4/3 - (4/11- (4/18- (4/25- (5/1 - (5/8 - (5/15 - (5/27 - (5/29 - than $50k -3/15) 3/18) 3/23) 3/30) 4/5) 4/13) 4/20) 4/27) 5/3) 5/10) 5/17) 5/28) 5/31) MALE FEMALE 18-34 35-49 50-64 65+ $50k $75k $75k+ GOP DEM IND/OTH
(A) (B) (C) (D) (E) (F) (G) (H) (I) (J) (K) (L) (M) (N) (O) (P) (Q) (R) (S) (T) (U) (V) (W) (X) (Y)
2050 2019 2023 - - 2013 2029 2050 2039 2030 1961 1996 1965 1066 899 504 475 502 484 749 397 729 698 683 584Unweighted Base2050 2019 2023 -** -** 2013 2029 2050 2039 2066 1961 1996 1965 952 1013 573 497 474 421 609 329 935 665 709 591Weighted Base
1608 1618 1780 - - 1763 1727 1727 1691 1631 1548 1598 1541 725 815 437 401 383 320 457 265 743 478 623 44078% 80% 88% - - 88% 85% 84% 83% 79% 79% 80% 78% 76% 80% 76% 81% 81% 76% 75% 80% 79% 72% 88% 74%
ABGHIJKLM ABgHIJKLM ABJKLM ABJKLM AbJKlM n WY
Healthcare workers(doctors, nurses,supporting staff)
1538 1479 1660 - - 1688 1651 1644 1627 1530 1494 1478 1419 668 751 408 379 330 303 423 245 684 415 592 41175% 73% 82% - - 84% 81% 80% 80% 74% 76% 74% 72% 70% 74% 71% 76% 70% 72% 69% 75% 73% 63% 84% 70%
ABJKLM ABgHIJKLM ABJKLM ABJKLM ABJKLM M r WY W
Testing kits for COVID-19
1395 1424 1672 - - 1692 1671 1683 1638 1540 1508 1475 1411 664 748 421 366 339 284 439 234 670 409 588 41568% 71% 83% - - 84% 82% 82% 80% 75% 77% 74% 72% 70% 74% 74% 74% 72% 68% 72% 71% 72% 62% 83% 70%
ABJKLM ABIJKLM ABJKLM ABJKLM ABJKLM AB ABlM Ab A WY W
Surgical masks and gloves
1525 1547 1738 - - 1688 1631 1606 1561 1516 1420 1443 1398 639 759 422 380 334 263 420 237 675 414 589 39474% 77% 86% - - 84% 80% 78% 77% 73% 72% 72% 71% 67% 75% 74% 76% 70% 62% 69% 72% 72% 62% 83% 67%m jKLM ABGHIJKLM ABGHIJKLM ABIJKLM AJKLM jKLM N S rS S WY
Hospital ventilators (forassisted breathing)
1540 1554 1740 - - 1644 1593 1563 1517 1472 1408 1412 1396 646 751 417 374 340 266 436 235 659 410 591 39575% 77% 86% - - 82% 79% 76% 74% 71% 72% 71% 71% 68% 74% 73% 75% 72% 63% 72% 71% 70% 62% 83% 67%
JkLM JKLM ABFGHIJKLM ABGHIJKLM AIJKLM JKLM jLm N S S S WY
Hospital beds (room forpatients)
__________________________________________________________________________________________________________________Proportions/Means: Columns Tested (5%, 10% risk level) - A/B/C/D/E/F/G/H/I/J/K/L/M - N/O - P/Q/R/S - T/U/V - W/X/YOverlap formulae used. ** very small base (under 30) ineligible for sig testing
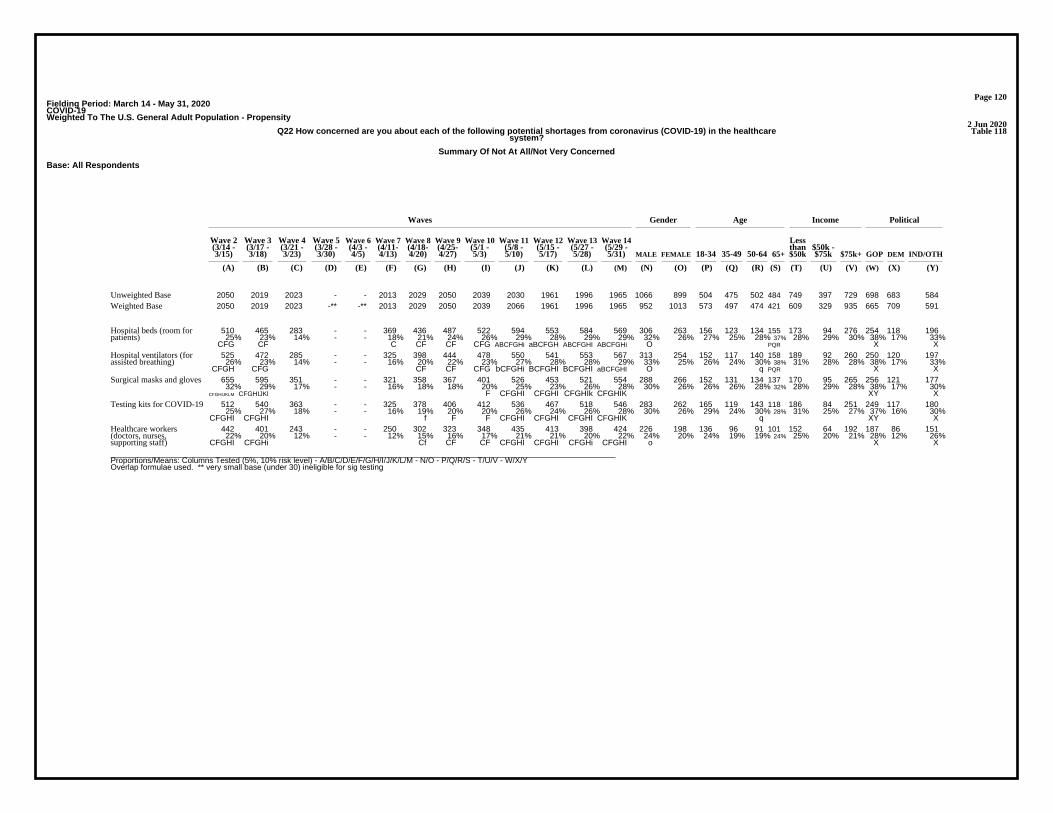
Page 120Fielding Period: March 14 - May 31, 2020COVID-19Weighted To The U.S. General Adult Population - Propensity
2 Jun 2020Table 118Q22 How concerned are you about each of the following potential shortages from coronavirus (COVID-19) in the healthcare
system?
Summary Of Not At All/Not Very Concerned
Base: All Respondents
Waves Gender Age Income Political
Wave 2 Wave 3 Wave 4 Wave 5 Wave 6 Wave 7 Wave 8 Wave 9 Wave 10 Wave 11 Wave 12 Wave 13 Wave 14 Less(3/14 - (3/17 - (3/21 - (3/28 - (4/3 - (4/11- (4/18- (4/25- (5/1 - (5/8 - (5/15 - (5/27 - (5/29 - than $50k -3/15) 3/18) 3/23) 3/30) 4/5) 4/13) 4/20) 4/27) 5/3) 5/10) 5/17) 5/28) 5/31) MALE FEMALE 18-34 35-49 50-64 65+ $50k $75k $75k+ GOP DEM IND/OTH
(A) (B) (C) (D) (E) (F) (G) (H) (I) (J) (K) (L) (M) (N) (O) (P) (Q) (R) (S) (T) (U) (V) (W) (X) (Y)
2050 2019 2023 - - 2013 2029 2050 2039 2030 1961 1996 1965 1066 899 504 475 502 484 749 397 729 698 683 584Unweighted Base2050 2019 2023 -** -** 2013 2029 2050 2039 2066 1961 1996 1965 952 1013 573 497 474 421 609 329 935 665 709 591Weighted Base
510 465 283 - - 369 436 487 522 594 553 584 569 306 263 156 123 134 155 173 94 276 254 118 19625% 23% 14% - - 18% 21% 24% 26% 29% 28% 29% 29% 32% 26% 27% 25% 28% 37% 28% 29% 30% 38% 17% 33%
CFG CF C CF CF CFG ABCFGHi aBCFGH ABCFGHI ABCFGHi O PQR X X
Hospital beds (room forpatients)
525 472 285 - - 325 398 444 478 550 541 553 567 313 254 152 117 140 158 189 92 260 250 120 19726% 23% 14% - - 16% 20% 22% 23% 27% 28% 28% 29% 33% 25% 26% 24% 30% 38% 31% 28% 28% 38% 17% 33%
CFGH CFG CF CF CFG bCFGHi BCFGHI BCFGHI aBCFGHI O q PQR X X
Hospital ventilators (forassisted breathing)
655 595 351 - - 321 358 367 401 526 453 521 554 288 266 152 131 134 137 170 95 265 256 121 17732% 29% 17% - - 16% 18% 18% 20% 25% 23% 26% 28% 30% 26% 26% 26% 28% 32% 28% 29% 28% 38% 17% 30%
CFGHIJKLM CFGHIJKl F CFGHI CFGHI CFGHIk CFGHIK XY X
Surgical masks and gloves
512 540 363 - - 325 378 406 412 536 467 518 546 283 262 165 119 143 118 186 84 251 249 117 18025% 27% 18% - - 16% 19% 20% 20% 26% 24% 26% 28% 30% 26% 29% 24% 30% 28% 31% 25% 27% 37% 16% 30%
CFGHI CFGHI f F F CFGHI CFGHI CFGHI CFGHIK q XY X
Testing kits for COVID-19
442 401 243 - - 250 302 323 348 435 413 398 424 226 198 136 96 91 101 152 64 192 187 86 15122% 20% 12% - - 12% 15% 16% 17% 21% 21% 20% 22% 24% 20% 24% 19% 19% 24% 25% 20% 21% 28% 12% 26%
CFGHI CFGHi Cf CF CF CFGHI CFGHI CFGHi CFGHI o X X
Healthcare workers(doctors, nurses,supporting staff)__________________________________________________________________________________________________________________Proportions/Means: Columns Tested (5%, 10% risk level) - A/B/C/D/E/F/G/H/I/J/K/L/M - N/O - P/Q/R/S - T/U/V - W/X/YOverlap formulae used. ** very small base (under 30) ineligible for sig testing

Page 121Fielding Period: March 14 - May 31, 2020COVID-19Weighted To The U.S. General Adult Population - Propensity
2 Jun 2020Table 119Q22_1 How concerned are you about each of the following potential shortages from coronavirus (COVID-19) in the healthcare
system?
Surgical masks and gloves
Base: All Respondents
Waves Gender Age Income Political
Wave 2 Wave 3 Wave 4 Wave 5 Wave 6 Wave 7 Wave 8 Wave 9 Wave 10 Wave 11 Wave 12 Wave 13 Wave 14 Less(3/14 - (3/17 - (3/21 - (3/28 - (4/3 - (4/11- (4/18- (4/25- (5/1 - (5/8 - (5/15 - (5/27 - (5/29 - than $50k -3/15) 3/18) 3/23) 3/30) 4/5) 4/13) 4/20) 4/27) 5/3) 5/10) 5/17) 5/28) 5/31) MALE FEMALE 18-34 35-49 50-64 65+ $50k $75k $75k+ GOP DEM IND/OTH
(A) (B) (C) (D) (E) (F) (G) (H) (I) (J) (K) (L) (M) (N) (O) (P) (Q) (R) (S) (T) (U) (V) (W) (X) (Y)
2050 2019 2023 - - 2013 2029 2050 2039 2030 1961 1996 1965 1066 899 504 475 502 484 749 397 729 698 683 584Unweighted Base2050 2019 2023 -** -** 2013 2029 2050 2039 2066 1961 1996 1965 952 1013 573 497 474 421 609 329 935 665 709 591Weighted Base
1395 1424 1672 - - 1692 1671 1683 1638 1540 1508 1475 1411 664 748 421 366 339 284 439 234 670 409 588 41568% 71% 83% - - 84% 82% 82% 80% 75% 77% 74% 72% 70% 74% 74% 74% 72% 68% 72% 71% 72% 62% 83% 70%
ABJKLM ABIJKLM ABJKLM ABJKLM ABJKLM AB ABlM Ab A WY W
Very/SomewhatConcerned (Net)
644 743 1089 - - 1068 1036 1001 1026 880 856 815 773 331 442 210 228 207 128 240 113 379 211 351 21131% 37% 54% - - 53% 51% 49% 50% 43% 44% 41% 39% 35% 44% 37% 46% 44% 30% 39% 34% 41% 32% 50% 36%
A ABHiJKLM ABHJKLM ABJKLM ABJKLM ABJKLM ABm ABM AB A N PS pS u WY
Very concerned
751 682 583 - - 624 635 681 612 660 652 660 638 333 305 211 138 132 156 199 121 291 198 236 20437% 34% 29% - - 31% 31% 33% 30% 32% 33% 33% 32% 35% 30% 37% 28% 28% 37% 33% 37% 31% 30% 33% 34%
CFGhIJklM CI Ci c Ci Ci c o QR QR
Somewhat concerned
655 595 351 - - 321 358 367 401 526 453 521 554 288 266 152 131 134 137 170 95 265 256 121 17732% 29% 17% - - 16% 18% 18% 20% 25% 23% 26% 28% 30% 26% 26% 26% 28% 32% 28% 29% 28% 38% 17% 30%
CFGHIJKLM CFGHIJKl F CFGHI CFGHI CFGHIk CFGHIK XY X
Not At All/Not VeryConcerned (Net)
393 351 231 - - 215 235 213 258 316 275 327 342 182 160 92 79 96 75 101 56 170 147 89 10619% 17% 11% - - 11% 12% 10% 13% 15% 14% 16% 17% 19% 16% 16% 16% 20% 18% 17% 17% 18% 22% 13% 18%
CFGHIJKl CFGHIK h CFGHi cFgH CFGHI CFGHIK X X
Not very concerned
262 243 120 - - 106 123 155 143 210 178 194 212 106 106 60 52 38 62 69 39 94 109 32 7013% 12% 6% - - 5% 6% 8% 7% 10% 9% 10% 11% 11% 10% 10% 10% 8% 15% 11% 12% 10% 16% 5% 12%
CFGHIJKL CFGHIKl cF f CFGHI CFGi CFGHI CFGHI R Xy X
Not at all concerned
2050 2019 2023 - - 2013 2029 2050 2039 2066 1961 1996 1965 952 1013 573 497 474 421 609 329 935 665 709 591100% 100% 100% - - 100% 100% 100% 100% 100% 100% 100% 100% 100% 100% 100% 100% 100% 100% 100% 100% 100% 100% 100% 100%
Sigma
__________________________________________________________________________________________________________________Proportions/Means: Columns Tested (5%, 10% risk level) - A/B/C/D/E/F/G/H/I/J/K/L/M - N/O - P/Q/R/S - T/U/V - W/X/YOverlap formulae used. ** very small base (under 30) ineligible for sig testing
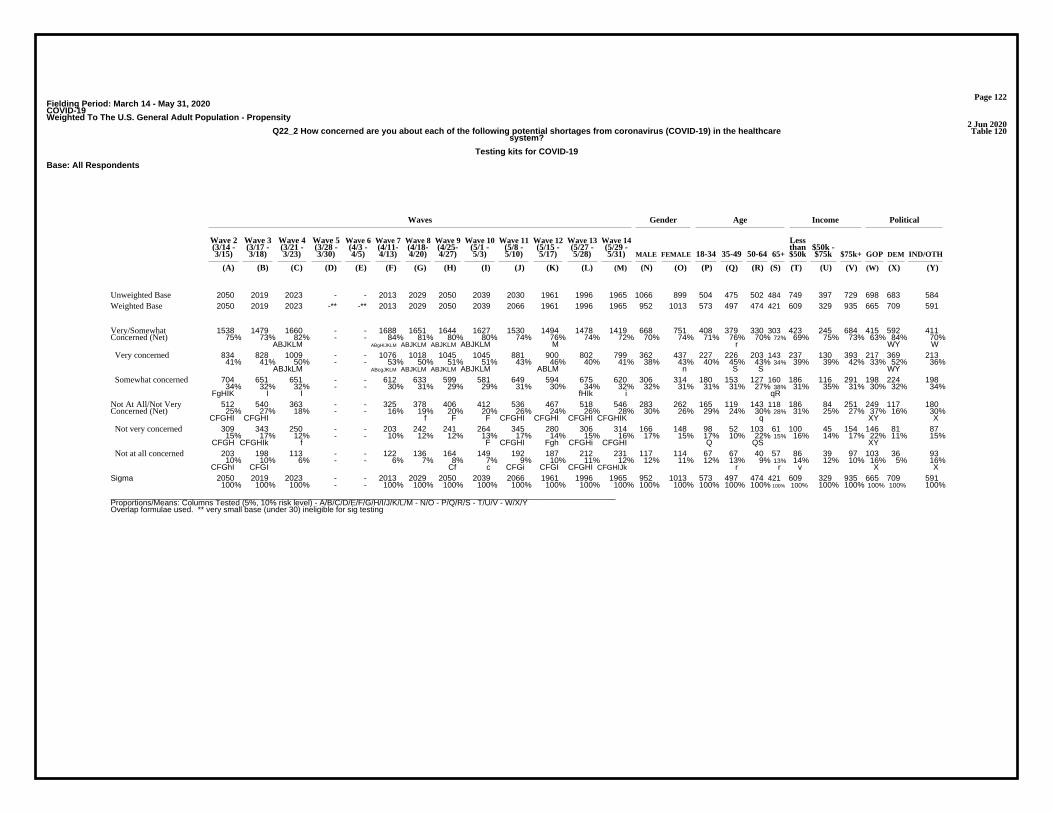
Page 122Fielding Period: March 14 - May 31, 2020COVID-19Weighted To The U.S. General Adult Population - Propensity
2 Jun 2020Table 120Q22_2 How concerned are you about each of the following potential shortages from coronavirus (COVID-19) in the healthcare
system?
Testing kits for COVID-19
Base: All Respondents
Waves Gender Age Income Political
Wave 2 Wave 3 Wave 4 Wave 5 Wave 6 Wave 7 Wave 8 Wave 9 Wave 10 Wave 11 Wave 12 Wave 13 Wave 14 Less(3/14 - (3/17 - (3/21 - (3/28 - (4/3 - (4/11- (4/18- (4/25- (5/1 - (5/8 - (5/15 - (5/27 - (5/29 - than $50k -3/15) 3/18) 3/23) 3/30) 4/5) 4/13) 4/20) 4/27) 5/3) 5/10) 5/17) 5/28) 5/31) MALE FEMALE 18-34 35-49 50-64 65+ $50k $75k $75k+ GOP DEM IND/OTH
(A) (B) (C) (D) (E) (F) (G) (H) (I) (J) (K) (L) (M) (N) (O) (P) (Q) (R) (S) (T) (U) (V) (W) (X) (Y)
2050 2019 2023 - - 2013 2029 2050 2039 2030 1961 1996 1965 1066 899 504 475 502 484 749 397 729 698 683 584Unweighted Base2050 2019 2023 -** -** 2013 2029 2050 2039 2066 1961 1996 1965 952 1013 573 497 474 421 609 329 935 665 709 591Weighted Base
1538 1479 1660 - - 1688 1651 1644 1627 1530 1494 1478 1419 668 751 408 379 330 303 423 245 684 415 592 41175% 73% 82% - - 84% 81% 80% 80% 74% 76% 74% 72% 70% 74% 71% 76% 70% 72% 69% 75% 73% 63% 84% 70%
ABJKLM ABgHIJKLM ABJKLM ABJKLM ABJKLM M r WY W
Very/SomewhatConcerned (Net)
834 828 1009 - - 1076 1018 1045 1045 881 900 802 799 362 437 227 226 203 143 237 130 393 217 369 21341% 41% 50% - - 53% 50% 51% 51% 43% 46% 40% 41% 38% 43% 40% 45% 43% 34% 39% 39% 42% 33% 52% 36%
ABJkLM ABcgJKLM ABJKLM ABJKLM ABJKLM ABLM n S S WY
Very concerned
704 651 651 - - 612 633 599 581 649 594 675 620 306 314 180 153 127 160 186 116 291 198 224 19834% 32% 32% - - 30% 31% 29% 29% 31% 30% 34% 32% 32% 31% 31% 31% 27% 38% 31% 35% 31% 30% 32% 34%
FgHIK I I fHIk i qR
Somewhat concerned
512 540 363 - - 325 378 406 412 536 467 518 546 283 262 165 119 143 118 186 84 251 249 117 18025% 27% 18% - - 16% 19% 20% 20% 26% 24% 26% 28% 30% 26% 29% 24% 30% 28% 31% 25% 27% 37% 16% 30%
CFGHI CFGHI f F F CFGHI CFGHI CFGHI CFGHIK q XY X
Not At All/Not VeryConcerned (Net)
309 343 250 - - 203 242 241 264 345 280 306 314 166 148 98 52 103 61 100 45 154 146 81 8715% 17% 12% - - 10% 12% 12% 13% 17% 14% 15% 16% 17% 15% 17% 10% 22% 15% 16% 14% 17% 22% 11% 15%
CFGH CFGHIk f F CFGHI Fgh CFGHi CFGHI Q QS XY
Not very concerned
203 198 113 - - 122 136 164 149 192 187 212 231 117 114 67 67 40 57 86 39 97 103 36 9310% 10% 6% - - 6% 7% 8% 7% 9% 10% 11% 12% 12% 11% 12% 13% 9% 13% 14% 12% 10% 16% 5% 16%
CFGhI CFGI Cf c CFGi CFGI CFGHI CFGHIJk r r v X X
Not at all concerned
2050 2019 2023 - - 2013 2029 2050 2039 2066 1961 1996 1965 952 1013 573 497 474 421 609 329 935 665 709 591100% 100% 100% - - 100% 100% 100% 100% 100% 100% 100% 100% 100% 100% 100% 100% 100% 100% 100% 100% 100% 100% 100% 100%
Sigma
__________________________________________________________________________________________________________________Proportions/Means: Columns Tested (5%, 10% risk level) - A/B/C/D/E/F/G/H/I/J/K/L/M - N/O - P/Q/R/S - T/U/V - W/X/YOverlap formulae used. ** very small base (under 30) ineligible for sig testing
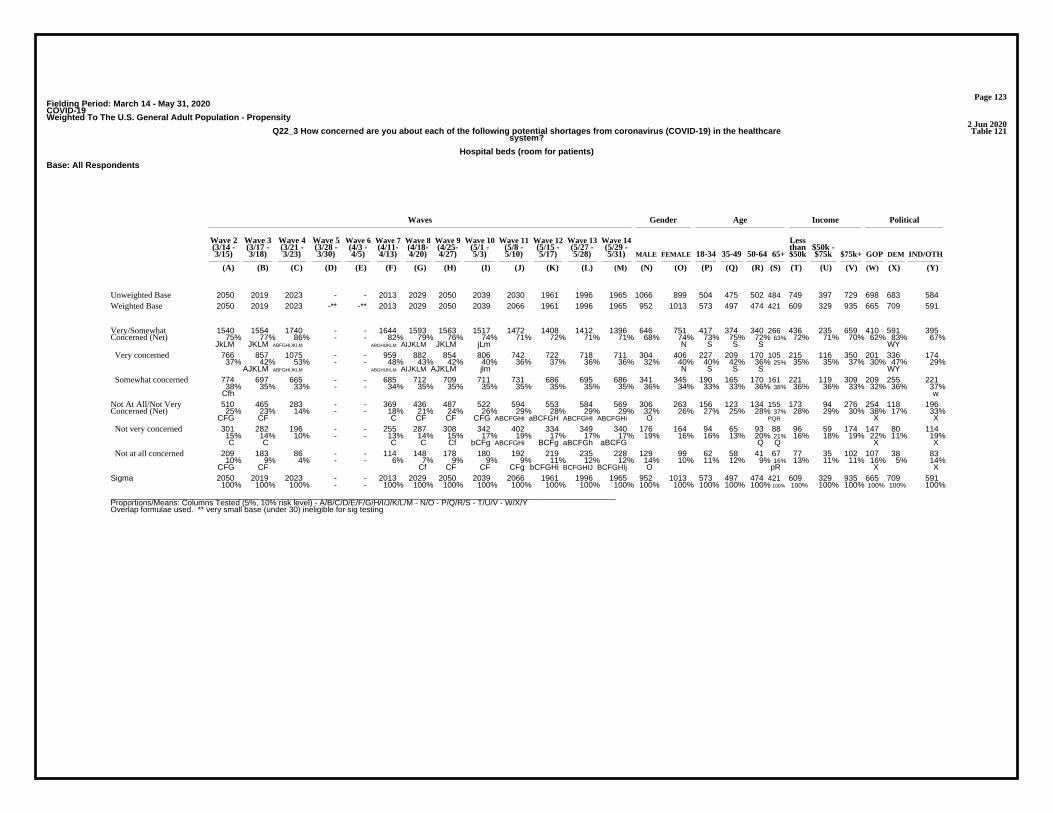
Page 123Fielding Period: March 14 - May 31, 2020COVID-19Weighted To The U.S. General Adult Population - Propensity
2 Jun 2020Table 121Q22_3 How concerned are you about each of the following potential shortages from coronavirus (COVID-19) in the healthcare
system?
Hospital beds (room for patients)
Base: All Respondents
Waves Gender Age Income Political
Wave 2 Wave 3 Wave 4 Wave 5 Wave 6 Wave 7 Wave 8 Wave 9 Wave 10 Wave 11 Wave 12 Wave 13 Wave 14 Less(3/14 - (3/17 - (3/21 - (3/28 - (4/3 - (4/11- (4/18- (4/25- (5/1 - (5/8 - (5/15 - (5/27 - (5/29 - than $50k -3/15) 3/18) 3/23) 3/30) 4/5) 4/13) 4/20) 4/27) 5/3) 5/10) 5/17) 5/28) 5/31) MALE FEMALE 18-34 35-49 50-64 65+ $50k $75k $75k+ GOP DEM IND/OTH
(A) (B) (C) (D) (E) (F) (G) (H) (I) (J) (K) (L) (M) (N) (O) (P) (Q) (R) (S) (T) (U) (V) (W) (X) (Y)
2050 2019 2023 - - 2013 2029 2050 2039 2030 1961 1996 1965 1066 899 504 475 502 484 749 397 729 698 683 584Unweighted Base2050 2019 2023 -** -** 2013 2029 2050 2039 2066 1961 1996 1965 952 1013 573 497 474 421 609 329 935 665 709 591Weighted Base
1540 1554 1740 - - 1644 1593 1563 1517 1472 1408 1412 1396 646 751 417 374 340 266 436 235 659 410 591 39575% 77% 86% - - 82% 79% 76% 74% 71% 72% 71% 71% 68% 74% 73% 75% 72% 63% 72% 71% 70% 62% 83% 67%
JkLM JKLM ABFGHIJKLM ABGHIJKLM AIJKLM JKLM jLm N S S S WY
Very/SomewhatConcerned (Net)
766 857 1075 - - 959 882 854 806 742 722 718 711 304 406 227 209 170 105 215 116 350 201 336 17437% 42% 53% - - 48% 43% 42% 40% 36% 37% 36% 36% 32% 40% 40% 42% 36% 25% 35% 35% 37% 30% 47% 29%
AJKLM ABFGHIJKLM ABGHIJKLM AIJKLM AJKLM jlm N S S S WY
Very concerned
774 697 665 - - 685 712 709 711 731 686 695 686 341 345 190 165 170 161 221 119 309 209 255 22138% 35% 33% - - 34% 35% 35% 35% 35% 35% 35% 35% 36% 34% 33% 33% 36% 38% 36% 36% 33% 32% 36% 37%
Cfh w
Somewhat concerned
510 465 283 - - 369 436 487 522 594 553 584 569 306 263 156 123 134 155 173 94 276 254 118 19625% 23% 14% - - 18% 21% 24% 26% 29% 28% 29% 29% 32% 26% 27% 25% 28% 37% 28% 29% 30% 38% 17% 33%
CFG CF C CF CF CFG ABCFGHi aBCFGH ABCFGHI ABCFGHi O PQR X X
Not At All/Not VeryConcerned (Net)
301 282 196 - - 255 287 308 342 402 334 349 340 176 164 94 65 93 88 96 59 174 147 80 11415% 14% 10% - - 13% 14% 15% 17% 19% 17% 17% 17% 19% 16% 16% 13% 20% 21% 16% 18% 19% 22% 11% 19%C C C C Cf bCFg ABCFGHi BCFg aBCFGh aBCFG Q Q X X
Not very concerned
209 183 86 - - 114 148 178 180 192 219 235 228 129 99 62 58 41 67 77 35 102 107 38 8310% 9% 4% - - 6% 7% 9% 9% 9% 11% 12% 12% 14% 10% 11% 12% 9% 16% 13% 11% 11% 16% 5% 14%
CFG CF Cf CF CF CFg bCFGHi BCFGHIJ BCFGHIj O pR X X
Not at all concerned
2050 2019 2023 - - 2013 2029 2050 2039 2066 1961 1996 1965 952 1013 573 497 474 421 609 329 935 665 709 591100% 100% 100% - - 100% 100% 100% 100% 100% 100% 100% 100% 100% 100% 100% 100% 100% 100% 100% 100% 100% 100% 100% 100%
Sigma
__________________________________________________________________________________________________________________Proportions/Means: Columns Tested (5%, 10% risk level) - A/B/C/D/E/F/G/H/I/J/K/L/M - N/O - P/Q/R/S - T/U/V - W/X/YOverlap formulae used. ** very small base (under 30) ineligible for sig testing

Page 124Fielding Period: March 14 - May 31, 2020COVID-19Weighted To The U.S. General Adult Population - Propensity
2 Jun 2020Table 122Q22_4 How concerned are you about each of the following potential shortages from coronavirus (COVID-19) in the healthcare
system?
Hospital ventilators (for assisted breathing)
Base: All Respondents
Waves Gender Age Income Political
Wave 2 Wave 3 Wave 4 Wave 5 Wave 6 Wave 7 Wave 8 Wave 9 Wave 10 Wave 11 Wave 12 Wave 13 Wave 14 Less(3/14 - (3/17 - (3/21 - (3/28 - (4/3 - (4/11- (4/18- (4/25- (5/1 - (5/8 - (5/15 - (5/27 - (5/29 - than $50k -3/15) 3/18) 3/23) 3/30) 4/5) 4/13) 4/20) 4/27) 5/3) 5/10) 5/17) 5/28) 5/31) MALE FEMALE 18-34 35-49 50-64 65+ $50k $75k $75k+ GOP DEM IND/OTH
(A) (B) (C) (D) (E) (F) (G) (H) (I) (J) (K) (L) (M) (N) (O) (P) (Q) (R) (S) (T) (U) (V) (W) (X) (Y)
2050 2019 2023 - - 2013 2029 2050 2039 2030 1961 1996 1965 1066 899 504 475 502 484 749 397 729 698 683 584Unweighted Base2050 2019 2023 -** -** 2013 2029 2050 2039 2066 1961 1996 1965 952 1013 573 497 474 421 609 329 935 665 709 591Weighted Base
1525 1547 1738 - - 1688 1631 1606 1561 1516 1420 1443 1398 639 759 422 380 334 263 420 237 675 414 589 39474% 77% 86% - - 84% 80% 78% 77% 73% 72% 72% 71% 67% 75% 74% 76% 70% 62% 69% 72% 72% 62% 83% 67%m jKLM ABGHIJKLM ABGHIJKLM ABIJKLM AJKLM jKLM N S rS S WY
Very/SomewhatConcerned (Net)
738 842 1151 - - 1047 961 925 922 847 783 777 745 325 420 227 222 182 114 218 133 366 209 345 19136% 42% 57% - - 52% 47% 45% 45% 41% 40% 39% 38% 34% 41% 40% 45% 38% 27% 36% 41% 39% 32% 49% 32%
Am ABFGHIJKLM ABGHIJKLM ABJKLM AbJKLM AbJKLM A a N S S S WY
Very concerned
787 705 586 - - 641 670 682 639 670 637 666 653 314 339 194 158 152 149 202 103 309 205 244 20438% 35% 29% - - 32% 33% 33% 31% 32% 32% 33% 33% 33% 33% 34% 32% 32% 35% 33% 31% 33% 31% 34% 34%
bCFGHIJKLM Ci C C c c C C
Somewhat concerned
525 472 285 - - 325 398 444 478 550 541 553 567 313 254 152 117 140 158 189 92 260 250 120 19726% 23% 14% - - 16% 20% 22% 23% 27% 28% 28% 29% 33% 25% 26% 24% 30% 38% 31% 28% 28% 38% 17% 33%
CFGH CFG CF CF CFG bCFGHi BCFGHI BCFGHI aBCFGHI O q PQR X X
Not At All/Not VeryConcerned (Net)
322 280 189 - - 220 242 259 310 336 316 347 327 184 143 89 58 93 88 107 45 156 130 84 11316% 14% 9% - - 11% 12% 13% 15% 16% 16% 17% 17% 19% 14% 16% 12% 20% 21% 18% 14% 17% 20% 12% 19%
CFGH CF C C CFGh bCFGH CFGH BCFGH bCFGH O Q pQ X X
Not very concerned
203 192 96 - - 106 156 185 169 214 225 205 239 128 111 63 60 47 71 81 47 104 120 36 8310% 9% 5% - - 5% 8% 9% 8% 10% 11% 10% 12% 13% 11% 11% 12% 10% 17% 13% 14% 11% 18% 5% 14%
CFG CF CF CF CF CFGi CFGHI CFGi aBCFGHI PqR X X
Not at all concerned
2050 2019 2023 - - 2013 2029 2050 2039 2066 1961 1996 1965 952 1013 573 497 474 421 609 329 935 665 709 591100% 100% 100% - - 100% 100% 100% 100% 100% 100% 100% 100% 100% 100% 100% 100% 100% 100% 100% 100% 100% 100% 100% 100%
Sigma
__________________________________________________________________________________________________________________Proportions/Means: Columns Tested (5%, 10% risk level) - A/B/C/D/E/F/G/H/I/J/K/L/M - N/O - P/Q/R/S - T/U/V - W/X/YOverlap formulae used. ** very small base (under 30) ineligible for sig testing
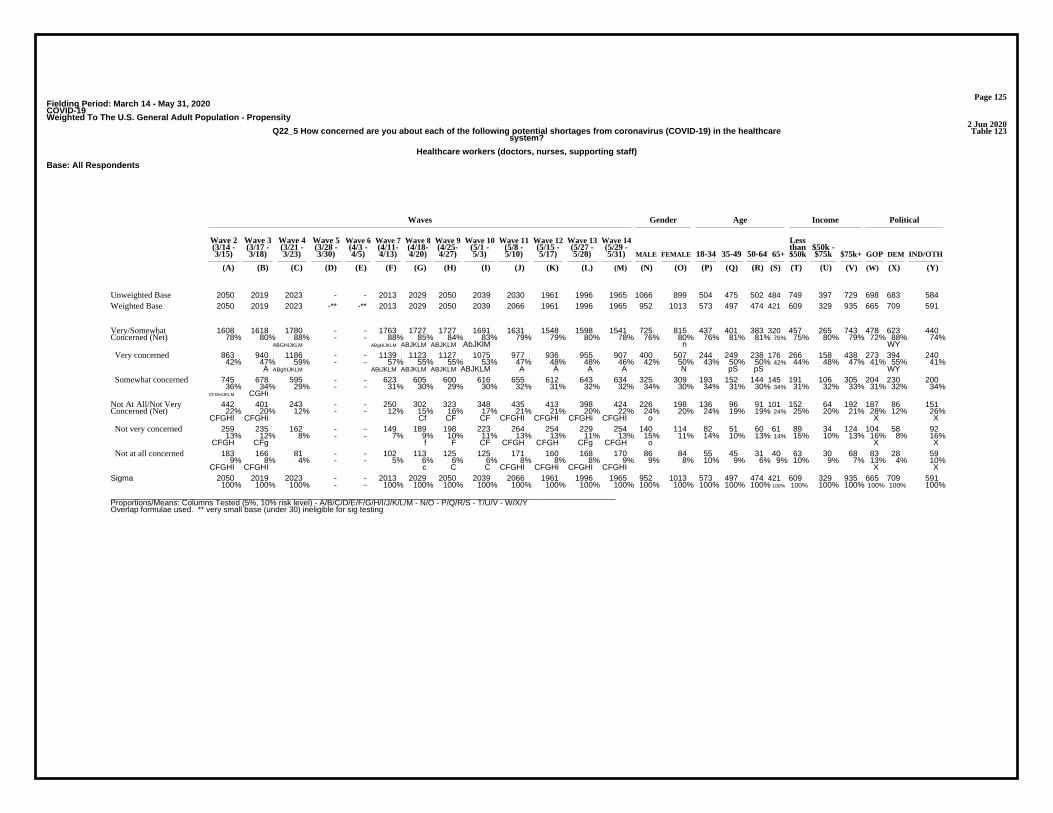
Page 125Fielding Period: March 14 - May 31, 2020COVID-19Weighted To The U.S. General Adult Population - Propensity
2 Jun 2020Table 123Q22_5 How concerned are you about each of the following potential shortages from coronavirus (COVID-19) in the healthcare
system?
Healthcare workers (doctors, nurses, supporting staff)
Base: All Respondents
Waves Gender Age Income Political
Wave 2 Wave 3 Wave 4 Wave 5 Wave 6 Wave 7 Wave 8 Wave 9 Wave 10 Wave 11 Wave 12 Wave 13 Wave 14 Less(3/14 - (3/17 - (3/21 - (3/28 - (4/3 - (4/11- (4/18- (4/25- (5/1 - (5/8 - (5/15 - (5/27 - (5/29 - than $50k -3/15) 3/18) 3/23) 3/30) 4/5) 4/13) 4/20) 4/27) 5/3) 5/10) 5/17) 5/28) 5/31) MALE FEMALE 18-34 35-49 50-64 65+ $50k $75k $75k+ GOP DEM IND/OTH
(A) (B) (C) (D) (E) (F) (G) (H) (I) (J) (K) (L) (M) (N) (O) (P) (Q) (R) (S) (T) (U) (V) (W) (X) (Y)
2050 2019 2023 - - 2013 2029 2050 2039 2030 1961 1996 1965 1066 899 504 475 502 484 749 397 729 698 683 584Unweighted Base2050 2019 2023 -** -** 2013 2029 2050 2039 2066 1961 1996 1965 952 1013 573 497 474 421 609 329 935 665 709 591Weighted Base
1608 1618 1780 - - 1763 1727 1727 1691 1631 1548 1598 1541 725 815 437 401 383 320 457 265 743 478 623 44078% 80% 88% - - 88% 85% 84% 83% 79% 79% 80% 78% 76% 80% 76% 81% 81% 76% 75% 80% 79% 72% 88% 74%
ABGHIJKLM ABgHIJKLM ABJKLM ABJKLM AbJKlM n WY
Very/SomewhatConcerned (Net)
863 940 1186 - - 1139 1123 1127 1075 977 936 955 907 400 507 244 249 238 176 266 158 438 273 394 24042% 47% 59% - - 57% 55% 55% 53% 47% 48% 48% 46% 42% 50% 43% 50% 50% 42% 44% 48% 47% 41% 55% 41%
A ABghIJKLM ABiJKLM ABJKLM ABJKLM ABJKLM A A A A N pS pS WY
Very concerned
745 678 595 - - 623 605 600 616 655 612 643 634 325 309 193 152 144 145 191 106 305 204 230 20036% 34% 29% - - 31% 30% 29% 30% 32% 31% 32% 32% 34% 30% 34% 31% 30% 34% 31% 32% 33% 31% 32% 34%
CFGHIJKLM CGHi
Somewhat concerned
442 401 243 - - 250 302 323 348 435 413 398 424 226 198 136 96 91 101 152 64 192 187 86 15122% 20% 12% - - 12% 15% 16% 17% 21% 21% 20% 22% 24% 20% 24% 19% 19% 24% 25% 20% 21% 28% 12% 26%
CFGHI CFGHi Cf CF CF CFGHI CFGHI CFGHi CFGHI o X X
Not At All/Not VeryConcerned (Net)
259 235 162 - - 149 189 198 223 264 254 229 254 140 114 82 51 60 61 89 34 124 104 58 9213% 12% 8% - - 7% 9% 10% 11% 13% 13% 11% 13% 15% 11% 14% 10% 13% 14% 15% 10% 13% 16% 8% 16%
CFGH CFg f F CF CFGH CFGH CFg CFGH o X X
Not very concerned
183 166 81 - - 102 113 125 125 171 160 168 170 86 84 55 45 31 40 63 30 68 83 28 599% 8% 4% - - 5% 6% 6% 6% 8% 8% 8% 9% 9% 8% 10% 9% 6% 9% 10% 9% 7% 13% 4% 10%
CFGHI CFGHI c C C CFGHI CFGHi CFGHI CFGHI X X
Not at all concerned
2050 2019 2023 - - 2013 2029 2050 2039 2066 1961 1996 1965 952 1013 573 497 474 421 609 329 935 665 709 591100% 100% 100% - - 100% 100% 100% 100% 100% 100% 100% 100% 100% 100% 100% 100% 100% 100% 100% 100% 100% 100% 100% 100%
Sigma
__________________________________________________________________________________________________________________Proportions/Means: Columns Tested (5%, 10% risk level) - A/B/C/D/E/F/G/H/I/J/K/L/M - N/O - P/Q/R/S - T/U/V - W/X/YOverlap formulae used. ** very small base (under 30) ineligible for sig testing
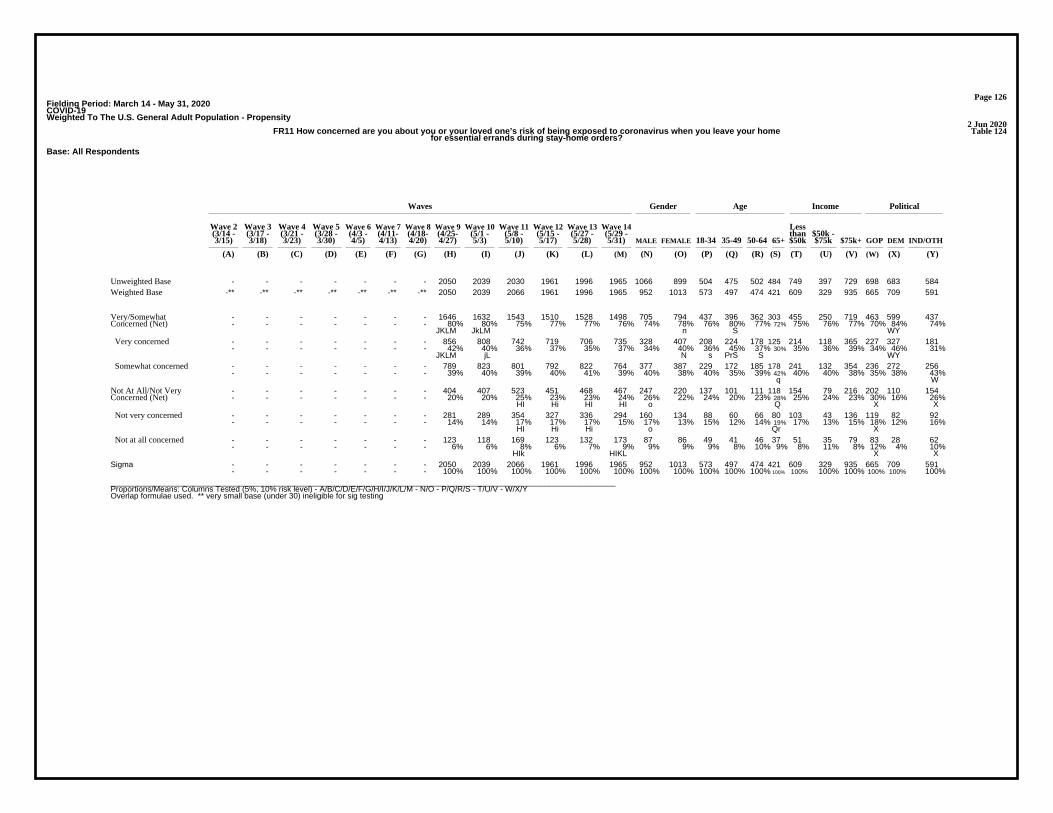
Page 126Fielding Period: March 14 - May 31, 2020COVID-19Weighted To The U.S. General Adult Population - Propensity
2 Jun 2020Table 124FR11 How concerned are you about you or your loved one’s risk of being exposed to coronavirus when you leave your home
for essential errands during stay-home orders?
Base: All Respondents
Waves Gender Age Income Political
Wave 2 Wave 3 Wave 4 Wave 5 Wave 6 Wave 7 Wave 8 Wave 9 Wave 10 Wave 11 Wave 12 Wave 13 Wave 14 Less(3/14 - (3/17 - (3/21 - (3/28 - (4/3 - (4/11- (4/18- (4/25- (5/1 - (5/8 - (5/15 - (5/27 - (5/29 - than $50k -3/15) 3/18) 3/23) 3/30) 4/5) 4/13) 4/20) 4/27) 5/3) 5/10) 5/17) 5/28) 5/31) MALE FEMALE 18-34 35-49 50-64 65+ $50k $75k $75k+ GOP DEM IND/OTH
(A) (B) (C) (D) (E) (F) (G) (H) (I) (J) (K) (L) (M) (N) (O) (P) (Q) (R) (S) (T) (U) (V) (W) (X) (Y)
- - - - - - - 2050 2039 2030 1961 1996 1965 1066 899 504 475 502 484 749 397 729 698 683 584Unweighted Base-** -** -** -** -** -** -** 2050 2039 2066 1961 1996 1965 952 1013 573 497 474 421 609 329 935 665 709 591Weighted Base
- - - - - - - 1646 1632 1543 1510 1528 1498 705 794 437 396 362 303 455 250 719 463 599 437- - - - - - - 80% 80% 75% 77% 77% 76% 74% 78% 76% 80% 77% 72% 75% 76% 77% 70% 84% 74%
JKLM JkLM n S WY
Very/SomewhatConcerned (Net)
- - - - - - - 856 808 742 719 706 735 328 407 208 224 178 125 214 118 365 227 327 181- - - - - - - 42% 40% 36% 37% 35% 37% 34% 40% 36% 45% 37% 30% 35% 36% 39% 34% 46% 31%
JKLM jL N s PrS S WY
Very concerned
- - - - - - - 789 823 801 792 822 764 377 387 229 172 185 178 241 132 354 236 272 256- - - - - - - 39% 40% 39% 40% 41% 39% 40% 38% 40% 35% 39% 42% 40% 40% 38% 35% 38% 43%
q W
Somewhat concerned
- - - - - - - 404 407 523 451 468 467 247 220 137 101 111 118 154 79 216 202 110 154- - - - - - - 20% 20% 25% 23% 23% 24% 26% 22% 24% 20% 23% 28% 25% 24% 23% 30% 16% 26%
HI Hi HI HI o Q X X
Not At All/Not VeryConcerned (Net)
- - - - - - - 281 289 354 327 336 294 160 134 88 60 66 80 103 43 136 119 82 92- - - - - - - 14% 14% 17% 17% 17% 15% 17% 13% 15% 12% 14% 19% 17% 13% 15% 18% 12% 16%
HI Hi Hi o Qr X
Not very concerned
- - - - - - - 123 118 169 123 132 173 87 86 49 41 46 37 51 35 79 83 28 62- - - - - - - 6% 6% 8% 6% 7% 9% 9% 9% 9% 8% 10% 9% 8% 11% 8% 12% 4% 10%
HIk HIKL X X
Not at all concerned
- - - - - - - 2050 2039 2066 1961 1996 1965 952 1013 573 497 474 421 609 329 935 665 709 591- - - - - - - 100% 100% 100% 100% 100% 100% 100% 100% 100% 100% 100% 100% 100% 100% 100% 100% 100% 100%
Sigma
__________________________________________________________________________________________________________________Proportions/Means: Columns Tested (5%, 10% risk level) - A/B/C/D/E/F/G/H/I/J/K/L/M - N/O - P/Q/R/S - T/U/V - W/X/YOverlap formulae used. ** very small base (under 30) ineligible for sig testing
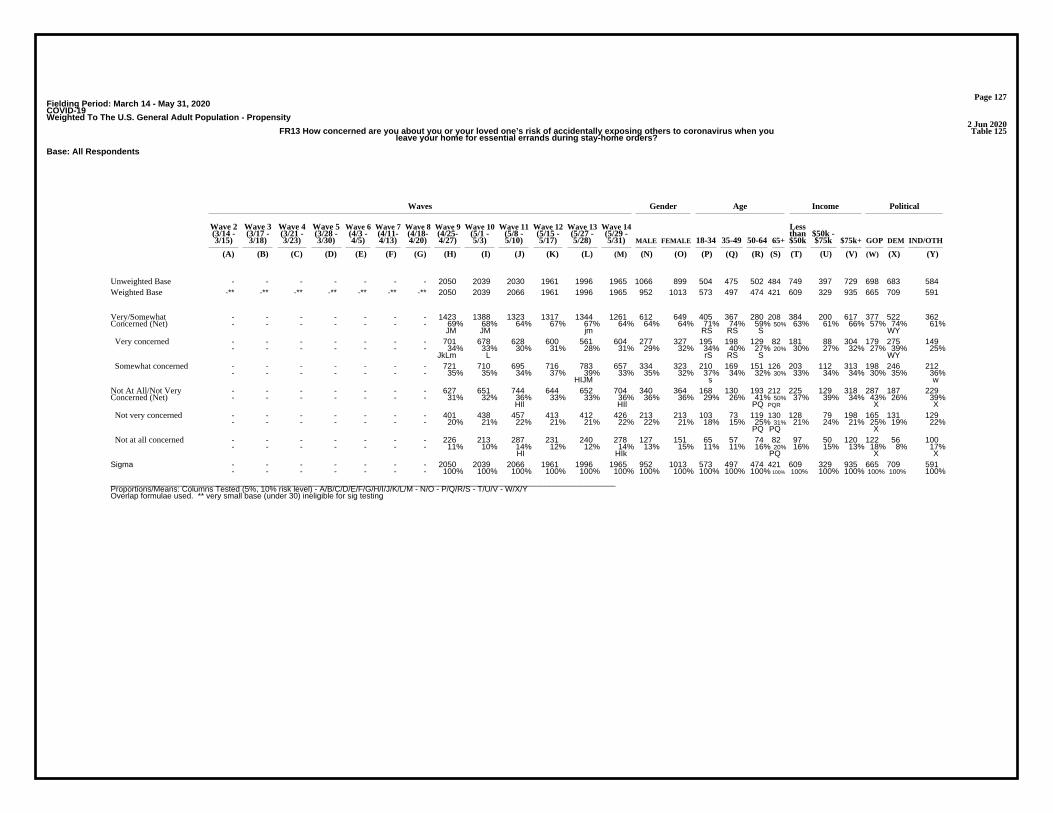
Page 127Fielding Period: March 14 - May 31, 2020COVID-19Weighted To The U.S. General Adult Population - Propensity
2 Jun 2020Table 125FR13 How concerned are you about you or your loved one’s risk of accidentally exposing others to coronavirus when you
leave your home for essential errands during stay-home orders?
Base: All Respondents
Waves Gender Age Income Political
Wave 2 Wave 3 Wave 4 Wave 5 Wave 6 Wave 7 Wave 8 Wave 9 Wave 10 Wave 11 Wave 12 Wave 13 Wave 14 Less(3/14 - (3/17 - (3/21 - (3/28 - (4/3 - (4/11- (4/18- (4/25- (5/1 - (5/8 - (5/15 - (5/27 - (5/29 - than $50k -3/15) 3/18) 3/23) 3/30) 4/5) 4/13) 4/20) 4/27) 5/3) 5/10) 5/17) 5/28) 5/31) MALE FEMALE 18-34 35-49 50-64 65+ $50k $75k $75k+ GOP DEM IND/OTH
(A) (B) (C) (D) (E) (F) (G) (H) (I) (J) (K) (L) (M) (N) (O) (P) (Q) (R) (S) (T) (U) (V) (W) (X) (Y)
- - - - - - - 2050 2039 2030 1961 1996 1965 1066 899 504 475 502 484 749 397 729 698 683 584Unweighted Base-** -** -** -** -** -** -** 2050 2039 2066 1961 1996 1965 952 1013 573 497 474 421 609 329 935 665 709 591Weighted Base
- - - - - - - 1423 1388 1323 1317 1344 1261 612 649 405 367 280 208 384 200 617 377 522 362- - - - - - - 69% 68% 64% 67% 67% 64% 64% 64% 71% 74% 59% 50% 63% 61% 66% 57% 74% 61%
JM JM jm RS RS S WY
Very/SomewhatConcerned (Net)
- - - - - - - 701 678 628 600 561 604 277 327 195 198 129 82 181 88 304 179 275 149- - - - - - - 34% 33% 30% 31% 28% 31% 29% 32% 34% 40% 27% 20% 30% 27% 32% 27% 39% 25%
JkLm L rS RS S WY
Very concerned
- - - - - - - 721 710 695 716 783 657 334 323 210 169 151 126 203 112 313 198 246 212- - - - - - - 35% 35% 34% 37% 39% 33% 35% 32% 37% 34% 32% 30% 33% 34% 34% 30% 35% 36%
HIJM s w
Somewhat concerned
- - - - - - - 627 651 744 644 652 704 340 364 168 130 193 212 225 129 318 287 187 229- - - - - - - 31% 32% 36% 33% 33% 36% 36% 36% 29% 26% 41% 50% 37% 39% 34% 43% 26% 39%
HIl HIl PQ PQR X X
Not At All/Not VeryConcerned (Net)
- - - - - - - 401 438 457 413 412 426 213 213 103 73 119 130 128 79 198 165 131 129- - - - - - - 20% 21% 22% 21% 21% 22% 22% 21% 18% 15% 25% 31% 21% 24% 21% 25% 19% 22%
PQ PQ X
Not very concerned
- - - - - - - 226 213 287 231 240 278 127 151 65 57 74 82 97 50 120 122 56 100- - - - - - - 11% 10% 14% 12% 12% 14% 13% 15% 11% 11% 16% 20% 16% 15% 13% 18% 8% 17%
HI HIk PQ X X
Not at all concerned
- - - - - - - 2050 2039 2066 1961 1996 1965 952 1013 573 497 474 421 609 329 935 665 709 591- - - - - - - 100% 100% 100% 100% 100% 100% 100% 100% 100% 100% 100% 100% 100% 100% 100% 100% 100% 100%
Sigma
__________________________________________________________________________________________________________________Proportions/Means: Columns Tested (5%, 10% risk level) - A/B/C/D/E/F/G/H/I/J/K/L/M - N/O - P/Q/R/S - T/U/V - W/X/YOverlap formulae used. ** very small base (under 30) ineligible for sig testing

Page 128Fielding Period: March 14 - May 31, 2020COVID-19Weighted To The U.S. General Adult Population - Propensity
2 Jun 2020Table 126FR12 When stay-at-home orders are lifted, how concerned are you about the following situations, as it relates to the risk of
you/your loved ones being exposed to, or accidentally exposing others to coronavirus?
Summary Of Very/Somewhat Concerned
Base: All Respondents (Variable Bases)
Waves Gender Age Income Political
Wave 2 Wave 3 Wave 4 Wave 5 Wave 6 Wave 7 Wave 8 Wave 9 Wave 10 Wave 11 Wave 12 Wave 13 Wave 14 Less(3/14 - (3/17 - (3/21 - (3/28 - (4/3 - (4/11- (4/18- (4/25- (5/1 - (5/8 - (5/15 - (5/27 - (5/29 - than $50k -3/15) 3/18) 3/23) 3/30) 4/5) 4/13) 4/20) 4/27) 5/3) 5/10) 5/17) 5/28) 5/31) MALE FEMALE 18-34 35-49 50-64 65+ $50k $75k $75k+ GOP DEM IND/OTH
(A) (B) (C) (D) (E) (F) (G) (H) (I) (J) (K) (L) (M) (N) (O) (P) (Q) (R) (S) (T) (U) (V) (W) (X) (Y)
- - - - - - - 1344 1498 1414 1353 1332 1374 664 710 385 384 318 287 368 236 708 431 559 383- - - - - - - 66% 73% 68% 69% 67% 70% 70% 70% 67% 77% 67% 68% 60% 72% 76% 65% 79% 65%
HJKLM h Hl PRS T T WY
Taking my first flight
- - - - - - - 1504 1521 1471 1421 1470 1362 637 725 366 385 335 275 398 241 656 398 586 378- - - - - - - 73% 75% 71% 72% 74% 69% 67% 72% 64% 77% 71% 65% 65% 73% 70% 60% 83% 64%
M jM m M n PrS p T WY
Returning to my normalactivities in public (e.g.,public transit, socializing)
- - - - - - - 1387 1441 1345 1317 1327 1296 605 691 365 358 314 260 394 213 628 383 550 363- - - - - - - 68% 71% 65% 67% 66% 66% 64% 68% 64% 72% 66% 62% 65% 65% 67% 58% 78% 61%
hJkLM n PS WY
Leaving my home for thefirst time to go tonon-essential businesses(e.g., bars, hair dressers,etc.)
- - - - - - - 771 780 689 721 649 698 326 372 157 297 139 104 166 113 401 241 294 164- - - - - - - 66% 66% 60% 62% 59% 63% 61% 65% 68% 80% 52% 44% 56% 64% 66% 58% 71% 58%
JL JL RS PRS T WY
My kids going back toschool for the first time
- - - - - - - 777 767 747 674 612 647 357 289 220 251 149 27 133 107 397 197 304 145- - - - - - - 63% 65% 61% 61% 57% 60% 59% 62% 61% 65% 57% 43% 54% 60% 62% 54% 72% 50%
L Lm S S t WY
Going back to the office
__________________________________________________________________________________________________________________Proportions/Means: Columns Tested (5%, 10% risk level) - A/B/C/D/E/F/G/H/I/J/K/L/M - N/O - P/Q/R/S - T/U/V - W/X/YOverlap formulae used. * small base; ** very small base (under 30) ineligible for sig testing
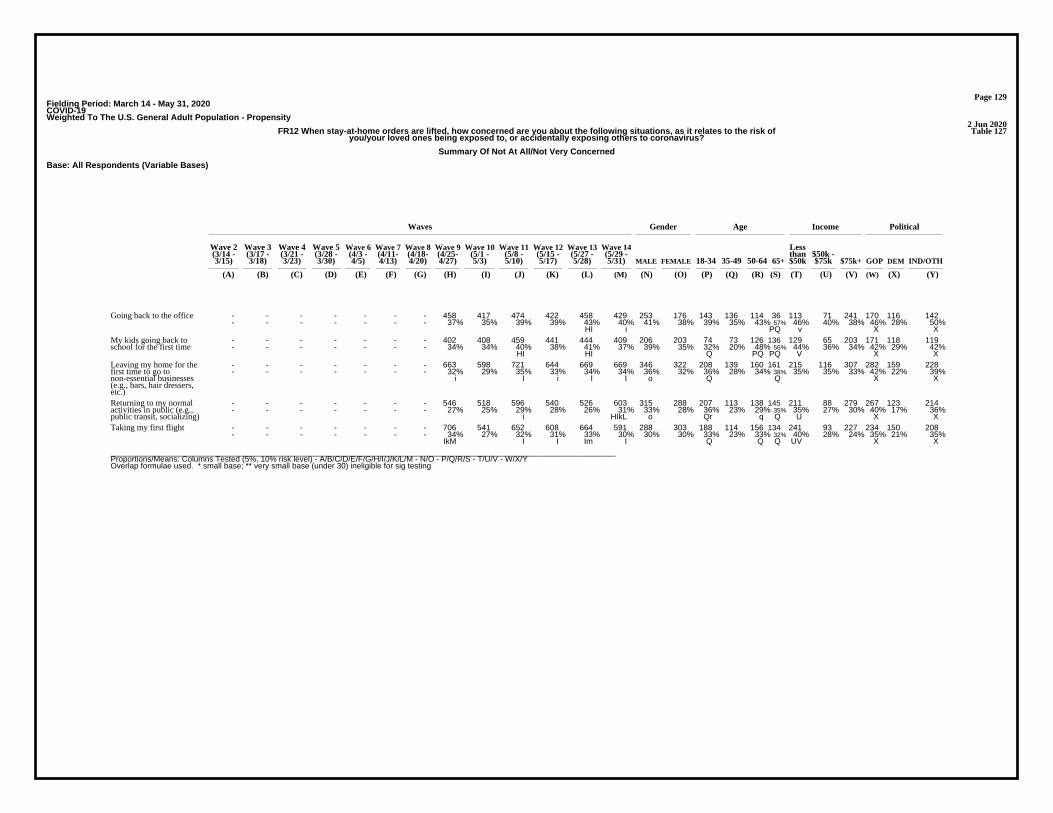
Page 129Fielding Period: March 14 - May 31, 2020COVID-19Weighted To The U.S. General Adult Population - Propensity
2 Jun 2020Table 127FR12 When stay-at-home orders are lifted, how concerned are you about the following situations, as it relates to the risk of
you/your loved ones being exposed to, or accidentally exposing others to coronavirus?
Summary Of Not At All/Not Very Concerned
Base: All Respondents (Variable Bases)
Waves Gender Age Income Political
Wave 2 Wave 3 Wave 4 Wave 5 Wave 6 Wave 7 Wave 8 Wave 9 Wave 10 Wave 11 Wave 12 Wave 13 Wave 14 Less(3/14 - (3/17 - (3/21 - (3/28 - (4/3 - (4/11- (4/18- (4/25- (5/1 - (5/8 - (5/15 - (5/27 - (5/29 - than $50k -3/15) 3/18) 3/23) 3/30) 4/5) 4/13) 4/20) 4/27) 5/3) 5/10) 5/17) 5/28) 5/31) MALE FEMALE 18-34 35-49 50-64 65+ $50k $75k $75k+ GOP DEM IND/OTH
(A) (B) (C) (D) (E) (F) (G) (H) (I) (J) (K) (L) (M) (N) (O) (P) (Q) (R) (S) (T) (U) (V) (W) (X) (Y)
- - - - - - - 458 417 474 422 458 429 253 176 143 136 114 36 113 71 241 170 116 142- - - - - - - 37% 35% 39% 39% 43% 40% 41% 38% 39% 35% 43% 57% 46% 40% 38% 46% 28% 50%
HI i PQ v X X
Going back to the office
- - - - - - - 402 408 459 441 444 409 206 203 74 73 126 136 129 65 203 171 118 119- - - - - - - 34% 34% 40% 38% 41% 37% 39% 35% 32% 20% 48% 56% 44% 36% 34% 42% 29% 42%
HI HI Q PQ PQ V X X
My kids going back toschool for the first time
- - - - - - - 663 598 721 644 669 669 346 322 208 139 160 161 215 116 307 282 159 228- - - - - - - 32% 29% 35% 33% 34% 34% 36% 32% 36% 28% 34% 38% 35% 35% 33% 42% 22% 39%
i I i I I o Q Q X X
Leaving my home for thefirst time to go tonon-essential businesses(e.g., bars, hair dressers,etc.)
- - - - - - - 546 518 596 540 526 603 315 288 207 113 138 145 211 88 279 267 123 214- - - - - - - 27% 25% 29% 28% 26% 31% 33% 28% 36% 23% 29% 35% 35% 27% 30% 40% 17% 36%
i HIkL o Qr q Q U X X
Returning to my normalactivities in public (e.g.,public transit, socializing)
- - - - - - - 706 541 652 608 664 591 288 303 188 114 156 134 241 93 227 234 150 208- - - - - - - 34% 27% 32% 31% 33% 30% 30% 30% 33% 23% 33% 32% 40% 28% 24% 35% 21% 35%
IkM I I Im I Q Q Q UV X X
Taking my first flight
__________________________________________________________________________________________________________________Proportions/Means: Columns Tested (5%, 10% risk level) - A/B/C/D/E/F/G/H/I/J/K/L/M - N/O - P/Q/R/S - T/U/V - W/X/YOverlap formulae used. * small base; ** very small base (under 30) ineligible for sig testing
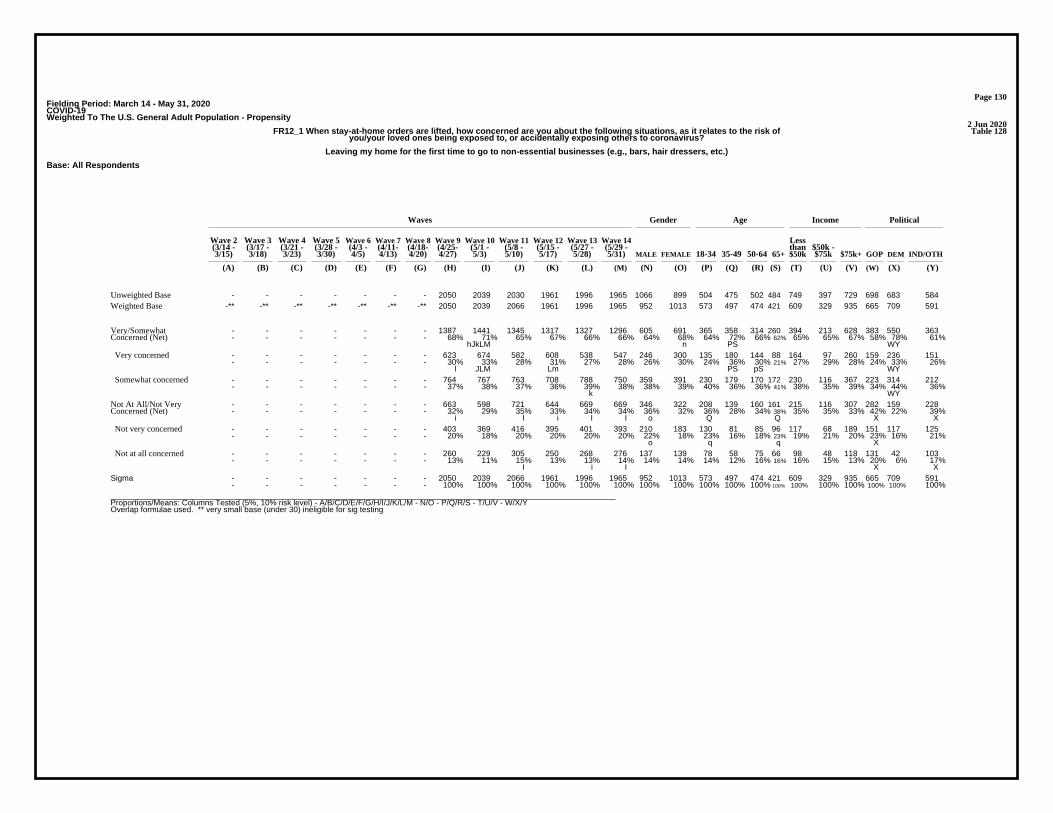
Page 130Fielding Period: March 14 - May 31, 2020COVID-19Weighted To The U.S. General Adult Population - Propensity
2 Jun 2020Table 128FR12_1 When stay-at-home orders are lifted, how concerned are you about the following situations, as it relates to the risk of
you/your loved ones being exposed to, or accidentally exposing others to coronavirus?
Leaving my home for the first time to go to non-essential businesses (e.g., bars, hair dressers, etc.)
Base: All Respondents
Waves Gender Age Income Political
Wave 2 Wave 3 Wave 4 Wave 5 Wave 6 Wave 7 Wave 8 Wave 9 Wave 10 Wave 11 Wave 12 Wave 13 Wave 14 Less(3/14 - (3/17 - (3/21 - (3/28 - (4/3 - (4/11- (4/18- (4/25- (5/1 - (5/8 - (5/15 - (5/27 - (5/29 - than $50k -3/15) 3/18) 3/23) 3/30) 4/5) 4/13) 4/20) 4/27) 5/3) 5/10) 5/17) 5/28) 5/31) MALE FEMALE 18-34 35-49 50-64 65+ $50k $75k $75k+ GOP DEM IND/OTH
(A) (B) (C) (D) (E) (F) (G) (H) (I) (J) (K) (L) (M) (N) (O) (P) (Q) (R) (S) (T) (U) (V) (W) (X) (Y)
- - - - - - - 2050 2039 2030 1961 1996 1965 1066 899 504 475 502 484 749 397 729 698 683 584Unweighted Base-** -** -** -** -** -** -** 2050 2039 2066 1961 1996 1965 952 1013 573 497 474 421 609 329 935 665 709 591Weighted Base
- - - - - - - 1387 1441 1345 1317 1327 1296 605 691 365 358 314 260 394 213 628 383 550 363- - - - - - - 68% 71% 65% 67% 66% 66% 64% 68% 64% 72% 66% 62% 65% 65% 67% 58% 78% 61%
hJkLM n PS WY
Very/SomewhatConcerned (Net)
- - - - - - - 623 674 582 608 538 547 246 300 135 180 144 88 164 97 260 159 236 151- - - - - - - 30% 33% 28% 31% 27% 28% 26% 30% 24% 36% 30% 21% 27% 29% 28% 24% 33% 26%
l JLM Lm PS pS WY
Very concerned
- - - - - - - 764 767 763 708 788 750 359 391 230 179 170 172 230 116 367 223 314 212- - - - - - - 37% 38% 37% 36% 39% 38% 38% 39% 40% 36% 36% 41% 38% 35% 39% 34% 44% 36%
k WY
Somewhat concerned
- - - - - - - 663 598 721 644 669 669 346 322 208 139 160 161 215 116 307 282 159 228- - - - - - - 32% 29% 35% 33% 34% 34% 36% 32% 36% 28% 34% 38% 35% 35% 33% 42% 22% 39%
i I i I I o Q Q X X
Not At All/Not VeryConcerned (Net)
- - - - - - - 403 369 416 395 401 393 210 183 130 81 85 96 117 68 189 151 117 125- - - - - - - 20% 18% 20% 20% 20% 20% 22% 18% 23% 16% 18% 23% 19% 21% 20% 23% 16% 21%
o q q X
Not very concerned
- - - - - - - 260 229 305 250 268 276 137 139 78 58 75 66 98 48 118 131 42 103- - - - - - - 13% 11% 15% 13% 13% 14% 14% 14% 14% 12% 16% 16% 16% 15% 13% 20% 6% 17%
I i I X X
Not at all concerned
- - - - - - - 2050 2039 2066 1961 1996 1965 952 1013 573 497 474 421 609 329 935 665 709 591- - - - - - - 100% 100% 100% 100% 100% 100% 100% 100% 100% 100% 100% 100% 100% 100% 100% 100% 100% 100%
Sigma
__________________________________________________________________________________________________________________Proportions/Means: Columns Tested (5%, 10% risk level) - A/B/C/D/E/F/G/H/I/J/K/L/M - N/O - P/Q/R/S - T/U/V - W/X/YOverlap formulae used. ** very small base (under 30) ineligible for sig testing

Page 131Fielding Period: March 14 - May 31, 2020COVID-19Weighted To The U.S. General Adult Population - Propensity
2 Jun 2020Table 129FR12_2 When stay-at-home orders are lifted, how concerned are you about the following situations, as it relates to the risk of
you/your loved ones being exposed to, or accidentally exposing others to coronavirus?
Returning to my normal activities in public (e.g., public transit, socializing)
Base: All Respondents
Waves Gender Age Income Political
Wave 2 Wave 3 Wave 4 Wave 5 Wave 6 Wave 7 Wave 8 Wave 9 Wave 10 Wave 11 Wave 12 Wave 13 Wave 14 Less(3/14 - (3/17 - (3/21 - (3/28 - (4/3 - (4/11- (4/18- (4/25- (5/1 - (5/8 - (5/15 - (5/27 - (5/29 - than $50k -3/15) 3/18) 3/23) 3/30) 4/5) 4/13) 4/20) 4/27) 5/3) 5/10) 5/17) 5/28) 5/31) MALE FEMALE 18-34 35-49 50-64 65+ $50k $75k $75k+ GOP DEM IND/OTH
(A) (B) (C) (D) (E) (F) (G) (H) (I) (J) (K) (L) (M) (N) (O) (P) (Q) (R) (S) (T) (U) (V) (W) (X) (Y)
- - - - - - - 2050 2039 2030 1961 1996 1965 1066 899 504 475 502 484 749 397 729 698 683 584Unweighted Base-** -** -** -** -** -** -** 2050 2039 2066 1961 1996 1965 952 1013 573 497 474 421 609 329 935 665 709 591Weighted Base
- - - - - - - 1504 1521 1471 1421 1470 1362 637 725 366 385 335 275 398 241 656 398 586 378- - - - - - - 73% 75% 71% 72% 74% 69% 67% 72% 64% 77% 71% 65% 65% 73% 70% 60% 83% 64%
M jM m M n PrS p T WY
Very/SomewhatConcerned (Net)
- - - - - - - 691 701 640 653 633 639 286 354 179 195 159 107 190 102 323 181 295 164- - - - - - - 34% 34% 31% 33% 32% 33% 30% 35% 31% 39% 34% 26% 31% 31% 35% 27% 42% 28%
j n PS S WY
Very concerned
- - - - - - - 812 819 831 769 837 722 351 372 188 190 177 168 208 139 333 217 291 214- - - - - - - 40% 40% 40% 39% 42% 37% 37% 37% 33% 38% 37% 40% 34% 42% 36% 33% 41% 36%
m m M p Tv W
Somewhat concerned
- - - - - - - 546 518 596 540 526 603 315 288 207 113 138 145 211 88 279 267 123 214- - - - - - - 27% 25% 29% 28% 26% 31% 33% 28% 36% 23% 29% 35% 35% 27% 30% 40% 17% 36%
i HIkL o Qr q Q U X X
Not At All/Not VeryConcerned (Net)
- - - - - - - 331 317 348 330 302 350 195 154 132 65 69 84 109 51 179 145 91 114- - - - - - - 16% 16% 17% 17% 15% 18% 21% 15% 23% 13% 15% 20% 18% 15% 19% 22% 13% 19%
l O QR Qr X X
Not very concerned
- - - - - - - 216 201 248 210 224 254 120 134 75 48 69 61 102 37 100 122 32 100- - - - - - - 11% 10% 12% 11% 11% 13% 13% 13% 13% 10% 15% 15% 17% 11% 11% 18% 4% 17%
i hI q q UV X X
Not at all concerned
- - - - - - - 2050 2039 2066 1961 1996 1965 952 1013 573 497 474 421 609 329 935 665 709 591- - - - - - - 100% 100% 100% 100% 100% 100% 100% 100% 100% 100% 100% 100% 100% 100% 100% 100% 100% 100%
Sigma
__________________________________________________________________________________________________________________Proportions/Means: Columns Tested (5%, 10% risk level) - A/B/C/D/E/F/G/H/I/J/K/L/M - N/O - P/Q/R/S - T/U/V - W/X/YOverlap formulae used. ** very small base (under 30) ineligible for sig testing

Page 132Fielding Period: March 14 - May 31, 2020COVID-19Weighted To The U.S. General Adult Population - Propensity
2 Jun 2020Table 130FR12_3 When stay-at-home orders are lifted, how concerned are you about the following situations, as it relates to the risk of
you/your loved ones being exposed to, or accidentally exposing others to coronavirus?
Taking my first flight
Base: All Respondents
Waves Gender Age Income Political
Wave 2 Wave 3 Wave 4 Wave 5 Wave 6 Wave 7 Wave 8 Wave 9 Wave 10 Wave 11 Wave 12 Wave 13 Wave 14 Less(3/14 - (3/17 - (3/21 - (3/28 - (4/3 - (4/11- (4/18- (4/25- (5/1 - (5/8 - (5/15 - (5/27 - (5/29 - than $50k -3/15) 3/18) 3/23) 3/30) 4/5) 4/13) 4/20) 4/27) 5/3) 5/10) 5/17) 5/28) 5/31) MALE FEMALE 18-34 35-49 50-64 65+ $50k $75k $75k+ GOP DEM IND/OTH
(A) (B) (C) (D) (E) (F) (G) (H) (I) (J) (K) (L) (M) (N) (O) (P) (Q) (R) (S) (T) (U) (V) (W) (X) (Y)
- - - - - - - 2050 2039 2030 1961 1996 1965 1066 899 504 475 502 484 749 397 729 698 683 584Unweighted Base-** -** -** -** -** -** -** 2050 2039 2066 1961 1996 1965 952 1013 573 497 474 421 609 329 935 665 709 591Weighted Base
- - - - - - - 1344 1498 1414 1353 1332 1374 664 710 385 384 318 287 368 236 708 431 559 383- - - - - - - 66% 73% 68% 69% 67% 70% 70% 70% 67% 77% 67% 68% 60% 72% 76% 65% 79% 65%
HJKLM h Hl PRS T T WY
Very/SomewhatConcerned (Net)
- - - - - - - 785 883 758 820 776 819 371 448 196 229 199 196 231 138 416 256 349 215- - - - - - - 38% 43% 37% 42% 39% 42% 39% 44% 34% 46% 42% 47% 38% 42% 44% 38% 49% 36%
HJL hJ hJ n P P P T WY
Very concerned
- - - - - - - 559 615 656 533 556 554 292 262 189 155 119 91 137 99 292 175 211 168- - - - - - - 27% 30% 32% 27% 28% 28% 31% 26% 33% 31% 25% 22% 23% 30% 31% 26% 30% 28%
HKLm o RS rS T T
Somewhat concerned
- - - - - - - 706 541 652 608 664 591 288 303 188 114 156 134 241 93 227 234 150 208- - - - - - - 34% 27% 32% 31% 33% 30% 30% 30% 33% 23% 33% 32% 40% 28% 24% 35% 21% 35%
IkM I I Im I Q Q Q UV X X
Not At All/Not VeryConcerned (Net)
- - - - - - - 259 250 293 261 286 247 152 94 95 46 60 46 84 42 115 93 74 80- - - - - - - 13% 12% 14% 13% 14% 13% 16% 9% 17% 9% 13% 11% 14% 13% 12% 14% 10% 14%
O Qs
Not very concerned
- - - - - - - 447 291 359 347 378 345 136 209 93 68 96 88 157 50 112 141 76 128- - - - - - - 22% 14% 17% 18% 19% 18% 14% 21% 16% 14% 20% 21% 26% 15% 12% 21% 11% 22%
IJKlM I I I I N Q Q UV X X
Not at all concerned
- - - - - - - 2050 2039 2066 1961 1996 1965 952 1013 573 497 474 421 609 329 935 665 709 591- - - - - - - 100% 100% 100% 100% 100% 100% 100% 100% 100% 100% 100% 100% 100% 100% 100% 100% 100% 100%
Sigma
__________________________________________________________________________________________________________________Proportions/Means: Columns Tested (5%, 10% risk level) - A/B/C/D/E/F/G/H/I/J/K/L/M - N/O - P/Q/R/S - T/U/V - W/X/YOverlap formulae used. ** very small base (under 30) ineligible for sig testing

Page 133Fielding Period: March 14 - May 31, 2020COVID-19Weighted To The U.S. General Adult Population - Propensity
2 Jun 2020Table 131FR12_4 When stay-at-home orders are lifted, how concerned are you about the following situations, as it relates to the risk of
you/your loved ones being exposed to, or accidentally exposing others to coronavirus?
My kids going back to school for the first time
Base: All Respondents Who Are Parent
Waves Gender Age Income Political
Wave 2 Wave 3 Wave 4 Wave 5 Wave 6 Wave 7 Wave 8 Wave 9 Wave 10 Wave 11 Wave 12 Wave 13 Wave 14 Less(3/14 - (3/17 - (3/21 - (3/28 - (4/3 - (4/11- (4/18- (4/25- (5/1 - (5/8 - (5/15 - (5/27 - (5/29 - than $50k -3/15) 3/18) 3/23) 3/30) 4/5) 4/13) 4/20) 4/27) 5/3) 5/10) 5/17) 5/28) 5/31) MALE FEMALE 18-34 35-49 50-64 65+ $50k $75k $75k+ GOP DEM IND/OTH
(A) (B) (C) (D) (E) (F) (G) (H) (I) (J) (K) (L) (M) (N) (O) (P) (Q) (R) (S) (T) (U) (V) (W) (X) (Y)
- - - - - - - 1136 1183 1121 1159 1115 1108 618 490 209 353 282 264 347 214 510 433 383 292Unweighted Base-** -** -** -** -** -** -** 1173 1188 1147 1161 1093 1107 531 575 231 371 265 240 295 178 604 412 412 283Weighted Base
- - - - - - - 771 780 689 721 649 698 326 372 157 297 139 104 166 113 401 241 294 164- - - - - - - 66% 66% 60% 62% 59% 63% 61% 65% 68% 80% 52% 44% 56% 64% 66% 58% 71% 58%
JL JL RS PRS T WY
Very/SomewhatConcerned (Net)
- - - - - - - 448 475 385 424 365 392 176 216 97 172 72 51 101 53 230 134 173 85- - - - - - - 38% 40% 34% 36% 33% 35% 33% 37% 42% 46% 27% 21% 34% 30% 38% 33% 42% 30%
jl JLm RS RS WY
Very concerned
- - - - - - - 323 305 304 297 283 306 149 157 60 126 67 53 65 60 171 106 121 79- - - - - - - 28% 26% 26% 26% 26% 28% 28% 27% 26% 34% 25% 22% 22% 34% 28% 26% 29% 28%
rS T
Somewhat concerned
- - - - - - - 402 408 459 441 444 409 206 203 74 73 126 136 129 65 203 171 118 119- - - - - - - 34% 34% 40% 38% 41% 37% 39% 35% 32% 20% 48% 56% 44% 36% 34% 42% 29% 42%
HI HI Q PQ PQ V X X
Not At All/Not VeryConcerned (Net)
- - - - - - - 110 167 158 153 141 140 81 60 45 37 30 28 38 25 75 51 46 43- - - - - - - 9% 14% 14% 13% 13% 13% 15% 10% 19% 10% 11% 12% 13% 14% 12% 12% 11% 15%
H H H H H o Qrs
Not very concerned
- - - - - - - 291 241 301 287 303 268 125 143 29 36 96 107 91 40 128 120 72 76- - - - - - - 25% 20% 26% 25% 28% 24% 24% 25% 12% 10% 36% 45% 31% 22% 21% 29% 17% 27%
I I I I i PQ PQ uV X X
Not at all concerned
- - - - - - - 1173 1188 1147 1161 1093 1107 531 575 231 371 265 240 295 178 604 412 412 283- - - - - - - 100% 100% 100% 100% 100% 100% 100% 100% 100% 100% 100% 100% 100% 100% 100% 100% 100% 100%
Sigma
__________________________________________________________________________________________________________________Proportions/Means: Columns Tested (5%, 10% risk level) - A/B/C/D/E/F/G/H/I/J/K/L/M - N/O - P/Q/R/S - T/U/V - W/X/YOverlap formulae used. ** very small base (under 30) ineligible for sig testing
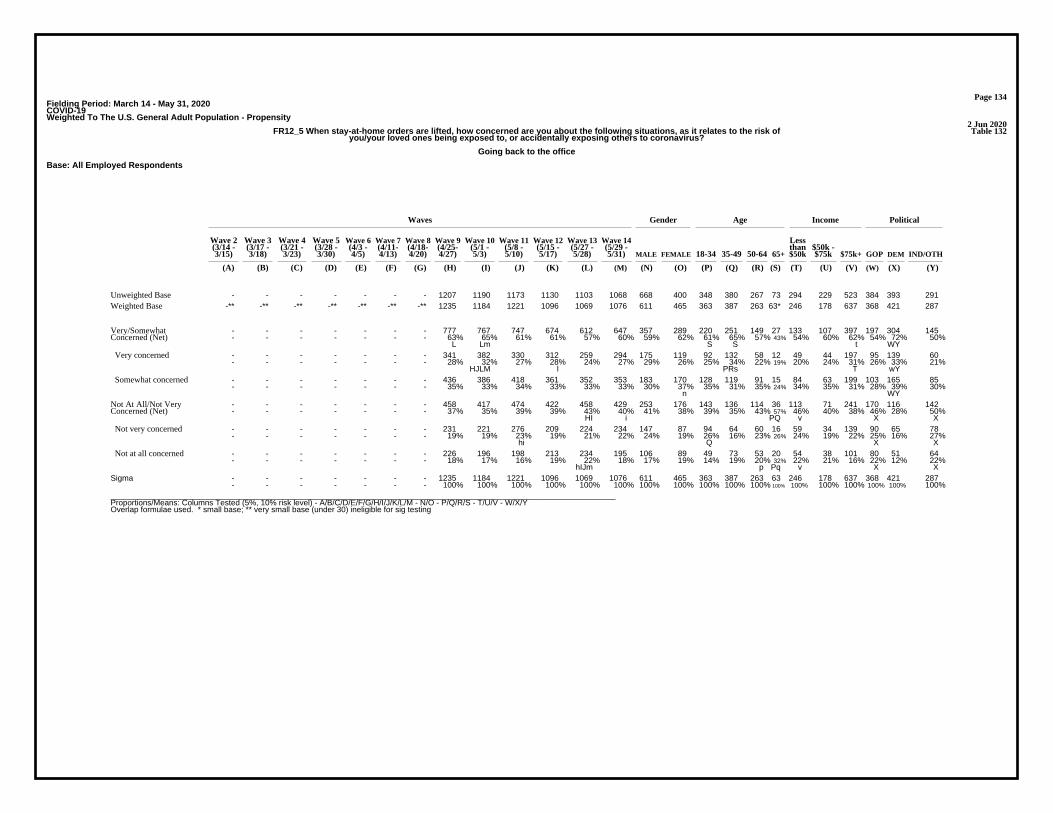
Page 134Fielding Period: March 14 - May 31, 2020COVID-19Weighted To The U.S. General Adult Population - Propensity
2 Jun 2020Table 132FR12_5 When stay-at-home orders are lifted, how concerned are you about the following situations, as it relates to the risk of
you/your loved ones being exposed to, or accidentally exposing others to coronavirus?
Going back to the office
Base: All Employed Respondents
Waves Gender Age Income Political
Wave 2 Wave 3 Wave 4 Wave 5 Wave 6 Wave 7 Wave 8 Wave 9 Wave 10 Wave 11 Wave 12 Wave 13 Wave 14 Less(3/14 - (3/17 - (3/21 - (3/28 - (4/3 - (4/11- (4/18- (4/25- (5/1 - (5/8 - (5/15 - (5/27 - (5/29 - than $50k -3/15) 3/18) 3/23) 3/30) 4/5) 4/13) 4/20) 4/27) 5/3) 5/10) 5/17) 5/28) 5/31) MALE FEMALE 18-34 35-49 50-64 65+ $50k $75k $75k+ GOP DEM IND/OTH
(A) (B) (C) (D) (E) (F) (G) (H) (I) (J) (K) (L) (M) (N) (O) (P) (Q) (R) (S) (T) (U) (V) (W) (X) (Y)
- - - - - - - 1207 1190 1173 1130 1103 1068 668 400 348 380 267 73 294 229 523 384 393 291Unweighted Base-** -** -** -** -** -** -** 1235 1184 1221 1096 1069 1076 611 465 363 387 263 63* 246 178 637 368 421 287Weighted Base
- - - - - - - 777 767 747 674 612 647 357 289 220 251 149 27 133 107 397 197 304 145- - - - - - - 63% 65% 61% 61% 57% 60% 59% 62% 61% 65% 57% 43% 54% 60% 62% 54% 72% 50%
L Lm S S t WY
Very/SomewhatConcerned (Net)
- - - - - - - 341 382 330 312 259 294 175 119 92 132 58 12 49 44 197 95 139 60- - - - - - - 28% 32% 27% 28% 24% 27% 29% 26% 25% 34% 22% 19% 20% 24% 31% 26% 33% 21%
HJLM l PRs T wY
Very concerned
- - - - - - - 436 386 418 361 352 353 183 170 128 119 91 15 84 63 199 103 165 85- - - - - - - 35% 33% 34% 33% 33% 33% 30% 37% 35% 31% 35% 24% 34% 35% 31% 28% 39% 30%
n WY
Somewhat concerned
- - - - - - - 458 417 474 422 458 429 253 176 143 136 114 36 113 71 241 170 116 142- - - - - - - 37% 35% 39% 39% 43% 40% 41% 38% 39% 35% 43% 57% 46% 40% 38% 46% 28% 50%
HI i PQ v X X
Not At All/Not VeryConcerned (Net)
- - - - - - - 231 221 276 209 224 234 147 87 94 64 60 16 59 34 139 90 65 78- - - - - - - 19% 19% 23% 19% 21% 22% 24% 19% 26% 16% 23% 26% 24% 19% 22% 25% 16% 27%
hi Q X X
Not very concerned
- - - - - - - 226 196 198 213 234 195 106 89 49 73 53 20 54 38 101 80 51 64- - - - - - - 18% 17% 16% 19% 22% 18% 17% 19% 14% 19% 20% 32% 22% 21% 16% 22% 12% 22%
hIJm p Pq v X X
Not at all concerned
- - - - - - - 1235 1184 1221 1096 1069 1076 611 465 363 387 263 63 246 178 637 368 421 287- - - - - - - 100% 100% 100% 100% 100% 100% 100% 100% 100% 100% 100% 100% 100% 100% 100% 100% 100% 100%
Sigma
__________________________________________________________________________________________________________________Proportions/Means: Columns Tested (5%, 10% risk level) - A/B/C/D/E/F/G/H/I/J/K/L/M - N/O - P/Q/R/S - T/U/V - W/X/YOverlap formulae used. * small base; ** very small base (under 30) ineligible for sig testing
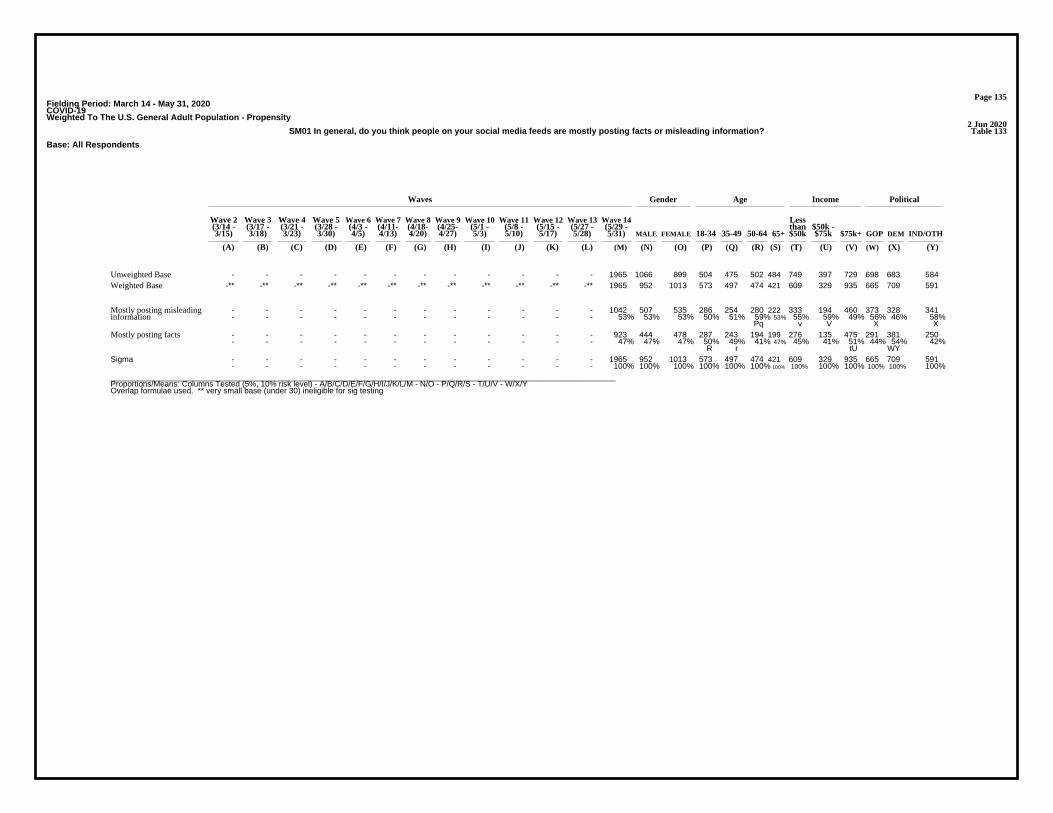
Page 135Fielding Period: March 14 - May 31, 2020COVID-19Weighted To The U.S. General Adult Population - Propensity
2 Jun 2020Table 133SM01 In general, do you think people on your social media feeds are mostly posting facts or misleading information?
Base: All Respondents
Waves Gender Age Income Political
Wave 2 Wave 3 Wave 4 Wave 5 Wave 6 Wave 7 Wave 8 Wave 9 Wave 10 Wave 11 Wave 12 Wave 13 Wave 14 Less(3/14 - (3/17 - (3/21 - (3/28 - (4/3 - (4/11- (4/18- (4/25- (5/1 - (5/8 - (5/15 - (5/27 - (5/29 - than $50k -3/15) 3/18) 3/23) 3/30) 4/5) 4/13) 4/20) 4/27) 5/3) 5/10) 5/17) 5/28) 5/31) MALE FEMALE 18-34 35-49 50-64 65+ $50k $75k $75k+ GOP DEM IND/OTH
(A) (B) (C) (D) (E) (F) (G) (H) (I) (J) (K) (L) (M) (N) (O) (P) (Q) (R) (S) (T) (U) (V) (W) (X) (Y)
- - - - - - - - - - - - 1965 1066 899 504 475 502 484 749 397 729 698 683 584Unweighted Base-** -** -** -** -** -** -** -** -** -** -** -** 1965 952 1013 573 497 474 421 609 329 935 665 709 591Weighted Base
- - - - - - - - - - - - 1042 507 535 286 254 280 222 333 194 460 373 328 341- - - - - - - - - - - - 53% 53% 53% 50% 51% 59% 53% 55% 59% 49% 56% 46% 58%
Pq v V X X
Mostly posting misleadinginformation
- - - - - - - - - - - - 923 444 478 287 243 194 199 276 135 475 291 381 250- - - - - - - - - - - - 47% 47% 47% 50% 49% 41% 47% 45% 41% 51% 44% 54% 42%
R r tU WY
Mostly posting facts
- - - - - - - - - - - - 1965 952 1013 573 497 474 421 609 329 935 665 709 591- - - - - - - - - - - - 100% 100% 100% 100% 100% 100% 100% 100% 100% 100% 100% 100% 100%
Sigma
__________________________________________________________________________________________________________________Proportions/Means: Columns Tested (5%, 10% risk level) - A/B/C/D/E/F/G/H/I/J/K/L/M - N/O - P/Q/R/S - T/U/V - W/X/YOverlap formulae used. ** very small base (under 30) ineligible for sig testing
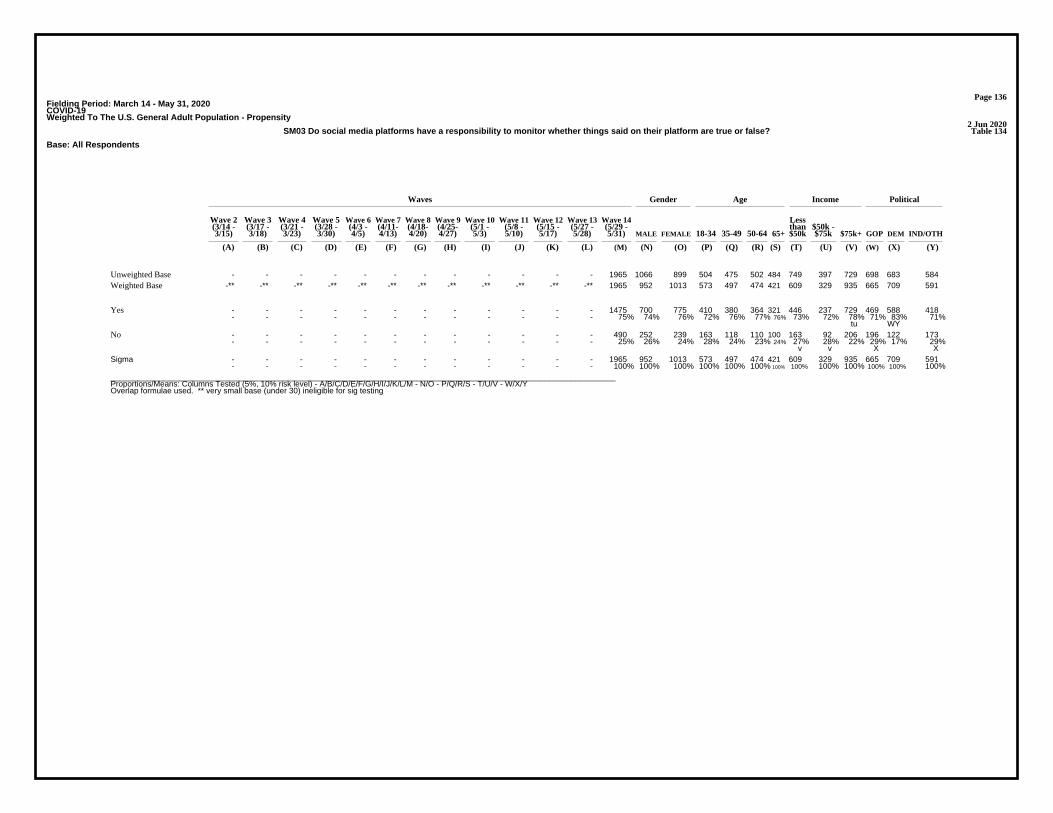
Page 136Fielding Period: March 14 - May 31, 2020COVID-19Weighted To The U.S. General Adult Population - Propensity
2 Jun 2020Table 134SM03 Do social media platforms have a responsibility to monitor whether things said on their platform are true or false?
Base: All Respondents
Waves Gender Age Income Political
Wave 2 Wave 3 Wave 4 Wave 5 Wave 6 Wave 7 Wave 8 Wave 9 Wave 10 Wave 11 Wave 12 Wave 13 Wave 14 Less(3/14 - (3/17 - (3/21 - (3/28 - (4/3 - (4/11- (4/18- (4/25- (5/1 - (5/8 - (5/15 - (5/27 - (5/29 - than $50k -3/15) 3/18) 3/23) 3/30) 4/5) 4/13) 4/20) 4/27) 5/3) 5/10) 5/17) 5/28) 5/31) MALE FEMALE 18-34 35-49 50-64 65+ $50k $75k $75k+ GOP DEM IND/OTH
(A) (B) (C) (D) (E) (F) (G) (H) (I) (J) (K) (L) (M) (N) (O) (P) (Q) (R) (S) (T) (U) (V) (W) (X) (Y)
- - - - - - - - - - - - 1965 1066 899 504 475 502 484 749 397 729 698 683 584Unweighted Base-** -** -** -** -** -** -** -** -** -** -** -** 1965 952 1013 573 497 474 421 609 329 935 665 709 591Weighted Base
- - - - - - - - - - - - 1475 700 775 410 380 364 321 446 237 729 469 588 418- - - - - - - - - - - - 75% 74% 76% 72% 76% 77% 76% 73% 72% 78% 71% 83% 71%
tu WY
Yes
- - - - - - - - - - - - 490 252 239 163 118 110 100 163 92 206 196 122 173- - - - - - - - - - - - 25% 26% 24% 28% 24% 23% 24% 27% 28% 22% 29% 17% 29%
v v X X
No
- - - - - - - - - - - - 1965 952 1013 573 497 474 421 609 329 935 665 709 591- - - - - - - - - - - - 100% 100% 100% 100% 100% 100% 100% 100% 100% 100% 100% 100% 100%
Sigma
__________________________________________________________________________________________________________________Proportions/Means: Columns Tested (5%, 10% risk level) - A/B/C/D/E/F/G/H/I/J/K/L/M - N/O - P/Q/R/S - T/U/V - W/X/YOverlap formulae used. ** very small base (under 30) ineligible for sig testing

Page 137Fielding Period: March 14 - May 31, 2020COVID-19Weighted To The U.S. General Adult Population - Propensity
2 Jun 2020Table 135SM04 Do you think social media platforms should or should not censor information they believe to be false/ misleading?
Base: All Respondents
Waves Gender Age Income Political
Wave 2 Wave 3 Wave 4 Wave 5 Wave 6 Wave 7 Wave 8 Wave 9 Wave 10 Wave 11 Wave 12 Wave 13 Wave 14 Less(3/14 - (3/17 - (3/21 - (3/28 - (4/3 - (4/11- (4/18- (4/25- (5/1 - (5/8 - (5/15 - (5/27 - (5/29 - than $50k -3/15) 3/18) 3/23) 3/30) 4/5) 4/13) 4/20) 4/27) 5/3) 5/10) 5/17) 5/28) 5/31) MALE FEMALE 18-34 35-49 50-64 65+ $50k $75k $75k+ GOP DEM IND/OTH
(A) (B) (C) (D) (E) (F) (G) (H) (I) (J) (K) (L) (M) (N) (O) (P) (Q) (R) (S) (T) (U) (V) (W) (X) (Y)
- - - - - - - - - - - - 1965 1066 899 504 475 502 484 749 397 729 698 683 584Unweighted Base-** -** -** -** -** -** -** -** -** -** -** -** 1965 952 1013 573 497 474 421 609 329 935 665 709 591Weighted Base
- - - - - - - - - - - - 1254 561 693 342 320 318 274 368 226 592 378 496 380- - - - - - - - - - - - 64% 59% 68% 60% 64% 67% 65% 60% 69% 63% 57% 70% 64%
N p T Wy W
Social media companiesshould censor informationthey believe to be false/misleading
- - - - - - - - - - - - 711 390 321 232 177 156 147 241 103 343 286 213 211- - - - - - - - - - - - 36% 41% 32% 40% 36% 33% 35% 40% 31% 37% 43% 30% 36%
O r U XY x
Social media companiesshould NOT censorinformation they believe tobe false/ misleading
- - - - - - - - - - - - 1965 952 1013 573 497 474 421 609 329 935 665 709 591- - - - - - - - - - - - 100% 100% 100% 100% 100% 100% 100% 100% 100% 100% 100% 100% 100%
Sigma
__________________________________________________________________________________________________________________Proportions/Means: Columns Tested (5%, 10% risk level) - A/B/C/D/E/F/G/H/I/J/K/L/M - N/O - P/Q/R/S - T/U/V - W/X/YOverlap formulae used. ** very small base (under 30) ineligible for sig testing

Page 138Fielding Period: March 14 - May 31, 2020COVID-19Weighted To The U.S. General Adult Population - Propensity
2 Jun 2020Table 136SM05 Do you think that social media platforms are generally more favorable to Republicans or Democrats?
Base: All Respondents
Waves Gender Age Income Political
Wave 2 Wave 3 Wave 4 Wave 5 Wave 6 Wave 7 Wave 8 Wave 9 Wave 10 Wave 11 Wave 12 Wave 13 Wave 14 Less(3/14 - (3/17 - (3/21 - (3/28 - (4/3 - (4/11- (4/18- (4/25- (5/1 - (5/8 - (5/15 - (5/27 - (5/29 - than $50k -3/15) 3/18) 3/23) 3/30) 4/5) 4/13) 4/20) 4/27) 5/3) 5/10) 5/17) 5/28) 5/31) MALE FEMALE 18-34 35-49 50-64 65+ $50k $75k $75k+ GOP DEM IND/OTH
(A) (B) (C) (D) (E) (F) (G) (H) (I) (J) (K) (L) (M) (N) (O) (P) (Q) (R) (S) (T) (U) (V) (W) (X) (Y)
- - - - - - - - - - - - 1965 1066 899 504 475 502 484 749 397 729 698 683 584Unweighted Base-** -** -** -** -** -** -** -** -** -** -** -** 1965 952 1013 573 497 474 421 609 329 935 665 709 591Weighted Base
- - - - - - - - - - - - 689 359 330 225 146 156 162 193 119 362 268 271 150- - - - - - - - - - - - 35% 38% 33% 39% 29% 33% 38% 32% 36% 39% 40% 38% 25%
o Q Q T Y Y
Democrats
- - - - - - - - - - - - 375 195 181 120 123 68 65 89 52 226 215 105 55- - - - - - - - - - - - 19% 20% 18% 21% 25% 14% 15% 15% 16% 24% 32% 15% 9%
Rs RS TU XY Y
Republicans
- - - - - - - - - - - - 901 398 503 228 229 249 194 327 158 347 181 333 386- - - - - - - - - - - - 46% 42% 50% 40% 46% 53% 46% 54% 48% 37% 27% 47% 65%
N P V V W WX
Neither
- - - - - - - - - - - - 1965 952 1013 573 497 474 421 609 329 935 665 709 591- - - - - - - - - - - - 100% 100% 100% 100% 100% 100% 100% 100% 100% 100% 100% 100% 100%
Sigma
__________________________________________________________________________________________________________________Proportions/Means: Columns Tested (5%, 10% risk level) - A/B/C/D/E/F/G/H/I/J/K/L/M - N/O - P/Q/R/S - T/U/V - W/X/YOverlap formulae used. ** very small base (under 30) ineligible for sig testing
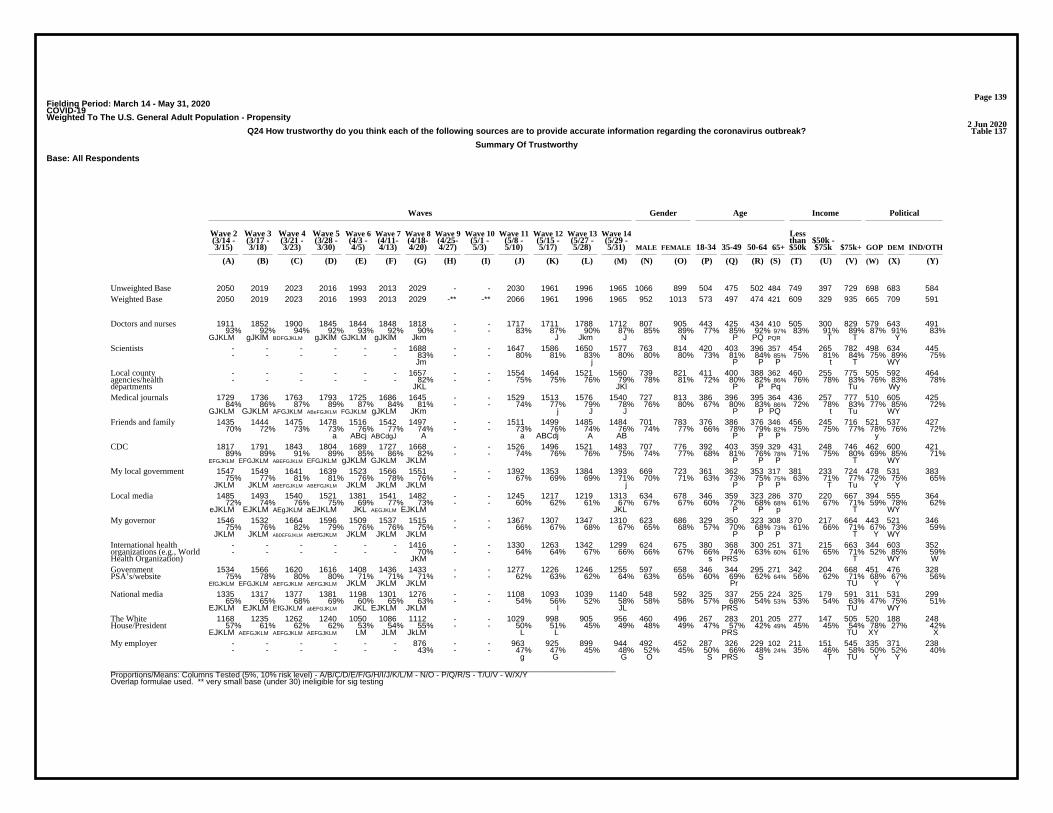
Page 139Fielding Period: March 14 - May 31, 2020COVID-19Weighted To The U.S. General Adult Population - Propensity
2 Jun 2020Table 137Q24 How trustworthy do you think each of the following sources are to provide accurate information regarding the coronavirus outbreak?
Summary Of Trustworthy
Base: All Respondents
Waves Gender Age Income Political
Wave 2 Wave 3 Wave 4 Wave 5 Wave 6 Wave 7 Wave 8 Wave 9 Wave 10 Wave 11 Wave 12 Wave 13 Wave 14 Less(3/14 - (3/17 - (3/21 - (3/28 - (4/3 - (4/11- (4/18- (4/25- (5/1 - (5/8 - (5/15 - (5/27 - (5/29 - than $50k -3/15) 3/18) 3/23) 3/30) 4/5) 4/13) 4/20) 4/27) 5/3) 5/10) 5/17) 5/28) 5/31) MALE FEMALE 18-34 35-49 50-64 65+ $50k $75k $75k+ GOP DEM IND/OTH
(A) (B) (C) (D) (E) (F) (G) (H) (I) (J) (K) (L) (M) (N) (O) (P) (Q) (R) (S) (T) (U) (V) (W) (X) (Y)
2050 2019 2023 2016 1993 2013 2029 - - 2030 1961 1996 1965 1066 899 504 475 502 484 749 397 729 698 683 584Unweighted Base2050 2019 2023 2016 1993 2013 2029 -** -** 2066 1961 1996 1965 952 1013 573 497 474 421 609 329 935 665 709 591Weighted Base
1911 1852 1900 1845 1844 1848 1818 - - 1717 1711 1788 1712 807 905 443 425 434 410 505 300 829 579 643 49193% 92% 94% 92% 93% 92% 90% - - 83% 87% 90% 87% 85% 89% 77% 85% 92% 97% 83% 91% 89% 87% 91% 83%
GJKLM gJKlM BDFGJKLM gJKlM GJKLM gJKlM Jkm J Jkm J N P PQ PQR T T Y
Doctors and nurses
- - - - - - 1688 - - 1647 1586 1650 1577 763 814 420 403 396 357 454 265 782 498 634 445- - - - - - 83% - - 80% 81% 83% 80% 80% 80% 73% 81% 84% 85% 75% 81% 84% 75% 89% 75%
Jm j P P P t T WY
Scientists
- - - - - - 1657 - - 1554 1464 1521 1560 739 821 411 400 388 362 460 255 775 505 592 464- - - - - - 82% - - 75% 75% 76% 79% 78% 81% 72% 80% 82% 86% 76% 78% 83% 76% 83% 78%
JKL JKl P P Pq Tu Wy
Local countyagencies/healthdepartments
1729 1736 1763 1793 1725 1686 1645 - - 1529 1513 1576 1540 727 813 386 396 395 364 436 257 777 510 605 42584% 86% 87% 89% 87% 84% 81% - - 74% 77% 79% 78% 76% 80% 67% 80% 83% 86% 72% 78% 83% 77% 85% 72%
GJKLM GJKLM AFGJKLM ABeFGJKLM FGJKLM gJKLM JKm j J J P P PQ t Tu WY
Medical journals
1435 1444 1475 1478 1516 1542 1497 - - 1511 1499 1485 1484 701 783 376 386 376 346 456 245 716 521 537 42770% 72% 73% 73% 76% 77% 74% - - 73% 76% 74% 76% 74% 77% 66% 78% 79% 82% 75% 75% 77% 78% 76% 72%
a ABcj ABCdgJ A a ABCdj A AB P P P y
Friends and family
1817 1791 1843 1804 1689 1727 1668 - - 1526 1496 1521 1483 707 776 392 403 359 329 431 248 746 462 600 42189% 89% 91% 89% 85% 86% 82% - - 74% 76% 76% 75% 74% 77% 68% 81% 76% 78% 71% 75% 80% 69% 85% 71%
EFGJKLM EFGJKLM ABEFGJKLM EFGJKLM gJKLM GJKLM JKLM P P P T WY
CDC
1547 1549 1641 1639 1523 1566 1551 - - 1392 1353 1384 1393 669 723 361 362 353 317 381 233 724 478 531 38375% 77% 81% 81% 76% 78% 76% - - 67% 69% 69% 71% 70% 71% 63% 73% 75% 75% 63% 71% 77% 72% 75% 65%
JKLM JKLM ABEFGJKLM ABEFGJKLM JKLM JKLM JKLM j P P P T Tu Y Y
My local government
1485 1493 1540 1521 1381 1541 1482 - - 1245 1217 1219 1313 634 678 346 359 323 286 370 220 667 394 555 36472% 74% 76% 75% 69% 77% 73% - - 60% 62% 61% 67% 67% 67% 60% 72% 68% 68% 61% 67% 71% 59% 78% 62%
eJKLM EJKLM AEgJKLM aEJKLM JKL AEGJKLM EJKLM JKL P P p T WY
Local media
1546 1532 1664 1596 1509 1537 1515 - - 1367 1307 1347 1310 623 686 329 350 323 308 370 217 664 443 521 34675% 76% 82% 79% 76% 76% 75% - - 66% 67% 68% 67% 65% 68% 57% 70% 68% 73% 61% 66% 71% 67% 73% 59%
JKLM JKLM ABDEFGJKLM AbEfGJKLM JKLM JKLM JKLM P P P T Y WY
My governor
- - - - - - 1416 - - 1330 1263 1342 1299 624 675 380 368 300 251 371 215 663 344 603 352- - - - - - 70% - - 64% 64% 67% 66% 66% 67% 66% 74% 63% 60% 61% 65% 71% 52% 85% 59%
JKM s PRS T WY W
International healthorganizations (e.g., WorldHealth Organization)
1534 1566 1620 1616 1408 1436 1433 - - 1277 1226 1246 1255 597 658 346 344 295 271 342 204 668 451 476 32875% 78% 80% 80% 71% 71% 71% - - 62% 63% 62% 64% 63% 65% 60% 69% 62% 64% 56% 62% 71% 68% 67% 56%
EfGJKLM EFGJKLM AEFGJKLM AEFGJKLM JKLM JKLM JKLM Pr TU Y Y
GovernmentPSA’s/website
1335 1317 1377 1381 1198 1301 1276 - - 1108 1093 1039 1140 548 592 325 337 255 224 325 179 591 311 531 29965% 65% 68% 69% 60% 65% 63% - - 54% 56% 52% 58% 58% 58% 57% 68% 54% 53% 53% 54% 63% 47% 75% 51%
EJKLM EJKLM EfGJKLM abEFGJKLM JKL EJKLM JKLM l JL PRS TU WY
National media
1168 1235 1262 1240 1050 1086 1112 - - 1029 998 905 956 460 496 267 283 201 205 277 147 505 520 188 24857% 61% 62% 62% 53% 54% 55% - - 50% 51% 45% 49% 48% 49% 47% 57% 42% 49% 45% 45% 54% 78% 27% 42%
EJKLM AEFGJKLM AEFGJKLM AEFGJKLM LM JLM JkLM L L PRS TU XY X
The WhiteHouse/President
- - - - - - 876 - - 963 925 899 944 492 452 287 326 229 102 211 151 545 335 371 238- - - - - - 43% - - 47% 47% 45% 48% 52% 45% 50% 66% 48% 24% 35% 46% 58% 50% 52% 40%
g G G O S PRS S T TU Y Y
My employer
__________________________________________________________________________________________________________________Proportions/Means: Columns Tested (5%, 10% risk level) - A/B/C/D/E/F/G/H/I/J/K/L/M - N/O - P/Q/R/S - T/U/V - W/X/YOverlap formulae used. ** very small base (under 30) ineligible for sig testing

Page 140Fielding Period: March 14 - May 31, 2020COVID-19Weighted To The U.S. General Adult Population - Propensity
2 Jun 2020Table 137Q24 How trustworthy do you think each of the following sources are to provide accurate information regarding the coronavirus outbreak?
Summary Of Trustworthy
Base: All Respondents
Waves Gender Age Income Political
Wave 2 Wave 3 Wave 4 Wave 5 Wave 6 Wave 7 Wave 8 Wave 9 Wave 10 Wave 11 Wave 12 Wave 13 Wave 14 Less(3/14 - (3/17 - (3/21 - (3/28 - (4/3 - (4/11- (4/18- (4/25- (5/1 - (5/8 - (5/15 - (5/27 - (5/29 - than $50k -3/15) 3/18) 3/23) 3/30) 4/5) 4/13) 4/20) 4/27) 5/3) 5/10) 5/17) 5/28) 5/31) MALE FEMALE 18-34 35-49 50-64 65+ $50k $75k $75k+ GOP DEM IND/OTH
(A) (B) (C) (D) (E) (F) (G) (H) (I) (J) (K) (L) (M) (N) (O) (P) (Q) (R) (S) (T) (U) (V) (W) (X) (Y)
2050 2019 2023 2016 1993 2013 2029 -** -** 2066 1961 1996 1965 952 1013 573 497 474 421 609 329 935 665 709 591Weighted Base759 689 753 797 689 812 795 - - 684 639 577 676 343 333 231 234 119 92 197 98 356 233 296 147
37% 34% 37% 40% 35% 40% 39% - - 33% 33% 29% 34% 36% 33% 40% 47% 25% 22% 32% 30% 38% 35% 42% 25%JKL L JKL BEJKLM L aBEJKLM BEJKLM L l L RS pRS tU Y WY
Social media (e.g.,Facebook, Instagram)
- - - - 453 429 445 - - 431 428 396 441 248 194 188 159 71 24 102 53 274 137 174 130- - - - 23% 21% 22% - - 21% 22% 20% 22% 26% 19% 33% 32% 15% 6% 17% 16% 29% 21% 25% 22%
l O RS RS S TU
Chinese President, XiJinping
__________________________________________________________________________________________________________________Proportions/Means: Columns Tested (5%, 10% risk level) - A/B/C/D/E/F/G/H/I/J/K/L/M - N/O - P/Q/R/S - T/U/V - W/X/YOverlap formulae used. ** very small base (under 30) ineligible for sig testing
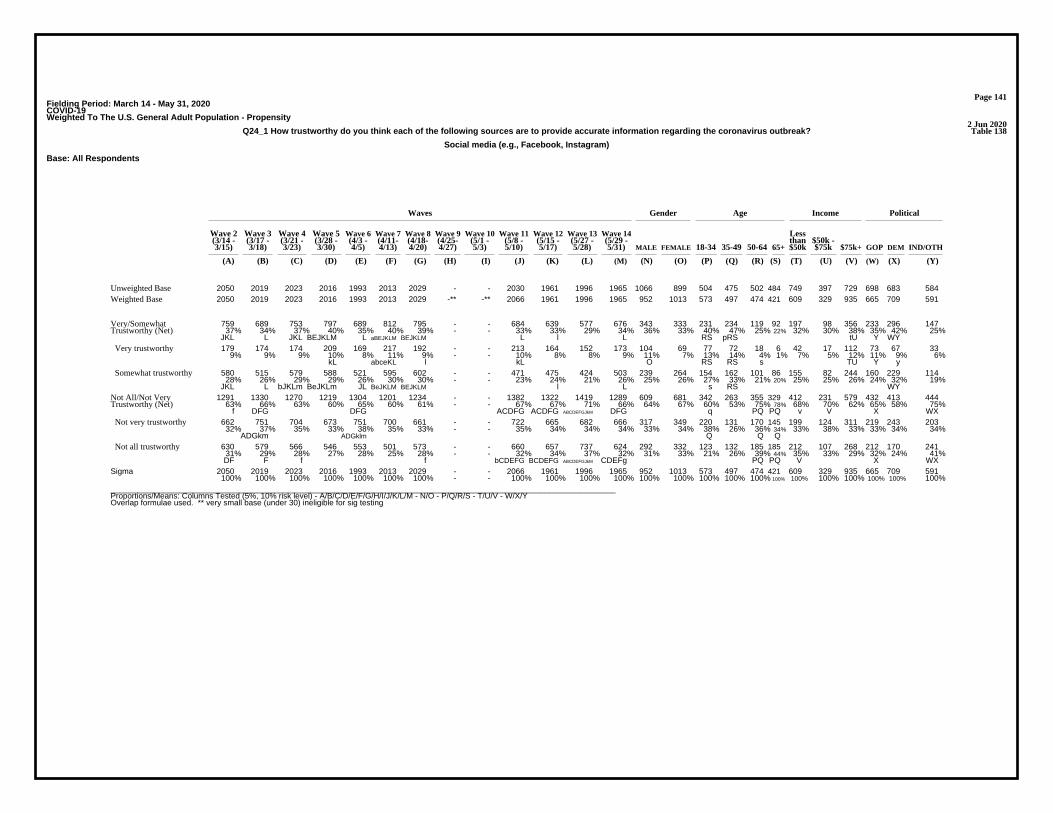
Page 141Fielding Period: March 14 - May 31, 2020COVID-19Weighted To The U.S. General Adult Population - Propensity
2 Jun 2020Table 138Q24_1 How trustworthy do you think each of the following sources are to provide accurate information regarding the coronavirus outbreak?
Social media (e.g., Facebook, Instagram)
Base: All Respondents
Waves Gender Age Income Political
Wave 2 Wave 3 Wave 4 Wave 5 Wave 6 Wave 7 Wave 8 Wave 9 Wave 10 Wave 11 Wave 12 Wave 13 Wave 14 Less(3/14 - (3/17 - (3/21 - (3/28 - (4/3 - (4/11- (4/18- (4/25- (5/1 - (5/8 - (5/15 - (5/27 - (5/29 - than $50k -3/15) 3/18) 3/23) 3/30) 4/5) 4/13) 4/20) 4/27) 5/3) 5/10) 5/17) 5/28) 5/31) MALE FEMALE 18-34 35-49 50-64 65+ $50k $75k $75k+ GOP DEM IND/OTH
(A) (B) (C) (D) (E) (F) (G) (H) (I) (J) (K) (L) (M) (N) (O) (P) (Q) (R) (S) (T) (U) (V) (W) (X) (Y)
2050 2019 2023 2016 1993 2013 2029 - - 2030 1961 1996 1965 1066 899 504 475 502 484 749 397 729 698 683 584Unweighted Base2050 2019 2023 2016 1993 2013 2029 -** -** 2066 1961 1996 1965 952 1013 573 497 474 421 609 329 935 665 709 591Weighted Base
759 689 753 797 689 812 795 - - 684 639 577 676 343 333 231 234 119 92 197 98 356 233 296 14737% 34% 37% 40% 35% 40% 39% - - 33% 33% 29% 34% 36% 33% 40% 47% 25% 22% 32% 30% 38% 35% 42% 25%
JKL L JKL BEJKLM L aBEJKLM BEJKLM L l L RS pRS tU Y WY
Very/SomewhatTrustworthy (Net)
179 174 174 209 169 217 192 - - 213 164 152 173 104 69 77 72 18 6 42 17 112 73 67 339% 9% 9% 10% 8% 11% 9% - - 10% 8% 8% 9% 11% 7% 13% 14% 4% 1% 7% 5% 12% 11% 9% 6%
kL abceKL l kL O RS RS s TU Y y
Very trustworthy
580 515 579 588 521 595 602 - - 471 475 424 503 239 264 154 162 101 86 155 82 244 160 229 11428% 26% 29% 29% 26% 30% 30% - - 23% 24% 21% 26% 25% 26% 27% 33% 21% 20% 25% 25% 26% 24% 32% 19%
JKL L bJKLm BeJKLm JL BeJKLM BEJKLM l L s RS WY
Somewhat trustworthy
1291 1330 1270 1219 1304 1201 1234 - - 1382 1322 1419 1289 609 681 342 263 355 329 412 231 579 432 413 44463% 66% 63% 60% 65% 60% 61% - - 67% 67% 71% 66% 64% 67% 60% 53% 75% 78% 68% 70% 62% 65% 58% 75%
f DFG DFG ACDFG ACDFG ABCDEFGJkM DFG q PQ PQ v V X WX
Not All/Not VeryTrustworthy (Net)
662 751 704 673 751 700 661 - - 722 665 682 666 317 349 220 131 170 145 199 124 311 219 243 20332% 37% 35% 33% 38% 35% 33% - - 35% 34% 34% 34% 33% 34% 38% 26% 36% 34% 33% 38% 33% 33% 34% 34%
ADGkm ADGklm Q Q Q
Not very trustworthy
630 579 566 546 553 501 573 - - 660 657 737 624 292 332 123 132 185 185 212 107 268 212 170 24131% 29% 28% 27% 28% 25% 28% - - 32% 34% 37% 32% 31% 33% 21% 26% 39% 44% 35% 33% 29% 32% 24% 41%DF F f f bCDEFG BCDEFG ABCDEFGJkM CDEFg PQ PQ V X WX
Not all trustworthy
2050 2019 2023 2016 1993 2013 2029 - - 2066 1961 1996 1965 952 1013 573 497 474 421 609 329 935 665 709 591100% 100% 100% 100% 100% 100% 100% - - 100% 100% 100% 100% 100% 100% 100% 100% 100% 100% 100% 100% 100% 100% 100% 100%
Sigma
__________________________________________________________________________________________________________________Proportions/Means: Columns Tested (5%, 10% risk level) - A/B/C/D/E/F/G/H/I/J/K/L/M - N/O - P/Q/R/S - T/U/V - W/X/YOverlap formulae used. ** very small base (under 30) ineligible for sig testing
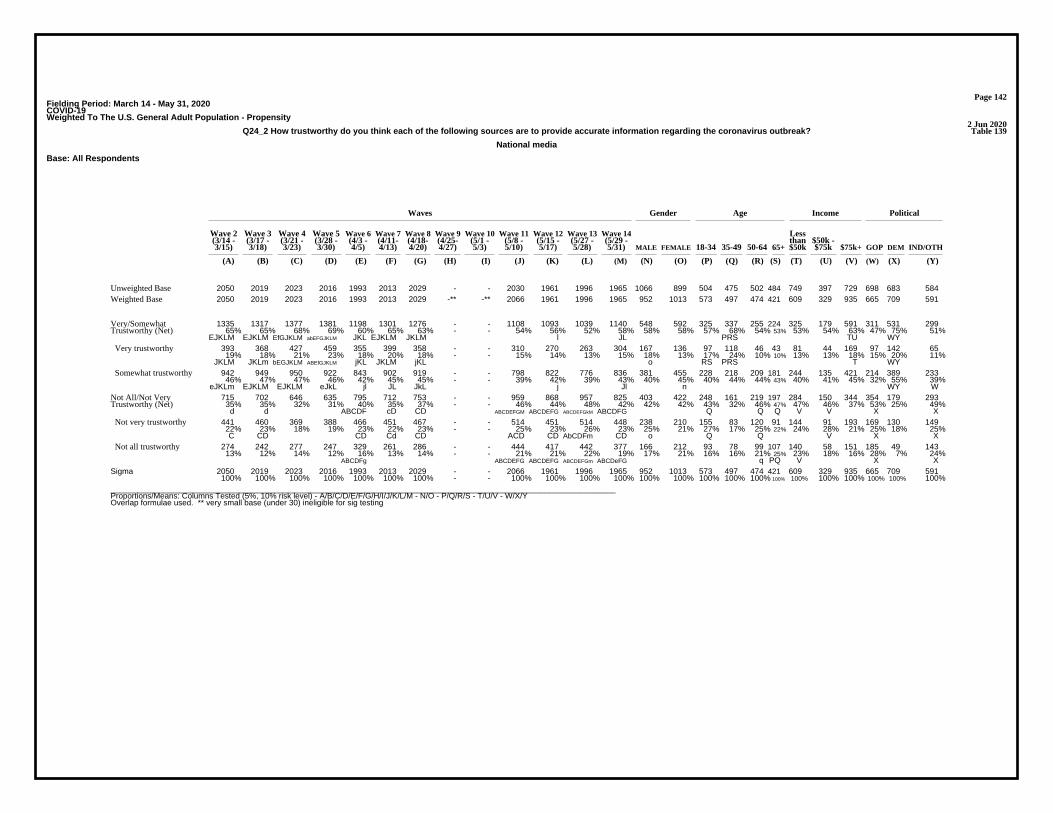
Page 142Fielding Period: March 14 - May 31, 2020COVID-19Weighted To The U.S. General Adult Population - Propensity
2 Jun 2020Table 139Q24_2 How trustworthy do you think each of the following sources are to provide accurate information regarding the coronavirus outbreak?
National media
Base: All Respondents
Waves Gender Age Income Political
Wave 2 Wave 3 Wave 4 Wave 5 Wave 6 Wave 7 Wave 8 Wave 9 Wave 10 Wave 11 Wave 12 Wave 13 Wave 14 Less(3/14 - (3/17 - (3/21 - (3/28 - (4/3 - (4/11- (4/18- (4/25- (5/1 - (5/8 - (5/15 - (5/27 - (5/29 - than $50k -3/15) 3/18) 3/23) 3/30) 4/5) 4/13) 4/20) 4/27) 5/3) 5/10) 5/17) 5/28) 5/31) MALE FEMALE 18-34 35-49 50-64 65+ $50k $75k $75k+ GOP DEM IND/OTH
(A) (B) (C) (D) (E) (F) (G) (H) (I) (J) (K) (L) (M) (N) (O) (P) (Q) (R) (S) (T) (U) (V) (W) (X) (Y)
2050 2019 2023 2016 1993 2013 2029 - - 2030 1961 1996 1965 1066 899 504 475 502 484 749 397 729 698 683 584Unweighted Base2050 2019 2023 2016 1993 2013 2029 -** -** 2066 1961 1996 1965 952 1013 573 497 474 421 609 329 935 665 709 591Weighted Base
1335 1317 1377 1381 1198 1301 1276 - - 1108 1093 1039 1140 548 592 325 337 255 224 325 179 591 311 531 29965% 65% 68% 69% 60% 65% 63% - - 54% 56% 52% 58% 58% 58% 57% 68% 54% 53% 53% 54% 63% 47% 75% 51%
EJKLM EJKLM EfGJKLM abEFGJKLM JKL EJKLM JKLM l JL PRS TU WY
Very/SomewhatTrustworthy (Net)
393 368 427 459 355 399 358 - - 310 270 263 304 167 136 97 118 46 43 81 44 169 97 142 6519% 18% 21% 23% 18% 20% 18% - - 15% 14% 13% 15% 18% 13% 17% 24% 10% 10% 13% 13% 18% 15% 20% 11%
JKLM JKLm bEGJKLM ABEfGJKLM jKL JKLM jKL o RS PRS T WY
Very trustworthy
942 949 950 922 843 902 919 - - 798 822 776 836 381 455 228 218 209 181 244 135 421 214 389 23346% 47% 47% 46% 42% 45% 45% - - 39% 42% 39% 43% 40% 45% 40% 44% 44% 43% 40% 41% 45% 32% 55% 39%
eJKLm EJKLM EJKLM eJkL jl JL JkL j Jl n WY W
Somewhat trustworthy
715 702 646 635 795 712 753 - - 959 868 957 825 403 422 248 161 219 197 284 150 344 354 179 29335% 35% 32% 31% 40% 35% 37% - - 46% 44% 48% 42% 42% 42% 43% 32% 46% 47% 47% 46% 37% 53% 25% 49%
d d ABCDF cD CD ABCDEFGM ABCDEFG ABCDEFGkM ABCDFG Q Q Q V V X X
Not All/Not VeryTrustworthy (Net)
441 460 369 388 466 451 467 - - 514 451 514 448 238 210 155 83 120 91 144 91 193 169 130 14922% 23% 18% 19% 23% 22% 23% - - 25% 23% 26% 23% 25% 21% 27% 17% 25% 22% 24% 28% 21% 25% 18% 25%C CD CD Cd CD ACD CD AbCDFm CD o Q Q V X X
Not very trustworthy
274 242 277 247 329 261 286 - - 444 417 442 377 166 212 93 78 99 107 140 58 151 185 49 14313% 12% 14% 12% 16% 13% 14% - - 21% 21% 22% 19% 17% 21% 16% 16% 21% 25% 23% 18% 16% 28% 7% 24%
ABCDFg ABCDEFG ABCDEFG ABCDEFGm ABCDeFG q PQ V X X
Not all trustworthy
2050 2019 2023 2016 1993 2013 2029 - - 2066 1961 1996 1965 952 1013 573 497 474 421 609 329 935 665 709 591100% 100% 100% 100% 100% 100% 100% - - 100% 100% 100% 100% 100% 100% 100% 100% 100% 100% 100% 100% 100% 100% 100% 100%
Sigma
__________________________________________________________________________________________________________________Proportions/Means: Columns Tested (5%, 10% risk level) - A/B/C/D/E/F/G/H/I/J/K/L/M - N/O - P/Q/R/S - T/U/V - W/X/YOverlap formulae used. ** very small base (under 30) ineligible for sig testing
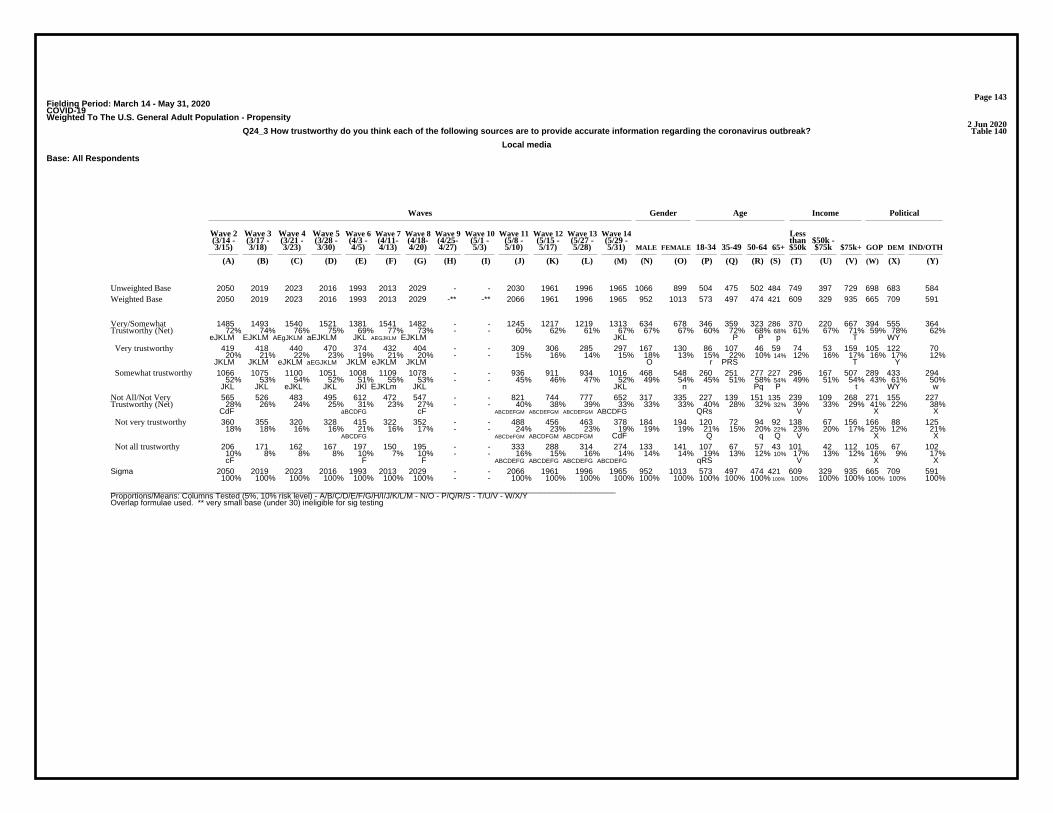
Page 143Fielding Period: March 14 - May 31, 2020COVID-19Weighted To The U.S. General Adult Population - Propensity
2 Jun 2020Table 140Q24_3 How trustworthy do you think each of the following sources are to provide accurate information regarding the coronavirus outbreak?
Local media
Base: All Respondents
Waves Gender Age Income Political
Wave 2 Wave 3 Wave 4 Wave 5 Wave 6 Wave 7 Wave 8 Wave 9 Wave 10 Wave 11 Wave 12 Wave 13 Wave 14 Less(3/14 - (3/17 - (3/21 - (3/28 - (4/3 - (4/11- (4/18- (4/25- (5/1 - (5/8 - (5/15 - (5/27 - (5/29 - than $50k -3/15) 3/18) 3/23) 3/30) 4/5) 4/13) 4/20) 4/27) 5/3) 5/10) 5/17) 5/28) 5/31) MALE FEMALE 18-34 35-49 50-64 65+ $50k $75k $75k+ GOP DEM IND/OTH
(A) (B) (C) (D) (E) (F) (G) (H) (I) (J) (K) (L) (M) (N) (O) (P) (Q) (R) (S) (T) (U) (V) (W) (X) (Y)
2050 2019 2023 2016 1993 2013 2029 - - 2030 1961 1996 1965 1066 899 504 475 502 484 749 397 729 698 683 584Unweighted Base2050 2019 2023 2016 1993 2013 2029 -** -** 2066 1961 1996 1965 952 1013 573 497 474 421 609 329 935 665 709 591Weighted Base
1485 1493 1540 1521 1381 1541 1482 - - 1245 1217 1219 1313 634 678 346 359 323 286 370 220 667 394 555 36472% 74% 76% 75% 69% 77% 73% - - 60% 62% 61% 67% 67% 67% 60% 72% 68% 68% 61% 67% 71% 59% 78% 62%
eJKLM EJKLM AEgJKLM aEJKLM JKL AEGJKLM EJKLM JKL P P p T WY
Very/SomewhatTrustworthy (Net)
419 418 440 470 374 432 404 - - 309 306 285 297 167 130 86 107 46 59 74 53 159 105 122 7020% 21% 22% 23% 19% 21% 20% - - 15% 16% 14% 15% 18% 13% 15% 22% 10% 14% 12% 16% 17% 16% 17% 12%
JKLM JKLM eJKLM aEGJKLM JKLM eJKLM JKLM O r PRS T Y
Very trustworthy
1066 1075 1100 1051 1008 1109 1078 - - 936 911 934 1016 468 548 260 251 277 227 296 167 507 289 433 29452% 53% 54% 52% 51% 55% 53% - - 45% 46% 47% 52% 49% 54% 45% 51% 58% 54% 49% 51% 54% 43% 61% 50%
JKL JKL eJKL JKL JKl EJKLm JKL JKL n Pq P t WY w
Somewhat trustworthy
565 526 483 495 612 472 547 - - 821 744 777 652 317 335 227 139 151 135 239 109 268 271 155 22728% 26% 24% 25% 31% 23% 27% - - 40% 38% 39% 33% 33% 33% 40% 28% 32% 32% 39% 33% 29% 41% 22% 38%
CdF aBCDFG cF ABCDEFGM ABCDEFGM ABCDEFGM ABCDFG QRs V X X
Not All/Not VeryTrustworthy (Net)
360 355 320 328 415 322 352 - - 488 456 463 378 184 194 120 72 94 92 138 67 156 166 88 12518% 18% 16% 16% 21% 16% 17% - - 24% 23% 23% 19% 19% 19% 21% 15% 20% 22% 23% 20% 17% 25% 12% 21%
ABCDFG ABCDeFGM ABCDFGM ABCDFGM CdF Q q Q V X X
Not very trustworthy
206 171 162 167 197 150 195 - - 333 288 314 274 133 141 107 67 57 43 101 42 112 105 67 10210% 8% 8% 8% 10% 7% 10% - - 16% 15% 16% 14% 14% 14% 19% 13% 12% 10% 17% 13% 12% 16% 9% 17%cF F F ABCDEFG ABCDEFG ABCDEFG ABCDEFG qRS V X X
Not all trustworthy
2050 2019 2023 2016 1993 2013 2029 - - 2066 1961 1996 1965 952 1013 573 497 474 421 609 329 935 665 709 591100% 100% 100% 100% 100% 100% 100% - - 100% 100% 100% 100% 100% 100% 100% 100% 100% 100% 100% 100% 100% 100% 100% 100%
Sigma
__________________________________________________________________________________________________________________Proportions/Means: Columns Tested (5%, 10% risk level) - A/B/C/D/E/F/G/H/I/J/K/L/M - N/O - P/Q/R/S - T/U/V - W/X/YOverlap formulae used. ** very small base (under 30) ineligible for sig testing
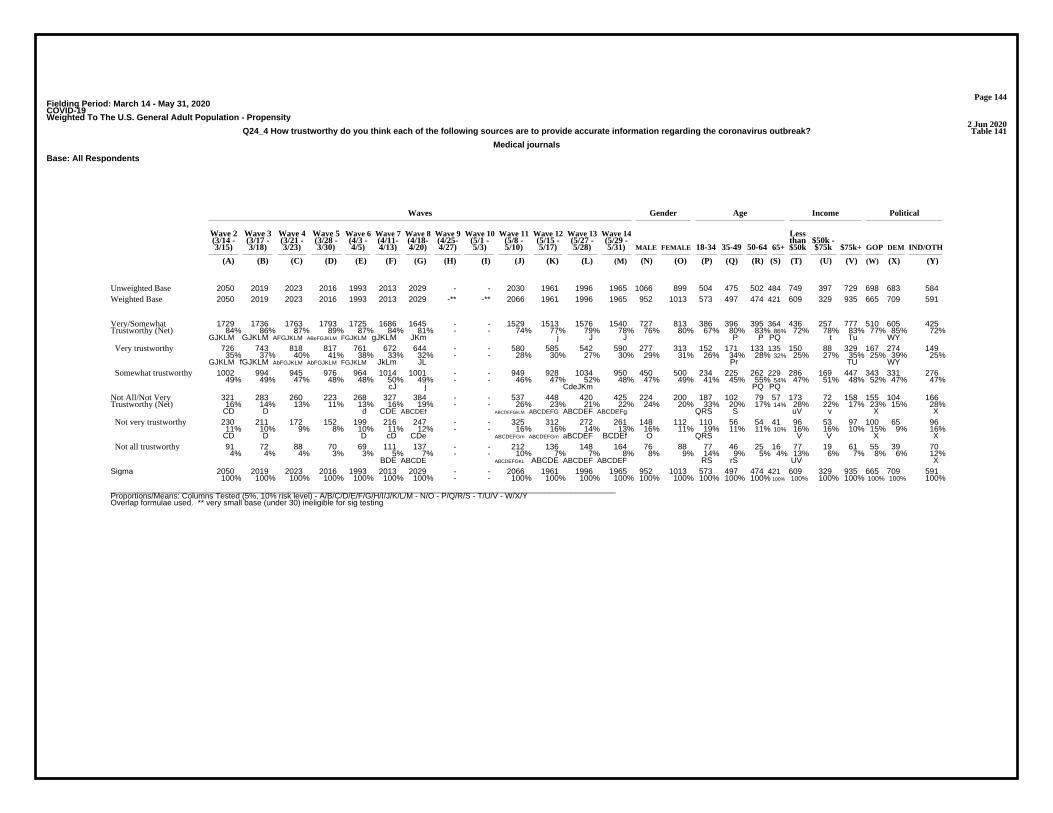
Page 144Fielding Period: March 14 - May 31, 2020COVID-19Weighted To The U.S. General Adult Population - Propensity
2 Jun 2020Table 141Q24_4 How trustworthy do you think each of the following sources are to provide accurate information regarding the coronavirus outbreak?
Medical journals
Base: All Respondents
Waves Gender Age Income Political
Wave 2 Wave 3 Wave 4 Wave 5 Wave 6 Wave 7 Wave 8 Wave 9 Wave 10 Wave 11 Wave 12 Wave 13 Wave 14 Less(3/14 - (3/17 - (3/21 - (3/28 - (4/3 - (4/11- (4/18- (4/25- (5/1 - (5/8 - (5/15 - (5/27 - (5/29 - than $50k -3/15) 3/18) 3/23) 3/30) 4/5) 4/13) 4/20) 4/27) 5/3) 5/10) 5/17) 5/28) 5/31) MALE FEMALE 18-34 35-49 50-64 65+ $50k $75k $75k+ GOP DEM IND/OTH
(A) (B) (C) (D) (E) (F) (G) (H) (I) (J) (K) (L) (M) (N) (O) (P) (Q) (R) (S) (T) (U) (V) (W) (X) (Y)
2050 2019 2023 2016 1993 2013 2029 - - 2030 1961 1996 1965 1066 899 504 475 502 484 749 397 729 698 683 584Unweighted Base2050 2019 2023 2016 1993 2013 2029 -** -** 2066 1961 1996 1965 952 1013 573 497 474 421 609 329 935 665 709 591Weighted Base
1729 1736 1763 1793 1725 1686 1645 - - 1529 1513 1576 1540 727 813 386 396 395 364 436 257 777 510 605 42584% 86% 87% 89% 87% 84% 81% - - 74% 77% 79% 78% 76% 80% 67% 80% 83% 86% 72% 78% 83% 77% 85% 72%
GJKLM GJKLM AFGJKLM ABeFGJKLM FGJKLM gJKLM JKm j J J P P PQ t Tu WY
Very/SomewhatTrustworthy (Net)
726 743 818 817 761 672 644 - - 580 585 542 590 277 313 152 171 133 135 150 88 329 167 274 14935% 37% 40% 41% 38% 33% 32% - - 28% 30% 27% 30% 29% 31% 26% 34% 28% 32% 25% 27% 35% 25% 39% 25%
GJKLM fGJKLM AbFGJKLM AbFGJKLM FGJKLM JkLm JL Pr TU WY
Very trustworthy
1002 994 945 976 964 1014 1001 - - 949 928 1034 950 450 500 234 225 262 229 286 169 447 343 331 27649% 49% 47% 48% 48% 50% 49% - - 46% 47% 52% 48% 47% 49% 41% 45% 55% 54% 47% 51% 48% 52% 47% 47%
cJ j CdeJKm PQ PQ
Somewhat trustworthy
321 283 260 223 268 327 384 - - 537 448 420 425 224 200 187 102 79 57 173 72 158 155 104 16616% 14% 13% 11% 13% 16% 19% - - 26% 23% 21% 22% 24% 20% 33% 20% 17% 14% 28% 22% 17% 23% 15% 28%
CD D d CDE ABCDEf ABCDEFGkLM ABCDEFG ABCDEF ABCDEFg QRS S uV v X X
Not All/Not VeryTrustworthy (Net)
230 211 172 152 199 216 247 - - 325 312 272 261 148 112 110 56 54 41 96 53 97 100 65 9611% 10% 9% 8% 10% 11% 12% - - 16% 16% 14% 13% 16% 11% 19% 11% 11% 10% 16% 16% 10% 15% 9% 16%
CD D D cD CDe ABCDEFGm ABCDEFGm aBCDEF BCDEf O QRS V V X X
Not very trustworthy
91 72 88 70 69 111 137 - - 212 136 148 164 76 88 77 46 25 16 77 19 61 55 39 704% 4% 4% 3% 3% 5% 7% - - 10% 7% 7% 8% 8% 9% 14% 9% 5% 4% 13% 6% 7% 8% 6% 12%
BDE ABCDE ABCDEFGKL ABCDE ABCDEF ABCDEF RS rS UV X
Not all trustworthy
2050 2019 2023 2016 1993 2013 2029 - - 2066 1961 1996 1965 952 1013 573 497 474 421 609 329 935 665 709 591100% 100% 100% 100% 100% 100% 100% - - 100% 100% 100% 100% 100% 100% 100% 100% 100% 100% 100% 100% 100% 100% 100% 100%
Sigma
__________________________________________________________________________________________________________________Proportions/Means: Columns Tested (5%, 10% risk level) - A/B/C/D/E/F/G/H/I/J/K/L/M - N/O - P/Q/R/S - T/U/V - W/X/YOverlap formulae used. ** very small base (under 30) ineligible for sig testing

Page 145Fielding Period: March 14 - May 31, 2020COVID-19Weighted To The U.S. General Adult Population - Propensity
2 Jun 2020Table 142Q24_5 How trustworthy do you think each of the following sources are to provide accurate information regarding the coronavirus outbreak?
Government PSA’s/website
Base: All Respondents
Waves Gender Age Income Political
Wave 2 Wave 3 Wave 4 Wave 5 Wave 6 Wave 7 Wave 8 Wave 9 Wave 10 Wave 11 Wave 12 Wave 13 Wave 14 Less(3/14 - (3/17 - (3/21 - (3/28 - (4/3 - (4/11- (4/18- (4/25- (5/1 - (5/8 - (5/15 - (5/27 - (5/29 - than $50k -3/15) 3/18) 3/23) 3/30) 4/5) 4/13) 4/20) 4/27) 5/3) 5/10) 5/17) 5/28) 5/31) MALE FEMALE 18-34 35-49 50-64 65+ $50k $75k $75k+ GOP DEM IND/OTH
(A) (B) (C) (D) (E) (F) (G) (H) (I) (J) (K) (L) (M) (N) (O) (P) (Q) (R) (S) (T) (U) (V) (W) (X) (Y)
2050 2019 2023 2016 1993 2013 2029 - - 2030 1961 1996 1965 1066 899 504 475 502 484 749 397 729 698 683 584Unweighted Base2050 2019 2023 2016 1993 2013 2029 -** -** 2066 1961 1996 1965 952 1013 573 497 474 421 609 329 935 665 709 591Weighted Base
1534 1566 1620 1616 1408 1436 1433 - - 1277 1226 1246 1255 597 658 346 344 295 271 342 204 668 451 476 32875% 78% 80% 80% 71% 71% 71% - - 62% 63% 62% 64% 63% 65% 60% 69% 62% 64% 56% 62% 71% 68% 67% 56%
EfGJKLM EFGJKLM AEFGJKLM AEFGJKLM JKLM JKLM JKLM Pr TU Y Y
Very/SomewhatTrustworthy (Net)
502 463 571 550 414 383 378 - - 335 289 278 288 159 129 113 87 53 35 71 44 167 115 107 6625% 23% 28% 27% 21% 19% 19% - - 16% 15% 14% 15% 17% 13% 20% 18% 11% 8% 12% 13% 18% 17% 15% 11%
EFGJKLM FGJKLM ABEFGJKLM BEFGJKLM JKLM jKLM KLM o RS RS T Y
Very trustworthy
1032 1103 1049 1066 994 1053 1055 - - 941 937 968 967 438 529 233 257 242 236 271 160 501 336 369 26350% 55% 52% 53% 50% 52% 52% - - 46% 48% 49% 49% 46% 52% 41% 52% 51% 56% 44% 49% 54% 51% 52% 44%
J AEJKLM JKl JKLm J JKl JKl j N P P P T y Y
Somewhat trustworthy
516 453 403 400 585 577 596 - - 790 735 750 710 354 355 228 154 178 150 267 125 267 214 233 26325% 22% 20% 20% 29% 29% 29% - - 38% 37% 38% 36% 37% 35% 40% 31% 38% 36% 44% 38% 29% 32% 33% 44%
CD ABCD aBCD ABCD ABCDEFG ABCDEFG ABCDEFG ABCDEFG Q q V V WX
Not All/Not VeryTrustworthy (Net)
360 313 271 272 382 427 369 - - 469 469 488 468 249 219 153 92 117 107 155 94 191 150 151 16718% 16% 13% 13% 19% 21% 18% - - 23% 24% 24% 24% 26% 22% 27% 18% 25% 25% 25% 29% 20% 23% 21% 28%
CD BCD ABCDg bCD ABCDEG ABCDEG ABCDEfG ABCDEG o Q q Q v V wX
Not very trustworthy
156 140 133 128 203 150 227 - - 321 266 262 242 106 136 75 62 62 43 112 31 76 64 82 968% 7% 7% 6% 10% 7% 11% - - 16% 14% 13% 12% 11% 13% 13% 12% 13% 10% 18% 9% 8% 10% 12% 16%
ABCDF ABCDF ABCDEFGlM ABCDEFg ABCDEF ABCDF UV Wx
Not all trustworthy
2050 2019 2023 2016 1993 2013 2029 - - 2066 1961 1996 1965 952 1013 573 497 474 421 609 329 935 665 709 591100% 100% 100% 100% 100% 100% 100% - - 100% 100% 100% 100% 100% 100% 100% 100% 100% 100% 100% 100% 100% 100% 100% 100%
Sigma
__________________________________________________________________________________________________________________Proportions/Means: Columns Tested (5%, 10% risk level) - A/B/C/D/E/F/G/H/I/J/K/L/M - N/O - P/Q/R/S - T/U/V - W/X/YOverlap formulae used. ** very small base (under 30) ineligible for sig testing
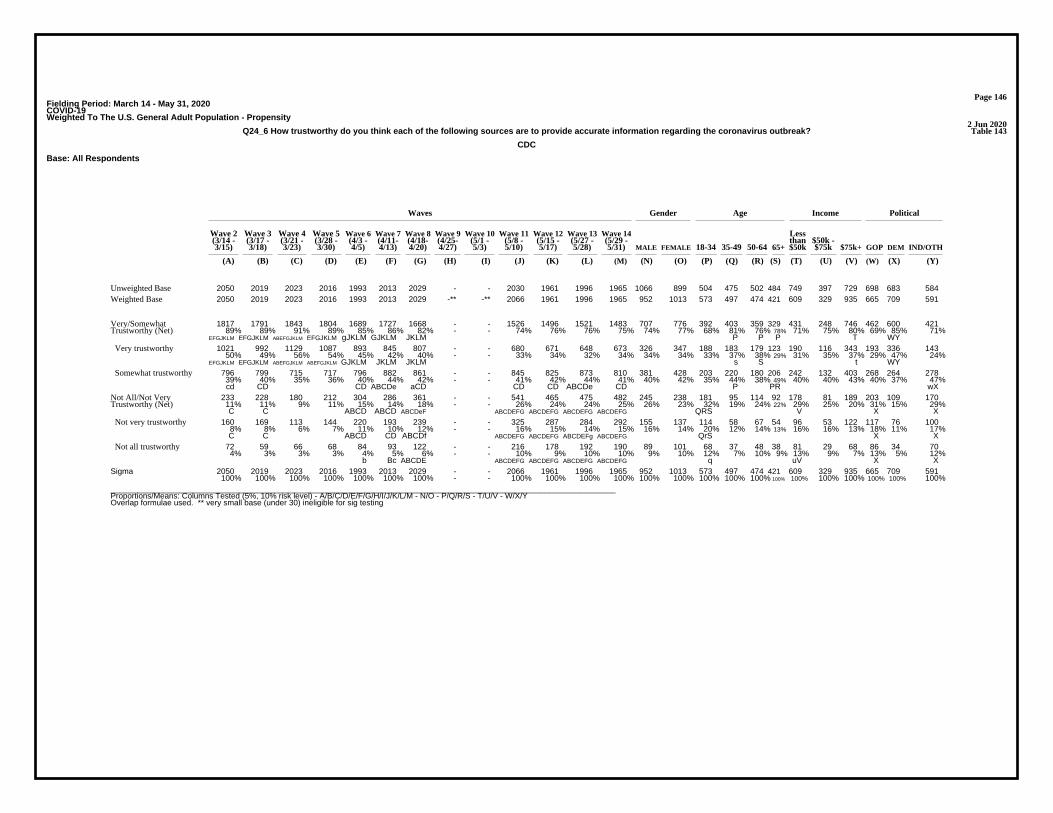
Page 146Fielding Period: March 14 - May 31, 2020COVID-19Weighted To The U.S. General Adult Population - Propensity
2 Jun 2020Table 143Q24_6 How trustworthy do you think each of the following sources are to provide accurate information regarding the coronavirus outbreak?
CDC
Base: All Respondents
Waves Gender Age Income Political
Wave 2 Wave 3 Wave 4 Wave 5 Wave 6 Wave 7 Wave 8 Wave 9 Wave 10 Wave 11 Wave 12 Wave 13 Wave 14 Less(3/14 - (3/17 - (3/21 - (3/28 - (4/3 - (4/11- (4/18- (4/25- (5/1 - (5/8 - (5/15 - (5/27 - (5/29 - than $50k -3/15) 3/18) 3/23) 3/30) 4/5) 4/13) 4/20) 4/27) 5/3) 5/10) 5/17) 5/28) 5/31) MALE FEMALE 18-34 35-49 50-64 65+ $50k $75k $75k+ GOP DEM IND/OTH
(A) (B) (C) (D) (E) (F) (G) (H) (I) (J) (K) (L) (M) (N) (O) (P) (Q) (R) (S) (T) (U) (V) (W) (X) (Y)
2050 2019 2023 2016 1993 2013 2029 - - 2030 1961 1996 1965 1066 899 504 475 502 484 749 397 729 698 683 584Unweighted Base2050 2019 2023 2016 1993 2013 2029 -** -** 2066 1961 1996 1965 952 1013 573 497 474 421 609 329 935 665 709 591Weighted Base
1817 1791 1843 1804 1689 1727 1668 - - 1526 1496 1521 1483 707 776 392 403 359 329 431 248 746 462 600 42189% 89% 91% 89% 85% 86% 82% - - 74% 76% 76% 75% 74% 77% 68% 81% 76% 78% 71% 75% 80% 69% 85% 71%
EFGJKLM EFGJKLM ABEFGJKLM EFGJKLM gJKLM GJKLM JKLM P P P T WY
Very/SomewhatTrustworthy (Net)
1021 992 1129 1087 893 845 807 - - 680 671 648 673 326 347 188 183 179 123 190 116 343 193 336 14350% 49% 56% 54% 45% 42% 40% - - 33% 34% 32% 34% 34% 34% 33% 37% 38% 29% 31% 35% 37% 29% 47% 24%
EFGJKLM EFGJKLM ABEFGJKLM ABEFGJKLM GJKLM JKLM JKLM s S t WY
Very trustworthy
796 799 715 717 796 882 861 - - 845 825 873 810 381 428 203 220 180 206 242 132 403 268 264 27839% 40% 35% 36% 40% 44% 42% - - 41% 42% 44% 41% 40% 42% 35% 44% 38% 49% 40% 40% 43% 40% 37% 47%cd CD CD ABCDe aCD CD CD ABCDe CD P PR wX
Somewhat trustworthy
233 228 180 212 304 286 361 - - 541 465 475 482 245 238 181 95 114 92 178 81 189 203 109 17011% 11% 9% 11% 15% 14% 18% - - 26% 24% 24% 25% 26% 23% 32% 19% 24% 22% 29% 25% 20% 31% 15% 29%C C ABCD ABCD ABCDeF ABCDEFG ABCDEFG ABCDEFG ABCDEFG QRS V X X
Not All/Not VeryTrustworthy (Net)
160 169 113 144 220 193 239 - - 325 287 284 292 155 137 114 58 67 54 96 53 122 117 76 1008% 8% 6% 7% 11% 10% 12% - - 16% 15% 14% 15% 16% 14% 20% 12% 14% 13% 16% 16% 13% 18% 11% 17%C C ABCD CD ABCDf ABCDEFG ABCDEFG ABCDEFg ABCDEFG QrS X X
Not very trustworthy
72 59 66 68 84 93 122 - - 216 178 192 190 89 101 68 37 48 38 81 29 68 86 34 704% 3% 3% 3% 4% 5% 6% - - 10% 9% 10% 10% 9% 10% 12% 7% 10% 9% 13% 9% 7% 13% 5% 12%
b Bc ABCDE ABCDEFG ABCDEFG ABCDEFG ABCDEFG q uV X X
Not all trustworthy
2050 2019 2023 2016 1993 2013 2029 - - 2066 1961 1996 1965 952 1013 573 497 474 421 609 329 935 665 709 591100% 100% 100% 100% 100% 100% 100% - - 100% 100% 100% 100% 100% 100% 100% 100% 100% 100% 100% 100% 100% 100% 100% 100%
Sigma
__________________________________________________________________________________________________________________Proportions/Means: Columns Tested (5%, 10% risk level) - A/B/C/D/E/F/G/H/I/J/K/L/M - N/O - P/Q/R/S - T/U/V - W/X/YOverlap formulae used. ** very small base (under 30) ineligible for sig testing

Page 147Fielding Period: March 14 - May 31, 2020COVID-19Weighted To The U.S. General Adult Population - Propensity
2 Jun 2020Table 144Q24_7 How trustworthy do you think each of the following sources are to provide accurate information regarding the coronavirus outbreak?
Friends and family
Base: All Respondents
Waves Gender Age Income Political
Wave 2 Wave 3 Wave 4 Wave 5 Wave 6 Wave 7 Wave 8 Wave 9 Wave 10 Wave 11 Wave 12 Wave 13 Wave 14 Less(3/14 - (3/17 - (3/21 - (3/28 - (4/3 - (4/11- (4/18- (4/25- (5/1 - (5/8 - (5/15 - (5/27 - (5/29 - than $50k -3/15) 3/18) 3/23) 3/30) 4/5) 4/13) 4/20) 4/27) 5/3) 5/10) 5/17) 5/28) 5/31) MALE FEMALE 18-34 35-49 50-64 65+ $50k $75k $75k+ GOP DEM IND/OTH
(A) (B) (C) (D) (E) (F) (G) (H) (I) (J) (K) (L) (M) (N) (O) (P) (Q) (R) (S) (T) (U) (V) (W) (X) (Y)
2050 2019 2023 2016 1993 2013 2029 - - 2030 1961 1996 1965 1066 899 504 475 502 484 749 397 729 698 683 584Unweighted Base2050 2019 2023 2016 1993 2013 2029 -** -** 2066 1961 1996 1965 952 1013 573 497 474 421 609 329 935 665 709 591Weighted Base
1435 1444 1475 1478 1516 1542 1497 - - 1511 1499 1485 1484 701 783 376 386 376 346 456 245 716 521 537 42770% 72% 73% 73% 76% 77% 74% - - 73% 76% 74% 76% 74% 77% 66% 78% 79% 82% 75% 75% 77% 78% 76% 72%
a ABcj ABCdgJ A a ABCdj A AB P P P y
Very/SomewhatTrustworthy (Net)
454 455 427 475 522 469 439 - - 575 487 495 478 235 243 131 158 92 97 142 71 238 195 165 11822% 23% 21% 24% 26% 23% 22% - - 28% 25% 25% 24% 25% 24% 23% 32% 19% 23% 23% 22% 25% 29% 23% 20%
ABCfG ABCDFGklM Cg Cg c PRS xY
Very trustworthy
981 989 1049 1004 994 1073 1057 - - 937 1012 989 1006 466 540 246 228 284 249 314 174 478 326 371 30948% 49% 52% 50% 50% 53% 52% - - 45% 52% 50% 51% 49% 53% 43% 46% 60% 59% 52% 53% 51% 49% 52% 52%
j AJ J J ABdeJl AJ aJ J aJ PQ PQ
Somewhat trustworthy
615 575 548 538 477 471 532 - - 555 462 511 481 250 230 197 111 98 75 153 84 219 144 173 16530% 28% 27% 27% 24% 23% 26% - - 27% 24% 26% 24% 26% 23% 34% 22% 21% 18% 25% 25% 23% 22% 24% 28%
dEFGjKLM EFKM eFK fk f eFk QRS w
Not All/Not VeryTrustworthy (Net)
463 445 426 407 359 381 381 - - 369 356 365 357 182 174 134 89 74 59 106 69 166 90 144 12223% 22% 21% 20% 18% 19% 19% - - 18% 18% 18% 18% 19% 17% 23% 18% 16% 14% 17% 21% 18% 14% 20% 21%
EFGJKLM EfGJKLM eJklm RS W W
Not very trustworthy
152 130 122 131 118 90 151 - - 186 106 146 124 68 56 63 22 23 16 47 15 52 53 29 427% 6% 6% 7% 6% 4% 7% - - 9% 5% 7% 6% 7% 6% 11% 4% 5% 4% 8% 5% 6% 8% 4% 7%
FK F f F FK BCDEFKM Fk F QRS X x
Not all trustworthy
2050 2019 2023 2016 1993 2013 2029 - - 2066 1961 1996 1965 952 1013 573 497 474 421 609 329 935 665 709 591100% 100% 100% 100% 100% 100% 100% - - 100% 100% 100% 100% 100% 100% 100% 100% 100% 100% 100% 100% 100% 100% 100% 100%
Sigma
__________________________________________________________________________________________________________________Proportions/Means: Columns Tested (5%, 10% risk level) - A/B/C/D/E/F/G/H/I/J/K/L/M - N/O - P/Q/R/S - T/U/V - W/X/YOverlap formulae used. ** very small base (under 30) ineligible for sig testing
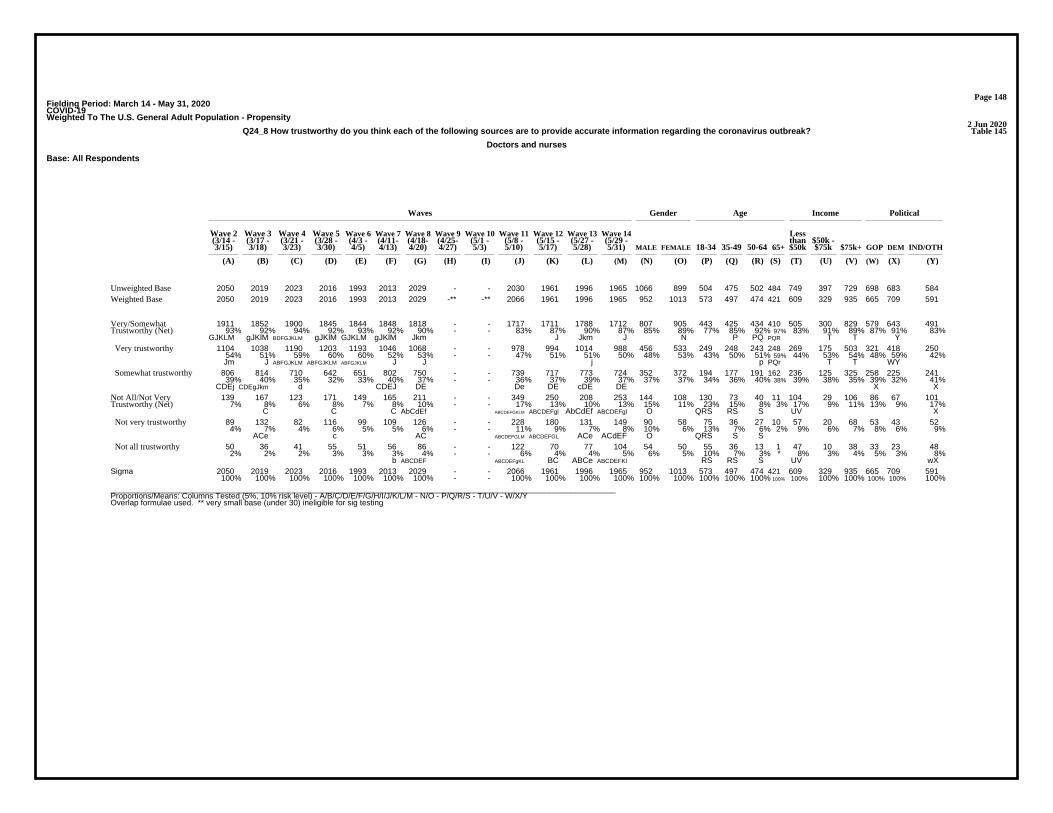
Page 148Fielding Period: March 14 - May 31, 2020COVID-19Weighted To The U.S. General Adult Population - Propensity
2 Jun 2020Table 145Q24_8 How trustworthy do you think each of the following sources are to provide accurate information regarding the coronavirus outbreak?
Doctors and nurses
Base: All Respondents
Waves Gender Age Income Political
Wave 2 Wave 3 Wave 4 Wave 5 Wave 6 Wave 7 Wave 8 Wave 9 Wave 10 Wave 11 Wave 12 Wave 13 Wave 14 Less(3/14 - (3/17 - (3/21 - (3/28 - (4/3 - (4/11- (4/18- (4/25- (5/1 - (5/8 - (5/15 - (5/27 - (5/29 - than $50k -3/15) 3/18) 3/23) 3/30) 4/5) 4/13) 4/20) 4/27) 5/3) 5/10) 5/17) 5/28) 5/31) MALE FEMALE 18-34 35-49 50-64 65+ $50k $75k $75k+ GOP DEM IND/OTH
(A) (B) (C) (D) (E) (F) (G) (H) (I) (J) (K) (L) (M) (N) (O) (P) (Q) (R) (S) (T) (U) (V) (W) (X) (Y)
2050 2019 2023 2016 1993 2013 2029 - - 2030 1961 1996 1965 1066 899 504 475 502 484 749 397 729 698 683 584Unweighted Base2050 2019 2023 2016 1993 2013 2029 -** -** 2066 1961 1996 1965 952 1013 573 497 474 421 609 329 935 665 709 591Weighted Base
1911 1852 1900 1845 1844 1848 1818 - - 1717 1711 1788 1712 807 905 443 425 434 410 505 300 829 579 643 49193% 92% 94% 92% 93% 92% 90% - - 83% 87% 90% 87% 85% 89% 77% 85% 92% 97% 83% 91% 89% 87% 91% 83%
GJKLM gJKlM BDFGJKLM gJKlM GJKLM gJKlM Jkm J Jkm J N P PQ PQR T T Y
Very/SomewhatTrustworthy (Net)
1104 1038 1190 1203 1193 1046 1068 - - 978 994 1014 988 456 533 249 248 243 248 269 175 503 321 418 25054% 51% 59% 60% 60% 52% 53% - - 47% 51% 51% 50% 48% 53% 43% 50% 51% 59% 44% 53% 54% 48% 59% 42%Jm J ABFGJKLM ABFGJKLM ABFGJKLM J J j p PQr T T WY
Very trustworthy
806 814 710 642 651 802 750 - - 739 717 773 724 352 372 194 177 191 162 236 125 325 258 225 24139% 40% 35% 32% 33% 40% 37% - - 36% 37% 39% 37% 37% 37% 34% 36% 40% 38% 39% 38% 35% 39% 32% 41%
CDEj CDEgJkm d CDEJ DE De DE cDE DE X X
Somewhat trustworthy
139 167 123 171 149 165 211 - - 349 250 208 253 144 108 130 73 40 11 104 29 106 86 67 1017% 8% 6% 8% 7% 8% 10% - - 17% 13% 10% 13% 15% 11% 23% 15% 8% 3% 17% 9% 11% 13% 9% 17%
C C C AbCdEf ABCDEFGKLM ABCDEFgl AbCdEf ABCDEFgl O QRS RS S UV X
Not All/Not VeryTrustworthy (Net)
89 132 82 116 99 109 126 - - 228 180 131 149 90 58 75 36 27 10 57 20 68 53 43 524% 7% 4% 6% 5% 5% 6% - - 11% 9% 7% 8% 10% 6% 13% 7% 6% 2% 9% 6% 7% 8% 6% 9%
ACe c AC ABCDEFGLM ABCDEFGL ACe ACdEF O QRS S S
Not very trustworthy
50 36 41 55 51 56 86 - - 122 70 77 104 54 50 55 36 13 1 47 10 38 33 23 482% 2% 2% 3% 3% 3% 4% - - 6% 4% 4% 5% 6% 5% 10% 7% 3% * 8% 3% 4% 5% 3% 8%
b ABCDEF ABCDEFgKL BC ABCe ABCDEFKl RS RS S UV wX
Not all trustworthy
2050 2019 2023 2016 1993 2013 2029 - - 2066 1961 1996 1965 952 1013 573 497 474 421 609 329 935 665 709 591100% 100% 100% 100% 100% 100% 100% - - 100% 100% 100% 100% 100% 100% 100% 100% 100% 100% 100% 100% 100% 100% 100% 100%
Sigma
__________________________________________________________________________________________________________________Proportions/Means: Columns Tested (5%, 10% risk level) - A/B/C/D/E/F/G/H/I/J/K/L/M - N/O - P/Q/R/S - T/U/V - W/X/YOverlap formulae used. ** very small base (under 30) ineligible for sig testing
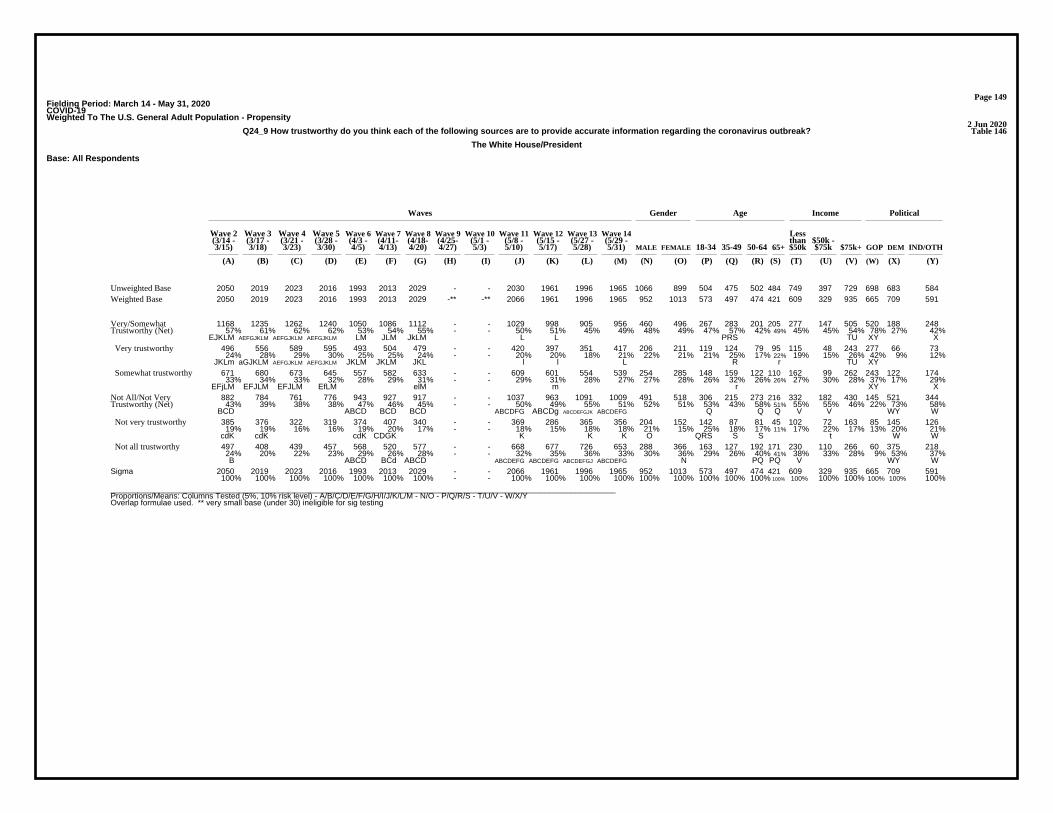
Page 149Fielding Period: March 14 - May 31, 2020COVID-19Weighted To The U.S. General Adult Population - Propensity
2 Jun 2020Table 146Q24_9 How trustworthy do you think each of the following sources are to provide accurate information regarding the coronavirus outbreak?
The White House/President
Base: All Respondents
Waves Gender Age Income Political
Wave 2 Wave 3 Wave 4 Wave 5 Wave 6 Wave 7 Wave 8 Wave 9 Wave 10 Wave 11 Wave 12 Wave 13 Wave 14 Less(3/14 - (3/17 - (3/21 - (3/28 - (4/3 - (4/11- (4/18- (4/25- (5/1 - (5/8 - (5/15 - (5/27 - (5/29 - than $50k -3/15) 3/18) 3/23) 3/30) 4/5) 4/13) 4/20) 4/27) 5/3) 5/10) 5/17) 5/28) 5/31) MALE FEMALE 18-34 35-49 50-64 65+ $50k $75k $75k+ GOP DEM IND/OTH
(A) (B) (C) (D) (E) (F) (G) (H) (I) (J) (K) (L) (M) (N) (O) (P) (Q) (R) (S) (T) (U) (V) (W) (X) (Y)
2050 2019 2023 2016 1993 2013 2029 - - 2030 1961 1996 1965 1066 899 504 475 502 484 749 397 729 698 683 584Unweighted Base2050 2019 2023 2016 1993 2013 2029 -** -** 2066 1961 1996 1965 952 1013 573 497 474 421 609 329 935 665 709 591Weighted Base
1168 1235 1262 1240 1050 1086 1112 - - 1029 998 905 956 460 496 267 283 201 205 277 147 505 520 188 24857% 61% 62% 62% 53% 54% 55% - - 50% 51% 45% 49% 48% 49% 47% 57% 42% 49% 45% 45% 54% 78% 27% 42%
EJKLM AEFGJKLM AEFGJKLM AEFGJKLM LM JLM JkLM L L PRS TU XY X
Very/SomewhatTrustworthy (Net)
496 556 589 595 493 504 479 - - 420 397 351 417 206 211 119 124 79 95 115 48 243 277 66 7324% 28% 29% 30% 25% 25% 24% - - 20% 20% 18% 21% 22% 21% 21% 25% 17% 22% 19% 15% 26% 42% 9% 12%
JKLm aGJKLM AEFGJKLM AEFGJKLM JKLM JKLM JKL l l L R r TU XY
Very trustworthy
671 680 673 645 557 582 633 - - 609 601 554 539 254 285 148 159 122 110 162 99 262 243 122 17433% 34% 33% 32% 28% 29% 31% - - 29% 31% 28% 27% 27% 28% 26% 32% 26% 26% 27% 30% 28% 37% 17% 29%
EFjLM EFJLM EFJLM EfLM elM m r XY X
Somewhat trustworthy
882 784 761 776 943 927 917 - - 1037 963 1091 1009 491 518 306 215 273 216 332 182 430 145 521 34443% 39% 38% 38% 47% 46% 45% - - 50% 49% 55% 51% 52% 51% 53% 43% 58% 51% 55% 55% 46% 22% 73% 58%
BCD ABCD BCD BCD ABCDFG ABCDg ABCDEFGJK ABCDEFG Q Q Q V V WY W
Not All/Not VeryTrustworthy (Net)
385 376 322 319 374 407 340 - - 369 286 365 356 204 152 142 87 81 45 102 72 163 85 145 12619% 19% 16% 16% 19% 20% 17% - - 18% 15% 18% 18% 21% 15% 25% 18% 17% 11% 17% 22% 17% 13% 20% 21%
cdK cdK cdK CDGK K K K O QRS S S t W W
Not very trustworthy
497 408 439 457 568 520 577 - - 668 677 726 653 288 366 163 127 192 171 230 110 266 60 375 21824% 20% 22% 23% 29% 26% 28% - - 32% 35% 36% 33% 30% 36% 29% 26% 40% 41% 38% 33% 28% 9% 53% 37%B ABCD BCd ABCD ABCDEFG ABCDEFG ABCDEFGJ ABCDEFG N PQ PQ V WY W
Not all trustworthy
2050 2019 2023 2016 1993 2013 2029 - - 2066 1961 1996 1965 952 1013 573 497 474 421 609 329 935 665 709 591100% 100% 100% 100% 100% 100% 100% - - 100% 100% 100% 100% 100% 100% 100% 100% 100% 100% 100% 100% 100% 100% 100% 100%
Sigma
__________________________________________________________________________________________________________________Proportions/Means: Columns Tested (5%, 10% risk level) - A/B/C/D/E/F/G/H/I/J/K/L/M - N/O - P/Q/R/S - T/U/V - W/X/YOverlap formulae used. ** very small base (under 30) ineligible for sig testing

Page 150Fielding Period: March 14 - May 31, 2020COVID-19Weighted To The U.S. General Adult Population - Propensity
2 Jun 2020Table 147Q24_10 How trustworthy do you think each of the following sources are to provide accurate information regarding the coronavirus outbreak?
My governor
Base: All Respondents
Waves Gender Age Income Political
Wave 2 Wave 3 Wave 4 Wave 5 Wave 6 Wave 7 Wave 8 Wave 9 Wave 10 Wave 11 Wave 12 Wave 13 Wave 14 Less(3/14 - (3/17 - (3/21 - (3/28 - (4/3 - (4/11- (4/18- (4/25- (5/1 - (5/8 - (5/15 - (5/27 - (5/29 - than $50k -3/15) 3/18) 3/23) 3/30) 4/5) 4/13) 4/20) 4/27) 5/3) 5/10) 5/17) 5/28) 5/31) MALE FEMALE 18-34 35-49 50-64 65+ $50k $75k $75k+ GOP DEM IND/OTH
(A) (B) (C) (D) (E) (F) (G) (H) (I) (J) (K) (L) (M) (N) (O) (P) (Q) (R) (S) (T) (U) (V) (W) (X) (Y)
2050 2019 2023 2016 1993 2013 2029 - - 2030 1961 1996 1965 1066 899 504 475 502 484 749 397 729 698 683 584Unweighted Base2050 2019 2023 2016 1993 2013 2029 -** -** 2066 1961 1996 1965 952 1013 573 497 474 421 609 329 935 665 709 591Weighted Base
1546 1532 1664 1596 1509 1537 1515 - - 1367 1307 1347 1310 623 686 329 350 323 308 370 217 664 443 521 34675% 76% 82% 79% 76% 76% 75% - - 66% 67% 68% 67% 65% 68% 57% 70% 68% 73% 61% 66% 71% 67% 73% 59%
JKLM JKLM ABDEFGJKLM AbEfGJKLM JKLM JKLM JKLM P P P T Y WY
Very/SomewhatTrustworthy (Net)
525 550 668 705 618 682 607 - - 549 485 482 521 250 271 119 151 112 139 131 93 281 183 245 9326% 27% 33% 35% 31% 34% 30% - - 27% 25% 24% 27% 26% 27% 21% 30% 24% 33% 21% 28% 30% 27% 35% 16%
l ABgJKLM ABEGJKLM ABJKLM ABGJKLM AjKLm Pr PR T T Y WY
Very trustworthy
1022 982 996 891 891 855 908 - - 819 822 865 789 373 416 210 199 211 169 240 124 383 260 275 25350% 49% 49% 44% 45% 42% 45% - - 40% 42% 43% 40% 39% 41% 37% 40% 44% 40% 39% 38% 41% 39% 39% 43%
DEFGJKLM DeFgJKLM DEFGJKLM JM JM JM j P
Somewhat trustworthy
504 487 359 420 484 476 514 - - 699 654 649 655 328 327 244 147 151 113 239 112 271 222 189 24525% 24% 18% 21% 24% 24% 25% - - 34% 33% 32% 33% 35% 32% 43% 30% 32% 27% 39% 34% 29% 33% 27% 41%
CD Cd C CD Cd CD ABCDEFG ABCDEFG ABCDEFG ABCDEFG QRS V X WX
Not All/Not VeryTrustworthy (Net)
338 320 218 259 306 293 330 - - 389 359 367 365 187 178 139 88 82 56 128 72 151 115 103 14816% 16% 11% 13% 15% 15% 16% - - 19% 18% 18% 19% 20% 18% 24% 18% 17% 13% 21% 22% 16% 17% 14% 25%
CD CD Cd C CD bCDEFg CDeF bCDEF bCDEF qRS v v WX
Not very trustworthy
166 166 141 161 179 183 184 - - 310 295 281 290 142 149 105 59 69 57 111 39 119 107 86 978% 8% 7% 8% 9% 9% 9% - - 15% 15% 14% 15% 15% 15% 18% 12% 15% 14% 18% 12% 13% 16% 12% 16%
c c C ABCDEFG ABCDEFG ABCDEFG ABCDEFG Q UV x x
Not all trustworthy
2050 2019 2023 2016 1993 2013 2029 - - 2066 1961 1996 1965 952 1013 573 497 474 421 609 329 935 665 709 591100% 100% 100% 100% 100% 100% 100% - - 100% 100% 100% 100% 100% 100% 100% 100% 100% 100% 100% 100% 100% 100% 100% 100%
Sigma
__________________________________________________________________________________________________________________Proportions/Means: Columns Tested (5%, 10% risk level) - A/B/C/D/E/F/G/H/I/J/K/L/M - N/O - P/Q/R/S - T/U/V - W/X/YOverlap formulae used. ** very small base (under 30) ineligible for sig testing
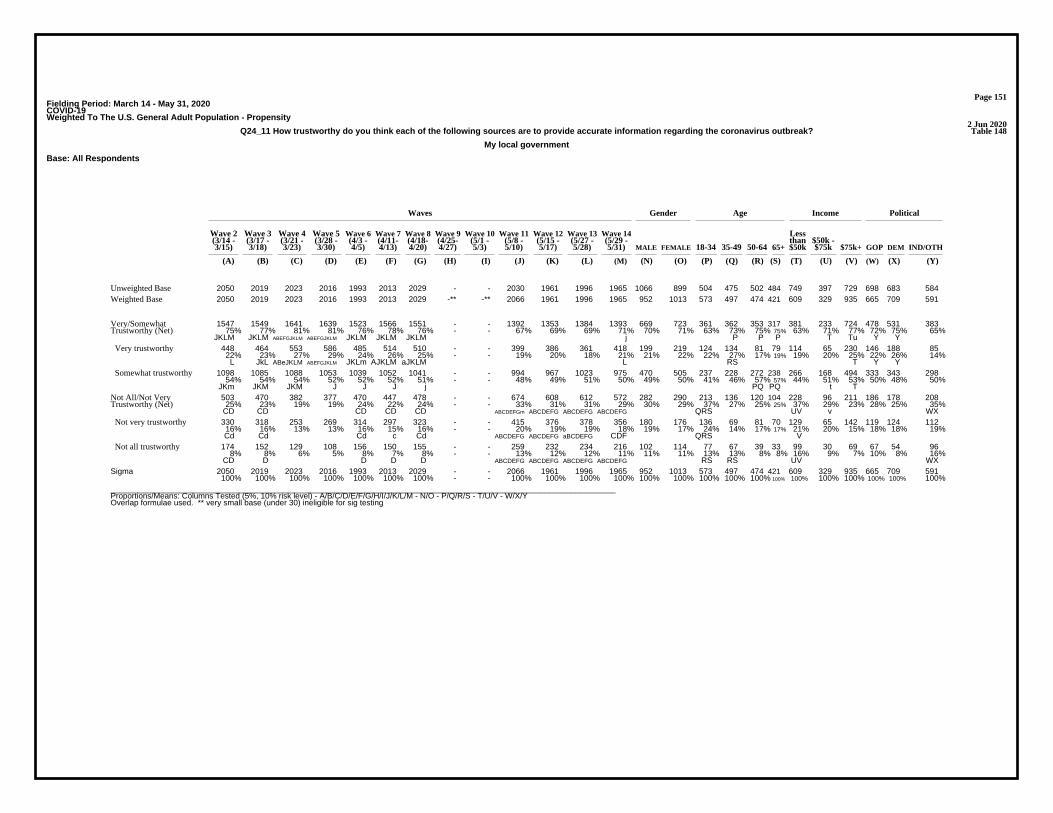
Page 151Fielding Period: March 14 - May 31, 2020COVID-19Weighted To The U.S. General Adult Population - Propensity
2 Jun 2020Table 148Q24_11 How trustworthy do you think each of the following sources are to provide accurate information regarding the coronavirus outbreak?
My local government
Base: All Respondents
Waves Gender Age Income Political
Wave 2 Wave 3 Wave 4 Wave 5 Wave 6 Wave 7 Wave 8 Wave 9 Wave 10 Wave 11 Wave 12 Wave 13 Wave 14 Less(3/14 - (3/17 - (3/21 - (3/28 - (4/3 - (4/11- (4/18- (4/25- (5/1 - (5/8 - (5/15 - (5/27 - (5/29 - than $50k -3/15) 3/18) 3/23) 3/30) 4/5) 4/13) 4/20) 4/27) 5/3) 5/10) 5/17) 5/28) 5/31) MALE FEMALE 18-34 35-49 50-64 65+ $50k $75k $75k+ GOP DEM IND/OTH
(A) (B) (C) (D) (E) (F) (G) (H) (I) (J) (K) (L) (M) (N) (O) (P) (Q) (R) (S) (T) (U) (V) (W) (X) (Y)
2050 2019 2023 2016 1993 2013 2029 - - 2030 1961 1996 1965 1066 899 504 475 502 484 749 397 729 698 683 584Unweighted Base2050 2019 2023 2016 1993 2013 2029 -** -** 2066 1961 1996 1965 952 1013 573 497 474 421 609 329 935 665 709 591Weighted Base
1547 1549 1641 1639 1523 1566 1551 - - 1392 1353 1384 1393 669 723 361 362 353 317 381 233 724 478 531 38375% 77% 81% 81% 76% 78% 76% - - 67% 69% 69% 71% 70% 71% 63% 73% 75% 75% 63% 71% 77% 72% 75% 65%
JKLM JKLM ABEFGJKLM ABEFGJKLM JKLM JKLM JKLM j P P P T Tu Y Y
Very/SomewhatTrustworthy (Net)
448 464 553 586 485 514 510 - - 399 386 361 418 199 219 124 134 81 79 114 65 230 146 188 8522% 23% 27% 29% 24% 26% 25% - - 19% 20% 18% 21% 21% 22% 22% 27% 17% 19% 19% 20% 25% 22% 26% 14%
L JkL ABeJKLM ABEFGJKLM JKLm AJKLM aJKLM L RS T Y Y
Very trustworthy
1098 1085 1088 1053 1039 1052 1041 - - 994 967 1023 975 470 505 237 228 272 238 266 168 494 333 343 29854% 54% 54% 52% 52% 52% 51% - - 48% 49% 51% 50% 49% 50% 41% 46% 57% 57% 44% 51% 53% 50% 48% 50%
JKm JKM JKM J J J j PQ PQ t T
Somewhat trustworthy
503 470 382 377 470 447 478 - - 674 608 612 572 282 290 213 136 120 104 228 96 211 186 178 20825% 23% 19% 19% 24% 22% 24% - - 33% 31% 31% 29% 30% 29% 37% 27% 25% 25% 37% 29% 23% 28% 25% 35%
CD CD CD CD CD ABCDEFGm ABCDEFG ABCDEFG ABCDEFG QRS UV v WX
Not All/Not VeryTrustworthy (Net)
330 318 253 269 314 297 323 - - 415 376 378 356 180 176 136 69 81 70 129 65 142 119 124 11216% 16% 13% 13% 16% 15% 16% - - 20% 19% 19% 18% 19% 17% 24% 14% 17% 17% 21% 20% 15% 18% 18% 19%Cd Cd Cd c Cd ABCDEFG ABCDEFG aBCDEFG CDF QRS V
Not very trustworthy
174 152 129 108 156 150 155 - - 259 232 234 216 102 114 77 67 39 33 99 30 69 67 54 968% 8% 6% 5% 8% 7% 8% - - 13% 12% 12% 11% 11% 11% 13% 13% 8% 8% 16% 9% 7% 10% 8% 16%
CD D D D D ABCDEFG ABCDEFG ABCDEFG ABCDEFG RS RS UV WX
Not all trustworthy
2050 2019 2023 2016 1993 2013 2029 - - 2066 1961 1996 1965 952 1013 573 497 474 421 609 329 935 665 709 591100% 100% 100% 100% 100% 100% 100% - - 100% 100% 100% 100% 100% 100% 100% 100% 100% 100% 100% 100% 100% 100% 100% 100%
Sigma
__________________________________________________________________________________________________________________Proportions/Means: Columns Tested (5%, 10% risk level) - A/B/C/D/E/F/G/H/I/J/K/L/M - N/O - P/Q/R/S - T/U/V - W/X/YOverlap formulae used. ** very small base (under 30) ineligible for sig testing

Page 152Fielding Period: March 14 - May 31, 2020COVID-19Weighted To The U.S. General Adult Population - Propensity
2 Jun 2020Table 149Q24_12 How trustworthy do you think each of the following sources are to provide accurate information regarding the coronavirus outbreak?
Chinese President, Xi Jinping
Base: All Respondents
Waves Gender Age Income Political
Wave 2 Wave 3 Wave 4 Wave 5 Wave 6 Wave 7 Wave 8 Wave 9 Wave 10 Wave 11 Wave 12 Wave 13 Wave 14 Less(3/14 - (3/17 - (3/21 - (3/28 - (4/3 - (4/11- (4/18- (4/25- (5/1 - (5/8 - (5/15 - (5/27 - (5/29 - than $50k -3/15) 3/18) 3/23) 3/30) 4/5) 4/13) 4/20) 4/27) 5/3) 5/10) 5/17) 5/28) 5/31) MALE FEMALE 18-34 35-49 50-64 65+ $50k $75k $75k+ GOP DEM IND/OTH
(A) (B) (C) (D) (E) (F) (G) (H) (I) (J) (K) (L) (M) (N) (O) (P) (Q) (R) (S) (T) (U) (V) (W) (X) (Y)
- - - - 1993 2013 2029 - - 2030 1961 1996 1965 1066 899 504 475 502 484 749 397 729 698 683 584Unweighted Base-** -** -** -** 1993 2013 2029 -** -** 2066 1961 1996 1965 952 1013 573 497 474 421 609 329 935 665 709 591Weighted Base
- - - - 453 429 445 - - 431 428 396 441 248 194 188 159 71 24 102 53 274 137 174 130- - - - 23% 21% 22% - - 21% 22% 20% 22% 26% 19% 33% 32% 15% 6% 17% 16% 29% 21% 25% 22%
l O RS RS S TU
Very/SomewhatTrustworthy (Net)
- - - - 133 128 129 - - 129 137 121 143 87 57 67 57 14 4 32 17 89 62 49 32- - - - 7% 6% 6% - - 6% 7% 6% 7% 9% 6% 12% 12% 3% 1% 5% 5% 10% 9% 7% 5%
O RS RS s Tu Y
Very trustworthy
- - - - 320 301 316 - - 303 292 275 298 161 137 120 101 57 19 70 35 185 75 125 98- - - - 16% 15% 16% - - 15% 15% 14% 15% 17% 14% 21% 20% 12% 5% 11% 11% 20% 11% 18% 17%
RS RS S TU W W
Somewhat trustworthy
- - - - 1540 1584 1584 - - 1635 1533 1600 1524 704 820 385 339 402 397 507 276 661 527 535 461- - - - 77% 79% 78% - - 79% 78% 80% 78% 74% 81% 67% 68% 85% 94% 83% 84% 71% 79% 75% 78%
e N PQ PQR V V
Not All/Not VeryTrustworthy (Net)
- - - - 567 550 522 - - 479 486 515 516 249 267 180 133 113 89 159 110 213 117 223 176- - - - 28% 27% 26% - - 23% 25% 26% 26% 26% 26% 31% 27% 24% 21% 26% 34% 23% 18% 31% 30%
JK J j RS TV W W
Not very trustworthy
- - - - 973 1034 1062 - - 1156 1047 1085 1008 455 553 205 205 289 308 348 166 448 410 313 285- - - - 49% 51% 52% - - 56% 53% 54% 51% 48% 55% 36% 41% 61% 73% 57% 50% 48% 62% 44% 48%
e EFgM E E N PQ PQR uV XY
Not all trustworthy
- - - - 1993 2013 2029 - - 2066 1961 1996 1965 952 1013 573 497 474 421 609 329 935 665 709 591- - - - 100% 100% 100% - - 100% 100% 100% 100% 100% 100% 100% 100% 100% 100% 100% 100% 100% 100% 100% 100%
Sigma
__________________________________________________________________________________________________________________Proportions/Means: Columns Tested (5%, 10% risk level) - A/B/C/D/E/F/G/H/I/J/K/L/M - N/O - P/Q/R/S - T/U/V - W/X/YOverlap formulae used. ** very small base (under 30) ineligible for sig testing
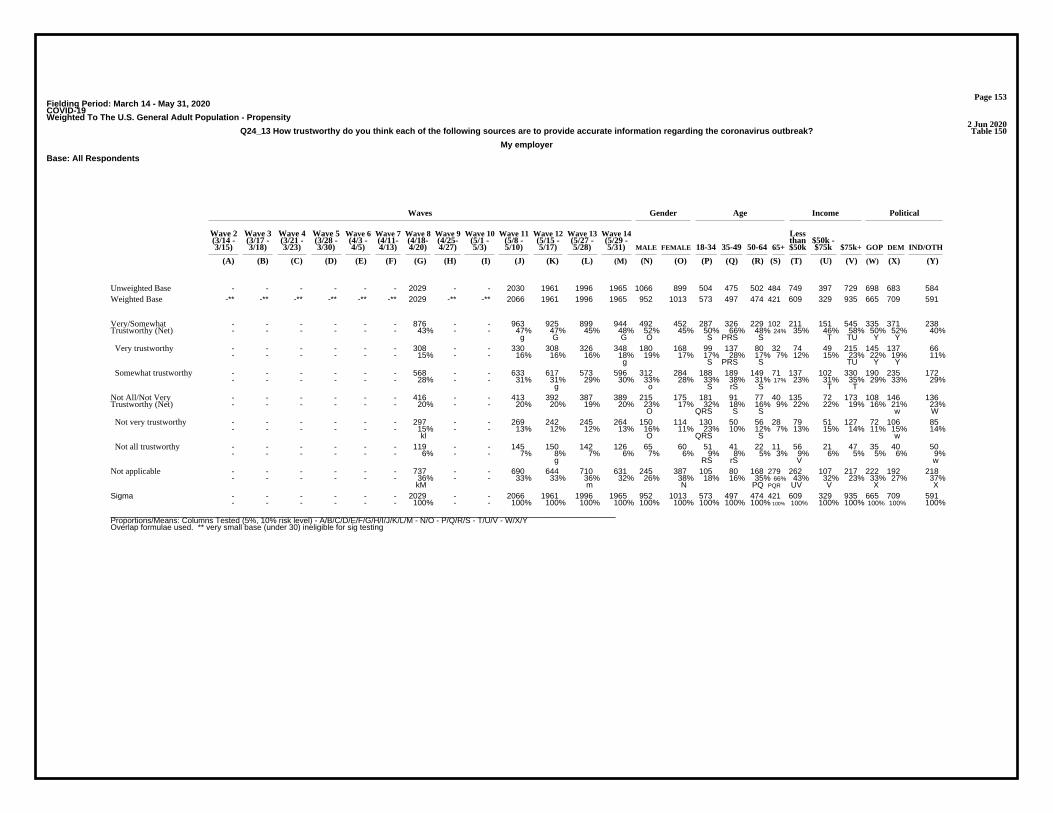
Page 153Fielding Period: March 14 - May 31, 2020COVID-19Weighted To The U.S. General Adult Population - Propensity
2 Jun 2020Table 150Q24_13 How trustworthy do you think each of the following sources are to provide accurate information regarding the coronavirus outbreak?
My employer
Base: All Respondents
Waves Gender Age Income Political
Wave 2 Wave 3 Wave 4 Wave 5 Wave 6 Wave 7 Wave 8 Wave 9 Wave 10 Wave 11 Wave 12 Wave 13 Wave 14 Less(3/14 - (3/17 - (3/21 - (3/28 - (4/3 - (4/11- (4/18- (4/25- (5/1 - (5/8 - (5/15 - (5/27 - (5/29 - than $50k -3/15) 3/18) 3/23) 3/30) 4/5) 4/13) 4/20) 4/27) 5/3) 5/10) 5/17) 5/28) 5/31) MALE FEMALE 18-34 35-49 50-64 65+ $50k $75k $75k+ GOP DEM IND/OTH
(A) (B) (C) (D) (E) (F) (G) (H) (I) (J) (K) (L) (M) (N) (O) (P) (Q) (R) (S) (T) (U) (V) (W) (X) (Y)
- - - - - - 2029 - - 2030 1961 1996 1965 1066 899 504 475 502 484 749 397 729 698 683 584Unweighted Base-** -** -** -** -** -** 2029 -** -** 2066 1961 1996 1965 952 1013 573 497 474 421 609 329 935 665 709 591Weighted Base
- - - - - - 876 - - 963 925 899 944 492 452 287 326 229 102 211 151 545 335 371 238- - - - - - 43% - - 47% 47% 45% 48% 52% 45% 50% 66% 48% 24% 35% 46% 58% 50% 52% 40%
g G G O S PRS S T TU Y Y
Very/SomewhatTrustworthy (Net)
- - - - - - 308 - - 330 308 326 348 180 168 99 137 80 32 74 49 215 145 137 66- - - - - - 15% - - 16% 16% 16% 18% 19% 17% 17% 28% 17% 7% 12% 15% 23% 22% 19% 11%
g S PRS S TU Y Y
Very trustworthy
- - - - - - 568 - - 633 617 573 596 312 284 188 189 149 71 137 102 330 190 235 172- - - - - - 28% - - 31% 31% 29% 30% 33% 28% 33% 38% 31% 17% 23% 31% 35% 29% 33% 29%
g o S rS S T T
Somewhat trustworthy
- - - - - - 416 - - 413 392 387 389 215 175 181 91 77 40 135 72 173 108 146 136- - - - - - 20% - - 20% 20% 19% 20% 23% 17% 32% 18% 16% 9% 22% 22% 19% 16% 21% 23%
O QRS S S w W
Not All/Not VeryTrustworthy (Net)
- - - - - - 297 - - 269 242 245 264 150 114 130 50 56 28 79 51 127 72 106 85- - - - - - 15% - - 13% 12% 12% 13% 16% 11% 23% 10% 12% 7% 13% 15% 14% 11% 15% 14%
kl O QRS S w
Not very trustworthy
- - - - - - 119 - - 145 150 142 126 65 60 51 41 22 11 56 21 47 35 40 50- - - - - - 6% - - 7% 8% 7% 6% 7% 6% 9% 8% 5% 3% 9% 6% 5% 5% 6% 9%
g RS rS V w
Not all trustworthy
- - - - - - 737 - - 690 644 710 631 245 387 105 80 168 279 262 107 217 222 192 218- - - - - - 36% - - 33% 33% 36% 32% 26% 38% 18% 16% 35% 66% 43% 32% 23% 33% 27% 37%
kM m N PQ PQR UV V X X
Not applicable
- - - - - - 2029 - - 2066 1961 1996 1965 952 1013 573 497 474 421 609 329 935 665 709 591- - - - - - 100% - - 100% 100% 100% 100% 100% 100% 100% 100% 100% 100% 100% 100% 100% 100% 100% 100%
Sigma
__________________________________________________________________________________________________________________Proportions/Means: Columns Tested (5%, 10% risk level) - A/B/C/D/E/F/G/H/I/J/K/L/M - N/O - P/Q/R/S - T/U/V - W/X/YOverlap formulae used. ** very small base (under 30) ineligible for sig testing

Page 154Fielding Period: March 14 - May 31, 2020COVID-19Weighted To The U.S. General Adult Population - Propensity
2 Jun 2020Table 151Q24_14 How trustworthy do you think each of the following sources are to provide accurate information regarding the coronavirus outbreak?
Local county agencies/health departments
Base: All Respondents
Waves Gender Age Income Political
Wave 2 Wave 3 Wave 4 Wave 5 Wave 6 Wave 7 Wave 8 Wave 9 Wave 10 Wave 11 Wave 12 Wave 13 Wave 14 Less(3/14 - (3/17 - (3/21 - (3/28 - (4/3 - (4/11- (4/18- (4/25- (5/1 - (5/8 - (5/15 - (5/27 - (5/29 - than $50k -3/15) 3/18) 3/23) 3/30) 4/5) 4/13) 4/20) 4/27) 5/3) 5/10) 5/17) 5/28) 5/31) MALE FEMALE 18-34 35-49 50-64 65+ $50k $75k $75k+ GOP DEM IND/OTH
(A) (B) (C) (D) (E) (F) (G) (H) (I) (J) (K) (L) (M) (N) (O) (P) (Q) (R) (S) (T) (U) (V) (W) (X) (Y)
- - - - - - 2029 - - 2030 1961 1996 1965 1066 899 504 475 502 484 749 397 729 698 683 584Unweighted Base-** -** -** -** -** -** 2029 -** -** 2066 1961 1996 1965 952 1013 573 497 474 421 609 329 935 665 709 591Weighted Base
- - - - - - 1657 - - 1554 1464 1521 1560 739 821 411 400 388 362 460 255 775 505 592 464- - - - - - 82% - - 75% 75% 76% 79% 78% 81% 72% 80% 82% 86% 76% 78% 83% 76% 83% 78%
JKL JKl P P Pq Tu Wy
Very/SomewhatTrustworthy (Net)
- - - - - - 586 - - 494 474 441 478 225 253 132 149 100 97 132 69 263 147 221 109- - - - - - 29% - - 24% 24% 22% 24% 24% 25% 23% 30% 21% 23% 22% 21% 28% 22% 31% 18%
JKLM pRs TU WY
Very trustworthy
- - - - - - 1071 - - 1060 990 1080 1083 514 569 279 251 287 265 327 187 511 358 370 355- - - - - - 53% - - 51% 50% 54% 55% 54% 56% 49% 50% 61% 63% 54% 57% 55% 54% 52% 60%
k jK PQ PQ wX
Somewhat trustworthy
- - - - - - 372 - - 513 497 475 405 212 192 162 98 86 59 149 74 160 160 117 127- - - - - - 18% - - 25% 25% 24% 21% 22% 19% 28% 20% 18% 14% 24% 22% 17% 24% 17% 22%
GM GM Gm QRS s V v X x
Not All/Not VeryTrustworthy (Net)
- - - - - - 235 - - 329 314 318 259 145 114 89 55 65 50 81 53 115 109 77 73- - - - - - 12% - - 16% 16% 16% 13% 15% 11% 15% 11% 14% 12% 13% 16% 12% 16% 11% 12%
Gm Gm Gm O X
Not very trustworthy
- - - - - - 138 - - 183 184 157 146 68 78 73 43 20 9 68 20 45 51 40 55- - - - - - 7% - - 9% 9% 8% 7% 7% 8% 13% 9% 4% 2% 11% 6% 5% 8% 6% 9%
G Gm RS RS UV x
Not all trustworthy
- - - - - - 2029 - - 2066 1961 1996 1965 952 1013 573 497 474 421 609 329 935 665 709 591- - - - - - 100% - - 100% 100% 100% 100% 100% 100% 100% 100% 100% 100% 100% 100% 100% 100% 100% 100%
Sigma
__________________________________________________________________________________________________________________Proportions/Means: Columns Tested (5%, 10% risk level) - A/B/C/D/E/F/G/H/I/J/K/L/M - N/O - P/Q/R/S - T/U/V - W/X/YOverlap formulae used. ** very small base (under 30) ineligible for sig testing
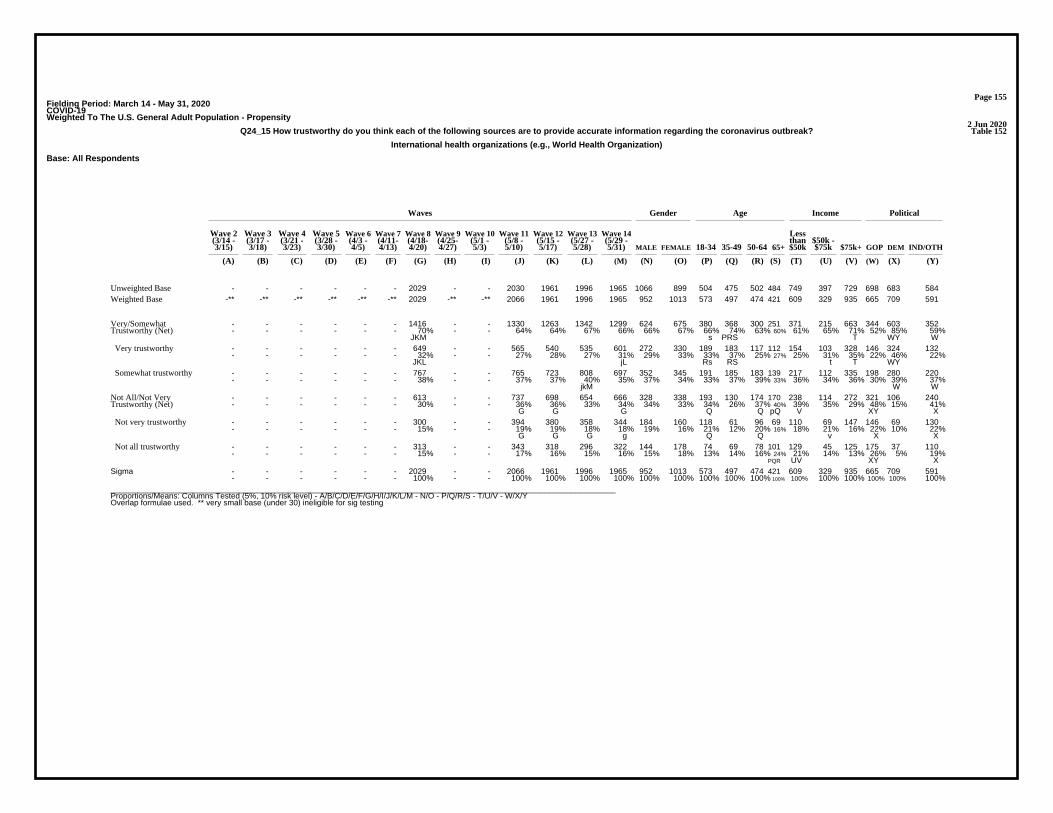
Page 155Fielding Period: March 14 - May 31, 2020COVID-19Weighted To The U.S. General Adult Population - Propensity
2 Jun 2020Table 152Q24_15 How trustworthy do you think each of the following sources are to provide accurate information regarding the coronavirus outbreak?
International health organizations (e.g., World Health Organization)
Base: All Respondents
Waves Gender Age Income Political
Wave 2 Wave 3 Wave 4 Wave 5 Wave 6 Wave 7 Wave 8 Wave 9 Wave 10 Wave 11 Wave 12 Wave 13 Wave 14 Less(3/14 - (3/17 - (3/21 - (3/28 - (4/3 - (4/11- (4/18- (4/25- (5/1 - (5/8 - (5/15 - (5/27 - (5/29 - than $50k -3/15) 3/18) 3/23) 3/30) 4/5) 4/13) 4/20) 4/27) 5/3) 5/10) 5/17) 5/28) 5/31) MALE FEMALE 18-34 35-49 50-64 65+ $50k $75k $75k+ GOP DEM IND/OTH
(A) (B) (C) (D) (E) (F) (G) (H) (I) (J) (K) (L) (M) (N) (O) (P) (Q) (R) (S) (T) (U) (V) (W) (X) (Y)
- - - - - - 2029 - - 2030 1961 1996 1965 1066 899 504 475 502 484 749 397 729 698 683 584Unweighted Base-** -** -** -** -** -** 2029 -** -** 2066 1961 1996 1965 952 1013 573 497 474 421 609 329 935 665 709 591Weighted Base
- - - - - - 1416 - - 1330 1263 1342 1299 624 675 380 368 300 251 371 215 663 344 603 352- - - - - - 70% - - 64% 64% 67% 66% 66% 67% 66% 74% 63% 60% 61% 65% 71% 52% 85% 59%
JKM s PRS T WY W
Very/SomewhatTrustworthy (Net)
- - - - - - 649 - - 565 540 535 601 272 330 189 183 117 112 154 103 328 146 324 132- - - - - - 32% - - 27% 28% 27% 31% 29% 33% 33% 37% 25% 27% 25% 31% 35% 22% 46% 22%
JKL jL Rs RS t T WY
Very trustworthy
- - - - - - 767 - - 765 723 808 697 352 345 191 185 183 139 217 112 335 198 280 220- - - - - - 38% - - 37% 37% 40% 35% 37% 34% 33% 37% 39% 33% 36% 34% 36% 30% 39% 37%
jkM W W
Somewhat trustworthy
- - - - - - 613 - - 737 698 654 666 328 338 193 130 174 170 238 114 272 321 106 240- - - - - - 30% - - 36% 36% 33% 34% 34% 33% 34% 26% 37% 40% 39% 35% 29% 48% 15% 41%
G G G Q Q pQ V XY X
Not All/Not VeryTrustworthy (Net)
- - - - - - 300 - - 394 380 358 344 184 160 118 61 96 69 110 69 147 146 69 130- - - - - - 15% - - 19% 19% 18% 18% 19% 16% 21% 12% 20% 16% 18% 21% 16% 22% 10% 22%
G G G g Q Q v X X
Not very trustworthy
- - - - - - 313 - - 343 318 296 322 144 178 74 69 78 101 129 45 125 175 37 110- - - - - - 15% - - 17% 16% 15% 16% 15% 18% 13% 14% 16% 24% 21% 14% 13% 26% 5% 19%
PQR UV XY X
Not all trustworthy
- - - - - - 2029 - - 2066 1961 1996 1965 952 1013 573 497 474 421 609 329 935 665 709 591- - - - - - 100% - - 100% 100% 100% 100% 100% 100% 100% 100% 100% 100% 100% 100% 100% 100% 100% 100%
Sigma
__________________________________________________________________________________________________________________Proportions/Means: Columns Tested (5%, 10% risk level) - A/B/C/D/E/F/G/H/I/J/K/L/M - N/O - P/Q/R/S - T/U/V - W/X/YOverlap formulae used. ** very small base (under 30) ineligible for sig testing
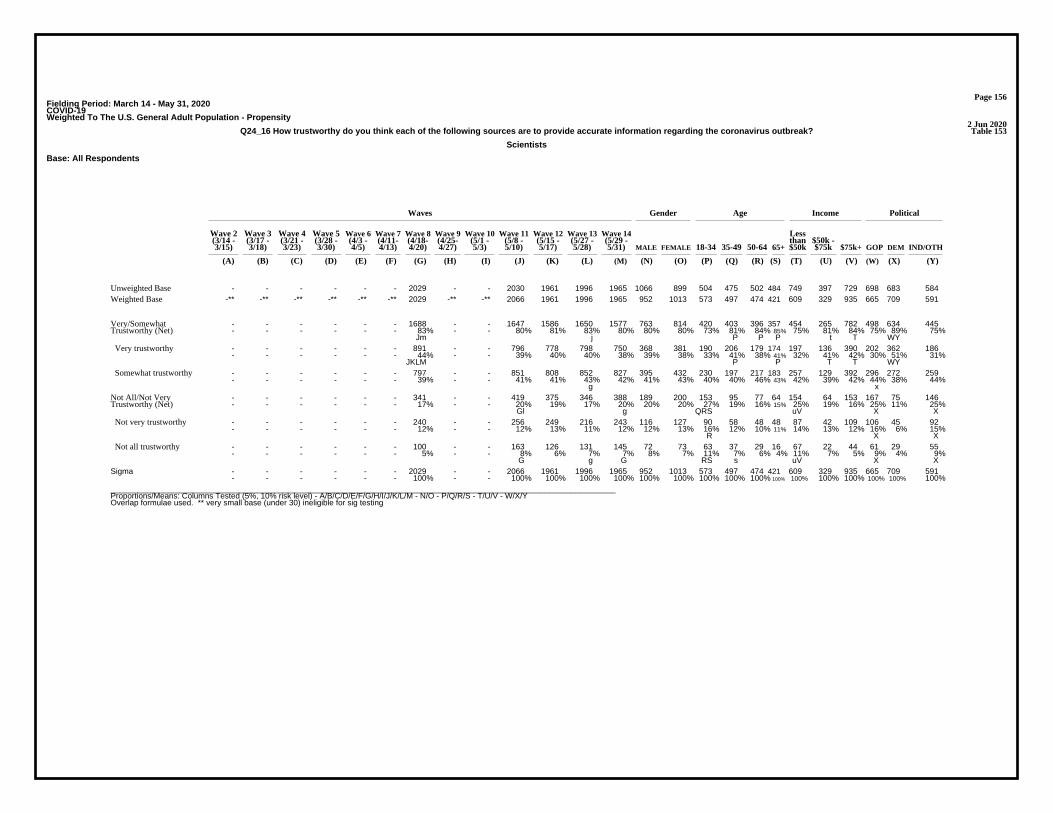
Page 156Fielding Period: March 14 - May 31, 2020COVID-19Weighted To The U.S. General Adult Population - Propensity
2 Jun 2020Table 153Q24_16 How trustworthy do you think each of the following sources are to provide accurate information regarding the coronavirus outbreak?
Scientists
Base: All Respondents
Waves Gender Age Income Political
Wave 2 Wave 3 Wave 4 Wave 5 Wave 6 Wave 7 Wave 8 Wave 9 Wave 10 Wave 11 Wave 12 Wave 13 Wave 14 Less(3/14 - (3/17 - (3/21 - (3/28 - (4/3 - (4/11- (4/18- (4/25- (5/1 - (5/8 - (5/15 - (5/27 - (5/29 - than $50k -3/15) 3/18) 3/23) 3/30) 4/5) 4/13) 4/20) 4/27) 5/3) 5/10) 5/17) 5/28) 5/31) MALE FEMALE 18-34 35-49 50-64 65+ $50k $75k $75k+ GOP DEM IND/OTH
(A) (B) (C) (D) (E) (F) (G) (H) (I) (J) (K) (L) (M) (N) (O) (P) (Q) (R) (S) (T) (U) (V) (W) (X) (Y)
- - - - - - 2029 - - 2030 1961 1996 1965 1066 899 504 475 502 484 749 397 729 698 683 584Unweighted Base-** -** -** -** -** -** 2029 -** -** 2066 1961 1996 1965 952 1013 573 497 474 421 609 329 935 665 709 591Weighted Base
- - - - - - 1688 - - 1647 1586 1650 1577 763 814 420 403 396 357 454 265 782 498 634 445- - - - - - 83% - - 80% 81% 83% 80% 80% 80% 73% 81% 84% 85% 75% 81% 84% 75% 89% 75%
Jm j P P P t T WY
Very/SomewhatTrustworthy (Net)
- - - - - - 891 - - 796 778 798 750 368 381 190 206 179 174 197 136 390 202 362 186- - - - - - 44% - - 39% 40% 40% 38% 39% 38% 33% 41% 38% 41% 32% 41% 42% 30% 51% 31%
JKLM P P T T WY
Very trustworthy
- - - - - - 797 - - 851 808 852 827 395 432 230 197 217 183 257 129 392 296 272 259- - - - - - 39% - - 41% 41% 43% 42% 41% 43% 40% 40% 46% 43% 42% 39% 42% 44% 38% 44%
g x
Somewhat trustworthy
- - - - - - 341 - - 419 375 346 388 189 200 153 95 77 64 154 64 153 167 75 146- - - - - - 17% - - 20% 19% 17% 20% 20% 20% 27% 19% 16% 15% 25% 19% 16% 25% 11% 25%
Gl g QRS uV X X
Not All/Not VeryTrustworthy (Net)
- - - - - - 240 - - 256 249 216 243 116 127 90 58 48 48 87 42 109 106 45 92- - - - - - 12% - - 12% 13% 11% 12% 12% 13% 16% 12% 10% 11% 14% 13% 12% 16% 6% 15%
R X X
Not very trustworthy
- - - - - - 100 - - 163 126 131 145 72 73 63 37 29 16 67 22 44 61 29 55- - - - - - 5% - - 8% 6% 7% 7% 8% 7% 11% 7% 6% 4% 11% 7% 5% 9% 4% 9%
G g G RS s uV X X
Not all trustworthy
- - - - - - 2029 - - 2066 1961 1996 1965 952 1013 573 497 474 421 609 329 935 665 709 591- - - - - - 100% - - 100% 100% 100% 100% 100% 100% 100% 100% 100% 100% 100% 100% 100% 100% 100% 100%
Sigma
__________________________________________________________________________________________________________________Proportions/Means: Columns Tested (5%, 10% risk level) - A/B/C/D/E/F/G/H/I/J/K/L/M - N/O - P/Q/R/S - T/U/V - W/X/YOverlap formulae used. ** very small base (under 30) ineligible for sig testing
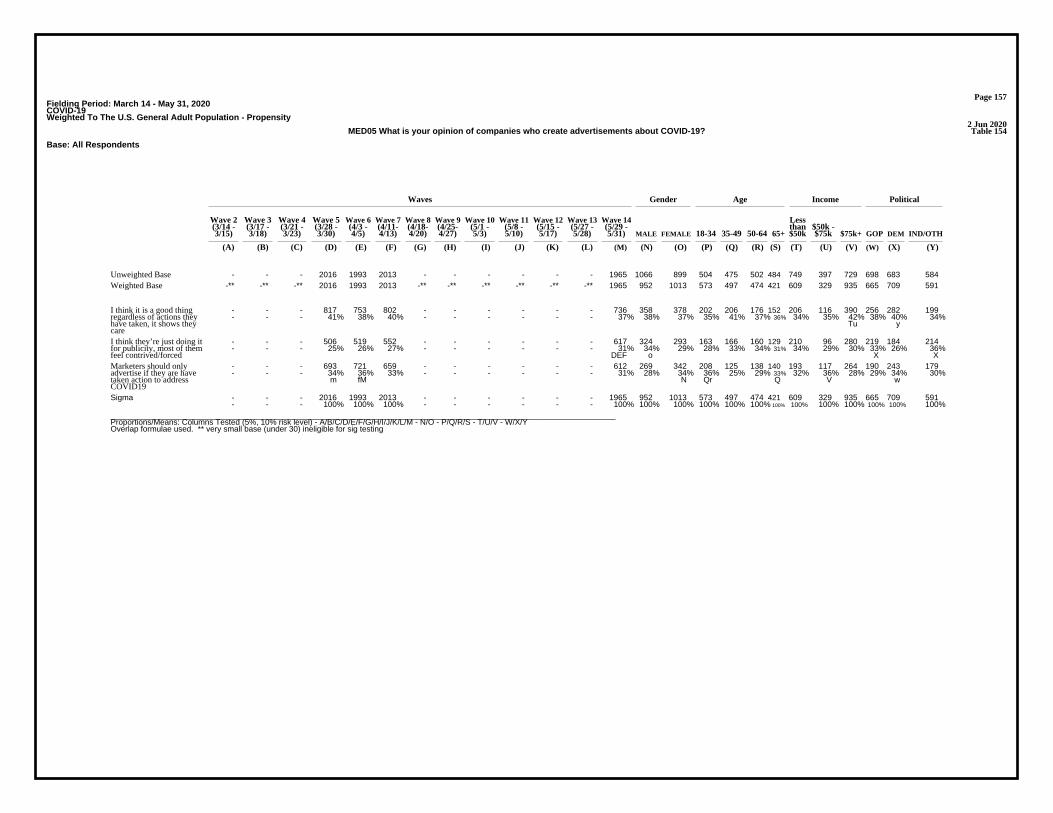
Page 157Fielding Period: March 14 - May 31, 2020COVID-19Weighted To The U.S. General Adult Population - Propensity
2 Jun 2020Table 154MED05 What is your opinion of companies who create advertisements about COVID-19?
Base: All Respondents
Waves Gender Age Income Political
Wave 2 Wave 3 Wave 4 Wave 5 Wave 6 Wave 7 Wave 8 Wave 9 Wave 10 Wave 11 Wave 12 Wave 13 Wave 14 Less(3/14 - (3/17 - (3/21 - (3/28 - (4/3 - (4/11- (4/18- (4/25- (5/1 - (5/8 - (5/15 - (5/27 - (5/29 - than $50k -3/15) 3/18) 3/23) 3/30) 4/5) 4/13) 4/20) 4/27) 5/3) 5/10) 5/17) 5/28) 5/31) MALE FEMALE 18-34 35-49 50-64 65+ $50k $75k $75k+ GOP DEM IND/OTH
(A) (B) (C) (D) (E) (F) (G) (H) (I) (J) (K) (L) (M) (N) (O) (P) (Q) (R) (S) (T) (U) (V) (W) (X) (Y)
- - - 2016 1993 2013 - - - - - - 1965 1066 899 504 475 502 484 749 397 729 698 683 584Unweighted Base-** -** -** 2016 1993 2013 -** -** -** -** -** -** 1965 952 1013 573 497 474 421 609 329 935 665 709 591Weighted Base
- - - 817 753 802 - - - - - - 736 358 378 202 206 176 152 206 116 390 256 282 199- - - 41% 38% 40% - - - - - - 37% 38% 37% 35% 41% 37% 36% 34% 35% 42% 38% 40% 34%
Tu y
I think it is a good thingregardless of actions theyhave taken, it shows theycare
- - - 506 519 552 - - - - - - 617 324 293 163 166 160 129 210 96 280 219 184 214- - - 25% 26% 27% - - - - - - 31% 34% 29% 28% 33% 34% 31% 34% 29% 30% 33% 26% 36%
DEF o X X
I think they’re just doing itfor publicity, most of themfeel contrived/forced
- - - 693 721 659 - - - - - - 612 269 342 208 125 138 140 193 117 264 190 243 179- - - 34% 36% 33% - - - - - - 31% 28% 34% 36% 25% 29% 33% 32% 36% 28% 29% 34% 30%
m fM N Qr Q V w
Marketers should onlyadvertise if they are havetaken action to addressCOVID19
- - - 2016 1993 2013 - - - - - - 1965 952 1013 573 497 474 421 609 329 935 665 709 591- - - 100% 100% 100% - - - - - - 100% 100% 100% 100% 100% 100% 100% 100% 100% 100% 100% 100% 100%
Sigma
__________________________________________________________________________________________________________________Proportions/Means: Columns Tested (5%, 10% risk level) - A/B/C/D/E/F/G/H/I/J/K/L/M - N/O - P/Q/R/S - T/U/V - W/X/YOverlap formulae used. ** very small base (under 30) ineligible for sig testing

Page 158Fielding Period: March 14 - May 31, 2020COVID-19Weighted To The U.S. General Adult Population - Propensity
2 Jun 2020Table 155Q23 Once they are allowed to reopen, should certain businesses that host events (e.g., concert venues, convention centers)
be required to conduct health screening before allowing people to enter?
Base: All Respondents
Waves Gender Age Income Political
Wave 2 Wave 3 Wave 4 Wave 5 Wave 6 Wave 7 Wave 8 Wave 9 Wave 10 Wave 11 Wave 12 Wave 13 Wave 14 Less(3/14 - (3/17 - (3/21 - (3/28 - (4/3 - (4/11- (4/18- (4/25- (5/1 - (5/8 - (5/15 - (5/27 - (5/29 - than $50k -3/15) 3/18) 3/23) 3/30) 4/5) 4/13) 4/20) 4/27) 5/3) 5/10) 5/17) 5/28) 5/31) MALE FEMALE 18-34 35-49 50-64 65+ $50k $75k $75k+ GOP DEM IND/OTH
(A) (B) (C) (D) (E) (F) (G) (H) (I) (J) (K) (L) (M) (N) (O) (P) (Q) (R) (S) (T) (U) (V) (W) (X) (Y)
- - - 2016 - 2013 - - - - - - 1965 1066 899 504 475 502 484 749 397 729 698 683 584Unweighted Base-** -** -** 2016 -** 2013 -** -** -** -** -** -** 1965 952 1013 573 497 474 421 609 329 935 665 709 591Weighted Base
- - - 1552 - 1504 - - - - - - 1517 741 776 430 388 361 339 473 248 728 478 602 438- - - 77% - 75% - - - - - - 77% 78% 77% 75% 78% 76% 80% 78% 75% 78% 72% 85% 74%
WY
Yes
- - - 464 - 509 - - - - - - 448 210 237 144 109 113 82 136 81 207 187 107 154- - - 23% - 25% - - - - - - 23% 22% 23% 25% 22% 24% 20% 22% 25% 22% 28% 15% 26%
X X
No
- - - 2016 - 2013 - - - - - - 1965 952 1013 573 497 474 421 609 329 935 665 709 591- - - 100% - 100% - - - - - - 100% 100% 100% 100% 100% 100% 100% 100% 100% 100% 100% 100% 100%
Sigma
__________________________________________________________________________________________________________________Proportions/Means: Columns Tested (5%, 10% risk level) - A/B/C/D/E/F/G/H/I/J/K/L/M - N/O - P/Q/R/S - T/U/V - W/X/YOverlap formulae used. ** very small base (under 30) ineligible for sig testing
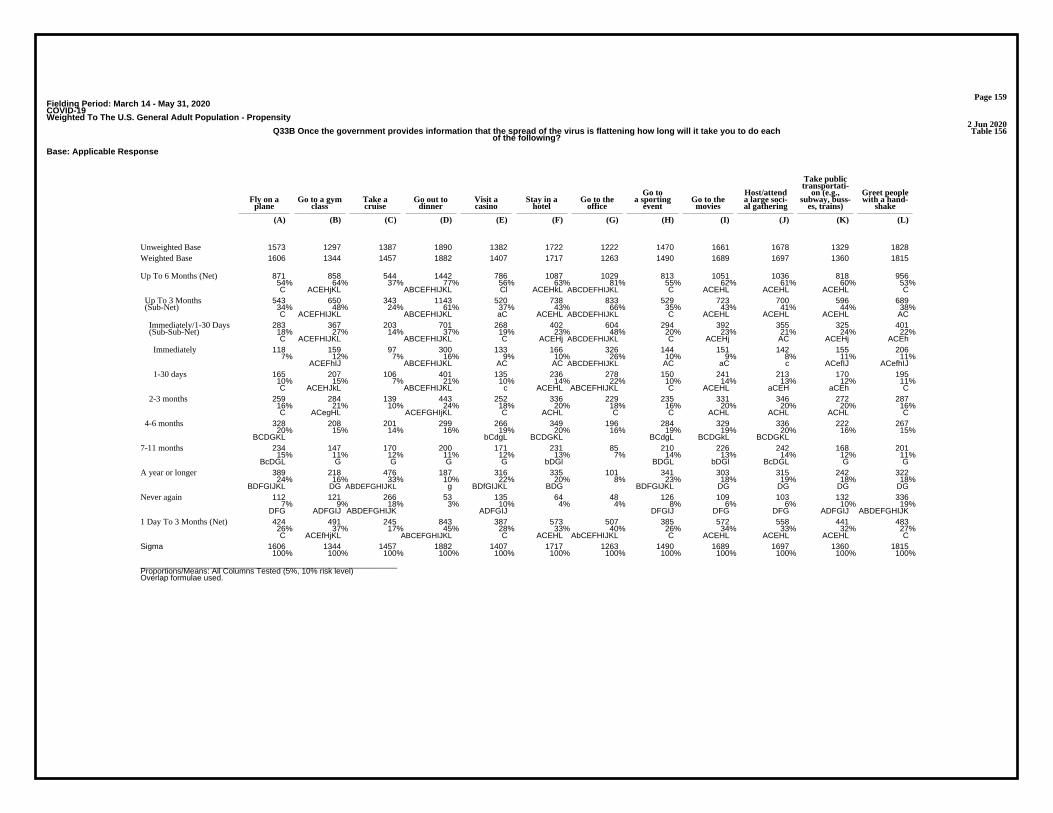
Page 159Fielding Period: March 14 - May 31, 2020COVID-19Weighted To The U.S. General Adult Population - Propensity
2 Jun 2020Table 156Q33B Once the government provides information that the spread of the virus is flattening how long will it take you to do each
of the following?
Base: Applicable Response
Take publictransportati-
Go to Host/attend on (e.g., Greet peopleFly on a Go to a gym Take a Go out to Visit a Stay in a Go to the a sporting Go to the a large soci- subway, buss- with a hand-
plane class cruise dinner casino hotel office event movies al gathering es, trains) shake
(A) (B) (C) (D) (E) (F) (G) (H) (I) (J) (K) (L)
1573 1297 1387 1890 1382 1722 1222 1470 1661 1678 1329 1828Unweighted Base1606 1344 1457 1882 1407 1717 1263 1490 1689 1697 1360 1815Weighted Base
871 858 544 1442 786 1087 1029 813 1051 1036 818 95654% 64% 37% 77% 56% 63% 81% 55% 62% 61% 60% 53%C ACEHjKL ABCEFHIJKL Cl ACEHkL ABCDEFHIJKL C ACEHL ACEHL ACEHL C
Up To 6 Months (Net)
543 650 343 1143 520 738 833 529 723 700 596 68934% 48% 24% 61% 37% 43% 66% 35% 43% 41% 44% 38%C ACEFHIJKL ABCEFHIJKL aC ACEHL ABCDEFHIJKL C ACEHL ACEHL ACEHL AC
Up To 3 Months (Sub-Net)
283 367 203 701 268 402 604 294 392 355 325 40118% 27% 14% 37% 19% 23% 48% 20% 23% 21% 24% 22%C ACEFHIJKL ABCEFHIJKL C ACEHj ABCDEFHIJKL C ACEHj AC ACEHj ACEh
Immediately/1-30 Days (Sub-Sub-Net)
118 159 97 300 133 166 326 144 151 142 155 2067% 12% 7% 16% 9% 10% 26% 10% 9% 8% 11% 11%
ACEFhIJ ABCEFHIJKL AC AC ABCDEFHIJKL AC aC c ACefIJ ACefhIJ
Immediately
165 207 106 401 135 236 278 150 241 213 170 19510% 15% 7% 21% 10% 14% 22% 10% 14% 13% 12% 11%C ACEHJkL ABCEFHIJKL c ACEHL ABCEFHIJKL C ACEHL aCEH aCEh C
1-30 days
259 284 139 443 252 336 229 235 331 346 272 28716% 21% 10% 24% 18% 20% 18% 16% 20% 20% 20% 16%C ACegHL ACEFGHIjKL C ACHL C C ACHL ACHL ACHL C
2-3 months
328 208 201 299 266 349 196 284 329 336 222 26720% 15% 14% 16% 19% 20% 16% 19% 19% 20% 16% 15%
BCDGKL bCdgL BCDGKL BCdgL BCDGkL BCDGKL
4-6 months
234 147 170 200 171 231 85 210 226 242 168 20115% 11% 12% 11% 12% 13% 7% 14% 13% 14% 12% 11%
BcDGL G G G G bDGl BDGL bDGl BcDGL G G
7-11 months
389 218 476 187 316 335 101 341 303 315 242 32224% 16% 33% 10% 22% 20% 8% 23% 18% 19% 18% 18%
BDFGIJKL DG ABDEFGHIJKL g BDfGIJKL BDG BDFGIJKL DG DG DG DG
A year or longer
112 121 266 53 135 64 48 126 109 103 132 3367% 9% 18% 3% 10% 4% 4% 8% 6% 6% 10% 19%
DFG ADFGIJ ABDEFGHIJK ADFGIJ DFGIJ DFG DFG ADFGIJ ABDEFGHIJK
Never again
424 491 245 843 387 573 507 385 572 558 441 48326% 37% 17% 45% 28% 33% 40% 26% 34% 33% 32% 27%C ACEfHjKL ABCEFGHIJKL C ACEHL AbCEFHIJKL C ACEHL ACEHL ACEHL C
1 Day To 3 Months (Net)
1606 1344 1457 1882 1407 1717 1263 1490 1689 1697 1360 1815100% 100% 100% 100% 100% 100% 100% 100% 100% 100% 100% 100%
Sigma
__________________________________________________________Proportions/Means: All Columns Tested (5%, 10% risk level)Overlap formulae used.

Page 160Fielding Period: March 14 - May 31, 2020COVID-19Weighted To The U.S. General Adult Population - Propensity
2 Jun 2020Table 157Q33B Once the government provides information that the spread of the virus is flattening how long will it take you to do each
of the following?
Summary Of Immediately/1-30 Days
Base: Applicable Response (Variable Bases)
Waves Gender Age Income Political
Wave 2 Wave 3 Wave 4 Wave 5 Wave 6 Wave 7 Wave 8 Wave 9 Wave 10 Wave 11 Wave 12 Wave 13 Wave 14 Less(3/14 - (3/17 - (3/21 - (3/28 - (4/3 - (4/11- (4/18- (4/25- (5/1 - (5/8 - (5/15 - (5/27 - (5/29 - than $50k -3/15) 3/18) 3/23) 3/30) 4/5) 4/13) 4/20) 4/27) 5/3) 5/10) 5/17) 5/28) 5/31) MALE FEMALE 18-34 35-49 50-64 65+ $50k $75k $75k+ GOP DEM IND/OTH
(A) (B) (C) (D) (E) (F) (G) (H) (I) (J) (K) (L) (M) (N) (O) (P) (Q) (R) (S) (T) (U) (V) (W) (X) (Y)
- - 831 843 731 698 582 644 643 612 515 597 604 345 259 184 204 162 55 155 98 336 237 208 159- - 63% 63% 59% 56% 47% 52% 49% 46% 43% 50% 48% 50% 46% 39% 52% 55% 51% 48% 47% 49% 57% 42% 45%
eFGHIJKLM eFGHIJKLM GHIJKLM GhIJKLM k gJK K K K P P p XY
Go to the office
- - 870 822 807 761 722 795 732 637 568 706 701 359 342 203 183 167 148 209 109 348 307 179 215- - 45% 43% 43% 40% 37% 41% 38% 32% 30% 37% 37% 39% 36% 38% 38% 37% 36% 37% 34% 38% 48% 26% 39%
FGHIJKLM GIJKLM GIJKLM JK JK giJKLm JK JK JK XY X
Go out to dinner
- - 493 480 429 386 359 389 400 379 322 385 367 215 151 126 127 72 42 89 52 214 161 105 100- - 37% 36% 36% 31% 29% 31% 31% 28% 25% 29% 27% 30% 24% 28% 32% 26% 20% 25% 24% 29% 36% 20% 27%
FGHIJKLM fGHIJKLM fGHIJKLM Km k K Km k o s S Xy x
Go to a gym class
- - 430 424 343 355 293 311 359 324 279 308 325 200 124 127 97 73 28 112 46 157 115 119 91- - 32% 32% 29% 27% 22% 24% 27% 23% 20% 23% 24% 27% 20% 28% 26% 25% 12% 30% 22% 22% 26% 22% 24%
FGHIJKLM FGHIJKLM GHJKLM GJKL K GJKL k O S S S uV
Take public transportation(e.g., subway, busses,trains)
- - 408 361 312 342 267 295 399 339 322 363 402 227 175 108 133 105 57 114 60 220 195 102 105- - 24% 21% 19% 20% 15% 17% 22% 19% 19% 21% 23% 26% 21% 22% 29% 26% 16% 24% 20% 25% 32% 16% 22%
EfGHJKl GH G Gh EGHJK G g GH EfGHJK O s pS S XY x
Stay in a hotel
- - 500 420 445 408 346 375 393 359 312 334 392 231 161 145 125 80 42 105 60 218 183 96 112- - 29% 25% 28% 25% 21% 23% 23% 21% 19% 20% 23% 27% 19% 27% 28% 20% 13% 22% 21% 25% 33% 15% 23%
DFGHIJKLM GJKL GHIJKLM GJKL K Kl Kl O rS rS S XY X
Go to the movies
- - 592 511 481 407 400 407 401 394 376 376 401 251 151 128 129 83 62 116 70 205 192 90 119- - 31% 27% 26% 22% 21% 22% 21% 21% 21% 20% 22% 28% 17% 25% 28% 19% 15% 22% 22% 23% 31% 13% 23%
DEFGHIJKLM FGHIJKLM FGHIJKLM O S RS XY X
Greet people with ahandshake
- - 482 416 417 404 344 356 375 369 305 359 355 220 135 114 118 69 54 95 49 198 169 89 97- - 28% 25% 25% 24% 20% 21% 22% 21% 18% 21% 21% 25% 16% 23% 26% 17% 15% 20% 17% 23% 30% 14% 20%
dFGHIJKLM GHJKLM GHiJKLM GhjKlm k K k k O S RS u XY x
Host/attend a large socialgathering
- - 394 339 311 298 221 261 312 293 218 257 294 191 103 97 101 63 33 83 41 163 139 81 75- - 26% 23% 22% 21% 15% 18% 21% 19% 15% 17% 20% 23% 15% 21% 25% 18% 12% 21% 16% 21% 27% 14% 18%
eFGHIJKLM GHJKL GHjKL GKL gk GKL GK GK O S rS s XY
Go to a sporting event
- - 312 293 245 257 197 211 270 269 240 255 268 176 92 87 96 49 36 76 49 138 118 72 78- - 22% 22% 20% 20% 15% 16% 20% 19% 18% 18% 19% 23% 14% 21% 24% 15% 13% 20% 21% 19% 25% 13% 20%
GHjKl GHKl GH Gh GH g g G O rs RS X x
Visit a casino
- - 314 298 288 288 199 219 288 259 222 250 283 178 105 86 93 64 41 73 44 160 126 78 79- - 20% 19% 19% 18% 12% 14% 18% 15% 14% 16% 18% 21% 14% 18% 21% 17% 13% 18% 16% 18% 23% 13% 18%
GHJKL GHJKL GHJKl GHjKl GHK g G GHK O s S X
Fly on a plane
- - 195 159 155 174 138 153 189 184 161 149 203 127 76 67 87 30 20 43 27 132 107 48 48- - 14% 12% 12% 13% 10% 12% 14% 13% 12% 11% 14% 16% 11% 15% 22% 9% 7% 12% 12% 16% 21% 9% 12%
Gl g Gl Gl O S pRS XY
Take a cruise
__________________________________________________________________________________________________________________Proportions/Means: Columns Tested (5%, 10% risk level) - A/B/C/D/E/F/G/H/I/J/K/L/M - N/O - P/Q/R/S - T/U/V - W/X/YOverlap formulae used. * small base; ** very small base (under 30) ineligible for sig testing
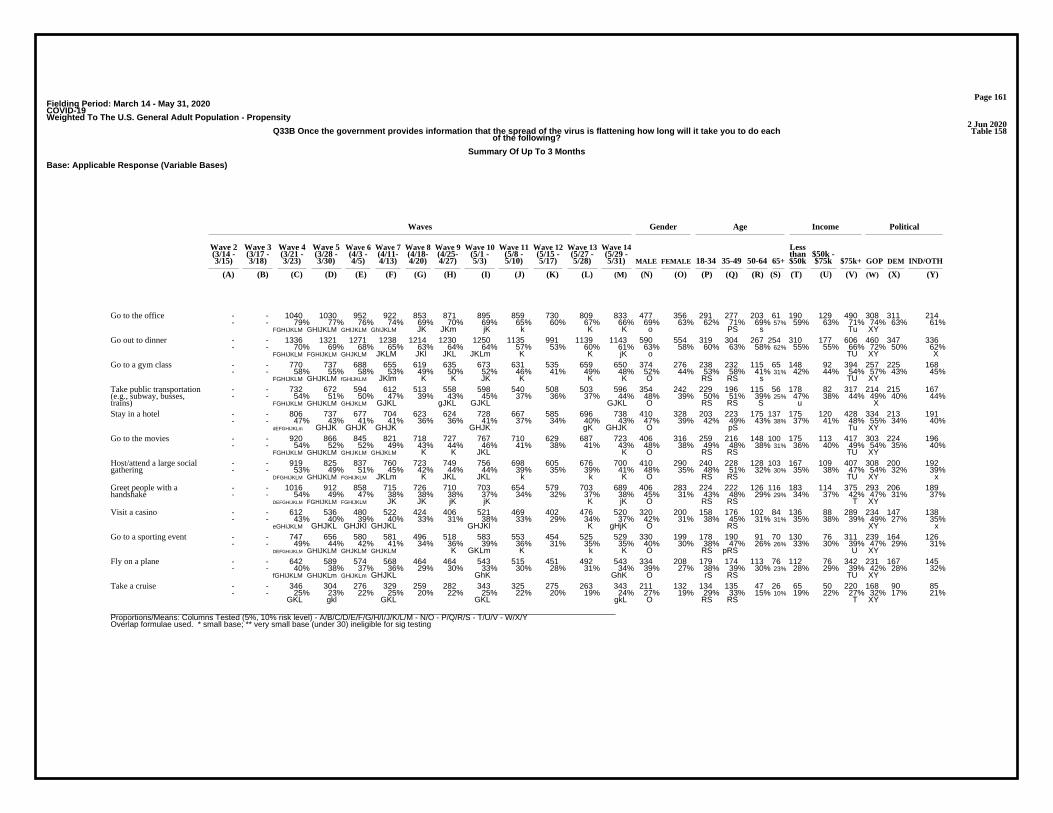
Page 161Fielding Period: March 14 - May 31, 2020COVID-19Weighted To The U.S. General Adult Population - Propensity
2 Jun 2020Table 158Q33B Once the government provides information that the spread of the virus is flattening how long will it take you to do each
of the following?
Summary Of Up To 3 Months
Base: Applicable Response (Variable Bases)
Waves Gender Age Income Political
Wave 2 Wave 3 Wave 4 Wave 5 Wave 6 Wave 7 Wave 8 Wave 9 Wave 10 Wave 11 Wave 12 Wave 13 Wave 14 Less(3/14 - (3/17 - (3/21 - (3/28 - (4/3 - (4/11- (4/18- (4/25- (5/1 - (5/8 - (5/15 - (5/27 - (5/29 - than $50k -3/15) 3/18) 3/23) 3/30) 4/5) 4/13) 4/20) 4/27) 5/3) 5/10) 5/17) 5/28) 5/31) MALE FEMALE 18-34 35-49 50-64 65+ $50k $75k $75k+ GOP DEM IND/OTH
(A) (B) (C) (D) (E) (F) (G) (H) (I) (J) (K) (L) (M) (N) (O) (P) (Q) (R) (S) (T) (U) (V) (W) (X) (Y)
- - 1040 1030 952 922 853 871 895 859 730 809 833 477 356 291 277 203 61 190 129 490 308 311 214- - 79% 77% 76% 74% 69% 70% 69% 65% 60% 67% 66% 69% 63% 62% 71% 69% 57% 59% 63% 71% 74% 63% 61%
FGHIJKLM GHIJKLM GHIJKLM GhIJKLM JK JKm jK k K K o PS s Tu XY
Go to the office
- - 1336 1321 1271 1238 1214 1230 1250 1135 991 1139 1143 590 554 319 304 267 254 310 177 606 460 347 336- - 70% 69% 68% 65% 63% 64% 64% 57% 53% 60% 61% 63% 58% 60% 63% 58% 62% 55% 55% 66% 72% 50% 62%
FGHIJKLM FGHIJKLM GHJKLM JKLM JKl JKL JKLm K K jK o TU XY X
Go out to dinner
- - 770 737 688 655 619 635 673 631 535 659 650 374 276 238 232 115 65 148 92 394 257 225 168- - 58% 55% 58% 53% 49% 50% 52% 46% 41% 49% 48% 52% 44% 53% 58% 41% 31% 42% 44% 54% 57% 43% 45%
FGHIJKLM GHJKLM fGHIJKLM JKlm K K JK K K K O RS RS s TU XY
Go to a gym class
- - 732 672 594 612 513 558 598 540 508 503 596 354 242 229 196 115 56 178 82 317 214 215 167- - 54% 51% 50% 47% 39% 43% 45% 37% 36% 37% 44% 48% 39% 50% 51% 39% 25% 47% 38% 44% 49% 40% 44%
FGHIJKLM GHIJKLM GHiJKLM GJKL gJKL GJKL GJKL O RS RS S u X
Take public transportation(e.g., subway, busses,trains)
- - 806 737 677 704 623 624 728 667 585 696 738 410 328 203 223 175 137 175 120 428 334 213 191- - 47% 43% 41% 41% 36% 36% 41% 37% 34% 40% 43% 47% 39% 42% 49% 43% 38% 37% 41% 48% 55% 34% 40%
dEFGHIJKLm GHJK GHJK GHJK GHJK gK GHJK O pS Tu XY
Stay in a hotel
- - 920 866 845 821 718 727 767 710 629 687 723 406 316 259 216 148 100 175 113 417 303 224 196- - 54% 52% 52% 49% 43% 44% 46% 41% 38% 41% 43% 48% 38% 49% 48% 38% 31% 36% 40% 49% 54% 35% 40%
FGHIJKLM GHIJKLM GHIJKLM GHiJKLM K K JKL K O RS RS TU XY
Go to the movies
- - 919 825 837 760 723 749 756 698 605 676 700 410 290 240 228 128 103 167 109 407 308 200 192- - 53% 49% 51% 45% 42% 44% 44% 39% 35% 39% 41% 48% 35% 48% 51% 32% 30% 35% 38% 47% 54% 32% 39%
DFGHIJKLM GHIJKLM FGHIJKLM JKLm K JKL JKL k k K O RS RS TU XY x
Host/attend a large socialgathering
- - 1016 912 858 715 726 710 703 654 579 703 689 406 283 224 222 126 116 183 114 375 293 206 189- - 54% 49% 47% 38% 38% 38% 37% 34% 32% 37% 38% 45% 31% 43% 48% 29% 29% 34% 37% 42% 47% 31% 37%
DEFGHIJKLM FGHIJKLM FGHIJKLM JK JK jK jK K jK O RS RS T XY
Greet people with ahandshake
- - 612 536 480 522 424 406 521 469 402 476 520 320 200 158 176 102 84 136 88 289 234 147 138- - 43% 40% 39% 40% 33% 31% 38% 33% 29% 34% 37% 42% 31% 38% 45% 31% 31% 35% 38% 39% 49% 27% 35%
eGHIJKLM GHJKL GHJKl GHJKL GHJKl K gHjK O RS XY x
Visit a casino
- - 747 656 580 581 496 518 583 553 454 525 529 330 199 178 190 91 70 130 76 311 239 164 126- - 49% 44% 42% 41% 34% 36% 39% 36% 31% 35% 35% 40% 30% 38% 47% 26% 26% 33% 30% 39% 47% 29% 31%
DEFGHIJKLM GHIJKLM GHJKLM GHJKLM K GKLm K k K O RS pRS U XY
Go to a sporting event
- - 642 589 574 568 464 464 543 515 451 492 543 334 208 179 174 113 76 112 76 342 231 167 145- - 40% 38% 37% 36% 29% 30% 33% 30% 28% 31% 34% 39% 27% 38% 39% 30% 23% 28% 29% 39% 42% 28% 32%
fGHIJKLM GHIJKLm GHiJKLm GHJKL GhK GhK O rS RS TU XY
Fly on a plane
- - 346 304 276 329 259 282 343 325 275 263 343 211 132 134 135 47 26 65 50 220 168 90 85- - 25% 23% 22% 25% 20% 22% 25% 22% 20% 19% 24% 27% 19% 29% 33% 15% 10% 19% 22% 27% 32% 17% 21%
GKL gkl GKL GKL gkL O RS RS T XY
Take a cruise
__________________________________________________________________________________________________________________Proportions/Means: Columns Tested (5%, 10% risk level) - A/B/C/D/E/F/G/H/I/J/K/L/M - N/O - P/Q/R/S - T/U/V - W/X/YOverlap formulae used. * small base; ** very small base (under 30) ineligible for sig testing
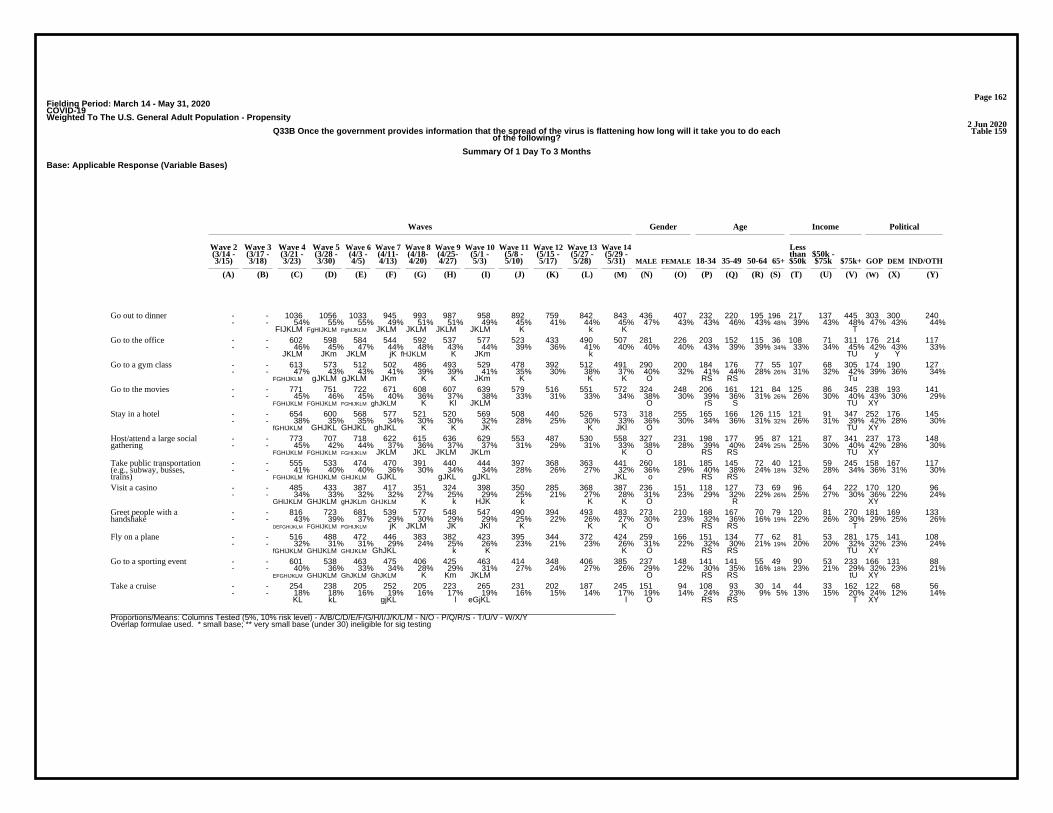
Page 162Fielding Period: March 14 - May 31, 2020COVID-19Weighted To The U.S. General Adult Population - Propensity
2 Jun 2020Table 159Q33B Once the government provides information that the spread of the virus is flattening how long will it take you to do each
of the following?
Summary Of 1 Day To 3 Months
Base: Applicable Response (Variable Bases)
Waves Gender Age Income Political
Wave 2 Wave 3 Wave 4 Wave 5 Wave 6 Wave 7 Wave 8 Wave 9 Wave 10 Wave 11 Wave 12 Wave 13 Wave 14 Less(3/14 - (3/17 - (3/21 - (3/28 - (4/3 - (4/11- (4/18- (4/25- (5/1 - (5/8 - (5/15 - (5/27 - (5/29 - than $50k -3/15) 3/18) 3/23) 3/30) 4/5) 4/13) 4/20) 4/27) 5/3) 5/10) 5/17) 5/28) 5/31) MALE FEMALE 18-34 35-49 50-64 65+ $50k $75k $75k+ GOP DEM IND/OTH
(A) (B) (C) (D) (E) (F) (G) (H) (I) (J) (K) (L) (M) (N) (O) (P) (Q) (R) (S) (T) (U) (V) (W) (X) (Y)
- - 1036 1056 1033 945 993 987 958 892 759 842 843 436 407 232 220 195 196 217 137 445 303 300 240- - 54% 55% 55% 49% 51% 51% 49% 45% 41% 44% 45% 47% 43% 43% 46% 43% 48% 39% 43% 48% 47% 43% 44%
FIJKLM FgHIJKLM FghIJKLM JKLM JKLM JKLM JKLM K k K T
Go out to dinner
- - 602 598 584 544 592 537 577 523 433 490 507 281 226 203 152 115 36 108 71 311 176 214 117- - 46% 45% 47% 44% 48% 43% 44% 39% 36% 41% 40% 40% 40% 43% 39% 39% 34% 33% 34% 45% 42% 43% 33%
JKLM JKm JKLM jK fHJKLM K JKm k TU y Y
Go to the office
- - 613 573 512 502 486 493 529 478 392 512 491 290 200 184 176 77 55 107 68 305 174 190 127- - 47% 43% 43% 41% 39% 39% 41% 35% 30% 38% 37% 40% 32% 41% 44% 28% 26% 31% 32% 42% 39% 36% 34%
FGHIJKLM gJKLM gJKLM JKm K K JKm K K K O RS RS Tu
Go to a gym class
- - 771 751 722 671 608 607 639 579 516 551 572 324 248 206 161 121 84 125 86 345 238 193 141- - 45% 46% 45% 40% 36% 37% 38% 33% 31% 33% 34% 38% 30% 39% 36% 31% 26% 26% 30% 40% 43% 30% 29%
FGHIJKLM FGHIJKLM FGHIJKLM ghJKLM K Kl JKLM O rS S TU XY
Go to the movies
- - 654 600 568 577 521 520 569 508 440 526 573 318 255 165 166 126 115 121 91 347 252 176 145- - 38% 35% 35% 34% 30% 30% 32% 28% 25% 30% 33% 36% 30% 34% 36% 31% 32% 26% 31% 39% 42% 28% 30%
fGHIJKLM GHJKL GHJKL ghJKL K K JK K JKl O TU XY
Stay in a hotel
- - 773 707 718 622 615 636 629 553 487 530 558 327 231 198 177 95 87 121 87 341 237 173 148- - 45% 42% 44% 37% 36% 37% 37% 31% 29% 31% 33% 38% 28% 39% 40% 24% 25% 25% 30% 40% 42% 28% 30%
FGHIJKLM FGHIJKLM FGHIJKLM JKLM JKL JKLM JKLm K O RS RS TU XY
Host/attend a large socialgathering
- - 555 533 474 470 391 440 444 397 368 363 441 260 181 185 145 72 40 121 59 245 158 167 117- - 41% 40% 40% 36% 30% 34% 34% 28% 26% 27% 32% 36% 29% 40% 38% 24% 18% 32% 28% 34% 36% 31% 30%
FGHIJKLM fGHIJKLM GHIJKLM GJKL gJKL gJKL JKL o RS RS
Take public transportation(e.g., subway, busses,trains)
- - 485 433 387 417 351 324 398 350 285 368 387 236 151 118 127 73 69 96 64 222 170 120 96- - 34% 33% 32% 32% 27% 25% 29% 25% 21% 27% 28% 31% 23% 29% 32% 22% 26% 25% 27% 30% 36% 22% 24%
GHIJKLM GHJKLM gHJKLm GHJKLM K k HJK k K K O R XY
Visit a casino
- - 816 723 681 539 577 548 547 490 394 493 483 273 210 168 167 70 79 120 81 270 181 169 133- - 43% 39% 37% 29% 30% 29% 29% 25% 22% 26% 27% 30% 23% 32% 36% 16% 19% 22% 26% 30% 29% 25% 26%
DEFGHIJKLM FGHIJKLM FGHIJKLM jK JKLM JK JKl K K K O RS RS T
Greet people with ahandshake
- - 516 488 472 446 383 382 423 395 344 372 424 259 166 151 134 77 62 81 53 281 175 141 108- - 32% 31% 31% 29% 24% 25% 26% 23% 21% 23% 26% 31% 22% 32% 30% 21% 19% 20% 20% 32% 32% 23% 24%
fGHIJKLM GHIJKLM GHIJKLM GhJKL k K K O RS RS TU XY
Fly on a plane
- - 601 538 463 475 406 425 463 414 348 406 385 237 148 141 141 55 49 90 53 233 166 131 88- - 40% 36% 33% 34% 28% 29% 31% 27% 24% 27% 26% 29% 22% 30% 35% 16% 18% 23% 21% 29% 32% 23% 21%
EFGHIJKLM GHIJKLM GhJKLM GhJKLM K Km JKLM O RS RS tU XY
Go to a sporting event
- - 254 238 205 252 205 223 265 231 202 187 245 151 94 108 93 30 14 44 33 162 122 68 56- - 18% 18% 16% 19% 16% 17% 19% 16% 15% 14% 17% 19% 14% 24% 23% 9% 5% 13% 15% 20% 24% 12% 14%
KL kL gjKL l eGjKL l O RS RS T XY
Take a cruise
__________________________________________________________________________________________________________________Proportions/Means: Columns Tested (5%, 10% risk level) - A/B/C/D/E/F/G/H/I/J/K/L/M - N/O - P/Q/R/S - T/U/V - W/X/YOverlap formulae used. * small base; ** very small base (under 30) ineligible for sig testing
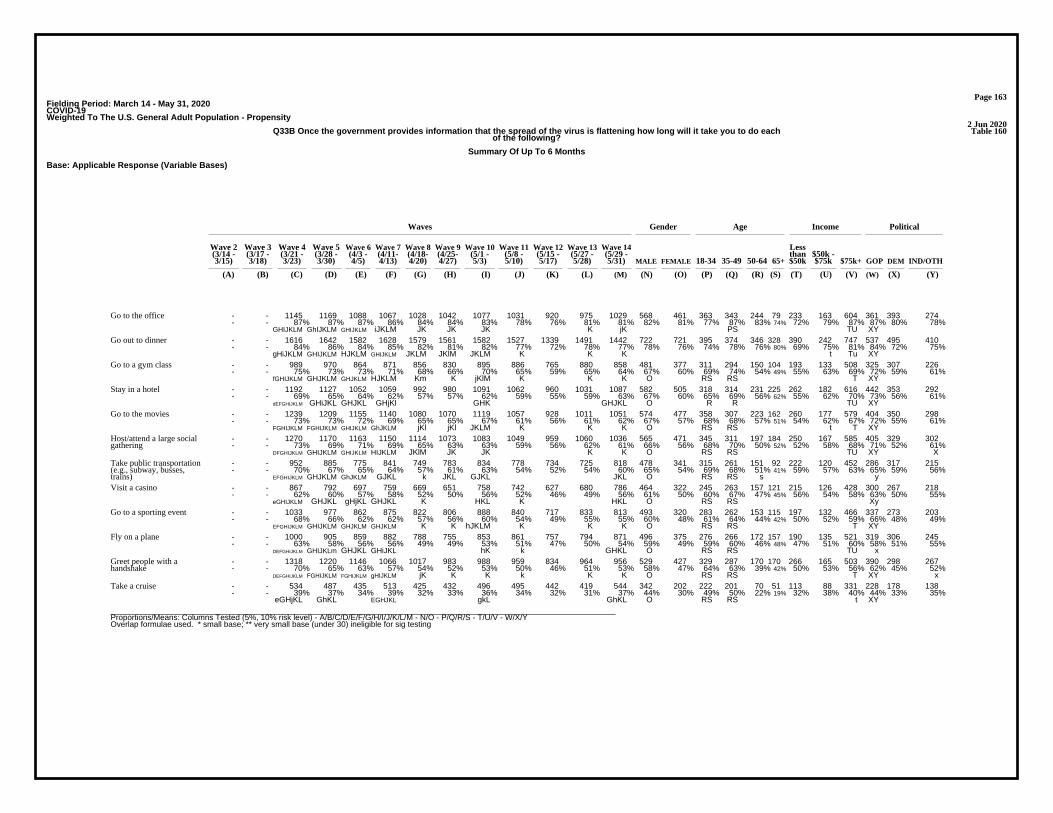
Page 163Fielding Period: March 14 - May 31, 2020COVID-19Weighted To The U.S. General Adult Population - Propensity
2 Jun 2020Table 160Q33B Once the government provides information that the spread of the virus is flattening how long will it take you to do each
of the following?
Summary Of Up To 6 Months
Base: Applicable Response (Variable Bases)
Waves Gender Age Income Political
Wave 2 Wave 3 Wave 4 Wave 5 Wave 6 Wave 7 Wave 8 Wave 9 Wave 10 Wave 11 Wave 12 Wave 13 Wave 14 Less(3/14 - (3/17 - (3/21 - (3/28 - (4/3 - (4/11- (4/18- (4/25- (5/1 - (5/8 - (5/15 - (5/27 - (5/29 - than $50k -3/15) 3/18) 3/23) 3/30) 4/5) 4/13) 4/20) 4/27) 5/3) 5/10) 5/17) 5/28) 5/31) MALE FEMALE 18-34 35-49 50-64 65+ $50k $75k $75k+ GOP DEM IND/OTH
(A) (B) (C) (D) (E) (F) (G) (H) (I) (J) (K) (L) (M) (N) (O) (P) (Q) (R) (S) (T) (U) (V) (W) (X) (Y)
- - 1145 1169 1088 1067 1028 1042 1077 1031 920 975 1029 568 461 363 343 244 79 233 163 604 361 393 274- - 87% 87% 87% 86% 84% 84% 83% 78% 76% 81% 81% 82% 81% 77% 87% 83% 74% 72% 79% 87% 87% 80% 78%
GHIJKLM GhIJKLM GHIJKLM iJKLM JK JK JK K jK PS TU XY
Go to the office
- - 1616 1642 1582 1628 1579 1561 1582 1527 1339 1491 1442 722 721 395 374 346 328 390 242 747 537 495 410- - 84% 86% 84% 85% 82% 81% 82% 77% 72% 78% 77% 78% 76% 74% 78% 76% 80% 69% 75% 81% 84% 72% 75%
gHiJKLM GHIJKLM HJKLM GHIJKLM JKLM JKlM JKLM K K K t Tu XY
Go out to dinner
- - 989 970 864 871 856 830 895 886 765 880 858 481 377 311 294 150 104 193 133 508 325 307 226- - 75% 73% 73% 71% 68% 66% 70% 65% 59% 65% 64% 67% 60% 69% 74% 54% 49% 55% 63% 69% 72% 59% 61%
fGHIJKLM GHJKLM GHJKLM HJKLM Km K jKlM K K K O RS RS T XY
Go to a gym class
- - 1192 1127 1052 1059 992 980 1091 1062 960 1031 1087 582 505 318 314 231 225 262 182 616 442 353 292- - 69% 65% 64% 62% 57% 57% 62% 59% 55% 59% 63% 67% 60% 65% 69% 56% 62% 55% 62% 70% 73% 56% 61%
dEFGHIJKLM GHiJKL GHJKL GHjKl GHK GHJKL O R R TU XY
Stay in a hotel
- - 1239 1209 1155 1140 1080 1070 1119 1057 928 1011 1051 574 477 358 307 223 162 260 177 579 404 350 298- - 73% 73% 72% 69% 65% 65% 67% 61% 56% 61% 62% 67% 57% 68% 68% 57% 51% 54% 62% 67% 72% 55% 61%
FGHIJKLM FGHIJKLM GHIJKLM GhJKLM jKl jKl JKLM K K K O RS RS t T XY
Go to the movies
- - 1270 1170 1163 1150 1114 1073 1083 1049 959 1060 1036 565 471 345 311 197 184 250 167 585 405 329 302- - 73% 69% 71% 69% 65% 63% 63% 59% 56% 62% 61% 66% 56% 68% 70% 50% 52% 52% 58% 68% 71% 52% 61%
DFGHIJKLM GHIJKLM GHIJKLM HIJKLM JKlM JK JK K K O RS RS TU XY X
Host/attend a large socialgathering
- - 952 885 775 841 749 783 834 778 734 725 818 478 341 315 261 151 92 222 120 452 286 317 215- - 70% 67% 65% 64% 57% 61% 63% 54% 52% 54% 60% 65% 54% 69% 68% 51% 41% 59% 57% 63% 65% 59% 56%
EFGHIJKLM GHJKLM GhJKLM GJKL k JKL GJKL JKL O RS RS s y
Take public transportation(e.g., subway, busses,trains)
- - 867 792 697 759 669 651 758 742 627 680 786 464 322 245 263 157 121 215 126 428 300 267 218- - 62% 60% 57% 58% 52% 50% 56% 52% 46% 49% 56% 61% 50% 60% 67% 47% 45% 56% 54% 58% 63% 50% 55%
eGHIJKLM GHJKL gHjKL GHJKL K HKL K HKL O RS RS Xy
Visit a casino
- - 1033 977 862 875 822 806 888 840 717 833 813 493 320 283 262 153 115 197 132 466 337 273 203- - 68% 66% 62% 62% 57% 56% 60% 54% 49% 55% 55% 60% 48% 61% 64% 44% 42% 50% 52% 59% 66% 48% 49%
EFGHIJKLM GHIJKLM GHJKLM GHJKLM K K hJKLM K K K O RS RS T XY
Go to a sporting event
- - 1000 905 859 882 788 755 853 861 757 794 871 496 375 276 266 172 157 190 135 521 319 306 245- - 63% 58% 56% 56% 49% 49% 53% 51% 47% 50% 54% 59% 49% 59% 60% 46% 48% 47% 51% 60% 58% 51% 55%
DEFGHIJKLM GHIJKLm GHJKL GHiJKL hK k GHKL O RS RS TU x
Fly on a plane
- - 1318 1220 1146 1066 1017 983 988 959 834 964 956 529 427 329 287 170 170 266 165 503 390 298 267- - 70% 65% 63% 57% 54% 52% 53% 50% 46% 51% 53% 58% 47% 64% 63% 39% 42% 50% 53% 56% 62% 45% 52%
DEFGHIJKLM FGHIJKLM FGHIJKLM gHIJKLM jK K K k K K O RS RS T XY x
Greet people with ahandshake
- - 534 487 435 513 425 432 496 495 442 419 544 342 202 222 201 70 51 113 88 331 228 178 138- - 39% 37% 34% 39% 32% 33% 36% 34% 32% 31% 37% 44% 30% 49% 50% 22% 19% 32% 38% 40% 44% 33% 35%
eGHjKL GhKL EGHJKL gkL GhKL O RS RS t XY
Take a cruise
__________________________________________________________________________________________________________________Proportions/Means: Columns Tested (5%, 10% risk level) - A/B/C/D/E/F/G/H/I/J/K/L/M - N/O - P/Q/R/S - T/U/V - W/X/YOverlap formulae used. * small base; ** very small base (under 30) ineligible for sig testing

Page 164Fielding Period: March 14 - May 31, 2020COVID-19Weighted To The U.S. General Adult Population - Propensity
2 Jun 2020Table 161Q33B Once the government provides information that the spread of the virus is flattening how long will it take you to do each
of the following?
Summary Of Year Or Longer
Base: Applicable Response (Variable Bases)
Waves Gender Age Income Political
Wave 2 Wave 3 Wave 4 Wave 5 Wave 6 Wave 7 Wave 8 Wave 9 Wave 10 Wave 11 Wave 12 Wave 13 Wave 14 Less(3/14 - (3/17 - (3/21 - (3/28 - (4/3 - (4/11- (4/18- (4/25- (5/1 - (5/8 - (5/15 - (5/27 - (5/29 - than $50k -3/15) 3/18) 3/23) 3/30) 4/5) 4/13) 4/20) 4/27) 5/3) 5/10) 5/17) 5/28) 5/31) MALE FEMALE 18-34 35-49 50-64 65+ $50k $75k $75k+ GOP DEM IND/OTH
(A) (B) (C) (D) (E) (F) (G) (H) (I) (J) (K) (L) (M) (N) (O) (P) (Q) (R) (S) (T) (U) (V) (W) (X) (Y)
- - 436 418 411 389 437 448 454 441 487 494 476 214 263 120 112 142 103 105 68 277 137 194 146- - 32% 32% 32% 30% 33% 34% 33% 30% 35% 36% 33% 27% 39% 26% 28% 44% 38% 30% 30% 34% 26% 36% 37%
Fj FJ CdeFJ N PQ PQ W W
Take a cruise
- - 319 359 384 343 447 454 415 464 491 480 389 184 205 84 92 111 101 92 80 188 112 165 111- - 20% 23% 25% 22% 28% 29% 26% 27% 30% 30% 24% 22% 27% 18% 21% 30% 31% 23% 30% 22% 20% 27% 25%
c C CDFm CDEFiM Cf CDF CDEFIM CDEFIM C n PQ PQ tV W
Fly on a plane
- - 234 254 269 270 339 356 320 332 410 376 341 165 176 81 70 109 81 88 70 156 77 148 116- - 15% 17% 19% 19% 23% 25% 22% 21% 28% 25% 23% 20% 26% 18% 17% 31% 30% 22% 28% 20% 15% 26% 28%
C C CDEF CDEFj CD CD CDEFGIJM CDEFij CDef N PQ PQ V W W
Go to a sporting event
- - 252 281 278 295 334 346 338 350 392 415 316 127 189 71 66 100 79 87 61 142 83 136 97- - 18% 21% 23% 23% 26% 26% 25% 24% 29% 30% 22% 17% 29% 17% 17% 30% 29% 22% 26% 19% 17% 25% 24%
c C C CDm CDefm Cd C CDEFijM CDEFghIJM C N PQ PQ v W w
Visit a casino
- - 297 318 317 355 407 398 354 417 419 396 335 135 200 82 75 104 74 110 73 131 77 146 112- - 17% 18% 19% 21% 24% 23% 20% 23% 24% 22% 20% 15% 24% 17% 16% 26% 20% 23% 25% 15% 13% 23% 23%
C CDEIM CDEiM c CDEiM CDEfIM CDem N PQ V V W W
Stay in a hotel
- - 206 240 221 259 309 313 309 380 389 330 315 137 178 64 57 107 86 114 61 120 62 146 107- - 12% 14% 13% 15% 18% 18% 18% 21% 23% 19% 19% 16% 21% 13% 13% 27% 25% 24% 21% 14% 11% 23% 22%
C CDEf CDEf CDEf CDEFghi CDEFGHILM CDEF CDEf N PQ PQ V V W W
Host/attend a large socialgathering
- - 213 216 221 242 272 311 239 304 362 352 303 125 178 62 68 88 84 105 65 118 68 150 86- - 13% 13% 14% 15% 16% 19% 14% 18% 22% 21% 18% 15% 21% 12% 15% 23% 26% 22% 23% 14% 12% 23% 18%
CDe CDEFI CDEfI CDEFGhIJM CDEFGIJm CDEFI N PQ PQ V V Wy w
Go to the movies
- - 189 189 184 187 277 250 217 330 335 331 242 105 136 54 41 79 68 60 47 116 72 95 74- - 14% 14% 15% 14% 21% 19% 16% 23% 24% 25% 18% 14% 22% 12% 11% 27% 30% 16% 22% 16% 16% 18% 19%
CDEFIm CDEF CDEFhIM CDEFHIM CDEFgHIM Cdf N PQ PQ
Take public transportation(e.g., subway, busses,trains)
- - 213 239 286 284 333 341 356 361 368 423 322 149 173 70 59 109 84 86 51 161 83 133 107- - 11% 13% 16% 15% 18% 18% 19% 19% 20% 22% 18% 16% 19% 14% 13% 25% 21% 16% 16% 18% 13% 20% 21%
CD Cd CD CDf CDEF CDEF CDEF CDEFGHIJM CD PQ PQ W W
Greet people with ahandshake
- - 125 163 115 129 181 192 176 214 231 186 218 108 110 60 45 63 50 67 32 105 50 93 75- - 9% 12% 10% 10% 14% 15% 14% 16% 18% 14% 16% 15% 18% 13% 11% 23% 24% 19% 15% 14% 11% 18% 20%
c CEF CdEF CEf CdEF CDEFgIL CEF CDEF PQ PQ W W
Go to a gym class
- - 129 121 151 120 172 175 176 218 229 205 187 96 91 48 42 57 40 72 34 73 34 88 66- - 7% 6% 8% 6% 9% 9% 9% 11% 12% 11% 10% 10% 10% 9% 9% 13% 10% 13% 11% 8% 5% 13% 12%
CDF CDF CDF CDEFg CDEFGHIm CDEF CDF V W W
Go out to dinner
- - 78 54 55 64 86 90 87 118 104 79 101 49 52 43 21 26 12 36 21 38 22 40 39- - 6% 4% 4% 5% 7% 7% 7% 9% 9% 7% 8% 7% 9% 9% 5% 9% 11% 11% 10% 5% 5% 8% 11%
d DE DEf DE CDEFl CDEF De DEF V v W
Go to the office
__________________________________________________________________________________________________________________Proportions/Means: Columns Tested (5%, 10% risk level) - A/B/C/D/E/F/G/H/I/J/K/L/M - N/O - P/Q/R/S - T/U/V - W/X/YOverlap formulae used. * small base; ** very small base (under 30) ineligible for sig testing

Page 165Fielding Period: March 14 - May 31, 2020COVID-19Weighted To The U.S. General Adult Population - Propensity
2 Jun 2020Table 162Q33B_1 Once the government provides information that the spread of the virus is flattening how long will it take you to do each
of the following?
Fly on a plane
Base: Applicable Response
Waves Gender Age Income Political
Wave 2 Wave 3 Wave 4 Wave 5 Wave 6 Wave 7 Wave 8 Wave 9 Wave 10 Wave 11 Wave 12 Wave 13 Wave 14 Less(3/14 - (3/17 - (3/21 - (3/28 - (4/3 - (4/11- (4/18- (4/25- (5/1 - (5/8 - (5/15 - (5/27 - (5/29 - than $50k -3/15) 3/18) 3/23) 3/30) 4/5) 4/13) 4/20) 4/27) 5/3) 5/10) 5/17) 5/28) 5/31) MALE FEMALE 18-34 35-49 50-64 65+ $50k $75k $75k+ GOP DEM IND/OTH
(A) (B) (C) (D) (E) (F) (G) (H) (I) (J) (K) (L) (M) (N) (O) (P) (Q) (R) (S) (T) (U) (V) (W) (X) (Y)
- - 1565 1533 1489 1503 1614 1533 1610 1627 1628 1605 1573 913 660 423 414 377 359 491 330 682 575 567 431Unweighted Base-** -** 1599 1558 1532 1562 1606 1553 1625 1689 1620 1604 1606 848 759 467 442 372 325 405 266 867 553 605 448Weighted Base
- - 1000 905 859 882 788 755 853 861 757 794 871 496 375 276 266 172 157 190 135 521 319 306 245- - 63% 58% 56% 56% 49% 49% 53% 51% 47% 50% 54% 59% 49% 59% 60% 46% 48% 47% 51% 60% 58% 51% 55%
DEFGHIJKLM GHIJKLm GHJKL GHiJKL hK k GHKL O RS RS TU x
Up To 6 Months (Net)
- - 642 589 574 568 464 464 543 515 451 492 543 334 208 179 174 113 76 112 76 342 231 167 145- - 40% 38% 37% 36% 29% 30% 33% 30% 28% 31% 34% 39% 27% 38% 39% 30% 23% 28% 29% 39% 42% 28% 32%
fGHIJKLM GHIJKLm GHiJKLm GHJKL GhK GhK O rS RS TU XY
Up To 3 Months (Sub-Net)
- - 314 298 288 288 199 219 288 259 222 250 283 178 105 86 93 64 41 73 44 160 126 78 79- - 20% 19% 19% 18% 12% 14% 18% 15% 14% 16% 18% 21% 14% 18% 21% 17% 13% 18% 16% 18% 23% 13% 18%
GHJKL GHJKL GHJKl GHjKl GHK g G GHK O s S X
Immediately/1-30 Days (Sub-Sub-Net)
- - 126 102 101 123 80 82 120 119 107 120 118 76 43 27 40 36 15 31 23 61 55 26 37- - 8% 7% 7% 8% 5% 5% 7% 7% 7% 7% 7% 9% 6% 6% 9% 10% 4% 8% 9% 7% 10% 4% 8%
GH GH Gh Gh GH Gh o s S X X
Immediately
- - 188 196 187 166 119 137 168 139 115 130 165 103 62 58 53 28 26 42 20 99 71 52 42- - 12% 13% 12% 11% 7% 9% 10% 8% 7% 8% 10% 12% 8% 12% 12% 7% 8% 10% 8% 11% 13% 9% 9%
GHJKL GHJKL GHJKL GjKl GKl GK o r r x
1-30 days
- - 327 292 286 280 264 246 255 256 228 242 259 156 103 93 81 49 35 38 33 182 104 88 67- - 20% 19% 19% 18% 16% 16% 16% 15% 14% 15% 16% 18% 14% 20% 18% 13% 11% 9% 12% 21% 19% 15% 15%
GHIJKLM hiJKL hiJKL Kl O rS S TU
2-3 months
- - 359 316 285 314 324 291 310 347 306 302 328 162 167 97 91 59 81 79 59 179 89 140 100- - 22% 20% 19% 20% 20% 19% 19% 21% 19% 19% 20% 19% 22% 21% 21% 16% 25% 19% 22% 21% 16% 23% 22%
EHikL R W w
4-6 months
- - 179 217 179 243 260 240 258 232 241 226 234 122 112 76 59 53 47 62 31 133 77 95 63- - 11% 14% 12% 16% 16% 15% 16% 14% 15% 14% 15% 14% 15% 16% 13% 14% 14% 15% 12% 15% 14% 16% 14%
c CE CE CE CE c CE C Ce
7-11 months
- - 319 359 384 343 447 454 415 464 491 480 389 184 205 84 92 111 101 92 80 188 112 165 111- - 20% 23% 25% 22% 28% 29% 26% 27% 30% 30% 24% 22% 27% 18% 21% 30% 31% 23% 30% 22% 20% 27% 25%
c C CDFm CDEFiM Cf CDF CDEFIM CDEFIM C n PQ PQ tV W
A year or longer
- - 101 78 110 93 111 104 98 132 131 103 112 46 67 31 25 36 20 61 19 25 44 39 29- - 6% 5% 7% 6% 7% 7% 6% 8% 8% 6% 7% 5% 9% 7% 6% 10% 6% 15% 7% 3% 8% 7% 6%
D d D Dfi d N UV V
Never again
- - 516 488 472 446 383 382 423 395 344 372 424 259 166 151 134 77 62 81 53 281 175 141 108- - 32% 31% 31% 29% 24% 25% 26% 23% 21% 23% 26% 31% 22% 32% 30% 21% 19% 20% 20% 32% 32% 23% 24%
fGHIJKLM GHIJKLM GHIJKLM GhJKL k K K O RS RS TU XY
1 Day To 3 Months (Net)
- - 1599 1558 1532 1562 1606 1553 1625 1689 1620 1604 1606 848 759 467 442 372 325 405 266 867 553 605 448- - 100% 100% 100% 100% 100% 100% 100% 100% 100% 100% 100% 100% 100% 100% 100% 100% 100% 100% 100% 100% 100% 100% 100%
Sigma
__________________________________________________________________________________________________________________Proportions/Means: Columns Tested (5%, 10% risk level) - A/B/C/D/E/F/G/H/I/J/K/L/M - N/O - P/Q/R/S - T/U/V - W/X/YOverlap formulae used. ** very small base (under 30) ineligible for sig testing
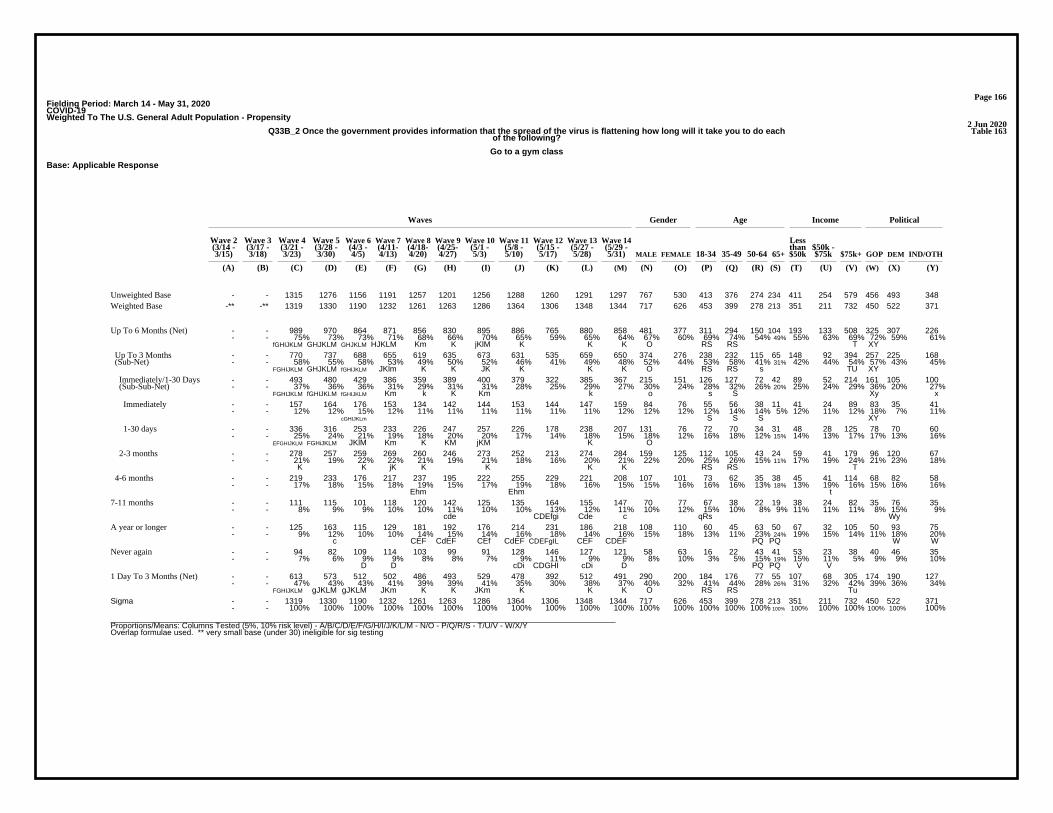
Page 166Fielding Period: March 14 - May 31, 2020COVID-19Weighted To The U.S. General Adult Population - Propensity
2 Jun 2020Table 163Q33B_2 Once the government provides information that the spread of the virus is flattening how long will it take you to do each
of the following?
Go to a gym class
Base: Applicable Response
Waves Gender Age Income Political
Wave 2 Wave 3 Wave 4 Wave 5 Wave 6 Wave 7 Wave 8 Wave 9 Wave 10 Wave 11 Wave 12 Wave 13 Wave 14 Less(3/14 - (3/17 - (3/21 - (3/28 - (4/3 - (4/11- (4/18- (4/25- (5/1 - (5/8 - (5/15 - (5/27 - (5/29 - than $50k -3/15) 3/18) 3/23) 3/30) 4/5) 4/13) 4/20) 4/27) 5/3) 5/10) 5/17) 5/28) 5/31) MALE FEMALE 18-34 35-49 50-64 65+ $50k $75k $75k+ GOP DEM IND/OTH
(A) (B) (C) (D) (E) (F) (G) (H) (I) (J) (K) (L) (M) (N) (O) (P) (Q) (R) (S) (T) (U) (V) (W) (X) (Y)
- - 1315 1276 1156 1191 1257 1201 1256 1288 1260 1291 1297 767 530 413 376 274 234 411 254 579 456 493 348Unweighted Base-** -** 1319 1330 1190 1232 1261 1263 1286 1364 1306 1348 1344 717 626 453 399 278 213 351 211 732 450 522 371Weighted Base
- - 989 970 864 871 856 830 895 886 765 880 858 481 377 311 294 150 104 193 133 508 325 307 226- - 75% 73% 73% 71% 68% 66% 70% 65% 59% 65% 64% 67% 60% 69% 74% 54% 49% 55% 63% 69% 72% 59% 61%
fGHIJKLM GHJKLM GHJKLM HJKLM Km K jKlM K K K O RS RS T XY
Up To 6 Months (Net)
- - 770 737 688 655 619 635 673 631 535 659 650 374 276 238 232 115 65 148 92 394 257 225 168- - 58% 55% 58% 53% 49% 50% 52% 46% 41% 49% 48% 52% 44% 53% 58% 41% 31% 42% 44% 54% 57% 43% 45%
FGHIJKLM GHJKLM fGHIJKLM JKlm K K JK K K K O RS RS s TU XY
Up To 3 Months (Sub-Net)
- - 493 480 429 386 359 389 400 379 322 385 367 215 151 126 127 72 42 89 52 214 161 105 100- - 37% 36% 36% 31% 29% 31% 31% 28% 25% 29% 27% 30% 24% 28% 32% 26% 20% 25% 24% 29% 36% 20% 27%
FGHIJKLM fGHIJKLM fGHIJKLM Km k K Km k o s S Xy x
Immediately/1-30 Days (Sub-Sub-Net)
- - 157 164 176 153 134 142 144 153 144 147 159 84 76 55 56 38 11 41 24 89 83 35 41- - 12% 12% 15% 12% 11% 11% 11% 11% 11% 11% 12% 12% 12% 12% 14% 14% 5% 12% 11% 12% 18% 7% 11%
cGHIJKLm S S S XY
Immediately
- - 336 316 253 233 226 247 257 226 178 238 207 131 76 72 70 34 31 48 28 125 78 70 60- - 25% 24% 21% 19% 18% 20% 20% 17% 14% 18% 15% 18% 12% 16% 18% 12% 15% 14% 13% 17% 17% 13% 16%
EFGHIJKLM FGHiJKLM JKlM Km K KM jKM K O
1-30 days
- - 278 257 259 269 260 246 273 252 213 274 284 159 125 112 105 43 24 59 41 179 96 120 67- - 21% 19% 22% 22% 21% 19% 21% 18% 16% 20% 21% 22% 20% 25% 26% 15% 11% 17% 19% 24% 21% 23% 18%
K K jK K K K K RS RS T
2-3 months
- - 219 233 176 217 237 195 222 255 229 221 208 107 101 73 62 35 38 45 41 114 68 82 58- - 17% 18% 15% 18% 19% 15% 17% 19% 18% 16% 15% 15% 16% 16% 16% 13% 18% 13% 19% 16% 15% 16% 16%
Ehm Ehm t
4-6 months
- - 111 115 101 118 120 142 125 135 164 155 147 70 77 67 38 22 19 38 24 82 35 76 35- - 8% 9% 9% 10% 10% 11% 10% 10% 13% 12% 11% 10% 12% 15% 10% 8% 9% 11% 11% 11% 8% 15% 9%
cde CDEfgi Cde c qRs Wy
7-11 months
- - 125 163 115 129 181 192 176 214 231 186 218 108 110 60 45 63 50 67 32 105 50 93 75- - 9% 12% 10% 10% 14% 15% 14% 16% 18% 14% 16% 15% 18% 13% 11% 23% 24% 19% 15% 14% 11% 18% 20%
c CEF CdEF CEf CdEF CDEFgIL CEF CDEF PQ PQ W W
A year or longer
- - 94 82 109 114 103 99 91 128 146 127 121 58 63 16 22 43 41 53 23 38 40 46 35- - 7% 6% 9% 9% 8% 8% 7% 9% 11% 9% 9% 8% 10% 3% 5% 15% 19% 15% 11% 5% 9% 9% 10%
D D cDi CDGHI cDi D PQ PQ V V
Never again
- - 613 573 512 502 486 493 529 478 392 512 491 290 200 184 176 77 55 107 68 305 174 190 127- - 47% 43% 43% 41% 39% 39% 41% 35% 30% 38% 37% 40% 32% 41% 44% 28% 26% 31% 32% 42% 39% 36% 34%
FGHIJKLM gJKLM gJKLM JKm K K JKm K K K O RS RS Tu
1 Day To 3 Months (Net)
- - 1319 1330 1190 1232 1261 1263 1286 1364 1306 1348 1344 717 626 453 399 278 213 351 211 732 450 522 371- - 100% 100% 100% 100% 100% 100% 100% 100% 100% 100% 100% 100% 100% 100% 100% 100% 100% 100% 100% 100% 100% 100% 100%
Sigma
__________________________________________________________________________________________________________________Proportions/Means: Columns Tested (5%, 10% risk level) - A/B/C/D/E/F/G/H/I/J/K/L/M - N/O - P/Q/R/S - T/U/V - W/X/YOverlap formulae used. ** very small base (under 30) ineligible for sig testing
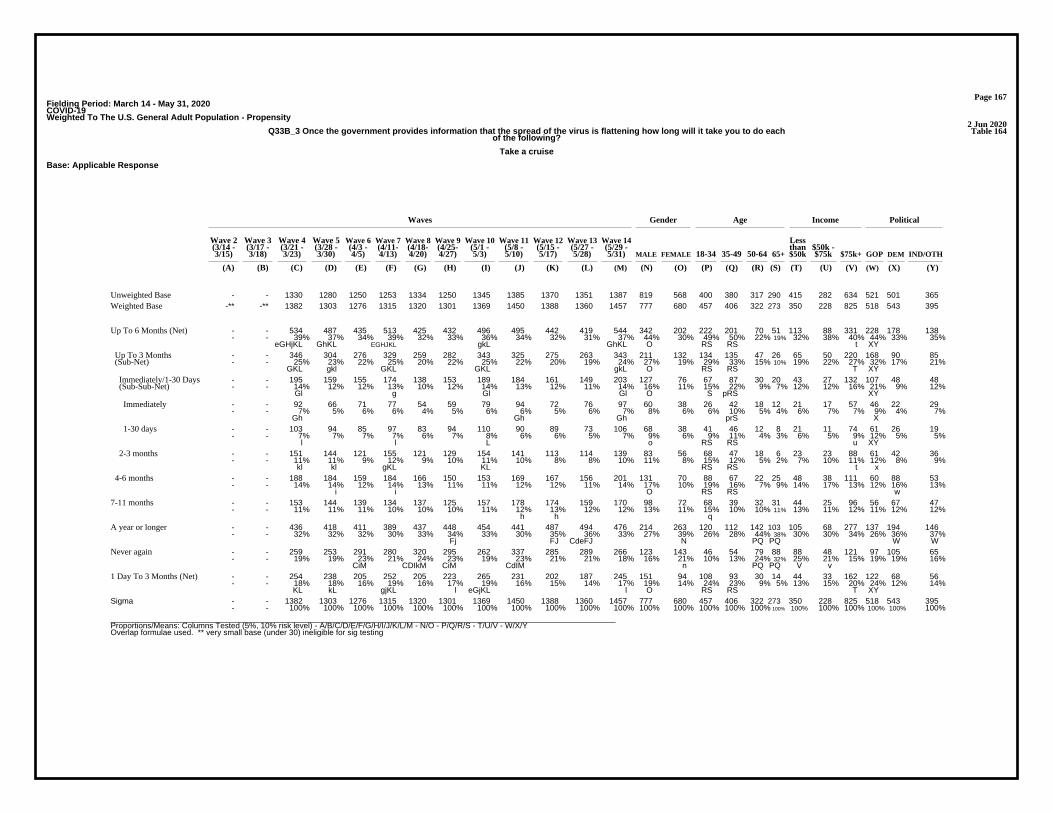
Page 167Fielding Period: March 14 - May 31, 2020COVID-19Weighted To The U.S. General Adult Population - Propensity
2 Jun 2020Table 164Q33B_3 Once the government provides information that the spread of the virus is flattening how long will it take you to do each
of the following?
Take a cruise
Base: Applicable Response
Waves Gender Age Income Political
Wave 2 Wave 3 Wave 4 Wave 5 Wave 6 Wave 7 Wave 8 Wave 9 Wave 10 Wave 11 Wave 12 Wave 13 Wave 14 Less(3/14 - (3/17 - (3/21 - (3/28 - (4/3 - (4/11- (4/18- (4/25- (5/1 - (5/8 - (5/15 - (5/27 - (5/29 - than $50k -3/15) 3/18) 3/23) 3/30) 4/5) 4/13) 4/20) 4/27) 5/3) 5/10) 5/17) 5/28) 5/31) MALE FEMALE 18-34 35-49 50-64 65+ $50k $75k $75k+ GOP DEM IND/OTH
(A) (B) (C) (D) (E) (F) (G) (H) (I) (J) (K) (L) (M) (N) (O) (P) (Q) (R) (S) (T) (U) (V) (W) (X) (Y)
- - 1330 1280 1250 1253 1334 1250 1345 1385 1370 1351 1387 819 568 400 380 317 290 415 282 634 521 501 365Unweighted Base-** -** 1382 1303 1276 1315 1320 1301 1369 1450 1388 1360 1457 777 680 457 406 322 273 350 228 825 518 543 395Weighted Base
- - 534 487 435 513 425 432 496 495 442 419 544 342 202 222 201 70 51 113 88 331 228 178 138- - 39% 37% 34% 39% 32% 33% 36% 34% 32% 31% 37% 44% 30% 49% 50% 22% 19% 32% 38% 40% 44% 33% 35%
eGHjKL GhKL EGHJKL gkL GhKL O RS RS t XY
Up To 6 Months (Net)
- - 346 304 276 329 259 282 343 325 275 263 343 211 132 134 135 47 26 65 50 220 168 90 85- - 25% 23% 22% 25% 20% 22% 25% 22% 20% 19% 24% 27% 19% 29% 33% 15% 10% 19% 22% 27% 32% 17% 21%
GKL gkl GKL GKL gkL O RS RS T XY
Up To 3 Months (Sub-Net)
- - 195 159 155 174 138 153 189 184 161 149 203 127 76 67 87 30 20 43 27 132 107 48 48- - 14% 12% 12% 13% 10% 12% 14% 13% 12% 11% 14% 16% 11% 15% 22% 9% 7% 12% 12% 16% 21% 9% 12%
Gl g Gl Gl O S pRS XY
Immediately/1-30 Days (Sub-Sub-Net)
- - 92 66 71 77 54 59 79 94 72 76 97 60 38 26 42 18 12 21 17 57 46 22 29- - 7% 5% 6% 6% 4% 5% 6% 6% 5% 6% 7% 8% 6% 6% 10% 5% 4% 6% 7% 7% 9% 4% 7%
Gh Gh Gh prS X
Immediately
- - 103 94 85 97 83 94 110 90 89 73 106 68 38 41 46 12 8 21 11 74 61 26 19- - 7% 7% 7% 7% 6% 7% 8% 6% 6% 5% 7% 9% 6% 9% 11% 4% 3% 6% 5% 9% 12% 5% 5%
l l L o RS RS u XY
1-30 days
- - 151 144 121 155 121 129 154 141 113 114 139 83 56 68 47 18 6 23 23 88 61 42 36- - 11% 11% 9% 12% 9% 10% 11% 10% 8% 8% 10% 11% 8% 15% 12% 5% 2% 7% 10% 11% 12% 8% 9%
kl kl gKL KL RS RS t x
2-3 months
- - 188 184 159 184 166 150 153 169 167 156 201 131 70 88 67 22 25 48 38 111 60 88 53- - 14% 14% 12% 14% 13% 11% 11% 12% 12% 11% 14% 17% 10% 19% 16% 7% 9% 14% 17% 13% 12% 16% 13%
i i O RS RS w
4-6 months
- - 153 144 139 134 137 125 157 178 174 159 170 98 72 68 39 32 31 44 25 96 56 67 47- - 11% 11% 11% 10% 10% 10% 11% 12% 13% 12% 12% 13% 11% 15% 10% 10% 11% 13% 11% 12% 11% 12% 12%
h h q
7-11 months
- - 436 418 411 389 437 448 454 441 487 494 476 214 263 120 112 142 103 105 68 277 137 194 146- - 32% 32% 32% 30% 33% 34% 33% 30% 35% 36% 33% 27% 39% 26% 28% 44% 38% 30% 30% 34% 26% 36% 37%
Fj FJ CdeFJ N PQ PQ W W
A year or longer
- - 259 253 291 280 320 295 262 337 285 289 266 123 143 46 54 79 88 88 48 121 97 105 65- - 19% 19% 23% 21% 24% 23% 19% 23% 21% 21% 18% 16% 21% 10% 13% 24% 32% 25% 21% 15% 19% 19% 16%
CiM CDIkM CiM CdIM n PQ PQ V v
Never again
- - 254 238 205 252 205 223 265 231 202 187 245 151 94 108 93 30 14 44 33 162 122 68 56- - 18% 18% 16% 19% 16% 17% 19% 16% 15% 14% 17% 19% 14% 24% 23% 9% 5% 13% 15% 20% 24% 12% 14%
KL kL gjKL l eGjKL l O RS RS T XY
1 Day To 3 Months (Net)
- - 1382 1303 1276 1315 1320 1301 1369 1450 1388 1360 1457 777 680 457 406 322 273 350 228 825 518 543 395- - 100% 100% 100% 100% 100% 100% 100% 100% 100% 100% 100% 100% 100% 100% 100% 100% 100% 100% 100% 100% 100% 100% 100%
Sigma
__________________________________________________________________________________________________________________Proportions/Means: Columns Tested (5%, 10% risk level) - A/B/C/D/E/F/G/H/I/J/K/L/M - N/O - P/Q/R/S - T/U/V - W/X/YOverlap formulae used. ** very small base (under 30) ineligible for sig testing

Page 168Fielding Period: March 14 - May 31, 2020COVID-19Weighted To The U.S. General Adult Population - Propensity
2 Jun 2020Table 165Q33B_4 Once the government provides information that the spread of the virus is flattening how long will it take you to do each
of the following?
Go out to dinner
Base: Applicable Response
Waves Gender Age Income Political
Wave 2 Wave 3 Wave 4 Wave 5 Wave 6 Wave 7 Wave 8 Wave 9 Wave 10 Wave 11 Wave 12 Wave 13 Wave 14 Less(3/14 - (3/17 - (3/21 - (3/28 - (4/3 - (4/11- (4/18- (4/25- (5/1 - (5/8 - (5/15 - (5/27 - (5/29 - than $50k -3/15) 3/18) 3/23) 3/30) 4/5) 4/13) 4/20) 4/27) 5/3) 5/10) 5/17) 5/28) 5/31) MALE FEMALE 18-34 35-49 50-64 65+ $50k $75k $75k+ GOP DEM IND/OTH
(A) (B) (C) (D) (E) (F) (G) (H) (I) (J) (K) (L) (M) (N) (O) (P) (Q) (R) (S) (T) (U) (V) (W) (X) (Y)
- - 1911 1926 1885 1902 1942 1941 1950 1951 1871 1924 1890 1040 850 478 459 482 471 701 387 721 676 666 548Unweighted Base-** -** 1913 1910 1882 1912 1930 1934 1940 1985 1872 1914 1882 930 952 535 480 456 412 562 320 922 643 692 547Weighted Base
- - 1616 1642 1582 1628 1579 1561 1582 1527 1339 1491 1442 722 721 395 374 346 328 390 242 747 537 495 410- - 84% 86% 84% 85% 82% 81% 82% 77% 72% 78% 77% 78% 76% 74% 78% 76% 80% 69% 75% 81% 84% 72% 75%
gHiJKLM GHIJKLM HJKLM GHIJKLM JKLM JKlM JKLM K K K t Tu XY
Up To 6 Months (Net)
- - 1336 1321 1271 1238 1214 1230 1250 1135 991 1139 1143 590 554 319 304 267 254 310 177 606 460 347 336- - 70% 69% 68% 65% 63% 64% 64% 57% 53% 60% 61% 63% 58% 60% 63% 58% 62% 55% 55% 66% 72% 50% 62%
FGHIJKLM FGHIJKLM GHJKLM JKLM JKl JKL JKLm K K jK o TU XY X
Up To 3 Months (Sub-Net)
- - 870 822 807 761 722 795 732 637 568 706 701 359 342 203 183 167 148 209 109 348 307 179 215- - 45% 43% 43% 40% 37% 41% 38% 32% 30% 37% 37% 39% 36% 38% 38% 37% 36% 37% 34% 38% 48% 26% 39%
FGHIJKLM GIJKLM GIJKLM JK JK giJKLm JK JK JK XY X
Immediately/1-30 Days (Sub-Sub-Net)
- - 300 265 238 293 221 243 292 244 232 298 300 154 147 87 84 71 58 93 40 161 157 47 97- - 16% 14% 13% 15% 11% 13% 15% 12% 12% 16% 16% 17% 15% 16% 18% 16% 14% 17% 13% 17% 24% 7% 18%
EGHJK g eGHJK eGhJk EGHJK EGHJK u XY X
Immediately
- - 571 557 569 468 501 552 439 393 337 408 401 205 195 116 98 96 91 116 69 187 150 133 118- - 30% 29% 30% 24% 26% 29% 23% 20% 18% 21% 21% 22% 21% 22% 21% 21% 22% 21% 22% 20% 23% 19% 22%
FGIJKLM FgIJKLM FGIJKLM JKlm iJKLM FIJKLM jK K k
1-30 days
- - 466 500 464 477 492 435 518 499 422 433 443 231 211 116 122 99 105 101 68 258 153 167 122- - 24% 26% 25% 25% 25% 22% 27% 25% 23% 23% 24% 25% 22% 22% 25% 22% 26% 18% 21% 28% 24% 24% 22%
HKL hl HKLm Tu
2-3 months
- - 280 321 311 390 365 331 332 392 349 352 299 132 167 76 69 79 74 80 64 142 77 148 74- - 15% 17% 17% 20% 19% 17% 17% 20% 19% 18% 16% 14% 18% 14% 14% 17% 18% 14% 20% 15% 12% 21% 13%
CDEHIM CM c c CdEhiM Cm C T WY
4-6 months
- - 125 126 120 133 162 171 162 188 246 188 200 86 114 66 52 41 42 69 39 88 60 87 53- - 7% 7% 6% 7% 8% 9% 8% 9% 13% 10% 11% 9% 12% 12% 11% 9% 10% 12% 12% 10% 9% 13% 10%
cde CDEf ce CDEF CDEFGHIJLm CDEF CDEFgi
7-11 months
- - 129 121 151 120 172 175 176 218 229 205 187 96 91 48 42 57 40 72 34 73 34 88 66- - 7% 6% 8% 6% 9% 9% 9% 11% 12% 11% 10% 10% 10% 9% 9% 13% 10% 13% 11% 8% 5% 13% 12%
CDF CDF CDF CDEFg CDEFGHIm CDEF CDF V W W
A year or longer
- - 43 21 30 32 18 27 20 52 58 30 53 27 26 27 12 12 2 31 6 13 12 23 18- - 2% 1% 2% 2% 1% 1% 1% 3% 3% 2% 3% 3% 3% 5% 3% 3% 1% 6% 2% 1% 2% 3% 3%
DGI g DeGHIl DEFGHIL DEfGHIL S s S UV
Never again
- - 1036 1056 1033 945 993 987 958 892 759 842 843 436 407 232 220 195 196 217 137 445 303 300 240- - 54% 55% 55% 49% 51% 51% 49% 45% 41% 44% 45% 47% 43% 43% 46% 43% 48% 39% 43% 48% 47% 43% 44%
FIJKLM FgHIJKLM FghIJKLM JKLM JKLM JKLM JKLM K k K T
1 Day To 3 Months (Net)
- - 1913 1910 1882 1912 1930 1934 1940 1985 1872 1914 1882 930 952 535 480 456 412 562 320 922 643 692 547- - 100% 100% 100% 100% 100% 100% 100% 100% 100% 100% 100% 100% 100% 100% 100% 100% 100% 100% 100% 100% 100% 100% 100%
Sigma
__________________________________________________________________________________________________________________Proportions/Means: Columns Tested (5%, 10% risk level) - A/B/C/D/E/F/G/H/I/J/K/L/M - N/O - P/Q/R/S - T/U/V - W/X/YOverlap formulae used. ** very small base (under 30) ineligible for sig testing

Page 169Fielding Period: March 14 - May 31, 2020COVID-19Weighted To The U.S. General Adult Population - Propensity
2 Jun 2020Table 166Q33B_5 Once the government provides information that the spread of the virus is flattening how long will it take you to do each
of the following?
Visit a casino
Base: Applicable Response
Waves Gender Age Income Political
Wave 2 Wave 3 Wave 4 Wave 5 Wave 6 Wave 7 Wave 8 Wave 9 Wave 10 Wave 11 Wave 12 Wave 13 Wave 14 Less(3/14 - (3/17 - (3/21 - (3/28 - (4/3 - (4/11- (4/18- (4/25- (5/1 - (5/8 - (5/15 - (5/27 - (5/29 - than $50k -3/15) 3/18) 3/23) 3/30) 4/5) 4/13) 4/20) 4/27) 5/3) 5/10) 5/17) 5/28) 5/31) MALE FEMALE 18-34 35-49 50-64 65+ $50k $75k $75k+ GOP DEM IND/OTH
(A) (B) (C) (D) (E) (F) (G) (H) (I) (J) (K) (L) (M) (N) (O) (P) (Q) (R) (S) (T) (U) (V) (W) (X) (Y)
- - 1377 1307 1192 1277 1284 1260 1327 1374 1315 1355 1382 819 563 377 373 338 294 463 287 583 501 506 375Unweighted Base-** -** 1410 1326 1227 1300 1287 1312 1356 1430 1370 1382 1407 756 651 411 395 333 268 388 232 736 473 537 397Weighted Base
- - 867 792 697 759 669 651 758 742 627 680 786 464 322 245 263 157 121 215 126 428 300 267 218- - 62% 60% 57% 58% 52% 50% 56% 52% 46% 49% 56% 61% 50% 60% 67% 47% 45% 56% 54% 58% 63% 50% 55%
eGHIJKLM GHJKL gHjKL GHJKL K HKL K HKL O RS RS Xy
Up To 6 Months (Net)
- - 612 536 480 522 424 406 521 469 402 476 520 320 200 158 176 102 84 136 88 289 234 147 138- - 43% 40% 39% 40% 33% 31% 38% 33% 29% 34% 37% 42% 31% 38% 45% 31% 31% 35% 38% 39% 49% 27% 35%
eGHIJKLM GHJKL GHJKl GHJKL GHJKl K gHjK O RS XY x
Up To 3 Months (Sub-Net)
- - 312 293 245 257 197 211 270 269 240 255 268 176 92 87 96 49 36 76 49 138 118 72 78- - 22% 22% 20% 20% 15% 16% 20% 19% 18% 18% 19% 23% 14% 21% 24% 15% 13% 20% 21% 19% 25% 13% 20%
GHjKl GHKl GH Gh GH g g G O rs RS X x
Immediately/1-30 Days (Sub-Sub-Net)
- - 127 102 93 105 73 82 123 119 117 108 133 84 49 40 49 29 15 40 24 67 64 27 42- - 9% 8% 8% 8% 6% 6% 9% 8% 9% 8% 9% 11% 8% 10% 12% 9% 5% 10% 10% 9% 13% 5% 11%
GH g g GH Gh Gh g GH o S X X
Immediately
- - 185 190 152 153 124 129 147 150 123 147 135 92 43 47 46 20 21 36 24 71 54 45 36- - 13% 14% 12% 12% 10% 10% 11% 10% 9% 11% 10% 12% 7% 11% 12% 6% 8% 9% 10% 10% 12% 8% 9%
GHjKM GHIJKLM gKm k O r R
1-30 days
- - 300 243 235 265 227 195 251 201 161 221 252 144 108 71 81 53 48 60 39 151 116 76 60- - 21% 18% 19% 20% 18% 15% 18% 14% 12% 16% 18% 19% 17% 17% 20% 16% 18% 15% 17% 21% 24% 14% 15%
gHJKLm hJK HJK HJKL JK k hJK K JK t XY
2-3 months
- - 255 256 217 237 245 245 237 273 225 204 266 144 122 87 87 55 37 80 38 139 66 120 80- - 18% 19% 18% 18% 19% 19% 17% 19% 16% 15% 19% 19% 19% 21% 22% 17% 14% 21% 17% 19% 14% 22% 20%
l L l L L L L s S W w
4-6 months
- - 166 151 150 154 170 190 167 203 195 137 171 105 66 60 38 43 30 35 21 108 51 83 37- - 12% 11% 12% 12% 13% 15% 12% 14% 14% 10% 12% 14% 10% 15% 10% 13% 11% 9% 9% 15% 11% 15% 9%
L cdL dL dL q Tu wY
7-11 months
- - 252 281 278 295 334 346 338 350 392 415 316 127 189 71 66 100 79 87 61 142 83 136 97- - 18% 21% 23% 23% 26% 26% 25% 24% 29% 30% 22% 17% 29% 17% 17% 30% 29% 22% 26% 19% 17% 25% 24%
c C C CDm CDefm Cd C CDEFijM CDEFghIJM C N PQ PQ v W w
A year or longer
- - 125 102 103 92 114 125 94 135 156 150 135 61 74 35 29 32 39 51 23 57 40 50 44- - 9% 8% 8% 7% 9% 10% 7% 9% 11% 11% 10% 8% 11% 8% 7% 10% 14% 13% 10% 8% 8% 9% 11%
fi fi cDeFgI DeFI fi pQ V
Never again
- - 485 433 387 417 351 324 398 350 285 368 387 236 151 118 127 73 69 96 64 222 170 120 96- - 34% 33% 32% 32% 27% 25% 29% 25% 21% 27% 28% 31% 23% 29% 32% 22% 26% 25% 27% 30% 36% 22% 24%
GHIJKLM GHJKLM gHJKLm GHJKLM K k HJK k K K O R XY
1 Day To 3 Months (Net)
- - 1410 1326 1227 1300 1287 1312 1356 1430 1370 1382 1407 756 651 411 395 333 268 388 232 736 473 537 397- - 100% 100% 100% 100% 100% 100% 100% 100% 100% 100% 100% 100% 100% 100% 100% 100% 100% 100% 100% 100% 100% 100% 100%
Sigma
__________________________________________________________________________________________________________________Proportions/Means: Columns Tested (5%, 10% risk level) - A/B/C/D/E/F/G/H/I/J/K/L/M - N/O - P/Q/R/S - T/U/V - W/X/YOverlap formulae used. ** very small base (under 30) ineligible for sig testing
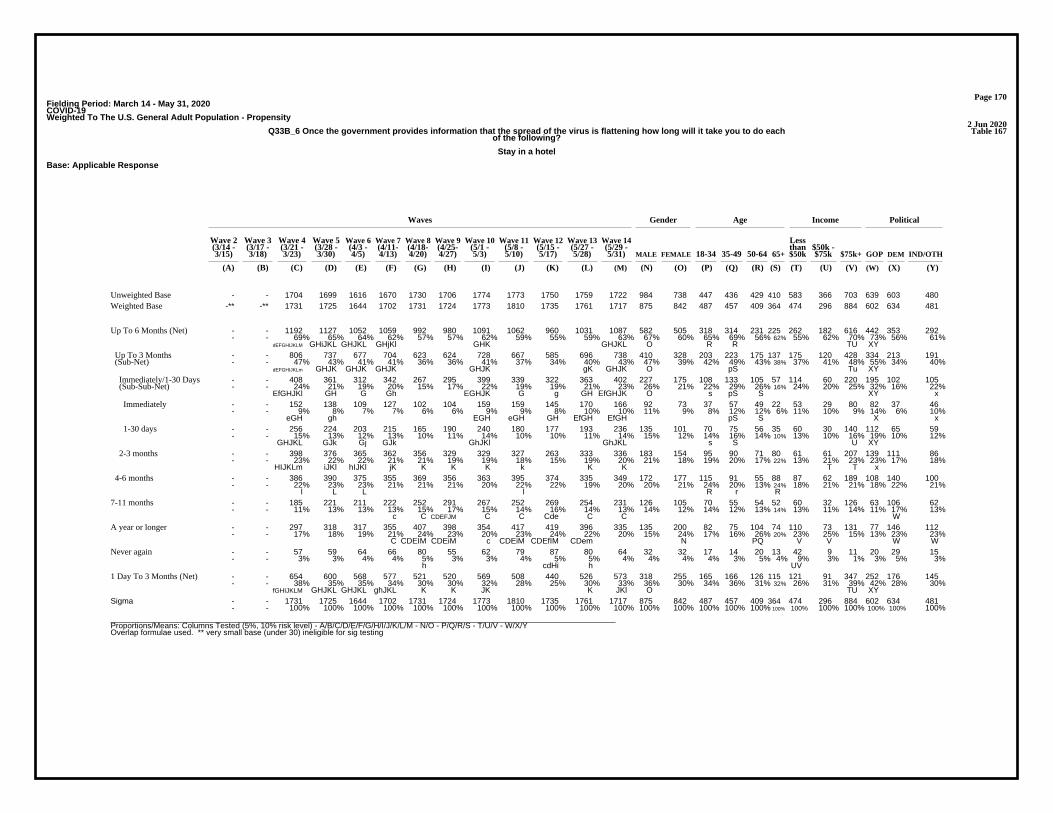
Page 170Fielding Period: March 14 - May 31, 2020COVID-19Weighted To The U.S. General Adult Population - Propensity
2 Jun 2020Table 167Q33B_6 Once the government provides information that the spread of the virus is flattening how long will it take you to do each
of the following?
Stay in a hotel
Base: Applicable Response
Waves Gender Age Income Political
Wave 2 Wave 3 Wave 4 Wave 5 Wave 6 Wave 7 Wave 8 Wave 9 Wave 10 Wave 11 Wave 12 Wave 13 Wave 14 Less(3/14 - (3/17 - (3/21 - (3/28 - (4/3 - (4/11- (4/18- (4/25- (5/1 - (5/8 - (5/15 - (5/27 - (5/29 - than $50k -3/15) 3/18) 3/23) 3/30) 4/5) 4/13) 4/20) 4/27) 5/3) 5/10) 5/17) 5/28) 5/31) MALE FEMALE 18-34 35-49 50-64 65+ $50k $75k $75k+ GOP DEM IND/OTH
(A) (B) (C) (D) (E) (F) (G) (H) (I) (J) (K) (L) (M) (N) (O) (P) (Q) (R) (S) (T) (U) (V) (W) (X) (Y)
- - 1704 1699 1616 1670 1730 1706 1774 1773 1750 1759 1722 984 738 447 436 429 410 583 366 703 639 603 480Unweighted Base-** -** 1731 1725 1644 1702 1731 1724 1773 1810 1735 1761 1717 875 842 487 457 409 364 474 296 884 602 634 481Weighted Base
- - 1192 1127 1052 1059 992 980 1091 1062 960 1031 1087 582 505 318 314 231 225 262 182 616 442 353 292- - 69% 65% 64% 62% 57% 57% 62% 59% 55% 59% 63% 67% 60% 65% 69% 56% 62% 55% 62% 70% 73% 56% 61%
dEFGHIJKLM GHiJKL GHJKL GHjKl GHK GHJKL O R R TU XY
Up To 6 Months (Net)
- - 806 737 677 704 623 624 728 667 585 696 738 410 328 203 223 175 137 175 120 428 334 213 191- - 47% 43% 41% 41% 36% 36% 41% 37% 34% 40% 43% 47% 39% 42% 49% 43% 38% 37% 41% 48% 55% 34% 40%
dEFGHIJKLm GHJK GHJK GHJK GHJK gK GHJK O pS Tu XY
Up To 3 Months (Sub-Net)
- - 408 361 312 342 267 295 399 339 322 363 402 227 175 108 133 105 57 114 60 220 195 102 105- - 24% 21% 19% 20% 15% 17% 22% 19% 19% 21% 23% 26% 21% 22% 29% 26% 16% 24% 20% 25% 32% 16% 22%
EfGHJKl GH G Gh EGHJK G g GH EfGHJK O s pS S XY x
Immediately/1-30 Days (Sub-Sub-Net)
- - 152 138 109 127 102 104 159 159 145 170 166 92 73 37 57 49 22 53 29 80 82 37 46- - 9% 8% 7% 7% 6% 6% 9% 9% 8% 10% 10% 11% 9% 8% 12% 12% 6% 11% 10% 9% 14% 6% 10%
eGH gh EGH eGH GH EfGH EfGH pS S X x
Immediately
- - 256 224 203 215 165 190 240 180 177 193 236 135 101 70 75 56 35 60 30 140 112 65 59- - 15% 13% 12% 13% 10% 11% 14% 10% 10% 11% 14% 15% 12% 14% 16% 14% 10% 13% 10% 16% 19% 10% 12%
GHJKL GJk Gj GJk GhJKl GhJKL s S U XY
1-30 days
- - 398 376 365 362 356 329 329 327 263 333 336 183 154 95 90 71 80 61 61 207 139 111 86- - 23% 22% 22% 21% 21% 19% 19% 18% 15% 19% 20% 21% 18% 19% 20% 17% 22% 13% 21% 23% 23% 17% 18%
HIJKLm iJKl hIJKl jK K K K k K K T T x
2-3 months
- - 386 390 375 355 369 356 363 395 374 335 349 172 177 115 91 55 88 87 62 189 108 140 100- - 22% 23% 23% 21% 21% 21% 20% 22% 22% 19% 20% 20% 21% 24% 20% 13% 24% 18% 21% 21% 18% 22% 21%
l L L l R r R
4-6 months
- - 185 221 211 222 252 291 267 252 269 254 231 126 105 70 55 54 52 60 32 126 63 106 62- - 11% 13% 13% 13% 15% 17% 15% 14% 16% 14% 13% 14% 12% 14% 12% 13% 14% 13% 11% 14% 11% 17% 13%
c C CDEFJM C C Cde C C W
7-11 months
- - 297 318 317 355 407 398 354 417 419 396 335 135 200 82 75 104 74 110 73 131 77 146 112- - 17% 18% 19% 21% 24% 23% 20% 23% 24% 22% 20% 15% 24% 17% 16% 26% 20% 23% 25% 15% 13% 23% 23%
C CDEIM CDEiM c CDEiM CDEfIM CDem N PQ V V W W
A year or longer
- - 57 59 64 66 80 55 62 79 87 80 64 32 32 17 14 20 13 42 9 11 20 29 15- - 3% 3% 4% 4% 5% 3% 3% 4% 5% 5% 4% 4% 4% 4% 3% 5% 4% 9% 3% 1% 3% 5% 3%
h cdHi h UV
Never again
- - 654 600 568 577 521 520 569 508 440 526 573 318 255 165 166 126 115 121 91 347 252 176 145- - 38% 35% 35% 34% 30% 30% 32% 28% 25% 30% 33% 36% 30% 34% 36% 31% 32% 26% 31% 39% 42% 28% 30%
fGHIJKLM GHJKL GHJKL ghJKL K K JK K JKl O TU XY
1 Day To 3 Months (Net)
- - 1731 1725 1644 1702 1731 1724 1773 1810 1735 1761 1717 875 842 487 457 409 364 474 296 884 602 634 481- - 100% 100% 100% 100% 100% 100% 100% 100% 100% 100% 100% 100% 100% 100% 100% 100% 100% 100% 100% 100% 100% 100% 100%
Sigma
__________________________________________________________________________________________________________________Proportions/Means: Columns Tested (5%, 10% risk level) - A/B/C/D/E/F/G/H/I/J/K/L/M - N/O - P/Q/R/S - T/U/V - W/X/YOverlap formulae used. ** very small base (under 30) ineligible for sig testing
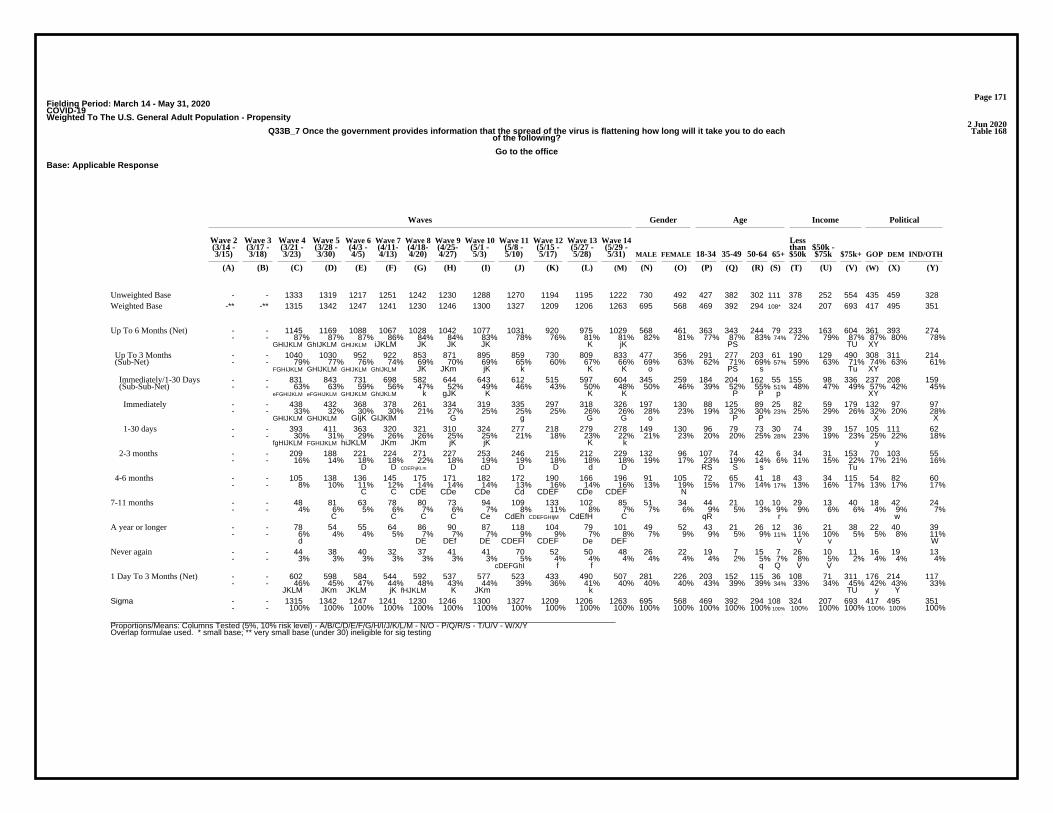
Page 171Fielding Period: March 14 - May 31, 2020COVID-19Weighted To The U.S. General Adult Population - Propensity
2 Jun 2020Table 168Q33B_7 Once the government provides information that the spread of the virus is flattening how long will it take you to do each
of the following?
Go to the office
Base: Applicable Response
Waves Gender Age Income Political
Wave 2 Wave 3 Wave 4 Wave 5 Wave 6 Wave 7 Wave 8 Wave 9 Wave 10 Wave 11 Wave 12 Wave 13 Wave 14 Less(3/14 - (3/17 - (3/21 - (3/28 - (4/3 - (4/11- (4/18- (4/25- (5/1 - (5/8 - (5/15 - (5/27 - (5/29 - than $50k -3/15) 3/18) 3/23) 3/30) 4/5) 4/13) 4/20) 4/27) 5/3) 5/10) 5/17) 5/28) 5/31) MALE FEMALE 18-34 35-49 50-64 65+ $50k $75k $75k+ GOP DEM IND/OTH
(A) (B) (C) (D) (E) (F) (G) (H) (I) (J) (K) (L) (M) (N) (O) (P) (Q) (R) (S) (T) (U) (V) (W) (X) (Y)
- - 1333 1319 1217 1251 1242 1230 1288 1270 1194 1195 1222 730 492 427 382 302 111 378 252 554 435 459 328Unweighted Base-** -** 1315 1342 1247 1241 1230 1246 1300 1327 1209 1206 1263 695 568 469 392 294 108* 324 207 693 417 495 351Weighted Base
- - 1145 1169 1088 1067 1028 1042 1077 1031 920 975 1029 568 461 363 343 244 79 233 163 604 361 393 274- - 87% 87% 87% 86% 84% 84% 83% 78% 76% 81% 81% 82% 81% 77% 87% 83% 74% 72% 79% 87% 87% 80% 78%
GHIJKLM GhIJKLM GHIJKLM iJKLM JK JK JK K jK PS TU XY
Up To 6 Months (Net)
- - 1040 1030 952 922 853 871 895 859 730 809 833 477 356 291 277 203 61 190 129 490 308 311 214- - 79% 77% 76% 74% 69% 70% 69% 65% 60% 67% 66% 69% 63% 62% 71% 69% 57% 59% 63% 71% 74% 63% 61%
FGHIJKLM GHIJKLM GHIJKLM GhIJKLM JK JKm jK k K K o PS s Tu XY
Up To 3 Months (Sub-Net)
- - 831 843 731 698 582 644 643 612 515 597 604 345 259 184 204 162 55 155 98 336 237 208 159- - 63% 63% 59% 56% 47% 52% 49% 46% 43% 50% 48% 50% 46% 39% 52% 55% 51% 48% 47% 49% 57% 42% 45%
eFGHIJKLM eFGHIJKLM GHIJKLM GhIJKLM k gJK K K K P P p XY
Immediately/1-30 Days (Sub-Sub-Net)
- - 438 432 368 378 261 334 319 335 297 318 326 197 130 88 125 89 25 82 59 179 132 97 97- - 33% 32% 30% 30% 21% 27% 25% 25% 25% 26% 26% 28% 23% 19% 32% 30% 23% 25% 29% 26% 32% 20% 28%
GHIJKLM GHIJKLM GIjK GIJKlM G g G G o P P X X
Immediately
- - 393 411 363 320 321 310 324 277 218 279 278 149 130 96 79 73 30 74 39 157 105 111 62- - 30% 31% 29% 26% 26% 25% 25% 21% 18% 23% 22% 21% 23% 20% 20% 25% 28% 23% 19% 23% 25% 22% 18%
fgHIJKLM FGHIJKLM hiJKLM JKm JKm jK jK K k y
1-30 days
- - 209 188 221 224 271 227 253 246 215 212 229 132 96 107 74 42 6 34 31 153 70 103 55- - 16% 14% 18% 18% 22% 18% 19% 19% 18% 18% 18% 19% 17% 23% 19% 14% 6% 11% 15% 22% 17% 21% 16%
D D CDEFhjKLm D cD D D d D RS S s Tu
2-3 months
- - 105 138 136 145 175 171 182 172 190 166 196 91 105 72 65 41 18 43 34 115 54 82 60- - 8% 10% 11% 12% 14% 14% 14% 13% 16% 14% 16% 13% 19% 15% 17% 14% 17% 13% 16% 17% 13% 17% 17%
C C CDE CDe CDe Cd CDEF CDe CDEF N
4-6 months
- - 48 81 63 78 80 73 94 109 133 102 85 51 34 44 21 10 10 29 13 40 18 42 24- - 4% 6% 5% 6% 7% 6% 7% 8% 11% 8% 7% 7% 6% 9% 5% 3% 9% 9% 6% 6% 4% 9% 7%
C C C C Ce CdEh CDEFGHIjM CdEfH C qR r w
7-11 months
- - 78 54 55 64 86 90 87 118 104 79 101 49 52 43 21 26 12 36 21 38 22 40 39- - 6% 4% 4% 5% 7% 7% 7% 9% 9% 7% 8% 7% 9% 9% 5% 9% 11% 11% 10% 5% 5% 8% 11%
d DE DEf DE CDEFl CDEF De DEF V v W
A year or longer
- - 44 38 40 32 37 41 41 70 52 50 48 26 22 19 7 15 7 26 10 11 16 19 13- - 3% 3% 3% 3% 3% 3% 3% 5% 4% 4% 4% 4% 4% 4% 2% 5% 7% 8% 5% 2% 4% 4% 4%
cDEFGhI f f q Q V V
Never again
- - 602 598 584 544 592 537 577 523 433 490 507 281 226 203 152 115 36 108 71 311 176 214 117- - 46% 45% 47% 44% 48% 43% 44% 39% 36% 41% 40% 40% 40% 43% 39% 39% 34% 33% 34% 45% 42% 43% 33%
JKLM JKm JKLM jK fHJKLM K JKm k TU y Y
1 Day To 3 Months (Net)
- - 1315 1342 1247 1241 1230 1246 1300 1327 1209 1206 1263 695 568 469 392 294 108 324 207 693 417 495 351- - 100% 100% 100% 100% 100% 100% 100% 100% 100% 100% 100% 100% 100% 100% 100% 100% 100% 100% 100% 100% 100% 100% 100%
Sigma
__________________________________________________________________________________________________________________Proportions/Means: Columns Tested (5%, 10% risk level) - A/B/C/D/E/F/G/H/I/J/K/L/M - N/O - P/Q/R/S - T/U/V - W/X/YOverlap formulae used. * small base; ** very small base (under 30) ineligible for sig testing
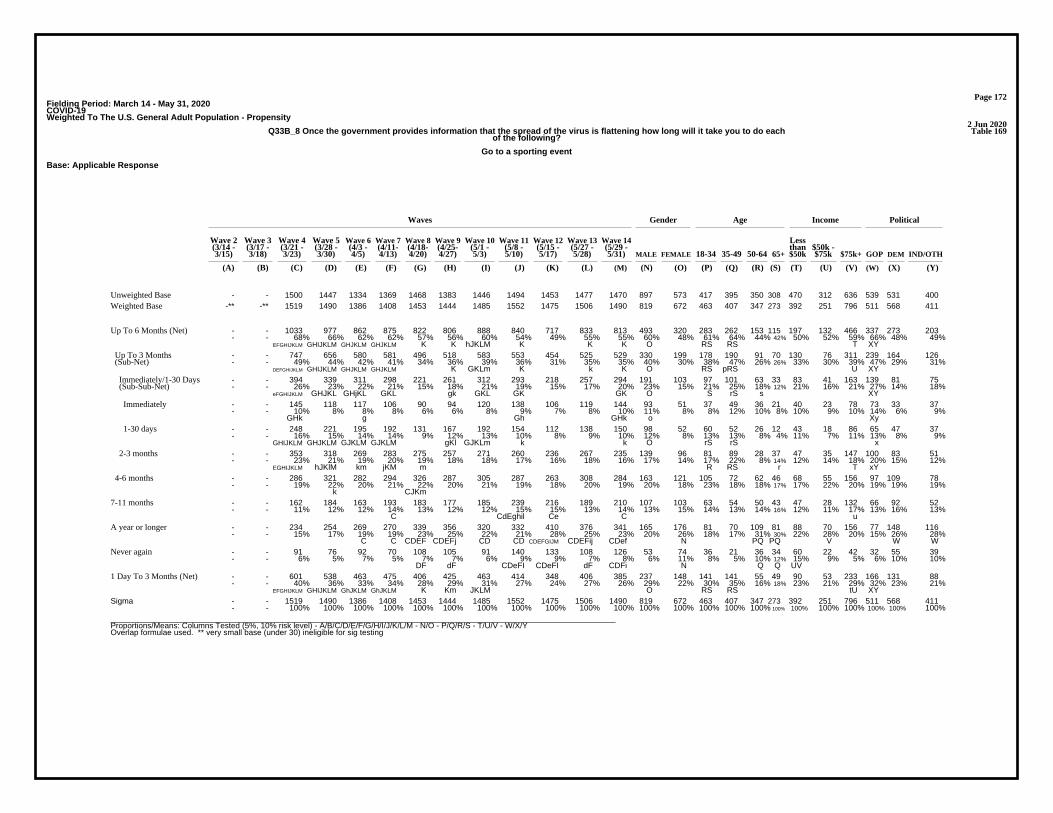
Page 172Fielding Period: March 14 - May 31, 2020COVID-19Weighted To The U.S. General Adult Population - Propensity
2 Jun 2020Table 169Q33B_8 Once the government provides information that the spread of the virus is flattening how long will it take you to do each
of the following?
Go to a sporting event
Base: Applicable Response
Waves Gender Age Income Political
Wave 2 Wave 3 Wave 4 Wave 5 Wave 6 Wave 7 Wave 8 Wave 9 Wave 10 Wave 11 Wave 12 Wave 13 Wave 14 Less(3/14 - (3/17 - (3/21 - (3/28 - (4/3 - (4/11- (4/18- (4/25- (5/1 - (5/8 - (5/15 - (5/27 - (5/29 - than $50k -3/15) 3/18) 3/23) 3/30) 4/5) 4/13) 4/20) 4/27) 5/3) 5/10) 5/17) 5/28) 5/31) MALE FEMALE 18-34 35-49 50-64 65+ $50k $75k $75k+ GOP DEM IND/OTH
(A) (B) (C) (D) (E) (F) (G) (H) (I) (J) (K) (L) (M) (N) (O) (P) (Q) (R) (S) (T) (U) (V) (W) (X) (Y)
- - 1500 1447 1334 1369 1468 1383 1446 1494 1453 1477 1470 897 573 417 395 350 308 470 312 636 539 531 400Unweighted Base-** -** 1519 1490 1386 1408 1453 1444 1485 1552 1475 1506 1490 819 672 463 407 347 273 392 251 796 511 568 411Weighted Base
- - 1033 977 862 875 822 806 888 840 717 833 813 493 320 283 262 153 115 197 132 466 337 273 203- - 68% 66% 62% 62% 57% 56% 60% 54% 49% 55% 55% 60% 48% 61% 64% 44% 42% 50% 52% 59% 66% 48% 49%
EFGHIJKLM GHIJKLM GHJKLM GHJKLM K K hJKLM K K K O RS RS T XY
Up To 6 Months (Net)
- - 747 656 580 581 496 518 583 553 454 525 529 330 199 178 190 91 70 130 76 311 239 164 126- - 49% 44% 42% 41% 34% 36% 39% 36% 31% 35% 35% 40% 30% 38% 47% 26% 26% 33% 30% 39% 47% 29% 31%
DEFGHIJKLM GHIJKLM GHJKLM GHJKLM K GKLm K k K O RS pRS U XY
Up To 3 Months (Sub-Net)
- - 394 339 311 298 221 261 312 293 218 257 294 191 103 97 101 63 33 83 41 163 139 81 75- - 26% 23% 22% 21% 15% 18% 21% 19% 15% 17% 20% 23% 15% 21% 25% 18% 12% 21% 16% 21% 27% 14% 18%
eFGHIJKLM GHJKL GHjKL GKL gk GKL GK GK O S rS s XY
Immediately/1-30 Days (Sub-Sub-Net)
- - 145 118 117 106 90 94 120 138 106 119 144 93 51 37 49 36 21 40 23 78 73 33 37- - 10% 8% 8% 8% 6% 6% 8% 9% 7% 8% 10% 11% 8% 8% 12% 10% 8% 10% 9% 10% 14% 6% 9%
GHk g Gh GHk o Xy
Immediately
- - 248 221 195 192 131 167 192 154 112 138 150 98 52 60 52 26 12 43 18 86 65 47 37- - 16% 15% 14% 14% 9% 12% 13% 10% 8% 9% 10% 12% 8% 13% 13% 8% 4% 11% 7% 11% 13% 8% 9%
GHIJKLM GHJKLM GJKLM GJKLM gKl GJKLm k k O rS rS x
1-30 days
- - 353 318 269 283 275 257 271 260 236 267 235 139 96 81 89 28 37 47 35 147 100 83 51- - 23% 21% 19% 20% 19% 18% 18% 17% 16% 18% 16% 17% 14% 17% 22% 8% 14% 12% 14% 18% 20% 15% 12%
EGHIJKLM hJKlM km jKM m R RS r T xY
2-3 months
- - 286 321 282 294 326 287 305 287 263 308 284 163 121 105 72 62 46 68 55 156 97 109 78- - 19% 22% 20% 21% 22% 20% 21% 19% 18% 20% 19% 20% 18% 23% 18% 18% 17% 17% 22% 20% 19% 19% 19%
k CJKm
4-6 months
- - 162 184 163 193 183 177 185 239 216 189 210 107 103 63 54 50 43 47 28 132 66 92 52- - 11% 12% 12% 14% 13% 12% 12% 15% 15% 13% 14% 13% 15% 14% 13% 14% 16% 12% 11% 17% 13% 16% 13%
C CdEghil Ce C u
7-11 months
- - 234 254 269 270 339 356 320 332 410 376 341 165 176 81 70 109 81 88 70 156 77 148 116- - 15% 17% 19% 19% 23% 25% 22% 21% 28% 25% 23% 20% 26% 18% 17% 31% 30% 22% 28% 20% 15% 26% 28%
C C CDEF CDEFj CD CD CDEFGIJM CDEFij CDef N PQ PQ V W W
A year or longer
- - 91 76 92 70 108 105 91 140 133 108 126 53 74 36 21 36 34 60 22 42 32 55 39- - 6% 5% 7% 5% 7% 7% 6% 9% 9% 7% 8% 6% 11% 8% 5% 10% 12% 15% 9% 5% 6% 10% 10%
DF dF CDeFI CDeFI dF CDFi N Q Q UV
Never again
- - 601 538 463 475 406 425 463 414 348 406 385 237 148 141 141 55 49 90 53 233 166 131 88- - 40% 36% 33% 34% 28% 29% 31% 27% 24% 27% 26% 29% 22% 30% 35% 16% 18% 23% 21% 29% 32% 23% 21%
EFGHIJKLM GHIJKLM GhJKLM GhJKLM K Km JKLM O RS RS tU XY
1 Day To 3 Months (Net)
- - 1519 1490 1386 1408 1453 1444 1485 1552 1475 1506 1490 819 672 463 407 347 273 392 251 796 511 568 411- - 100% 100% 100% 100% 100% 100% 100% 100% 100% 100% 100% 100% 100% 100% 100% 100% 100% 100% 100% 100% 100% 100% 100%
Sigma
__________________________________________________________________________________________________________________Proportions/Means: Columns Tested (5%, 10% risk level) - A/B/C/D/E/F/G/H/I/J/K/L/M - N/O - P/Q/R/S - T/U/V - W/X/YOverlap formulae used. ** very small base (under 30) ineligible for sig testing
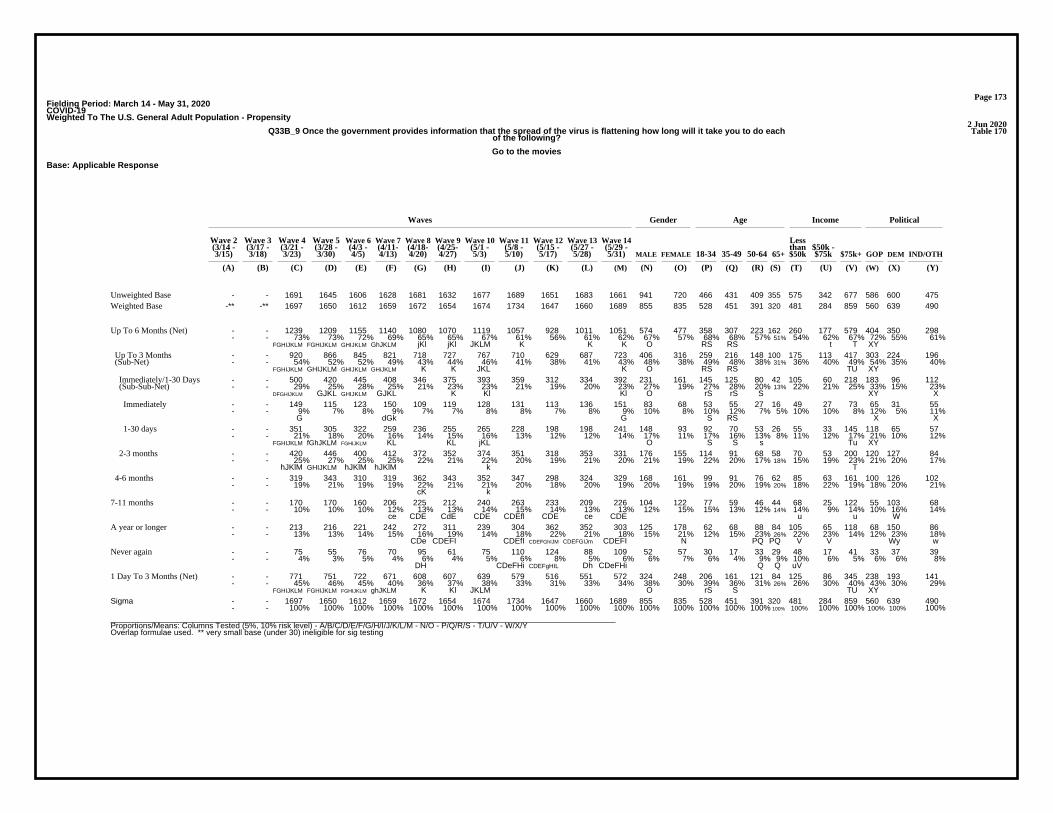
Page 173Fielding Period: March 14 - May 31, 2020COVID-19Weighted To The U.S. General Adult Population - Propensity
2 Jun 2020Table 170Q33B_9 Once the government provides information that the spread of the virus is flattening how long will it take you to do each
of the following?
Go to the movies
Base: Applicable Response
Waves Gender Age Income Political
Wave 2 Wave 3 Wave 4 Wave 5 Wave 6 Wave 7 Wave 8 Wave 9 Wave 10 Wave 11 Wave 12 Wave 13 Wave 14 Less(3/14 - (3/17 - (3/21 - (3/28 - (4/3 - (4/11- (4/18- (4/25- (5/1 - (5/8 - (5/15 - (5/27 - (5/29 - than $50k -3/15) 3/18) 3/23) 3/30) 4/5) 4/13) 4/20) 4/27) 5/3) 5/10) 5/17) 5/28) 5/31) MALE FEMALE 18-34 35-49 50-64 65+ $50k $75k $75k+ GOP DEM IND/OTH
(A) (B) (C) (D) (E) (F) (G) (H) (I) (J) (K) (L) (M) (N) (O) (P) (Q) (R) (S) (T) (U) (V) (W) (X) (Y)
- - 1691 1645 1606 1628 1681 1632 1677 1689 1651 1683 1661 941 720 466 431 409 355 575 342 677 586 600 475Unweighted Base-** -** 1697 1650 1612 1659 1672 1654 1674 1734 1647 1660 1689 855 835 528 451 391 320 481 284 859 560 639 490Weighted Base
- - 1239 1209 1155 1140 1080 1070 1119 1057 928 1011 1051 574 477 358 307 223 162 260 177 579 404 350 298- - 73% 73% 72% 69% 65% 65% 67% 61% 56% 61% 62% 67% 57% 68% 68% 57% 51% 54% 62% 67% 72% 55% 61%
FGHIJKLM FGHIJKLM GHIJKLM GhJKLM jKl jKl JKLM K K K O RS RS t T XY
Up To 6 Months (Net)
- - 920 866 845 821 718 727 767 710 629 687 723 406 316 259 216 148 100 175 113 417 303 224 196- - 54% 52% 52% 49% 43% 44% 46% 41% 38% 41% 43% 48% 38% 49% 48% 38% 31% 36% 40% 49% 54% 35% 40%
FGHIJKLM GHIJKLM GHIJKLM GHiJKLM K K JKL K O RS RS TU XY
Up To 3 Months (Sub-Net)
- - 500 420 445 408 346 375 393 359 312 334 392 231 161 145 125 80 42 105 60 218 183 96 112- - 29% 25% 28% 25% 21% 23% 23% 21% 19% 20% 23% 27% 19% 27% 28% 20% 13% 22% 21% 25% 33% 15% 23%
DFGHIJKLM GJKL GHIJKLM GJKL K Kl Kl O rS rS S XY X
Immediately/1-30 Days (Sub-Sub-Net)
- - 149 115 123 150 109 119 128 131 113 136 151 83 68 53 55 27 16 49 27 73 65 31 55- - 9% 7% 8% 9% 7% 7% 8% 8% 7% 8% 9% 10% 8% 10% 12% 7% 5% 10% 10% 8% 12% 5% 11%
G dGk G S RS X X
Immediately
- - 351 305 322 259 236 255 265 228 198 198 241 148 93 92 70 53 26 55 33 145 118 65 57- - 21% 18% 20% 16% 14% 15% 16% 13% 12% 12% 14% 17% 11% 17% 16% 13% 8% 11% 12% 17% 21% 10% 12%
FGHIJKLM fGhJKLM FGHIJKLM KL KL jKL O S S s Tu XY
1-30 days
- - 420 446 400 412 372 352 374 351 318 353 331 176 155 114 91 68 58 70 53 200 120 127 84- - 25% 27% 25% 25% 22% 21% 22% 20% 19% 21% 20% 21% 19% 22% 20% 17% 18% 15% 19% 23% 21% 20% 17%
hJKlM GHIJKLM hJKlM hJKlM k T
2-3 months
- - 319 343 310 319 362 343 352 347 298 324 329 168 161 99 91 76 62 85 63 161 100 126 102- - 19% 21% 19% 19% 22% 21% 21% 20% 18% 20% 19% 20% 19% 19% 20% 19% 20% 18% 22% 19% 18% 20% 21%
cK k
4-6 months
- - 170 170 160 206 225 212 240 263 233 209 226 104 122 77 59 46 44 68 25 122 55 103 68- - 10% 10% 10% 12% 13% 13% 14% 15% 14% 13% 13% 12% 15% 15% 13% 12% 14% 14% 9% 14% 10% 16% 14%
ce CDE CdE CDE CDEfl CDE ce CDE u u W
7-11 months
- - 213 216 221 242 272 311 239 304 362 352 303 125 178 62 68 88 84 105 65 118 68 150 86- - 13% 13% 14% 15% 16% 19% 14% 18% 22% 21% 18% 15% 21% 12% 15% 23% 26% 22% 23% 14% 12% 23% 18%
CDe CDEFI CDEfI CDEFGhIJM CDEFGIJm CDEFI N PQ PQ V V Wy w
A year or longer
- - 75 55 76 70 95 61 75 110 124 88 109 52 57 30 17 33 29 48 17 41 33 37 39- - 4% 3% 5% 4% 6% 4% 5% 6% 8% 5% 6% 6% 7% 6% 4% 9% 9% 10% 6% 5% 6% 6% 8%
DH CDeFHi CDEFgHIL Dh CDeFHi Q Q uV
Never again
- - 771 751 722 671 608 607 639 579 516 551 572 324 248 206 161 121 84 125 86 345 238 193 141- - 45% 46% 45% 40% 36% 37% 38% 33% 31% 33% 34% 38% 30% 39% 36% 31% 26% 26% 30% 40% 43% 30% 29%
FGHIJKLM FGHIJKLM FGHIJKLM ghJKLM K Kl JKLM O rS S TU XY
1 Day To 3 Months (Net)
- - 1697 1650 1612 1659 1672 1654 1674 1734 1647 1660 1689 855 835 528 451 391 320 481 284 859 560 639 490- - 100% 100% 100% 100% 100% 100% 100% 100% 100% 100% 100% 100% 100% 100% 100% 100% 100% 100% 100% 100% 100% 100% 100%
Sigma
__________________________________________________________________________________________________________________Proportions/Means: Columns Tested (5%, 10% risk level) - A/B/C/D/E/F/G/H/I/J/K/L/M - N/O - P/Q/R/S - T/U/V - W/X/YOverlap formulae used. ** very small base (under 30) ineligible for sig testing
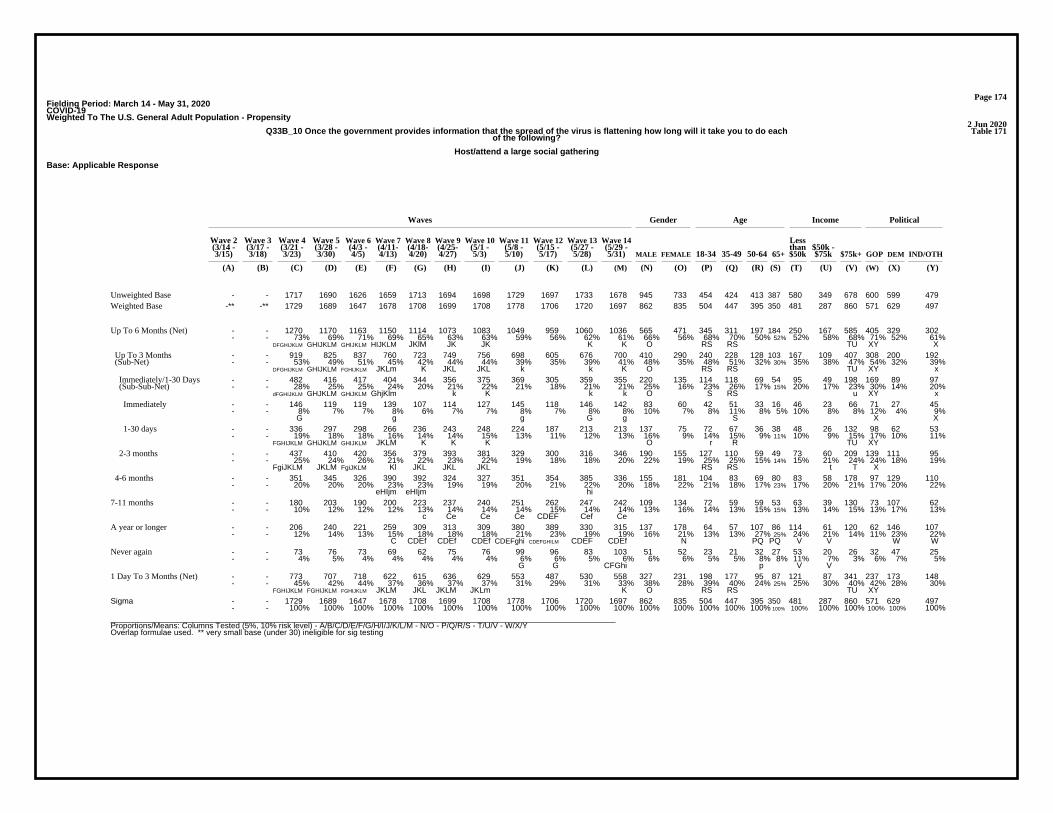
Page 174Fielding Period: March 14 - May 31, 2020COVID-19Weighted To The U.S. General Adult Population - Propensity
2 Jun 2020Table 171Q33B_10 Once the government provides information that the spread of the virus is flattening how long will it take you to do each
of the following?
Host/attend a large social gathering
Base: Applicable Response
Waves Gender Age Income Political
Wave 2 Wave 3 Wave 4 Wave 5 Wave 6 Wave 7 Wave 8 Wave 9 Wave 10 Wave 11 Wave 12 Wave 13 Wave 14 Less(3/14 - (3/17 - (3/21 - (3/28 - (4/3 - (4/11- (4/18- (4/25- (5/1 - (5/8 - (5/15 - (5/27 - (5/29 - than $50k -3/15) 3/18) 3/23) 3/30) 4/5) 4/13) 4/20) 4/27) 5/3) 5/10) 5/17) 5/28) 5/31) MALE FEMALE 18-34 35-49 50-64 65+ $50k $75k $75k+ GOP DEM IND/OTH
(A) (B) (C) (D) (E) (F) (G) (H) (I) (J) (K) (L) (M) (N) (O) (P) (Q) (R) (S) (T) (U) (V) (W) (X) (Y)
- - 1717 1690 1626 1659 1713 1694 1698 1729 1697 1733 1678 945 733 454 424 413 387 580 349 678 600 599 479Unweighted Base-** -** 1729 1689 1647 1678 1708 1699 1708 1778 1706 1720 1697 862 835 504 447 395 350 481 287 860 571 629 497Weighted Base
- - 1270 1170 1163 1150 1114 1073 1083 1049 959 1060 1036 565 471 345 311 197 184 250 167 585 405 329 302- - 73% 69% 71% 69% 65% 63% 63% 59% 56% 62% 61% 66% 56% 68% 70% 50% 52% 52% 58% 68% 71% 52% 61%
DFGHIJKLM GHIJKLM GHIJKLM HIJKLM JKlM JK JK K K O RS RS TU XY X
Up To 6 Months (Net)
- - 919 825 837 760 723 749 756 698 605 676 700 410 290 240 228 128 103 167 109 407 308 200 192- - 53% 49% 51% 45% 42% 44% 44% 39% 35% 39% 41% 48% 35% 48% 51% 32% 30% 35% 38% 47% 54% 32% 39%
DFGHIJKLM GHIJKLM FGHIJKLM JKLm K JKL JKL k k K O RS RS TU XY x
Up To 3 Months (Sub-Net)
- - 482 416 417 404 344 356 375 369 305 359 355 220 135 114 118 69 54 95 49 198 169 89 97- - 28% 25% 25% 24% 20% 21% 22% 21% 18% 21% 21% 25% 16% 23% 26% 17% 15% 20% 17% 23% 30% 14% 20%
dFGHIJKLM GHJKLM GHiJKLM GhjKlm k K k k O S RS u XY x
Immediately/1-30 Days (Sub-Sub-Net)
- - 146 119 119 139 107 114 127 145 118 146 142 83 60 42 51 33 16 46 23 66 71 27 45- - 8% 7% 7% 8% 6% 7% 7% 8% 7% 8% 8% 10% 7% 8% 11% 8% 5% 10% 8% 8% 12% 4% 9%
G g g G g S X X
Immediately
- - 336 297 298 266 236 243 248 224 187 213 213 137 75 72 67 36 38 48 26 132 98 62 53- - 19% 18% 18% 16% 14% 14% 15% 13% 11% 12% 13% 16% 9% 14% 15% 9% 11% 10% 9% 15% 17% 10% 11%
FGHIJKLM GHiJKLM GHIJKLM JKLM K K K O r R TU XY
1-30 days
- - 437 410 420 356 379 393 381 329 300 316 346 190 155 127 110 59 49 73 60 209 139 111 95- - 25% 24% 26% 21% 22% 23% 22% 19% 18% 18% 20% 22% 19% 25% 25% 15% 14% 15% 21% 24% 24% 18% 19%
FgiJKLM JKLM FgiJKLM Kl JKL JKL JKL RS RS t T X
2-3 months
- - 351 345 326 390 392 324 327 351 354 385 336 155 181 104 83 69 80 83 58 178 97 129 110- - 20% 20% 20% 23% 23% 19% 19% 20% 21% 22% 20% 18% 22% 21% 18% 17% 23% 17% 20% 21% 17% 20% 22%
eHIjm eHIjm hi
4-6 months
- - 180 203 190 200 223 237 240 251 262 247 242 109 134 72 59 59 53 63 39 130 73 107 62- - 10% 12% 12% 12% 13% 14% 14% 14% 15% 14% 14% 13% 16% 14% 13% 15% 15% 13% 14% 15% 13% 17% 13%
c Ce Ce Ce CDEF Cef Ce
7-11 months
- - 206 240 221 259 309 313 309 380 389 330 315 137 178 64 57 107 86 114 61 120 62 146 107- - 12% 14% 13% 15% 18% 18% 18% 21% 23% 19% 19% 16% 21% 13% 13% 27% 25% 24% 21% 14% 11% 23% 22%
C CDEf CDEf CDEf CDEFghi CDEFGHILM CDEF CDEf N PQ PQ V V W W
A year or longer
- - 73 76 73 69 62 75 76 99 96 83 103 51 52 23 21 32 27 53 20 26 32 47 25- - 4% 5% 4% 4% 4% 4% 4% 6% 6% 5% 6% 6% 6% 5% 5% 8% 8% 11% 7% 3% 6% 7% 5%
G G CFGhi p V V
Never again
- - 773 707 718 622 615 636 629 553 487 530 558 327 231 198 177 95 87 121 87 341 237 173 148- - 45% 42% 44% 37% 36% 37% 37% 31% 29% 31% 33% 38% 28% 39% 40% 24% 25% 25% 30% 40% 42% 28% 30%
FGHIJKLM FGHIJKLM FGHIJKLM JKLM JKL JKLM JKLm K O RS RS TU XY
1 Day To 3 Months (Net)
- - 1729 1689 1647 1678 1708 1699 1708 1778 1706 1720 1697 862 835 504 447 395 350 481 287 860 571 629 497- - 100% 100% 100% 100% 100% 100% 100% 100% 100% 100% 100% 100% 100% 100% 100% 100% 100% 100% 100% 100% 100% 100% 100%
Sigma
__________________________________________________________________________________________________________________Proportions/Means: Columns Tested (5%, 10% risk level) - A/B/C/D/E/F/G/H/I/J/K/L/M - N/O - P/Q/R/S - T/U/V - W/X/YOverlap formulae used. ** very small base (under 30) ineligible for sig testing
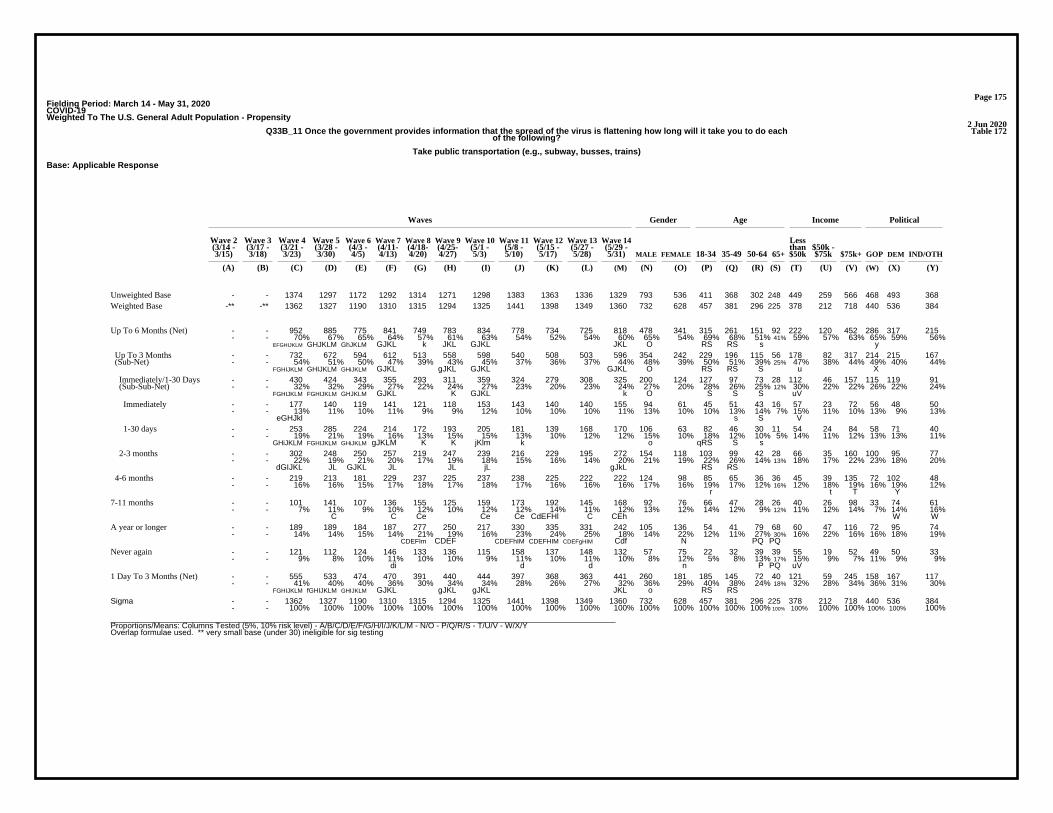
Page 175Fielding Period: March 14 - May 31, 2020COVID-19Weighted To The U.S. General Adult Population - Propensity
2 Jun 2020Table 172Q33B_11 Once the government provides information that the spread of the virus is flattening how long will it take you to do each
of the following?
Take public transportation (e.g., subway, busses, trains)
Base: Applicable Response
Waves Gender Age Income Political
Wave 2 Wave 3 Wave 4 Wave 5 Wave 6 Wave 7 Wave 8 Wave 9 Wave 10 Wave 11 Wave 12 Wave 13 Wave 14 Less(3/14 - (3/17 - (3/21 - (3/28 - (4/3 - (4/11- (4/18- (4/25- (5/1 - (5/8 - (5/15 - (5/27 - (5/29 - than $50k -3/15) 3/18) 3/23) 3/30) 4/5) 4/13) 4/20) 4/27) 5/3) 5/10) 5/17) 5/28) 5/31) MALE FEMALE 18-34 35-49 50-64 65+ $50k $75k $75k+ GOP DEM IND/OTH
(A) (B) (C) (D) (E) (F) (G) (H) (I) (J) (K) (L) (M) (N) (O) (P) (Q) (R) (S) (T) (U) (V) (W) (X) (Y)
- - 1374 1297 1172 1292 1314 1271 1298 1383 1363 1336 1329 793 536 411 368 302 248 449 259 566 468 493 368Unweighted Base-** -** 1362 1327 1190 1310 1315 1294 1325 1441 1398 1349 1360 732 628 457 381 296 225 378 212 718 440 536 384Weighted Base
- - 952 885 775 841 749 783 834 778 734 725 818 478 341 315 261 151 92 222 120 452 286 317 215- - 70% 67% 65% 64% 57% 61% 63% 54% 52% 54% 60% 65% 54% 69% 68% 51% 41% 59% 57% 63% 65% 59% 56%
EFGHIJKLM GHJKLM GhJKLM GJKL k JKL GJKL JKL O RS RS s y
Up To 6 Months (Net)
- - 732 672 594 612 513 558 598 540 508 503 596 354 242 229 196 115 56 178 82 317 214 215 167- - 54% 51% 50% 47% 39% 43% 45% 37% 36% 37% 44% 48% 39% 50% 51% 39% 25% 47% 38% 44% 49% 40% 44%
FGHIJKLM GHIJKLM GHiJKLM GJKL gJKL GJKL GJKL O RS RS S u X
Up To 3 Months (Sub-Net)
- - 430 424 343 355 293 311 359 324 279 308 325 200 124 127 97 73 28 112 46 157 115 119 91- - 32% 32% 29% 27% 22% 24% 27% 23% 20% 23% 24% 27% 20% 28% 26% 25% 12% 30% 22% 22% 26% 22% 24%
FGHIJKLM FGHIJKLM GHJKLM GJKL K GJKL k O S S S uV
Immediately/1-30 Days (Sub-Sub-Net)
- - 177 140 119 141 121 118 153 143 140 140 155 94 61 45 51 43 16 57 23 72 56 48 50- - 13% 11% 10% 11% 9% 9% 12% 10% 10% 10% 11% 13% 10% 10% 13% 14% 7% 15% 11% 10% 13% 9% 13%
eGHJkl s S V
Immediately
- - 253 285 224 214 172 193 205 181 139 168 170 106 63 82 46 30 11 54 24 84 58 71 40- - 19% 21% 19% 16% 13% 15% 15% 13% 10% 12% 12% 15% 10% 18% 12% 10% 5% 14% 11% 12% 13% 13% 11%
GHiJKLM FGHIJKLM GHiJKLM gJKLM K K jKlm k o qRS S s
1-30 days
- - 302 248 250 257 219 247 239 216 229 195 272 154 118 103 99 42 28 66 35 160 100 95 77- - 22% 19% 21% 20% 17% 19% 18% 15% 16% 14% 20% 21% 19% 22% 26% 14% 13% 18% 17% 22% 23% 18% 20%
dGIJKL JL GJKL JL JL jL gJkL RS RS
2-3 months
- - 219 213 181 229 237 225 237 238 225 222 222 124 98 85 65 36 36 45 39 135 72 102 48- - 16% 16% 15% 17% 18% 17% 18% 17% 16% 16% 16% 17% 16% 19% 17% 12% 16% 12% 18% 19% 16% 19% 12%
r t T Y
4-6 months
- - 101 141 107 136 155 125 159 173 192 145 168 92 76 66 47 28 26 40 26 98 33 74 61- - 7% 11% 9% 10% 12% 10% 12% 12% 14% 11% 12% 13% 12% 14% 12% 9% 12% 11% 12% 14% 7% 14% 16%
C C Ce Ce Ce CdEFHl C CEh W W
7-11 months
- - 189 189 184 187 277 250 217 330 335 331 242 105 136 54 41 79 68 60 47 116 72 95 74- - 14% 14% 15% 14% 21% 19% 16% 23% 24% 25% 18% 14% 22% 12% 11% 27% 30% 16% 22% 16% 16% 18% 19%
CDEFIm CDEF CDEFhIM CDEFHIM CDEFgHIM Cdf N PQ PQ
A year or longer
- - 121 112 124 146 133 136 115 158 137 148 132 57 75 22 32 39 39 55 19 52 49 50 33- - 9% 8% 10% 11% 10% 10% 9% 11% 10% 11% 10% 8% 12% 5% 8% 13% 17% 15% 9% 7% 11% 9% 9%
di d d n P PQ uV
Never again
- - 555 533 474 470 391 440 444 397 368 363 441 260 181 185 145 72 40 121 59 245 158 167 117- - 41% 40% 40% 36% 30% 34% 34% 28% 26% 27% 32% 36% 29% 40% 38% 24% 18% 32% 28% 34% 36% 31% 30%
FGHIJKLM fGHIJKLM GHIJKLM GJKL gJKL gJKL JKL o RS RS
1 Day To 3 Months (Net)
- - 1362 1327 1190 1310 1315 1294 1325 1441 1398 1349 1360 732 628 457 381 296 225 378 212 718 440 536 384- - 100% 100% 100% 100% 100% 100% 100% 100% 100% 100% 100% 100% 100% 100% 100% 100% 100% 100% 100% 100% 100% 100% 100%
Sigma
__________________________________________________________________________________________________________________Proportions/Means: Columns Tested (5%, 10% risk level) - A/B/C/D/E/F/G/H/I/J/K/L/M - N/O - P/Q/R/S - T/U/V - W/X/YOverlap formulae used. ** very small base (under 30) ineligible for sig testing

Page 176Fielding Period: March 14 - May 31, 2020COVID-19Weighted To The U.S. General Adult Population - Propensity
2 Jun 2020Table 173Q33B_12 Once the government provides information that the spread of the virus is flattening how long will it take you to do each
of the following?
Greet people with a handshake
Base: Applicable Response
Waves Gender Age Income Political
Wave 2 Wave 3 Wave 4 Wave 5 Wave 6 Wave 7 Wave 8 Wave 9 Wave 10 Wave 11 Wave 12 Wave 13 Wave 14 Less(3/14 - (3/17 - (3/21 - (3/28 - (4/3 - (4/11- (4/18- (4/25- (5/1 - (5/8 - (5/15 - (5/27 - (5/29 - than $50k -3/15) 3/18) 3/23) 3/30) 4/5) 4/13) 4/20) 4/27) 5/3) 5/10) 5/17) 5/28) 5/31) MALE FEMALE 18-34 35-49 50-64 65+ $50k $75k $75k+ GOP DEM IND/OTH
(A) (B) (C) (D) (E) (F) (G) (H) (I) (J) (K) (L) (M) (N) (O) (P) (Q) (R) (S) (T) (U) (V) (W) (X) (Y)
- - 1881 1883 1828 1844 1895 1886 1894 1888 1817 1897 1828 1024 804 462 438 465 463 667 379 702 663 643 522Unweighted Base-** -** 1888 1869 1820 1858 1897 1886 1879 1922 1817 1892 1815 908 907 517 458 435 405 536 312 890 629 670 516Weighted Base
- - 1318 1220 1146 1066 1017 983 988 959 834 964 956 529 427 329 287 170 170 266 165 503 390 298 267- - 70% 65% 63% 57% 54% 52% 53% 50% 46% 51% 53% 58% 47% 64% 63% 39% 42% 50% 53% 56% 62% 45% 52%
DEFGHIJKLM FGHIJKLM FGHIJKLM gHIJKLM jK K K k K K O RS RS T XY x
Up To 6 Months (Net)
- - 1016 912 858 715 726 710 703 654 579 703 689 406 283 224 222 126 116 183 114 375 293 206 189- - 54% 49% 47% 38% 38% 38% 37% 34% 32% 37% 38% 45% 31% 43% 48% 29% 29% 34% 37% 42% 47% 31% 37%
DEFGHIJKLM FGHIJKLM FGHIJKLM JK JK jK jK K jK O RS RS T XY
Up To 3 Months (Sub-Net)
- - 592 511 481 407 400 407 401 394 376 376 401 251 151 128 129 83 62 116 70 205 192 90 119- - 31% 27% 26% 22% 21% 22% 21% 21% 21% 20% 22% 28% 17% 25% 28% 19% 15% 22% 22% 23% 31% 13% 23%
DEFGHIJKLM FGHIJKLM FGHIJKLM O S RS XY X
Immediately/1-30 Days (Sub-Sub-Net)
- - 200 190 176 176 149 162 156 165 185 210 206 133 73 57 55 57 38 63 33 105 112 37 57- - 11% 10% 10% 9% 8% 9% 8% 9% 10% 11% 11% 15% 8% 11% 12% 13% 9% 12% 11% 12% 18% 6% 11%
Ghij g g GHIJ GHIJ O XY X
Immediately
- - 393 322 305 231 250 245 246 230 191 166 195 117 78 71 74 27 24 53 36 99 80 53 63- - 21% 17% 17% 12% 13% 13% 13% 12% 11% 9% 11% 13% 9% 14% 16% 6% 6% 10% 12% 11% 13% 8% 12%
DEFGHIJKLM FGHIJKLM FGHIJKLM L KLm kLm kLm L O RS RS X x
1-30 days
- - 424 401 377 308 327 302 302 260 203 328 287 155 132 96 93 43 55 66 45 171 101 116 70- - 22% 21% 21% 17% 17% 16% 16% 14% 11% 17% 16% 17% 15% 19% 20% 10% 14% 12% 14% 19% 16% 17% 14%
FGHIJKLM FGHIJKLM FGHIJKLM JK JK jK jK k JK K R RS T
2-3 months
- - 302 307 289 351 291 273 285 304 255 260 267 123 144 104 65 44 54 83 51 127 97 92 78- - 16% 16% 16% 19% 15% 14% 15% 16% 14% 14% 15% 14% 16% 20% 14% 10% 13% 15% 16% 14% 15% 14% 15%
l ceGHIjKLM qRS
4-6 months
- - 162 171 142 158 159 186 176 185 232 174 201 106 94 65 50 47 39 55 28 109 65 89 46- - 9% 9% 8% 8% 8% 10% 9% 10% 13% 9% 11% 12% 10% 13% 11% 11% 10% 10% 9% 12% 10% 13% 9%
e CDEFGHIJL CEFG y
7-11 months
- - 213 239 286 284 333 341 356 361 368 423 322 149 173 70 59 109 84 86 51 161 83 133 107- - 11% 13% 16% 15% 18% 18% 19% 19% 20% 22% 18% 16% 19% 14% 13% 25% 21% 16% 16% 18% 13% 20% 21%
CD Cd CD CDf CDEF CDEF CDEF CDEFGHIJM CD PQ PQ W W
A year or longer
- - 195 239 245 351 388 376 359 417 383 331 336 124 212 53 62 109 112 130 67 118 90 151 96- - 10% 13% 13% 19% 20% 20% 19% 22% 21% 18% 19% 14% 23% 10% 14% 25% 28% 24% 21% 13% 14% 22% 19%
c C CDE CDEl CDE CDE CDEfLm CDEL CDE CDE N PQ PQ V V W
Never again
- - 816 723 681 539 577 548 547 490 394 493 483 273 210 168 167 70 79 120 81 270 181 169 133- - 43% 39% 37% 29% 30% 29% 29% 25% 22% 26% 27% 30% 23% 32% 36% 16% 19% 22% 26% 30% 29% 25% 26%
DEFGHIJKLM FGHIJKLM FGHIJKLM jK JKLM JK JKl K K K O RS RS T
1 Day To 3 Months (Net)
- - 1888 1869 1820 1858 1897 1886 1879 1922 1817 1892 1815 908 907 517 458 435 405 536 312 890 629 670 516- - 100% 100% 100% 100% 100% 100% 100% 100% 100% 100% 100% 100% 100% 100% 100% 100% 100% 100% 100% 100% 100% 100% 100%
Sigma
__________________________________________________________________________________________________________________Proportions/Means: Columns Tested (5%, 10% risk level) - A/B/C/D/E/F/G/H/I/J/K/L/M - N/O - P/Q/R/S - T/U/V - W/X/YOverlap formulae used. ** very small base (under 30) ineligible for sig testing

Page 177Fielding Period: March 14 - May 31, 2020COVID-19Weighted To The U.S. General Adult Population - Propensity
2 Jun 2020Table 174Q1314_1 For this question, we’d like you to think about industries in general. How would you rate the overall reputation of the
following industries, where ’’1’’ means the industry has a ’’Very Bad’’ reputation and ’’7’’ means the industry has a ’’Very Good’’ reputation?
Airline
Base: All Respondents
Waves Gender Age Income Political
Wave 2 Wave 3 Wave 4 Wave 5 Wave 6 Wave 7 Wave 8 Wave 9 Wave 10 Wave 11 Wave 12 Wave 13 Wave 14 Less(3/14 - (3/17 - (3/21 - (3/28 - (4/3 - (4/11- (4/18- (4/25- (5/1 - (5/8 - (5/15 - (5/27 - (5/29 - than $50k -3/15) 3/18) 3/23) 3/30) 4/5) 4/13) 4/20) 4/27) 5/3) 5/10) 5/17) 5/28) 5/31) MALE FEMALE 18-34 35-49 50-64 65+ $50k $75k $75k+ GOP DEM IND/OTH
(A) (B) (C) (D) (E) (F) (G) (H) (I) (J) (K) (L) (M) (N) (O) (P) (Q) (R) (S) (T) (U) (V) (W) (X) (Y)
- - - - - - - - - - - - 689 369 320 182 162 190 155 263 142 254 251 239 199Unweighted Base-** -** -** -** -** -** -** -** -** -** -** -** 704 329 375 216 183* 177 128* 212 121* 338 239 263 202Weighted Base
- - - - - - - - - - - - 184 95 89 58 57 39 30 44 32 101 72 79 34- - - - - - - - - - - - 26% 29% 24% 27% 31% 22% 23% 21% 26% 30% 30% 30% 17%
t Y Y
Top 2 Box (Net)
- - - - - - - - - - - - 88 38 50 33 30 14 11 15 17 55 39 37 12- - - - - - - - - - - - 12% 12% 13% 15% 17% 8% 9% 7% 14% 16% 16% 14% 6%
r r t T Y Y
7 - Very good
- - - - - - - - - - - - 96 57 40 25 26 26 19 28 15 45 33 41 22- - - - - - - - - - - - 14% 17% 11% 12% 14% 15% 15% 13% 13% 13% 14% 16% 11%
o
6
- - - - - - - - - - - - 147 78 68 39 38 38 32 25 34 82 47 57 43- - - - - - - - - - - - 21% 24% 18% 18% 21% 22% 25% 12% 28% 24% 20% 22% 21%
T T
5
- - - - - - - - - - - - 146 62 84 47 27 38 34 44 27 71 56 60 29- - - - - - - - - - - - 21% 19% 22% 22% 15% 21% 27% 21% 23% 21% 24% 23% 15%
Q y
4
- - - - - - - - - - - - 59 28 31 17 18 17 8 19 7 31 13 23 23- - - - - - - - - - - - 8% 9% 8% 8% 10% 9% 6% 9% 6% 9% 6% 9% 11%
w
3
- - - - - - - - - - - - 79 42 37 25 22 21 12 27 11 40 36 24 20- - - - - - - - - - - - 11% 13% 10% 11% 12% 12% 9% 13% 9% 12% 15% 9% 10%
Bottom 2 Box (Net)
- - - - - - - - - - - - 37 16 20 9 13 13 3 12 4 21 22 8 7- - - - - - - - - - - - 5% 5% 5% 4% 7% 7% 2% 6% 3% 6% 9% 3% 3%
Xy
2
- - - - - - - - - - - - 43 26 17 16 9 9 9 15 7 20 14 15 13- - - - - - - - - - - - 6% 8% 5% 8% 5% 5% 7% 7% 5% 6% 6% 6% 6%
1 - Very bad
- - - - - - - - - - - - 89 24 65 31 22 23 13 53 11 12 15 20 53- - - - - - - - - - - - 13% 7% 17% 14% 12% 13% 10% 25% 9% 4% 6% 8% 27%
N UV v WX
Not sure
- - - - - - - - - - - - 704 329 375 216 183 177 128 212 121 338 239 263 202- - - - - - - - - - - - 100% 100% 100% 100% 100% 100% 100% 100% 100% 100% 100% 100% 100%
Sigma
__________________________________________________________________________________________________________________Proportions/Means: Columns Tested (5%, 10% risk level) - A/B/C/D/E/F/G/H/I/J/K/L/M - N/O - P/Q/R/S - T/U/V - W/X/YOverlap formulae used. * small base; ** very small base (under 30) ineligible for sig testing

Page 178Fielding Period: March 14 - May 31, 2020COVID-19Weighted To The U.S. General Adult Population - Propensity
2 Jun 2020Table 175Q1314_2 For this question, we’d like you to think about industries in general. How would you rate the overall reputation of the
following industries, where ’’1’’ means the industry has a ’’Very Bad’’ reputation and ’’7’’ means the industry has a ’’Very Good’’ reputation?
Automotive
Base: All Respondents
Waves Gender Age Income Political
Wave 2 Wave 3 Wave 4 Wave 5 Wave 6 Wave 7 Wave 8 Wave 9 Wave 10 Wave 11 Wave 12 Wave 13 Wave 14 Less(3/14 - (3/17 - (3/21 - (3/28 - (4/3 - (4/11- (4/18- (4/25- (5/1 - (5/8 - (5/15 - (5/27 - (5/29 - than $50k -3/15) 3/18) 3/23) 3/30) 4/5) 4/13) 4/20) 4/27) 5/3) 5/10) 5/17) 5/28) 5/31) MALE FEMALE 18-34 35-49 50-64 65+ $50k $75k $75k+ GOP DEM IND/OTH
(A) (B) (C) (D) (E) (F) (G) (H) (I) (J) (K) (L) (M) (N) (O) (P) (Q) (R) (S) (T) (U) (V) (W) (X) (Y)
- - - - - - - - - - - - 689 372 317 180 164 181 164 242 148 269 250 250 189Unweighted Base-** -** -** -** -** -** -** -** -** -** -** -** 705 350 355 203 172 170 160* 207 129* 345 232 273 200Weighted Base
- - - - - - - - - - - - 245 136 109 59 68 58 59 56 39 144 91 115 38- - - - - - - - - - - - 35% 39% 31% 29% 40% 34% 37% 27% 30% 42% 39% 42% 19%
o Tu Y Y
Top 2 Box (Net)
- - - - - - - - - - - - 108 56 52 26 35 29 18 29 19 59 42 55 11- - - - - - - - - - - - 15% 16% 15% 13% 21% 17% 11% 14% 14% 17% 18% 20% 6%
s Y Y
7 - Very good
- - - - - - - - - - - - 136 80 57 33 33 29 41 28 20 84 49 60 27- - - - - - - - - - - - 19% 23% 16% 16% 19% 17% 26% 13% 16% 24% 21% 22% 14%
o T y
6
- - - - - - - - - - - - 204 103 102 55 39 53 57 60 42 96 75 69 60- - - - - - - - - - - - 29% 29% 29% 27% 23% 31% 36% 29% 32% 28% 32% 25% 30%
Q
5
- - - - - - - - - - - - 105 44 61 35 26 18 26 34 26 42 19 46 40- - - - - - - - - - - - 15% 13% 17% 17% 15% 11% 16% 16% 20% 12% 8% 17% 20%
v W W
4
- - - - - - - - - - - - 49 30 19 9 20 11 9 18 10 21 20 15 14- - - - - - - - - - - - 7% 9% 5% 4% 12% 6% 6% 9% 8% 6% 8% 5% 7%
p
3
- - - - - - - - - - - - 37 27 11 21 4 11 1 10 4 22 14 7 16- - - - - - - - - - - - 5% 8% 3% 10% 2% 6% 1% 5% 3% 6% 6% 2% 8%
O QS S X
Bottom 2 Box (Net)
- - - - - - - - - - - - 19 12 7 12 2 5 - 6 4 9 7 3 9- - - - - - - - - - - - 3% 3% 2% 6% 1% 3% - 3% 3% 3% 3% 1% 4%
qS
2
- - - - - - - - - - - - 18 15 4 9 2 6 1 3 1 13 8 3 7- - - - - - - - - - - - 3% 4% 1% 4% 1% 4% 1% 2% 1% 4% 3% 1% 4%
O
1 - Very bad
- - - - - - - - - - - - 65 11 54 24 15 19 8 29 8 21 12 21 31- - - - - - - - - - - - 9% 3% 15% 12% 8% 11% 5% 14% 6% 6% 5% 8% 16%
N s uV WX
Not sure
- - - - - - - - - - - - 705 350 355 203 172 170 160 207 129 345 232 273 200- - - - - - - - - - - - 100% 100% 100% 100% 100% 100% 100% 100% 100% 100% 100% 100% 100%
Sigma
__________________________________________________________________________________________________________________Proportions/Means: Columns Tested (5%, 10% risk level) - A/B/C/D/E/F/G/H/I/J/K/L/M - N/O - P/Q/R/S - T/U/V - W/X/YOverlap formulae used. * small base; ** very small base (under 30) ineligible for sig testing

Page 179Fielding Period: March 14 - May 31, 2020COVID-19Weighted To The U.S. General Adult Population - Propensity
2 Jun 2020Table 176Q1314_3 For this question, we’d like you to think about industries in general. How would you rate the overall reputation of the
following industries, where ’’1’’ means the industry has a ’’Very Bad’’ reputation and ’’7’’ means the industry has a ’’Very Good’’ reputation?
Consumer products
Base: All Respondents
Waves Gender Age Income Political
Wave 2 Wave 3 Wave 4 Wave 5 Wave 6 Wave 7 Wave 8 Wave 9 Wave 10 Wave 11 Wave 12 Wave 13 Wave 14 Less(3/14 - (3/17 - (3/21 - (3/28 - (4/3 - (4/11- (4/18- (4/25- (5/1 - (5/8 - (5/15 - (5/27 - (5/29 - than $50k -3/15) 3/18) 3/23) 3/30) 4/5) 4/13) 4/20) 4/27) 5/3) 5/10) 5/17) 5/28) 5/31) MALE FEMALE 18-34 35-49 50-64 65+ $50k $75k $75k+ GOP DEM IND/OTH
(A) (B) (C) (D) (E) (F) (G) (H) (I) (J) (K) (L) (M) (N) (O) (P) (Q) (R) (S) (T) (U) (V) (W) (X) (Y)
- - - - - - - - - - - - 694 374 320 187 171 169 167 259 140 254 260 246 188Unweighted Base-** -** -** -** -** -** -** -** -** -** -** -** 695 334 360 217 181 157 139 216 113* 323 247 254 193Weighted Base
- - - - - - - - - - - - 252 127 125 64 65 67 55 71 32 136 99 99 55- - - - - - - - - - - - 36% 38% 35% 29% 36% 43% 40% 33% 28% 42% 40% 39% 28%
P tU y y
Top 2 Box (Net)
- - - - - - - - - - - - 90 42 48 32 28 23 7 28 5 48 43 31 17- - - - - - - - - - - - 13% 13% 13% 15% 16% 14% 5% 13% 5% 15% 17% 12% 9%
S S S U U y
7 - Very good
- - - - - - - - - - - - 162 86 76 32 37 44 48 43 26 87 56 68 38- - - - - - - - - - - - 23% 26% 21% 15% 20% 28% 35% 20% 23% 27% 23% 27% 20%
P PQ
6
- - - - - - - - - - - - 207 94 113 53 55 50 48 52 35 111 82 80 45- - - - - - - - - - - - 30% 28% 31% 25% 31% 32% 34% 24% 31% 34% 33% 32% 23%
T y
5
- - - - - - - - - - - - 122 56 66 48 31 21 22 47 23 40 48 34 40- - - - - - - - - - - - 18% 17% 18% 22% 17% 13% 16% 22% 21% 13% 19% 13% 21%
V v
4
- - - - - - - - - - - - 36 21 16 18 10 5 4 18 5 12 4 23 9- - - - - - - - - - - - 5% 6% 4% 8% 6% 3% 3% 8% 4% 4% 2% 9% 5%
v W
3
- - - - - - - - - - - - 33 27 6 19 8 5 1 6 7 19 8 5 19- - - - - - - - - - - - 5% 8% 2% 9% 4% 3% 1% 3% 6% 6% 3% 2% 10%
O S WX
Bottom 2 Box (Net)
- - - - - - - - - - - - 18 13 5 14 3 1 - 5 2 10 1 2 16- - - - - - - - - - - - 3% 4% 1% 7% 2% 1% - 2% 2% 3% * 1% 8%
qRS WX
2
- - - - - - - - - - - - 15 14 1 4 5 5 1 1 5 9 8 3 4- - - - - - - - - - - - 2% 4% * 2% 3% 3% 1% 1% 4% 3% 3% 1% 2%
O T
1 - Very bad
- - - - - - - - - - - - 44 10 35 15 11 8 9 22 11 5 6 13 25- - - - - - - - - - - - 6% 3% 10% 7% 6% 5% 7% 10% 10% 2% 3% 5% 13%
N V V WX
Not sure
- - - - - - - - - - - - 695 334 360 217 181 157 139 216 113 323 247 254 193- - - - - - - - - - - - 100% 100% 100% 100% 100% 100% 100% 100% 100% 100% 100% 100% 100%
Sigma
__________________________________________________________________________________________________________________Proportions/Means: Columns Tested (5%, 10% risk level) - A/B/C/D/E/F/G/H/I/J/K/L/M - N/O - P/Q/R/S - T/U/V - W/X/YOverlap formulae used. * small base; ** very small base (under 30) ineligible for sig testing

Page 180Fielding Period: March 14 - May 31, 2020COVID-19Weighted To The U.S. General Adult Population - Propensity
2 Jun 2020Table 177Q1314_4 For this question, we’d like you to think about industries in general. How would you rate the overall reputation of the
following industries, where ’’1’’ means the industry has a ’’Very Bad’’ reputation and ’’7’’ means the industry has a ’’Very Good’’ reputation?
Energy
Base: All Respondents
Waves Gender Age Income Political
Wave 2 Wave 3 Wave 4 Wave 5 Wave 6 Wave 7 Wave 8 Wave 9 Wave 10 Wave 11 Wave 12 Wave 13 Wave 14 Less(3/14 - (3/17 - (3/21 - (3/28 - (4/3 - (4/11- (4/18- (4/25- (5/1 - (5/8 - (5/15 - (5/27 - (5/29 - than $50k -3/15) 3/18) 3/23) 3/30) 4/5) 4/13) 4/20) 4/27) 5/3) 5/10) 5/17) 5/28) 5/31) MALE FEMALE 18-34 35-49 50-64 65+ $50k $75k $75k+ GOP DEM IND/OTH
(A) (B) (C) (D) (E) (F) (G) (H) (I) (J) (K) (L) (M) (N) (O) (P) (Q) (R) (S) (T) (U) (V) (W) (X) (Y)
- - - - - - - - - - - - 688 371 317 188 162 164 174 264 143 250 235 233 220Unweighted Base-** -** -** -** -** -** -** -** -** -** -** -** 687 328 359 209 170 156 152 209 113* 335 237 236 214Weighted Base
- - - - - - - - - - - - 284 126 158 83 74 60 67 76 51 149 114 89 81- - - - - - - - - - - - 41% 38% 44% 40% 44% 38% 44% 36% 45% 44% 48% 38% 38%
xy
Top 2 Box (Net)
- - - - - - - - - - - - 139 62 76 53 38 28 21 26 18 88 52 48 38- - - - - - - - - - - - 20% 19% 21% 25% 22% 18% 14% 13% 16% 26% 22% 20% 18%
S Tu
7 - Very good
- - - - - - - - - - - - 145 64 82 30 37 32 46 49 33 60 61 41 43- - - - - - - - - - - - 21% 19% 23% 14% 22% 21% 30% 24% 29% 18% 26% 17% 20%
P V x
6
- - - - - - - - - - - - 153 94 58 48 36 30 38 55 18 75 66 53 33- - - - - - - - - - - - 22% 29% 16% 23% 21% 19% 25% 26% 16% 22% 28% 23% 16%
O u Y
5
- - - - - - - - - - - - 129 64 64 52 24 30 23 36 22 60 44 45 40- - - - - - - - - - - - 19% 20% 18% 25% 14% 19% 15% 17% 19% 18% 18% 19% 19%
qs
4
- - - - - - - - - - - - 42 25 17 10 12 11 9 13 6 19 5 20 17- - - - - - - - - - - - 6% 8% 5% 5% 7% 7% 6% 6% 6% 6% 2% 8% 8%
W W
3
- - - - - - - - - - - - 37 12 25 10 12 8 7 6 9 21 4 17 16- - - - - - - - - - - - 5% 4% 7% 5% 7% 5% 5% 3% 8% 6% 2% 7% 7%
t W W
Bottom 2 Box (Net)
- - - - - - - - - - - - 16 8 7 6 2 5 3 3 7 6 3 3 9- - - - - - - - - - - - 2% 3% 2% 3% 1% 3% 2% 1% 6% 2% 1% 1% 4%
Tv
2
- - - - - - - - - - - - 21 3 18 4 10 3 4 3 3 15 1 14 7- - - - - - - - - - - - 3% 1% 5% 2% 6% 2% 3% 2% 2% 5% * 6% 3%
N W w
1 - Very bad
- - - - - - - - - - - - 43 7 37 7 11 17 8 23 6 10 5 12 27- - - - - - - - - - - - 6% 2% 10% 3% 7% 11% 5% 11% 5% 3% 2% 5% 12%
N P V WX
Not sure
- - - - - - - - - - - - 687 328 359 209 170 156 152 209 113 335 237 236 214- - - - - - - - - - - - 100% 100% 100% 100% 100% 100% 100% 100% 100% 100% 100% 100% 100%
Sigma
__________________________________________________________________________________________________________________Proportions/Means: Columns Tested (5%, 10% risk level) - A/B/C/D/E/F/G/H/I/J/K/L/M - N/O - P/Q/R/S - T/U/V - W/X/YOverlap formulae used. * small base; ** very small base (under 30) ineligible for sig testing

Page 181Fielding Period: March 14 - May 31, 2020COVID-19Weighted To The U.S. General Adult Population - Propensity
2 Jun 2020Table 178Q1314_5 For this question, we’d like you to think about industries in general. How would you rate the overall reputation of the
following industries, where ’’1’’ means the industry has a ’’Very Bad’’ reputation and ’’7’’ means the industry has a ’’Very Good’’ reputation?
Insurance (excluding health insurance)
Base: All Respondents
Waves Gender Age Income Political
Wave 2 Wave 3 Wave 4 Wave 5 Wave 6 Wave 7 Wave 8 Wave 9 Wave 10 Wave 11 Wave 12 Wave 13 Wave 14 Less(3/14 - (3/17 - (3/21 - (3/28 - (4/3 - (4/11- (4/18- (4/25- (5/1 - (5/8 - (5/15 - (5/27 - (5/29 - than $50k -3/15) 3/18) 3/23) 3/30) 4/5) 4/13) 4/20) 4/27) 5/3) 5/10) 5/17) 5/28) 5/31) MALE FEMALE 18-34 35-49 50-64 65+ $50k $75k $75k+ GOP DEM IND/OTH
(A) (B) (C) (D) (E) (F) (G) (H) (I) (J) (K) (L) (M) (N) (O) (P) (Q) (R) (S) (T) (U) (V) (W) (X) (Y)
- - - - - - - - - - - - 696 372 324 181 168 183 164 264 136 263 236 239 221Unweighted Base-** -** -** -** -** -** -** -** -** -** -** -** 715 337 378 206 179 186 144* 217 110* 345 228 265 222Weighted Base
- - - - - - - - - - - - 258 138 119 76 66 60 55 62 36 154 91 113 54- - - - - - - - - - - - 36% 41% 32% 37% 37% 32% 38% 29% 33% 45% 40% 43% 24%
O Tu Y Y
Top 2 Box (Net)
- - - - - - - - - - - - 117 65 52 46 45 17 8 23 15 77 40 60 17- - - - - - - - - - - - 16% 19% 14% 23% 25% 9% 6% 11% 14% 22% 17% 23% 8%
RS RS T Y Y
7 - Very good
- - - - - - - - - - - - 141 73 68 30 21 43 46 39 21 76 51 52 37- - - - - - - - - - - - 20% 22% 18% 15% 12% 23% 32% 18% 19% 22% 22% 20% 17%
Q PQ
6
- - - - - - - - - - - - 163 77 87 46 49 31 37 48 25 85 61 63 39- - - - - - - - - - - - 23% 23% 23% 22% 27% 17% 26% 22% 22% 25% 27% 24% 17%
r y
5
- - - - - - - - - - - - 132 54 78 37 25 40 29 50 19 56 43 40 50- - - - - - - - - - - - 18% 16% 21% 18% 14% 21% 21% 23% 17% 16% 19% 15% 22%
4
- - - - - - - - - - - - 63 34 28 12 13 27 10 21 12 17 15 20 27- - - - - - - - - - - - 9% 10% 7% 6% 7% 15% 7% 10% 11% 5% 7% 7% 12%
Pqs v v
3
- - - - - - - - - - - - 46 24 22 11 14 13 7 14 8 21 10 17 18- - - - - - - - - - - - 6% 7% 6% 5% 8% 7% 5% 6% 7% 6% 5% 6% 8%
Bottom 2 Box (Net)
- - - - - - - - - - - - 22 13 9 9 6 3 4 4 4 13 5 10 7- - - - - - - - - - - - 3% 4% 2% 4% 3% 2% 3% 2% 4% 4% 2% 4% 3%
2
- - - - - - - - - - - - 24 11 13 2 9 10 3 10 4 9 6 8 11- - - - - - - - - - - - 3% 3% 3% 1% 5% 5% 2% 5% 4% 2% 3% 3% 5%
p
1 - Very bad
- - - - - - - - - - - - 53 10 44 23 10 14 6 23 10 12 8 12 34- - - - - - - - - - - - 7% 3% 12% 11% 6% 8% 4% 10% 9% 3% 3% 4% 15%
N s V V WX
Not sure
- - - - - - - - - - - - 715 337 378 206 179 186 144 217 110 345 228 265 222- - - - - - - - - - - - 100% 100% 100% 100% 100% 100% 100% 100% 100% 100% 100% 100% 100%
Sigma
__________________________________________________________________________________________________________________Proportions/Means: Columns Tested (5%, 10% risk level) - A/B/C/D/E/F/G/H/I/J/K/L/M - N/O - P/Q/R/S - T/U/V - W/X/YOverlap formulae used. * small base; ** very small base (under 30) ineligible for sig testing

Page 182Fielding Period: March 14 - May 31, 2020COVID-19Weighted To The U.S. General Adult Population - Propensity
2 Jun 2020Table 179Q1314_6 For this question, we’d like you to think about industries in general. How would you rate the overall reputation of the
following industries, where ’’1’’ means the industry has a ’’Very Bad’’ reputation and ’’7’’ means the industry has a ’’Very Good’’ reputation?
Financial services
Base: All Respondents
Waves Gender Age Income Political
Wave 2 Wave 3 Wave 4 Wave 5 Wave 6 Wave 7 Wave 8 Wave 9 Wave 10 Wave 11 Wave 12 Wave 13 Wave 14 Less(3/14 - (3/17 - (3/21 - (3/28 - (4/3 - (4/11- (4/18- (4/25- (5/1 - (5/8 - (5/15 - (5/27 - (5/29 - than $50k -3/15) 3/18) 3/23) 3/30) 4/5) 4/13) 4/20) 4/27) 5/3) 5/10) 5/17) 5/28) 5/31) MALE FEMALE 18-34 35-49 50-64 65+ $50k $75k $75k+ GOP DEM IND/OTH
(A) (B) (C) (D) (E) (F) (G) (H) (I) (J) (K) (L) (M) (N) (O) (P) (Q) (R) (S) (T) (U) (V) (W) (X) (Y)
- - - - - - - - - - - - 687 368 319 169 168 182 168 265 138 248 240 253 194Unweighted Base-** -** -** -** -** -** -** -** -** -** -** -** 696 324 372 200* 175 172 148* 214 115* 334 232 269 195Weighted Base
- - - - - - - - - - - - 239 129 110 57 72 46 64 56 32 143 94 99 45- - - - - - - - - - - - 34% 40% 29% 28% 41% 27% 43% 26% 28% 43% 41% 37% 23%
O pR PR TU Y Y
Top 2 Box (Net)
- - - - - - - - - - - - 96 52 43 30 31 21 14 24 15 51 45 36 16- - - - - - - - - - - - 14% 16% 12% 15% 18% 12% 10% 11% 13% 15% 19% 13% 8%
Y
7 - Very good
- - - - - - - - - - - - 143 76 66 27 41 26 49 32 17 92 49 63 30- - - - - - - - - - - - 21% 24% 18% 14% 23% 15% 33% 15% 15% 28% 21% 24% 15%
p PR TU
6
- - - - - - - - - - - - 165 76 89 53 33 44 35 52 34 73 66 60 40- - - - - - - - - - - - 24% 24% 24% 26% 19% 26% 24% 24% 29% 22% 28% 22% 20%
5
- - - - - - - - - - - - 128 54 74 35 33 33 28 47 25 48 36 46 46- - - - - - - - - - - - 18% 17% 20% 18% 19% 19% 19% 22% 22% 14% 15% 17% 24%
v w
4
- - - - - - - - - - - - 62 26 36 29 8 15 9 15 14 29 22 22 18- - - - - - - - - - - - 9% 8% 10% 15% 5% 9% 6% 7% 12% 9% 10% 8% 9%
Qs
3
- - - - - - - - - - - - 46 24 23 15 13 12 7 20 5 20 4 26 16- - - - - - - - - - - - 7% 7% 6% 8% 7% 7% 4% 10% 4% 6% 2% 10% 8%
W W
Bottom 2 Box (Net)
- - - - - - - - - - - - 16 9 7 6 2 6 2 9 2 5 2 10 4- - - - - - - - - - - - 2% 3% 2% 3% 1% 4% 2% 4% 2% 1% 1% 4% 2%
2
- - - - - - - - - - - - 30 14 16 9 10 6 4 12 2 16 3 16 11- - - - - - - - - - - - 4% 4% 4% 5% 6% 3% 3% 6% 2% 5% 1% 6% 6%
W W
1 - Very bad
- - - - - - - - - - - - 55 14 41 11 17 21 6 24 6 21 10 16 29- - - - - - - - - - - - 8% 4% 11% 6% 10% 12% 4% 11% 5% 6% 4% 6% 15%
N s pS uv WX
Not sure
- - - - - - - - - - - - 696 324 372 200 175 172 148 214 115 334 232 269 195- - - - - - - - - - - - 100% 100% 100% 100% 100% 100% 100% 100% 100% 100% 100% 100% 100%
Sigma
__________________________________________________________________________________________________________________Proportions/Means: Columns Tested (5%, 10% risk level) - A/B/C/D/E/F/G/H/I/J/K/L/M - N/O - P/Q/R/S - T/U/V - W/X/YOverlap formulae used. * small base; ** very small base (under 30) ineligible for sig testing
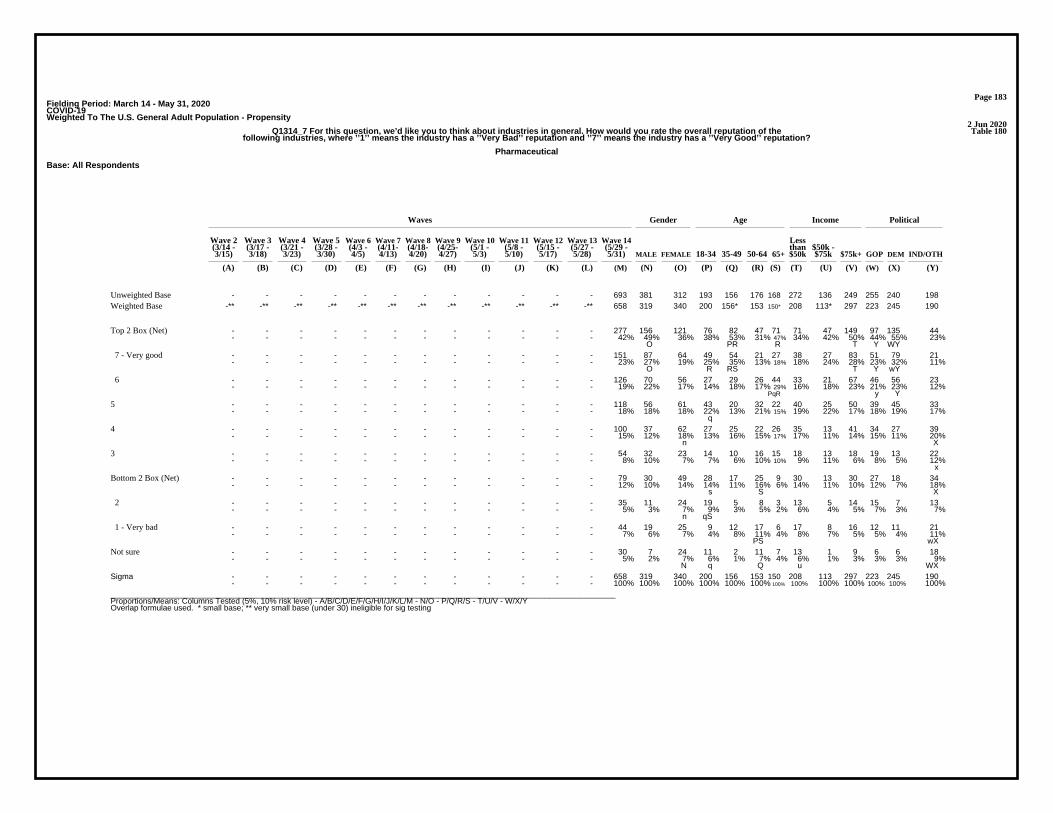
Page 183Fielding Period: March 14 - May 31, 2020COVID-19Weighted To The U.S. General Adult Population - Propensity
2 Jun 2020Table 180Q1314_7 For this question, we’d like you to think about industries in general. How would you rate the overall reputation of the
following industries, where ’’1’’ means the industry has a ’’Very Bad’’ reputation and ’’7’’ means the industry has a ’’Very Good’’ reputation?
Pharmaceutical
Base: All Respondents
Waves Gender Age Income Political
Wave 2 Wave 3 Wave 4 Wave 5 Wave 6 Wave 7 Wave 8 Wave 9 Wave 10 Wave 11 Wave 12 Wave 13 Wave 14 Less(3/14 - (3/17 - (3/21 - (3/28 - (4/3 - (4/11- (4/18- (4/25- (5/1 - (5/8 - (5/15 - (5/27 - (5/29 - than $50k -3/15) 3/18) 3/23) 3/30) 4/5) 4/13) 4/20) 4/27) 5/3) 5/10) 5/17) 5/28) 5/31) MALE FEMALE 18-34 35-49 50-64 65+ $50k $75k $75k+ GOP DEM IND/OTH
(A) (B) (C) (D) (E) (F) (G) (H) (I) (J) (K) (L) (M) (N) (O) (P) (Q) (R) (S) (T) (U) (V) (W) (X) (Y)
- - - - - - - - - - - - 693 381 312 193 156 176 168 272 136 249 255 240 198Unweighted Base-** -** -** -** -** -** -** -** -** -** -** -** 658 319 340 200 156* 153 150* 208 113* 297 223 245 190Weighted Base
- - - - - - - - - - - - 277 156 121 76 82 47 71 71 47 149 97 135 44- - - - - - - - - - - - 42% 49% 36% 38% 53% 31% 47% 34% 42% 50% 44% 55% 23%
O PR R T Y WY
Top 2 Box (Net)
- - - - - - - - - - - - 151 87 64 49 54 21 27 38 27 83 51 79 21- - - - - - - - - - - - 23% 27% 19% 25% 35% 13% 18% 18% 24% 28% 23% 32% 11%
O R RS T Y wY
7 - Very good
- - - - - - - - - - - - 126 70 56 27 29 26 44 33 21 67 46 56 23- - - - - - - - - - - - 19% 22% 17% 14% 18% 17% 29% 16% 18% 23% 21% 23% 12%
PqR y Y
6
- - - - - - - - - - - - 118 56 61 43 20 32 22 40 25 50 39 45 33- - - - - - - - - - - - 18% 18% 18% 22% 13% 21% 15% 19% 22% 17% 18% 19% 17%
q
5
- - - - - - - - - - - - 100 37 62 27 25 22 26 35 13 41 34 27 39- - - - - - - - - - - - 15% 12% 18% 13% 16% 15% 17% 17% 11% 14% 15% 11% 20%
n X
4
- - - - - - - - - - - - 54 32 23 14 10 16 15 18 13 18 19 13 22- - - - - - - - - - - - 8% 10% 7% 7% 6% 10% 10% 9% 11% 6% 8% 5% 12%
x
3
- - - - - - - - - - - - 79 30 49 28 17 25 9 30 13 30 27 18 34- - - - - - - - - - - - 12% 10% 14% 14% 11% 16% 6% 14% 11% 10% 12% 7% 18%
s S X
Bottom 2 Box (Net)
- - - - - - - - - - - - 35 11 24 19 5 8 3 13 5 14 15 7 13- - - - - - - - - - - - 5% 3% 7% 9% 3% 5% 2% 6% 4% 5% 7% 3% 7%
n qS
2
- - - - - - - - - - - - 44 19 25 9 12 17 6 17 8 16 12 11 21- - - - - - - - - - - - 7% 6% 7% 4% 8% 11% 4% 8% 7% 5% 5% 4% 11%
PS wX
1 - Very bad
- - - - - - - - - - - - 30 7 24 11 2 11 7 13 1 9 6 6 18- - - - - - - - - - - - 5% 2% 7% 6% 1% 7% 4% 6% 1% 3% 3% 3% 9%
N q Q u WX
Not sure
- - - - - - - - - - - - 658 319 340 200 156 153 150 208 113 297 223 245 190- - - - - - - - - - - - 100% 100% 100% 100% 100% 100% 100% 100% 100% 100% 100% 100% 100%
Sigma
__________________________________________________________________________________________________________________Proportions/Means: Columns Tested (5%, 10% risk level) - A/B/C/D/E/F/G/H/I/J/K/L/M - N/O - P/Q/R/S - T/U/V - W/X/YOverlap formulae used. * small base; ** very small base (under 30) ineligible for sig testing

Page 184Fielding Period: March 14 - May 31, 2020COVID-19Weighted To The U.S. General Adult Population - Propensity
2 Jun 2020Table 181Q1314_8 For this question, we’d like you to think about industries in general. How would you rate the overall reputation of the
following industries, where ’’1’’ means the industry has a ’’Very Bad’’ reputation and ’’7’’ means the industry has a ’’Very Good’’ reputation?
Retail
Base: All Respondents
Waves Gender Age Income Political
Wave 2 Wave 3 Wave 4 Wave 5 Wave 6 Wave 7 Wave 8 Wave 9 Wave 10 Wave 11 Wave 12 Wave 13 Wave 14 Less(3/14 - (3/17 - (3/21 - (3/28 - (4/3 - (4/11- (4/18- (4/25- (5/1 - (5/8 - (5/15 - (5/27 - (5/29 - than $50k -3/15) 3/18) 3/23) 3/30) 4/5) 4/13) 4/20) 4/27) 5/3) 5/10) 5/17) 5/28) 5/31) MALE FEMALE 18-34 35-49 50-64 65+ $50k $75k $75k+ GOP DEM IND/OTH
(A) (B) (C) (D) (E) (F) (G) (H) (I) (J) (K) (L) (M) (N) (O) (P) (Q) (R) (S) (T) (U) (V) (W) (X) (Y)
- - - - - - - - - - - - 688 378 310 193 171 175 149 279 124 253 247 237 204Unweighted Base-** -** -** -** -** -** -** -** -** -** -** -** 696 353 343 214 179 168 135* 231 108* 332 234 258 203Weighted Base
- - - - - - - - - - - - 258 141 117 85 76 51 47 72 45 137 92 117 50- - - - - - - - - - - - 37% 40% 34% 40% 42% 30% 34% 31% 42% 41% 39% 45% 25%
r t Y Y
Top 2 Box (Net)
- - - - - - - - - - - - 87 46 42 30 40 8 9 29 8 49 29 42 17- - - - - - - - - - - - 13% 13% 12% 14% 22% 5% 7% 13% 8% 15% 12% 16% 8%
Rs RS Y
7 - Very good
- - - - - - - - - - - - 171 96 75 55 36 43 37 43 37 88 63 74 33- - - - - - - - - - - - 25% 27% 22% 26% 20% 25% 27% 18% 34% 27% 27% 29% 16%
T t Y Y
6
- - - - - - - - - - - - 194 103 91 56 33 57 48 65 19 101 70 70 53- - - - - - - - - - - - 28% 29% 26% 26% 19% 34% 35% 28% 18% 30% 30% 27% 26%
Q Q u U
5
- - - - - - - - - - - - 103 53 50 28 36 22 18 39 21 37 41 25 37- - - - - - - - - - - - 15% 15% 15% 13% 20% 13% 13% 17% 19% 11% 17% 10% 18%
v x X
4
- - - - - - - - - - - - 61 27 34 30 13 11 7 19 10 30 20 15 26- - - - - - - - - - - - 9% 8% 10% 14% 7% 7% 5% 8% 9% 9% 9% 6% 13%
rS x
3
- - - - - - - - - - - - 31 17 13 9 9 8 5 12 4 15 7 11 13- - - - - - - - - - - - 4% 5% 4% 4% 5% 5% 4% 5% 3% 4% 3% 4% 6%
Bottom 2 Box (Net)
- - - - - - - - - - - - 11 6 4 4 * 2 4 4 1 6 1 6 3- - - - - - - - - - - - 2% 2% 1% 2% * 1% 3% 2% 1% 2% * 3% 2%
q
2
- - - - - - - - - - - - 20 11 9 5 9 6 1 8 3 9 6 4 10- - - - - - - - - - - - 3% 3% 3% 2% 5% 3% 1% 3% 3% 3% 3% 2% 5%
s
1 - Very bad
- - - - - - - - - - - - 49 11 38 6 12 19 12 24 9 13 5 20 24- - - - - - - - - - - - 7% 3% 11% 3% 7% 11% 9% 11% 9% 4% 2% 8% 12%
N P p V W W
Not sure
- - - - - - - - - - - - 696 353 343 214 179 168 135 231 108 332 234 258 203- - - - - - - - - - - - 100% 100% 100% 100% 100% 100% 100% 100% 100% 100% 100% 100% 100%
Sigma
__________________________________________________________________________________________________________________Proportions/Means: Columns Tested (5%, 10% risk level) - A/B/C/D/E/F/G/H/I/J/K/L/M - N/O - P/Q/R/S - T/U/V - W/X/YOverlap formulae used. * small base; ** very small base (under 30) ineligible for sig testing
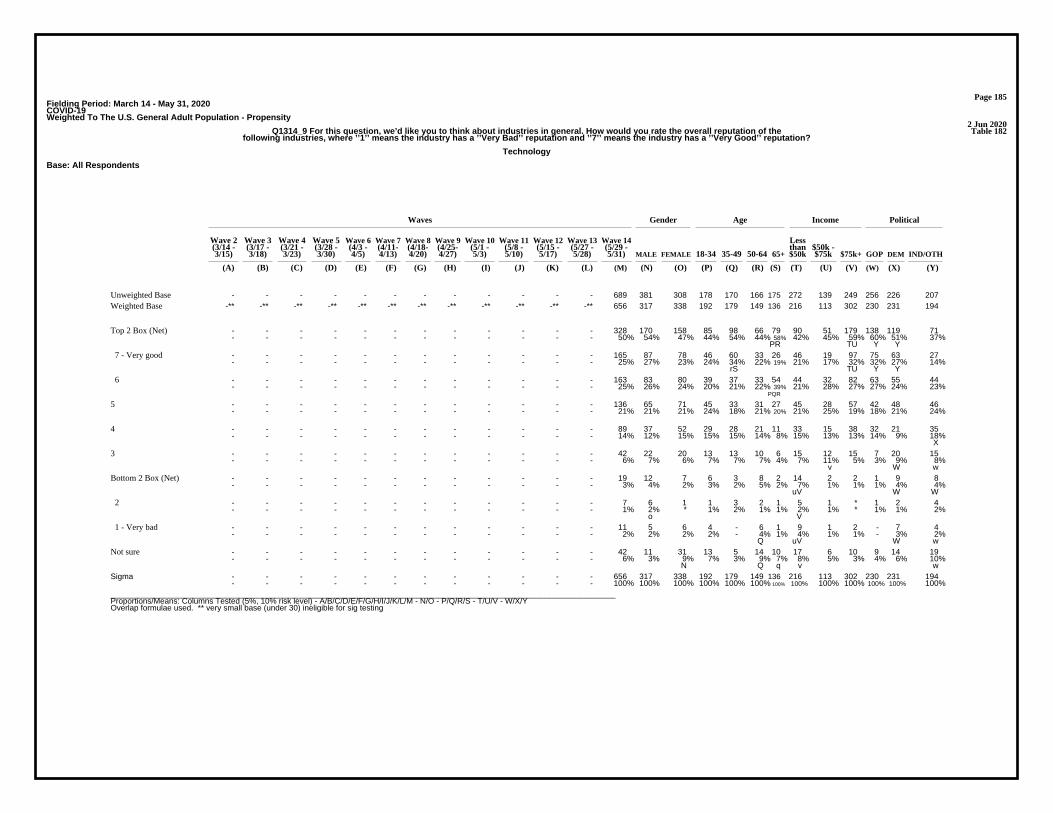
Page 185Fielding Period: March 14 - May 31, 2020COVID-19Weighted To The U.S. General Adult Population - Propensity
2 Jun 2020Table 182Q1314_9 For this question, we’d like you to think about industries in general. How would you rate the overall reputation of the
following industries, where ’’1’’ means the industry has a ’’Very Bad’’ reputation and ’’7’’ means the industry has a ’’Very Good’’ reputation?
Technology
Base: All Respondents
Waves Gender Age Income Political
Wave 2 Wave 3 Wave 4 Wave 5 Wave 6 Wave 7 Wave 8 Wave 9 Wave 10 Wave 11 Wave 12 Wave 13 Wave 14 Less(3/14 - (3/17 - (3/21 - (3/28 - (4/3 - (4/11- (4/18- (4/25- (5/1 - (5/8 - (5/15 - (5/27 - (5/29 - than $50k -3/15) 3/18) 3/23) 3/30) 4/5) 4/13) 4/20) 4/27) 5/3) 5/10) 5/17) 5/28) 5/31) MALE FEMALE 18-34 35-49 50-64 65+ $50k $75k $75k+ GOP DEM IND/OTH
(A) (B) (C) (D) (E) (F) (G) (H) (I) (J) (K) (L) (M) (N) (O) (P) (Q) (R) (S) (T) (U) (V) (W) (X) (Y)
- - - - - - - - - - - - 689 381 308 178 170 166 175 272 139 249 256 226 207Unweighted Base-** -** -** -** -** -** -** -** -** -** -** -** 656 317 338 192 179 149 136 216 113 302 230 231 194Weighted Base
- - - - - - - - - - - - 328 170 158 85 98 66 79 90 51 179 138 119 71- - - - - - - - - - - - 50% 54% 47% 44% 54% 44% 58% 42% 45% 59% 60% 51% 37%
PR TU Y Y
Top 2 Box (Net)
- - - - - - - - - - - - 165 87 78 46 60 33 26 46 19 97 75 63 27- - - - - - - - - - - - 25% 27% 23% 24% 34% 22% 19% 21% 17% 32% 32% 27% 14%
rS TU Y Y
7 - Very good
- - - - - - - - - - - - 163 83 80 39 37 33 54 44 32 82 63 55 44- - - - - - - - - - - - 25% 26% 24% 20% 21% 22% 39% 21% 28% 27% 27% 24% 23%
PQR
6
- - - - - - - - - - - - 136 65 71 45 33 31 27 45 28 57 42 48 46- - - - - - - - - - - - 21% 21% 21% 24% 18% 21% 20% 21% 25% 19% 18% 21% 24%
5
- - - - - - - - - - - - 89 37 52 29 28 21 11 33 15 38 32 21 35- - - - - - - - - - - - 14% 12% 15% 15% 15% 14% 8% 15% 13% 13% 14% 9% 18%
X
4
- - - - - - - - - - - - 42 22 20 13 13 10 6 15 12 15 7 20 15- - - - - - - - - - - - 6% 7% 6% 7% 7% 7% 4% 7% 11% 5% 3% 9% 8%
v W w
3
- - - - - - - - - - - - 19 12 7 6 3 8 2 14 2 2 1 9 8- - - - - - - - - - - - 3% 4% 2% 3% 2% 5% 2% 7% 1% 1% 1% 4% 4%
uV W W
Bottom 2 Box (Net)
- - - - - - - - - - - - 7 6 1 1 3 2 1 5 1 * 1 2 4- - - - - - - - - - - - 1% 2% * 1% 2% 1% 1% 2% 1% * 1% 1% 2%
o V
2
- - - - - - - - - - - - 11 5 6 4 - 6 1 9 1 2 - 7 4- - - - - - - - - - - - 2% 2% 2% 2% - 4% 1% 4% 1% 1% - 3% 2%
Q uV W w
1 - Very bad
- - - - - - - - - - - - 42 11 31 13 5 14 10 17 6 10 9 14 19- - - - - - - - - - - - 6% 3% 9% 7% 3% 9% 7% 8% 5% 3% 4% 6% 10%
N Q q v w
Not sure
- - - - - - - - - - - - 656 317 338 192 179 149 136 216 113 302 230 231 194- - - - - - - - - - - - 100% 100% 100% 100% 100% 100% 100% 100% 100% 100% 100% 100% 100%
Sigma
__________________________________________________________________________________________________________________Proportions/Means: Columns Tested (5%, 10% risk level) - A/B/C/D/E/F/G/H/I/J/K/L/M - N/O - P/Q/R/S - T/U/V - W/X/YOverlap formulae used. ** very small base (under 30) ineligible for sig testing
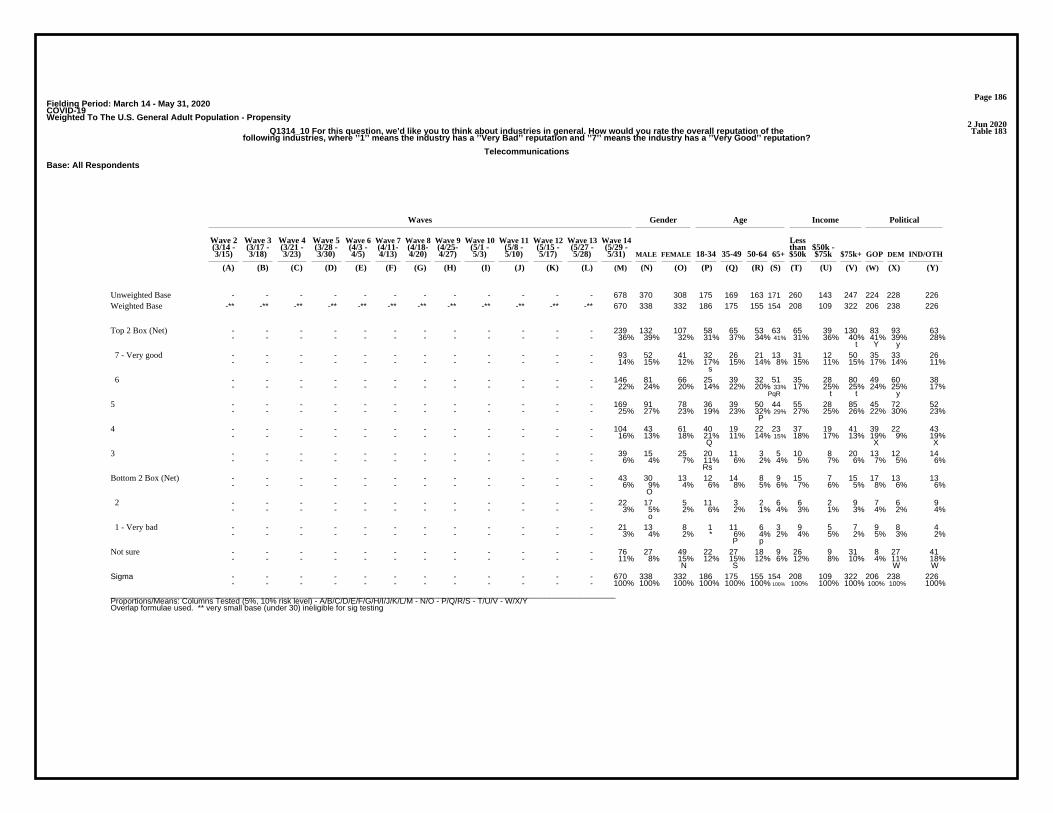
Page 186Fielding Period: March 14 - May 31, 2020COVID-19Weighted To The U.S. General Adult Population - Propensity
2 Jun 2020Table 183Q1314_10 For this question, we’d like you to think about industries in general. How would you rate the overall reputation of the
following industries, where ’’1’’ means the industry has a ’’Very Bad’’ reputation and ’’7’’ means the industry has a ’’Very Good’’ reputation?
Telecommunications
Base: All Respondents
Waves Gender Age Income Political
Wave 2 Wave 3 Wave 4 Wave 5 Wave 6 Wave 7 Wave 8 Wave 9 Wave 10 Wave 11 Wave 12 Wave 13 Wave 14 Less(3/14 - (3/17 - (3/21 - (3/28 - (4/3 - (4/11- (4/18- (4/25- (5/1 - (5/8 - (5/15 - (5/27 - (5/29 - than $50k -3/15) 3/18) 3/23) 3/30) 4/5) 4/13) 4/20) 4/27) 5/3) 5/10) 5/17) 5/28) 5/31) MALE FEMALE 18-34 35-49 50-64 65+ $50k $75k $75k+ GOP DEM IND/OTH
(A) (B) (C) (D) (E) (F) (G) (H) (I) (J) (K) (L) (M) (N) (O) (P) (Q) (R) (S) (T) (U) (V) (W) (X) (Y)
- - - - - - - - - - - - 678 370 308 175 169 163 171 260 143 247 224 228 226Unweighted Base-** -** -** -** -** -** -** -** -** -** -** -** 670 338 332 186 175 155 154 208 109 322 206 238 226Weighted Base
- - - - - - - - - - - - 239 132 107 58 65 53 63 65 39 130 83 93 63- - - - - - - - - - - - 36% 39% 32% 31% 37% 34% 41% 31% 36% 40% 41% 39% 28%
t Y y
Top 2 Box (Net)
- - - - - - - - - - - - 93 52 41 32 26 21 13 31 12 50 35 33 26- - - - - - - - - - - - 14% 15% 12% 17% 15% 14% 8% 15% 11% 15% 17% 14% 11%
s
7 - Very good
- - - - - - - - - - - - 146 81 66 25 39 32 51 35 28 80 49 60 38- - - - - - - - - - - - 22% 24% 20% 14% 22% 20% 33% 17% 25% 25% 24% 25% 17%
PqR t t y
6
- - - - - - - - - - - - 169 91 78 36 39 50 44 55 28 85 45 72 52- - - - - - - - - - - - 25% 27% 23% 19% 23% 32% 29% 27% 25% 26% 22% 30% 23%
P
5
- - - - - - - - - - - - 104 43 61 40 19 22 23 37 19 41 39 22 43- - - - - - - - - - - - 16% 13% 18% 21% 11% 14% 15% 18% 17% 13% 19% 9% 19%
Q X X
4
- - - - - - - - - - - - 39 15 25 20 11 3 5 10 8 20 13 12 14- - - - - - - - - - - - 6% 4% 7% 11% 6% 2% 4% 5% 7% 6% 7% 5% 6%
Rs
3
- - - - - - - - - - - - 43 30 13 12 14 8 9 15 7 15 17 13 13- - - - - - - - - - - - 6% 9% 4% 6% 8% 5% 6% 7% 6% 5% 8% 6% 6%
O
Bottom 2 Box (Net)
- - - - - - - - - - - - 22 17 5 11 3 2 6 6 2 9 7 6 9- - - - - - - - - - - - 3% 5% 2% 6% 2% 1% 4% 3% 1% 3% 4% 2% 4%
o
2
- - - - - - - - - - - - 21 13 8 1 11 6 3 9 5 7 9 8 4- - - - - - - - - - - - 3% 4% 2% * 6% 4% 2% 4% 5% 2% 5% 3% 2%
P p
1 - Very bad
- - - - - - - - - - - - 76 27 49 22 27 18 9 26 9 31 8 27 41- - - - - - - - - - - - 11% 8% 15% 12% 15% 12% 6% 12% 8% 10% 4% 11% 18%
N S W W
Not sure
- - - - - - - - - - - - 670 338 332 186 175 155 154 208 109 322 206 238 226- - - - - - - - - - - - 100% 100% 100% 100% 100% 100% 100% 100% 100% 100% 100% 100% 100%
Sigma
__________________________________________________________________________________________________________________Proportions/Means: Columns Tested (5%, 10% risk level) - A/B/C/D/E/F/G/H/I/J/K/L/M - N/O - P/Q/R/S - T/U/V - W/X/YOverlap formulae used. ** very small base (under 30) ineligible for sig testing
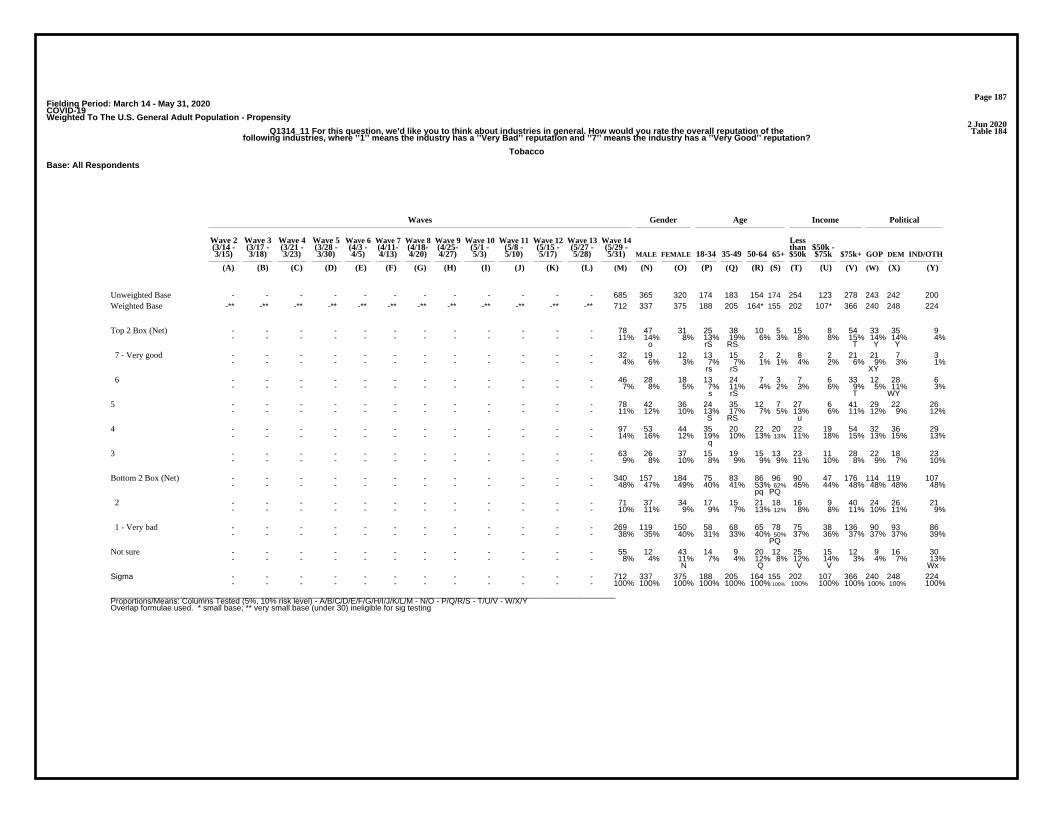
Page 187Fielding Period: March 14 - May 31, 2020COVID-19Weighted To The U.S. General Adult Population - Propensity
2 Jun 2020Table 184Q1314_11 For this question, we’d like you to think about industries in general. How would you rate the overall reputation of the
following industries, where ’’1’’ means the industry has a ’’Very Bad’’ reputation and ’’7’’ means the industry has a ’’Very Good’’ reputation?
Tobacco
Base: All Respondents
Waves Gender Age Income Political
Wave 2 Wave 3 Wave 4 Wave 5 Wave 6 Wave 7 Wave 8 Wave 9 Wave 10 Wave 11 Wave 12 Wave 13 Wave 14 Less(3/14 - (3/17 - (3/21 - (3/28 - (4/3 - (4/11- (4/18- (4/25- (5/1 - (5/8 - (5/15 - (5/27 - (5/29 - than $50k -3/15) 3/18) 3/23) 3/30) 4/5) 4/13) 4/20) 4/27) 5/3) 5/10) 5/17) 5/28) 5/31) MALE FEMALE 18-34 35-49 50-64 65+ $50k $75k $75k+ GOP DEM IND/OTH
(A) (B) (C) (D) (E) (F) (G) (H) (I) (J) (K) (L) (M) (N) (O) (P) (Q) (R) (S) (T) (U) (V) (W) (X) (Y)
- - - - - - - - - - - - 685 365 320 174 183 154 174 254 123 278 243 242 200Unweighted Base-** -** -** -** -** -** -** -** -** -** -** -** 712 337 375 188 205 164* 155 202 107* 366 240 248 224Weighted Base
- - - - - - - - - - - - 78 47 31 25 38 10 5 15 8 54 33 35 9- - - - - - - - - - - - 11% 14% 8% 13% 19% 6% 3% 8% 8% 15% 14% 14% 4%
o rS RS T Y Y
Top 2 Box (Net)
- - - - - - - - - - - - 32 19 12 13 15 2 2 8 2 21 21 7 3- - - - - - - - - - - - 4% 6% 3% 7% 7% 1% 1% 4% 2% 6% 9% 3% 1%
rs rS XY
7 - Very good
- - - - - - - - - - - - 46 28 18 13 24 7 3 7 6 33 12 28 6- - - - - - - - - - - - 7% 8% 5% 7% 11% 4% 2% 3% 6% 9% 5% 11% 3%
s rS T WY
6
- - - - - - - - - - - - 78 42 36 24 35 12 7 27 6 41 29 22 26- - - - - - - - - - - - 11% 12% 10% 13% 17% 7% 5% 13% 6% 11% 12% 9% 12%
S RS u
5
- - - - - - - - - - - - 97 53 44 35 20 22 20 22 19 54 32 36 29- - - - - - - - - - - - 14% 16% 12% 19% 10% 13% 13% 11% 18% 15% 13% 15% 13%
q
4
- - - - - - - - - - - - 63 26 37 15 19 15 13 23 11 28 22 18 23- - - - - - - - - - - - 9% 8% 10% 8% 9% 9% 9% 11% 10% 8% 9% 7% 10%
3
- - - - - - - - - - - - 340 157 184 75 83 86 96 90 47 176 114 119 107- - - - - - - - - - - - 48% 47% 49% 40% 41% 53% 62% 45% 44% 48% 48% 48% 48%
pq PQ
Bottom 2 Box (Net)
- - - - - - - - - - - - 71 37 34 17 15 21 18 16 9 40 24 26 21- - - - - - - - - - - - 10% 11% 9% 9% 7% 13% 12% 8% 8% 11% 10% 11% 9%
2
- - - - - - - - - - - - 269 119 150 58 68 65 78 75 38 136 90 93 86- - - - - - - - - - - - 38% 35% 40% 31% 33% 40% 50% 37% 36% 37% 37% 37% 39%
PQ
1 - Very bad
- - - - - - - - - - - - 55 12 43 14 9 20 12 25 15 12 9 16 30- - - - - - - - - - - - 8% 4% 11% 7% 4% 12% 8% 12% 14% 3% 4% 7% 13%
N Q V V Wx
Not sure
- - - - - - - - - - - - 712 337 375 188 205 164 155 202 107 366 240 248 224- - - - - - - - - - - - 100% 100% 100% 100% 100% 100% 100% 100% 100% 100% 100% 100% 100%
Sigma
__________________________________________________________________________________________________________________Proportions/Means: Columns Tested (5%, 10% risk level) - A/B/C/D/E/F/G/H/I/J/K/L/M - N/O - P/Q/R/S - T/U/V - W/X/YOverlap formulae used. * small base; ** very small base (under 30) ineligible for sig testing
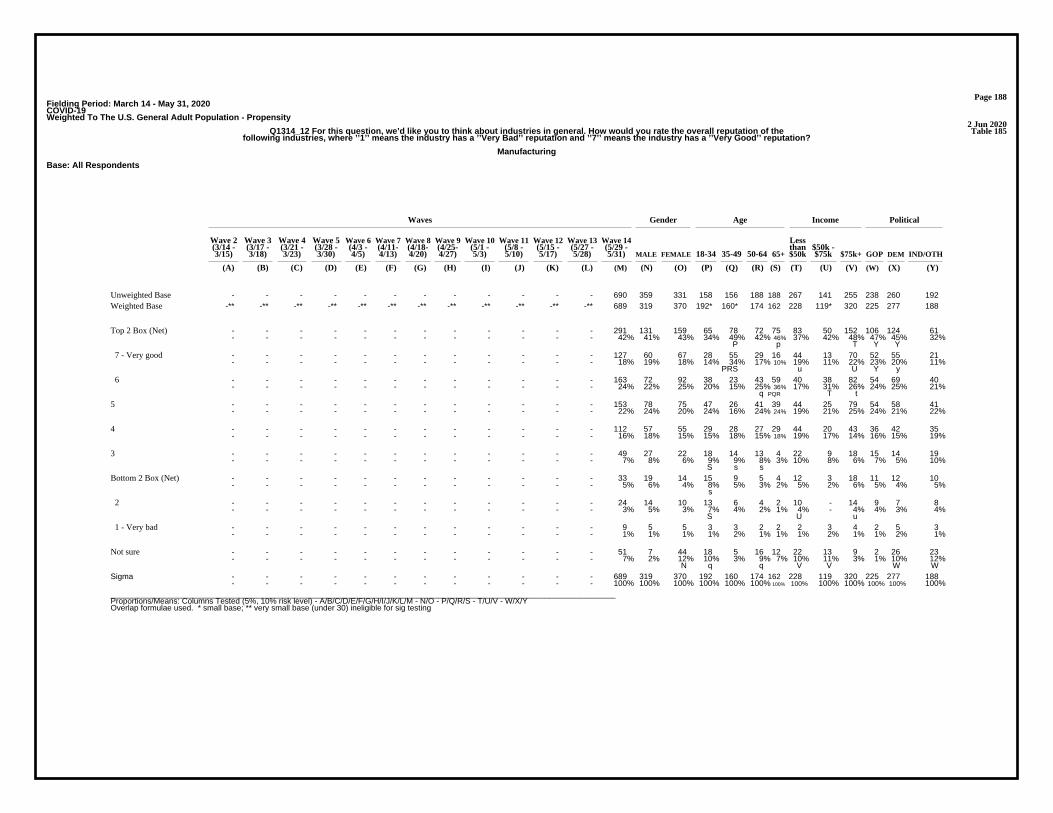
Page 188Fielding Period: March 14 - May 31, 2020COVID-19Weighted To The U.S. General Adult Population - Propensity
2 Jun 2020Table 185Q1314_12 For this question, we’d like you to think about industries in general. How would you rate the overall reputation of the
following industries, where ’’1’’ means the industry has a ’’Very Bad’’ reputation and ’’7’’ means the industry has a ’’Very Good’’ reputation?
Manufacturing
Base: All Respondents
Waves Gender Age Income Political
Wave 2 Wave 3 Wave 4 Wave 5 Wave 6 Wave 7 Wave 8 Wave 9 Wave 10 Wave 11 Wave 12 Wave 13 Wave 14 Less(3/14 - (3/17 - (3/21 - (3/28 - (4/3 - (4/11- (4/18- (4/25- (5/1 - (5/8 - (5/15 - (5/27 - (5/29 - than $50k -3/15) 3/18) 3/23) 3/30) 4/5) 4/13) 4/20) 4/27) 5/3) 5/10) 5/17) 5/28) 5/31) MALE FEMALE 18-34 35-49 50-64 65+ $50k $75k $75k+ GOP DEM IND/OTH
(A) (B) (C) (D) (E) (F) (G) (H) (I) (J) (K) (L) (M) (N) (O) (P) (Q) (R) (S) (T) (U) (V) (W) (X) (Y)
- - - - - - - - - - - - 690 359 331 158 156 188 188 267 141 255 238 260 192Unweighted Base-** -** -** -** -** -** -** -** -** -** -** -** 689 319 370 192* 160* 174 162 228 119* 320 225 277 188Weighted Base
- - - - - - - - - - - - 291 131 159 65 78 72 75 83 50 152 106 124 61- - - - - - - - - - - - 42% 41% 43% 34% 49% 42% 46% 37% 42% 48% 47% 45% 32%
P p T Y Y
Top 2 Box (Net)
- - - - - - - - - - - - 127 60 67 28 55 29 16 44 13 70 52 55 21- - - - - - - - - - - - 18% 19% 18% 14% 34% 17% 10% 19% 11% 22% 23% 20% 11%
PRS u U Y y
7 - Very good
- - - - - - - - - - - - 163 72 92 38 23 43 59 40 38 82 54 69 40- - - - - - - - - - - - 24% 22% 25% 20% 15% 25% 36% 17% 31% 26% 24% 25% 21%
q PQR T t
6
- - - - - - - - - - - - 153 78 75 47 26 41 39 44 25 79 54 58 41- - - - - - - - - - - - 22% 24% 20% 24% 16% 24% 24% 19% 21% 25% 24% 21% 22%
5
- - - - - - - - - - - - 112 57 55 29 28 27 29 44 20 43 36 42 35- - - - - - - - - - - - 16% 18% 15% 15% 18% 15% 18% 19% 17% 14% 16% 15% 19%
4
- - - - - - - - - - - - 49 27 22 18 14 13 4 22 9 18 15 14 19- - - - - - - - - - - - 7% 8% 6% 9% 9% 8% 3% 10% 8% 6% 7% 5% 10%
S s s
3
- - - - - - - - - - - - 33 19 14 15 9 5 4 12 3 18 11 12 10- - - - - - - - - - - - 5% 6% 4% 8% 5% 3% 2% 5% 2% 6% 5% 4% 5%
s
Bottom 2 Box (Net)
- - - - - - - - - - - - 24 14 10 13 6 4 2 10 - 14 9 7 8- - - - - - - - - - - - 3% 5% 3% 7% 4% 2% 1% 4% - 4% 4% 3% 4%
S U u
2
- - - - - - - - - - - - 9 5 5 3 3 2 2 2 3 4 2 5 3- - - - - - - - - - - - 1% 1% 1% 1% 2% 1% 1% 1% 2% 1% 1% 2% 1%
1 - Very bad
- - - - - - - - - - - - 51 7 44 18 5 16 12 22 13 9 2 26 23- - - - - - - - - - - - 7% 2% 12% 10% 3% 9% 7% 10% 11% 3% 1% 10% 12%
N q q V V W W
Not sure
- - - - - - - - - - - - 689 319 370 192 160 174 162 228 119 320 225 277 188- - - - - - - - - - - - 100% 100% 100% 100% 100% 100% 100% 100% 100% 100% 100% 100% 100%
Sigma
__________________________________________________________________________________________________________________Proportions/Means: Columns Tested (5%, 10% risk level) - A/B/C/D/E/F/G/H/I/J/K/L/M - N/O - P/Q/R/S - T/U/V - W/X/YOverlap formulae used. * small base; ** very small base (under 30) ineligible for sig testing

Page 189Fielding Period: March 14 - May 31, 2020COVID-19Weighted To The U.S. General Adult Population - Propensity
2 Jun 2020Table 186Q1314_13 For this question, we’d like you to think about industries in general. How would you rate the overall reputation of the
following industries, where ’’1’’ means the industry has a ’’Very Bad’’ reputation and ’’7’’ means the industry has a ’’Very Good’’ reputation?
Government
Base: All Respondents
Waves Gender Age Income Political
Wave 2 Wave 3 Wave 4 Wave 5 Wave 6 Wave 7 Wave 8 Wave 9 Wave 10 Wave 11 Wave 12 Wave 13 Wave 14 Less(3/14 - (3/17 - (3/21 - (3/28 - (4/3 - (4/11- (4/18- (4/25- (5/1 - (5/8 - (5/15 - (5/27 - (5/29 - than $50k -3/15) 3/18) 3/23) 3/30) 4/5) 4/13) 4/20) 4/27) 5/3) 5/10) 5/17) 5/28) 5/31) MALE FEMALE 18-34 35-49 50-64 65+ $50k $75k $75k+ GOP DEM IND/OTH
(A) (B) (C) (D) (E) (F) (G) (H) (I) (J) (K) (L) (M) (N) (O) (P) (Q) (R) (S) (T) (U) (V) (W) (X) (Y)
- - - - - - - - - - - - 691 367 324 169 169 181 172 267 146 249 232 246 213Unweighted Base-** -** -** -** -** -** -** -** -** -** -** -** 729 337 392 205* 185 183 156 233 130* 340 236 270 223Weighted Base
- - - - - - - - - - - - 183 91 93 65 61 33 25 39 24 115 85 72 26- - - - - - - - - - - - 25% 27% 24% 32% 33% 18% 16% 17% 19% 34% 36% 27% 12%
RS RS TU xY Y
Top 2 Box (Net)
- - - - - - - - - - - - 99 49 50 37 40 14 7 20 13 66 51 39 9- - - - - - - - - - - - 14% 14% 13% 18% 22% 8% 5% 8% 10% 19% 22% 14% 4%
RS RS Tu Y Y
7 - Very good
- - - - - - - - - - - - 85 42 43 28 21 19 17 19 11 49 34 33 17- - - - - - - - - - - - 12% 13% 11% 14% 11% 10% 11% 8% 8% 15% 14% 12% 8%
t
6
- - - - - - - - - - - - 130 62 69 33 31 32 33 36 27 66 51 42 38- - - - - - - - - - - - 18% 18% 18% 16% 17% 18% 21% 15% 21% 20% 22% 15% 17%
5
- - - - - - - - - - - - 134 71 63 35 31 44 25 48 28 54 49 42 43- - - - - - - - - - - - 18% 21% 16% 17% 17% 24% 16% 21% 22% 16% 21% 16% 19%
4
- - - - - - - - - - - - 75 33 42 14 21 16 25 26 15 30 17 27 32- - - - - - - - - - - - 10% 10% 11% 7% 12% 8% 16% 11% 11% 9% 7% 10% 14%
Pr w
3
- - - - - - - - - - - - 177 77 100 48 35 50 44 67 29 71 31 79 68- - - - - - - - - - - - 24% 23% 26% 24% 19% 27% 28% 29% 23% 21% 13% 29% 30%
W W
Bottom 2 Box (Net)
- - - - - - - - - - - - 67 42 25 19 11 22 17 16 13 34 17 27 23- - - - - - - - - - - - 9% 12% 6% 9% 6% 12% 11% 7% 10% 10% 7% 10% 10%
O
2
- - - - - - - - - - - - 110 35 75 30 24 29 27 51 16 37 14 51 44- - - - - - - - - - - - 15% 10% 19% 15% 13% 16% 17% 22% 13% 11% 6% 19% 20%
N uV W W
1 - Very bad
- - - - - - - - - - - - 28 3 25 10 5 9 4 18 6 3 3 9 16- - - - - - - - - - - - 4% 1% 6% 5% 3% 5% 3% 8% 5% 1% 1% 3% 7%
N V V W
Not sure
- - - - - - - - - - - - 729 337 392 205 185 183 156 233 130 340 236 270 223- - - - - - - - - - - - 100% 100% 100% 100% 100% 100% 100% 100% 100% 100% 100% 100% 100%
Sigma
__________________________________________________________________________________________________________________Proportions/Means: Columns Tested (5%, 10% risk level) - A/B/C/D/E/F/G/H/I/J/K/L/M - N/O - P/Q/R/S - T/U/V - W/X/YOverlap formulae used. * small base; ** very small base (under 30) ineligible for sig testing

Page 190Fielding Period: March 14 - May 31, 2020COVID-19Weighted To The U.S. General Adult Population - Propensity
2 Jun 2020Table 187Q1314_14 For this question, we’d like you to think about industries in general. How would you rate the overall reputation of the
following industries, where ’’1’’ means the industry has a ’’Very Bad’’ reputation and ’’7’’ means the industry has a ’’Very Good’’ reputation?
Banking
Base: All Respondents
Waves Gender Age Income Political
Wave 2 Wave 3 Wave 4 Wave 5 Wave 6 Wave 7 Wave 8 Wave 9 Wave 10 Wave 11 Wave 12 Wave 13 Wave 14 Less(3/14 - (3/17 - (3/21 - (3/28 - (4/3 - (4/11- (4/18- (4/25- (5/1 - (5/8 - (5/15 - (5/27 - (5/29 - than $50k -3/15) 3/18) 3/23) 3/30) 4/5) 4/13) 4/20) 4/27) 5/3) 5/10) 5/17) 5/28) 5/31) MALE FEMALE 18-34 35-49 50-64 65+ $50k $75k $75k+ GOP DEM IND/OTH
(A) (B) (C) (D) (E) (F) (G) (H) (I) (J) (K) (L) (M) (N) (O) (P) (Q) (R) (S) (T) (U) (V) (W) (X) (Y)
- - - - - - - - - - - - 696 382 314 182 170 164 180 257 137 271 240 239 217Unweighted Base-** -** -** -** -** -** -** -** -** -** -** -** 714 356 358 212* 174 161* 167 215 110* 349 230 257 228Weighted Base
- - - - - - - - - - - - 279 138 141 60 77 70 71 65 50 150 79 125 75- - - - - - - - - - - - 39% 39% 39% 28% 44% 44% 42% 30% 45% 43% 34% 49% 33%
P P P T T WY
Top 2 Box (Net)
- - - - - - - - - - - - 132 69 63 29 41 37 25 35 17 71 39 59 34- - - - - - - - - - - - 18% 19% 18% 14% 23% 23% 15% 16% 15% 20% 17% 23% 15%
p p
7 - Very good
- - - - - - - - - - - - 147 69 77 31 37 33 46 30 33 79 40 66 41- - - - - - - - - - - - 21% 19% 22% 15% 21% 21% 27% 14% 30% 23% 17% 26% 18%
P T t w
6
- - - - - - - - - - - - 178 84 94 49 34 46 48 51 19 101 77 47 53- - - - - - - - - - - - 25% 23% 26% 23% 20% 28% 29% 23% 17% 29% 34% 18% 23%
u Xy
5
- - - - - - - - - - - - 134 72 63 47 31 27 29 49 26 50 47 42 45- - - - - - - - - - - - 19% 20% 17% 22% 18% 17% 17% 23% 23% 14% 20% 16% 20%
v v
4
- - - - - - - - - - - - 42 26 16 14 12 6 10 15 5 21 15 15 12- - - - - - - - - - - - 6% 7% 5% 6% 7% 4% 6% 7% 5% 6% 6% 6% 5%
3
- - - - - - - - - - - - 43 28 15 19 11 8 5 16 4 22 8 16 20- - - - - - - - - - - - 6% 8% 4% 9% 6% 5% 3% 8% 4% 6% 3% 6% 9%
s w
Bottom 2 Box (Net)
- - - - - - - - - - - - 20 13 7 11 1 6 1 7 2 10 7 2 12- - - - - - - - - - - - 3% 4% 2% 5% 1% 4% 1% 3% 2% 3% 3% 1% 5%
qs X
2
- - - - - - - - - - - - 23 14 9 8 10 2 4 9 2 12 1 14 8- - - - - - - - - - - - 3% 4% 2% 4% 6% 1% 2% 4% 2% 3% 1% 5% 4%
r W
1 - Very bad
- - - - - - - - - - - - 38 9 29 22 8 4 4 20 6 5 4 11 23- - - - - - - - - - - - 5% 2% 8% 11% 5% 3% 2% 9% 6% 1% 2% 4% 10%
N RS V V Wx
Not sure
- - - - - - - - - - - - 714 356 358 212 174 161 167 215 110 349 230 257 228- - - - - - - - - - - - 100% 100% 100% 100% 100% 100% 100% 100% 100% 100% 100% 100% 100%
Sigma
__________________________________________________________________________________________________________________Proportions/Means: Columns Tested (5%, 10% risk level) - A/B/C/D/E/F/G/H/I/J/K/L/M - N/O - P/Q/R/S - T/U/V - W/X/YOverlap formulae used. * small base; ** very small base (under 30) ineligible for sig testing

Page 191Fielding Period: March 14 - May 31, 2020COVID-19Weighted To The U.S. General Adult Population - Propensity
2 Jun 2020Table 188Q1314_15 For this question, we’d like you to think about industries in general. How would you rate the overall reputation of the
following industries, where ’’1’’ means the industry has a ’’Very Bad’’ reputation and ’’7’’ means the industry has a ’’Very Good’’ reputation?
Media
Base: All Respondents
Waves Gender Age Income Political
Wave 2 Wave 3 Wave 4 Wave 5 Wave 6 Wave 7 Wave 8 Wave 9 Wave 10 Wave 11 Wave 12 Wave 13 Wave 14 Less(3/14 - (3/17 - (3/21 - (3/28 - (4/3 - (4/11- (4/18- (4/25- (5/1 - (5/8 - (5/15 - (5/27 - (5/29 - than $50k -3/15) 3/18) 3/23) 3/30) 4/5) 4/13) 4/20) 4/27) 5/3) 5/10) 5/17) 5/28) 5/31) MALE FEMALE 18-34 35-49 50-64 65+ $50k $75k $75k+ GOP DEM IND/OTH
(A) (B) (C) (D) (E) (F) (G) (H) (I) (J) (K) (L) (M) (N) (O) (P) (Q) (R) (S) (T) (U) (V) (W) (X) (Y)
- - - - - - - - - - - - 679 382 297 157 170 189 163 247 141 259 256 222 201Unweighted Base-** -** -** -** -** -** -** -** -** -** -** -** 660 355 305 182* 181 165 132 192 113* 326 236 226 198Weighted Base
- - - - - - - - - - - - 168 105 62 51 58 32 26 39 26 102 58 80 30- - - - - - - - - - - - 25% 30% 21% 28% 32% 19% 20% 20% 23% 31% 25% 35% 15%
O Rs T y WY
Top 2 Box (Net)
- - - - - - - - - - - - 79 51 28 19 39 13 9 19 10 50 31 35 12- - - - - - - - - - - - 12% 14% 9% 10% 21% 8% 7% 10% 9% 15% 13% 16% 6%
o PRS Y Y
7 - Very good
- - - - - - - - - - - - 89 54 35 32 20 19 18 20 16 52 26 45 18- - - - - - - - - - - - 13% 15% 11% 18% 11% 12% 13% 11% 14% 16% 11% 20% 9%
WY
6
- - - - - - - - - - - - 133 70 63 43 38 34 19 33 22 71 37 59 37- - - - - - - - - - - - 20% 20% 21% 24% 21% 20% 14% 17% 20% 22% 16% 26% 18%
s W
5
- - - - - - - - - - - - 117 50 67 30 37 26 24 34 21 53 39 42 36- - - - - - - - - - - - 18% 14% 22% 16% 21% 16% 18% 17% 18% 16% 17% 19% 18%
N
4
- - - - - - - - - - - - 74 41 33 24 10 24 17 27 16 29 29 18 28- - - - - - - - - - - - 11% 11% 11% 13% 6% 14% 13% 14% 14% 9% 12% 8% 14%
q Q q
3
- - - - - - - - - - - - 144 78 67 30 30 41 44 50 28 62 70 21 53- - - - - - - - - - - - 22% 22% 22% 17% 16% 25% 33% 26% 25% 19% 30% 9% 27%
PQ X X
Bottom 2 Box (Net)
- - - - - - - - - - - - 49 21 28 11 10 13 14 17 11 19 24 8 17- - - - - - - - - - - - 7% 6% 9% 6% 5% 8% 11% 9% 10% 6% 10% 4% 9%
X x
2
- - - - - - - - - - - - 96 57 39 19 20 27 29 33 17 42 46 13 37- - - - - - - - - - - - 15% 16% 13% 10% 11% 17% 22% 17% 15% 13% 19% 6% 18%
PQ X X
1 - Very bad
- - - - - - - - - - - - 23 12 11 4 8 9 2 9 - 9 3 6 15- - - - - - - - - - - - 3% 3% 4% 2% 5% 5% 2% 5% - 3% 1% 2% 7%
U Wx
Not sure
- - - - - - - - - - - - 660 355 305 182 181 165 132 192 113 326 236 226 198- - - - - - - - - - - - 100% 100% 100% 100% 100% 100% 100% 100% 100% 100% 100% 100% 100%
Sigma
__________________________________________________________________________________________________________________Proportions/Means: Columns Tested (5%, 10% risk level) - A/B/C/D/E/F/G/H/I/J/K/L/M - N/O - P/Q/R/S - T/U/V - W/X/YOverlap formulae used. * small base; ** very small base (under 30) ineligible for sig testing
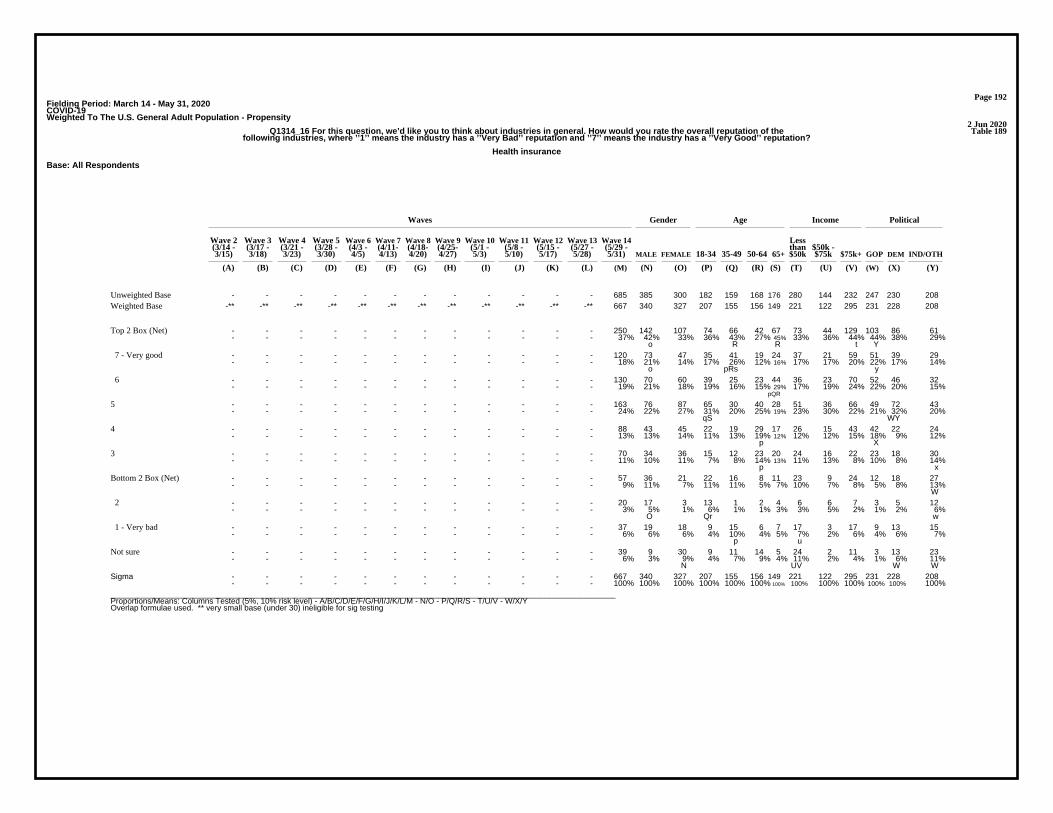
Page 192Fielding Period: March 14 - May 31, 2020COVID-19Weighted To The U.S. General Adult Population - Propensity
2 Jun 2020Table 189Q1314_16 For this question, we’d like you to think about industries in general. How would you rate the overall reputation of the
following industries, where ’’1’’ means the industry has a ’’Very Bad’’ reputation and ’’7’’ means the industry has a ’’Very Good’’ reputation?
Health insurance
Base: All Respondents
Waves Gender Age Income Political
Wave 2 Wave 3 Wave 4 Wave 5 Wave 6 Wave 7 Wave 8 Wave 9 Wave 10 Wave 11 Wave 12 Wave 13 Wave 14 Less(3/14 - (3/17 - (3/21 - (3/28 - (4/3 - (4/11- (4/18- (4/25- (5/1 - (5/8 - (5/15 - (5/27 - (5/29 - than $50k -3/15) 3/18) 3/23) 3/30) 4/5) 4/13) 4/20) 4/27) 5/3) 5/10) 5/17) 5/28) 5/31) MALE FEMALE 18-34 35-49 50-64 65+ $50k $75k $75k+ GOP DEM IND/OTH
(A) (B) (C) (D) (E) (F) (G) (H) (I) (J) (K) (L) (M) (N) (O) (P) (Q) (R) (S) (T) (U) (V) (W) (X) (Y)
- - - - - - - - - - - - 685 385 300 182 159 168 176 280 144 232 247 230 208Unweighted Base-** -** -** -** -** -** -** -** -** -** -** -** 667 340 327 207 155 156 149 221 122 295 231 228 208Weighted Base
- - - - - - - - - - - - 250 142 107 74 66 42 67 73 44 129 103 86 61- - - - - - - - - - - - 37% 42% 33% 36% 43% 27% 45% 33% 36% 44% 44% 38% 29%
o R R t Y
Top 2 Box (Net)
- - - - - - - - - - - - 120 73 47 35 41 19 24 37 21 59 51 39 29- - - - - - - - - - - - 18% 21% 14% 17% 26% 12% 16% 17% 17% 20% 22% 17% 14%
o pRs y
7 - Very good
- - - - - - - - - - - - 130 70 60 39 25 23 44 36 23 70 52 46 32- - - - - - - - - - - - 19% 21% 18% 19% 16% 15% 29% 17% 19% 24% 22% 20% 15%
pQR
6
- - - - - - - - - - - - 163 76 87 65 30 40 28 51 36 66 49 72 43- - - - - - - - - - - - 24% 22% 27% 31% 20% 25% 19% 23% 30% 22% 21% 32% 20%
qS WY
5
- - - - - - - - - - - - 88 43 45 22 19 29 17 26 15 43 42 22 24- - - - - - - - - - - - 13% 13% 14% 11% 13% 19% 12% 12% 12% 15% 18% 9% 12%
p X
4
- - - - - - - - - - - - 70 34 36 15 12 23 20 24 16 22 23 18 30- - - - - - - - - - - - 11% 10% 11% 7% 8% 14% 13% 11% 13% 8% 10% 8% 14%
p x
3
- - - - - - - - - - - - 57 36 21 22 16 8 11 23 9 24 12 18 27- - - - - - - - - - - - 9% 11% 7% 11% 11% 5% 7% 10% 7% 8% 5% 8% 13%
W
Bottom 2 Box (Net)
- - - - - - - - - - - - 20 17 3 13 1 2 4 6 6 7 3 5 12- - - - - - - - - - - - 3% 5% 1% 6% 1% 1% 3% 3% 5% 2% 1% 2% 6%
O Qr w
2
- - - - - - - - - - - - 37 19 18 9 15 6 7 17 3 17 9 13 15- - - - - - - - - - - - 6% 6% 6% 4% 10% 4% 5% 7% 2% 6% 4% 6% 7%
p u
1 - Very bad
- - - - - - - - - - - - 39 9 30 9 11 14 5 24 2 11 3 13 23- - - - - - - - - - - - 6% 3% 9% 4% 7% 9% 4% 11% 2% 4% 1% 6% 11%
N UV W W
Not sure
- - - - - - - - - - - - 667 340 327 207 155 156 149 221 122 295 231 228 208- - - - - - - - - - - - 100% 100% 100% 100% 100% 100% 100% 100% 100% 100% 100% 100% 100%
Sigma
__________________________________________________________________________________________________________________Proportions/Means: Columns Tested (5%, 10% risk level) - A/B/C/D/E/F/G/H/I/J/K/L/M - N/O - P/Q/R/S - T/U/V - W/X/YOverlap formulae used. ** very small base (under 30) ineligible for sig testing

Page 193Fielding Period: March 14 - May 31, 2020COVID-19Weighted To The U.S. General Adult Population - Propensity
2 Jun 2020Table 190Q1314_17 For this question, we’d like you to think about industries in general. How would you rate the overall reputation of the
following industries, where ’’1’’ means the industry has a ’’Very Bad’’ reputation and ’’7’’ means the industry has a ’’Very Good’’ reputation?
Retail (grocery)
Base: All Respondents
Waves Gender Age Income Political
Wave 2 Wave 3 Wave 4 Wave 5 Wave 6 Wave 7 Wave 8 Wave 9 Wave 10 Wave 11 Wave 12 Wave 13 Wave 14 Less(3/14 - (3/17 - (3/21 - (3/28 - (4/3 - (4/11- (4/18- (4/25- (5/1 - (5/8 - (5/15 - (5/27 - (5/29 - than $50k -3/15) 3/18) 3/23) 3/30) 4/5) 4/13) 4/20) 4/27) 5/3) 5/10) 5/17) 5/28) 5/31) MALE FEMALE 18-34 35-49 50-64 65+ $50k $75k $75k+ GOP DEM IND/OTH
(A) (B) (C) (D) (E) (F) (G) (H) (I) (J) (K) (L) (M) (N) (O) (P) (Q) (R) (S) (T) (U) (V) (W) (X) (Y)
- - - - - - - - - - - - 681 389 292 166 153 184 178 257 134 261 249 232 200Unweighted Base-** -** -** -** -** -** -** -** -** -** -** -** 677 338 339 189* 159* 169 161 205 115* 324 245 233 199Weighted Base
- - - - - - - - - - - - 396 187 209 93 100 85 117 117 70 194 150 134 112- - - - - - - - - - - - 59% 55% 62% 49% 63% 51% 73% 57% 61% 60% 61% 57% 56%
pr PR
Top 2 Box (Net)
- - - - - - - - - - - - 189 70 120 46 43 42 59 64 30 88 74 75 41- - - - - - - - - - - - 28% 21% 35% 24% 27% 25% 37% 31% 26% 27% 30% 32% 20%
N pr y Y
7 - Very good
- - - - - - - - - - - - 207 117 89 48 57 43 58 53 40 106 76 59 72- - - - - - - - - - - - 31% 35% 26% 25% 36% 26% 36% 26% 35% 33% 31% 25% 36%
o pr x
6
- - - - - - - - - - - - 144 83 61 52 21 41 29 39 25 75 53 52 39- - - - - - - - - - - - 21% 25% 18% 28% 13% 24% 18% 19% 21% 23% 22% 22% 20%
o Q Q
5
- - - - - - - - - - - - 68 36 33 17 21 25 6 19 13 29 23 21 24- - - - - - - - - - - - 10% 11% 10% 9% 13% 15% 4% 9% 12% 9% 9% 9% 12%
S S
4
- - - - - - - - - - - - 29 16 13 13 6 4 6 10 4 12 11 11 6- - - - - - - - - - - - 4% 5% 4% 7% 4% 2% 4% 5% 3% 4% 5% 5% 3%
3
- - - - - - - - - - - - 15 11 4 9 4 1 1 4 1 10 2 9 4- - - - - - - - - - - - 2% 3% 1% 5% 2% * * 2% 1% 3% 1% 4% 2%
rs w
Bottom 2 Box (Net)
- - - - - - - - - - - - 9 8 1 7 1 1 - 3 1 5 1 6 2- - - - - - - - - - - - 1% 2% * 4% * * - 1% 1% 2% * 2% 1%
O s
2
- - - - - - - - - - - - 6 3 3 2 3 - 1 2 - 4 1 3 2- - - - - - - - - - - - 1% 1% 1% 1% 2% - * 1% - 1% * 1% 1%
1 - Very bad
- - - - - - - - - - - - 25 5 20 5 6 13 1 15 2 5 6 6 13- - - - - - - - - - - - 4% 2% 6% 2% 4% 8% 1% 8% 2% 1% 2% 3% 7%
N pS uV wx
Not sure
- - - - - - - - - - - - 677 338 339 189 159 169 161 205 115 324 245 233 199- - - - - - - - - - - - 100% 100% 100% 100% 100% 100% 100% 100% 100% 100% 100% 100% 100%
Sigma
__________________________________________________________________________________________________________________Proportions/Means: Columns Tested (5%, 10% risk level) - A/B/C/D/E/F/G/H/I/J/K/L/M - N/O - P/Q/R/S - T/U/V - W/X/YOverlap formulae used. * small base; ** very small base (under 30) ineligible for sig testing

Page 194Fielding Period: March 14 - May 31, 2020COVID-19Weighted To The U.S. General Adult Population - Propensity
2 Jun 2020Table 191Q1314_18 For this question, we’d like you to think about industries in general. How would you rate the overall reputation of the
following industries, where ’’1’’ means the industry has a ’’Very Bad’’ reputation and ’’7’’ means the industry has a ’’Very Good’’ reputation?
Retail (apparel)
Base: All Respondents
Waves Gender Age Income Political
Wave 2 Wave 3 Wave 4 Wave 5 Wave 6 Wave 7 Wave 8 Wave 9 Wave 10 Wave 11 Wave 12 Wave 13 Wave 14 Less(3/14 - (3/17 - (3/21 - (3/28 - (4/3 - (4/11- (4/18- (4/25- (5/1 - (5/8 - (5/15 - (5/27 - (5/29 - than $50k -3/15) 3/18) 3/23) 3/30) 4/5) 4/13) 4/20) 4/27) 5/3) 5/10) 5/17) 5/28) 5/31) MALE FEMALE 18-34 35-49 50-64 65+ $50k $75k $75k+ GOP DEM IND/OTH
(A) (B) (C) (D) (E) (F) (G) (H) (I) (J) (K) (L) (M) (N) (O) (P) (Q) (R) (S) (T) (U) (V) (W) (X) (Y)
- - - - - - - - - - - - 674 365 309 162 173 179 160 252 139 253 246 234 194Unweighted Base-** -** -** -** -** -** -** -** -** -** -** -** 672 319 353 190* 175 169 138 208 108* 324 238 219 215Weighted Base
- - - - - - - - - - - - 260 121 139 68 80 66 45 69 34 148 108 90 61- - - - - - - - - - - - 39% 38% 39% 36% 46% 39% 32% 33% 32% 46% 45% 41% 28%
S TU Y Y
Top 2 Box (Net)
- - - - - - - - - - - - 127 58 69 32 49 30 16 32 10 81 57 46 24- - - - - - - - - - - - 19% 18% 20% 17% 28% 18% 12% 16% 9% 25% 24% 21% 11%
prS TU Y Y
7 - Very good
- - - - - - - - - - - - 132 63 69 36 31 36 28 37 25 67 51 44 37- - - - - - - - - - - - 20% 20% 20% 19% 18% 21% 21% 18% 23% 21% 22% 20% 17%
6
- - - - - - - - - - - - 190 86 104 52 44 43 51 65 33 83 66 65 59- - - - - - - - - - - - 28% 27% 29% 27% 25% 25% 37% 32% 30% 26% 28% 30% 27%
qr
5
- - - - - - - - - - - - 120 66 54 31 30 32 27 35 21 58 45 28 48- - - - - - - - - - - - 18% 21% 15% 16% 17% 19% 20% 17% 20% 18% 19% 13% 22%
X
4
- - - - - - - - - - - - 37 23 14 12 9 13 2 10 9 18 12 15 10- - - - - - - - - - - - 5% 7% 4% 6% 5% 8% 2% 5% 8% 6% 5% 7% 5%
S
3
- - - - - - - - - - - - 21 13 8 11 5 3 2 7 3 11 3 4 13- - - - - - - - - - - - 3% 4% 2% 6% 3% 2% 1% 3% 3% 3% 1% 2% 6%
Wx
Bottom 2 Box (Net)
- - - - - - - - - - - - 6 4 2 4 2 - 1 3 1 3 2 3 1- - - - - - - - - - - - 1% 1% 1% 2% 1% - 1% 1% 1% 1% 1% 1% 1%
2
- - - - - - - - - - - - 14 9 5 8 3 3 1 4 2 8 1 1 12- - - - - - - - - - - - 2% 3% 2% 4% 2% 2% 1% 2% 2% 2% * 1% 6%
WX
1 - Very bad
- - - - - - - - - - - - 45 10 35 15 7 12 11 21 8 6 5 17 24- - - - - - - - - - - - 7% 3% 10% 8% 4% 7% 8% 10% 7% 2% 2% 8% 11%
N V V W W
Not sure
- - - - - - - - - - - - 672 319 353 190 175 169 138 208 108 324 238 219 215- - - - - - - - - - - - 100% 100% 100% 100% 100% 100% 100% 100% 100% 100% 100% 100% 100%
Sigma
__________________________________________________________________________________________________________________Proportions/Means: Columns Tested (5%, 10% risk level) - A/B/C/D/E/F/G/H/I/J/K/L/M - N/O - P/Q/R/S - T/U/V - W/X/YOverlap formulae used. * small base; ** very small base (under 30) ineligible for sig testing

Page 195Fielding Period: March 14 - May 31, 2020COVID-19Weighted To The U.S. General Adult Population - Propensity
2 Jun 2020Table 192Q1314_19 For this question, we’d like you to think about industries in general. How would you rate the overall reputation of the
following industries, where ’’1’’ means the industry has a ’’Very Bad’’ reputation and ’’7’’ means the industry has a ’’Very Good’’ reputation?
E-commerce
Base: All Respondents
Waves Gender Age Income Political
Wave 2 Wave 3 Wave 4 Wave 5 Wave 6 Wave 7 Wave 8 Wave 9 Wave 10 Wave 11 Wave 12 Wave 13 Wave 14 Less(3/14 - (3/17 - (3/21 - (3/28 - (4/3 - (4/11- (4/18- (4/25- (5/1 - (5/8 - (5/15 - (5/27 - (5/29 - than $50k -3/15) 3/18) 3/23) 3/30) 4/5) 4/13) 4/20) 4/27) 5/3) 5/10) 5/17) 5/28) 5/31) MALE FEMALE 18-34 35-49 50-64 65+ $50k $75k $75k+ GOP DEM IND/OTH
(A) (B) (C) (D) (E) (F) (G) (H) (I) (J) (K) (L) (M) (N) (O) (P) (Q) (R) (S) (T) (U) (V) (W) (X) (Y)
- - - - - - - - - - - - 689 379 310 181 167 178 163 259 135 260 236 245 208Unweighted Base-** -** -** -** -** -** -** -** -** -** -** -** 669 325 343 214 160* 155 140 214 108* 312 221 239 208Weighted Base
- - - - - - - - - - - - 228 142 86 60 75 49 44 49 38 134 79 90 59- - - - - - - - - - - - 34% 44% 25% 28% 47% 32% 32% 23% 35% 43% 36% 38% 28%
O PRS T T
Top 2 Box (Net)
- - - - - - - - - - - - 97 53 44 26 32 20 19 25 19 52 42 34 21- - - - - - - - - - - - 15% 16% 13% 12% 20% 13% 13% 11% 17% 17% 19% 14% 10%
Y
7 - Very good
- - - - - - - - - - - - 131 89 42 34 43 29 26 24 20 82 37 56 38- - - - - - - - - - - - 20% 27% 12% 16% 27% 19% 18% 11% 18% 26% 17% 23% 18%
O p T
6
- - - - - - - - - - - - 140 69 71 42 36 31 30 43 19 72 43 47 50- - - - - - - - - - - - 21% 21% 21% 20% 23% 20% 22% 20% 17% 23% 19% 20% 24%
5
- - - - - - - - - - - - 119 59 60 48 21 31 18 43 23 51 45 37 36- - - - - - - - - - - - 18% 18% 17% 23% 13% 20% 13% 20% 21% 16% 20% 16% 17%
qs
4
- - - - - - - - - - - - 43 24 18 15 5 10 12 16 6 15 13 16 14- - - - - - - - - - - - 6% 7% 5% 7% 3% 7% 9% 7% 5% 5% 6% 7% 7%
q
3
- - - - - - - - - - - - 48 16 32 14 12 13 10 16 7 23 16 24 9- - - - - - - - - - - - 7% 5% 9% 7% 8% 8% 7% 8% 6% 7% 7% 10% 4%
n y
Bottom 2 Box (Net)
- - - - - - - - - - - - 29 9 20 11 5 6 6 10 2 15 13 12 4- - - - - - - - - - - - 4% 3% 6% 5% 3% 4% 5% 5% 2% 5% 6% 5% 2%
n
2
- - - - - - - - - - - - 19 8 12 3 7 6 3 6 5 9 3 12 4- - - - - - - - - - - - 3% 2% 3% 1% 5% 4% 2% 3% 5% 3% 1% 5% 2%
w
1 - Very bad
- - - - - - - - - - - - 92 16 76 35 11 20 25 47 16 16 26 25 40- - - - - - - - - - - - 14% 5% 22% 16% 7% 13% 18% 22% 14% 5% 12% 11% 19%
N Q Q V V X
Not sure
- - - - - - - - - - - - 669 325 343 214 160 155 140 214 108 312 221 239 208- - - - - - - - - - - - 100% 100% 100% 100% 100% 100% 100% 100% 100% 100% 100% 100% 100%
Sigma
__________________________________________________________________________________________________________________Proportions/Means: Columns Tested (5%, 10% risk level) - A/B/C/D/E/F/G/H/I/J/K/L/M - N/O - P/Q/R/S - T/U/V - W/X/YOverlap formulae used. * small base; ** very small base (under 30) ineligible for sig testing

Page 196Fielding Period: March 14 - May 31, 2020COVID-19Weighted To The U.S. General Adult Population - Propensity
2 Jun 2020Table 193Q1314_20 For this question, we’d like you to think about industries in general. How would you rate the overall reputation of the
following industries, where ’’1’’ means the industry has a ’’Very Bad’’ reputation and ’’7’’ means the industry has a ’’Very Good’’ reputation?
Aerospace
Base: All Respondents
Waves Gender Age Income Political
Wave 2 Wave 3 Wave 4 Wave 5 Wave 6 Wave 7 Wave 8 Wave 9 Wave 10 Wave 11 Wave 12 Wave 13 Wave 14 Less(3/14 - (3/17 - (3/21 - (3/28 - (4/3 - (4/11- (4/18- (4/25- (5/1 - (5/8 - (5/15 - (5/27 - (5/29 - than $50k -3/15) 3/18) 3/23) 3/30) 4/5) 4/13) 4/20) 4/27) 5/3) 5/10) 5/17) 5/28) 5/31) MALE FEMALE 18-34 35-49 50-64 65+ $50k $75k $75k+ GOP DEM IND/OTH
(A) (B) (C) (D) (E) (F) (G) (H) (I) (J) (K) (L) (M) (N) (O) (P) (Q) (R) (S) (T) (U) (V) (W) (X) (Y)
- - - - - - - - - - - - 694 353 341 171 164 180 179 263 150 249 245 240 209Unweighted Base-** -** -** -** -** -** -** -** -** -** -** -** 684 306 378 191* 177 175 141 208 126* 316 241 234 209Weighted Base
- - - - - - - - - - - - 275 139 136 60 81 66 68 68 57 144 120 93 62- - - - - - - - - - - - 40% 45% 36% 31% 46% 38% 48% 33% 45% 46% 50% 40% 29%
o P P T T xY y
Top 2 Box (Net)
- - - - - - - - - - - - 131 68 63 26 48 26 31 29 24 76 63 41 27- - - - - - - - - - - - 19% 22% 17% 14% 27% 15% 22% 14% 19% 24% 26% 18% 13%
PR T xY
7 - Very good
- - - - - - - - - - - - 144 71 73 34 33 40 36 39 33 68 57 52 34- - - - - - - - - - - - 21% 23% 19% 18% 19% 23% 26% 19% 26% 22% 24% 22% 16%
6
- - - - - - - - - - - - 115 54 61 28 31 30 26 32 22 58 45 50 19- - - - - - - - - - - - 17% 18% 16% 15% 17% 17% 18% 15% 17% 18% 19% 21% 9%
Y Y
5
- - - - - - - - - - - - 108 45 63 40 20 28 20 36 16 45 45 23 39- - - - - - - - - - - - 16% 15% 17% 21% 11% 16% 14% 18% 13% 14% 19% 10% 19%
q X X
4
- - - - - - - - - - - - 35 18 17 21 6 8 1 10 5 18 4 14 17- - - - - - - - - - - - 5% 6% 4% 11% 3% 5% * 5% 4% 6% 2% 6% 8%
QrS s W W
3
- - - - - - - - - - - - 33 19 14 13 7 7 6 14 4 15 8 10 14- - - - - - - - - - - - 5% 6% 4% 7% 4% 4% 4% 7% 3% 5% 3% 4% 7%
Bottom 2 Box (Net)
- - - - - - - - - - - - 17 9 8 8 2 3 4 5 2 10 5 3 9- - - - - - - - - - - - 2% 3% 2% 4% 1% 2% 3% 3% 1% 3% 2% 1% 4%
2
- - - - - - - - - - - - 16 11 5 5 5 5 2 9 2 5 3 7 6- - - - - - - - - - - - 2% 3% 1% 3% 3% 3% 1% 4% 2% 1% 1% 3% 3%
1 - Very bad
- - - - - - - - - - - - 119 31 88 29 33 36 21 47 22 36 19 43 58- - - - - - - - - - - - 17% 10% 23% 15% 18% 21% 15% 23% 17% 11% 8% 18% 28%
N V W Wx
Not sure
- - - - - - - - - - - - 684 306 378 191 177 175 141 208 126 316 241 234 209- - - - - - - - - - - - 100% 100% 100% 100% 100% 100% 100% 100% 100% 100% 100% 100% 100%
Sigma
__________________________________________________________________________________________________________________Proportions/Means: Columns Tested (5%, 10% risk level) - A/B/C/D/E/F/G/H/I/J/K/L/M - N/O - P/Q/R/S - T/U/V - W/X/YOverlap formulae used. * small base; ** very small base (under 30) ineligible for sig testing

Page 197Fielding Period: March 14 - May 31, 2020COVID-19Weighted To The U.S. General Adult Population - Propensity
2 Jun 2020Table 194Q38 How has your view of each of the following industries changed since the start of the coronavirus pandemic?
Summary Of More Positive
Base: All Respondents
Waves Gender Age Income Political
Wave 2 Wave 3 Wave 4 Wave 5 Wave 6 Wave 7 Wave 8 Wave 9 Wave 10 Wave 11 Wave 12 Wave 13 Wave 14 Less(3/14 - (3/17 - (3/21 - (3/28 - (4/3 - (4/11- (4/18- (4/25- (5/1 - (5/8 - (5/15 - (5/27 - (5/29 - than $50k -3/15) 3/18) 3/23) 3/30) 4/5) 4/13) 4/20) 4/27) 5/3) 5/10) 5/17) 5/28) 5/31) MALE FEMALE 18-34 35-49 50-64 65+ $50k $75k $75k+ GOP DEM IND/OTH
(A) (B) (C) (D) (E) (F) (G) (H) (I) (J) (K) (L) (M) (N) (O) (P) (Q) (R) (S) (T) (U) (V) (W) (X) (Y)
- - 2023 2016 - 2013 2029 2050 2039 2030 1961 1996 1965 1066 899 504 475 502 484 749 397 729 698 683 584Unweighted Base-** -** 2023 2016 -** 2013 2029 2050 2039 2066 1961 1996 1965 952 1013 573 497 474 421 609 329 935 665 709 591Weighted Base
- - 1095 1253 - 1302 1230 1217 1257 1199 1135 1169 1179 567 612 327 291 273 289 318 211 601 403 472 305- - 54% 62% - 65% 61% 59% 62% 58% 58% 59% 60% 60% 60% 57% 59% 58% 69% 52% 64% 64% 61% 67% 52%
CJKl CGHJKLM C C Cjk C c C C PQR T T Y wY
Healthcare(Doctors/Nurses/Hospital)
- - 828 966 - 1073 1042 993 1004 937 892 953 1008 467 541 288 262 239 219 271 178 519 339 399 270- - 41% 48% - 53% 51% 48% 49% 45% 45% 48% 51% 49% 53% 50% 53% 51% 52% 44% 54% 56% 51% 56% 46%
C CDHIJKL CdJKl C CJk C C C CdJKl T T Y
Retail - grocery
- - 752 826 - 904 883 921 858 863 767 849 839 427 412 294 194 182 170 208 151 452 300 318 221- - 37% 41% - 45% 44% 45% 42% 42% 39% 43% 43% 45% 41% 51% 39% 38% 40% 34% 46% 48% 45% 45% 37%
c CdK CK CDK C C Ck Ck QRS T T Y Y
Small Businesses
- - 632 753 - 862 817 768 751 771 670 713 776 390 387 258 219 166 132 194 129 420 262 324 190- - 31% 37% - 43% 40% 37% 37% 37% 34% 36% 40% 41% 38% 45% 44% 35% 31% 32% 39% 45% 39% 46% 32%
C CDHIJKLm CiKL Ck C C C CKl RS RS T T Y wY
Food & Beverage
- - 671 779 - 797 744 703 790 761 731 669 756 383 373 239 213 145 160 182 130 414 296 290 170- - 33% 39% - 40% 37% 34% 39% 37% 37% 34% 38% 40% 37% 42% 43% 31% 38% 30% 40% 44% 45% 41% 29%
CHL CHL cl CHL cl Cl CHL R R r T T Y Y
Pharmaceutical/drugs
- - 612 757 - 819 766 758 780 724 699 702 755 376 379 243 190 172 149 184 131 410 280 300 174- - 30% 38% - 41% 38% 37% 38% 35% 36% 35% 38% 39% 37% 42% 38% 36% 35% 30% 40% 44% 42% 42% 29%
C ChJKL C C Cj C C C Cjl s T T Y Y
Restaurants
- - 618 739 - 819 767 775 805 765 700 740 751 392 360 255 213 159 125 195 115 405 257 305 189- - 31% 37% - 41% 38% 38% 39% 37% 36% 37% 38% 41% 35% 44% 43% 33% 30% 32% 35% 43% 39% 43% 32%
C CDjKl C C Ck C C C C O RS RS TU y Y
Technology
- - 597 674 - 764 711 713 727 729 593 676 722 379 342 246 185 145 145 182 145 366 239 293 190- - 29% 33% - 38% 35% 35% 36% 35% 30% 34% 37% 40% 34% 43% 37% 31% 35% 30% 44% 39% 36% 41% 32%
Ck CDhKL CK CK CK CK Ck CdK O RS r T T Y
Non-profits
- - - - - - - 679 688 674 652 605 667 361 306 234 208 134 91 165 115 364 217 283 167- - - - - - - 33% 34% 33% 33% 30% 34% 38% 30% 41% 42% 28% 22% 27% 35% 39% 33% 40% 28%
l l O RS RS s T T WY
Telecommunications
- - 545 645 - 739 637 626 671 684 575 608 657 360 297 221 188 124 124 161 109 366 268 235 154- - 27% 32% - 37% 31% 31% 33% 33% 29% 30% 33% 38% 29% 39% 38% 26% 29% 26% 33% 39% 40% 33% 26%
C CDGHIjKLm C C Ck CK C CK O RS RS t T XY Y
Manufacturing
- - - - - - - - - - 565 550 624 315 309 215 183 112 113 154 99 354 239 243 142- - - - - - - - - - 29% 28% 32% 33% 30% 38% 37% 24% 27% 25% 30% 38% 36% 34% 24%
L RS RS TU Y Y
Insurance
- - - - - - - - - - 598 517 618 313 305 209 206 111 92 168 106 319 237 253 128- - - - - - - - - - 30% 26% 31% 33% 30% 36% 41% 23% 22% 28% 32% 34% 36% 36% 22%
L L RS RS T Y Y
Energy and Utilities
- - 551 595 - 666 628 603 578 619 511 577 600 319 281 217 186 102 95 159 102 323 231 233 136- - 27% 30% - 33% 31% 29% 28% 30% 26% 29% 31% 34% 28% 38% 37% 21% 22% 26% 31% 35% 35% 33% 23%
k CdHIjKL CK k K cK O RS RS T Y Y
Retail
- - 410 479 - 569 511 495 485 534 483 469 574 324 251 228 177 86 83 141 100 320 237 217 121- - 20% 24% - 28% 25% 24% 24% 26% 25% 24% 29% 34% 25% 40% 36% 18% 20% 23% 30% 34% 36% 31% 20%
C CDgHIKL C C C C C C CDGHIjKL O RS RS T T Y Y
Financial services
__________________________________________________________________________________________________________________Proportions/Means: Columns Tested (5%, 10% risk level) - A/B/C/D/E/F/G/H/I/J/K/L/M - N/O - P/Q/R/S - T/U/V - W/X/YOverlap formulae used. ** very small base (under 30) ineligible for sig testing

Page 198Fielding Period: March 14 - May 31, 2020COVID-19Weighted To The U.S. General Adult Population - Propensity
2 Jun 2020Table 194Q38 How has your view of each of the following industries changed since the start of the coronavirus pandemic?
Summary Of More Positive
Base: All Respondents
Waves Gender Age Income Political
Wave 2 Wave 3 Wave 4 Wave 5 Wave 6 Wave 7 Wave 8 Wave 9 Wave 10 Wave 11 Wave 12 Wave 13 Wave 14 Less(3/14 - (3/17 - (3/21 - (3/28 - (4/3 - (4/11- (4/18- (4/25- (5/1 - (5/8 - (5/15 - (5/27 - (5/29 - than $50k -3/15) 3/18) 3/23) 3/30) 4/5) 4/13) 4/20) 4/27) 5/3) 5/10) 5/17) 5/28) 5/31) MALE FEMALE 18-34 35-49 50-64 65+ $50k $75k $75k+ GOP DEM IND/OTH
(A) (B) (C) (D) (E) (F) (G) (H) (I) (J) (K) (L) (M) (N) (O) (P) (Q) (R) (S) (T) (U) (V) (W) (X) (Y)
-** -** 2023 2016 -** 2013 2029 2050 2039 2066 1961 1996 1965 952 1013 573 497 474 421 609 329 935 665 709 591Weighted Base- - 450 524 - 581 532 544 572 532 514 438 559 326 233 219 180 97 63 142 85 312 172 260 127- - 22% 26% - 29% 26% 27% 28% 26% 26% 22% 28% 34% 23% 38% 36% 20% 15% 23% 26% 33% 26% 37% 21%
CL CjL CL CL CL CL CL CL O RS RS s TU WY
Media
- - 407 502 - 638 592 555 581 588 506 541 554 313 241 226 186 78 64 132 80 330 191 248 114- - 20% 25% - 32% 29% 27% 28% 28% 26% 27% 28% 33% 24% 39% 37% 16% 15% 22% 24% 35% 29% 35% 19%
C CDHijKLm CDk C CD CD C C Cd O RS RS TU Y wY
Entertainment
- - 388 458 - 534 459 495 443 523 500 453 545 295 250 205 162 94 84 140 84 312 214 230 102- - 19% 23% - 27% 23% 24% 22% 25% 25% 23% 28% 31% 25% 36% 33% 20% 20% 23% 25% 33% 32% 32% 17%
C CDGIL C C CI CgI C CDGHIL O RS RS TU Y Y
Automotive
- - - - - - - - 459 546 477 457 531 277 253 214 156 96 65 138 89 288 194 233 104- - - - - - - - 23% 26% 24% 23% 27% 29% 25% 37% 31% 20% 15% 23% 27% 31% 29% 33% 18%
IL IL RS RS T Y Y
Retail - apparel
- - 424 422 - 475 429 442 454 511 453 384 499 293 206 203 161 75 61 123 79 281 197 184 118- - 21% 21% - 24% 21% 22% 22% 25% 23% 19% 25% 31% 20% 35% 32% 16% 14% 20% 24% 30% 30% 26% 20%
L l CDGhL L CDGHiL O RS RS Tu Y y
Oil
- - 385 421 - 492 430 414 453 497 416 434 453 251 202 189 137 73 55 111 72 262 168 191 93- - 19% 21% - 24% 21% 20% 22% 24% 21% 22% 23% 26% 20% 33% 27% 15% 13% 18% 22% 28% 25% 27% 16%
CDgHk C CdgHk c Ch O RS RS Tu Y Y
Travel and hospitality(hotels, cruise lines)
- - 361 362 - 405 371 358 382 462 377 315 450 260 190 180 146 75 49 96 77 264 173 197 80- - 18% 18% - 20% 18% 17% 19% 22% 19% 16% 23% 27% 19% 31% 29% 16% 12% 16% 23% 28% 26% 28% 14%
hL l L CDGHIkL L CDfGHIKL O RS RS T T Y Y
Airlines
- - 268 318 - 335 379 354 337 459 397 350 436 261 175 187 146 70 33 86 66 271 174 175 87- - 13% 16% - 17% 19% 17% 17% 22% 20% 18% 22% 27% 17% 33% 29% 15% 8% 14% 20% 29% 26% 25% 15%
c C Cd C C CDFGHIL CDFhIl C CDFGHIL O RS RS S T TU Y Y
Real estate
__________________________________________________________________________________________________________________Proportions/Means: Columns Tested (5%, 10% risk level) - A/B/C/D/E/F/G/H/I/J/K/L/M - N/O - P/Q/R/S - T/U/V - W/X/YOverlap formulae used. ** very small base (under 30) ineligible for sig testing
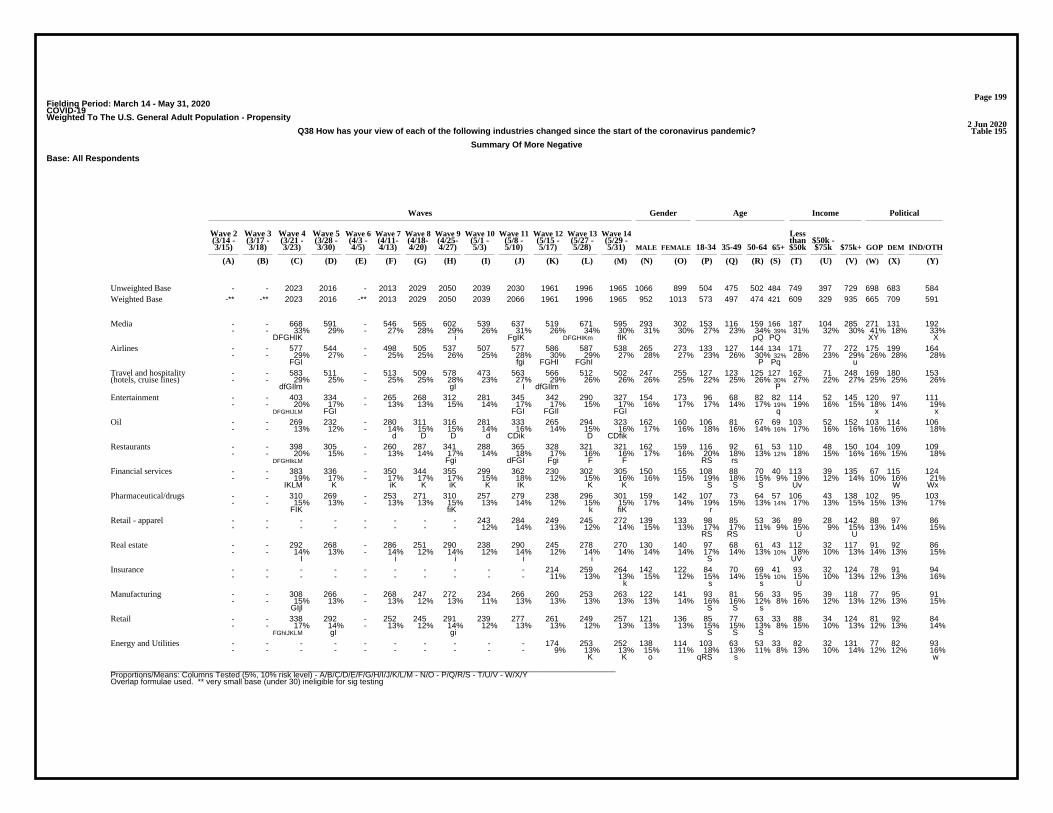
Page 199Fielding Period: March 14 - May 31, 2020COVID-19Weighted To The U.S. General Adult Population - Propensity
2 Jun 2020Table 195Q38 How has your view of each of the following industries changed since the start of the coronavirus pandemic?
Summary Of More Negative
Base: All Respondents
Waves Gender Age Income Political
Wave 2 Wave 3 Wave 4 Wave 5 Wave 6 Wave 7 Wave 8 Wave 9 Wave 10 Wave 11 Wave 12 Wave 13 Wave 14 Less(3/14 - (3/17 - (3/21 - (3/28 - (4/3 - (4/11- (4/18- (4/25- (5/1 - (5/8 - (5/15 - (5/27 - (5/29 - than $50k -3/15) 3/18) 3/23) 3/30) 4/5) 4/13) 4/20) 4/27) 5/3) 5/10) 5/17) 5/28) 5/31) MALE FEMALE 18-34 35-49 50-64 65+ $50k $75k $75k+ GOP DEM IND/OTH
(A) (B) (C) (D) (E) (F) (G) (H) (I) (J) (K) (L) (M) (N) (O) (P) (Q) (R) (S) (T) (U) (V) (W) (X) (Y)
- - 2023 2016 - 2013 2029 2050 2039 2030 1961 1996 1965 1066 899 504 475 502 484 749 397 729 698 683 584Unweighted Base-** -** 2023 2016 -** 2013 2029 2050 2039 2066 1961 1996 1965 952 1013 573 497 474 421 609 329 935 665 709 591Weighted Base
- - 668 591 - 546 565 602 539 637 519 671 595 293 302 153 116 159 166 187 104 285 271 131 192- - 33% 29% - 27% 28% 29% 26% 31% 26% 34% 30% 31% 30% 27% 23% 34% 39% 31% 32% 30% 41% 18% 33%
DFGHIK i FgIK DFGHIKm fIK pQ PQ XY X
Media
- - 577 544 - 498 505 537 507 577 586 587 538 265 273 133 127 144 134 171 77 272 175 199 164- - 29% 27% - 25% 25% 26% 25% 28% 30% 29% 27% 28% 27% 23% 26% 30% 32% 28% 23% 29% 26% 28% 28%
FGI fgi FGHI FGhI P Pq u
Airlines
- - 583 511 - 513 509 578 473 563 566 512 502 247 255 127 123 125 127 162 71 248 169 180 153- - 29% 25% - 25% 25% 28% 23% 27% 29% 26% 26% 26% 25% 22% 25% 26% 30% 27% 22% 27% 25% 25% 26%
dfGIlm gI I dfGIlm P
Travel and hospitality(hotels, cruise lines)
- - 403 334 - 265 268 312 281 345 342 290 327 154 173 96 68 82 82 114 52 145 120 97 111- - 20% 17% - 13% 13% 15% 14% 17% 17% 15% 17% 16% 17% 17% 14% 17% 19% 19% 16% 15% 18% 14% 19%
DFGHIJLM FGI FGI FGIl FGI q x x
Entertainment
- - 269 232 - 280 311 316 281 333 265 294 323 162 160 106 81 67 69 103 52 152 103 114 106- - 13% 12% - 14% 15% 15% 14% 16% 14% 15% 16% 17% 16% 18% 16% 14% 16% 17% 16% 16% 16% 16% 18%
d D D d CDik D CDfik
Oil
- - 398 305 - 260 287 341 288 365 328 321 321 162 159 116 92 61 53 110 48 150 104 109 109- - 20% 15% - 13% 14% 17% 14% 18% 17% 16% 16% 17% 16% 20% 18% 13% 12% 18% 15% 16% 16% 15% 18%
DFGHIkLM Fgi dFGI Fgi F F RS rs
Restaurants
- - 383 336 - 350 344 355 299 362 230 302 305 150 155 108 88 70 40 113 39 135 67 115 124- - 19% 17% - 17% 17% 17% 15% 18% 12% 15% 16% 16% 15% 19% 18% 15% 9% 19% 12% 14% 10% 16% 21%
IKLM K iK K iK K IK K K S S S Uv W Wx
Financial services
- - 310 269 - 253 271 310 257 279 238 296 301 159 142 107 73 64 57 106 43 138 102 95 103- - 15% 13% - 13% 13% 15% 13% 14% 12% 15% 15% 17% 14% 19% 15% 13% 14% 17% 13% 15% 15% 13% 17%
FIK fiK k fiK r
Pharmaceutical/drugs
- - - - - - - - 243 284 249 245 272 139 133 98 85 53 36 89 28 142 88 97 86- - - - - - - - 12% 14% 13% 12% 14% 15% 13% 17% 17% 11% 9% 15% 9% 15% 13% 14% 15%
RS RS U U
Retail - apparel
- - 292 268 - 286 251 290 238 290 245 278 270 130 140 97 68 61 43 112 32 117 91 92 86- - 14% 13% - 14% 12% 14% 12% 14% 12% 14% 14% 14% 14% 17% 14% 13% 10% 18% 10% 13% 14% 13% 15%
I i i i i S UV
Real estate
- - - - - - - - - - 214 259 264 142 122 84 70 69 41 93 32 124 78 91 94- - - - - - - - - - 11% 13% 13% 15% 12% 15% 14% 15% 10% 15% 10% 13% 12% 13% 16%
k s s U
Insurance
- - 308 266 - 268 247 272 234 266 260 253 263 122 141 93 81 56 33 95 39 118 77 95 91- - 15% 13% - 13% 12% 13% 11% 13% 13% 13% 13% 13% 14% 16% 16% 12% 8% 16% 12% 13% 12% 13% 15%
GIjl S S s
Manufacturing
- - 338 292 - 252 245 291 239 277 261 249 257 121 136 85 77 63 33 88 34 124 81 92 84- - 17% 14% - 13% 12% 14% 12% 13% 13% 12% 13% 13% 13% 15% 15% 13% 8% 15% 10% 13% 12% 13% 14%
FGhIJKLM gI gi S S S
Retail
- - - - - - - - - - 174 253 252 138 114 103 63 53 33 82 32 131 77 82 93- - - - - - - - - - 9% 13% 13% 15% 11% 18% 13% 11% 8% 13% 10% 14% 12% 12% 16%
K K o qRS s w
Energy and Utilities
__________________________________________________________________________________________________________________Proportions/Means: Columns Tested (5%, 10% risk level) - A/B/C/D/E/F/G/H/I/J/K/L/M - N/O - P/Q/R/S - T/U/V - W/X/YOverlap formulae used. ** very small base (under 30) ineligible for sig testing
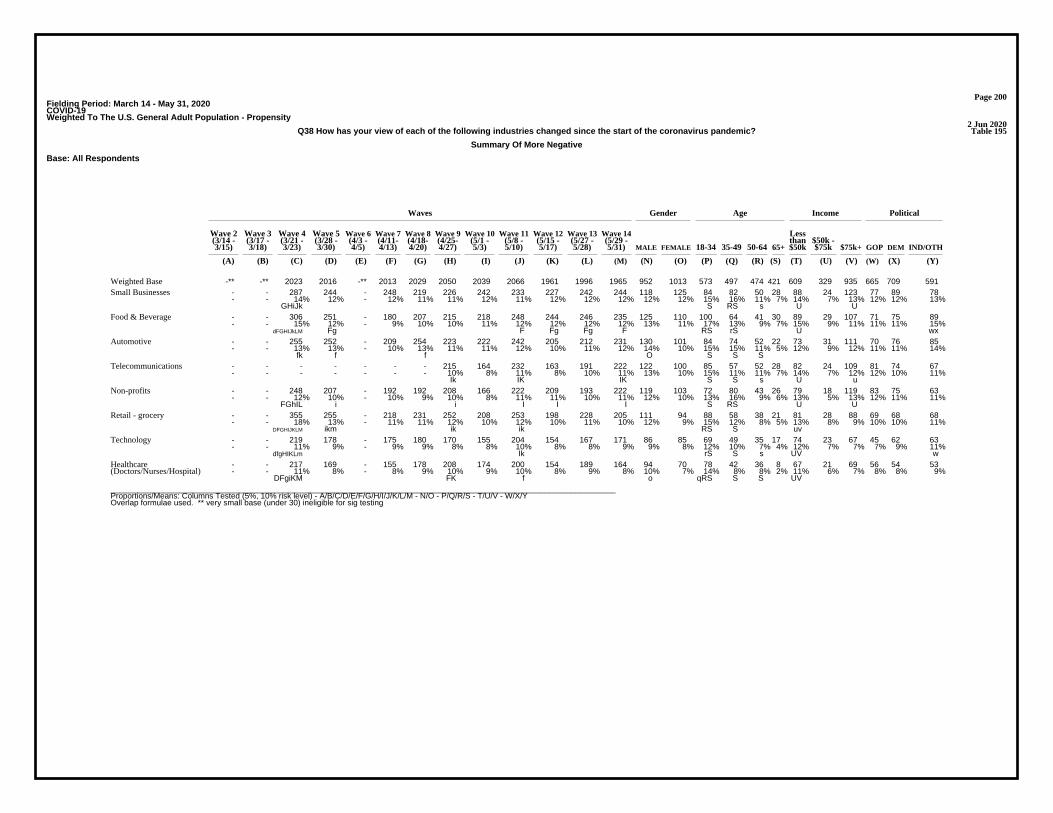
Page 200Fielding Period: March 14 - May 31, 2020COVID-19Weighted To The U.S. General Adult Population - Propensity
2 Jun 2020Table 195Q38 How has your view of each of the following industries changed since the start of the coronavirus pandemic?
Summary Of More Negative
Base: All Respondents
Waves Gender Age Income Political
Wave 2 Wave 3 Wave 4 Wave 5 Wave 6 Wave 7 Wave 8 Wave 9 Wave 10 Wave 11 Wave 12 Wave 13 Wave 14 Less(3/14 - (3/17 - (3/21 - (3/28 - (4/3 - (4/11- (4/18- (4/25- (5/1 - (5/8 - (5/15 - (5/27 - (5/29 - than $50k -3/15) 3/18) 3/23) 3/30) 4/5) 4/13) 4/20) 4/27) 5/3) 5/10) 5/17) 5/28) 5/31) MALE FEMALE 18-34 35-49 50-64 65+ $50k $75k $75k+ GOP DEM IND/OTH
(A) (B) (C) (D) (E) (F) (G) (H) (I) (J) (K) (L) (M) (N) (O) (P) (Q) (R) (S) (T) (U) (V) (W) (X) (Y)
-** -** 2023 2016 -** 2013 2029 2050 2039 2066 1961 1996 1965 952 1013 573 497 474 421 609 329 935 665 709 591Weighted Base- - 287 244 - 248 219 226 242 233 227 242 244 118 125 84 82 50 28 88 24 123 77 89 78- - 14% 12% - 12% 11% 11% 12% 11% 12% 12% 12% 12% 12% 15% 16% 11% 7% 14% 7% 13% 12% 12% 13%
GHiJk S RS s U U
Small Businesses
- - 306 251 - 180 207 215 218 248 244 246 235 125 110 100 64 41 30 89 29 107 71 75 89- - 15% 12% - 9% 10% 10% 11% 12% 12% 12% 12% 13% 11% 17% 13% 9% 7% 15% 9% 11% 11% 11% 15%
dFGHIJkLM Fg F Fg Fg F RS rS U wx
Food & Beverage
- - 255 252 - 209 254 223 222 242 205 212 231 130 101 84 74 52 22 73 31 111 70 76 85- - 13% 13% - 10% 13% 11% 11% 12% 10% 11% 12% 14% 10% 15% 15% 11% 5% 12% 9% 12% 11% 11% 14%
fk f f O S S S
Automotive
- - - - - - - 215 164 232 163 191 222 122 100 85 57 52 28 82 24 109 81 74 67- - - - - - - 10% 8% 11% 8% 10% 11% 13% 10% 15% 11% 11% 7% 14% 7% 12% 12% 10% 11%
Ik IK IK S S s U u
Telecommunications
- - 248 207 - 192 192 208 166 222 209 193 222 119 103 72 80 43 26 79 18 119 83 75 63- - 12% 10% - 10% 9% 10% 8% 11% 11% 10% 11% 12% 10% 13% 16% 9% 6% 13% 5% 13% 12% 11% 11%
FGhIL i i I I I S RS U U
Non-profits
- - 355 255 - 218 231 252 208 253 198 228 205 111 94 88 58 38 21 81 28 88 69 68 68- - 18% 13% - 11% 11% 12% 10% 12% 10% 11% 10% 12% 9% 15% 12% 8% 5% 13% 8% 9% 10% 10% 11%
DFGHIJKLM ikm ik ik RS S uv
Retail - grocery
- - 219 178 - 175 180 170 155 204 154 167 171 86 85 69 49 35 17 74 23 67 45 62 63- - 11% 9% - 9% 9% 8% 8% 10% 8% 8% 9% 9% 8% 12% 10% 7% 4% 12% 7% 7% 7% 9% 11%
dfgHIKLm Ik rS S s UV w
Technology
- - 217 169 - 155 178 208 174 200 154 189 164 94 70 78 42 36 8 67 21 69 56 54 53- - 11% 8% - 8% 9% 10% 9% 10% 8% 9% 8% 10% 7% 14% 8% 8% 2% 11% 6% 7% 8% 8% 9%
DFgiKM FK f o qRS S S UV
Healthcare(Doctors/Nurses/Hospital)
__________________________________________________________________________________________________________________Proportions/Means: Columns Tested (5%, 10% risk level) - A/B/C/D/E/F/G/H/I/J/K/L/M - N/O - P/Q/R/S - T/U/V - W/X/YOverlap formulae used. ** very small base (under 30) ineligible for sig testing

Page 201Fielding Period: March 14 - May 31, 2020COVID-19Weighted To The U.S. General Adult Population - Propensity
2 Jun 2020Table 196Q38_1 How has your view of each of the following industries changed since the start of the coronavirus pandemic?
Financial services
Base: All Respondents
Waves Gender Age Income Political
Wave 2 Wave 3 Wave 4 Wave 5 Wave 6 Wave 7 Wave 8 Wave 9 Wave 10 Wave 11 Wave 12 Wave 13 Wave 14 Less(3/14 - (3/17 - (3/21 - (3/28 - (4/3 - (4/11- (4/18- (4/25- (5/1 - (5/8 - (5/15 - (5/27 - (5/29 - than $50k -3/15) 3/18) 3/23) 3/30) 4/5) 4/13) 4/20) 4/27) 5/3) 5/10) 5/17) 5/28) 5/31) MALE FEMALE 18-34 35-49 50-64 65+ $50k $75k $75k+ GOP DEM IND/OTH
(A) (B) (C) (D) (E) (F) (G) (H) (I) (J) (K) (L) (M) (N) (O) (P) (Q) (R) (S) (T) (U) (V) (W) (X) (Y)
- - 2023 2016 - 2013 2029 2050 2039 2030 1961 1996 1965 1066 899 504 475 502 484 749 397 729 698 683 584Unweighted Base-** -** 2023 2016 -** 2013 2029 2050 2039 2066 1961 1996 1965 952 1013 573 497 474 421 609 329 935 665 709 591Weighted Base
- - 794 815 - 919 855 850 784 896 713 771 880 474 406 336 264 156 123 254 140 455 304 331 245- - 39% 40% - 46% 42% 41% 38% 43% 36% 39% 45% 50% 40% 59% 53% 33% 29% 42% 42% 49% 46% 47% 41%
K CDgHIKL iKl K CIKL CDhIKL O RS RS T
More Positive/Negative(Net)
- - 410 479 - 569 511 495 485 534 483 469 574 324 251 228 177 86 83 141 100 320 237 217 121- - 20% 24% - 28% 25% 24% 24% 26% 25% 24% 29% 34% 25% 40% 36% 18% 20% 23% 30% 34% 36% 31% 20%
C CDgHIKL C C C C C C CDGHIjKL O RS RS T T Y Y
More positive
- - 383 336 - 350 344 355 299 362 230 302 305 150 155 108 88 70 40 113 39 135 67 115 124- - 19% 17% - 17% 17% 17% 15% 18% 12% 15% 16% 16% 15% 19% 18% 15% 9% 19% 12% 14% 10% 16% 21%
IKLM K iK K iK K IK K K S S S Uv W Wx
More negative
- - 1229 1201 - 1094 1174 1200 1255 1170 1248 1225 1085 478 607 237 233 317 298 355 189 480 361 378 347- - 61% 60% - 54% 58% 59% 62% 57% 64% 61% 55% 50% 60% 41% 47% 67% 71% 58% 58% 51% 54% 53% 59%
FJM FM f Fm FgJM DFGHJM FgJM N PQ PQ V
Unchanged
- - 2023 2016 - 2013 2029 2050 2039 2066 1961 1996 1965 952 1013 573 497 474 421 609 329 935 665 709 591- - 100% 100% - 100% 100% 100% 100% 100% 100% 100% 100% 100% 100% 100% 100% 100% 100% 100% 100% 100% 100% 100% 100%
Sigma
__________________________________________________________________________________________________________________Proportions/Means: Columns Tested (5%, 10% risk level) - A/B/C/D/E/F/G/H/I/J/K/L/M - N/O - P/Q/R/S - T/U/V - W/X/YOverlap formulae used. ** very small base (under 30) ineligible for sig testing

Page 202Fielding Period: March 14 - May 31, 2020COVID-19Weighted To The U.S. General Adult Population - Propensity
2 Jun 2020Table 197Q38_2 How has your view of each of the following industries changed since the start of the coronavirus pandemic?
Retail
Base: All Respondents
Waves Gender Age Income Political
Wave 2 Wave 3 Wave 4 Wave 5 Wave 6 Wave 7 Wave 8 Wave 9 Wave 10 Wave 11 Wave 12 Wave 13 Wave 14 Less(3/14 - (3/17 - (3/21 - (3/28 - (4/3 - (4/11- (4/18- (4/25- (5/1 - (5/8 - (5/15 - (5/27 - (5/29 - than $50k -3/15) 3/18) 3/23) 3/30) 4/5) 4/13) 4/20) 4/27) 5/3) 5/10) 5/17) 5/28) 5/31) MALE FEMALE 18-34 35-49 50-64 65+ $50k $75k $75k+ GOP DEM IND/OTH
(A) (B) (C) (D) (E) (F) (G) (H) (I) (J) (K) (L) (M) (N) (O) (P) (Q) (R) (S) (T) (U) (V) (W) (X) (Y)
- - 2023 2016 - 2013 2029 2050 2039 2030 1961 1996 1965 1066 899 504 475 502 484 749 397 729 698 683 584Unweighted Base-** -** 2023 2016 -** 2013 2029 2050 2039 2066 1961 1996 1965 952 1013 573 497 474 421 609 329 935 665 709 591Weighted Base
- - 890 887 - 918 873 895 817 896 772 826 857 440 417 302 263 164 127 247 136 446 312 325 220- - 44% 44% - 46% 43% 44% 40% 43% 39% 41% 44% 46% 41% 53% 53% 35% 30% 41% 41% 48% 47% 46% 37%
IK IK IKL k iK iK iK o RS RS T Y Y
More Positive/Negative(Net)
- - 551 595 - 666 628 603 578 619 511 577 600 319 281 217 186 102 95 159 102 323 231 233 136- - 27% 30% - 33% 31% 29% 28% 30% 26% 29% 31% 34% 28% 38% 37% 21% 22% 26% 31% 35% 35% 33% 23%
k CdHIjKL CK k K cK O RS RS T Y Y
More positive
- - 338 292 - 252 245 291 239 277 261 249 257 121 136 85 77 63 33 88 34 124 81 92 84- - 17% 14% - 13% 12% 14% 12% 13% 13% 12% 13% 13% 13% 15% 15% 13% 8% 15% 10% 13% 12% 13% 14%
FGhIJKLM gI gi S S S
More negative
- - 1133 1129 - 1095 1156 1155 1222 1171 1189 1170 1108 512 596 271 234 309 294 362 193 489 352 385 371- - 56% 56% - 54% 57% 56% 60% 57% 61% 59% 56% 54% 59% 47% 47% 65% 70% 59% 59% 52% 53% 54% 63%
CDFhjm CDFgHJM F n PQ PQ V WX
Unchanged
- - 2023 2016 - 2013 2029 2050 2039 2066 1961 1996 1965 952 1013 573 497 474 421 609 329 935 665 709 591- - 100% 100% - 100% 100% 100% 100% 100% 100% 100% 100% 100% 100% 100% 100% 100% 100% 100% 100% 100% 100% 100% 100%
Sigma
__________________________________________________________________________________________________________________Proportions/Means: Columns Tested (5%, 10% risk level) - A/B/C/D/E/F/G/H/I/J/K/L/M - N/O - P/Q/R/S - T/U/V - W/X/YOverlap formulae used. ** very small base (under 30) ineligible for sig testing
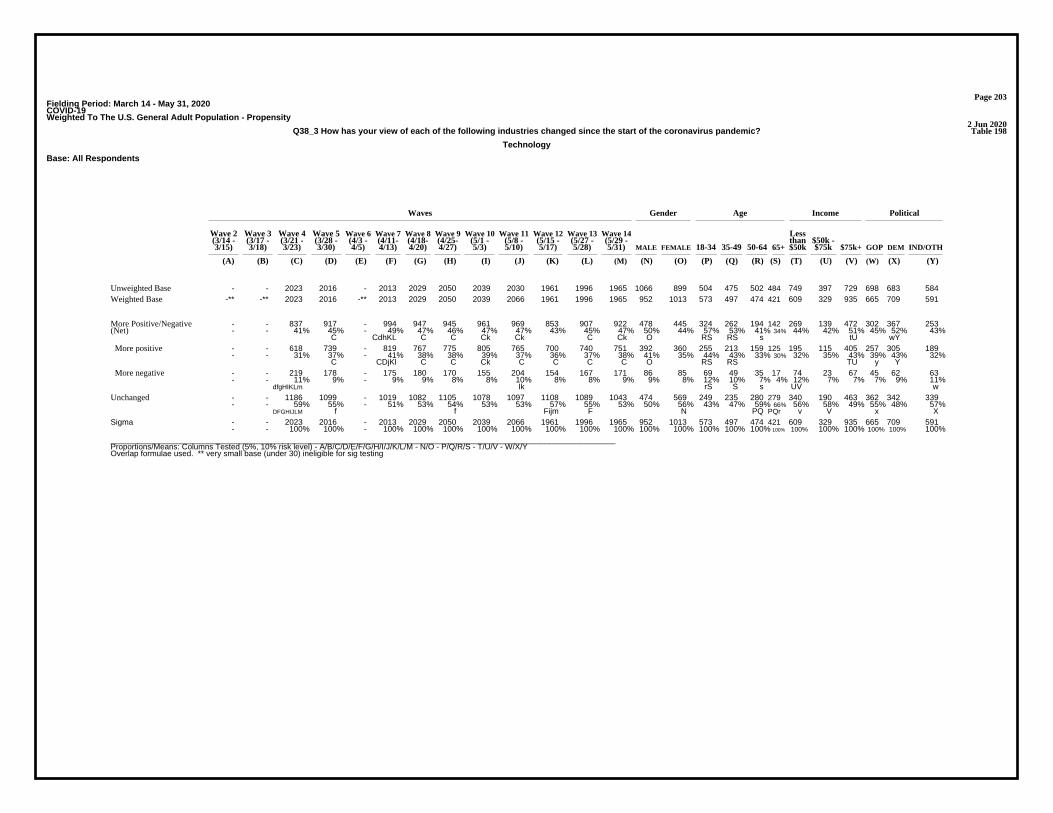
Page 203Fielding Period: March 14 - May 31, 2020COVID-19Weighted To The U.S. General Adult Population - Propensity
2 Jun 2020Table 198Q38_3 How has your view of each of the following industries changed since the start of the coronavirus pandemic?
Technology
Base: All Respondents
Waves Gender Age Income Political
Wave 2 Wave 3 Wave 4 Wave 5 Wave 6 Wave 7 Wave 8 Wave 9 Wave 10 Wave 11 Wave 12 Wave 13 Wave 14 Less(3/14 - (3/17 - (3/21 - (3/28 - (4/3 - (4/11- (4/18- (4/25- (5/1 - (5/8 - (5/15 - (5/27 - (5/29 - than $50k -3/15) 3/18) 3/23) 3/30) 4/5) 4/13) 4/20) 4/27) 5/3) 5/10) 5/17) 5/28) 5/31) MALE FEMALE 18-34 35-49 50-64 65+ $50k $75k $75k+ GOP DEM IND/OTH
(A) (B) (C) (D) (E) (F) (G) (H) (I) (J) (K) (L) (M) (N) (O) (P) (Q) (R) (S) (T) (U) (V) (W) (X) (Y)
- - 2023 2016 - 2013 2029 2050 2039 2030 1961 1996 1965 1066 899 504 475 502 484 749 397 729 698 683 584Unweighted Base-** -** 2023 2016 -** 2013 2029 2050 2039 2066 1961 1996 1965 952 1013 573 497 474 421 609 329 935 665 709 591Weighted Base
- - 837 917 - 994 947 945 961 969 853 907 922 478 445 324 262 194 142 269 139 472 302 367 253- - 41% 45% - 49% 47% 46% 47% 47% 43% 45% 47% 50% 44% 57% 53% 41% 34% 44% 42% 51% 45% 52% 43%
C CdhKL C C Ck Ck C Ck O RS RS s tU wY
More Positive/Negative(Net)
- - 618 739 - 819 767 775 805 765 700 740 751 392 360 255 213 159 125 195 115 405 257 305 189- - 31% 37% - 41% 38% 38% 39% 37% 36% 37% 38% 41% 35% 44% 43% 33% 30% 32% 35% 43% 39% 43% 32%
C CDjKl C C Ck C C C C O RS RS TU y Y
More positive
- - 219 178 - 175 180 170 155 204 154 167 171 86 85 69 49 35 17 74 23 67 45 62 63- - 11% 9% - 9% 9% 8% 8% 10% 8% 8% 9% 9% 8% 12% 10% 7% 4% 12% 7% 7% 7% 9% 11%
dfgHIKLm Ik rS S s UV w
More negative
- - 1186 1099 - 1019 1082 1105 1078 1097 1108 1089 1043 474 569 249 235 280 279 340 190 463 362 342 339- - 59% 55% - 51% 53% 54% 53% 53% 57% 55% 53% 50% 56% 43% 47% 59% 66% 56% 58% 49% 55% 48% 57%
DFGHIJLM f f Fijm F N PQ PQr v V x X
Unchanged
- - 2023 2016 - 2013 2029 2050 2039 2066 1961 1996 1965 952 1013 573 497 474 421 609 329 935 665 709 591- - 100% 100% - 100% 100% 100% 100% 100% 100% 100% 100% 100% 100% 100% 100% 100% 100% 100% 100% 100% 100% 100% 100%
Sigma
__________________________________________________________________________________________________________________Proportions/Means: Columns Tested (5%, 10% risk level) - A/B/C/D/E/F/G/H/I/J/K/L/M - N/O - P/Q/R/S - T/U/V - W/X/YOverlap formulae used. ** very small base (under 30) ineligible for sig testing

Page 204Fielding Period: March 14 - May 31, 2020COVID-19Weighted To The U.S. General Adult Population - Propensity
2 Jun 2020Table 199Q38_4 How has your view of each of the following industries changed since the start of the coronavirus pandemic?
Media
Base: All Respondents
Waves Gender Age Income Political
Wave 2 Wave 3 Wave 4 Wave 5 Wave 6 Wave 7 Wave 8 Wave 9 Wave 10 Wave 11 Wave 12 Wave 13 Wave 14 Less(3/14 - (3/17 - (3/21 - (3/28 - (4/3 - (4/11- (4/18- (4/25- (5/1 - (5/8 - (5/15 - (5/27 - (5/29 - than $50k -3/15) 3/18) 3/23) 3/30) 4/5) 4/13) 4/20) 4/27) 5/3) 5/10) 5/17) 5/28) 5/31) MALE FEMALE 18-34 35-49 50-64 65+ $50k $75k $75k+ GOP DEM IND/OTH
(A) (B) (C) (D) (E) (F) (G) (H) (I) (J) (K) (L) (M) (N) (O) (P) (Q) (R) (S) (T) (U) (V) (W) (X) (Y)
- - 2023 2016 - 2013 2029 2050 2039 2030 1961 1996 1965 1066 899 504 475 502 484 749 397 729 698 683 584Unweighted Base-** -** 2023 2016 -** 2013 2029 2050 2039 2066 1961 1996 1965 952 1013 573 497 474 421 609 329 935 665 709 591Weighted Base
- - 1118 1116 - 1127 1097 1146 1111 1169 1033 1109 1153 619 534 372 296 256 228 329 189 597 443 391 319- - 55% 55% - 56% 54% 56% 55% 57% 53% 56% 59% 65% 53% 65% 60% 54% 54% 54% 58% 64% 67% 55% 54%
k cdGIK O RS Tu XY
More Positive/Negative(Net)
- - 450 524 - 581 532 544 572 532 514 438 559 326 233 219 180 97 63 142 85 312 172 260 127- - 22% 26% - 29% 26% 27% 28% 26% 26% 22% 28% 34% 23% 38% 36% 20% 15% 23% 26% 33% 26% 37% 21%
CL CjL CL CL CL CL CL CL O RS RS s TU WY
More positive
- - 668 591 - 546 565 602 539 637 519 671 595 293 302 153 116 159 166 187 104 285 271 131 192- - 33% 29% - 27% 28% 29% 26% 31% 26% 34% 30% 31% 30% 27% 23% 34% 39% 31% 32% 30% 41% 18% 33%
DFGHIK i FgIK DFGHIKm fIK pQ PQ XY X
More negative
- - 905 900 - 886 932 904 928 897 928 887 812 333 479 201 201 217 193 280 140 338 222 318 272- - 45% 45% - 44% 46% 44% 45% 43% 47% 44% 41% 35% 47% 35% 40% 46% 46% 46% 42% 36% 33% 45% 46%
m m M M jM N P P V v W W
Unchanged
- - 2023 2016 - 2013 2029 2050 2039 2066 1961 1996 1965 952 1013 573 497 474 421 609 329 935 665 709 591- - 100% 100% - 100% 100% 100% 100% 100% 100% 100% 100% 100% 100% 100% 100% 100% 100% 100% 100% 100% 100% 100% 100%
Sigma
__________________________________________________________________________________________________________________Proportions/Means: Columns Tested (5%, 10% risk level) - A/B/C/D/E/F/G/H/I/J/K/L/M - N/O - P/Q/R/S - T/U/V - W/X/YOverlap formulae used. ** very small base (under 30) ineligible for sig testing
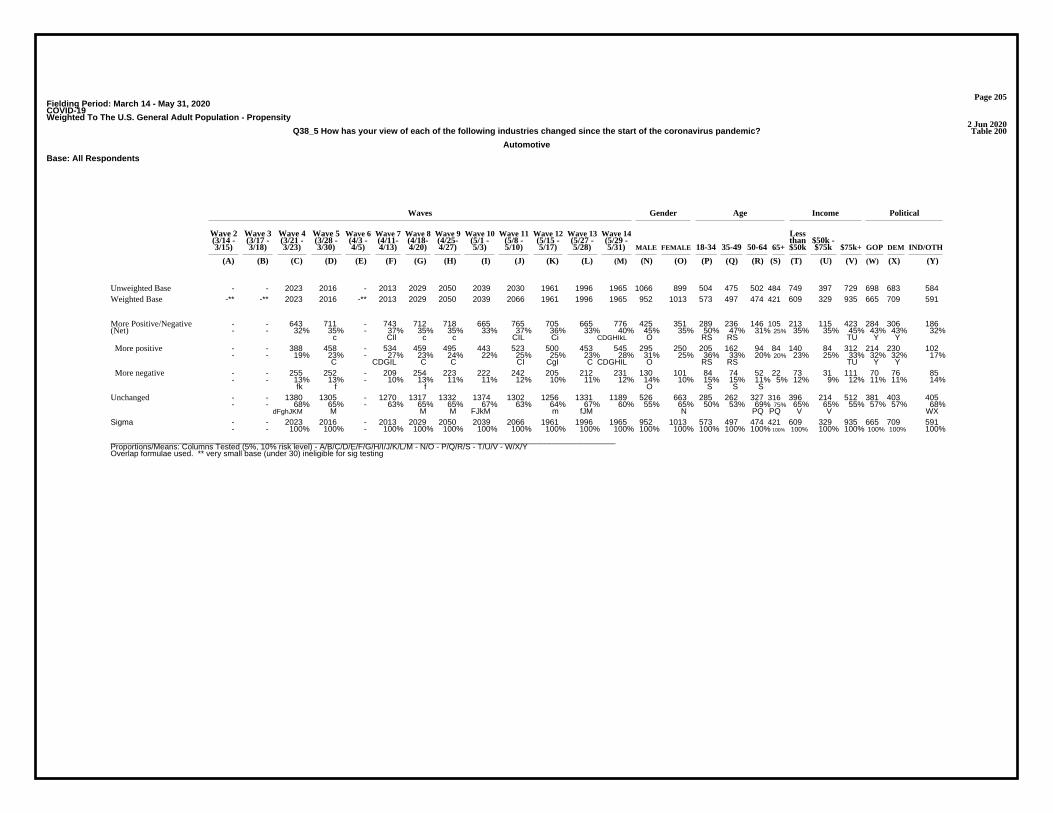
Page 205Fielding Period: March 14 - May 31, 2020COVID-19Weighted To The U.S. General Adult Population - Propensity
2 Jun 2020Table 200Q38_5 How has your view of each of the following industries changed since the start of the coronavirus pandemic?
Automotive
Base: All Respondents
Waves Gender Age Income Political
Wave 2 Wave 3 Wave 4 Wave 5 Wave 6 Wave 7 Wave 8 Wave 9 Wave 10 Wave 11 Wave 12 Wave 13 Wave 14 Less(3/14 - (3/17 - (3/21 - (3/28 - (4/3 - (4/11- (4/18- (4/25- (5/1 - (5/8 - (5/15 - (5/27 - (5/29 - than $50k -3/15) 3/18) 3/23) 3/30) 4/5) 4/13) 4/20) 4/27) 5/3) 5/10) 5/17) 5/28) 5/31) MALE FEMALE 18-34 35-49 50-64 65+ $50k $75k $75k+ GOP DEM IND/OTH
(A) (B) (C) (D) (E) (F) (G) (H) (I) (J) (K) (L) (M) (N) (O) (P) (Q) (R) (S) (T) (U) (V) (W) (X) (Y)
- - 2023 2016 - 2013 2029 2050 2039 2030 1961 1996 1965 1066 899 504 475 502 484 749 397 729 698 683 584Unweighted Base-** -** 2023 2016 -** 2013 2029 2050 2039 2066 1961 1996 1965 952 1013 573 497 474 421 609 329 935 665 709 591Weighted Base
- - 643 711 - 743 712 718 665 765 705 665 776 425 351 289 236 146 105 213 115 423 284 306 186- - 32% 35% - 37% 35% 35% 33% 37% 36% 33% 40% 45% 35% 50% 47% 31% 25% 35% 35% 45% 43% 43% 32%
c CIl c c CIL Ci CDGHIkL O RS RS TU Y Y
More Positive/Negative(Net)
- - 388 458 - 534 459 495 443 523 500 453 545 295 250 205 162 94 84 140 84 312 214 230 102- - 19% 23% - 27% 23% 24% 22% 25% 25% 23% 28% 31% 25% 36% 33% 20% 20% 23% 25% 33% 32% 32% 17%
C CDGIL C C CI CgI C CDGHIL O RS RS TU Y Y
More positive
- - 255 252 - 209 254 223 222 242 205 212 231 130 101 84 74 52 22 73 31 111 70 76 85- - 13% 13% - 10% 13% 11% 11% 12% 10% 11% 12% 14% 10% 15% 15% 11% 5% 12% 9% 12% 11% 11% 14%
fk f f O S S S
More negative
- - 1380 1305 - 1270 1317 1332 1374 1302 1256 1331 1189 526 663 285 262 327 316 396 214 512 381 403 405- - 68% 65% - 63% 65% 65% 67% 63% 64% 67% 60% 55% 65% 50% 53% 69% 75% 65% 65% 55% 57% 57% 68%
dFghJKM M M M FJkM m fJM N PQ PQ V V WX
Unchanged
- - 2023 2016 - 2013 2029 2050 2039 2066 1961 1996 1965 952 1013 573 497 474 421 609 329 935 665 709 591- - 100% 100% - 100% 100% 100% 100% 100% 100% 100% 100% 100% 100% 100% 100% 100% 100% 100% 100% 100% 100% 100% 100%
Sigma
__________________________________________________________________________________________________________________Proportions/Means: Columns Tested (5%, 10% risk level) - A/B/C/D/E/F/G/H/I/J/K/L/M - N/O - P/Q/R/S - T/U/V - W/X/YOverlap formulae used. ** very small base (under 30) ineligible for sig testing
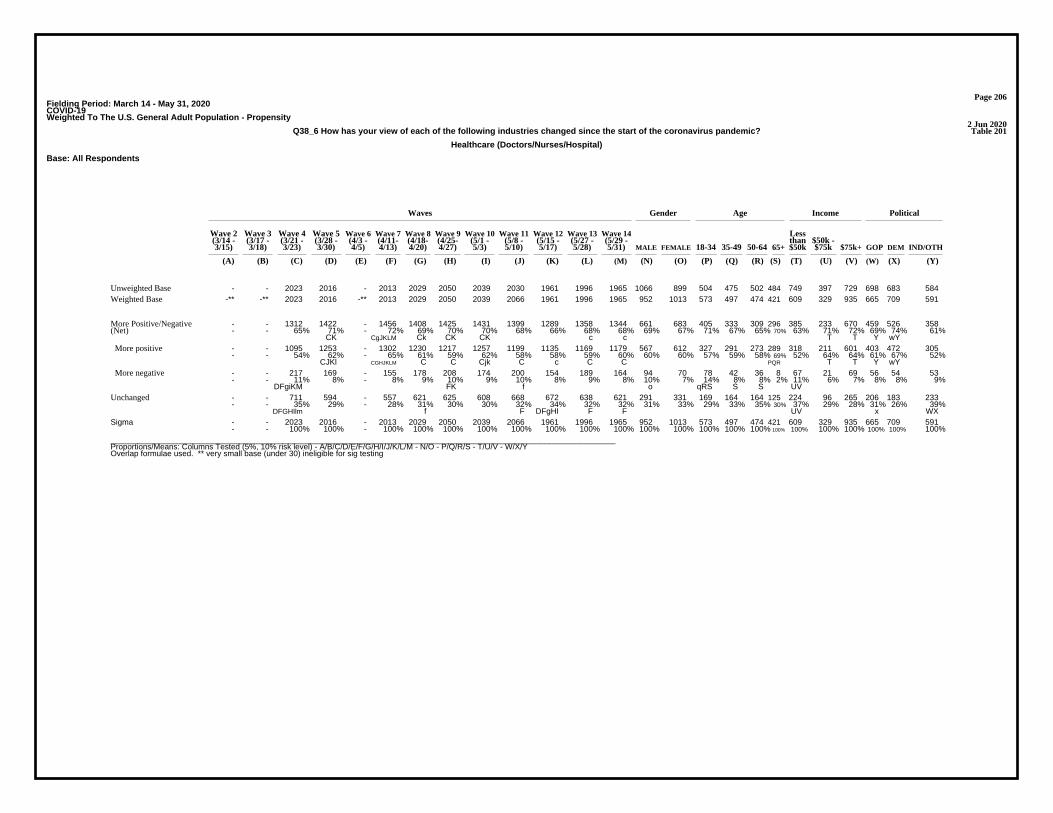
Page 206Fielding Period: March 14 - May 31, 2020COVID-19Weighted To The U.S. General Adult Population - Propensity
2 Jun 2020Table 201Q38_6 How has your view of each of the following industries changed since the start of the coronavirus pandemic?
Healthcare (Doctors/Nurses/Hospital)
Base: All Respondents
Waves Gender Age Income Political
Wave 2 Wave 3 Wave 4 Wave 5 Wave 6 Wave 7 Wave 8 Wave 9 Wave 10 Wave 11 Wave 12 Wave 13 Wave 14 Less(3/14 - (3/17 - (3/21 - (3/28 - (4/3 - (4/11- (4/18- (4/25- (5/1 - (5/8 - (5/15 - (5/27 - (5/29 - than $50k -3/15) 3/18) 3/23) 3/30) 4/5) 4/13) 4/20) 4/27) 5/3) 5/10) 5/17) 5/28) 5/31) MALE FEMALE 18-34 35-49 50-64 65+ $50k $75k $75k+ GOP DEM IND/OTH
(A) (B) (C) (D) (E) (F) (G) (H) (I) (J) (K) (L) (M) (N) (O) (P) (Q) (R) (S) (T) (U) (V) (W) (X) (Y)
- - 2023 2016 - 2013 2029 2050 2039 2030 1961 1996 1965 1066 899 504 475 502 484 749 397 729 698 683 584Unweighted Base-** -** 2023 2016 -** 2013 2029 2050 2039 2066 1961 1996 1965 952 1013 573 497 474 421 609 329 935 665 709 591Weighted Base
- - 1312 1422 - 1456 1408 1425 1431 1399 1289 1358 1344 661 683 405 333 309 296 385 233 670 459 526 358- - 65% 71% - 72% 69% 70% 70% 68% 66% 68% 68% 69% 67% 71% 67% 65% 70% 63% 71% 72% 69% 74% 61%
CK CgJKLM Ck CK CK c c T T Y wY
More Positive/Negative(Net)
- - 1095 1253 - 1302 1230 1217 1257 1199 1135 1169 1179 567 612 327 291 273 289 318 211 601 403 472 305- - 54% 62% - 65% 61% 59% 62% 58% 58% 59% 60% 60% 60% 57% 59% 58% 69% 52% 64% 64% 61% 67% 52%
CJKl CGHJKLM C C Cjk C c C C PQR T T Y wY
More positive
- - 217 169 - 155 178 208 174 200 154 189 164 94 70 78 42 36 8 67 21 69 56 54 53- - 11% 8% - 8% 9% 10% 9% 10% 8% 9% 8% 10% 7% 14% 8% 8% 2% 11% 6% 7% 8% 8% 9%
DFgiKM FK f o qRS S S UV
More negative
- - 711 594 - 557 621 625 608 668 672 638 621 291 331 169 164 164 125 224 96 265 206 183 233- - 35% 29% - 28% 31% 30% 30% 32% 34% 32% 32% 31% 33% 29% 33% 35% 30% 37% 29% 28% 31% 26% 39%
DFGHIlm f F DFgHI F F UV x WX
Unchanged
- - 2023 2016 - 2013 2029 2050 2039 2066 1961 1996 1965 952 1013 573 497 474 421 609 329 935 665 709 591- - 100% 100% - 100% 100% 100% 100% 100% 100% 100% 100% 100% 100% 100% 100% 100% 100% 100% 100% 100% 100% 100% 100%
Sigma
__________________________________________________________________________________________________________________Proportions/Means: Columns Tested (5%, 10% risk level) - A/B/C/D/E/F/G/H/I/J/K/L/M - N/O - P/Q/R/S - T/U/V - W/X/YOverlap formulae used. ** very small base (under 30) ineligible for sig testing

Page 207Fielding Period: March 14 - May 31, 2020COVID-19Weighted To The U.S. General Adult Population - Propensity
2 Jun 2020Table 202Q38_7 How has your view of each of the following industries changed since the start of the coronavirus pandemic?
Food & Beverage
Base: All Respondents
Waves Gender Age Income Political
Wave 2 Wave 3 Wave 4 Wave 5 Wave 6 Wave 7 Wave 8 Wave 9 Wave 10 Wave 11 Wave 12 Wave 13 Wave 14 Less(3/14 - (3/17 - (3/21 - (3/28 - (4/3 - (4/11- (4/18- (4/25- (5/1 - (5/8 - (5/15 - (5/27 - (5/29 - than $50k -3/15) 3/18) 3/23) 3/30) 4/5) 4/13) 4/20) 4/27) 5/3) 5/10) 5/17) 5/28) 5/31) MALE FEMALE 18-34 35-49 50-64 65+ $50k $75k $75k+ GOP DEM IND/OTH
(A) (B) (C) (D) (E) (F) (G) (H) (I) (J) (K) (L) (M) (N) (O) (P) (Q) (R) (S) (T) (U) (V) (W) (X) (Y)
- - 2023 2016 - 2013 2029 2050 2039 2030 1961 1996 1965 1066 899 504 475 502 484 749 397 729 698 683 584Unweighted Base-** -** 2023 2016 -** 2013 2029 2050 2039 2066 1961 1996 1965 952 1013 573 497 474 421 609 329 935 665 709 591Weighted Base
- - 938 1004 - 1042 1023 982 969 1019 913 959 1011 514 497 358 284 208 162 282 157 527 333 399 279- - 46% 50% - 52% 50% 48% 48% 49% 47% 48% 51% 54% 49% 62% 57% 44% 39% 46% 48% 56% 50% 56% 47%
c CHIKl Ck ChiKl o RS RS TU wY
More Positive/Negative(Net)
- - 632 753 - 862 817 768 751 771 670 713 776 390 387 258 219 166 132 194 129 420 262 324 190- - 31% 37% - 43% 40% 37% 37% 37% 34% 36% 40% 41% 38% 45% 44% 35% 31% 32% 39% 45% 39% 46% 32%
C CDHIJKLm CiKL Ck C C C CKl RS RS T T Y wY
More positive
- - 306 251 - 180 207 215 218 248 244 246 235 125 110 100 64 41 30 89 29 107 71 75 89- - 15% 12% - 9% 10% 10% 11% 12% 12% 12% 12% 13% 11% 17% 13% 9% 7% 15% 9% 11% 11% 11% 15%
dFGHIJkLM Fg F Fg Fg F RS rS U wx
More negative
- - 1085 1012 - 971 1006 1068 1070 1047 1048 1037 954 437 517 215 214 266 259 327 172 408 331 311 312- - 54% 50% - 48% 50% 52% 52% 51% 53% 52% 49% 46% 51% 38% 43% 56% 61% 54% 52% 44% 50% 44% 53%
dFGM Fm Fm FgM fm n PQ PQ V V x X
Unchanged
- - 2023 2016 - 2013 2029 2050 2039 2066 1961 1996 1965 952 1013 573 497 474 421 609 329 935 665 709 591- - 100% 100% - 100% 100% 100% 100% 100% 100% 100% 100% 100% 100% 100% 100% 100% 100% 100% 100% 100% 100% 100% 100%
Sigma
__________________________________________________________________________________________________________________Proportions/Means: Columns Tested (5%, 10% risk level) - A/B/C/D/E/F/G/H/I/J/K/L/M - N/O - P/Q/R/S - T/U/V - W/X/YOverlap formulae used. ** very small base (under 30) ineligible for sig testing

Page 208Fielding Period: March 14 - May 31, 2020COVID-19Weighted To The U.S. General Adult Population - Propensity
2 Jun 2020Table 203Q38_8 How has your view of each of the following industries changed since the start of the coronavirus pandemic?
Entertainment
Base: All Respondents
Waves Gender Age Income Political
Wave 2 Wave 3 Wave 4 Wave 5 Wave 6 Wave 7 Wave 8 Wave 9 Wave 10 Wave 11 Wave 12 Wave 13 Wave 14 Less(3/14 - (3/17 - (3/21 - (3/28 - (4/3 - (4/11- (4/18- (4/25- (5/1 - (5/8 - (5/15 - (5/27 - (5/29 - than $50k -3/15) 3/18) 3/23) 3/30) 4/5) 4/13) 4/20) 4/27) 5/3) 5/10) 5/17) 5/28) 5/31) MALE FEMALE 18-34 35-49 50-64 65+ $50k $75k $75k+ GOP DEM IND/OTH
(A) (B) (C) (D) (E) (F) (G) (H) (I) (J) (K) (L) (M) (N) (O) (P) (Q) (R) (S) (T) (U) (V) (W) (X) (Y)
- - 2023 2016 - 2013 2029 2050 2039 2030 1961 1996 1965 1066 899 504 475 502 484 749 397 729 698 683 584Unweighted Base-** -** 2023 2016 -** 2013 2029 2050 2039 2066 1961 1996 1965 952 1013 573 497 474 421 609 329 935 665 709 591Weighted Base
- - 810 836 - 903 860 868 861 934 848 831 881 467 414 322 254 160 145 246 132 474 311 345 225- - 40% 41% - 45% 42% 42% 42% 45% 43% 42% 45% 49% 41% 56% 51% 34% 35% 40% 40% 51% 47% 49% 38%
Cd Cdl Cd O RS RS TU Y Y
More Positive/Negative(Net)
- - 407 502 - 638 592 555 581 588 506 541 554 313 241 226 186 78 64 132 80 330 191 248 114- - 20% 25% - 32% 29% 27% 28% 28% 26% 27% 28% 33% 24% 39% 37% 16% 15% 22% 24% 35% 29% 35% 19%
C CDHijKLm CDk C CD CD C C Cd O RS RS TU Y wY
More positive
- - 403 334 - 265 268 312 281 345 342 290 327 154 173 96 68 82 82 114 52 145 120 97 111- - 20% 17% - 13% 13% 15% 14% 17% 17% 15% 17% 16% 17% 17% 14% 17% 19% 19% 16% 15% 18% 14% 19%
DFGHIJLM FGI FGI FGIl FGI q x x
More negative
- - 1213 1180 - 1110 1169 1182 1178 1133 1113 1165 1084 485 599 251 243 314 276 363 197 461 353 365 366- - 60% 59% - 55% 58% 58% 58% 55% 57% 58% 55% 51% 59% 44% 49% 66% 65% 60% 60% 49% 53% 51% 62%
FJM fjm j N PQ PQ V V WX
Unchanged
- - 2023 2016 - 2013 2029 2050 2039 2066 1961 1996 1965 952 1013 573 497 474 421 609 329 935 665 709 591- - 100% 100% - 100% 100% 100% 100% 100% 100% 100% 100% 100% 100% 100% 100% 100% 100% 100% 100% 100% 100% 100% 100%
Sigma
__________________________________________________________________________________________________________________Proportions/Means: Columns Tested (5%, 10% risk level) - A/B/C/D/E/F/G/H/I/J/K/L/M - N/O - P/Q/R/S - T/U/V - W/X/YOverlap formulae used. ** very small base (under 30) ineligible for sig testing

Page 209Fielding Period: March 14 - May 31, 2020COVID-19Weighted To The U.S. General Adult Population - Propensity
2 Jun 2020Table 204Q38_9 How has your view of each of the following industries changed since the start of the coronavirus pandemic?
Travel and hospitality (hotels, cruise lines)
Base: All Respondents
Waves Gender Age Income Political
Wave 2 Wave 3 Wave 4 Wave 5 Wave 6 Wave 7 Wave 8 Wave 9 Wave 10 Wave 11 Wave 12 Wave 13 Wave 14 Less(3/14 - (3/17 - (3/21 - (3/28 - (4/3 - (4/11- (4/18- (4/25- (5/1 - (5/8 - (5/15 - (5/27 - (5/29 - than $50k -3/15) 3/18) 3/23) 3/30) 4/5) 4/13) 4/20) 4/27) 5/3) 5/10) 5/17) 5/28) 5/31) MALE FEMALE 18-34 35-49 50-64 65+ $50k $75k $75k+ GOP DEM IND/OTH
(A) (B) (C) (D) (E) (F) (G) (H) (I) (J) (K) (L) (M) (N) (O) (P) (Q) (R) (S) (T) (U) (V) (W) (X) (Y)
- - 2023 2016 - 2013 2029 2050 2039 2030 1961 1996 1965 1066 899 504 475 502 484 749 397 729 698 683 584Unweighted Base-** -** 2023 2016 -** 2013 2029 2050 2039 2066 1961 1996 1965 952 1013 573 497 474 421 609 329 935 665 709 591Weighted Base
- - 968 932 - 1005 940 992 926 1060 982 946 955 499 456 316 259 198 182 273 143 510 338 371 246- - 48% 46% - 50% 46% 48% 45% 51% 50% 47% 49% 52% 45% 55% 52% 42% 43% 45% 43% 55% 51% 52% 42%
dgI cDGIL dgI O RS RS TU Y Y
More Positive/Negative(Net)
- - 385 421 - 492 430 414 453 497 416 434 453 251 202 189 137 73 55 111 72 262 168 191 93- - 19% 21% - 24% 21% 20% 22% 24% 21% 22% 23% 26% 20% 33% 27% 15% 13% 18% 22% 28% 25% 27% 16%
CDgHk C CdgHk c Ch O RS RS Tu Y Y
More positive
- - 583 511 - 513 509 578 473 563 566 512 502 247 255 127 123 125 127 162 71 248 169 180 153- - 29% 25% - 25% 25% 28% 23% 27% 29% 26% 26% 26% 25% 22% 25% 26% 30% 27% 22% 27% 25% 25% 26%
dfGIlm gI I dfGIlm P
More negative
- - 1055 1084 - 1008 1089 1058 1113 1007 979 1050 1010 453 557 257 238 276 239 336 186 425 327 338 345- - 52% 54% - 50% 54% 52% 55% 49% 50% 53% 51% 48% 55% 45% 48% 58% 57% 55% 57% 45% 49% 48% 58%
j fJk fJk FJK J N PQ PQ V V WX
Unchanged
- - 2023 2016 - 2013 2029 2050 2039 2066 1961 1996 1965 952 1013 573 497 474 421 609 329 935 665 709 591- - 100% 100% - 100% 100% 100% 100% 100% 100% 100% 100% 100% 100% 100% 100% 100% 100% 100% 100% 100% 100% 100% 100%
Sigma
__________________________________________________________________________________________________________________Proportions/Means: Columns Tested (5%, 10% risk level) - A/B/C/D/E/F/G/H/I/J/K/L/M - N/O - P/Q/R/S - T/U/V - W/X/YOverlap formulae used. ** very small base (under 30) ineligible for sig testing

Page 210Fielding Period: March 14 - May 31, 2020COVID-19Weighted To The U.S. General Adult Population - Propensity
2 Jun 2020Table 205Q38_10 How has your view of each of the following industries changed since the start of the coronavirus pandemic?
Airlines
Base: All Respondents
Waves Gender Age Income Political
Wave 2 Wave 3 Wave 4 Wave 5 Wave 6 Wave 7 Wave 8 Wave 9 Wave 10 Wave 11 Wave 12 Wave 13 Wave 14 Less(3/14 - (3/17 - (3/21 - (3/28 - (4/3 - (4/11- (4/18- (4/25- (5/1 - (5/8 - (5/15 - (5/27 - (5/29 - than $50k -3/15) 3/18) 3/23) 3/30) 4/5) 4/13) 4/20) 4/27) 5/3) 5/10) 5/17) 5/28) 5/31) MALE FEMALE 18-34 35-49 50-64 65+ $50k $75k $75k+ GOP DEM IND/OTH
(A) (B) (C) (D) (E) (F) (G) (H) (I) (J) (K) (L) (M) (N) (O) (P) (Q) (R) (S) (T) (U) (V) (W) (X) (Y)
- - 2023 2016 - 2013 2029 2050 2039 2030 1961 1996 1965 1066 899 504 475 502 484 749 397 729 698 683 584Unweighted Base-** -** 2023 2016 -** 2013 2029 2050 2039 2066 1961 1996 1965 952 1013 573 497 474 421 609 329 935 665 709 591Weighted Base
- - 938 905 - 903 876 895 889 1039 963 903 988 525 463 313 273 219 183 267 154 536 348 396 244- - 46% 45% - 45% 43% 44% 44% 50% 49% 45% 50% 55% 46% 55% 55% 46% 43% 44% 47% 57% 52% 56% 41%
CDFGHIL DFGHIl cDFGHIL O RS RS TU Y Y
More Positive/Negative(Net)
- - 361 362 - 405 371 358 382 462 377 315 450 260 190 180 146 75 49 96 77 264 173 197 80- - 18% 18% - 20% 18% 17% 19% 22% 19% 16% 23% 27% 19% 31% 29% 16% 12% 16% 23% 28% 26% 28% 14%
hL l L CDGHIkL L CDfGHIKL O RS RS T T Y Y
More positive
- - 577 544 - 498 505 537 507 577 586 587 538 265 273 133 127 144 134 171 77 272 175 199 164- - 29% 27% - 25% 25% 26% 25% 28% 30% 29% 27% 28% 27% 23% 26% 30% 32% 28% 23% 29% 26% 28% 28%
FGI fgi FGHI FGhI P Pq u
More negative
- - 1085 1111 - 1110 1153 1155 1150 1027 998 1093 977 426 551 260 224 255 238 342 175 399 317 313 347- - 54% 55% - 55% 57% 56% 56% 50% 51% 55% 50% 45% 54% 45% 45% 54% 57% 56% 53% 43% 48% 44% 59%
Jm JKM JKM JKM JKM JKM JkM N PQ PQ V V WX
Unchanged
- - 2023 2016 - 2013 2029 2050 2039 2066 1961 1996 1965 952 1013 573 497 474 421 609 329 935 665 709 591- - 100% 100% - 100% 100% 100% 100% 100% 100% 100% 100% 100% 100% 100% 100% 100% 100% 100% 100% 100% 100% 100% 100%
Sigma
__________________________________________________________________________________________________________________Proportions/Means: Columns Tested (5%, 10% risk level) - A/B/C/D/E/F/G/H/I/J/K/L/M - N/O - P/Q/R/S - T/U/V - W/X/YOverlap formulae used. ** very small base (under 30) ineligible for sig testing

Page 211Fielding Period: March 14 - May 31, 2020COVID-19Weighted To The U.S. General Adult Population - Propensity
2 Jun 2020Table 206Q38_11 How has your view of each of the following industries changed since the start of the coronavirus pandemic?
Non-profits
Base: All Respondents
Waves Gender Age Income Political
Wave 2 Wave 3 Wave 4 Wave 5 Wave 6 Wave 7 Wave 8 Wave 9 Wave 10 Wave 11 Wave 12 Wave 13 Wave 14 Less(3/14 - (3/17 - (3/21 - (3/28 - (4/3 - (4/11- (4/18- (4/25- (5/1 - (5/8 - (5/15 - (5/27 - (5/29 - than $50k -3/15) 3/18) 3/23) 3/30) 4/5) 4/13) 4/20) 4/27) 5/3) 5/10) 5/17) 5/28) 5/31) MALE FEMALE 18-34 35-49 50-64 65+ $50k $75k $75k+ GOP DEM IND/OTH
(A) (B) (C) (D) (E) (F) (G) (H) (I) (J) (K) (L) (M) (N) (O) (P) (Q) (R) (S) (T) (U) (V) (W) (X) (Y)
- - 2023 2016 - 2013 2029 2050 2039 2030 1961 1996 1965 1066 899 504 475 502 484 749 397 729 698 683 584Unweighted Base-** -** 2023 2016 -** 2013 2029 2050 2039 2066 1961 1996 1965 952 1013 573 497 474 421 609 329 935 665 709 591Weighted Base
- - 845 881 - 956 903 921 893 951 803 869 944 498 445 318 265 189 172 261 162 485 322 368 254- - 42% 44% - 47% 45% 45% 44% 46% 41% 44% 48% 52% 44% 56% 53% 40% 41% 43% 49% 52% 48% 52% 43%
CdiKL k cK CK CDgIKL O RS RS t T Y
More Positive/Negative(Net)
- - 597 674 - 764 711 713 727 729 593 676 722 379 342 246 185 145 145 182 145 366 239 293 190- - 29% 33% - 38% 35% 35% 36% 35% 30% 34% 37% 40% 34% 43% 37% 31% 35% 30% 44% 39% 36% 41% 32%
Ck CDhKL CK CK CK CK Ck CdK O RS r T T Y
More positive
- - 248 207 - 192 192 208 166 222 209 193 222 119 103 72 80 43 26 79 18 119 83 75 63- - 12% 10% - 10% 9% 10% 8% 11% 11% 10% 11% 12% 10% 13% 16% 9% 6% 13% 5% 13% 12% 11% 11%
FGhIL i i I I I S RS U U
More negative
- - 1178 1135 - 1057 1126 1129 1146 1115 1158 1127 1021 453 568 255 232 285 249 348 167 450 343 341 337- - 58% 56% - 53% 55% 55% 56% 54% 59% 56% 52% 48% 56% 44% 47% 60% 59% 57% 51% 48% 52% 48% 57%
FhJM fM m fM FgHJM FM N PQ PQ uV X
Unchanged
- - 2023 2016 - 2013 2029 2050 2039 2066 1961 1996 1965 952 1013 573 497 474 421 609 329 935 665 709 591- - 100% 100% - 100% 100% 100% 100% 100% 100% 100% 100% 100% 100% 100% 100% 100% 100% 100% 100% 100% 100% 100% 100%
Sigma
__________________________________________________________________________________________________________________Proportions/Means: Columns Tested (5%, 10% risk level) - A/B/C/D/E/F/G/H/I/J/K/L/M - N/O - P/Q/R/S - T/U/V - W/X/YOverlap formulae used. ** very small base (under 30) ineligible for sig testing
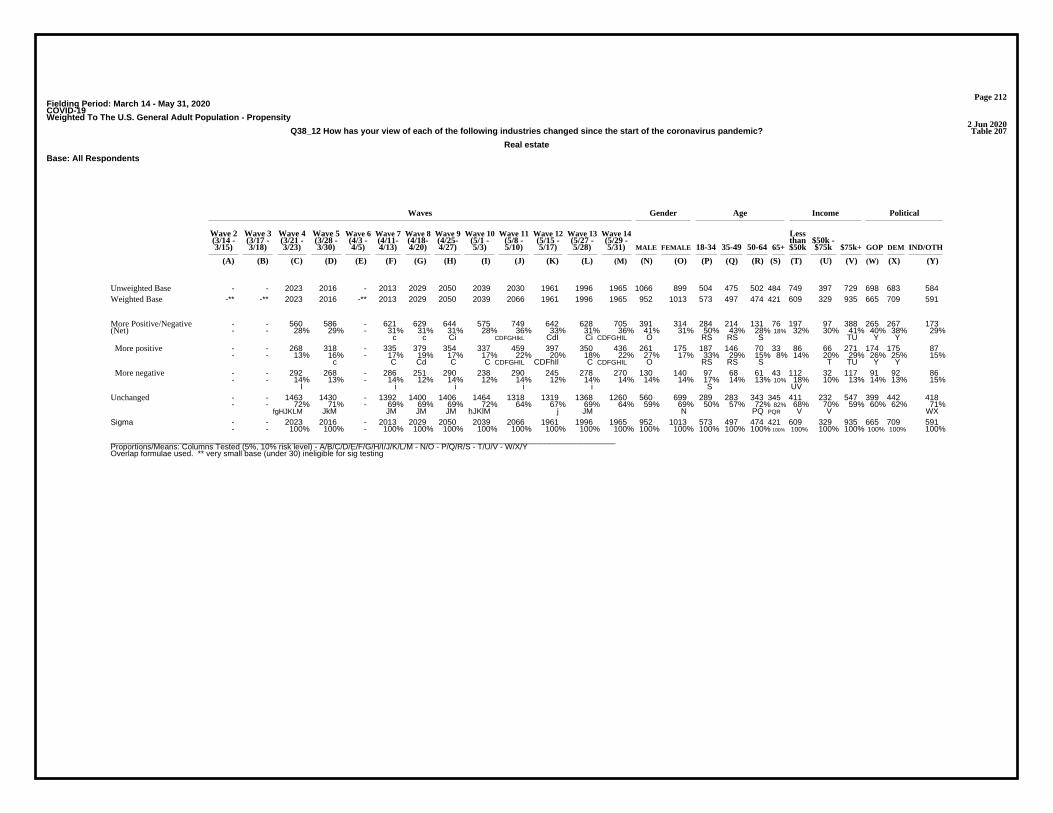
Page 212Fielding Period: March 14 - May 31, 2020COVID-19Weighted To The U.S. General Adult Population - Propensity
2 Jun 2020Table 207Q38_12 How has your view of each of the following industries changed since the start of the coronavirus pandemic?
Real estate
Base: All Respondents
Waves Gender Age Income Political
Wave 2 Wave 3 Wave 4 Wave 5 Wave 6 Wave 7 Wave 8 Wave 9 Wave 10 Wave 11 Wave 12 Wave 13 Wave 14 Less(3/14 - (3/17 - (3/21 - (3/28 - (4/3 - (4/11- (4/18- (4/25- (5/1 - (5/8 - (5/15 - (5/27 - (5/29 - than $50k -3/15) 3/18) 3/23) 3/30) 4/5) 4/13) 4/20) 4/27) 5/3) 5/10) 5/17) 5/28) 5/31) MALE FEMALE 18-34 35-49 50-64 65+ $50k $75k $75k+ GOP DEM IND/OTH
(A) (B) (C) (D) (E) (F) (G) (H) (I) (J) (K) (L) (M) (N) (O) (P) (Q) (R) (S) (T) (U) (V) (W) (X) (Y)
- - 2023 2016 - 2013 2029 2050 2039 2030 1961 1996 1965 1066 899 504 475 502 484 749 397 729 698 683 584Unweighted Base-** -** 2023 2016 -** 2013 2029 2050 2039 2066 1961 1996 1965 952 1013 573 497 474 421 609 329 935 665 709 591Weighted Base
- - 560 586 - 621 629 644 575 749 642 628 705 391 314 284 214 131 76 197 97 388 265 267 173- - 28% 29% - 31% 31% 31% 28% 36% 33% 31% 36% 41% 31% 50% 43% 28% 18% 32% 30% 41% 40% 38% 29%
c c Ci CDFGHIkL CdI Ci CDFGHIL O RS RS S TU Y Y
More Positive/Negative(Net)
- - 268 318 - 335 379 354 337 459 397 350 436 261 175 187 146 70 33 86 66 271 174 175 87- - 13% 16% - 17% 19% 17% 17% 22% 20% 18% 22% 27% 17% 33% 29% 15% 8% 14% 20% 29% 26% 25% 15%
c C Cd C C CDFGHIL CDFhIl C CDFGHIL O RS RS S T TU Y Y
More positive
- - 292 268 - 286 251 290 238 290 245 278 270 130 140 97 68 61 43 112 32 117 91 92 86- - 14% 13% - 14% 12% 14% 12% 14% 12% 14% 14% 14% 14% 17% 14% 13% 10% 18% 10% 13% 14% 13% 15%
I i i i i S UV
More negative
- - 1463 1430 - 1392 1400 1406 1464 1318 1319 1368 1260 560 699 289 283 343 345 411 232 547 399 442 418- - 72% 71% - 69% 69% 69% 72% 64% 67% 69% 64% 59% 69% 50% 57% 72% 82% 68% 70% 59% 60% 62% 71%
fgHJKLM JkM JM JM JM hJKlM j JM N PQ PQR V V WX
Unchanged
- - 2023 2016 - 2013 2029 2050 2039 2066 1961 1996 1965 952 1013 573 497 474 421 609 329 935 665 709 591- - 100% 100% - 100% 100% 100% 100% 100% 100% 100% 100% 100% 100% 100% 100% 100% 100% 100% 100% 100% 100% 100% 100%
Sigma
__________________________________________________________________________________________________________________Proportions/Means: Columns Tested (5%, 10% risk level) - A/B/C/D/E/F/G/H/I/J/K/L/M - N/O - P/Q/R/S - T/U/V - W/X/YOverlap formulae used. ** very small base (under 30) ineligible for sig testing

Page 213Fielding Period: March 14 - May 31, 2020COVID-19Weighted To The U.S. General Adult Population - Propensity
2 Jun 2020Table 208Q38_13 How has your view of each of the following industries changed since the start of the coronavirus pandemic?
Retail - grocery
Base: All Respondents
Waves Gender Age Income Political
Wave 2 Wave 3 Wave 4 Wave 5 Wave 6 Wave 7 Wave 8 Wave 9 Wave 10 Wave 11 Wave 12 Wave 13 Wave 14 Less(3/14 - (3/17 - (3/21 - (3/28 - (4/3 - (4/11- (4/18- (4/25- (5/1 - (5/8 - (5/15 - (5/27 - (5/29 - than $50k -3/15) 3/18) 3/23) 3/30) 4/5) 4/13) 4/20) 4/27) 5/3) 5/10) 5/17) 5/28) 5/31) MALE FEMALE 18-34 35-49 50-64 65+ $50k $75k $75k+ GOP DEM IND/OTH
(A) (B) (C) (D) (E) (F) (G) (H) (I) (J) (K) (L) (M) (N) (O) (P) (Q) (R) (S) (T) (U) (V) (W) (X) (Y)
- - 2023 2016 - 2013 2029 2050 2039 2030 1961 1996 1965 1066 899 504 475 502 484 749 397 729 698 683 584Unweighted Base-** -** 2023 2016 -** 2013 2029 2050 2039 2066 1961 1996 1965 952 1013 573 497 474 421 609 329 935 665 709 591Weighted Base
- - 1184 1220 - 1291 1273 1245 1212 1191 1090 1181 1213 579 634 376 320 278 240 352 206 608 408 467 338- - 59% 61% - 64% 63% 61% 59% 58% 56% 59% 62% 61% 63% 66% 64% 59% 57% 58% 63% 65% 61% 66% 57%
K CdhIJKL CiJKl K k k JK rS s T Y
More Positive/Negative(Net)
- - 828 966 - 1073 1042 993 1004 937 892 953 1008 467 541 288 262 239 219 271 178 519 339 399 270- - 41% 48% - 53% 51% 48% 49% 45% 45% 48% 51% 49% 53% 50% 53% 51% 52% 44% 54% 56% 51% 56% 46%
C CDHIJKL CdJKl C CJk C C C CdJKl T T Y
More positive
- - 355 255 - 218 231 252 208 253 198 228 205 111 94 88 58 38 21 81 28 88 69 68 68- - 18% 13% - 11% 11% 12% 10% 12% 10% 11% 10% 12% 9% 15% 12% 8% 5% 13% 8% 9% 10% 10% 11%
DFGHIJKLM ikm ik ik RS S uv
More negative
- - 839 796 - 722 756 805 827 876 871 815 752 373 379 197 178 196 181 257 123 327 257 242 253- - 41% 39% - 36% 37% 39% 41% 42% 44% 41% 38% 39% 37% 34% 36% 41% 43% 42% 37% 35% 39% 34% 43%
FG f f Fg FGM DFGHilM Fg p Pq V X
Unchanged
- - 2023 2016 - 2013 2029 2050 2039 2066 1961 1996 1965 952 1013 573 497 474 421 609 329 935 665 709 591- - 100% 100% - 100% 100% 100% 100% 100% 100% 100% 100% 100% 100% 100% 100% 100% 100% 100% 100% 100% 100% 100% 100%
Sigma
__________________________________________________________________________________________________________________Proportions/Means: Columns Tested (5%, 10% risk level) - A/B/C/D/E/F/G/H/I/J/K/L/M - N/O - P/Q/R/S - T/U/V - W/X/YOverlap formulae used. ** very small base (under 30) ineligible for sig testing

Page 214Fielding Period: March 14 - May 31, 2020COVID-19Weighted To The U.S. General Adult Population - Propensity
2 Jun 2020Table 209Q38_14 How has your view of each of the following industries changed since the start of the coronavirus pandemic?
Pharmaceutical/drugs
Base: All Respondents
Waves Gender Age Income Political
Wave 2 Wave 3 Wave 4 Wave 5 Wave 6 Wave 7 Wave 8 Wave 9 Wave 10 Wave 11 Wave 12 Wave 13 Wave 14 Less(3/14 - (3/17 - (3/21 - (3/28 - (4/3 - (4/11- (4/18- (4/25- (5/1 - (5/8 - (5/15 - (5/27 - (5/29 - than $50k -3/15) 3/18) 3/23) 3/30) 4/5) 4/13) 4/20) 4/27) 5/3) 5/10) 5/17) 5/28) 5/31) MALE FEMALE 18-34 35-49 50-64 65+ $50k $75k $75k+ GOP DEM IND/OTH
(A) (B) (C) (D) (E) (F) (G) (H) (I) (J) (K) (L) (M) (N) (O) (P) (Q) (R) (S) (T) (U) (V) (W) (X) (Y)
- - 2023 2016 - 2013 2029 2050 2039 2030 1961 1996 1965 1066 899 504 475 502 484 749 397 729 698 683 584Unweighted Base-** -** 2023 2016 -** 2013 2029 2050 2039 2066 1961 1996 1965 952 1013 573 497 474 421 609 329 935 665 709 591Weighted Base
- - 981 1049 - 1050 1015 1013 1048 1040 970 965 1057 542 515 345 286 209 217 288 174 551 398 386 273- - 48% 52% - 52% 50% 49% 51% 50% 49% 48% 54% 57% 51% 60% 57% 44% 52% 47% 53% 59% 60% 54% 46%
cl cl CgHjKL O RS R r T Y Y
More Positive/Negative(Net)
- - 671 779 - 797 744 703 790 761 731 669 756 383 373 239 213 145 160 182 130 414 296 290 170- - 33% 39% - 40% 37% 34% 39% 37% 37% 34% 38% 40% 37% 42% 43% 31% 38% 30% 40% 44% 45% 41% 29%
CHL CHL cl CHL cl Cl CHL R R r T T Y Y
More positive
- - 310 269 - 253 271 310 257 279 238 296 301 159 142 107 73 64 57 106 43 138 102 95 103- - 15% 13% - 13% 13% 15% 13% 14% 12% 15% 15% 17% 14% 19% 15% 13% 14% 17% 13% 15% 15% 13% 17%
FIK fiK k fiK r
More negative
- - 1042 967 - 963 1014 1037 991 1026 991 1031 908 410 499 228 212 265 204 321 155 384 266 324 318- - 52% 48% - 48% 50% 51% 49% 50% 51% 52% 46% 43% 49% 40% 43% 56% 48% 53% 47% 41% 40% 46% 54%
dfM m M m M dfM N PQs P V WX
Unchanged
- - 2023 2016 - 2013 2029 2050 2039 2066 1961 1996 1965 952 1013 573 497 474 421 609 329 935 665 709 591- - 100% 100% - 100% 100% 100% 100% 100% 100% 100% 100% 100% 100% 100% 100% 100% 100% 100% 100% 100% 100% 100% 100%
Sigma
__________________________________________________________________________________________________________________Proportions/Means: Columns Tested (5%, 10% risk level) - A/B/C/D/E/F/G/H/I/J/K/L/M - N/O - P/Q/R/S - T/U/V - W/X/YOverlap formulae used. ** very small base (under 30) ineligible for sig testing
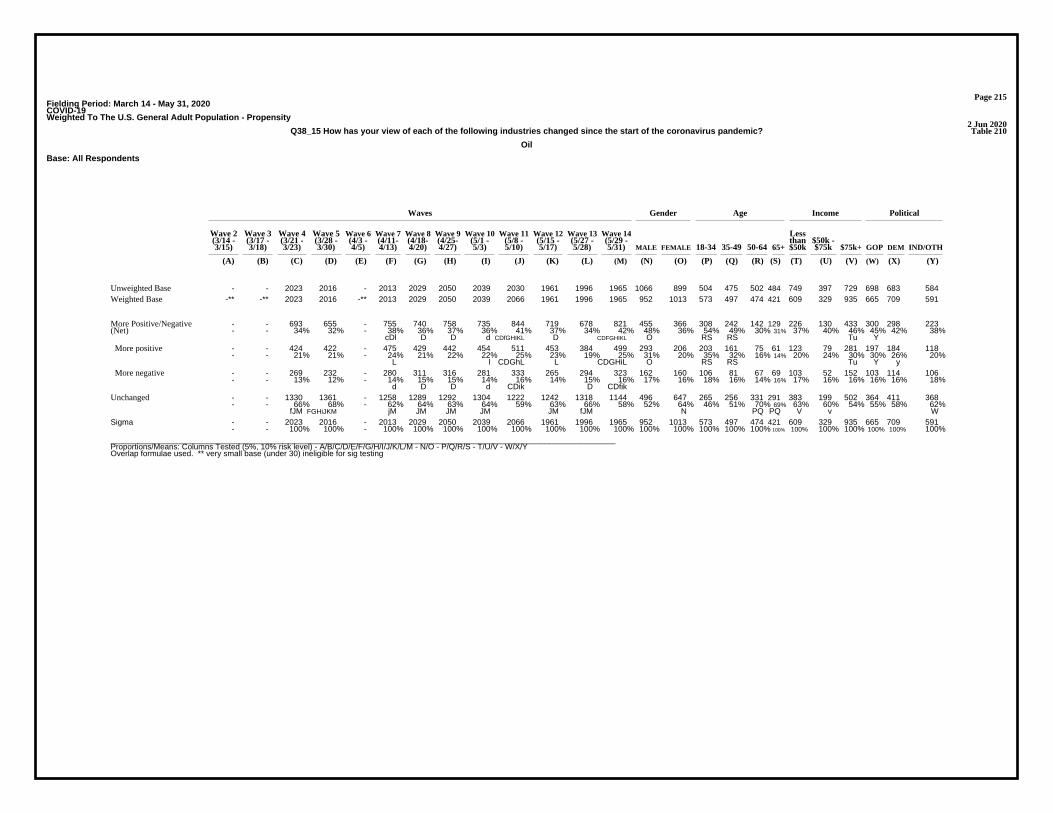
Page 215Fielding Period: March 14 - May 31, 2020COVID-19Weighted To The U.S. General Adult Population - Propensity
2 Jun 2020Table 210Q38_15 How has your view of each of the following industries changed since the start of the coronavirus pandemic?
Oil
Base: All Respondents
Waves Gender Age Income Political
Wave 2 Wave 3 Wave 4 Wave 5 Wave 6 Wave 7 Wave 8 Wave 9 Wave 10 Wave 11 Wave 12 Wave 13 Wave 14 Less(3/14 - (3/17 - (3/21 - (3/28 - (4/3 - (4/11- (4/18- (4/25- (5/1 - (5/8 - (5/15 - (5/27 - (5/29 - than $50k -3/15) 3/18) 3/23) 3/30) 4/5) 4/13) 4/20) 4/27) 5/3) 5/10) 5/17) 5/28) 5/31) MALE FEMALE 18-34 35-49 50-64 65+ $50k $75k $75k+ GOP DEM IND/OTH
(A) (B) (C) (D) (E) (F) (G) (H) (I) (J) (K) (L) (M) (N) (O) (P) (Q) (R) (S) (T) (U) (V) (W) (X) (Y)
- - 2023 2016 - 2013 2029 2050 2039 2030 1961 1996 1965 1066 899 504 475 502 484 749 397 729 698 683 584Unweighted Base-** -** 2023 2016 -** 2013 2029 2050 2039 2066 1961 1996 1965 952 1013 573 497 474 421 609 329 935 665 709 591Weighted Base
- - 693 655 - 755 740 758 735 844 719 678 821 455 366 308 242 142 129 226 130 433 300 298 223- - 34% 32% - 38% 36% 37% 36% 41% 37% 34% 42% 48% 36% 54% 49% 30% 31% 37% 40% 46% 45% 42% 38%
cDl D D d CDfGHIKL D CDFGHIKL O RS RS Tu Y
More Positive/Negative(Net)
- - 424 422 - 475 429 442 454 511 453 384 499 293 206 203 161 75 61 123 79 281 197 184 118- - 21% 21% - 24% 21% 22% 22% 25% 23% 19% 25% 31% 20% 35% 32% 16% 14% 20% 24% 30% 30% 26% 20%
L l CDGhL L CDGHiL O RS RS Tu Y y
More positive
- - 269 232 - 280 311 316 281 333 265 294 323 162 160 106 81 67 69 103 52 152 103 114 106- - 13% 12% - 14% 15% 15% 14% 16% 14% 15% 16% 17% 16% 18% 16% 14% 16% 17% 16% 16% 16% 16% 18%
d D D d CDik D CDfik
More negative
- - 1330 1361 - 1258 1289 1292 1304 1222 1242 1318 1144 496 647 265 256 331 291 383 199 502 364 411 368- - 66% 68% - 62% 64% 63% 64% 59% 63% 66% 58% 52% 64% 46% 51% 70% 69% 63% 60% 54% 55% 58% 62%
fJM FGHiJKM jM JM JM JM JM fJM N PQ PQ V v W
Unchanged
- - 2023 2016 - 2013 2029 2050 2039 2066 1961 1996 1965 952 1013 573 497 474 421 609 329 935 665 709 591- - 100% 100% - 100% 100% 100% 100% 100% 100% 100% 100% 100% 100% 100% 100% 100% 100% 100% 100% 100% 100% 100% 100%
Sigma
__________________________________________________________________________________________________________________Proportions/Means: Columns Tested (5%, 10% risk level) - A/B/C/D/E/F/G/H/I/J/K/L/M - N/O - P/Q/R/S - T/U/V - W/X/YOverlap formulae used. ** very small base (under 30) ineligible for sig testing

Page 216Fielding Period: March 14 - May 31, 2020COVID-19Weighted To The U.S. General Adult Population - Propensity
2 Jun 2020Table 211Q38_16 How has your view of each of the following industries changed since the start of the coronavirus pandemic?
Restaurants
Base: All Respondents
Waves Gender Age Income Political
Wave 2 Wave 3 Wave 4 Wave 5 Wave 6 Wave 7 Wave 8 Wave 9 Wave 10 Wave 11 Wave 12 Wave 13 Wave 14 Less(3/14 - (3/17 - (3/21 - (3/28 - (4/3 - (4/11- (4/18- (4/25- (5/1 - (5/8 - (5/15 - (5/27 - (5/29 - than $50k -3/15) 3/18) 3/23) 3/30) 4/5) 4/13) 4/20) 4/27) 5/3) 5/10) 5/17) 5/28) 5/31) MALE FEMALE 18-34 35-49 50-64 65+ $50k $75k $75k+ GOP DEM IND/OTH
(A) (B) (C) (D) (E) (F) (G) (H) (I) (J) (K) (L) (M) (N) (O) (P) (Q) (R) (S) (T) (U) (V) (W) (X) (Y)
- - 2023 2016 - 2013 2029 2050 2039 2030 1961 1996 1965 1066 899 504 475 502 484 749 397 729 698 683 584Unweighted Base-** -** 2023 2016 -** 2013 2029 2050 2039 2066 1961 1996 1965 952 1013 573 497 474 421 609 329 935 665 709 591Weighted Base
- - 1009 1062 - 1079 1053 1098 1068 1089 1027 1023 1076 538 538 359 282 233 202 294 179 559 384 409 282- - 50% 53% - 54% 52% 54% 52% 53% 52% 51% 55% 57% 53% 63% 57% 49% 48% 48% 54% 60% 58% 58% 48%
c c Cl RS rS T Y Y
More Positive/Negative(Net)
- - 612 757 - 819 766 758 780 724 699 702 755 376 379 243 190 172 149 184 131 410 280 300 174- - 30% 38% - 41% 38% 37% 38% 35% 36% 35% 38% 39% 37% 42% 38% 36% 35% 30% 40% 44% 42% 42% 29%
C ChJKL C C Cj C C C Cjl s T T Y Y
More positive
- - 398 305 - 260 287 341 288 365 328 321 321 162 159 116 92 61 53 110 48 150 104 109 109- - 20% 15% - 13% 14% 17% 14% 18% 17% 16% 16% 17% 16% 20% 18% 13% 12% 18% 15% 16% 16% 15% 18%
DFGHIkLM Fgi dFGI Fgi F F RS rs
More negative
- - 1014 954 - 934 976 952 971 977 934 973 889 413 476 215 215 240 219 315 150 376 281 300 309- - 50% 47% - 46% 48% 46% 48% 47% 48% 49% 45% 43% 47% 37% 43% 51% 52% 52% 46% 40% 42% 42% 52%
fhM m Pq PQ V WX
Unchanged
- - 2023 2016 - 2013 2029 2050 2039 2066 1961 1996 1965 952 1013 573 497 474 421 609 329 935 665 709 591- - 100% 100% - 100% 100% 100% 100% 100% 100% 100% 100% 100% 100% 100% 100% 100% 100% 100% 100% 100% 100% 100% 100%
Sigma
__________________________________________________________________________________________________________________Proportions/Means: Columns Tested (5%, 10% risk level) - A/B/C/D/E/F/G/H/I/J/K/L/M - N/O - P/Q/R/S - T/U/V - W/X/YOverlap formulae used. ** very small base (under 30) ineligible for sig testing

Page 217Fielding Period: March 14 - May 31, 2020COVID-19Weighted To The U.S. General Adult Population - Propensity
2 Jun 2020Table 212Q38_17 How has your view of each of the following industries changed since the start of the coronavirus pandemic?
Manufacturing
Base: All Respondents
Waves Gender Age Income Political
Wave 2 Wave 3 Wave 4 Wave 5 Wave 6 Wave 7 Wave 8 Wave 9 Wave 10 Wave 11 Wave 12 Wave 13 Wave 14 Less(3/14 - (3/17 - (3/21 - (3/28 - (4/3 - (4/11- (4/18- (4/25- (5/1 - (5/8 - (5/15 - (5/27 - (5/29 - than $50k -3/15) 3/18) 3/23) 3/30) 4/5) 4/13) 4/20) 4/27) 5/3) 5/10) 5/17) 5/28) 5/31) MALE FEMALE 18-34 35-49 50-64 65+ $50k $75k $75k+ GOP DEM IND/OTH
(A) (B) (C) (D) (E) (F) (G) (H) (I) (J) (K) (L) (M) (N) (O) (P) (Q) (R) (S) (T) (U) (V) (W) (X) (Y)
- - 2023 2016 - 2013 2029 2050 2039 2030 1961 1996 1965 1066 899 504 475 502 484 749 397 729 698 683 584Unweighted Base-** -** 2023 2016 -** 2013 2029 2050 2039 2066 1961 1996 1965 952 1013 573 497 474 421 609 329 935 665 709 591Weighted Base
- - 853 911 - 1007 884 898 905 950 835 861 921 482 438 314 269 181 157 255 148 485 346 330 245- - 42% 45% - 50% 44% 44% 44% 46% 43% 43% 47% 51% 43% 55% 54% 38% 37% 42% 45% 52% 52% 47% 41%
CDGHIJKL Ck CgKl O RS RS Tu Y
More Positive/Negative(Net)
- - 545 645 - 739 637 626 671 684 575 608 657 360 297 221 188 124 124 161 109 366 268 235 154- - 27% 32% - 37% 31% 31% 33% 33% 29% 30% 33% 38% 29% 39% 38% 26% 29% 26% 33% 39% 40% 33% 26%
C CDGHIjKLm C C Ck CK C CK O RS RS t T XY Y
More positive
- - 308 266 - 268 247 272 234 266 260 253 263 122 141 93 81 56 33 95 39 118 77 95 91- - 15% 13% - 13% 12% 13% 11% 13% 13% 13% 13% 13% 14% 16% 16% 12% 8% 16% 12% 13% 12% 13% 15%
GIjl S S s
More negative
- - 1170 1105 - 1006 1145 1152 1134 1116 1126 1135 1044 469 575 259 229 293 264 353 181 450 319 379 346- - 58% 55% - 50% 56% 56% 56% 54% 57% 57% 53% 49% 57% 45% 46% 62% 63% 58% 55% 48% 48% 53% 59%
FJM F Fm F F F FjM Fm N PQ PQ V v W
Unchanged
- - 2023 2016 - 2013 2029 2050 2039 2066 1961 1996 1965 952 1013 573 497 474 421 609 329 935 665 709 591- - 100% 100% - 100% 100% 100% 100% 100% 100% 100% 100% 100% 100% 100% 100% 100% 100% 100% 100% 100% 100% 100% 100%
Sigma
__________________________________________________________________________________________________________________Proportions/Means: Columns Tested (5%, 10% risk level) - A/B/C/D/E/F/G/H/I/J/K/L/M - N/O - P/Q/R/S - T/U/V - W/X/YOverlap formulae used. ** very small base (under 30) ineligible for sig testing

Page 218Fielding Period: March 14 - May 31, 2020COVID-19Weighted To The U.S. General Adult Population - Propensity
2 Jun 2020Table 213Q38_18 How has your view of each of the following industries changed since the start of the coronavirus pandemic?
Small Businesses
Base: All Respondents
Waves Gender Age Income Political
Wave 2 Wave 3 Wave 4 Wave 5 Wave 6 Wave 7 Wave 8 Wave 9 Wave 10 Wave 11 Wave 12 Wave 13 Wave 14 Less(3/14 - (3/17 - (3/21 - (3/28 - (4/3 - (4/11- (4/18- (4/25- (5/1 - (5/8 - (5/15 - (5/27 - (5/29 - than $50k -3/15) 3/18) 3/23) 3/30) 4/5) 4/13) 4/20) 4/27) 5/3) 5/10) 5/17) 5/28) 5/31) MALE FEMALE 18-34 35-49 50-64 65+ $50k $75k $75k+ GOP DEM IND/OTH
(A) (B) (C) (D) (E) (F) (G) (H) (I) (J) (K) (L) (M) (N) (O) (P) (Q) (R) (S) (T) (U) (V) (W) (X) (Y)
- - 2023 2016 - 2013 2029 2050 2039 2030 1961 1996 1965 1066 899 504 475 502 484 749 397 729 698 683 584Unweighted Base-** -** 2023 2016 -** 2013 2029 2050 2039 2066 1961 1996 1965 952 1013 573 497 474 421 609 329 935 665 709 591Weighted Base
- - 1038 1070 - 1152 1102 1147 1100 1096 995 1091 1083 546 538 378 276 232 197 296 175 574 377 407 299- - 51% 53% - 57% 54% 56% 54% 53% 51% 55% 55% 57% 53% 66% 55% 49% 47% 49% 53% 61% 57% 57% 51%
CDiJK k CK ck cK QRS S TU y y
More Positive/Negative(Net)
- - 752 826 - 904 883 921 858 863 767 849 839 427 412 294 194 182 170 208 151 452 300 318 221- - 37% 41% - 45% 44% 45% 42% 42% 39% 43% 43% 45% 41% 51% 39% 38% 40% 34% 46% 48% 45% 45% 37%
c CdK CK CDK C C Ck Ck QRS T T Y Y
More positive
- - 287 244 - 248 219 226 242 233 227 242 244 118 125 84 82 50 28 88 24 123 77 89 78- - 14% 12% - 12% 11% 11% 12% 11% 12% 12% 12% 12% 12% 15% 16% 11% 7% 14% 7% 13% 12% 12% 13%
GHiJk S RS s U U
More negative
- - 985 946 - 861 927 903 939 970 966 905 882 406 476 195 222 242 224 313 154 361 287 302 292- - 49% 47% - 43% 46% 44% 46% 47% 49% 45% 45% 43% 47% 34% 45% 51% 53% 51% 47% 39% 43% 43% 49%
FHlm F f F FgHlM P P PQ V V wx
Unchanged
- - 2023 2016 - 2013 2029 2050 2039 2066 1961 1996 1965 952 1013 573 497 474 421 609 329 935 665 709 591- - 100% 100% - 100% 100% 100% 100% 100% 100% 100% 100% 100% 100% 100% 100% 100% 100% 100% 100% 100% 100% 100% 100%
Sigma
__________________________________________________________________________________________________________________Proportions/Means: Columns Tested (5%, 10% risk level) - A/B/C/D/E/F/G/H/I/J/K/L/M - N/O - P/Q/R/S - T/U/V - W/X/YOverlap formulae used. ** very small base (under 30) ineligible for sig testing

Page 219Fielding Period: March 14 - May 31, 2020COVID-19Weighted To The U.S. General Adult Population - Propensity
2 Jun 2020Table 214Q38_19 How has your view of each of the following industries changed since the start of the coronavirus pandemic?
Telecommunications
Base: All Respondents
Waves Gender Age Income Political
Wave 2 Wave 3 Wave 4 Wave 5 Wave 6 Wave 7 Wave 8 Wave 9 Wave 10 Wave 11 Wave 12 Wave 13 Wave 14 Less(3/14 - (3/17 - (3/21 - (3/28 - (4/3 - (4/11- (4/18- (4/25- (5/1 - (5/8 - (5/15 - (5/27 - (5/29 - than $50k -3/15) 3/18) 3/23) 3/30) 4/5) 4/13) 4/20) 4/27) 5/3) 5/10) 5/17) 5/28) 5/31) MALE FEMALE 18-34 35-49 50-64 65+ $50k $75k $75k+ GOP DEM IND/OTH
(A) (B) (C) (D) (E) (F) (G) (H) (I) (J) (K) (L) (M) (N) (O) (P) (Q) (R) (S) (T) (U) (V) (W) (X) (Y)
- - - - - - - 2050 2039 2030 1961 1996 1965 1066 899 504 475 502 484 749 397 729 698 683 584Unweighted Base-** -** -** -** -** -** -** 2050 2039 2066 1961 1996 1965 952 1013 573 497 474 421 609 329 935 665 709 591Weighted Base
- - - - - - - 893 851 906 815 796 890 483 406 319 265 186 119 247 138 473 298 358 234- - - - - - - 44% 42% 44% 42% 40% 45% 51% 40% 56% 53% 39% 28% 41% 42% 51% 45% 50% 40%
l L ikL O RS RS S TU Y
More Positive/Negative(Net)
- - - - - - - 679 688 674 652 605 667 361 306 234 208 134 91 165 115 364 217 283 167- - - - - - - 33% 34% 33% 33% 30% 34% 38% 30% 41% 42% 28% 22% 27% 35% 39% 33% 40% 28%
l l O RS RS s T T WY
More positive
- - - - - - - 215 164 232 163 191 222 122 100 85 57 52 28 82 24 109 81 74 67- - - - - - - 10% 8% 11% 8% 10% 11% 13% 10% 15% 11% 11% 7% 14% 7% 12% 12% 10% 11%
Ik IK IK S S s U u
More negative
- - - - - - - 1157 1188 1160 1146 1200 1075 468 607 254 233 287 302 362 191 462 366 352 357- - - - - - - 56% 58% 56% 58% 60% 55% 49% 60% 44% 47% 61% 72% 59% 58% 49% 55% 50% 60%
m m hJM N PQ PQR V V X
Unchanged
- - - - - - - 2050 2039 2066 1961 1996 1965 952 1013 573 497 474 421 609 329 935 665 709 591- - - - - - - 100% 100% 100% 100% 100% 100% 100% 100% 100% 100% 100% 100% 100% 100% 100% 100% 100% 100%
Sigma
__________________________________________________________________________________________________________________Proportions/Means: Columns Tested (5%, 10% risk level) - A/B/C/D/E/F/G/H/I/J/K/L/M - N/O - P/Q/R/S - T/U/V - W/X/YOverlap formulae used. ** very small base (under 30) ineligible for sig testing

Page 220Fielding Period: March 14 - May 31, 2020COVID-19Weighted To The U.S. General Adult Population - Propensity
2 Jun 2020Table 215Q38_20 How has your view of each of the following industries changed since the start of the coronavirus pandemic?
Retail - apparel
Base: All Respondents
Waves Gender Age Income Political
Wave 2 Wave 3 Wave 4 Wave 5 Wave 6 Wave 7 Wave 8 Wave 9 Wave 10 Wave 11 Wave 12 Wave 13 Wave 14 Less(3/14 - (3/17 - (3/21 - (3/28 - (4/3 - (4/11- (4/18- (4/25- (5/1 - (5/8 - (5/15 - (5/27 - (5/29 - than $50k -3/15) 3/18) 3/23) 3/30) 4/5) 4/13) 4/20) 4/27) 5/3) 5/10) 5/17) 5/28) 5/31) MALE FEMALE 18-34 35-49 50-64 65+ $50k $75k $75k+ GOP DEM IND/OTH
(A) (B) (C) (D) (E) (F) (G) (H) (I) (J) (K) (L) (M) (N) (O) (P) (Q) (R) (S) (T) (U) (V) (W) (X) (Y)
- - - - - - - - 2039 2030 1961 1996 1965 1066 899 504 475 502 484 749 397 729 698 683 584Unweighted Base-** -** -** -** -** -** -** -** 2039 2066 1961 1996 1965 952 1013 573 497 474 421 609 329 935 665 709 591Weighted Base
- - - - - - - - 702 830 726 702 803 417 386 312 241 149 101 227 117 430 283 330 190- - - - - - - - 34% 40% 37% 35% 41% 44% 38% 54% 48% 31% 24% 37% 36% 46% 43% 47% 32%
IL IkL O RS RS S TU Y Y
More Positive/Negative(Net)
- - - - - - - - 459 546 477 457 531 277 253 214 156 96 65 138 89 288 194 233 104- - - - - - - - 23% 26% 24% 23% 27% 29% 25% 37% 31% 20% 15% 23% 27% 31% 29% 33% 18%
IL IL RS RS T Y Y
More positive
- - - - - - - - 243 284 249 245 272 139 133 98 85 53 36 89 28 142 88 97 86- - - - - - - - 12% 14% 13% 12% 14% 15% 13% 17% 17% 11% 9% 15% 9% 15% 13% 14% 15%
RS RS U U
More negative
- - - - - - - - 1337 1236 1235 1294 1162 535 627 261 256 325 320 382 212 504 382 379 401- - - - - - - - 66% 60% 63% 65% 59% 56% 62% 46% 52% 69% 76% 63% 64% 54% 57% 53% 68%
JM m JM N PQ PQR V V WX
Unchanged
- - - - - - - - 2039 2066 1961 1996 1965 952 1013 573 497 474 421 609 329 935 665 709 591- - - - - - - - 100% 100% 100% 100% 100% 100% 100% 100% 100% 100% 100% 100% 100% 100% 100% 100% 100%
Sigma
__________________________________________________________________________________________________________________Proportions/Means: Columns Tested (5%, 10% risk level) - A/B/C/D/E/F/G/H/I/J/K/L/M - N/O - P/Q/R/S - T/U/V - W/X/YOverlap formulae used. ** very small base (under 30) ineligible for sig testing

Page 221Fielding Period: March 14 - May 31, 2020COVID-19Weighted To The U.S. General Adult Population - Propensity
2 Jun 2020Table 216Q38_21 How has your view of each of the following industries changed since the start of the coronavirus pandemic?
Energy and Utilities
Base: All Respondents
Waves Gender Age Income Political
Wave 2 Wave 3 Wave 4 Wave 5 Wave 6 Wave 7 Wave 8 Wave 9 Wave 10 Wave 11 Wave 12 Wave 13 Wave 14 Less(3/14 - (3/17 - (3/21 - (3/28 - (4/3 - (4/11- (4/18- (4/25- (5/1 - (5/8 - (5/15 - (5/27 - (5/29 - than $50k -3/15) 3/18) 3/23) 3/30) 4/5) 4/13) 4/20) 4/27) 5/3) 5/10) 5/17) 5/28) 5/31) MALE FEMALE 18-34 35-49 50-64 65+ $50k $75k $75k+ GOP DEM IND/OTH
(A) (B) (C) (D) (E) (F) (G) (H) (I) (J) (K) (L) (M) (N) (O) (P) (Q) (R) (S) (T) (U) (V) (W) (X) (Y)
- - - - - - - - - - 1961 1996 1965 1066 899 504 475 502 484 749 397 729 698 683 584Unweighted Base-** -** -** -** -** -** -** -** -** -** 1961 1996 1965 952 1013 573 497 474 421 609 329 935 665 709 591Weighted Base
- - - - - - - - - - 772 770 870 451 419 312 269 164 125 250 139 451 313 335 221- - - - - - - - - - 39% 39% 44% 47% 41% 54% 54% 35% 30% 41% 42% 48% 47% 47% 37%
KL O RS RS T Y Y
More Positive/Negative(Net)
- - - - - - - - - - 598 517 618 313 305 209 206 111 92 168 106 319 237 253 128- - - - - - - - - - 30% 26% 31% 33% 30% 36% 41% 23% 22% 28% 32% 34% 36% 36% 22%
L L RS RS T Y Y
More positive
- - - - - - - - - - 174 253 252 138 114 103 63 53 33 82 32 131 77 82 93- - - - - - - - - - 9% 13% 13% 15% 11% 18% 13% 11% 8% 13% 10% 14% 12% 12% 16%
K K o qRS s w
More negative
- - - - - - - - - - 1189 1226 1095 500 595 261 229 310 295 359 190 484 351 374 370- - - - - - - - - - 61% 61% 56% 53% 59% 46% 46% 65% 70% 59% 58% 52% 53% 53% 63%
M M N PQ PQ V WX
Unchanged
- - - - - - - - - - 1961 1996 1965 952 1013 573 497 474 421 609 329 935 665 709 591- - - - - - - - - - 100% 100% 100% 100% 100% 100% 100% 100% 100% 100% 100% 100% 100% 100% 100%
Sigma
__________________________________________________________________________________________________________________Proportions/Means: Columns Tested (5%, 10% risk level) - A/B/C/D/E/F/G/H/I/J/K/L/M - N/O - P/Q/R/S - T/U/V - W/X/YOverlap formulae used. ** very small base (under 30) ineligible for sig testing
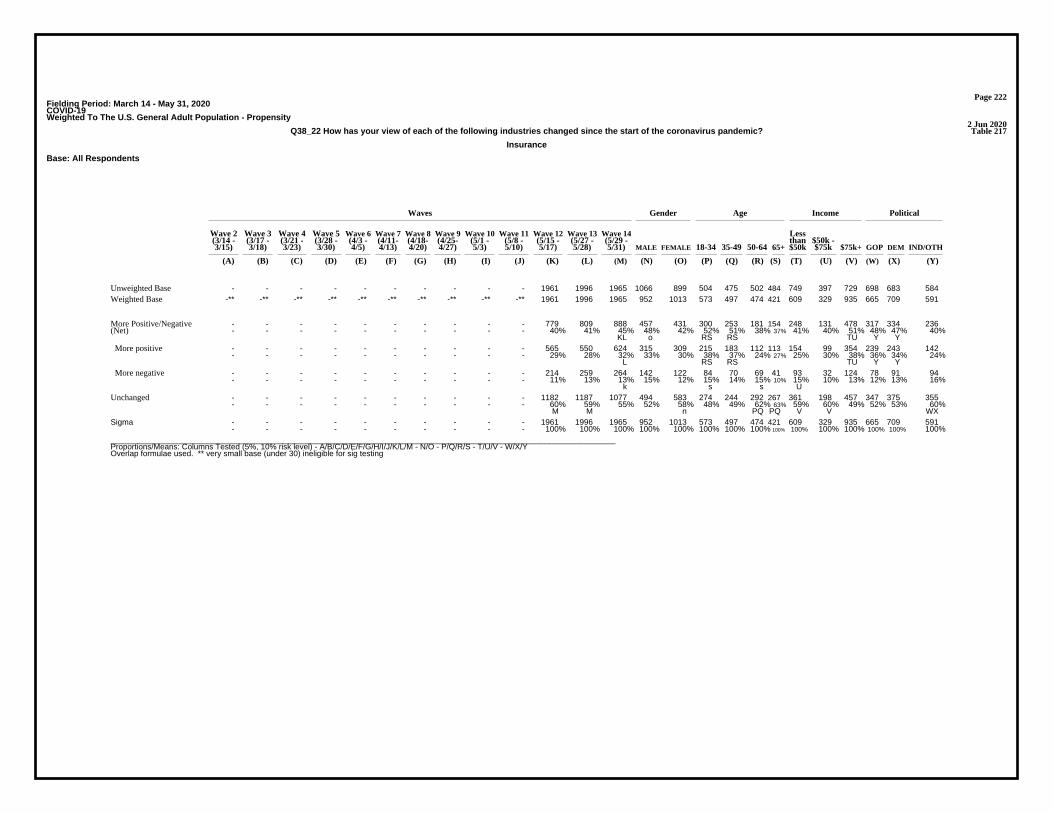
Page 222Fielding Period: March 14 - May 31, 2020COVID-19Weighted To The U.S. General Adult Population - Propensity
2 Jun 2020Table 217Q38_22 How has your view of each of the following industries changed since the start of the coronavirus pandemic?
Insurance
Base: All Respondents
Waves Gender Age Income Political
Wave 2 Wave 3 Wave 4 Wave 5 Wave 6 Wave 7 Wave 8 Wave 9 Wave 10 Wave 11 Wave 12 Wave 13 Wave 14 Less(3/14 - (3/17 - (3/21 - (3/28 - (4/3 - (4/11- (4/18- (4/25- (5/1 - (5/8 - (5/15 - (5/27 - (5/29 - than $50k -3/15) 3/18) 3/23) 3/30) 4/5) 4/13) 4/20) 4/27) 5/3) 5/10) 5/17) 5/28) 5/31) MALE FEMALE 18-34 35-49 50-64 65+ $50k $75k $75k+ GOP DEM IND/OTH
(A) (B) (C) (D) (E) (F) (G) (H) (I) (J) (K) (L) (M) (N) (O) (P) (Q) (R) (S) (T) (U) (V) (W) (X) (Y)
- - - - - - - - - - 1961 1996 1965 1066 899 504 475 502 484 749 397 729 698 683 584Unweighted Base-** -** -** -** -** -** -** -** -** -** 1961 1996 1965 952 1013 573 497 474 421 609 329 935 665 709 591Weighted Base
- - - - - - - - - - 779 809 888 457 431 300 253 181 154 248 131 478 317 334 236- - - - - - - - - - 40% 41% 45% 48% 42% 52% 51% 38% 37% 41% 40% 51% 48% 47% 40%
KL o RS RS TU Y Y
More Positive/Negative(Net)
- - - - - - - - - - 565 550 624 315 309 215 183 112 113 154 99 354 239 243 142- - - - - - - - - - 29% 28% 32% 33% 30% 38% 37% 24% 27% 25% 30% 38% 36% 34% 24%
L RS RS TU Y Y
More positive
- - - - - - - - - - 214 259 264 142 122 84 70 69 41 93 32 124 78 91 94- - - - - - - - - - 11% 13% 13% 15% 12% 15% 14% 15% 10% 15% 10% 13% 12% 13% 16%
k s s U
More negative
- - - - - - - - - - 1182 1187 1077 494 583 274 244 292 267 361 198 457 347 375 355- - - - - - - - - - 60% 59% 55% 52% 58% 48% 49% 62% 63% 59% 60% 49% 52% 53% 60%
M M n PQ PQ V V WX
Unchanged
- - - - - - - - - - 1961 1996 1965 952 1013 573 497 474 421 609 329 935 665 709 591- - - - - - - - - - 100% 100% 100% 100% 100% 100% 100% 100% 100% 100% 100% 100% 100% 100% 100%
Sigma
__________________________________________________________________________________________________________________Proportions/Means: Columns Tested (5%, 10% risk level) - A/B/C/D/E/F/G/H/I/J/K/L/M - N/O - P/Q/R/S - T/U/V - W/X/YOverlap formulae used. ** very small base (under 30) ineligible for sig testing
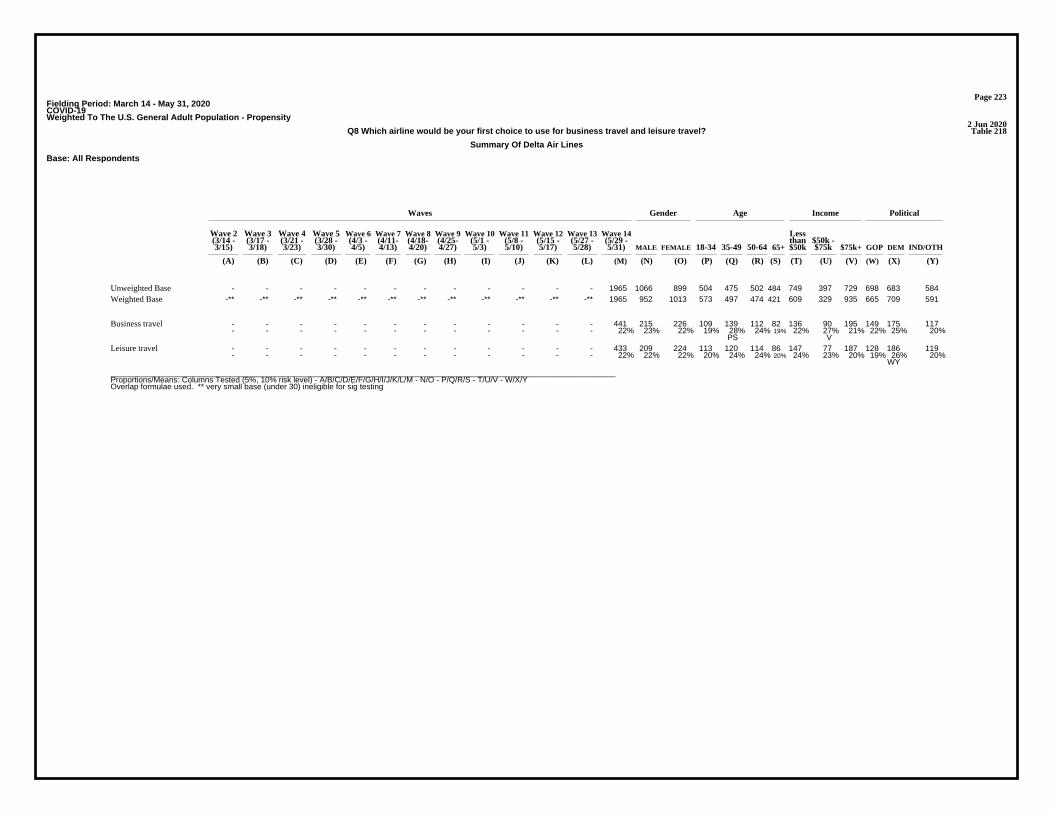
Page 223Fielding Period: March 14 - May 31, 2020COVID-19Weighted To The U.S. General Adult Population - Propensity
2 Jun 2020Table 218Q8 Which airline would be your first choice to use for business travel and leisure travel?
Summary Of Delta Air Lines
Base: All Respondents
Waves Gender Age Income Political
Wave 2 Wave 3 Wave 4 Wave 5 Wave 6 Wave 7 Wave 8 Wave 9 Wave 10 Wave 11 Wave 12 Wave 13 Wave 14 Less(3/14 - (3/17 - (3/21 - (3/28 - (4/3 - (4/11- (4/18- (4/25- (5/1 - (5/8 - (5/15 - (5/27 - (5/29 - than $50k -3/15) 3/18) 3/23) 3/30) 4/5) 4/13) 4/20) 4/27) 5/3) 5/10) 5/17) 5/28) 5/31) MALE FEMALE 18-34 35-49 50-64 65+ $50k $75k $75k+ GOP DEM IND/OTH
(A) (B) (C) (D) (E) (F) (G) (H) (I) (J) (K) (L) (M) (N) (O) (P) (Q) (R) (S) (T) (U) (V) (W) (X) (Y)
- - - - - - - - - - - - 1965 1066 899 504 475 502 484 749 397 729 698 683 584Unweighted Base-** -** -** -** -** -** -** -** -** -** -** -** 1965 952 1013 573 497 474 421 609 329 935 665 709 591Weighted Base
- - - - - - - - - - - - 441 215 226 109 139 112 82 136 90 195 149 175 117- - - - - - - - - - - - 22% 23% 22% 19% 28% 24% 19% 22% 27% 21% 22% 25% 20%
PS V
Business travel
- - - - - - - - - - - - 433 209 224 113 120 114 86 147 77 187 128 186 119- - - - - - - - - - - - 22% 22% 22% 20% 24% 24% 20% 24% 23% 20% 19% 26% 20%
WY
Leisure travel
__________________________________________________________________________________________________________________Proportions/Means: Columns Tested (5%, 10% risk level) - A/B/C/D/E/F/G/H/I/J/K/L/M - N/O - P/Q/R/S - T/U/V - W/X/YOverlap formulae used. ** very small base (under 30) ineligible for sig testing

Page 224Fielding Period: March 14 - May 31, 2020COVID-19Weighted To The U.S. General Adult Population - Propensity
2 Jun 2020Table 219Q8 Which airline would be your first choice to use for business travel and leisure travel?
Summary Of American Airlines
Base: All Respondents
Waves Gender Age Income Political
Wave 2 Wave 3 Wave 4 Wave 5 Wave 6 Wave 7 Wave 8 Wave 9 Wave 10 Wave 11 Wave 12 Wave 13 Wave 14 Less(3/14 - (3/17 - (3/21 - (3/28 - (4/3 - (4/11- (4/18- (4/25- (5/1 - (5/8 - (5/15 - (5/27 - (5/29 - than $50k -3/15) 3/18) 3/23) 3/30) 4/5) 4/13) 4/20) 4/27) 5/3) 5/10) 5/17) 5/28) 5/31) MALE FEMALE 18-34 35-49 50-64 65+ $50k $75k $75k+ GOP DEM IND/OTH
(A) (B) (C) (D) (E) (F) (G) (H) (I) (J) (K) (L) (M) (N) (O) (P) (Q) (R) (S) (T) (U) (V) (W) (X) (Y)
- - - - - - - - - - - - 1965 1066 899 504 475 502 484 749 397 729 698 683 584Unweighted Base-** -** -** -** -** -** -** -** -** -** -** -** 1965 952 1013 573 497 474 421 609 329 935 665 709 591Weighted Base
- - - - - - - - - - - - 425 196 229 135 125 94 71 133 70 207 166 142 117- - - - - - - - - - - - 22% 21% 23% 23% 25% 20% 17% 22% 21% 22% 25% 20% 20%
S S xy
Business travel
- - - - - - - - - - - - 422 195 226 137 124 94 67 135 58 212 168 156 98- - - - - - - - - - - - 21% 21% 22% 24% 25% 20% 16% 22% 17% 23% 25% 22% 17%
S S Y y
Leisure travel
__________________________________________________________________________________________________________________Proportions/Means: Columns Tested (5%, 10% risk level) - A/B/C/D/E/F/G/H/I/J/K/L/M - N/O - P/Q/R/S - T/U/V - W/X/YOverlap formulae used. ** very small base (under 30) ineligible for sig testing

Page 225Fielding Period: March 14 - May 31, 2020COVID-19Weighted To The U.S. General Adult Population - Propensity
2 Jun 2020Table 220Q8 Which airline would be your first choice to use for business travel and leisure travel?
Summary Of United Airlines
Base: All Respondents
Waves Gender Age Income Political
Wave 2 Wave 3 Wave 4 Wave 5 Wave 6 Wave 7 Wave 8 Wave 9 Wave 10 Wave 11 Wave 12 Wave 13 Wave 14 Less(3/14 - (3/17 - (3/21 - (3/28 - (4/3 - (4/11- (4/18- (4/25- (5/1 - (5/8 - (5/15 - (5/27 - (5/29 - than $50k -3/15) 3/18) 3/23) 3/30) 4/5) 4/13) 4/20) 4/27) 5/3) 5/10) 5/17) 5/28) 5/31) MALE FEMALE 18-34 35-49 50-64 65+ $50k $75k $75k+ GOP DEM IND/OTH
(A) (B) (C) (D) (E) (F) (G) (H) (I) (J) (K) (L) (M) (N) (O) (P) (Q) (R) (S) (T) (U) (V) (W) (X) (Y)
- - - - - - - - - - - - 1965 1066 899 504 475 502 484 749 397 729 698 683 584Unweighted Base-** -** -** -** -** -** -** -** -** -** -** -** 1965 952 1013 573 497 474 421 609 329 935 665 709 591Weighted Base
- - - - - - - - - - - - 420 212 208 163 96 79 82 146 55 206 129 172 120- - - - - - - - - - - - 21% 22% 20% 28% 19% 17% 19% 24% 17% 22% 19% 24% 20%
QRS U w
Business travel
- - - - - - - - - - - - 373 175 198 134 98 72 69 123 56 183 129 128 116- - - - - - - - - - - - 19% 18% 20% 23% 20% 15% 16% 20% 17% 20% 19% 18% 20%
RS
Leisure travel
__________________________________________________________________________________________________________________Proportions/Means: Columns Tested (5%, 10% risk level) - A/B/C/D/E/F/G/H/I/J/K/L/M - N/O - P/Q/R/S - T/U/V - W/X/YOverlap formulae used. ** very small base (under 30) ineligible for sig testing

Page 226Fielding Period: March 14 - May 31, 2020COVID-19Weighted To The U.S. General Adult Population - Propensity
2 Jun 2020Table 221Q8 Which airline would be your first choice to use for business travel and leisure travel?
Summary Of Southwest Airlines
Base: All Respondents
Waves Gender Age Income Political
Wave 2 Wave 3 Wave 4 Wave 5 Wave 6 Wave 7 Wave 8 Wave 9 Wave 10 Wave 11 Wave 12 Wave 13 Wave 14 Less(3/14 - (3/17 - (3/21 - (3/28 - (4/3 - (4/11- (4/18- (4/25- (5/1 - (5/8 - (5/15 - (5/27 - (5/29 - than $50k -3/15) 3/18) 3/23) 3/30) 4/5) 4/13) 4/20) 4/27) 5/3) 5/10) 5/17) 5/28) 5/31) MALE FEMALE 18-34 35-49 50-64 65+ $50k $75k $75k+ GOP DEM IND/OTH
(A) (B) (C) (D) (E) (F) (G) (H) (I) (J) (K) (L) (M) (N) (O) (P) (Q) (R) (S) (T) (U) (V) (W) (X) (Y)
- - - - - - - - - - - - 1965 1066 899 504 475 502 484 749 397 729 698 683 584Unweighted Base-** -** -** -** -** -** -** -** -** -** -** -** 1965 952 1013 573 497 474 421 609 329 935 665 709 591Weighted Base
- - - - - - - - - - - - 484 251 233 108 105 133 138 135 101 221 167 162 155- - - - - - - - - - - - 25% 26% 23% 19% 21% 28% 33% 22% 31% 24% 25% 23% 26%
PQ PQ TV
Leisure travel
- - - - - - - - - - - - 442 211 231 106 86 130 119 132 80 201 158 144 141- - - - - - - - - - - - 22% 22% 23% 19% 17% 27% 28% 22% 24% 22% 24% 20% 24%
PQ PQ
Business travel
__________________________________________________________________________________________________________________Proportions/Means: Columns Tested (5%, 10% risk level) - A/B/C/D/E/F/G/H/I/J/K/L/M - N/O - P/Q/R/S - T/U/V - W/X/YOverlap formulae used. ** very small base (under 30) ineligible for sig testing

Page 227Fielding Period: March 14 - May 31, 2020COVID-19Weighted To The U.S. General Adult Population - Propensity
2 Jun 2020Table 222Q8 Which airline would be your first choice to use for business travel and leisure travel?
Summary Of Jetblue Airways
Base: All Respondents
Waves Gender Age Income Political
Wave 2 Wave 3 Wave 4 Wave 5 Wave 6 Wave 7 Wave 8 Wave 9 Wave 10 Wave 11 Wave 12 Wave 13 Wave 14 Less(3/14 - (3/17 - (3/21 - (3/28 - (4/3 - (4/11- (4/18- (4/25- (5/1 - (5/8 - (5/15 - (5/27 - (5/29 - than $50k -3/15) 3/18) 3/23) 3/30) 4/5) 4/13) 4/20) 4/27) 5/3) 5/10) 5/17) 5/28) 5/31) MALE FEMALE 18-34 35-49 50-64 65+ $50k $75k $75k+ GOP DEM IND/OTH
(A) (B) (C) (D) (E) (F) (G) (H) (I) (J) (K) (L) (M) (N) (O) (P) (Q) (R) (S) (T) (U) (V) (W) (X) (Y)
- - - - - - - - - - - - 1965 1066 899 504 475 502 484 749 397 729 698 683 584Unweighted Base-** -** -** -** -** -** -** -** -** -** -** -** 1965 952 1013 573 497 474 421 609 329 935 665 709 591Weighted Base
- - - - - - - - - - - - 162 71 90 48 36 38 40 48 23 85 54 53 55- - - - - - - - - - - - 8% 7% 9% 8% 7% 8% 10% 8% 7% 9% 8% 8% 9%
Leisure travel
- - - - - - - - - - - - 140 65 76 33 30 37 40 41 19 70 40 48 52- - - - - - - - - - - - 7% 7% 7% 6% 6% 8% 10% 7% 6% 8% 6% 7% 9%
p
Business travel
__________________________________________________________________________________________________________________Proportions/Means: Columns Tested (5%, 10% risk level) - A/B/C/D/E/F/G/H/I/J/K/L/M - N/O - P/Q/R/S - T/U/V - W/X/YOverlap formulae used. ** very small base (under 30) ineligible for sig testing
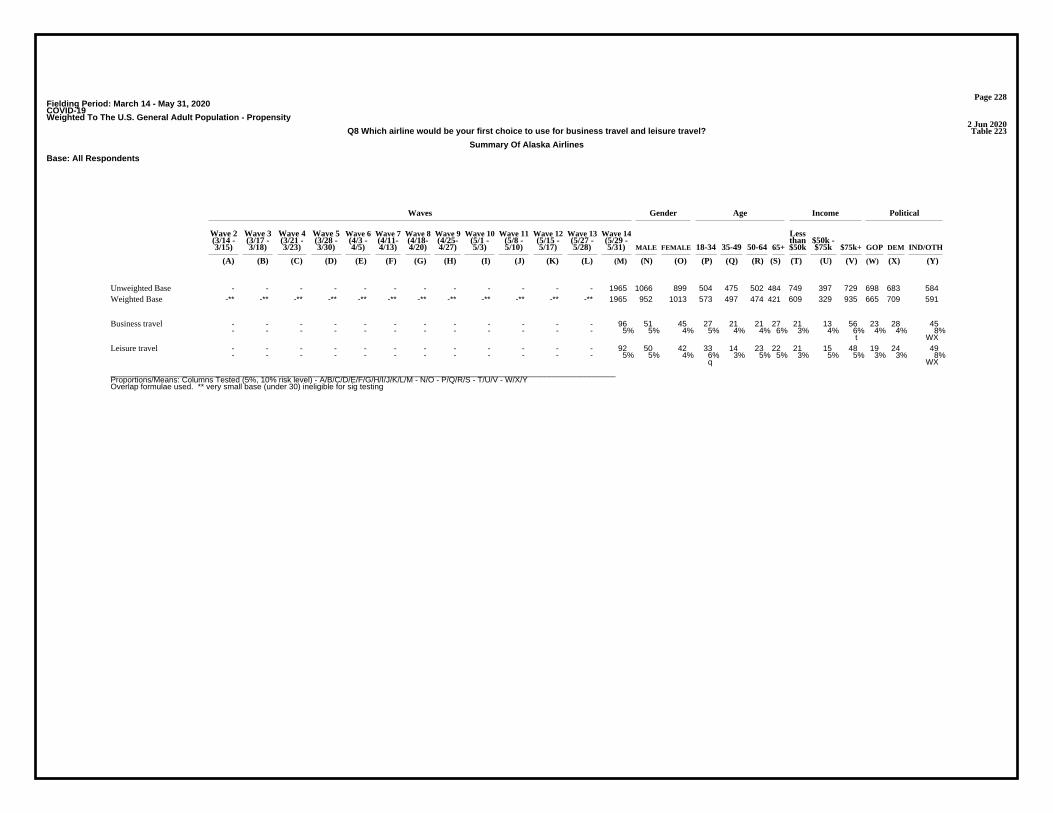
Page 228Fielding Period: March 14 - May 31, 2020COVID-19Weighted To The U.S. General Adult Population - Propensity
2 Jun 2020Table 223Q8 Which airline would be your first choice to use for business travel and leisure travel?
Summary Of Alaska Airlines
Base: All Respondents
Waves Gender Age Income Political
Wave 2 Wave 3 Wave 4 Wave 5 Wave 6 Wave 7 Wave 8 Wave 9 Wave 10 Wave 11 Wave 12 Wave 13 Wave 14 Less(3/14 - (3/17 - (3/21 - (3/28 - (4/3 - (4/11- (4/18- (4/25- (5/1 - (5/8 - (5/15 - (5/27 - (5/29 - than $50k -3/15) 3/18) 3/23) 3/30) 4/5) 4/13) 4/20) 4/27) 5/3) 5/10) 5/17) 5/28) 5/31) MALE FEMALE 18-34 35-49 50-64 65+ $50k $75k $75k+ GOP DEM IND/OTH
(A) (B) (C) (D) (E) (F) (G) (H) (I) (J) (K) (L) (M) (N) (O) (P) (Q) (R) (S) (T) (U) (V) (W) (X) (Y)
- - - - - - - - - - - - 1965 1066 899 504 475 502 484 749 397 729 698 683 584Unweighted Base-** -** -** -** -** -** -** -** -** -** -** -** 1965 952 1013 573 497 474 421 609 329 935 665 709 591Weighted Base
- - - - - - - - - - - - 96 51 45 27 21 21 27 21 13 56 23 28 45- - - - - - - - - - - - 5% 5% 4% 5% 4% 4% 6% 3% 4% 6% 4% 4% 8%
t WX
Business travel
- - - - - - - - - - - - 92 50 42 33 14 23 22 21 15 48 19 24 49- - - - - - - - - - - - 5% 5% 4% 6% 3% 5% 5% 3% 5% 5% 3% 3% 8%
q WX
Leisure travel
__________________________________________________________________________________________________________________Proportions/Means: Columns Tested (5%, 10% risk level) - A/B/C/D/E/F/G/H/I/J/K/L/M - N/O - P/Q/R/S - T/U/V - W/X/YOverlap formulae used. ** very small base (under 30) ineligible for sig testing
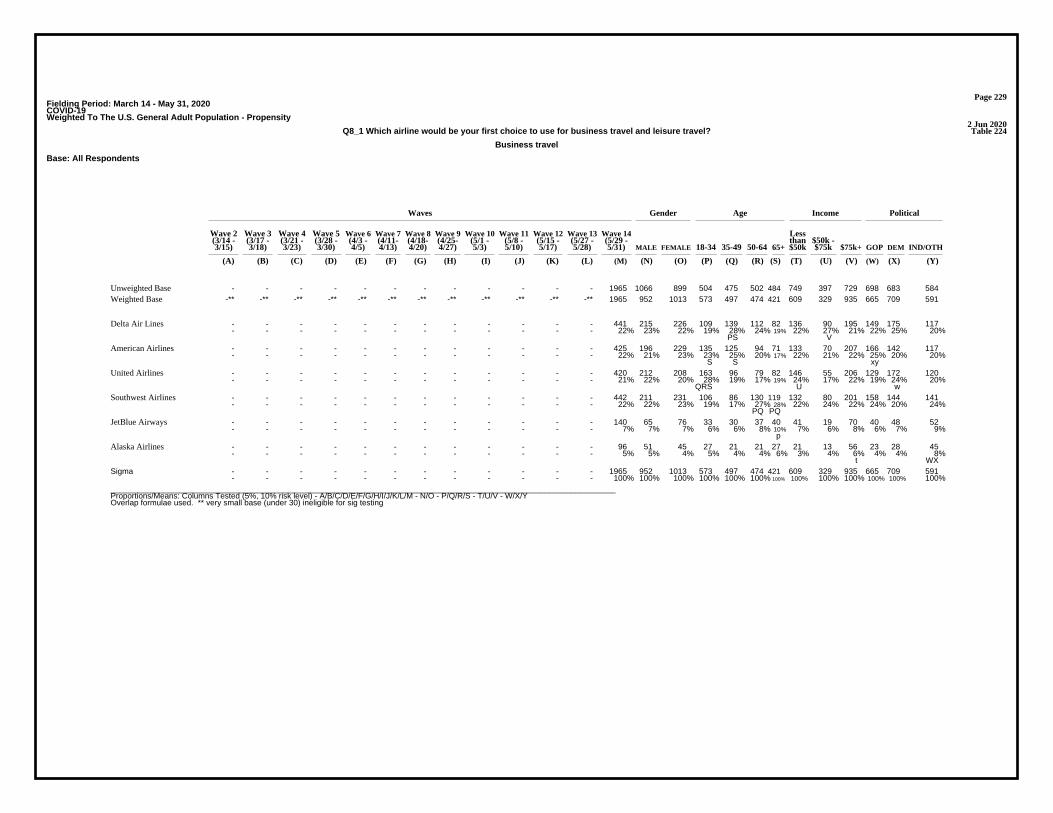
Page 229Fielding Period: March 14 - May 31, 2020COVID-19Weighted To The U.S. General Adult Population - Propensity
2 Jun 2020Table 224Q8_1 Which airline would be your first choice to use for business travel and leisure travel?
Business travel
Base: All Respondents
Waves Gender Age Income Political
Wave 2 Wave 3 Wave 4 Wave 5 Wave 6 Wave 7 Wave 8 Wave 9 Wave 10 Wave 11 Wave 12 Wave 13 Wave 14 Less(3/14 - (3/17 - (3/21 - (3/28 - (4/3 - (4/11- (4/18- (4/25- (5/1 - (5/8 - (5/15 - (5/27 - (5/29 - than $50k -3/15) 3/18) 3/23) 3/30) 4/5) 4/13) 4/20) 4/27) 5/3) 5/10) 5/17) 5/28) 5/31) MALE FEMALE 18-34 35-49 50-64 65+ $50k $75k $75k+ GOP DEM IND/OTH
(A) (B) (C) (D) (E) (F) (G) (H) (I) (J) (K) (L) (M) (N) (O) (P) (Q) (R) (S) (T) (U) (V) (W) (X) (Y)
- - - - - - - - - - - - 1965 1066 899 504 475 502 484 749 397 729 698 683 584Unweighted Base-** -** -** -** -** -** -** -** -** -** -** -** 1965 952 1013 573 497 474 421 609 329 935 665 709 591Weighted Base
- - - - - - - - - - - - 441 215 226 109 139 112 82 136 90 195 149 175 117- - - - - - - - - - - - 22% 23% 22% 19% 28% 24% 19% 22% 27% 21% 22% 25% 20%
PS V
Delta Air Lines
- - - - - - - - - - - - 425 196 229 135 125 94 71 133 70 207 166 142 117- - - - - - - - - - - - 22% 21% 23% 23% 25% 20% 17% 22% 21% 22% 25% 20% 20%
S S xy
American Airlines
- - - - - - - - - - - - 420 212 208 163 96 79 82 146 55 206 129 172 120- - - - - - - - - - - - 21% 22% 20% 28% 19% 17% 19% 24% 17% 22% 19% 24% 20%
QRS U w
United Airlines
- - - - - - - - - - - - 442 211 231 106 86 130 119 132 80 201 158 144 141- - - - - - - - - - - - 22% 22% 23% 19% 17% 27% 28% 22% 24% 22% 24% 20% 24%
PQ PQ
Southwest Airlines
- - - - - - - - - - - - 140 65 76 33 30 37 40 41 19 70 40 48 52- - - - - - - - - - - - 7% 7% 7% 6% 6% 8% 10% 7% 6% 8% 6% 7% 9%
p
JetBlue Airways
- - - - - - - - - - - - 96 51 45 27 21 21 27 21 13 56 23 28 45- - - - - - - - - - - - 5% 5% 4% 5% 4% 4% 6% 3% 4% 6% 4% 4% 8%
t WX
Alaska Airlines
- - - - - - - - - - - - 1965 952 1013 573 497 474 421 609 329 935 665 709 591- - - - - - - - - - - - 100% 100% 100% 100% 100% 100% 100% 100% 100% 100% 100% 100% 100%
Sigma
__________________________________________________________________________________________________________________Proportions/Means: Columns Tested (5%, 10% risk level) - A/B/C/D/E/F/G/H/I/J/K/L/M - N/O - P/Q/R/S - T/U/V - W/X/YOverlap formulae used. ** very small base (under 30) ineligible for sig testing

Page 230Fielding Period: March 14 - May 31, 2020COVID-19Weighted To The U.S. General Adult Population - Propensity
2 Jun 2020Table 225Q8_2 Which airline would be your first choice to use for business travel and leisure travel?
Leisure travel
Base: All Respondents
Waves Gender Age Income Political
Wave 2 Wave 3 Wave 4 Wave 5 Wave 6 Wave 7 Wave 8 Wave 9 Wave 10 Wave 11 Wave 12 Wave 13 Wave 14 Less(3/14 - (3/17 - (3/21 - (3/28 - (4/3 - (4/11- (4/18- (4/25- (5/1 - (5/8 - (5/15 - (5/27 - (5/29 - than $50k -3/15) 3/18) 3/23) 3/30) 4/5) 4/13) 4/20) 4/27) 5/3) 5/10) 5/17) 5/28) 5/31) MALE FEMALE 18-34 35-49 50-64 65+ $50k $75k $75k+ GOP DEM IND/OTH
(A) (B) (C) (D) (E) (F) (G) (H) (I) (J) (K) (L) (M) (N) (O) (P) (Q) (R) (S) (T) (U) (V) (W) (X) (Y)
- - - - - - - - - - - - 1965 1066 899 504 475 502 484 749 397 729 698 683 584Unweighted Base-** -** -** -** -** -** -** -** -** -** -** -** 1965 952 1013 573 497 474 421 609 329 935 665 709 591Weighted Base
- - - - - - - - - - - - 433 209 224 113 120 114 86 147 77 187 128 186 119- - - - - - - - - - - - 22% 22% 22% 20% 24% 24% 20% 24% 23% 20% 19% 26% 20%
WY
Delta Air Lines
- - - - - - - - - - - - 422 195 226 137 124 94 67 135 58 212 168 156 98- - - - - - - - - - - - 21% 21% 22% 24% 25% 20% 16% 22% 17% 23% 25% 22% 17%
S S Y y
American Airlines
- - - - - - - - - - - - 373 175 198 134 98 72 69 123 56 183 129 128 116- - - - - - - - - - - - 19% 18% 20% 23% 20% 15% 16% 20% 17% 20% 19% 18% 20%
RS
United Airlines
- - - - - - - - - - - - 484 251 233 108 105 133 138 135 101 221 167 162 155- - - - - - - - - - - - 25% 26% 23% 19% 21% 28% 33% 22% 31% 24% 25% 23% 26%
PQ PQ TV
Southwest Airlines
- - - - - - - - - - - - 162 71 90 48 36 38 40 48 23 85 54 53 55- - - - - - - - - - - - 8% 7% 9% 8% 7% 8% 10% 8% 7% 9% 8% 8% 9%
JetBlue Airways
- - - - - - - - - - - - 92 50 42 33 14 23 22 21 15 48 19 24 49- - - - - - - - - - - - 5% 5% 4% 6% 3% 5% 5% 3% 5% 5% 3% 3% 8%
q WX
Alaska Airlines
- - - - - - - - - - - - 1965 952 1013 573 497 474 421 609 329 935 665 709 591- - - - - - - - - - - - 100% 100% 100% 100% 100% 100% 100% 100% 100% 100% 100% 100% 100%
Sigma
__________________________________________________________________________________________________________________Proportions/Means: Columns Tested (5%, 10% risk level) - A/B/C/D/E/F/G/H/I/J/K/L/M - N/O - P/Q/R/S - T/U/V - W/X/YOverlap formulae used. ** very small base (under 30) ineligible for sig testing
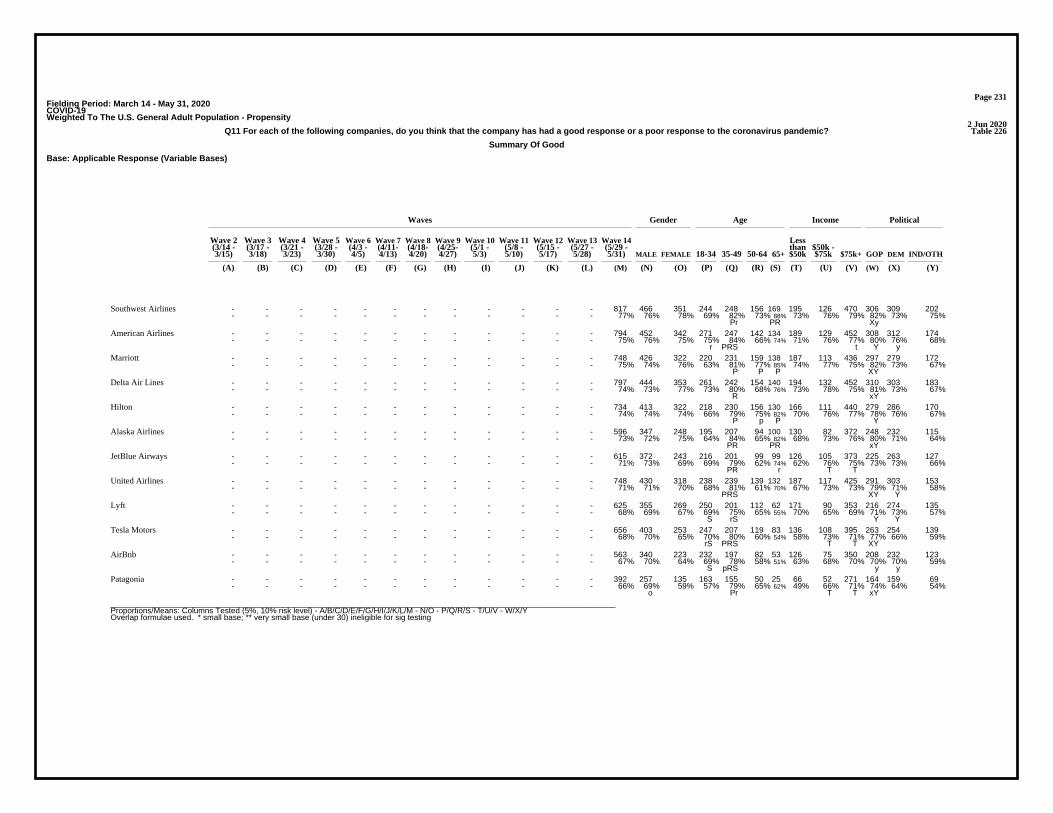
Page 231Fielding Period: March 14 - May 31, 2020COVID-19Weighted To The U.S. General Adult Population - Propensity
2 Jun 2020Table 226Q11 For each of the following companies, do you think that the company has had a good response or a poor response to the coronavirus pandemic?
Summary Of Good
Base: Applicable Response (Variable Bases)
Waves Gender Age Income Political
Wave 2 Wave 3 Wave 4 Wave 5 Wave 6 Wave 7 Wave 8 Wave 9 Wave 10 Wave 11 Wave 12 Wave 13 Wave 14 Less(3/14 - (3/17 - (3/21 - (3/28 - (4/3 - (4/11- (4/18- (4/25- (5/1 - (5/8 - (5/15 - (5/27 - (5/29 - than $50k -3/15) 3/18) 3/23) 3/30) 4/5) 4/13) 4/20) 4/27) 5/3) 5/10) 5/17) 5/28) 5/31) MALE FEMALE 18-34 35-49 50-64 65+ $50k $75k $75k+ GOP DEM IND/OTH
(A) (B) (C) (D) (E) (F) (G) (H) (I) (J) (K) (L) (M) (N) (O) (P) (Q) (R) (S) (T) (U) (V) (W) (X) (Y)
- - - - - - - - - - - - 817 466 351 244 248 156 169 195 126 470 306 309 202- - - - - - - - - - - - 77% 76% 78% 69% 82% 73% 88% 73% 76% 79% 82% 73% 75%
Pr PR Xy
Southwest Airlines
- - - - - - - - - - - - 794 452 342 271 247 142 134 189 129 452 308 312 174- - - - - - - - - - - - 75% 76% 75% 75% 84% 66% 74% 71% 76% 77% 80% 76% 68%
r PRS t Y y
American Airlines
- - - - - - - - - - - - 748 426 322 220 231 159 138 187 113 436 297 279 172- - - - - - - - - - - - 75% 74% 76% 63% 81% 77% 85% 74% 77% 75% 82% 73% 67%
P P P XY
Marriott
- - - - - - - - - - - - 797 444 353 261 242 154 140 194 132 452 310 303 183- - - - - - - - - - - - 74% 73% 77% 73% 80% 68% 76% 73% 78% 75% 81% 73% 67%
R xY
Delta Air Lines
- - - - - - - - - - - - 734 413 322 218 230 156 130 166 111 440 279 286 170- - - - - - - - - - - - 74% 74% 74% 66% 79% 75% 82% 70% 76% 77% 78% 76% 67%
P p P Y
Hilton
- - - - - - - - - - - - 596 347 248 195 207 94 100 130 82 372 248 232 115- - - - - - - - - - - - 73% 72% 75% 64% 84% 65% 82% 68% 73% 76% 80% 71% 64%
PR PR xY
Alaska Airlines
- - - - - - - - - - - - 615 372 243 216 201 99 99 126 105 373 225 263 127- - - - - - - - - - - - 71% 73% 69% 69% 79% 62% 74% 62% 76% 75% 73% 73% 66%
PR r T T
JetBlue Airways
- - - - - - - - - - - - 748 430 318 238 239 139 132 187 117 425 291 303 153- - - - - - - - - - - - 71% 71% 70% 68% 81% 61% 70% 67% 73% 73% 79% 71% 58%
PRS XY Y
United Airlines
- - - - - - - - - - - - 625 355 269 250 201 112 62 171 90 353 216 274 135- - - - - - - - - - - - 68% 69% 67% 69% 75% 65% 55% 70% 65% 69% 71% 73% 57%
S rS Y Y
Lyft
- - - - - - - - - - - - 656 403 253 247 207 119 83 136 108 395 263 254 139- - - - - - - - - - - - 68% 70% 65% 70% 80% 60% 54% 58% 73% 71% 77% 66% 59%
rS PRS T T XY
Tesla Motors
- - - - - - - - - - - - 563 340 223 232 197 82 53 126 75 350 208 232 123- - - - - - - - - - - - 67% 70% 64% 69% 78% 58% 51% 63% 68% 70% 70% 70% 59%
S pRS y y
AirBnb
- - - - - - - - - - - - 392 257 135 163 155 50 25 66 52 271 164 159 69- - - - - - - - - - - - 66% 69% 59% 57% 79% 65% 62% 49% 66% 71% 74% 64% 54%
o Pr T T xY
Patagonia
__________________________________________________________________________________________________________________Proportions/Means: Columns Tested (5%, 10% risk level) - A/B/C/D/E/F/G/H/I/J/K/L/M - N/O - P/Q/R/S - T/U/V - W/X/YOverlap formulae used. * small base; ** very small base (under 30) ineligible for sig testing

Page 232Fielding Period: March 14 - May 31, 2020COVID-19Weighted To The U.S. General Adult Population - Propensity
2 Jun 2020Table 227Q11 For each of the following companies, do you think that the company has had a good response or a poor response to the coronavirus pandemic?
Summary Of Poor
Base: Applicable Response (Variable Bases)
Waves Gender Age Income Political
Wave 2 Wave 3 Wave 4 Wave 5 Wave 6 Wave 7 Wave 8 Wave 9 Wave 10 Wave 11 Wave 12 Wave 13 Wave 14 Less(3/14 - (3/17 - (3/21 - (3/28 - (4/3 - (4/11- (4/18- (4/25- (5/1 - (5/8 - (5/15 - (5/27 - (5/29 - than $50k -3/15) 3/18) 3/23) 3/30) 4/5) 4/13) 4/20) 4/27) 5/3) 5/10) 5/17) 5/28) 5/31) MALE FEMALE 18-34 35-49 50-64 65+ $50k $75k $75k+ GOP DEM IND/OTH
(A) (B) (C) (D) (E) (F) (G) (H) (I) (J) (K) (L) (M) (N) (O) (P) (Q) (R) (S) (T) (U) (V) (W) (X) (Y)
- - - - - - - - - - - - 206 113 93 123 42 27 15 70 27 109 57 91 59- - - - - - - - - - - - 34% 31% 41% 43% 21% 35% 38% 51% 34% 29% 26% 36% 46%
n Q q UV w W
Patagonia
- - - - - - - - - - - - 273 147 126 107 56 59 51 72 36 153 89 100 84- - - - - - - - - - - - 33% 30% 36% 31% 22% 42% 49% 37% 32% 30% 30% 30% 41%
q Q PQ wx
AirBnb
- - - - - - - - - - - - 309 170 139 108 50 79 71 97 40 159 79 133 97- - - - - - - - - - - - 32% 30% 35% 30% 20% 40% 46% 42% 27% 29% 23% 34% 41%
Q pQ PQ UV W W
Tesla Motors
- - - - - - - - - - - - 291 157 134 112 69 60 51 73 47 157 87 102 102- - - - - - - - - - - - 32% 31% 33% 31% 25% 35% 45% 30% 35% 31% 29% 27% 43%
q PQ WX
Lyft
- - - - - - - - - - - - 312 178 134 111 56 88 58 92 44 160 77 123 112- - - - - - - - - - - - 29% 29% 30% 32% 19% 39% 30% 33% 27% 27% 21% 29% 42%
Q Q Q W WX
United Airlines
- - - - - - - - - - - - 249 138 111 99 55 61 35 76 33 125 83 100 67- - - - - - - - - - - - 29% 27% 31% 31% 21% 38% 26% 38% 24% 25% 27% 27% 34%
Q Qs UV
JetBlue Airways
- - - - - - - - - - - - 219 137 82 108 39 51 22 61 30 121 61 93 64- - - - - - - - - - - - 27% 28% 25% 36% 16% 35% 18% 32% 27% 24% 20% 29% 36%
QS QS w W
Alaska Airlines
- - - - - - - - - - - - 253 143 110 113 60 51 28 70 35 132 79 92 82- - - - - - - - - - - - 26% 26% 26% 34% 21% 25% 18% 30% 24% 23% 22% 24% 33%
QrS W
Hilton
- - - - - - - - - - - - 274 168 107 97 59 74 44 70 37 153 73 110 92- - - - - - - - - - - - 26% 27% 23% 27% 20% 32% 24% 27% 22% 25% 19% 27% 33%
Q w W
Delta Air Lines
- - - - - - - - - - - - 252 150 102 127 54 47 24 64 33 143 64 104 84- - - - - - - - - - - - 25% 26% 24% 37% 19% 23% 15% 26% 23% 25% 18% 27% 33%
QRS W W
Marriott
- - - - - - - - - - - - 260 146 114 90 49 73 48 77 40 132 79 97 84- - - - - - - - - - - - 25% 24% 25% 25% 16% 34% 26% 29% 24% 23% 20% 24% 32%
Q pQ Q v Wx
American Airlines
- - - - - - - - - - - - 249 149 100 112 54 58 24 73 39 126 67 112 69- - - - - - - - - - - - 23% 24% 22% 31% 18% 27% 12% 27% 24% 21% 18% 27% 25%
QS qS W w
Southwest Airlines
__________________________________________________________________________________________________________________Proportions/Means: Columns Tested (5%, 10% risk level) - A/B/C/D/E/F/G/H/I/J/K/L/M - N/O - P/Q/R/S - T/U/V - W/X/YOverlap formulae used. * small base; ** very small base (under 30) ineligible for sig testing

Page 233Fielding Period: March 14 - May 31, 2020COVID-19Weighted To The U.S. General Adult Population - Propensity
2 Jun 2020Table 228Q11_1 For each of the following companies, do you think that the company has had a good response or a poor response to the coronavirus pandemic?
Delta Air Lines
Base: Applicable Response
Waves Gender Age Income Political
Wave 2 Wave 3 Wave 4 Wave 5 Wave 6 Wave 7 Wave 8 Wave 9 Wave 10 Wave 11 Wave 12 Wave 13 Wave 14 Less(3/14 - (3/17 - (3/21 - (3/28 - (4/3 - (4/11- (4/18- (4/25- (5/1 - (5/8 - (5/15 - (5/27 - (5/29 - than $50k -3/15) 3/18) 3/23) 3/30) 4/5) 4/13) 4/20) 4/27) 5/3) 5/10) 5/17) 5/28) 5/31) MALE FEMALE 18-34 35-49 50-64 65+ $50k $75k $75k+ GOP DEM IND/OTH
(A) (B) (C) (D) (E) (F) (G) (H) (I) (J) (K) (L) (M) (N) (O) (P) (Q) (R) (S) (T) (U) (V) (W) (X) (Y)
- - - - - - - - - - - - 1044 660 384 320 291 227 206 319 203 494 398 387 259Unweighted Base-** -** -** -** -** -** -** -** -** -** -** -** 1071 612 459 358 301 228 184 264 168 605 383 413 275Weighted Base
- - - - - - - - - - - - 797 444 353 261 242 154 140 194 132 452 310 303 183- - - - - - - - - - - - 74% 73% 77% 73% 80% 68% 76% 73% 78% 75% 81% 73% 67%
R xY
Good
- - - - - - - - - - - - 274 168 107 97 59 74 44 70 37 153 73 110 92- - - - - - - - - - - - 26% 27% 23% 27% 20% 32% 24% 27% 22% 25% 19% 27% 33%
Q w W
Poor
- - - - - - - - - - - - 1071 612 459 358 301 228 184 264 168 605 383 413 275- - - - - - - - - - - - 100% 100% 100% 100% 100% 100% 100% 100% 100% 100% 100% 100% 100%
Sigma
__________________________________________________________________________________________________________________Proportions/Means: Columns Tested (5%, 10% risk level) - A/B/C/D/E/F/G/H/I/J/K/L/M - N/O - P/Q/R/S - T/U/V - W/X/YOverlap formulae used. ** very small base (under 30) ineligible for sig testing

Page 234Fielding Period: March 14 - May 31, 2020COVID-19Weighted To The U.S. General Adult Population - Propensity
2 Jun 2020Table 229Q11_2 For each of the following companies, do you think that the company has had a good response or a poor response to the coronavirus pandemic?
American Airlines
Base: Applicable Response
Waves Gender Age Income Political
Wave 2 Wave 3 Wave 4 Wave 5 Wave 6 Wave 7 Wave 8 Wave 9 Wave 10 Wave 11 Wave 12 Wave 13 Wave 14 Less(3/14 - (3/17 - (3/21 - (3/28 - (4/3 - (4/11- (4/18- (4/25- (5/1 - (5/8 - (5/15 - (5/27 - (5/29 - than $50k -3/15) 3/18) 3/23) 3/30) 4/5) 4/13) 4/20) 4/27) 5/3) 5/10) 5/17) 5/28) 5/31) MALE FEMALE 18-34 35-49 50-64 65+ $50k $75k $75k+ GOP DEM IND/OTH
(A) (B) (C) (D) (E) (F) (G) (H) (I) (J) (K) (L) (M) (N) (O) (P) (Q) (R) (S) (T) (U) (V) (W) (X) (Y)
- - - - - - - - - - - - 1043 657 386 326 293 217 207 327 208 476 403 390 250Unweighted Base-** -** -** -** -** -** -** -** -** -** -** -** 1054 598 456 362 295 215 182 266 170 584 387 409 257Weighted Base
- - - - - - - - - - - - 794 452 342 271 247 142 134 189 129 452 308 312 174- - - - - - - - - - - - 75% 76% 75% 75% 84% 66% 74% 71% 76% 77% 80% 76% 68%
r PRS t Y y
Good
- - - - - - - - - - - - 260 146 114 90 49 73 48 77 40 132 79 97 84- - - - - - - - - - - - 25% 24% 25% 25% 16% 34% 26% 29% 24% 23% 20% 24% 32%
Q pQ Q v Wx
Poor
- - - - - - - - - - - - 1054 598 456 362 295 215 182 266 170 584 387 409 257- - - - - - - - - - - - 100% 100% 100% 100% 100% 100% 100% 100% 100% 100% 100% 100% 100%
Sigma
__________________________________________________________________________________________________________________Proportions/Means: Columns Tested (5%, 10% risk level) - A/B/C/D/E/F/G/H/I/J/K/L/M - N/O - P/Q/R/S - T/U/V - W/X/YOverlap formulae used. ** very small base (under 30) ineligible for sig testing

Page 235Fielding Period: March 14 - May 31, 2020COVID-19Weighted To The U.S. General Adult Population - Propensity
2 Jun 2020Table 230Q11_3 For each of the following companies, do you think that the company has had a good response or a poor response to the coronavirus pandemic?
United Airlines
Base: Applicable Response
Waves Gender Age Income Political
Wave 2 Wave 3 Wave 4 Wave 5 Wave 6 Wave 7 Wave 8 Wave 9 Wave 10 Wave 11 Wave 12 Wave 13 Wave 14 Less(3/14 - (3/17 - (3/21 - (3/28 - (4/3 - (4/11- (4/18- (4/25- (5/1 - (5/8 - (5/15 - (5/27 - (5/29 - than $50k -3/15) 3/18) 3/23) 3/30) 4/5) 4/13) 4/20) 4/27) 5/3) 5/10) 5/17) 5/28) 5/31) MALE FEMALE 18-34 35-49 50-64 65+ $50k $75k $75k+ GOP DEM IND/OTH
(A) (B) (C) (D) (E) (F) (G) (H) (I) (J) (K) (L) (M) (N) (O) (P) (Q) (R) (S) (T) (U) (V) (W) (X) (Y)
- - - - - - - - - - - - 1055 666 389 329 289 228 209 339 196 488 391 398 266Unweighted Base-** -** -** -** -** -** -** -** -** -** -** -** 1060 608 452 349 294 226 190 280 161 584 368 427 265Weighted Base
- - - - - - - - - - - - 748 430 318 238 239 139 132 187 117 425 291 303 153- - - - - - - - - - - - 71% 71% 70% 68% 81% 61% 70% 67% 73% 73% 79% 71% 58%
PRS XY Y
Good
- - - - - - - - - - - - 312 178 134 111 56 88 58 92 44 160 77 123 112- - - - - - - - - - - - 29% 29% 30% 32% 19% 39% 30% 33% 27% 27% 21% 29% 42%
Q Q Q W WX
Poor
- - - - - - - - - - - - 1060 608 452 349 294 226 190 280 161 584 368 427 265- - - - - - - - - - - - 100% 100% 100% 100% 100% 100% 100% 100% 100% 100% 100% 100% 100%
Sigma
__________________________________________________________________________________________________________________Proportions/Means: Columns Tested (5%, 10% risk level) - A/B/C/D/E/F/G/H/I/J/K/L/M - N/O - P/Q/R/S - T/U/V - W/X/YOverlap formulae used. ** very small base (under 30) ineligible for sig testing

Page 236Fielding Period: March 14 - May 31, 2020COVID-19Weighted To The U.S. General Adult Population - Propensity
2 Jun 2020Table 231Q11_4 For each of the following companies, do you think that the company has had a good response or a poor response to the coronavirus pandemic?
Southwest Airlines
Base: Applicable Response
Waves Gender Age Income Political
Wave 2 Wave 3 Wave 4 Wave 5 Wave 6 Wave 7 Wave 8 Wave 9 Wave 10 Wave 11 Wave 12 Wave 13 Wave 14 Less(3/14 - (3/17 - (3/21 - (3/28 - (4/3 - (4/11- (4/18- (4/25- (5/1 - (5/8 - (5/15 - (5/27 - (5/29 - than $50k -3/15) 3/18) 3/23) 3/30) 4/5) 4/13) 4/20) 4/27) 5/3) 5/10) 5/17) 5/28) 5/31) MALE FEMALE 18-34 35-49 50-64 65+ $50k $75k $75k+ GOP DEM IND/OTH
(A) (B) (C) (D) (E) (F) (G) (H) (I) (J) (K) (L) (M) (N) (O) (P) (Q) (R) (S) (T) (U) (V) (W) (X) (Y)
- - - - - - - - - - - - 1043 662 381 316 292 220 215 330 204 481 391 387 265Unweighted Base-** -** -** -** -** -** -** -** -** -** -** -** 1066 615 451 356 302 215 193 268 166 596 373 421 272Weighted Base
- - - - - - - - - - - - 817 466 351 244 248 156 169 195 126 470 306 309 202- - - - - - - - - - - - 77% 76% 78% 69% 82% 73% 88% 73% 76% 79% 82% 73% 75%
Pr PR Xy
Good
- - - - - - - - - - - - 249 149 100 112 54 58 24 73 39 126 67 112 69- - - - - - - - - - - - 23% 24% 22% 31% 18% 27% 12% 27% 24% 21% 18% 27% 25%
QS qS W w
Poor
- - - - - - - - - - - - 1066 615 451 356 302 215 193 268 166 596 373 421 272- - - - - - - - - - - - 100% 100% 100% 100% 100% 100% 100% 100% 100% 100% 100% 100% 100%
Sigma
__________________________________________________________________________________________________________________Proportions/Means: Columns Tested (5%, 10% risk level) - A/B/C/D/E/F/G/H/I/J/K/L/M - N/O - P/Q/R/S - T/U/V - W/X/YOverlap formulae used. ** very small base (under 30) ineligible for sig testing
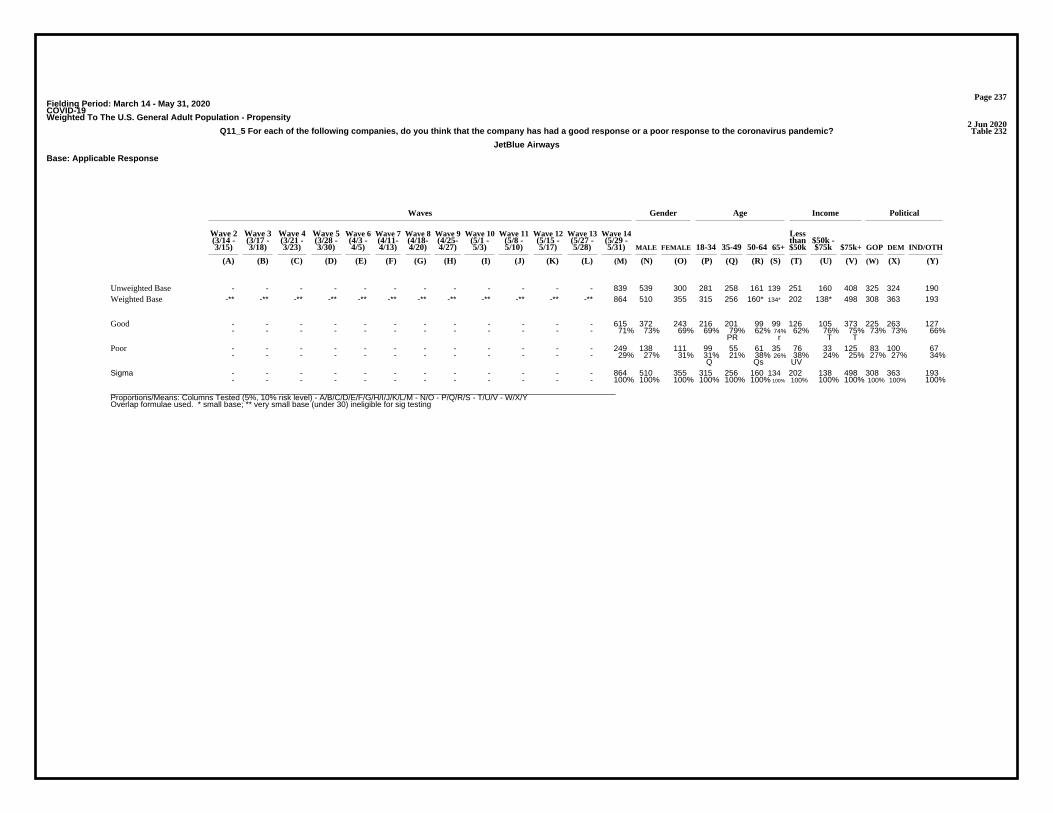
Page 237Fielding Period: March 14 - May 31, 2020COVID-19Weighted To The U.S. General Adult Population - Propensity
2 Jun 2020Table 232Q11_5 For each of the following companies, do you think that the company has had a good response or a poor response to the coronavirus pandemic?
JetBlue Airways
Base: Applicable Response
Waves Gender Age Income Political
Wave 2 Wave 3 Wave 4 Wave 5 Wave 6 Wave 7 Wave 8 Wave 9 Wave 10 Wave 11 Wave 12 Wave 13 Wave 14 Less(3/14 - (3/17 - (3/21 - (3/28 - (4/3 - (4/11- (4/18- (4/25- (5/1 - (5/8 - (5/15 - (5/27 - (5/29 - than $50k -3/15) 3/18) 3/23) 3/30) 4/5) 4/13) 4/20) 4/27) 5/3) 5/10) 5/17) 5/28) 5/31) MALE FEMALE 18-34 35-49 50-64 65+ $50k $75k $75k+ GOP DEM IND/OTH
(A) (B) (C) (D) (E) (F) (G) (H) (I) (J) (K) (L) (M) (N) (O) (P) (Q) (R) (S) (T) (U) (V) (W) (X) (Y)
- - - - - - - - - - - - 839 539 300 281 258 161 139 251 160 408 325 324 190Unweighted Base-** -** -** -** -** -** -** -** -** -** -** -** 864 510 355 315 256 160* 134* 202 138* 498 308 363 193Weighted Base
- - - - - - - - - - - - 615 372 243 216 201 99 99 126 105 373 225 263 127- - - - - - - - - - - - 71% 73% 69% 69% 79% 62% 74% 62% 76% 75% 73% 73% 66%
PR r T T
Good
- - - - - - - - - - - - 249 138 111 99 55 61 35 76 33 125 83 100 67- - - - - - - - - - - - 29% 27% 31% 31% 21% 38% 26% 38% 24% 25% 27% 27% 34%
Q Qs UV
Poor
- - - - - - - - - - - - 864 510 355 315 256 160 134 202 138 498 308 363 193- - - - - - - - - - - - 100% 100% 100% 100% 100% 100% 100% 100% 100% 100% 100% 100% 100%
Sigma
__________________________________________________________________________________________________________________Proportions/Means: Columns Tested (5%, 10% risk level) - A/B/C/D/E/F/G/H/I/J/K/L/M - N/O - P/Q/R/S - T/U/V - W/X/YOverlap formulae used. * small base; ** very small base (under 30) ineligible for sig testing

Page 238Fielding Period: March 14 - May 31, 2020COVID-19Weighted To The U.S. General Adult Population - Propensity
2 Jun 2020Table 233Q11_6 For each of the following companies, do you think that the company has had a good response or a poor response to the coronavirus pandemic?
Alaska Airlines
Base: Applicable Response
Waves Gender Age Income Political
Wave 2 Wave 3 Wave 4 Wave 5 Wave 6 Wave 7 Wave 8 Wave 9 Wave 10 Wave 11 Wave 12 Wave 13 Wave 14 Less(3/14 - (3/17 - (3/21 - (3/28 - (4/3 - (4/11- (4/18- (4/25- (5/1 - (5/8 - (5/15 - (5/27 - (5/29 - than $50k -3/15) 3/18) 3/23) 3/30) 4/5) 4/13) 4/20) 4/27) 5/3) 5/10) 5/17) 5/28) 5/31) MALE FEMALE 18-34 35-49 50-64 65+ $50k $75k $75k+ GOP DEM IND/OTH
(A) (B) (C) (D) (E) (F) (G) (H) (I) (J) (K) (L) (M) (N) (O) (P) (Q) (R) (S) (T) (U) (V) (W) (X) (Y)
- - - - - - - - - - - - 778 517 261 264 241 147 126 234 134 394 323 286 169Unweighted Base-** -** -** -** -** -** -** -** -** -** -** -** 815 485 330 303 246 145* 121* 191 112* 493 310 326 179*Weighted Base
- - - - - - - - - - - - 596 347 248 195 207 94 100 130 82 372 248 232 115- - - - - - - - - - - - 73% 72% 75% 64% 84% 65% 82% 68% 73% 76% 80% 71% 64%
PR PR xY
Good
- - - - - - - - - - - - 219 137 82 108 39 51 22 61 30 121 61 93 64- - - - - - - - - - - - 27% 28% 25% 36% 16% 35% 18% 32% 27% 24% 20% 29% 36%
QS QS w W
Poor
- - - - - - - - - - - - 815 485 330 303 246 145 121 191 112 493 310 326 179- - - - - - - - - - - - 100% 100% 100% 100% 100% 100% 100% 100% 100% 100% 100% 100% 100%
Sigma
__________________________________________________________________________________________________________________Proportions/Means: Columns Tested (5%, 10% risk level) - A/B/C/D/E/F/G/H/I/J/K/L/M - N/O - P/Q/R/S - T/U/V - W/X/YOverlap formulae used. * small base; ** very small base (under 30) ineligible for sig testing

Page 239Fielding Period: March 14 - May 31, 2020COVID-19Weighted To The U.S. General Adult Population - Propensity
2 Jun 2020Table 234Q11_7 For each of the following companies, do you think that the company has had a good response or a poor response to the coronavirus pandemic?
Tesla Motors
Base: Applicable Response
Waves Gender Age Income Political
Wave 2 Wave 3 Wave 4 Wave 5 Wave 6 Wave 7 Wave 8 Wave 9 Wave 10 Wave 11 Wave 12 Wave 13 Wave 14 Less(3/14 - (3/17 - (3/21 - (3/28 - (4/3 - (4/11- (4/18- (4/25- (5/1 - (5/8 - (5/15 - (5/27 - (5/29 - than $50k -3/15) 3/18) 3/23) 3/30) 4/5) 4/13) 4/20) 4/27) 5/3) 5/10) 5/17) 5/28) 5/31) MALE FEMALE 18-34 35-49 50-64 65+ $50k $75k $75k+ GOP DEM IND/OTH
(A) (B) (C) (D) (E) (F) (G) (H) (I) (J) (K) (L) (M) (N) (O) (P) (Q) (R) (S) (T) (U) (V) (W) (X) (Y)
- - - - - - - - - - - - 931 616 315 316 255 192 168 282 177 448 360 354 217Unweighted Base-** -** -** -** -** -** -** -** -** -** -** -** 965 573 392 355 257 198 155* 233 148 554 342 386 236Weighted Base
- - - - - - - - - - - - 656 403 253 247 207 119 83 136 108 395 263 254 139- - - - - - - - - - - - 68% 70% 65% 70% 80% 60% 54% 58% 73% 71% 77% 66% 59%
rS PRS T T XY
Good
- - - - - - - - - - - - 309 170 139 108 50 79 71 97 40 159 79 133 97- - - - - - - - - - - - 32% 30% 35% 30% 20% 40% 46% 42% 27% 29% 23% 34% 41%
Q pQ PQ UV W W
Poor
- - - - - - - - - - - - 965 573 392 355 257 198 155 233 148 554 342 386 236- - - - - - - - - - - - 100% 100% 100% 100% 100% 100% 100% 100% 100% 100% 100% 100% 100%
Sigma
__________________________________________________________________________________________________________________Proportions/Means: Columns Tested (5%, 10% risk level) - A/B/C/D/E/F/G/H/I/J/K/L/M - N/O - P/Q/R/S - T/U/V - W/X/YOverlap formulae used. * small base; ** very small base (under 30) ineligible for sig testing

Page 240Fielding Period: March 14 - May 31, 2020COVID-19Weighted To The U.S. General Adult Population - Propensity
2 Jun 2020Table 235Q11_8 For each of the following companies, do you think that the company has had a good response or a poor response to the coronavirus pandemic?
AirBnb
Base: Applicable Response
Waves Gender Age Income Political
Wave 2 Wave 3 Wave 4 Wave 5 Wave 6 Wave 7 Wave 8 Wave 9 Wave 10 Wave 11 Wave 12 Wave 13 Wave 14 Less(3/14 - (3/17 - (3/21 - (3/28 - (4/3 - (4/11- (4/18- (4/25- (5/1 - (5/8 - (5/15 - (5/27 - (5/29 - than $50k -3/15) 3/18) 3/23) 3/30) 4/5) 4/13) 4/20) 4/27) 5/3) 5/10) 5/17) 5/28) 5/31) MALE FEMALE 18-34 35-49 50-64 65+ $50k $75k $75k+ GOP DEM IND/OTH
(A) (B) (C) (D) (E) (F) (G) (H) (I) (J) (K) (L) (M) (N) (O) (P) (Q) (R) (S) (T) (U) (V) (W) (X) (Y)
- - - - - - - - - - - - 791 507 284 293 249 138 111 233 138 402 308 301 182Unweighted Base-** -** -** -** -** -** -** -** -** -** -** -** 836 487 349 339 252 141* 104* 198 111* 503 297 331 208*Weighted Base
- - - - - - - - - - - - 563 340 223 232 197 82 53 126 75 350 208 232 123- - - - - - - - - - - - 67% 70% 64% 69% 78% 58% 51% 63% 68% 70% 70% 70% 59%
S pRS y y
Good
- - - - - - - - - - - - 273 147 126 107 56 59 51 72 36 153 89 100 84- - - - - - - - - - - - 33% 30% 36% 31% 22% 42% 49% 37% 32% 30% 30% 30% 41%
q Q PQ wx
Poor
- - - - - - - - - - - - 836 487 349 339 252 141 104 198 111 503 297 331 208- - - - - - - - - - - - 100% 100% 100% 100% 100% 100% 100% 100% 100% 100% 100% 100% 100%
Sigma
__________________________________________________________________________________________________________________Proportions/Means: Columns Tested (5%, 10% risk level) - A/B/C/D/E/F/G/H/I/J/K/L/M - N/O - P/Q/R/S - T/U/V - W/X/YOverlap formulae used. * small base; ** very small base (under 30) ineligible for sig testing

Page 241Fielding Period: March 14 - May 31, 2020COVID-19Weighted To The U.S. General Adult Population - Propensity
2 Jun 2020Table 236Q11_9 For each of the following companies, do you think that the company has had a good response or a poor response to the coronavirus pandemic?
Patagonia
Base: Applicable Response
Waves Gender Age Income Political
Wave 2 Wave 3 Wave 4 Wave 5 Wave 6 Wave 7 Wave 8 Wave 9 Wave 10 Wave 11 Wave 12 Wave 13 Wave 14 Less(3/14 - (3/17 - (3/21 - (3/28 - (4/3 - (4/11- (4/18- (4/25- (5/1 - (5/8 - (5/15 - (5/27 - (5/29 - than $50k -3/15) 3/18) 3/23) 3/30) 4/5) 4/13) 4/20) 4/27) 5/3) 5/10) 5/17) 5/28) 5/31) MALE FEMALE 18-34 35-49 50-64 65+ $50k $75k $75k+ GOP DEM IND/OTH
(A) (B) (C) (D) (E) (F) (G) (H) (I) (J) (K) (L) (M) (N) (O) (P) (Q) (R) (S) (T) (U) (V) (W) (X) (Y)
- - - - - - - - - - - - 563 384 179 251 193 78 41 151 94 312 229 216 118Unweighted Base-** -** -** -** -** -** -** -** -** -** -** -** 599 370 228 285 197 77* 40** 136* 79* 380 221 249 128*Weighted Base
- - - - - - - - - - - - 392 257 135 163 155 50 25 66 52 271 164 159 69- - - - - - - - - - - - 66% 69% 59% 57% 79% 65% 62% 49% 66% 71% 74% 64% 54%
o Pr T T xY
Good
- - - - - - - - - - - - 206 113 93 123 42 27 15 70 27 109 57 91 59- - - - - - - - - - - - 34% 31% 41% 43% 21% 35% 38% 51% 34% 29% 26% 36% 46%
n Q q UV w W
Poor
- - - - - - - - - - - - 599 370 228 285 197 77 40 136 79 380 221 249 128- - - - - - - - - - - - 100% 100% 100% 100% 100% 100% 100% 100% 100% 100% 100% 100% 100%
Sigma
__________________________________________________________________________________________________________________Proportions/Means: Columns Tested (5%, 10% risk level) - A/B/C/D/E/F/G/H/I/J/K/L/M - N/O - P/Q/R/S - T/U/V - W/X/YOverlap formulae used. * small base; ** very small base (under 30) ineligible for sig testing

Page 242Fielding Period: March 14 - May 31, 2020COVID-19Weighted To The U.S. General Adult Population - Propensity
2 Jun 2020Table 237Q11_10 For each of the following companies, do you think that the company has had a good response or a poor response to the coronavirus pandemic?
Lyft
Base: Applicable Response
Waves Gender Age Income Political
Wave 2 Wave 3 Wave 4 Wave 5 Wave 6 Wave 7 Wave 8 Wave 9 Wave 10 Wave 11 Wave 12 Wave 13 Wave 14 Less(3/14 - (3/17 - (3/21 - (3/28 - (4/3 - (4/11- (4/18- (4/25- (5/1 - (5/8 - (5/15 - (5/27 - (5/29 - than $50k -3/15) 3/18) 3/23) 3/30) 4/5) 4/13) 4/20) 4/27) 5/3) 5/10) 5/17) 5/28) 5/31) MALE FEMALE 18-34 35-49 50-64 65+ $50k $75k $75k+ GOP DEM IND/OTH
(A) (B) (C) (D) (E) (F) (G) (H) (I) (J) (K) (L) (M) (N) (O) (P) (Q) (R) (S) (T) (U) (V) (W) (X) (Y)
- - - - - - - - - - - - 880 551 329 316 266 178 120 284 161 415 325 342 213Unweighted Base-** -** -** -** -** -** -** -** -** -** -** -** 916 513 403 362 269 172 113* 244 137 510 303 376 236Weighted Base
- - - - - - - - - - - - 625 355 269 250 201 112 62 171 90 353 216 274 135- - - - - - - - - - - - 68% 69% 67% 69% 75% 65% 55% 70% 65% 69% 71% 73% 57%
S rS Y Y
Good
- - - - - - - - - - - - 291 157 134 112 69 60 51 73 47 157 87 102 102- - - - - - - - - - - - 32% 31% 33% 31% 25% 35% 45% 30% 35% 31% 29% 27% 43%
q PQ WX
Poor
- - - - - - - - - - - - 916 513 403 362 269 172 113 244 137 510 303 376 236- - - - - - - - - - - - 100% 100% 100% 100% 100% 100% 100% 100% 100% 100% 100% 100% 100%
Sigma
__________________________________________________________________________________________________________________Proportions/Means: Columns Tested (5%, 10% risk level) - A/B/C/D/E/F/G/H/I/J/K/L/M - N/O - P/Q/R/S - T/U/V - W/X/YOverlap formulae used. * small base; ** very small base (under 30) ineligible for sig testing

Page 243Fielding Period: March 14 - May 31, 2020COVID-19Weighted To The U.S. General Adult Population - Propensity
2 Jun 2020Table 238Q11_11 For each of the following companies, do you think that the company has had a good response or a poor response to the coronavirus pandemic?
Marriott
Base: Applicable Response
Waves Gender Age Income Political
Wave 2 Wave 3 Wave 4 Wave 5 Wave 6 Wave 7 Wave 8 Wave 9 Wave 10 Wave 11 Wave 12 Wave 13 Wave 14 Less(3/14 - (3/17 - (3/21 - (3/28 - (4/3 - (4/11- (4/18- (4/25- (5/1 - (5/8 - (5/15 - (5/27 - (5/29 - than $50k -3/15) 3/18) 3/23) 3/30) 4/5) 4/13) 4/20) 4/27) 5/3) 5/10) 5/17) 5/28) 5/31) MALE FEMALE 18-34 35-49 50-64 65+ $50k $75k $75k+ GOP DEM IND/OTH
(A) (B) (C) (D) (E) (F) (G) (H) (I) (J) (K) (L) (M) (N) (O) (P) (Q) (R) (S) (T) (U) (V) (W) (X) (Y)
- - - - - - - - - - - - 955 598 357 305 277 203 170 304 178 451 372 346 237Unweighted Base-** -** -** -** -** -** -** -** -** -** -** -** 1000 576 424 347 285 206 162* 251 146 579 361 382 256Weighted Base
- - - - - - - - - - - - 748 426 322 220 231 159 138 187 113 436 297 279 172- - - - - - - - - - - - 75% 74% 76% 63% 81% 77% 85% 74% 77% 75% 82% 73% 67%
P P P XY
Good
- - - - - - - - - - - - 252 150 102 127 54 47 24 64 33 143 64 104 84- - - - - - - - - - - - 25% 26% 24% 37% 19% 23% 15% 26% 23% 25% 18% 27% 33%
QRS W W
Poor
- - - - - - - - - - - - 1000 576 424 347 285 206 162 251 146 579 361 382 256- - - - - - - - - - - - 100% 100% 100% 100% 100% 100% 100% 100% 100% 100% 100% 100% 100%
Sigma
__________________________________________________________________________________________________________________Proportions/Means: Columns Tested (5%, 10% risk level) - A/B/C/D/E/F/G/H/I/J/K/L/M - N/O - P/Q/R/S - T/U/V - W/X/YOverlap formulae used. * small base; ** very small base (under 30) ineligible for sig testing

Page 244Fielding Period: March 14 - May 31, 2020COVID-19Weighted To The U.S. General Adult Population - Propensity
2 Jun 2020Table 239Q11_12 For each of the following companies, do you think that the company has had a good response or a poor response to the coronavirus pandemic?
Hilton
Base: Applicable Response
Waves Gender Age Income Political
Wave 2 Wave 3 Wave 4 Wave 5 Wave 6 Wave 7 Wave 8 Wave 9 Wave 10 Wave 11 Wave 12 Wave 13 Wave 14 Less(3/14 - (3/17 - (3/21 - (3/28 - (4/3 - (4/11- (4/18- (4/25- (5/1 - (5/8 - (5/15 - (5/27 - (5/29 - than $50k -3/15) 3/18) 3/23) 3/30) 4/5) 4/13) 4/20) 4/27) 5/3) 5/10) 5/17) 5/28) 5/31) MALE FEMALE 18-34 35-49 50-64 65+ $50k $75k $75k+ GOP DEM IND/OTH
(A) (B) (C) (D) (E) (F) (G) (H) (I) (J) (K) (L) (M) (N) (O) (P) (Q) (R) (S) (T) (U) (V) (W) (X) (Y)
- - - - - - - - - - - - 943 589 354 297 282 206 158 285 175 454 368 344 231Unweighted Base-** -** -** -** -** -** -** -** -** -** -** -** 987 555 432 331 290 208 158* 236 145 571 357 378 252Weighted Base
- - - - - - - - - - - - 734 413 322 218 230 156 130 166 111 440 279 286 170- - - - - - - - - - - - 74% 74% 74% 66% 79% 75% 82% 70% 76% 77% 78% 76% 67%
P p P Y
Good
- - - - - - - - - - - - 253 143 110 113 60 51 28 70 35 132 79 92 82- - - - - - - - - - - - 26% 26% 26% 34% 21% 25% 18% 30% 24% 23% 22% 24% 33%
QrS W
Poor
- - - - - - - - - - - - 987 555 432 331 290 208 158 236 145 571 357 378 252- - - - - - - - - - - - 100% 100% 100% 100% 100% 100% 100% 100% 100% 100% 100% 100% 100%
Sigma
__________________________________________________________________________________________________________________Proportions/Means: Columns Tested (5%, 10% risk level) - A/B/C/D/E/F/G/H/I/J/K/L/M - N/O - P/Q/R/S - T/U/V - W/X/YOverlap formulae used. * small base; ** very small base (under 30) ineligible for sig testing
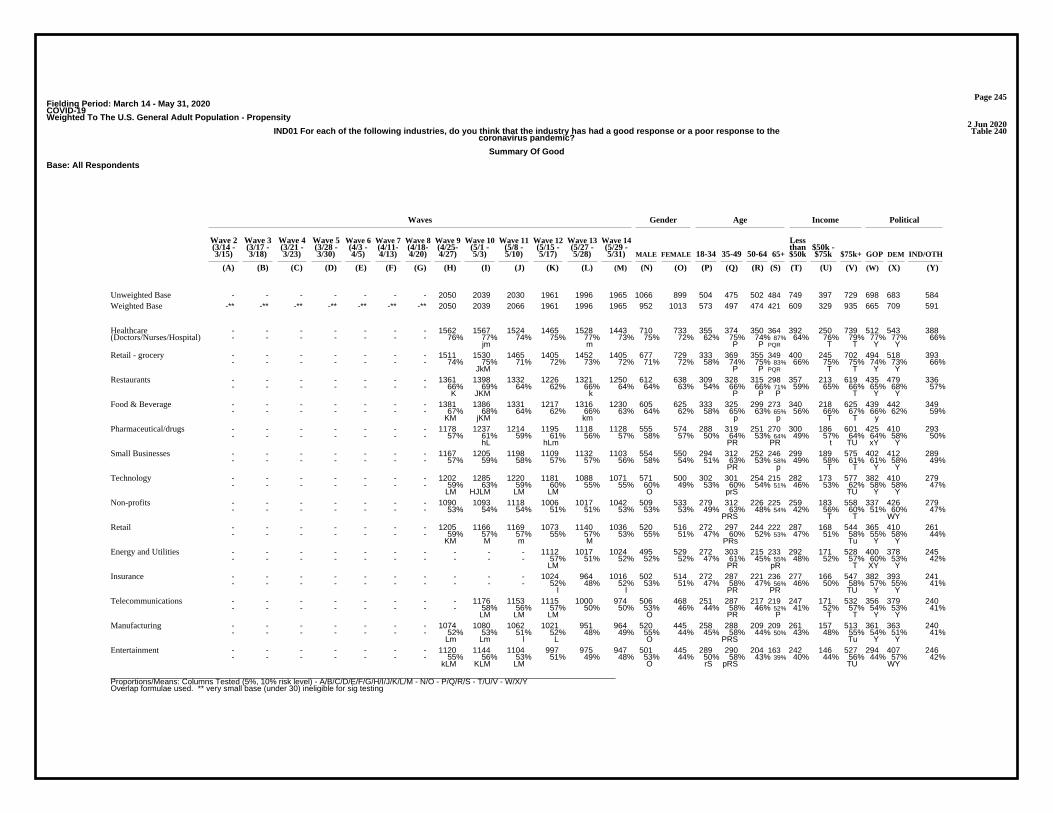
Page 245Fielding Period: March 14 - May 31, 2020COVID-19Weighted To The U.S. General Adult Population - Propensity
2 Jun 2020Table 240IND01 For each of the following industries, do you think that the industry has had a good response or a poor response to the
coronavirus pandemic?
Summary Of Good
Base: All Respondents
Waves Gender Age Income Political
Wave 2 Wave 3 Wave 4 Wave 5 Wave 6 Wave 7 Wave 8 Wave 9 Wave 10 Wave 11 Wave 12 Wave 13 Wave 14 Less(3/14 - (3/17 - (3/21 - (3/28 - (4/3 - (4/11- (4/18- (4/25- (5/1 - (5/8 - (5/15 - (5/27 - (5/29 - than $50k -3/15) 3/18) 3/23) 3/30) 4/5) 4/13) 4/20) 4/27) 5/3) 5/10) 5/17) 5/28) 5/31) MALE FEMALE 18-34 35-49 50-64 65+ $50k $75k $75k+ GOP DEM IND/OTH
(A) (B) (C) (D) (E) (F) (G) (H) (I) (J) (K) (L) (M) (N) (O) (P) (Q) (R) (S) (T) (U) (V) (W) (X) (Y)
- - - - - - - 2050 2039 2030 1961 1996 1965 1066 899 504 475 502 484 749 397 729 698 683 584Unweighted Base-** -** -** -** -** -** -** 2050 2039 2066 1961 1996 1965 952 1013 573 497 474 421 609 329 935 665 709 591Weighted Base
- - - - - - - 1562 1567 1524 1465 1528 1443 710 733 355 374 350 364 392 250 739 512 543 388- - - - - - - 76% 77% 74% 75% 77% 73% 75% 72% 62% 75% 74% 87% 64% 76% 79% 77% 77% 66%
jm m P P PQR T T Y Y
Healthcare(Doctors/Nurses/Hospital)
- - - - - - - 1511 1530 1465 1405 1452 1405 677 729 333 369 355 349 400 245 702 494 518 393- - - - - - - 74% 75% 71% 72% 73% 72% 71% 72% 58% 74% 75% 83% 66% 75% 75% 74% 73% 66%
JkM P P PQR T T Y Y
Retail - grocery
- - - - - - - 1361 1398 1332 1226 1321 1250 612 638 309 328 315 298 357 213 619 435 479 336- - - - - - - 66% 69% 64% 62% 66% 64% 64% 63% 54% 66% 66% 71% 59% 65% 66% 65% 68% 57%
K JKM k P P P T Y Y
Restaurants
- - - - - - - 1381 1386 1331 1217 1316 1230 605 625 333 325 299 273 340 218 625 439 442 349- - - - - - - 67% 68% 64% 62% 66% 63% 64% 62% 58% 65% 63% 65% 56% 66% 67% 66% 62% 59%
KM jKM km p p T T y
Food & Beverage
- - - - - - - 1178 1237 1214 1195 1118 1128 555 574 288 319 251 270 300 186 601 425 410 293- - - - - - - 57% 61% 59% 61% 56% 57% 58% 57% 50% 64% 53% 64% 49% 57% 64% 64% 58% 50%
hL hLm PR PR t TU xY Y
Pharmaceutical/drugs
- - - - - - - 1167 1205 1198 1109 1132 1103 554 550 294 312 252 246 299 189 575 402 412 289- - - - - - - 57% 59% 58% 57% 57% 56% 58% 54% 51% 63% 53% 58% 49% 58% 61% 61% 58% 49%
PR p T T Y Y
Small Businesses
- - - - - - - 1202 1285 1220 1181 1088 1071 571 500 302 301 254 215 282 173 577 382 410 279- - - - - - - 59% 63% 59% 60% 55% 55% 60% 49% 53% 60% 54% 51% 46% 53% 62% 58% 58% 47%
LM HJLM LM LM O prS TU Y Y
Technology
- - - - - - - 1090 1093 1118 1006 1017 1042 509 533 279 312 226 225 259 183 558 337 426 279- - - - - - - 53% 54% 54% 51% 51% 53% 53% 53% 49% 63% 48% 54% 42% 56% 60% 51% 60% 47%
PRS T T WY
Non-profits
- - - - - - - 1205 1166 1169 1073 1140 1036 520 516 272 297 244 222 287 168 544 365 410 261- - - - - - - 59% 57% 57% 55% 57% 53% 55% 51% 47% 60% 52% 53% 47% 51% 58% 55% 58% 44%
KM M m M PRs Tu Y Y
Retail
- - - - - - - - - - 1112 1017 1024 495 529 272 303 215 233 292 171 528 400 378 245- - - - - - - - - - 57% 51% 52% 52% 52% 47% 61% 45% 55% 48% 52% 57% 60% 53% 42%
LM PR pR T XY Y
Energy and Utilities
- - - - - - - - - - 1024 964 1016 502 514 272 287 221 236 277 166 547 382 393 241- - - - - - - - - - 52% 48% 52% 53% 51% 47% 58% 47% 56% 46% 50% 58% 57% 55% 41%
l l PR PR TU Y Y
Insurance
- - - - - - - - 1176 1153 1115 1000 974 506 468 251 287 217 219 247 171 532 356 379 240- - - - - - - - 58% 56% 57% 50% 50% 53% 46% 44% 58% 46% 52% 41% 52% 57% 54% 53% 41%
LM LM LM O PR P T T Y Y
Telecommunications
- - - - - - - 1074 1080 1062 1021 951 964 520 445 258 288 209 209 261 157 513 361 363 240- - - - - - - 52% 53% 51% 52% 48% 49% 55% 44% 45% 58% 44% 50% 43% 48% 55% 54% 51% 41%
Lm Lm l L O PRS Tu Y Y
Manufacturing
- - - - - - - 1120 1144 1104 997 975 947 501 445 289 290 204 163 242 146 527 294 407 246- - - - - - - 55% 56% 53% 51% 49% 48% 53% 44% 50% 58% 43% 39% 40% 44% 56% 44% 57% 42%
kLM KLM LM O rS pRS TU WY
Entertainment
__________________________________________________________________________________________________________________Proportions/Means: Columns Tested (5%, 10% risk level) - A/B/C/D/E/F/G/H/I/J/K/L/M - N/O - P/Q/R/S - T/U/V - W/X/YOverlap formulae used. ** very small base (under 30) ineligible for sig testing

Page 246Fielding Period: March 14 - May 31, 2020COVID-19Weighted To The U.S. General Adult Population - Propensity
2 Jun 2020Table 240IND01 For each of the following industries, do you think that the industry has had a good response or a poor response to the
coronavirus pandemic?
Summary Of Good
Base: All Respondents
Waves Gender Age Income Political
Wave 2 Wave 3 Wave 4 Wave 5 Wave 6 Wave 7 Wave 8 Wave 9 Wave 10 Wave 11 Wave 12 Wave 13 Wave 14 Less(3/14 - (3/17 - (3/21 - (3/28 - (4/3 - (4/11- (4/18- (4/25- (5/1 - (5/8 - (5/15 - (5/27 - (5/29 - than $50k -3/15) 3/18) 3/23) 3/30) 4/5) 4/13) 4/20) 4/27) 5/3) 5/10) 5/17) 5/28) 5/31) MALE FEMALE 18-34 35-49 50-64 65+ $50k $75k $75k+ GOP DEM IND/OTH
(A) (B) (C) (D) (E) (F) (G) (H) (I) (J) (K) (L) (M) (N) (O) (P) (Q) (R) (S) (T) (U) (V) (W) (X) (Y)
-** -** -** -** -** -** -** 2050 2039 2066 1961 1996 1965 952 1013 573 497 474 421 609 329 935 665 709 591Weighted Base- - - - - - - - 1034 1069 1006 965 947 469 477 285 281 207 174 257 153 505 326 373 248- - - - - - - - 51% 52% 51% 48% 48% 49% 47% 50% 57% 44% 41% 42% 46% 54% 49% 53% 42%
lm S pRS Tu y Y
Retail - apparel
- - - - - - - 974 930 1059 992 900 945 494 451 231 279 219 217 250 158 515 357 358 230- - - - - - - 48% 46% 51% 51% 45% 48% 52% 45% 40% 56% 46% 52% 41% 48% 55% 54% 50% 39%
hIL IL O PR P t Tu Y Y
Automotive
- - - - - - - 941 990 986 965 876 932 490 442 257 272 191 212 236 160 517 375 346 211- - - - - - - 46% 49% 48% 49% 44% 47% 52% 44% 45% 55% 40% 50% 39% 48% 55% 56% 49% 36%
L l L l O PR R T Tu XY Y
Financial services
- - - - - - - 966 1078 947 889 847 885 455 430 249 278 191 166 248 128 475 246 411 228- - - - - - - 47% 53% 46% 45% 42% 45% 48% 42% 43% 56% 40% 40% 41% 39% 51% 37% 58% 39%
L HJKLM l o PRS TU WY
Media
- - - - - - - 817 866 841 773 793 819 440 379 253 256 155 155 205 129 460 314 311 194- - - - - - - 40% 42% 41% 39% 40% 42% 46% 37% 44% 51% 33% 37% 34% 39% 49% 47% 44% 33%
O Rs pRS TU Y Y
Travel and hospitality(hotels, cruise lines)
- - - - - - - 795 892 870 759 747 799 409 390 232 240 165 161 203 120 449 304 315 180- - - - - - - 39% 44% 42% 39% 37% 41% 43% 38% 41% 48% 35% 38% 33% 36% 48% 46% 44% 30%
HKL hkL pRS TU Y Y
Airlines
- - - - - - - 724 737 782 829 678 723 389 333 209 239 142 133 184 115 396 300 253 169- - - - - - - 35% 36% 38% 42% 34% 37% 41% 33% 37% 48% 30% 31% 30% 35% 42% 45% 36% 29%
L HIJLM O r PRS Tu XY Y
Oil
- - - - - - - 670 697 792 783 671 714 388 327 223 228 146 117 159 102 432 278 269 167- - - - - - - 33% 34% 38% 40% 34% 36% 41% 32% 39% 46% 31% 28% 26% 31% 46% 42% 38% 28%
HIL HILm h O RS pRS TU Y Y
Real estate
__________________________________________________________________________________________________________________Proportions/Means: Columns Tested (5%, 10% risk level) - A/B/C/D/E/F/G/H/I/J/K/L/M - N/O - P/Q/R/S - T/U/V - W/X/YOverlap formulae used. ** very small base (under 30) ineligible for sig testing
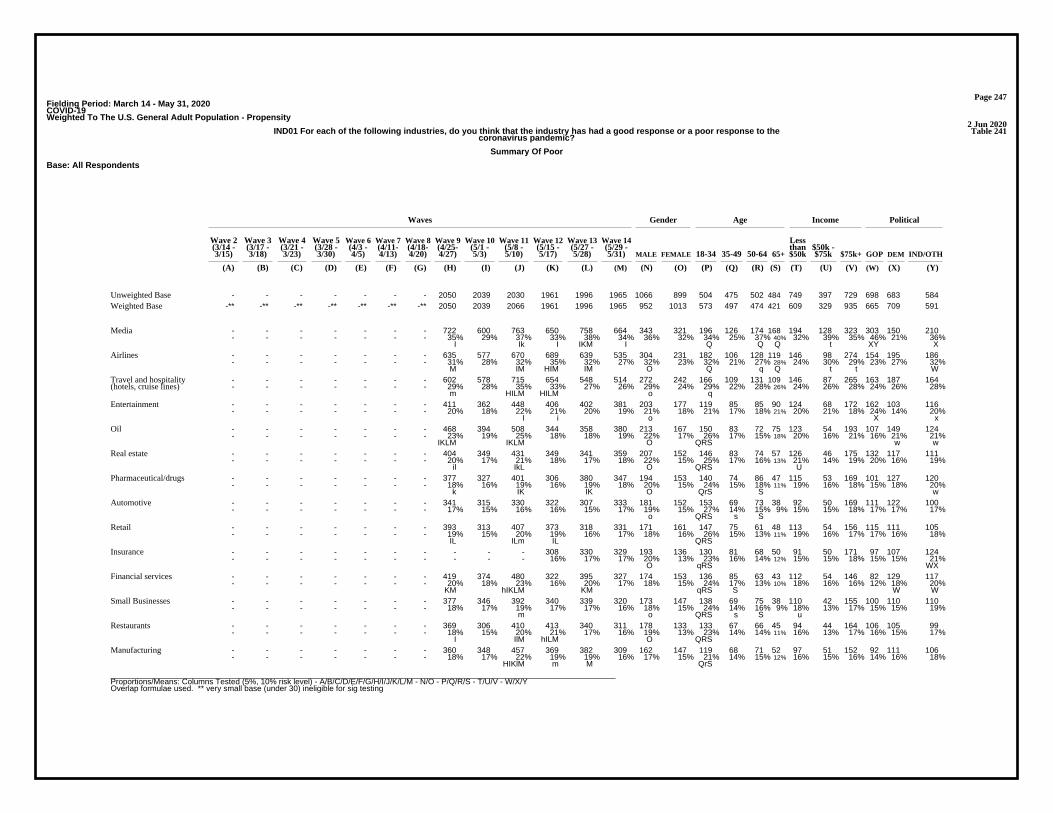
Page 247Fielding Period: March 14 - May 31, 2020COVID-19Weighted To The U.S. General Adult Population - Propensity
2 Jun 2020Table 241IND01 For each of the following industries, do you think that the industry has had a good response or a poor response to the
coronavirus pandemic?
Summary Of Poor
Base: All Respondents
Waves Gender Age Income Political
Wave 2 Wave 3 Wave 4 Wave 5 Wave 6 Wave 7 Wave 8 Wave 9 Wave 10 Wave 11 Wave 12 Wave 13 Wave 14 Less(3/14 - (3/17 - (3/21 - (3/28 - (4/3 - (4/11- (4/18- (4/25- (5/1 - (5/8 - (5/15 - (5/27 - (5/29 - than $50k -3/15) 3/18) 3/23) 3/30) 4/5) 4/13) 4/20) 4/27) 5/3) 5/10) 5/17) 5/28) 5/31) MALE FEMALE 18-34 35-49 50-64 65+ $50k $75k $75k+ GOP DEM IND/OTH
(A) (B) (C) (D) (E) (F) (G) (H) (I) (J) (K) (L) (M) (N) (O) (P) (Q) (R) (S) (T) (U) (V) (W) (X) (Y)
- - - - - - - 2050 2039 2030 1961 1996 1965 1066 899 504 475 502 484 749 397 729 698 683 584Unweighted Base-** -** -** -** -** -** -** 2050 2039 2066 1961 1996 1965 952 1013 573 497 474 421 609 329 935 665 709 591Weighted Base
- - - - - - - 722 600 763 650 758 664 343 321 196 126 174 168 194 128 323 303 150 210- - - - - - - 35% 29% 37% 33% 38% 34% 36% 32% 34% 25% 37% 40% 32% 39% 35% 46% 21% 36%
I Ik I IKM I Q Q Q t XY X
Media
- - - - - - - 635 577 670 689 639 535 304 231 182 106 128 119 146 98 274 154 195 186- - - - - - - 31% 28% 32% 35% 32% 27% 32% 23% 32% 21% 27% 28% 24% 30% 29% 23% 27% 32%
M IM HIM IM O Q q Q t t W
Airlines
- - - - - - - 602 578 715 654 548 514 272 242 166 109 131 109 146 87 265 163 187 164- - - - - - - 29% 28% 35% 33% 27% 26% 29% 24% 29% 22% 28% 26% 24% 26% 28% 24% 26% 28%
m HILM HILM o q
Travel and hospitality(hotels, cruise lines)
- - - - - - - 411 362 448 406 402 381 203 177 119 85 85 90 124 68 172 162 103 116- - - - - - - 20% 18% 22% 21% 20% 19% 21% 18% 21% 17% 18% 21% 20% 21% 18% 24% 14% 20%
I i o X x
Entertainment
- - - - - - - 468 394 508 344 358 380 213 167 150 83 72 75 123 54 193 107 149 124- - - - - - - 23% 19% 25% 18% 18% 19% 22% 17% 26% 17% 15% 18% 20% 16% 21% 16% 21% 21%
IKLM IKLM O QRS w w
Oil
- - - - - - - 404 349 431 349 341 359 207 152 146 83 74 57 126 46 175 132 117 111- - - - - - - 20% 17% 21% 18% 17% 18% 22% 15% 25% 17% 16% 13% 21% 14% 19% 20% 16% 19%
il IkL O QRS U
Real estate
- - - - - - - 377 327 401 306 380 347 194 153 140 74 86 47 115 53 169 101 127 120- - - - - - - 18% 16% 19% 16% 19% 18% 20% 15% 24% 15% 18% 11% 19% 16% 18% 15% 18% 20%
k IK IK O QrS S w
Pharmaceutical/drugs
- - - - - - - 341 315 330 322 307 333 181 152 153 69 73 38 92 50 169 111 122 100- - - - - - - 17% 15% 16% 16% 15% 17% 19% 15% 27% 14% 15% 9% 15% 15% 18% 17% 17% 17%
o QRS s S
Automotive
- - - - - - - 393 313 407 373 318 331 171 161 147 75 61 48 113 54 156 115 111 105- - - - - - - 19% 15% 20% 19% 16% 17% 18% 16% 26% 15% 13% 11% 19% 16% 17% 17% 16% 18%
IL ILm IL QRS
Retail
- - - - - - - - - - 308 330 329 193 136 130 81 68 50 91 50 171 97 107 124- - - - - - - - - - 16% 17% 17% 20% 13% 23% 16% 14% 12% 15% 15% 18% 15% 15% 21%
O qRS WX
Insurance
- - - - - - - 419 374 480 322 395 327 174 153 136 85 63 43 112 54 146 82 129 117- - - - - - - 20% 18% 23% 16% 20% 17% 18% 15% 24% 17% 13% 10% 18% 16% 16% 12% 18% 20%
KM hIKLM KM qRS S W W
Financial services
- - - - - - - 377 346 392 340 339 320 173 147 138 69 75 38 110 42 155 100 110 110- - - - - - - 18% 17% 19% 17% 17% 16% 18% 15% 24% 14% 16% 9% 18% 13% 17% 15% 15% 19%
m o QRS s S u
Small Businesses
- - - - - - - 369 306 410 413 340 311 178 133 133 67 66 45 94 44 164 106 105 99- - - - - - - 18% 15% 20% 21% 17% 16% 19% 13% 23% 14% 14% 11% 16% 13% 17% 16% 15% 17%
I IlM hILM O QRS
Restaurants
- - - - - - - 360 348 457 369 382 309 162 147 119 68 71 52 97 51 152 92 111 106- - - - - - - 18% 17% 22% 19% 19% 16% 17% 15% 21% 14% 15% 12% 16% 15% 16% 14% 16% 18%
HIKlM m M QrS
Manufacturing
__________________________________________________________________________________________________________________Proportions/Means: Columns Tested (5%, 10% risk level) - A/B/C/D/E/F/G/H/I/J/K/L/M - N/O - P/Q/R/S - T/U/V - W/X/YOverlap formulae used. ** very small base (under 30) ineligible for sig testing

Page 248Fielding Period: March 14 - May 31, 2020COVID-19Weighted To The U.S. General Adult Population - Propensity
2 Jun 2020Table 241IND01 For each of the following industries, do you think that the industry has had a good response or a poor response to the
coronavirus pandemic?
Summary Of Poor
Base: All Respondents
Waves Gender Age Income Political
Wave 2 Wave 3 Wave 4 Wave 5 Wave 6 Wave 7 Wave 8 Wave 9 Wave 10 Wave 11 Wave 12 Wave 13 Wave 14 Less(3/14 - (3/17 - (3/21 - (3/28 - (4/3 - (4/11- (4/18- (4/25- (5/1 - (5/8 - (5/15 - (5/27 - (5/29 - than $50k -3/15) 3/18) 3/23) 3/30) 4/5) 4/13) 4/20) 4/27) 5/3) 5/10) 5/17) 5/28) 5/31) MALE FEMALE 18-34 35-49 50-64 65+ $50k $75k $75k+ GOP DEM IND/OTH
(A) (B) (C) (D) (E) (F) (G) (H) (I) (J) (K) (L) (M) (N) (O) (P) (Q) (R) (S) (T) (U) (V) (W) (X) (Y)
-** -** -** -** -** -** -** 2050 2039 2066 1961 1996 1965 952 1013 573 497 474 421 609 329 935 665 709 591Weighted Base- - - - - - - - 302 384 333 350 302 168 134 108 82 62 51 96 50 148 126 98 78- - - - - - - - 15% 19% 17% 18% 15% 18% 13% 19% 16% 13% 12% 16% 15% 16% 19% 14% 13%
IM i O rS XY
Retail - apparel
- - - - - - - - - - 253 266 290 167 123 131 60 69 28 89 34 157 83 115 91- - - - - - - - - - 13% 13% 15% 18% 12% 23% 12% 15% 7% 15% 10% 17% 13% 16% 15%
O QRS S S U
Energy and Utilities
- - - - - - - - 243 334 245 249 266 155 111 116 59 62 29 90 42 116 83 89 94- - - - - - - - 12% 16% 13% 12% 14% 16% 11% 20% 12% 13% 7% 15% 13% 12% 13% 13% 16%
IKLm O QRS S S
Telecommunications
- - - - - - - 290 279 338 257 266 266 169 97 118 63 45 40 87 38 134 104 84 78- - - - - - - 14% 14% 16% 13% 13% 14% 18% 10% 21% 13% 9% 9% 14% 11% 14% 16% 12% 13%
iKLM O QRS
Non-profits
- - - - - - - 284 231 326 304 267 265 153 112 109 67 54 35 83 40 131 81 111 74- - - - - - - 14% 11% 16% 16% 13% 14% 16% 11% 19% 13% 11% 8% 14% 12% 14% 12% 16% 12%
i Il I O qRS S
Food & Beverage
- - - - - - - 262 194 308 209 229 247 141 106 102 64 49 31 75 38 128 77 86 84- - - - - - - 13% 10% 15% 11% 11% 13% 15% 10% 18% 13% 10% 7% 12% 12% 14% 12% 12% 14%
I IKLm I O RS S
Technology
- - - - - - - 268 225 296 233 248 242 136 105 122 55 45 19 90 30 116 68 97 77- - - - - - - 13% 11% 14% 12% 12% 12% 14% 10% 21% 11% 9% 5% 15% 9% 12% 10% 14% 13%
Ik O QRS S S U
Retail - grocery
- - - - - - - 243 226 298 213 230 206 115 92 103 51 44 9 77 25 98 57 75 74- - - - - - - 12% 11% 14% 11% 12% 11% 12% 9% 18% 10% 9% 2% 13% 8% 11% 9% 11% 12%
HIKLM o QRS S S U w
Healthcare(Doctors/Nurses/Hospital)
__________________________________________________________________________________________________________________Proportions/Means: Columns Tested (5%, 10% risk level) - A/B/C/D/E/F/G/H/I/J/K/L/M - N/O - P/Q/R/S - T/U/V - W/X/YOverlap formulae used. ** very small base (under 30) ineligible for sig testing

Page 249Fielding Period: March 14 - May 31, 2020COVID-19Weighted To The U.S. General Adult Population - Propensity
2 Jun 2020Table 242IND01_1 For each of the following industries, do you think that the industry has had a good response or a poor response to the
coronavirus pandemic?
Financial services
Base: All Respondents
Waves Gender Age Income Political
Wave 2 Wave 3 Wave 4 Wave 5 Wave 6 Wave 7 Wave 8 Wave 9 Wave 10 Wave 11 Wave 12 Wave 13 Wave 14 Less(3/14 - (3/17 - (3/21 - (3/28 - (4/3 - (4/11- (4/18- (4/25- (5/1 - (5/8 - (5/15 - (5/27 - (5/29 - than $50k -3/15) 3/18) 3/23) 3/30) 4/5) 4/13) 4/20) 4/27) 5/3) 5/10) 5/17) 5/28) 5/31) MALE FEMALE 18-34 35-49 50-64 65+ $50k $75k $75k+ GOP DEM IND/OTH
(A) (B) (C) (D) (E) (F) (G) (H) (I) (J) (K) (L) (M) (N) (O) (P) (Q) (R) (S) (T) (U) (V) (W) (X) (Y)
- - - - - - - 2050 2039 2030 1961 1996 1965 1066 899 504 475 502 484 749 397 729 698 683 584Unweighted Base-** -** -** -** -** -** -** 2050 2039 2066 1961 1996 1965 952 1013 573 497 474 421 609 329 935 665 709 591Weighted Base
- - - - - - - 941 990 986 965 876 932 490 442 257 272 191 212 236 160 517 375 346 211- - - - - - - 46% 49% 48% 49% 44% 47% 52% 44% 45% 55% 40% 50% 39% 48% 55% 56% 49% 36%
L l L l O PR R T Tu XY Y
Good
- - - - - - - 419 374 480 322 395 327 174 153 136 85 63 43 112 54 146 82 129 117- - - - - - - 20% 18% 23% 16% 20% 17% 18% 15% 24% 17% 13% 10% 18% 16% 16% 12% 18% 20%
KM hIKLM KM qRS S W W
Poor
- - - - - - - 689 675 600 675 725 705 287 419 180 140 220 166 261 115 273 208 234 263- - - - - - - 34% 33% 29% 34% 36% 36% 30% 41% 31% 28% 46% 39% 43% 35% 29% 31% 33% 45%
J J J iJ J N PQs PQ UV WX
N/A - Not familiar withthis industry’s response
- - - - - - - 2050 2039 2066 1961 1996 1965 952 1013 573 497 474 421 609 329 935 665 709 591- - - - - - - 100% 100% 100% 100% 100% 100% 100% 100% 100% 100% 100% 100% 100% 100% 100% 100% 100% 100%
Sigma
__________________________________________________________________________________________________________________Proportions/Means: Columns Tested (5%, 10% risk level) - A/B/C/D/E/F/G/H/I/J/K/L/M - N/O - P/Q/R/S - T/U/V - W/X/YOverlap formulae used. ** very small base (under 30) ineligible for sig testing

Page 250Fielding Period: March 14 - May 31, 2020COVID-19Weighted To The U.S. General Adult Population - Propensity
2 Jun 2020Table 243IND01_2 For each of the following industries, do you think that the industry has had a good response or a poor response to the
coronavirus pandemic?
Retail
Base: All Respondents
Waves Gender Age Income Political
Wave 2 Wave 3 Wave 4 Wave 5 Wave 6 Wave 7 Wave 8 Wave 9 Wave 10 Wave 11 Wave 12 Wave 13 Wave 14 Less(3/14 - (3/17 - (3/21 - (3/28 - (4/3 - (4/11- (4/18- (4/25- (5/1 - (5/8 - (5/15 - (5/27 - (5/29 - than $50k -3/15) 3/18) 3/23) 3/30) 4/5) 4/13) 4/20) 4/27) 5/3) 5/10) 5/17) 5/28) 5/31) MALE FEMALE 18-34 35-49 50-64 65+ $50k $75k $75k+ GOP DEM IND/OTH
(A) (B) (C) (D) (E) (F) (G) (H) (I) (J) (K) (L) (M) (N) (O) (P) (Q) (R) (S) (T) (U) (V) (W) (X) (Y)
- - - - - - - 2050 2039 2030 1961 1996 1965 1066 899 504 475 502 484 749 397 729 698 683 584Unweighted Base-** -** -** -** -** -** -** 2050 2039 2066 1961 1996 1965 952 1013 573 497 474 421 609 329 935 665 709 591Weighted Base
- - - - - - - 1205 1166 1169 1073 1140 1036 520 516 272 297 244 222 287 168 544 365 410 261- - - - - - - 59% 57% 57% 55% 57% 53% 55% 51% 47% 60% 52% 53% 47% 51% 58% 55% 58% 44%
KM M m M PRs Tu Y Y
Good
- - - - - - - 393 313 407 373 318 331 171 161 147 75 61 48 113 54 156 115 111 105- - - - - - - 19% 15% 20% 19% 16% 17% 18% 16% 26% 15% 13% 11% 19% 16% 17% 17% 16% 18%
IL ILm IL QRS
Poor
- - - - - - - 452 560 490 515 538 598 261 337 154 125 168 150 209 107 235 184 188 225- - - - - - - 22% 27% 24% 26% 27% 30% 27% 33% 27% 25% 36% 36% 34% 33% 25% 28% 27% 38%
HJ H Hj HJKl N PQ PQ V V WX
N/A - Not familiar withthis industry’s response
- - - - - - - 2050 2039 2066 1961 1996 1965 952 1013 573 497 474 421 609 329 935 665 709 591- - - - - - - 100% 100% 100% 100% 100% 100% 100% 100% 100% 100% 100% 100% 100% 100% 100% 100% 100% 100%
Sigma
__________________________________________________________________________________________________________________Proportions/Means: Columns Tested (5%, 10% risk level) - A/B/C/D/E/F/G/H/I/J/K/L/M - N/O - P/Q/R/S - T/U/V - W/X/YOverlap formulae used. ** very small base (under 30) ineligible for sig testing

Page 251Fielding Period: March 14 - May 31, 2020COVID-19Weighted To The U.S. General Adult Population - Propensity
2 Jun 2020Table 244IND01_3 For each of the following industries, do you think that the industry has had a good response or a poor response to the
coronavirus pandemic?
Technology
Base: All Respondents
Waves Gender Age Income Political
Wave 2 Wave 3 Wave 4 Wave 5 Wave 6 Wave 7 Wave 8 Wave 9 Wave 10 Wave 11 Wave 12 Wave 13 Wave 14 Less(3/14 - (3/17 - (3/21 - (3/28 - (4/3 - (4/11- (4/18- (4/25- (5/1 - (5/8 - (5/15 - (5/27 - (5/29 - than $50k -3/15) 3/18) 3/23) 3/30) 4/5) 4/13) 4/20) 4/27) 5/3) 5/10) 5/17) 5/28) 5/31) MALE FEMALE 18-34 35-49 50-64 65+ $50k $75k $75k+ GOP DEM IND/OTH
(A) (B) (C) (D) (E) (F) (G) (H) (I) (J) (K) (L) (M) (N) (O) (P) (Q) (R) (S) (T) (U) (V) (W) (X) (Y)
- - - - - - - 2050 2039 2030 1961 1996 1965 1066 899 504 475 502 484 749 397 729 698 683 584Unweighted Base-** -** -** -** -** -** -** 2050 2039 2066 1961 1996 1965 952 1013 573 497 474 421 609 329 935 665 709 591Weighted Base
- - - - - - - 1202 1285 1220 1181 1088 1071 571 500 302 301 254 215 282 173 577 382 410 279- - - - - - - 59% 63% 59% 60% 55% 55% 60% 49% 53% 60% 54% 51% 46% 53% 62% 58% 58% 47%
LM HJLM LM LM O prS TU Y Y
Good
- - - - - - - 262 194 308 209 229 247 141 106 102 64 49 31 75 38 128 77 86 84- - - - - - - 13% 10% 15% 11% 11% 13% 15% 10% 18% 13% 10% 7% 12% 12% 14% 12% 12% 14%
I IKLm I O RS S
Poor
- - - - - - - 586 559 538 571 678 647 240 408 170 133 171 174 253 118 229 206 213 228- - - - - - - 29% 27% 26% 29% 34% 33% 25% 40% 30% 27% 36% 41% 41% 36% 25% 31% 30% 39%
j HIJK HIJK N pQ PQ V V WX
N/A - Not familiar withthis industry’s response
- - - - - - - 2050 2039 2066 1961 1996 1965 952 1013 573 497 474 421 609 329 935 665 709 591- - - - - - - 100% 100% 100% 100% 100% 100% 100% 100% 100% 100% 100% 100% 100% 100% 100% 100% 100% 100%
Sigma
__________________________________________________________________________________________________________________Proportions/Means: Columns Tested (5%, 10% risk level) - A/B/C/D/E/F/G/H/I/J/K/L/M - N/O - P/Q/R/S - T/U/V - W/X/YOverlap formulae used. ** very small base (under 30) ineligible for sig testing

Page 252Fielding Period: March 14 - May 31, 2020COVID-19Weighted To The U.S. General Adult Population - Propensity
2 Jun 2020Table 245IND01_4 For each of the following industries, do you think that the industry has had a good response or a poor response to the
coronavirus pandemic?
Media
Base: All Respondents
Waves Gender Age Income Political
Wave 2 Wave 3 Wave 4 Wave 5 Wave 6 Wave 7 Wave 8 Wave 9 Wave 10 Wave 11 Wave 12 Wave 13 Wave 14 Less(3/14 - (3/17 - (3/21 - (3/28 - (4/3 - (4/11- (4/18- (4/25- (5/1 - (5/8 - (5/15 - (5/27 - (5/29 - than $50k -3/15) 3/18) 3/23) 3/30) 4/5) 4/13) 4/20) 4/27) 5/3) 5/10) 5/17) 5/28) 5/31) MALE FEMALE 18-34 35-49 50-64 65+ $50k $75k $75k+ GOP DEM IND/OTH
(A) (B) (C) (D) (E) (F) (G) (H) (I) (J) (K) (L) (M) (N) (O) (P) (Q) (R) (S) (T) (U) (V) (W) (X) (Y)
- - - - - - - 2050 2039 2030 1961 1996 1965 1066 899 504 475 502 484 749 397 729 698 683 584Unweighted Base-** -** -** -** -** -** -** 2050 2039 2066 1961 1996 1965 952 1013 573 497 474 421 609 329 935 665 709 591Weighted Base
- - - - - - - 966 1078 947 889 847 885 455 430 249 278 191 166 248 128 475 246 411 228- - - - - - - 47% 53% 46% 45% 42% 45% 48% 42% 43% 56% 40% 40% 41% 39% 51% 37% 58% 39%
L HJKLM l o PRS TU WY
Good
- - - - - - - 722 600 763 650 758 664 343 321 196 126 174 168 194 128 323 303 150 210- - - - - - - 35% 29% 37% 33% 38% 34% 36% 32% 34% 25% 37% 40% 32% 39% 35% 46% 21% 36%
I Ik I IKM I Q Q Q t XY X
Poor
- - - - - - - 362 361 357 421 391 416 153 263 128 93 108 87 168 73 136 115 148 153- - - - - - - 18% 18% 17% 21% 20% 21% 16% 26% 22% 19% 23% 21% 28% 22% 15% 17% 21% 26%
HIJ HIJ N V V W
N/A - Not familiar withthis industry’s response
- - - - - - - 2050 2039 2066 1961 1996 1965 952 1013 573 497 474 421 609 329 935 665 709 591- - - - - - - 100% 100% 100% 100% 100% 100% 100% 100% 100% 100% 100% 100% 100% 100% 100% 100% 100% 100%
Sigma
__________________________________________________________________________________________________________________Proportions/Means: Columns Tested (5%, 10% risk level) - A/B/C/D/E/F/G/H/I/J/K/L/M - N/O - P/Q/R/S - T/U/V - W/X/YOverlap formulae used. ** very small base (under 30) ineligible for sig testing

Page 253Fielding Period: March 14 - May 31, 2020COVID-19Weighted To The U.S. General Adult Population - Propensity
2 Jun 2020Table 246IND01_5 For each of the following industries, do you think that the industry has had a good response or a poor response to the
coronavirus pandemic?
Automotive
Base: All Respondents
Waves Gender Age Income Political
Wave 2 Wave 3 Wave 4 Wave 5 Wave 6 Wave 7 Wave 8 Wave 9 Wave 10 Wave 11 Wave 12 Wave 13 Wave 14 Less(3/14 - (3/17 - (3/21 - (3/28 - (4/3 - (4/11- (4/18- (4/25- (5/1 - (5/8 - (5/15 - (5/27 - (5/29 - than $50k -3/15) 3/18) 3/23) 3/30) 4/5) 4/13) 4/20) 4/27) 5/3) 5/10) 5/17) 5/28) 5/31) MALE FEMALE 18-34 35-49 50-64 65+ $50k $75k $75k+ GOP DEM IND/OTH
(A) (B) (C) (D) (E) (F) (G) (H) (I) (J) (K) (L) (M) (N) (O) (P) (Q) (R) (S) (T) (U) (V) (W) (X) (Y)
- - - - - - - 2050 2039 2030 1961 1996 1965 1066 899 504 475 502 484 749 397 729 698 683 584Unweighted Base-** -** -** -** -** -** -** 2050 2039 2066 1961 1996 1965 952 1013 573 497 474 421 609 329 935 665 709 591Weighted Base
- - - - - - - 974 930 1059 992 900 945 494 451 231 279 219 217 250 158 515 357 358 230- - - - - - - 48% 46% 51% 51% 45% 48% 52% 45% 40% 56% 46% 52% 41% 48% 55% 54% 50% 39%
hIL IL O PR P t Tu Y Y
Good
- - - - - - - 341 315 330 322 307 333 181 152 153 69 73 38 92 50 169 111 122 100- - - - - - - 17% 15% 16% 16% 15% 17% 19% 15% 27% 14% 15% 9% 15% 15% 18% 17% 17% 17%
o QRS s S
Poor
- - - - - - - 734 794 677 647 789 687 277 410 190 150 182 166 266 121 250 197 229 261- - - - - - - 36% 39% 33% 33% 40% 35% 29% 41% 33% 30% 38% 40% 44% 37% 27% 30% 32% 44%
hJKM HJKM N Q Q uV V WX
N/A - Not familiar withthis industry’s response
- - - - - - - 2050 2039 2066 1961 1996 1965 952 1013 573 497 474 421 609 329 935 665 709 591- - - - - - - 100% 100% 100% 100% 100% 100% 100% 100% 100% 100% 100% 100% 100% 100% 100% 100% 100% 100%
Sigma
__________________________________________________________________________________________________________________Proportions/Means: Columns Tested (5%, 10% risk level) - A/B/C/D/E/F/G/H/I/J/K/L/M - N/O - P/Q/R/S - T/U/V - W/X/YOverlap formulae used. ** very small base (under 30) ineligible for sig testing

Page 254Fielding Period: March 14 - May 31, 2020COVID-19Weighted To The U.S. General Adult Population - Propensity
2 Jun 2020Table 247IND01_6 For each of the following industries, do you think that the industry has had a good response or a poor response to the
coronavirus pandemic?
Healthcare (Doctors/Nurses/Hospital)
Base: All Respondents
Waves Gender Age Income Political
Wave 2 Wave 3 Wave 4 Wave 5 Wave 6 Wave 7 Wave 8 Wave 9 Wave 10 Wave 11 Wave 12 Wave 13 Wave 14 Less(3/14 - (3/17 - (3/21 - (3/28 - (4/3 - (4/11- (4/18- (4/25- (5/1 - (5/8 - (5/15 - (5/27 - (5/29 - than $50k -3/15) 3/18) 3/23) 3/30) 4/5) 4/13) 4/20) 4/27) 5/3) 5/10) 5/17) 5/28) 5/31) MALE FEMALE 18-34 35-49 50-64 65+ $50k $75k $75k+ GOP DEM IND/OTH
(A) (B) (C) (D) (E) (F) (G) (H) (I) (J) (K) (L) (M) (N) (O) (P) (Q) (R) (S) (T) (U) (V) (W) (X) (Y)
- - - - - - - 2050 2039 2030 1961 1996 1965 1066 899 504 475 502 484 749 397 729 698 683 584Unweighted Base-** -** -** -** -** -** -** 2050 2039 2066 1961 1996 1965 952 1013 573 497 474 421 609 329 935 665 709 591Weighted Base
- - - - - - - 1562 1567 1524 1465 1528 1443 710 733 355 374 350 364 392 250 739 512 543 388- - - - - - - 76% 77% 74% 75% 77% 73% 75% 72% 62% 75% 74% 87% 64% 76% 79% 77% 77% 66%
jm m P P PQR T T Y Y
Good
- - - - - - - 243 226 298 213 230 206 115 92 103 51 44 9 77 25 98 57 75 74- - - - - - - 12% 11% 14% 11% 12% 11% 12% 9% 18% 10% 9% 2% 13% 8% 11% 9% 11% 12%
HIKLM o QRS S S U w
Poor
- - - - - - - 245 246 244 283 237 316 127 189 115 73 79 48 141 54 97 95 91 130- - - - - - - 12% 12% 12% 14% 12% 16% 13% 19% 20% 15% 17% 11% 23% 16% 10% 14% 13% 22%
hijl HIJL N qS s UV V WX
N/A - Not familiar withthis industry’s response
- - - - - - - 2050 2039 2066 1961 1996 1965 952 1013 573 497 474 421 609 329 935 665 709 591- - - - - - - 100% 100% 100% 100% 100% 100% 100% 100% 100% 100% 100% 100% 100% 100% 100% 100% 100% 100%
Sigma
__________________________________________________________________________________________________________________Proportions/Means: Columns Tested (5%, 10% risk level) - A/B/C/D/E/F/G/H/I/J/K/L/M - N/O - P/Q/R/S - T/U/V - W/X/YOverlap formulae used. ** very small base (under 30) ineligible for sig testing

Page 255Fielding Period: March 14 - May 31, 2020COVID-19Weighted To The U.S. General Adult Population - Propensity
2 Jun 2020Table 248IND01_7 For each of the following industries, do you think that the industry has had a good response or a poor response to the
coronavirus pandemic?
Food & Beverage
Base: All Respondents
Waves Gender Age Income Political
Wave 2 Wave 3 Wave 4 Wave 5 Wave 6 Wave 7 Wave 8 Wave 9 Wave 10 Wave 11 Wave 12 Wave 13 Wave 14 Less(3/14 - (3/17 - (3/21 - (3/28 - (4/3 - (4/11- (4/18- (4/25- (5/1 - (5/8 - (5/15 - (5/27 - (5/29 - than $50k -3/15) 3/18) 3/23) 3/30) 4/5) 4/13) 4/20) 4/27) 5/3) 5/10) 5/17) 5/28) 5/31) MALE FEMALE 18-34 35-49 50-64 65+ $50k $75k $75k+ GOP DEM IND/OTH
(A) (B) (C) (D) (E) (F) (G) (H) (I) (J) (K) (L) (M) (N) (O) (P) (Q) (R) (S) (T) (U) (V) (W) (X) (Y)
- - - - - - - 2050 2039 2030 1961 1996 1965 1066 899 504 475 502 484 749 397 729 698 683 584Unweighted Base-** -** -** -** -** -** -** 2050 2039 2066 1961 1996 1965 952 1013 573 497 474 421 609 329 935 665 709 591Weighted Base
- - - - - - - 1381 1386 1331 1217 1316 1230 605 625 333 325 299 273 340 218 625 439 442 349- - - - - - - 67% 68% 64% 62% 66% 63% 64% 62% 58% 65% 63% 65% 56% 66% 67% 66% 62% 59%
KM jKM km p p T T y
Good
- - - - - - - 284 231 326 304 267 265 153 112 109 67 54 35 83 40 131 81 111 74- - - - - - - 14% 11% 16% 16% 13% 14% 16% 11% 19% 13% 11% 8% 14% 12% 14% 12% 16% 12%
i Il I O qRS S
Poor
- - - - - - - 384 421 409 440 413 469 193 276 131 106 121 112 186 71 179 145 156 168- - - - - - - 19% 21% 20% 22% 21% 24% 20% 27% 23% 21% 25% 27% 30% 22% 19% 22% 22% 28%
H HiJl N UV WX
N/A - Not familiar withthis industry’s response
- - - - - - - 2050 2039 2066 1961 1996 1965 952 1013 573 497 474 421 609 329 935 665 709 591- - - - - - - 100% 100% 100% 100% 100% 100% 100% 100% 100% 100% 100% 100% 100% 100% 100% 100% 100% 100%
Sigma
__________________________________________________________________________________________________________________Proportions/Means: Columns Tested (5%, 10% risk level) - A/B/C/D/E/F/G/H/I/J/K/L/M - N/O - P/Q/R/S - T/U/V - W/X/YOverlap formulae used. ** very small base (under 30) ineligible for sig testing

Page 256Fielding Period: March 14 - May 31, 2020COVID-19Weighted To The U.S. General Adult Population - Propensity
2 Jun 2020Table 249IND01_8 For each of the following industries, do you think that the industry has had a good response or a poor response to the
coronavirus pandemic?
Entertainment
Base: All Respondents
Waves Gender Age Income Political
Wave 2 Wave 3 Wave 4 Wave 5 Wave 6 Wave 7 Wave 8 Wave 9 Wave 10 Wave 11 Wave 12 Wave 13 Wave 14 Less(3/14 - (3/17 - (3/21 - (3/28 - (4/3 - (4/11- (4/18- (4/25- (5/1 - (5/8 - (5/15 - (5/27 - (5/29 - than $50k -3/15) 3/18) 3/23) 3/30) 4/5) 4/13) 4/20) 4/27) 5/3) 5/10) 5/17) 5/28) 5/31) MALE FEMALE 18-34 35-49 50-64 65+ $50k $75k $75k+ GOP DEM IND/OTH
(A) (B) (C) (D) (E) (F) (G) (H) (I) (J) (K) (L) (M) (N) (O) (P) (Q) (R) (S) (T) (U) (V) (W) (X) (Y)
- - - - - - - 2050 2039 2030 1961 1996 1965 1066 899 504 475 502 484 749 397 729 698 683 584Unweighted Base-** -** -** -** -** -** -** 2050 2039 2066 1961 1996 1965 952 1013 573 497 474 421 609 329 935 665 709 591Weighted Base
- - - - - - - 1120 1144 1104 997 975 947 501 445 289 290 204 163 242 146 527 294 407 246- - - - - - - 55% 56% 53% 51% 49% 48% 53% 44% 50% 58% 43% 39% 40% 44% 56% 44% 57% 42%
kLM KLM LM O rS pRS TU WY
Good
- - - - - - - 411 362 448 406 402 381 203 177 119 85 85 90 124 68 172 162 103 116- - - - - - - 20% 18% 22% 21% 20% 19% 21% 18% 21% 17% 18% 21% 20% 21% 18% 24% 14% 20%
I i o X x
Poor
- - - - - - - 519 533 514 559 619 638 247 391 164 122 184 168 244 115 236 209 200 229- - - - - - - 25% 26% 25% 28% 31% 32% 26% 39% 29% 24% 39% 40% 40% 35% 25% 31% 28% 39%
hJ HIJ HIJK N PQ PQ V V WX
N/A - Not familiar withthis industry’s response
- - - - - - - 2050 2039 2066 1961 1996 1965 952 1013 573 497 474 421 609 329 935 665 709 591- - - - - - - 100% 100% 100% 100% 100% 100% 100% 100% 100% 100% 100% 100% 100% 100% 100% 100% 100% 100%
Sigma
__________________________________________________________________________________________________________________Proportions/Means: Columns Tested (5%, 10% risk level) - A/B/C/D/E/F/G/H/I/J/K/L/M - N/O - P/Q/R/S - T/U/V - W/X/YOverlap formulae used. ** very small base (under 30) ineligible for sig testing

Page 257Fielding Period: March 14 - May 31, 2020COVID-19Weighted To The U.S. General Adult Population - Propensity
2 Jun 2020Table 250IND01_9 For each of the following industries, do you think that the industry has had a good response or a poor response to the
coronavirus pandemic?
Travel and hospitality (hotels, cruise lines)
Base: All Respondents
Waves Gender Age Income Political
Wave 2 Wave 3 Wave 4 Wave 5 Wave 6 Wave 7 Wave 8 Wave 9 Wave 10 Wave 11 Wave 12 Wave 13 Wave 14 Less(3/14 - (3/17 - (3/21 - (3/28 - (4/3 - (4/11- (4/18- (4/25- (5/1 - (5/8 - (5/15 - (5/27 - (5/29 - than $50k -3/15) 3/18) 3/23) 3/30) 4/5) 4/13) 4/20) 4/27) 5/3) 5/10) 5/17) 5/28) 5/31) MALE FEMALE 18-34 35-49 50-64 65+ $50k $75k $75k+ GOP DEM IND/OTH
(A) (B) (C) (D) (E) (F) (G) (H) (I) (J) (K) (L) (M) (N) (O) (P) (Q) (R) (S) (T) (U) (V) (W) (X) (Y)
- - - - - - - 2050 2039 2030 1961 1996 1965 1066 899 504 475 502 484 749 397 729 698 683 584Unweighted Base-** -** -** -** -** -** -** 2050 2039 2066 1961 1996 1965 952 1013 573 497 474 421 609 329 935 665 709 591Weighted Base
- - - - - - - 817 866 841 773 793 819 440 379 253 256 155 155 205 129 460 314 311 194- - - - - - - 40% 42% 41% 39% 40% 42% 46% 37% 44% 51% 33% 37% 34% 39% 49% 47% 44% 33%
O Rs pRS TU Y Y
Good
- - - - - - - 602 578 715 654 548 514 272 242 166 109 131 109 146 87 265 163 187 164- - - - - - - 29% 28% 35% 33% 27% 26% 29% 24% 29% 22% 28% 26% 24% 26% 28% 24% 26% 28%
m HILM HILM o q
Poor
- - - - - - - 631 595 510 534 655 632 240 392 154 133 188 157 258 114 210 188 211 233- - - - - - - 31% 29% 25% 27% 33% 32% 25% 39% 27% 27% 40% 37% 42% 35% 22% 28% 30% 39%
Jk J IJK JK N PQ PQ UV V WX
N/A - Not familiar withthis industry’s response
- - - - - - - 2050 2039 2066 1961 1996 1965 952 1013 573 497 474 421 609 329 935 665 709 591- - - - - - - 100% 100% 100% 100% 100% 100% 100% 100% 100% 100% 100% 100% 100% 100% 100% 100% 100% 100%
Sigma
__________________________________________________________________________________________________________________Proportions/Means: Columns Tested (5%, 10% risk level) - A/B/C/D/E/F/G/H/I/J/K/L/M - N/O - P/Q/R/S - T/U/V - W/X/YOverlap formulae used. ** very small base (under 30) ineligible for sig testing

Page 258Fielding Period: March 14 - May 31, 2020COVID-19Weighted To The U.S. General Adult Population - Propensity
2 Jun 2020Table 251IND01_10 For each of the following industries, do you think that the industry has had a good response or a poor response to the
coronavirus pandemic?
Airlines
Base: All Respondents
Waves Gender Age Income Political
Wave 2 Wave 3 Wave 4 Wave 5 Wave 6 Wave 7 Wave 8 Wave 9 Wave 10 Wave 11 Wave 12 Wave 13 Wave 14 Less(3/14 - (3/17 - (3/21 - (3/28 - (4/3 - (4/11- (4/18- (4/25- (5/1 - (5/8 - (5/15 - (5/27 - (5/29 - than $50k -3/15) 3/18) 3/23) 3/30) 4/5) 4/13) 4/20) 4/27) 5/3) 5/10) 5/17) 5/28) 5/31) MALE FEMALE 18-34 35-49 50-64 65+ $50k $75k $75k+ GOP DEM IND/OTH
(A) (B) (C) (D) (E) (F) (G) (H) (I) (J) (K) (L) (M) (N) (O) (P) (Q) (R) (S) (T) (U) (V) (W) (X) (Y)
- - - - - - - 2050 2039 2030 1961 1996 1965 1066 899 504 475 502 484 749 397 729 698 683 584Unweighted Base-** -** -** -** -** -** -** 2050 2039 2066 1961 1996 1965 952 1013 573 497 474 421 609 329 935 665 709 591Weighted Base
- - - - - - - 795 892 870 759 747 799 409 390 232 240 165 161 203 120 449 304 315 180- - - - - - - 39% 44% 42% 39% 37% 41% 43% 38% 41% 48% 35% 38% 33% 36% 48% 46% 44% 30%
HKL hkL pRS TU Y Y
Good
- - - - - - - 635 577 670 689 639 535 304 231 182 106 128 119 146 98 274 154 195 186- - - - - - - 31% 28% 32% 35% 32% 27% 32% 23% 32% 21% 27% 28% 24% 30% 29% 23% 27% 32%
M IM HIM IM O Q q Q t t W
Poor
- - - - - - - 620 570 526 513 610 631 239 393 159 152 180 140 260 111 212 207 199 225- - - - - - - 30% 28% 25% 26% 31% 32% 25% 39% 28% 31% 38% 33% 43% 34% 23% 31% 28% 38%
JK JK IJK N Pq UV V WX
N/A - Not familiar withthis industry’s response
- - - - - - - 2050 2039 2066 1961 1996 1965 952 1013 573 497 474 421 609 329 935 665 709 591- - - - - - - 100% 100% 100% 100% 100% 100% 100% 100% 100% 100% 100% 100% 100% 100% 100% 100% 100% 100%
Sigma
__________________________________________________________________________________________________________________Proportions/Means: Columns Tested (5%, 10% risk level) - A/B/C/D/E/F/G/H/I/J/K/L/M - N/O - P/Q/R/S - T/U/V - W/X/YOverlap formulae used. ** very small base (under 30) ineligible for sig testing

Page 259Fielding Period: March 14 - May 31, 2020COVID-19Weighted To The U.S. General Adult Population - Propensity
2 Jun 2020Table 252IND01_11 For each of the following industries, do you think that the industry has had a good response or a poor response to the
coronavirus pandemic?
Non-profits
Base: All Respondents
Waves Gender Age Income Political
Wave 2 Wave 3 Wave 4 Wave 5 Wave 6 Wave 7 Wave 8 Wave 9 Wave 10 Wave 11 Wave 12 Wave 13 Wave 14 Less(3/14 - (3/17 - (3/21 - (3/28 - (4/3 - (4/11- (4/18- (4/25- (5/1 - (5/8 - (5/15 - (5/27 - (5/29 - than $50k -3/15) 3/18) 3/23) 3/30) 4/5) 4/13) 4/20) 4/27) 5/3) 5/10) 5/17) 5/28) 5/31) MALE FEMALE 18-34 35-49 50-64 65+ $50k $75k $75k+ GOP DEM IND/OTH
(A) (B) (C) (D) (E) (F) (G) (H) (I) (J) (K) (L) (M) (N) (O) (P) (Q) (R) (S) (T) (U) (V) (W) (X) (Y)
- - - - - - - 2050 2039 2030 1961 1996 1965 1066 899 504 475 502 484 749 397 729 698 683 584Unweighted Base-** -** -** -** -** -** -** 2050 2039 2066 1961 1996 1965 952 1013 573 497 474 421 609 329 935 665 709 591Weighted Base
- - - - - - - 1090 1093 1118 1006 1017 1042 509 533 279 312 226 225 259 183 558 337 426 279- - - - - - - 53% 54% 54% 51% 51% 53% 53% 53% 49% 63% 48% 54% 42% 56% 60% 51% 60% 47%
PRS T T WY
Good
- - - - - - - 290 279 338 257 266 266 169 97 118 63 45 40 87 38 134 104 84 78- - - - - - - 14% 14% 16% 13% 13% 14% 18% 10% 21% 13% 9% 9% 14% 11% 14% 16% 12% 13%
iKLM O QRS
Poor
- - - - - - - 670 667 610 697 713 656 273 383 176 122 202 156 263 109 243 224 199 234- - - - - - - 33% 33% 30% 36% 36% 33% 29% 38% 31% 25% 43% 37% 43% 33% 26% 34% 28% 40%
j j J J J N PQ Q UV V x wX
N/A - Not familiar withthis industry’s response
- - - - - - - 2050 2039 2066 1961 1996 1965 952 1013 573 497 474 421 609 329 935 665 709 591- - - - - - - 100% 100% 100% 100% 100% 100% 100% 100% 100% 100% 100% 100% 100% 100% 100% 100% 100% 100%
Sigma
__________________________________________________________________________________________________________________Proportions/Means: Columns Tested (5%, 10% risk level) - A/B/C/D/E/F/G/H/I/J/K/L/M - N/O - P/Q/R/S - T/U/V - W/X/YOverlap formulae used. ** very small base (under 30) ineligible for sig testing

Page 260Fielding Period: March 14 - May 31, 2020COVID-19Weighted To The U.S. General Adult Population - Propensity
2 Jun 2020Table 253IND01_12 For each of the following industries, do you think that the industry has had a good response or a poor response to the
coronavirus pandemic?
Real estate
Base: All Respondents
Waves Gender Age Income Political
Wave 2 Wave 3 Wave 4 Wave 5 Wave 6 Wave 7 Wave 8 Wave 9 Wave 10 Wave 11 Wave 12 Wave 13 Wave 14 Less(3/14 - (3/17 - (3/21 - (3/28 - (4/3 - (4/11- (4/18- (4/25- (5/1 - (5/8 - (5/15 - (5/27 - (5/29 - than $50k -3/15) 3/18) 3/23) 3/30) 4/5) 4/13) 4/20) 4/27) 5/3) 5/10) 5/17) 5/28) 5/31) MALE FEMALE 18-34 35-49 50-64 65+ $50k $75k $75k+ GOP DEM IND/OTH
(A) (B) (C) (D) (E) (F) (G) (H) (I) (J) (K) (L) (M) (N) (O) (P) (Q) (R) (S) (T) (U) (V) (W) (X) (Y)
- - - - - - - 2050 2039 2030 1961 1996 1965 1066 899 504 475 502 484 749 397 729 698 683 584Unweighted Base-** -** -** -** -** -** -** 2050 2039 2066 1961 1996 1965 952 1013 573 497 474 421 609 329 935 665 709 591Weighted Base
- - - - - - - 670 697 792 783 671 714 388 327 223 228 146 117 159 102 432 278 269 167- - - - - - - 33% 34% 38% 40% 34% 36% 41% 32% 39% 46% 31% 28% 26% 31% 46% 42% 38% 28%
HIL HILm h O RS pRS TU Y Y
Good
- - - - - - - 404 349 431 349 341 359 207 152 146 83 74 57 126 46 175 132 117 111- - - - - - - 20% 17% 21% 18% 17% 18% 22% 15% 25% 17% 16% 13% 21% 14% 19% 20% 16% 19%
il IkL O QRS U
Poor
- - - - - - - 976 993 844 829 984 892 357 535 205 186 254 247 324 181 328 255 323 313- - - - - - - 48% 49% 41% 42% 49% 45% 37% 53% 36% 37% 54% 59% 53% 55% 35% 38% 46% 53%
JK JKm JKm J N PQ PQ V V W WX
N/A - Not familiar withthis industry’s response
- - - - - - - 2050 2039 2066 1961 1996 1965 952 1013 573 497 474 421 609 329 935 665 709 591- - - - - - - 100% 100% 100% 100% 100% 100% 100% 100% 100% 100% 100% 100% 100% 100% 100% 100% 100% 100%
Sigma
__________________________________________________________________________________________________________________Proportions/Means: Columns Tested (5%, 10% risk level) - A/B/C/D/E/F/G/H/I/J/K/L/M - N/O - P/Q/R/S - T/U/V - W/X/YOverlap formulae used. ** very small base (under 30) ineligible for sig testing

Page 261Fielding Period: March 14 - May 31, 2020COVID-19Weighted To The U.S. General Adult Population - Propensity
2 Jun 2020Table 254IND01_13 For each of the following industries, do you think that the industry has had a good response or a poor response to the
coronavirus pandemic?
Retail - grocery
Base: All Respondents
Waves Gender Age Income Political
Wave 2 Wave 3 Wave 4 Wave 5 Wave 6 Wave 7 Wave 8 Wave 9 Wave 10 Wave 11 Wave 12 Wave 13 Wave 14 Less(3/14 - (3/17 - (3/21 - (3/28 - (4/3 - (4/11- (4/18- (4/25- (5/1 - (5/8 - (5/15 - (5/27 - (5/29 - than $50k -3/15) 3/18) 3/23) 3/30) 4/5) 4/13) 4/20) 4/27) 5/3) 5/10) 5/17) 5/28) 5/31) MALE FEMALE 18-34 35-49 50-64 65+ $50k $75k $75k+ GOP DEM IND/OTH
(A) (B) (C) (D) (E) (F) (G) (H) (I) (J) (K) (L) (M) (N) (O) (P) (Q) (R) (S) (T) (U) (V) (W) (X) (Y)
- - - - - - - 2050 2039 2030 1961 1996 1965 1066 899 504 475 502 484 749 397 729 698 683 584Unweighted Base-** -** -** -** -** -** -** 2050 2039 2066 1961 1996 1965 952 1013 573 497 474 421 609 329 935 665 709 591Weighted Base
- - - - - - - 1511 1530 1465 1405 1452 1405 677 729 333 369 355 349 400 245 702 494 518 393- - - - - - - 74% 75% 71% 72% 73% 72% 71% 72% 58% 74% 75% 83% 66% 75% 75% 74% 73% 66%
JkM P P PQR T T Y Y
Good
- - - - - - - 268 225 296 233 248 242 136 105 122 55 45 19 90 30 116 68 97 77- - - - - - - 13% 11% 14% 12% 12% 12% 14% 10% 21% 11% 9% 5% 15% 9% 12% 10% 14% 13%
Ik O QRS S S U
Poor
- - - - - - - 270 284 306 323 296 318 139 180 118 74 74 53 119 54 117 102 94 122- - - - - - - 13% 14% 15% 16% 15% 16% 15% 18% 21% 15% 16% 13% 20% 16% 12% 15% 13% 21%
Hi H qS V wX
N/A - Not familiar withthis industry’s response
- - - - - - - 2050 2039 2066 1961 1996 1965 952 1013 573 497 474 421 609 329 935 665 709 591- - - - - - - 100% 100% 100% 100% 100% 100% 100% 100% 100% 100% 100% 100% 100% 100% 100% 100% 100% 100%
Sigma
__________________________________________________________________________________________________________________Proportions/Means: Columns Tested (5%, 10% risk level) - A/B/C/D/E/F/G/H/I/J/K/L/M - N/O - P/Q/R/S - T/U/V - W/X/YOverlap formulae used. ** very small base (under 30) ineligible for sig testing

Page 262Fielding Period: March 14 - May 31, 2020COVID-19Weighted To The U.S. General Adult Population - Propensity
2 Jun 2020Table 255IND01_14 For each of the following industries, do you think that the industry has had a good response or a poor response to the
coronavirus pandemic?
Pharmaceutical/drugs
Base: All Respondents
Waves Gender Age Income Political
Wave 2 Wave 3 Wave 4 Wave 5 Wave 6 Wave 7 Wave 8 Wave 9 Wave 10 Wave 11 Wave 12 Wave 13 Wave 14 Less(3/14 - (3/17 - (3/21 - (3/28 - (4/3 - (4/11- (4/18- (4/25- (5/1 - (5/8 - (5/15 - (5/27 - (5/29 - than $50k -3/15) 3/18) 3/23) 3/30) 4/5) 4/13) 4/20) 4/27) 5/3) 5/10) 5/17) 5/28) 5/31) MALE FEMALE 18-34 35-49 50-64 65+ $50k $75k $75k+ GOP DEM IND/OTH
(A) (B) (C) (D) (E) (F) (G) (H) (I) (J) (K) (L) (M) (N) (O) (P) (Q) (R) (S) (T) (U) (V) (W) (X) (Y)
- - - - - - - 2050 2039 2030 1961 1996 1965 1066 899 504 475 502 484 749 397 729 698 683 584Unweighted Base-** -** -** -** -** -** -** 2050 2039 2066 1961 1996 1965 952 1013 573 497 474 421 609 329 935 665 709 591Weighted Base
- - - - - - - 1178 1237 1214 1195 1118 1128 555 574 288 319 251 270 300 186 601 425 410 293- - - - - - - 57% 61% 59% 61% 56% 57% 58% 57% 50% 64% 53% 64% 49% 57% 64% 64% 58% 50%
hL hLm PR PR t TU xY Y
Good
- - - - - - - 377 327 401 306 380 347 194 153 140 74 86 47 115 53 169 101 127 120- - - - - - - 18% 16% 19% 16% 19% 18% 20% 15% 24% 15% 18% 11% 19% 16% 18% 15% 18% 20%
k IK IK O QrS S w
Poor
- - - - - - - 495 476 451 460 498 489 203 287 145 105 136 104 194 90 165 138 173 178- - - - - - - 24% 23% 22% 23% 25% 25% 21% 28% 25% 21% 29% 25% 32% 27% 18% 21% 24% 30%
j j N Q V V Wx
N/A - Not familiar withthis industry’s response
- - - - - - - 2050 2039 2066 1961 1996 1965 952 1013 573 497 474 421 609 329 935 665 709 591- - - - - - - 100% 100% 100% 100% 100% 100% 100% 100% 100% 100% 100% 100% 100% 100% 100% 100% 100% 100%
Sigma
__________________________________________________________________________________________________________________Proportions/Means: Columns Tested (5%, 10% risk level) - A/B/C/D/E/F/G/H/I/J/K/L/M - N/O - P/Q/R/S - T/U/V - W/X/YOverlap formulae used. ** very small base (under 30) ineligible for sig testing
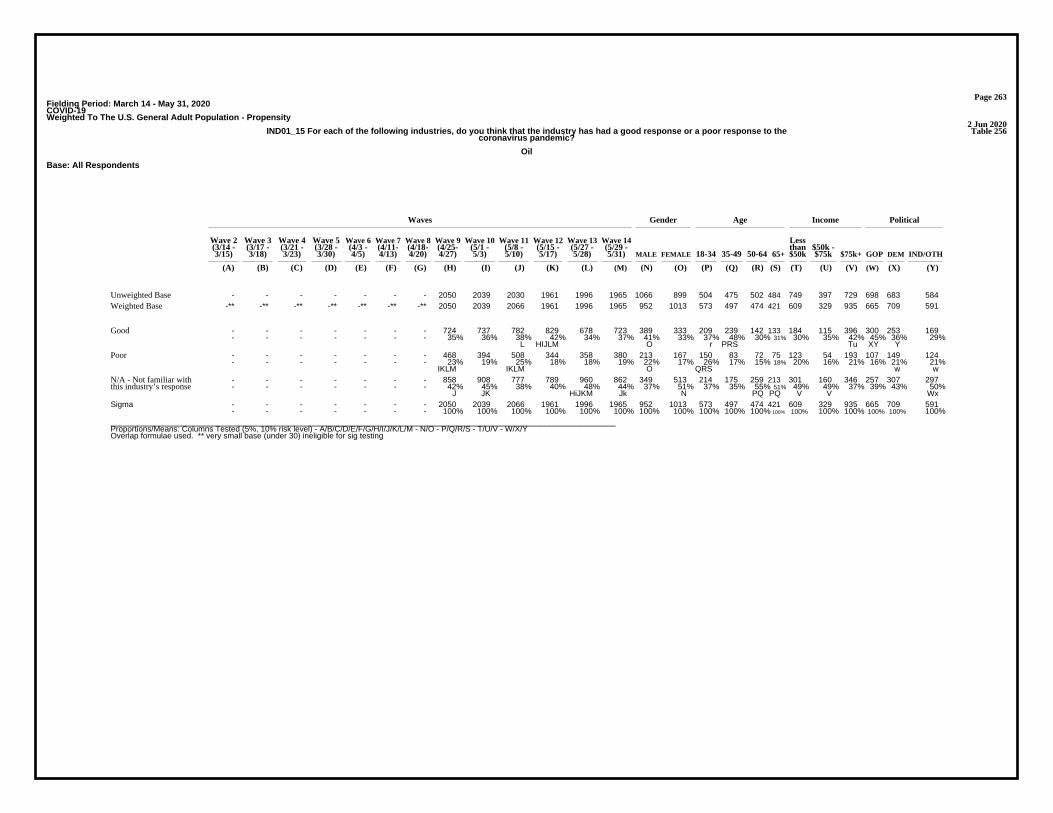
Page 263Fielding Period: March 14 - May 31, 2020COVID-19Weighted To The U.S. General Adult Population - Propensity
2 Jun 2020Table 256IND01_15 For each of the following industries, do you think that the industry has had a good response or a poor response to the
coronavirus pandemic?
Oil
Base: All Respondents
Waves Gender Age Income Political
Wave 2 Wave 3 Wave 4 Wave 5 Wave 6 Wave 7 Wave 8 Wave 9 Wave 10 Wave 11 Wave 12 Wave 13 Wave 14 Less(3/14 - (3/17 - (3/21 - (3/28 - (4/3 - (4/11- (4/18- (4/25- (5/1 - (5/8 - (5/15 - (5/27 - (5/29 - than $50k -3/15) 3/18) 3/23) 3/30) 4/5) 4/13) 4/20) 4/27) 5/3) 5/10) 5/17) 5/28) 5/31) MALE FEMALE 18-34 35-49 50-64 65+ $50k $75k $75k+ GOP DEM IND/OTH
(A) (B) (C) (D) (E) (F) (G) (H) (I) (J) (K) (L) (M) (N) (O) (P) (Q) (R) (S) (T) (U) (V) (W) (X) (Y)
- - - - - - - 2050 2039 2030 1961 1996 1965 1066 899 504 475 502 484 749 397 729 698 683 584Unweighted Base-** -** -** -** -** -** -** 2050 2039 2066 1961 1996 1965 952 1013 573 497 474 421 609 329 935 665 709 591Weighted Base
- - - - - - - 724 737 782 829 678 723 389 333 209 239 142 133 184 115 396 300 253 169- - - - - - - 35% 36% 38% 42% 34% 37% 41% 33% 37% 48% 30% 31% 30% 35% 42% 45% 36% 29%
L HIJLM O r PRS Tu XY Y
Good
- - - - - - - 468 394 508 344 358 380 213 167 150 83 72 75 123 54 193 107 149 124- - - - - - - 23% 19% 25% 18% 18% 19% 22% 17% 26% 17% 15% 18% 20% 16% 21% 16% 21% 21%
IKLM IKLM O QRS w w
Poor
- - - - - - - 858 908 777 789 960 862 349 513 214 175 259 213 301 160 346 257 307 297- - - - - - - 42% 45% 38% 40% 48% 44% 37% 51% 37% 35% 55% 51% 49% 49% 37% 39% 43% 50%
J JK HiJKM Jk N PQ PQ V V Wx
N/A - Not familiar withthis industry’s response
- - - - - - - 2050 2039 2066 1961 1996 1965 952 1013 573 497 474 421 609 329 935 665 709 591- - - - - - - 100% 100% 100% 100% 100% 100% 100% 100% 100% 100% 100% 100% 100% 100% 100% 100% 100% 100%
Sigma
__________________________________________________________________________________________________________________Proportions/Means: Columns Tested (5%, 10% risk level) - A/B/C/D/E/F/G/H/I/J/K/L/M - N/O - P/Q/R/S - T/U/V - W/X/YOverlap formulae used. ** very small base (under 30) ineligible for sig testing
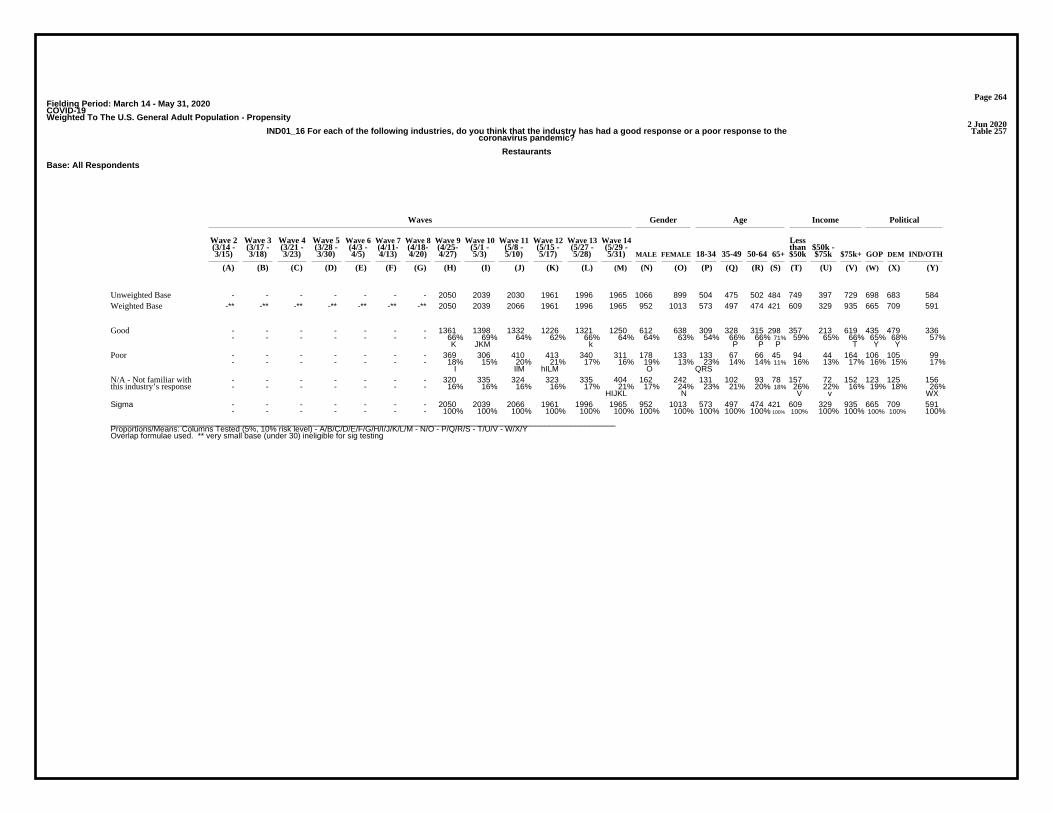
Page 264Fielding Period: March 14 - May 31, 2020COVID-19Weighted To The U.S. General Adult Population - Propensity
2 Jun 2020Table 257IND01_16 For each of the following industries, do you think that the industry has had a good response or a poor response to the
coronavirus pandemic?
Restaurants
Base: All Respondents
Waves Gender Age Income Political
Wave 2 Wave 3 Wave 4 Wave 5 Wave 6 Wave 7 Wave 8 Wave 9 Wave 10 Wave 11 Wave 12 Wave 13 Wave 14 Less(3/14 - (3/17 - (3/21 - (3/28 - (4/3 - (4/11- (4/18- (4/25- (5/1 - (5/8 - (5/15 - (5/27 - (5/29 - than $50k -3/15) 3/18) 3/23) 3/30) 4/5) 4/13) 4/20) 4/27) 5/3) 5/10) 5/17) 5/28) 5/31) MALE FEMALE 18-34 35-49 50-64 65+ $50k $75k $75k+ GOP DEM IND/OTH
(A) (B) (C) (D) (E) (F) (G) (H) (I) (J) (K) (L) (M) (N) (O) (P) (Q) (R) (S) (T) (U) (V) (W) (X) (Y)
- - - - - - - 2050 2039 2030 1961 1996 1965 1066 899 504 475 502 484 749 397 729 698 683 584Unweighted Base-** -** -** -** -** -** -** 2050 2039 2066 1961 1996 1965 952 1013 573 497 474 421 609 329 935 665 709 591Weighted Base
- - - - - - - 1361 1398 1332 1226 1321 1250 612 638 309 328 315 298 357 213 619 435 479 336- - - - - - - 66% 69% 64% 62% 66% 64% 64% 63% 54% 66% 66% 71% 59% 65% 66% 65% 68% 57%
K JKM k P P P T Y Y
Good
- - - - - - - 369 306 410 413 340 311 178 133 133 67 66 45 94 44 164 106 105 99- - - - - - - 18% 15% 20% 21% 17% 16% 19% 13% 23% 14% 14% 11% 16% 13% 17% 16% 15% 17%
I IlM hILM O QRS
Poor
- - - - - - - 320 335 324 323 335 404 162 242 131 102 93 78 157 72 152 123 125 156- - - - - - - 16% 16% 16% 16% 17% 21% 17% 24% 23% 21% 20% 18% 26% 22% 16% 19% 18% 26%
HIJKL N V v WX
N/A - Not familiar withthis industry’s response
- - - - - - - 2050 2039 2066 1961 1996 1965 952 1013 573 497 474 421 609 329 935 665 709 591- - - - - - - 100% 100% 100% 100% 100% 100% 100% 100% 100% 100% 100% 100% 100% 100% 100% 100% 100% 100%
Sigma
__________________________________________________________________________________________________________________Proportions/Means: Columns Tested (5%, 10% risk level) - A/B/C/D/E/F/G/H/I/J/K/L/M - N/O - P/Q/R/S - T/U/V - W/X/YOverlap formulae used. ** very small base (under 30) ineligible for sig testing

Page 265Fielding Period: March 14 - May 31, 2020COVID-19Weighted To The U.S. General Adult Population - Propensity
2 Jun 2020Table 258IND01_17 For each of the following industries, do you think that the industry has had a good response or a poor response to the
coronavirus pandemic?
Manufacturing
Base: All Respondents
Waves Gender Age Income Political
Wave 2 Wave 3 Wave 4 Wave 5 Wave 6 Wave 7 Wave 8 Wave 9 Wave 10 Wave 11 Wave 12 Wave 13 Wave 14 Less(3/14 - (3/17 - (3/21 - (3/28 - (4/3 - (4/11- (4/18- (4/25- (5/1 - (5/8 - (5/15 - (5/27 - (5/29 - than $50k -3/15) 3/18) 3/23) 3/30) 4/5) 4/13) 4/20) 4/27) 5/3) 5/10) 5/17) 5/28) 5/31) MALE FEMALE 18-34 35-49 50-64 65+ $50k $75k $75k+ GOP DEM IND/OTH
(A) (B) (C) (D) (E) (F) (G) (H) (I) (J) (K) (L) (M) (N) (O) (P) (Q) (R) (S) (T) (U) (V) (W) (X) (Y)
- - - - - - - 2050 2039 2030 1961 1996 1965 1066 899 504 475 502 484 749 397 729 698 683 584Unweighted Base-** -** -** -** -** -** -** 2050 2039 2066 1961 1996 1965 952 1013 573 497 474 421 609 329 935 665 709 591Weighted Base
- - - - - - - 1074 1080 1062 1021 951 964 520 445 258 288 209 209 261 157 513 361 363 240- - - - - - - 52% 53% 51% 52% 48% 49% 55% 44% 45% 58% 44% 50% 43% 48% 55% 54% 51% 41%
Lm Lm l L O PRS Tu Y Y
Good
- - - - - - - 360 348 457 369 382 309 162 147 119 68 71 52 97 51 152 92 111 106- - - - - - - 18% 17% 22% 19% 19% 16% 17% 15% 21% 14% 15% 12% 16% 15% 16% 14% 16% 18%
HIKlM m M QrS
Poor
- - - - - - - 616 611 546 571 663 691 270 422 197 141 193 160 250 122 270 212 234 245- - - - - - - 30% 30% 26% 29% 33% 35% 28% 42% 34% 28% 41% 38% 41% 37% 29% 32% 33% 41%
J J hiJK HIJK N Q Q V V WX
N/A - Not familiar withthis industry’s response
- - - - - - - 2050 2039 2066 1961 1996 1965 952 1013 573 497 474 421 609 329 935 665 709 591- - - - - - - 100% 100% 100% 100% 100% 100% 100% 100% 100% 100% 100% 100% 100% 100% 100% 100% 100% 100%
Sigma
__________________________________________________________________________________________________________________Proportions/Means: Columns Tested (5%, 10% risk level) - A/B/C/D/E/F/G/H/I/J/K/L/M - N/O - P/Q/R/S - T/U/V - W/X/YOverlap formulae used. ** very small base (under 30) ineligible for sig testing

Page 266Fielding Period: March 14 - May 31, 2020COVID-19Weighted To The U.S. General Adult Population - Propensity
2 Jun 2020Table 259IND01_18 For each of the following industries, do you think that the industry has had a good response or a poor response to the
coronavirus pandemic?
Small Businesses
Base: All Respondents
Waves Gender Age Income Political
Wave 2 Wave 3 Wave 4 Wave 5 Wave 6 Wave 7 Wave 8 Wave 9 Wave 10 Wave 11 Wave 12 Wave 13 Wave 14 Less(3/14 - (3/17 - (3/21 - (3/28 - (4/3 - (4/11- (4/18- (4/25- (5/1 - (5/8 - (5/15 - (5/27 - (5/29 - than $50k -3/15) 3/18) 3/23) 3/30) 4/5) 4/13) 4/20) 4/27) 5/3) 5/10) 5/17) 5/28) 5/31) MALE FEMALE 18-34 35-49 50-64 65+ $50k $75k $75k+ GOP DEM IND/OTH
(A) (B) (C) (D) (E) (F) (G) (H) (I) (J) (K) (L) (M) (N) (O) (P) (Q) (R) (S) (T) (U) (V) (W) (X) (Y)
- - - - - - - 2050 2039 2030 1961 1996 1965 1066 899 504 475 502 484 749 397 729 698 683 584Unweighted Base-** -** -** -** -** -** -** 2050 2039 2066 1961 1996 1965 952 1013 573 497 474 421 609 329 935 665 709 591Weighted Base
- - - - - - - 1167 1205 1198 1109 1132 1103 554 550 294 312 252 246 299 189 575 402 412 289- - - - - - - 57% 59% 58% 57% 57% 56% 58% 54% 51% 63% 53% 58% 49% 58% 61% 61% 58% 49%
PR p T T Y Y
Good
- - - - - - - 377 346 392 340 339 320 173 147 138 69 75 38 110 42 155 100 110 110- - - - - - - 18% 17% 19% 17% 17% 16% 18% 15% 24% 14% 16% 9% 18% 13% 17% 15% 15% 19%
m o QRS s S u
Poor
- - - - - - - 506 488 477 512 526 542 225 317 141 117 147 137 200 98 206 162 188 193- - - - - - - 25% 24% 23% 26% 26% 28% 24% 31% 25% 23% 31% 33% 33% 30% 22% 24% 26% 33%
j j hIJ N pQ PQ V V Wx
N/A - Not familiar withthis industry’s response
- - - - - - - 2050 2039 2066 1961 1996 1965 952 1013 573 497 474 421 609 329 935 665 709 591- - - - - - - 100% 100% 100% 100% 100% 100% 100% 100% 100% 100% 100% 100% 100% 100% 100% 100% 100% 100%
Sigma
__________________________________________________________________________________________________________________Proportions/Means: Columns Tested (5%, 10% risk level) - A/B/C/D/E/F/G/H/I/J/K/L/M - N/O - P/Q/R/S - T/U/V - W/X/YOverlap formulae used. ** very small base (under 30) ineligible for sig testing

Page 267Fielding Period: March 14 - May 31, 2020COVID-19Weighted To The U.S. General Adult Population - Propensity
2 Jun 2020Table 260IND01_19 For each of the following industries, do you think that the industry has had a good response or a poor response to the
coronavirus pandemic?
Telecommunications
Base: All Respondents
Waves Gender Age Income Political
Wave 2 Wave 3 Wave 4 Wave 5 Wave 6 Wave 7 Wave 8 Wave 9 Wave 10 Wave 11 Wave 12 Wave 13 Wave 14 Less(3/14 - (3/17 - (3/21 - (3/28 - (4/3 - (4/11- (4/18- (4/25- (5/1 - (5/8 - (5/15 - (5/27 - (5/29 - than $50k -3/15) 3/18) 3/23) 3/30) 4/5) 4/13) 4/20) 4/27) 5/3) 5/10) 5/17) 5/28) 5/31) MALE FEMALE 18-34 35-49 50-64 65+ $50k $75k $75k+ GOP DEM IND/OTH
(A) (B) (C) (D) (E) (F) (G) (H) (I) (J) (K) (L) (M) (N) (O) (P) (Q) (R) (S) (T) (U) (V) (W) (X) (Y)
- - - - - - - - 2039 2030 1961 1996 1965 1066 899 504 475 502 484 749 397 729 698 683 584Unweighted Base-** -** -** -** -** -** -** -** 2039 2066 1961 1996 1965 952 1013 573 497 474 421 609 329 935 665 709 591Weighted Base
- - - - - - - - 1176 1153 1115 1000 974 506 468 251 287 217 219 247 171 532 356 379 240- - - - - - - - 58% 56% 57% 50% 50% 53% 46% 44% 58% 46% 52% 41% 52% 57% 54% 53% 41%
LM LM LM O PR P T T Y Y
Good
- - - - - - - - 243 334 245 249 266 155 111 116 59 62 29 90 42 116 83 89 94- - - - - - - - 12% 16% 13% 12% 14% 16% 11% 20% 12% 13% 7% 15% 13% 12% 13% 13% 16%
IKLm O QRS S S
Poor
- - - - - - - - 620 579 601 747 724 290 434 206 151 195 172 272 117 287 226 242 257- - - - - - - - 30% 28% 31% 37% 37% 30% 43% 36% 30% 41% 41% 45% 35% 31% 34% 34% 44%
IJK IJK N Q Q UV WX
N/A - Not familiar withthis industry’s response
- - - - - - - - 2039 2066 1961 1996 1965 952 1013 573 497 474 421 609 329 935 665 709 591- - - - - - - - 100% 100% 100% 100% 100% 100% 100% 100% 100% 100% 100% 100% 100% 100% 100% 100% 100%
Sigma
__________________________________________________________________________________________________________________Proportions/Means: Columns Tested (5%, 10% risk level) - A/B/C/D/E/F/G/H/I/J/K/L/M - N/O - P/Q/R/S - T/U/V - W/X/YOverlap formulae used. ** very small base (under 30) ineligible for sig testing

Page 268Fielding Period: March 14 - May 31, 2020COVID-19Weighted To The U.S. General Adult Population - Propensity
2 Jun 2020Table 261IND01_20 For each of the following industries, do you think that the industry has had a good response or a poor response to the
coronavirus pandemic?
Retail - apparel
Base: All Respondents
Waves Gender Age Income Political
Wave 2 Wave 3 Wave 4 Wave 5 Wave 6 Wave 7 Wave 8 Wave 9 Wave 10 Wave 11 Wave 12 Wave 13 Wave 14 Less(3/14 - (3/17 - (3/21 - (3/28 - (4/3 - (4/11- (4/18- (4/25- (5/1 - (5/8 - (5/15 - (5/27 - (5/29 - than $50k -3/15) 3/18) 3/23) 3/30) 4/5) 4/13) 4/20) 4/27) 5/3) 5/10) 5/17) 5/28) 5/31) MALE FEMALE 18-34 35-49 50-64 65+ $50k $75k $75k+ GOP DEM IND/OTH
(A) (B) (C) (D) (E) (F) (G) (H) (I) (J) (K) (L) (M) (N) (O) (P) (Q) (R) (S) (T) (U) (V) (W) (X) (Y)
- - - - - - - - 2039 2030 1961 1996 1965 1066 899 504 475 502 484 749 397 729 698 683 584Unweighted Base-** -** -** -** -** -** -** -** 2039 2066 1961 1996 1965 952 1013 573 497 474 421 609 329 935 665 709 591Weighted Base
- - - - - - - - 1034 1069 1006 965 947 469 477 285 281 207 174 257 153 505 326 373 248- - - - - - - - 51% 52% 51% 48% 48% 49% 47% 50% 57% 44% 41% 42% 46% 54% 49% 53% 42%
lm S pRS Tu y Y
Good
- - - - - - - - 302 384 333 350 302 168 134 108 82 62 51 96 50 148 126 98 78- - - - - - - - 15% 19% 17% 18% 15% 18% 13% 19% 16% 13% 12% 16% 15% 16% 19% 14% 13%
IM i O rS XY
Poor
- - - - - - - - 703 613 622 681 716 314 402 181 135 205 196 256 127 283 213 238 265- - - - - - - - 34% 30% 32% 34% 36% 33% 40% 32% 27% 43% 47% 42% 39% 30% 32% 34% 45%
J J JK N PQ PQ V V WX
N/A - Not familiar withthis industry’s response
- - - - - - - - 2039 2066 1961 1996 1965 952 1013 573 497 474 421 609 329 935 665 709 591- - - - - - - - 100% 100% 100% 100% 100% 100% 100% 100% 100% 100% 100% 100% 100% 100% 100% 100% 100%
Sigma
__________________________________________________________________________________________________________________Proportions/Means: Columns Tested (5%, 10% risk level) - A/B/C/D/E/F/G/H/I/J/K/L/M - N/O - P/Q/R/S - T/U/V - W/X/YOverlap formulae used. ** very small base (under 30) ineligible for sig testing

Page 269Fielding Period: March 14 - May 31, 2020COVID-19Weighted To The U.S. General Adult Population - Propensity
2 Jun 2020Table 262IND01_21 For each of the following industries, do you think that the industry has had a good response or a poor response to the
coronavirus pandemic?
Energy and Utilities
Base: All Respondents
Waves Gender Age Income Political
Wave 2 Wave 3 Wave 4 Wave 5 Wave 6 Wave 7 Wave 8 Wave 9 Wave 10 Wave 11 Wave 12 Wave 13 Wave 14 Less(3/14 - (3/17 - (3/21 - (3/28 - (4/3 - (4/11- (4/18- (4/25- (5/1 - (5/8 - (5/15 - (5/27 - (5/29 - than $50k -3/15) 3/18) 3/23) 3/30) 4/5) 4/13) 4/20) 4/27) 5/3) 5/10) 5/17) 5/28) 5/31) MALE FEMALE 18-34 35-49 50-64 65+ $50k $75k $75k+ GOP DEM IND/OTH
(A) (B) (C) (D) (E) (F) (G) (H) (I) (J) (K) (L) (M) (N) (O) (P) (Q) (R) (S) (T) (U) (V) (W) (X) (Y)
- - - - - - - - - - 1961 1996 1965 1066 899 504 475 502 484 749 397 729 698 683 584Unweighted Base-** -** -** -** -** -** -** -** -** -** 1961 1996 1965 952 1013 573 497 474 421 609 329 935 665 709 591Weighted Base
- - - - - - - - - - 1112 1017 1024 495 529 272 303 215 233 292 171 528 400 378 245- - - - - - - - - - 57% 51% 52% 52% 52% 47% 61% 45% 55% 48% 52% 57% 60% 53% 42%
LM PR pR T XY Y
Good
- - - - - - - - - - 253 266 290 167 123 131 60 69 28 89 34 157 83 115 91- - - - - - - - - - 13% 13% 15% 18% 12% 23% 12% 15% 7% 15% 10% 17% 13% 16% 15%
O QRS S S U
Poor
- - - - - - - - - - 596 713 652 290 362 170 134 189 159 228 124 250 181 216 255- - - - - - - - - - 30% 36% 33% 30% 36% 30% 27% 40% 38% 37% 38% 27% 27% 30% 43%
K n PQ PQ V V WX
N/A - Not familiar withthis industry’s response
- - - - - - - - - - 1961 1996 1965 952 1013 573 497 474 421 609 329 935 665 709 591- - - - - - - - - - 100% 100% 100% 100% 100% 100% 100% 100% 100% 100% 100% 100% 100% 100% 100%
Sigma
__________________________________________________________________________________________________________________Proportions/Means: Columns Tested (5%, 10% risk level) - A/B/C/D/E/F/G/H/I/J/K/L/M - N/O - P/Q/R/S - T/U/V - W/X/YOverlap formulae used. ** very small base (under 30) ineligible for sig testing

Page 270Fielding Period: March 14 - May 31, 2020COVID-19Weighted To The U.S. General Adult Population - Propensity
2 Jun 2020Table 263IND01_22 For each of the following industries, do you think that the industry has had a good response or a poor response to the
coronavirus pandemic?
Insurance
Base: All Respondents
Waves Gender Age Income Political
Wave 2 Wave 3 Wave 4 Wave 5 Wave 6 Wave 7 Wave 8 Wave 9 Wave 10 Wave 11 Wave 12 Wave 13 Wave 14 Less(3/14 - (3/17 - (3/21 - (3/28 - (4/3 - (4/11- (4/18- (4/25- (5/1 - (5/8 - (5/15 - (5/27 - (5/29 - than $50k -3/15) 3/18) 3/23) 3/30) 4/5) 4/13) 4/20) 4/27) 5/3) 5/10) 5/17) 5/28) 5/31) MALE FEMALE 18-34 35-49 50-64 65+ $50k $75k $75k+ GOP DEM IND/OTH
(A) (B) (C) (D) (E) (F) (G) (H) (I) (J) (K) (L) (M) (N) (O) (P) (Q) (R) (S) (T) (U) (V) (W) (X) (Y)
- - - - - - - - - - 1961 1996 1965 1066 899 504 475 502 484 749 397 729 698 683 584Unweighted Base-** -** -** -** -** -** -** -** -** -** 1961 1996 1965 952 1013 573 497 474 421 609 329 935 665 709 591Weighted Base
- - - - - - - - - - 1024 964 1016 502 514 272 287 221 236 277 166 547 382 393 241- - - - - - - - - - 52% 48% 52% 53% 51% 47% 58% 47% 56% 46% 50% 58% 57% 55% 41%
l l PR PR TU Y Y
Good
- - - - - - - - - - 308 330 329 193 136 130 81 68 50 91 50 171 97 107 124- - - - - - - - - - 16% 17% 17% 20% 13% 23% 16% 14% 12% 15% 15% 18% 15% 15% 21%
O qRS WX
Poor
- - - - - - - - - - 629 702 620 256 364 172 129 185 135 240 113 217 185 208 226- - - - - - - - - - 32% 35% 32% 27% 36% 30% 26% 39% 32% 39% 34% 23% 28% 29% 38%
m N PQs V V WX
N/A - Not familiar withthis industry’s response
- - - - - - - - - - 1961 1996 1965 952 1013 573 497 474 421 609 329 935 665 709 591- - - - - - - - - - 100% 100% 100% 100% 100% 100% 100% 100% 100% 100% 100% 100% 100% 100% 100%
Sigma
__________________________________________________________________________________________________________________Proportions/Means: Columns Tested (5%, 10% risk level) - A/B/C/D/E/F/G/H/I/J/K/L/M - N/O - P/Q/R/S - T/U/V - W/X/YOverlap formulae used. ** very small base (under 30) ineligible for sig testing
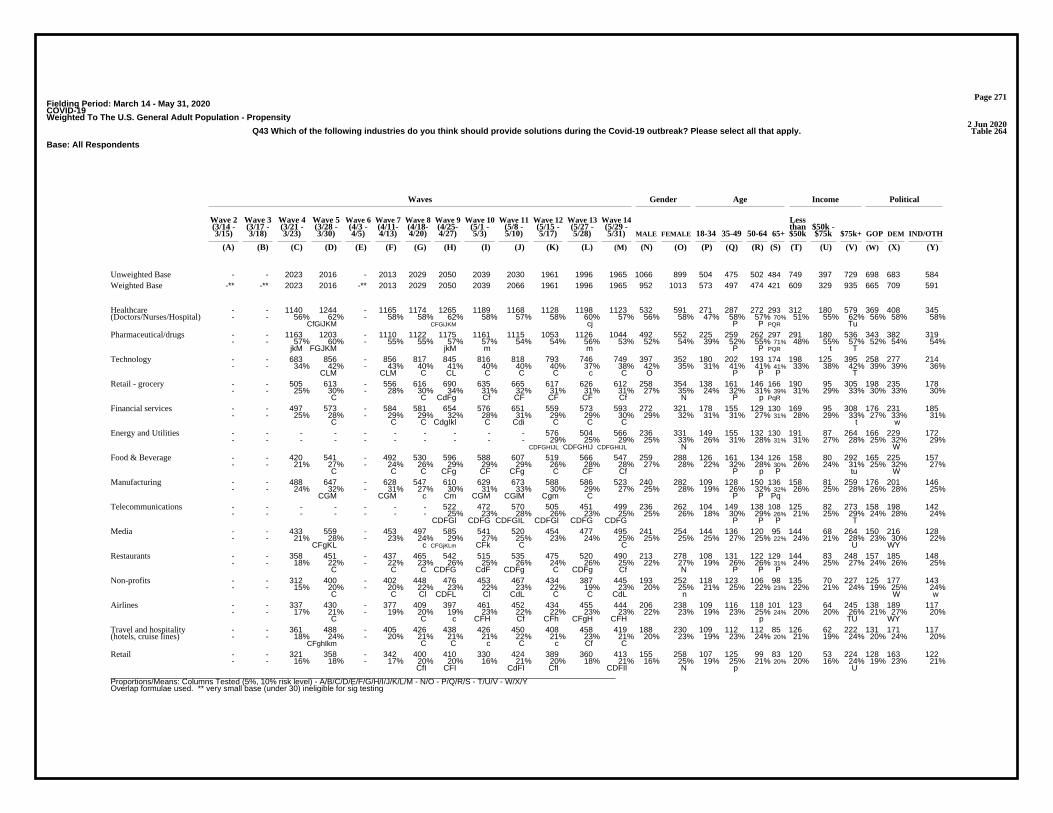
Page 271Fielding Period: March 14 - May 31, 2020COVID-19Weighted To The U.S. General Adult Population - Propensity
2 Jun 2020Table 264Q43 Which of the following industries do you think should provide solutions during the Covid-19 outbreak? Please select all that apply.
Base: All Respondents
Waves Gender Age Income Political
Wave 2 Wave 3 Wave 4 Wave 5 Wave 6 Wave 7 Wave 8 Wave 9 Wave 10 Wave 11 Wave 12 Wave 13 Wave 14 Less(3/14 - (3/17 - (3/21 - (3/28 - (4/3 - (4/11- (4/18- (4/25- (5/1 - (5/8 - (5/15 - (5/27 - (5/29 - than $50k -3/15) 3/18) 3/23) 3/30) 4/5) 4/13) 4/20) 4/27) 5/3) 5/10) 5/17) 5/28) 5/31) MALE FEMALE 18-34 35-49 50-64 65+ $50k $75k $75k+ GOP DEM IND/OTH
(A) (B) (C) (D) (E) (F) (G) (H) (I) (J) (K) (L) (M) (N) (O) (P) (Q) (R) (S) (T) (U) (V) (W) (X) (Y)
- - 2023 2016 - 2013 2029 2050 2039 2030 1961 1996 1965 1066 899 504 475 502 484 749 397 729 698 683 584Unweighted Base-** -** 2023 2016 -** 2013 2029 2050 2039 2066 1961 1996 1965 952 1013 573 497 474 421 609 329 935 665 709 591Weighted Base
- - 1140 1244 - 1165 1174 1265 1189 1168 1128 1198 1123 532 591 271 287 272 293 312 180 579 369 408 345- - 56% 62% - 58% 58% 62% 58% 57% 58% 60% 57% 56% 58% 47% 58% 57% 70% 51% 55% 62% 56% 58% 58%
CfGiJKM CFGiJKM cj P P PQR Tu
Healthcare(Doctors/Nurses/Hospital)
- - 1163 1203 - 1110 1122 1175 1161 1115 1053 1126 1044 492 552 225 259 262 297 291 180 536 343 382 319- - 57% 60% - 55% 55% 57% 57% 54% 54% 56% 53% 52% 54% 39% 52% 55% 71% 48% 55% 57% 52% 54% 54%
jkM FGJKM jkM m m P P PQR t T
Pharmaceutical/drugs
- - 683 856 - 856 817 845 816 818 793 746 749 397 352 180 202 193 174 198 125 395 258 277 214- - 34% 42% - 43% 40% 41% 40% 40% 40% 37% 38% 42% 35% 31% 41% 41% 41% 33% 38% 42% 39% 39% 36%
CLM CLM C CL C C C c C O P P P T
Technology
- - 505 613 - 556 616 690 635 665 617 626 612 258 354 138 161 146 166 190 95 305 198 235 178- - 25% 30% - 28% 30% 34% 31% 32% 31% 31% 31% 27% 35% 24% 32% 31% 39% 31% 29% 33% 30% 33% 30%
C C CdFg Cf CF CF CF Cf N P p PqR
Retail - grocery
- - 497 573 - 584 581 654 576 651 559 573 593 272 321 178 155 129 130 169 95 308 176 231 185- - 25% 28% - 29% 29% 32% 28% 31% 29% 29% 30% 29% 32% 31% 31% 27% 31% 28% 29% 33% 27% 33% 31%
C C C CdgIkl C Cdi C C C t w
Financial services
- - - - - - - - - - 576 504 566 236 331 149 155 132 130 191 87 264 166 229 172- - - - - - - - - - 29% 25% 29% 25% 33% 26% 31% 28% 31% 31% 27% 28% 25% 32% 29%
CDFGHIJL CDFGHIJ CDFGHIJL N W
Energy and Utilities
- - 420 541 - 492 530 596 588 607 519 566 547 259 288 126 161 134 126 158 80 292 165 225 157- - 21% 27% - 24% 26% 29% 29% 29% 26% 28% 28% 27% 28% 22% 32% 28% 30% 26% 24% 31% 25% 32% 27%
C C C CFg CF CFg C CF Cf P p P tu W
Food & Beverage
- - 488 647 - 628 547 610 629 673 588 586 523 240 282 109 128 150 136 158 81 259 176 201 146- - 24% 32% - 31% 27% 30% 31% 33% 30% 29% 27% 25% 28% 19% 26% 32% 32% 26% 25% 28% 26% 28% 25%
CGM CGM c Cm CGM CGlM Cgm C P P Pq
Manufacturing
- - - - - - - 522 472 570 505 451 499 236 262 104 149 138 108 125 82 273 158 198 142- - - - - - - 25% 23% 28% 26% 23% 25% 25% 26% 18% 30% 29% 26% 21% 25% 29% 24% 28% 24%
CDFGl CDFG CDFGIL CDFGl CDFG CDFG P P P T
Telecommunications
- - 433 559 - 453 497 585 541 520 454 477 495 241 254 144 136 120 95 144 68 264 150 216 128- - 21% 28% - 23% 24% 29% 27% 25% 23% 24% 25% 25% 25% 25% 27% 25% 22% 24% 21% 28% 23% 30% 22%
CFgKL c CFGjKLm CFk C C U WY
Media
- - 358 451 - 437 465 542 515 535 475 520 490 213 278 108 131 122 129 144 83 248 157 185 148- - 18% 22% - 22% 23% 26% 25% 26% 24% 26% 25% 22% 27% 19% 26% 26% 31% 24% 25% 27% 24% 26% 25%
C C C CDFG CdF CDFg C CDFg Cf N P P P
Restaurants
- - 312 400 - 402 448 476 453 467 434 387 445 193 252 118 123 106 98 135 70 227 125 177 143- - 15% 20% - 20% 22% 23% 22% 23% 22% 19% 23% 20% 25% 21% 25% 22% 23% 22% 21% 24% 19% 25% 24%
C C Cl CDFL Cl CdL C C CdL n W w
Non-profits
- - 337 430 - 377 409 397 461 452 434 455 444 206 238 109 116 118 101 123 64 245 138 189 117- - 17% 21% - 19% 20% 19% 23% 22% 22% 23% 23% 22% 23% 19% 23% 25% 24% 20% 20% 26% 21% 27% 20%
C C c CFH Cf CFh CFgH CFH p TU WY
Airlines
- - 361 488 - 405 426 438 426 450 408 458 419 188 230 109 112 112 85 126 62 222 131 171 117- - 18% 24% - 20% 21% 21% 21% 22% 21% 23% 21% 20% 23% 19% 23% 24% 20% 21% 19% 24% 20% 24% 20%
CFghIkm C C c C c Cf C
Travel and hospitality(hotels, cruise lines)
- - 321 358 - 342 400 410 330 424 389 360 413 155 258 107 125 99 83 120 53 224 128 163 122- - 16% 18% - 17% 20% 20% 16% 21% 20% 18% 21% 16% 25% 19% 25% 21% 20% 20% 16% 24% 19% 23% 21%
CfI CFI CdFI CfI CDFIl N p U
Retail
__________________________________________________________________________________________________________________Proportions/Means: Columns Tested (5%, 10% risk level) - A/B/C/D/E/F/G/H/I/J/K/L/M - N/O - P/Q/R/S - T/U/V - W/X/YOverlap formulae used. ** very small base (under 30) ineligible for sig testing
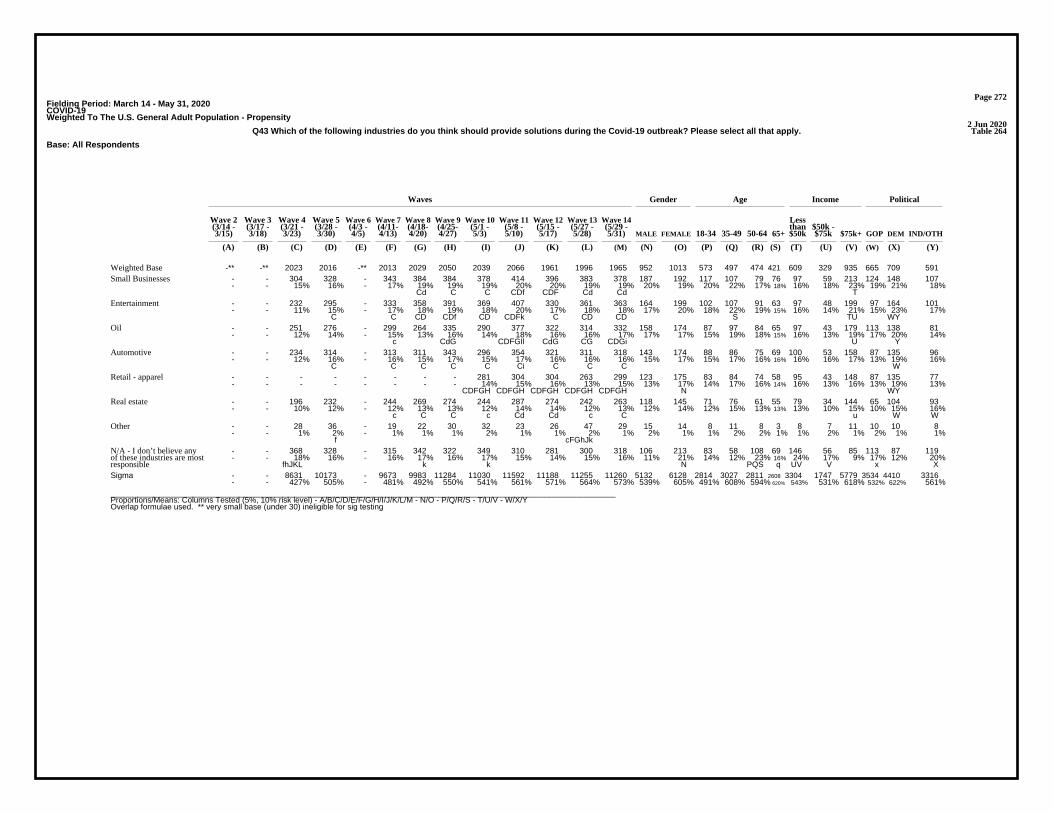
Page 272Fielding Period: March 14 - May 31, 2020COVID-19Weighted To The U.S. General Adult Population - Propensity
2 Jun 2020Table 264Q43 Which of the following industries do you think should provide solutions during the Covid-19 outbreak? Please select all that apply.
Base: All Respondents
Waves Gender Age Income Political
Wave 2 Wave 3 Wave 4 Wave 5 Wave 6 Wave 7 Wave 8 Wave 9 Wave 10 Wave 11 Wave 12 Wave 13 Wave 14 Less(3/14 - (3/17 - (3/21 - (3/28 - (4/3 - (4/11- (4/18- (4/25- (5/1 - (5/8 - (5/15 - (5/27 - (5/29 - than $50k -3/15) 3/18) 3/23) 3/30) 4/5) 4/13) 4/20) 4/27) 5/3) 5/10) 5/17) 5/28) 5/31) MALE FEMALE 18-34 35-49 50-64 65+ $50k $75k $75k+ GOP DEM IND/OTH
(A) (B) (C) (D) (E) (F) (G) (H) (I) (J) (K) (L) (M) (N) (O) (P) (Q) (R) (S) (T) (U) (V) (W) (X) (Y)
-** -** 2023 2016 -** 2013 2029 2050 2039 2066 1961 1996 1965 952 1013 573 497 474 421 609 329 935 665 709 591Weighted Base- - 304 328 - 343 384 384 378 414 396 383 378 187 192 117 107 79 76 97 59 213 124 148 107- - 15% 16% - 17% 19% 19% 19% 20% 20% 19% 19% 20% 19% 20% 22% 17% 18% 16% 18% 23% 19% 21% 18%
Cd C C CDf CDF Cd Cd T
Small Businesses
- - 232 295 - 333 358 391 369 407 330 361 363 164 199 102 107 91 63 97 48 199 97 164 101- - 11% 15% - 17% 18% 19% 18% 20% 17% 18% 18% 17% 20% 18% 22% 19% 15% 16% 14% 21% 15% 23% 17%
C C CD CDf CD CDFk C CD CD S TU WY
Entertainment
- - 251 276 - 299 264 335 290 377 322 314 332 158 174 87 97 84 65 97 43 179 113 138 81- - 12% 14% - 15% 13% 16% 14% 18% 16% 16% 17% 17% 17% 15% 19% 18% 15% 16% 13% 19% 17% 20% 14%
c CdG CDFGIl CdG CG CDGi U Y
Oil
- - 234 314 - 313 311 343 296 354 321 311 318 143 174 88 86 75 69 100 53 158 87 135 96- - 12% 16% - 16% 15% 17% 15% 17% 16% 16% 16% 15% 17% 15% 17% 16% 16% 16% 16% 17% 13% 19% 16%
C C C C C Ci C C C W
Automotive
- - - - - - - - 281 304 304 263 299 123 175 83 84 74 58 95 43 148 87 135 77- - - - - - - - 14% 15% 16% 13% 15% 13% 17% 14% 17% 16% 14% 16% 13% 16% 13% 19% 13%
CDFGH CDFGH CDFGH CDFGH CDFGH N WY
Retail - apparel
- - 196 232 - 244 269 274 244 287 274 242 263 118 145 71 76 61 55 79 34 144 65 104 93- - 10% 12% - 12% 13% 13% 12% 14% 14% 12% 13% 12% 14% 12% 15% 13% 13% 13% 10% 15% 10% 15% 16%
c C C c Cd Cd c C u W W
Real estate
- - 28 36 - 19 22 30 32 23 26 47 29 15 14 8 11 8 3 8 7 11 10 10 8- - 1% 2% - 1% 1% 1% 2% 1% 1% 2% 1% 2% 1% 1% 2% 2% 1% 1% 2% 1% 2% 1% 1%
f cFGhJk
Other
- - 368 328 - 315 342 322 349 310 281 300 318 106 213 83 58 108 69 146 56 85 113 87 119- - 18% 16% - 16% 17% 16% 17% 15% 14% 15% 16% 11% 21% 14% 12% 23% 16% 24% 17% 9% 17% 12% 20%
fhJKL k k N PQS q UV V x X
N/A - I don’t believe anyof these industries are mostresponsible
- - 8631 10173 - 9673 9983 11284 11030 11592 11188 11255 11260 5132 6128 2814 3027 2811 2608 3304 1747 5779 3534 4410 3316- - 427% 505% - 481% 492% 550% 541% 561% 571% 564% 573% 539% 605% 491% 608% 594% 620% 543% 531% 618% 532% 622% 561%
Sigma
__________________________________________________________________________________________________________________Proportions/Means: Columns Tested (5%, 10% risk level) - A/B/C/D/E/F/G/H/I/J/K/L/M - N/O - P/Q/R/S - T/U/V - W/X/YOverlap formulae used. ** very small base (under 30) ineligible for sig testing
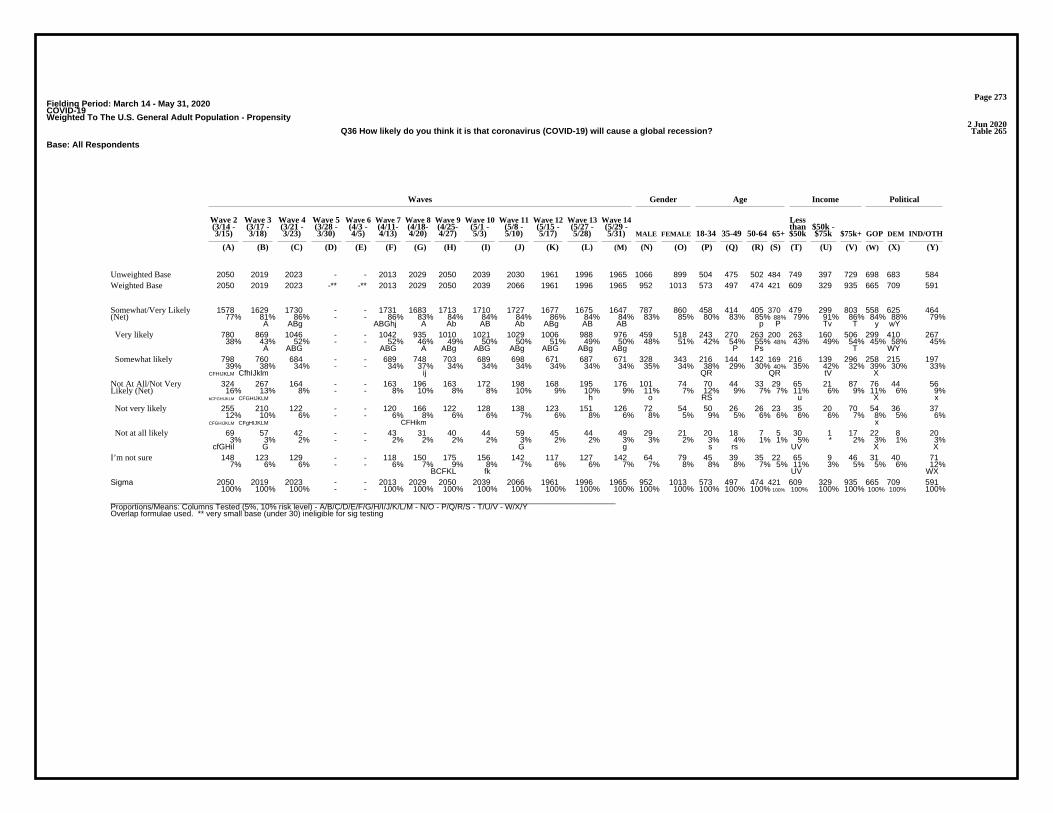
Page 273Fielding Period: March 14 - May 31, 2020COVID-19Weighted To The U.S. General Adult Population - Propensity
2 Jun 2020Table 265Q36 How likely do you think it is that coronavirus (COVID-19) will cause a global recession?
Base: All Respondents
Waves Gender Age Income Political
Wave 2 Wave 3 Wave 4 Wave 5 Wave 6 Wave 7 Wave 8 Wave 9 Wave 10 Wave 11 Wave 12 Wave 13 Wave 14 Less(3/14 - (3/17 - (3/21 - (3/28 - (4/3 - (4/11- (4/18- (4/25- (5/1 - (5/8 - (5/15 - (5/27 - (5/29 - than $50k -3/15) 3/18) 3/23) 3/30) 4/5) 4/13) 4/20) 4/27) 5/3) 5/10) 5/17) 5/28) 5/31) MALE FEMALE 18-34 35-49 50-64 65+ $50k $75k $75k+ GOP DEM IND/OTH
(A) (B) (C) (D) (E) (F) (G) (H) (I) (J) (K) (L) (M) (N) (O) (P) (Q) (R) (S) (T) (U) (V) (W) (X) (Y)
2050 2019 2023 - - 2013 2029 2050 2039 2030 1961 1996 1965 1066 899 504 475 502 484 749 397 729 698 683 584Unweighted Base2050 2019 2023 -** -** 2013 2029 2050 2039 2066 1961 1996 1965 952 1013 573 497 474 421 609 329 935 665 709 591Weighted Base
1578 1629 1730 - - 1731 1683 1713 1710 1727 1677 1675 1647 787 860 458 414 405 370 479 299 803 558 625 46477% 81% 86% - - 86% 83% 84% 84% 84% 86% 84% 84% 83% 85% 80% 83% 85% 88% 79% 91% 86% 84% 88% 79%
A ABg ABGhj A Ab AB Ab ABg AB AB p P Tv T y wY
Somewhat/Very Likely(Net)
780 869 1046 - - 1042 935 1010 1021 1029 1006 988 976 459 518 243 270 263 200 263 160 506 299 410 26738% 43% 52% - - 52% 46% 49% 50% 50% 51% 49% 50% 48% 51% 42% 54% 55% 48% 43% 49% 54% 45% 58% 45%
A ABG ABG A ABg ABG ABg ABG ABg ABg P Ps T WY
Very likely
798 760 684 - - 689 748 703 689 698 671 687 671 328 343 216 144 142 169 216 139 296 258 215 19739% 38% 34% - - 34% 37% 34% 34% 34% 34% 34% 34% 35% 34% 38% 29% 30% 40% 35% 42% 32% 39% 30% 33%
CFHIJKLM CfhIJklm ij QR QR tV X
Somewhat likely
324 267 164 - - 163 196 163 172 198 168 195 176 101 74 70 44 33 29 65 21 87 76 44 5616% 13% 8% - - 8% 10% 8% 8% 10% 9% 10% 9% 11% 7% 12% 9% 7% 7% 11% 6% 9% 11% 6% 9%
bCFGHIJKLM CFGHIJKLM h o RS u X x
Not At All/Not VeryLikely (Net)
255 210 122 - - 120 166 122 128 138 123 151 126 72 54 50 26 26 23 35 20 70 54 36 3712% 10% 6% - - 6% 8% 6% 6% 7% 6% 8% 6% 8% 5% 9% 5% 6% 6% 6% 6% 7% 8% 5% 6%
CFGHIJKLM CFgHIJKLM CFHikm x
Not very likely
69 57 42 - - 43 31 40 44 59 45 44 49 29 21 20 18 7 5 30 1 17 22 8 203% 3% 2% - - 2% 2% 2% 2% 3% 2% 2% 3% 3% 2% 3% 4% 1% 1% 5% * 2% 3% 1% 3%
cfGHil G G g s rs UV X X
Not at all likely
148 123 129 - - 118 150 175 156 142 117 127 142 64 79 45 39 35 22 65 9 46 31 40 717% 6% 6% - - 6% 7% 9% 8% 7% 6% 6% 7% 7% 8% 8% 8% 7% 5% 11% 3% 5% 5% 6% 12%
BCFKL fk UV WX
I’m not sure
2050 2019 2023 - - 2013 2029 2050 2039 2066 1961 1996 1965 952 1013 573 497 474 421 609 329 935 665 709 591100% 100% 100% - - 100% 100% 100% 100% 100% 100% 100% 100% 100% 100% 100% 100% 100% 100% 100% 100% 100% 100% 100% 100%
Sigma
__________________________________________________________________________________________________________________Proportions/Means: Columns Tested (5%, 10% risk level) - A/B/C/D/E/F/G/H/I/J/K/L/M - N/O - P/Q/R/S - T/U/V - W/X/YOverlap formulae used. ** very small base (under 30) ineligible for sig testing

Page 274Fielding Period: March 14 - May 31, 2020COVID-19Weighted To The U.S. General Adult Population - Propensity
2 Jun 2020Table 266Q36A Would you say we are in a global recession due to the coronavirus outbreak?
Base: All Respondents
Waves Gender Age Income Political
Wave 2 Wave 3 Wave 4 Wave 5 Wave 6 Wave 7 Wave 8 Wave 9 Wave 10 Wave 11 Wave 12 Wave 13 Wave 14 Less(3/14 - (3/17 - (3/21 - (3/28 - (4/3 - (4/11- (4/18- (4/25- (5/1 - (5/8 - (5/15 - (5/27 - (5/29 - than $50k -3/15) 3/18) 3/23) 3/30) 4/5) 4/13) 4/20) 4/27) 5/3) 5/10) 5/17) 5/28) 5/31) MALE FEMALE 18-34 35-49 50-64 65+ $50k $75k $75k+ GOP DEM IND/OTH
(A) (B) (C) (D) (E) (F) (G) (H) (I) (J) (K) (L) (M) (N) (O) (P) (Q) (R) (S) (T) (U) (V) (W) (X) (Y)
- - - 2016 1993 2013 2029 2050 2039 2030 1961 1996 1965 1066 899 504 475 502 484 749 397 729 698 683 584Unweighted Base-** -** -** 2016 1993 2013 2029 2050 2039 2066 1961 1996 1965 952 1013 573 497 474 421 609 329 935 665 709 591Weighted Base
- - - 1689 1793 1558 1522 1583 1614 1601 1496 1485 1508 718 790 429 385 379 315 485 260 699 483 577 448- - - 84% 90% 77% 75% 77% 79% 77% 76% 74% 77% 75% 78% 75% 77% 80% 75% 80% 79% 75% 73% 81% 76%
FGHIJKLM DFGHIJKLM l l GkL l v Wy
Yes
- - - 327 200 455 507 467 425 465 465 511 457 233 224 144 112 95 106 124 69 236 181 133 143- - - 16% 10% 23% 25% 23% 21% 23% 24% 26% 23% 25% 22% 25% 23% 20% 25% 20% 21% 25% 27% 19% 24%
E DE DEI DE DE DE DEi DEfhIj DE t X x
No
- - - 2016 1993 2013 2029 2050 2039 2066 1961 1996 1965 952 1013 573 497 474 421 609 329 935 665 709 591- - - 100% 100% 100% 100% 100% 100% 100% 100% 100% 100% 100% 100% 100% 100% 100% 100% 100% 100% 100% 100% 100% 100%
Sigma
__________________________________________________________________________________________________________________Proportions/Means: Columns Tested (5%, 10% risk level) - A/B/C/D/E/F/G/H/I/J/K/L/M - N/O - P/Q/R/S - T/U/V - W/X/YOverlap formulae used. ** very small base (under 30) ineligible for sig testing
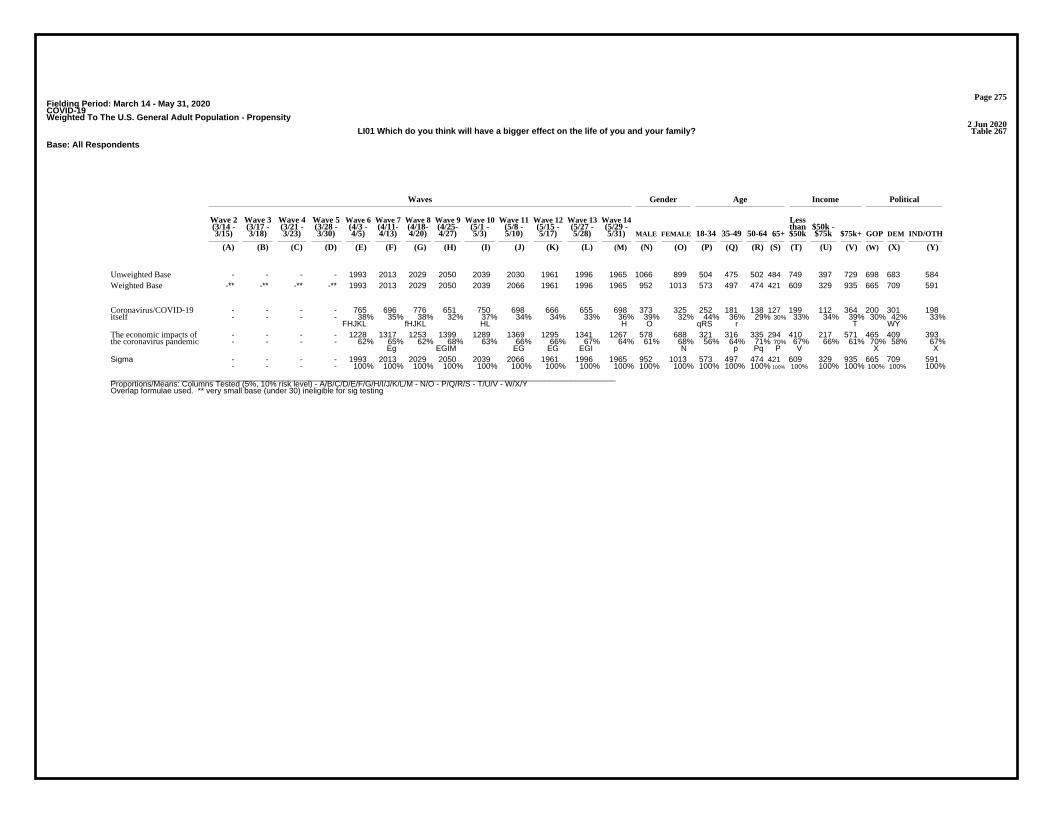
Page 275Fielding Period: March 14 - May 31, 2020COVID-19Weighted To The U.S. General Adult Population - Propensity
2 Jun 2020Table 267LI01 Which do you think will have a bigger effect on the life of you and your family?
Base: All Respondents
Waves Gender Age Income Political
Wave 2 Wave 3 Wave 4 Wave 5 Wave 6 Wave 7 Wave 8 Wave 9 Wave 10 Wave 11 Wave 12 Wave 13 Wave 14 Less(3/14 - (3/17 - (3/21 - (3/28 - (4/3 - (4/11- (4/18- (4/25- (5/1 - (5/8 - (5/15 - (5/27 - (5/29 - than $50k -3/15) 3/18) 3/23) 3/30) 4/5) 4/13) 4/20) 4/27) 5/3) 5/10) 5/17) 5/28) 5/31) MALE FEMALE 18-34 35-49 50-64 65+ $50k $75k $75k+ GOP DEM IND/OTH
(A) (B) (C) (D) (E) (F) (G) (H) (I) (J) (K) (L) (M) (N) (O) (P) (Q) (R) (S) (T) (U) (V) (W) (X) (Y)
- - - - 1993 2013 2029 2050 2039 2030 1961 1996 1965 1066 899 504 475 502 484 749 397 729 698 683 584Unweighted Base-** -** -** -** 1993 2013 2029 2050 2039 2066 1961 1996 1965 952 1013 573 497 474 421 609 329 935 665 709 591Weighted Base
- - - - 765 696 776 651 750 698 666 655 698 373 325 252 181 138 127 199 112 364 200 301 198- - - - 38% 35% 38% 32% 37% 34% 34% 33% 36% 39% 32% 44% 36% 29% 30% 33% 34% 39% 30% 42% 33%
FHJKL fHJKL HL H O qRS r T WY
Coronavirus/COVID-19itself
- - - - 1228 1317 1253 1399 1289 1369 1295 1341 1267 578 688 321 316 335 294 410 217 571 465 409 393- - - - 62% 65% 62% 68% 63% 66% 66% 67% 64% 61% 68% 56% 64% 71% 70% 67% 66% 61% 70% 58% 67%
Eg EGIM EG EG EGI N p Pq P V X X
The economic impacts ofthe coronavirus pandemic
- - - - 1993 2013 2029 2050 2039 2066 1961 1996 1965 952 1013 573 497 474 421 609 329 935 665 709 591- - - - 100% 100% 100% 100% 100% 100% 100% 100% 100% 100% 100% 100% 100% 100% 100% 100% 100% 100% 100% 100% 100%
Sigma
__________________________________________________________________________________________________________________Proportions/Means: Columns Tested (5%, 10% risk level) - A/B/C/D/E/F/G/H/I/J/K/L/M - N/O - P/Q/R/S - T/U/V - W/X/YOverlap formulae used. ** very small base (under 30) ineligible for sig testing
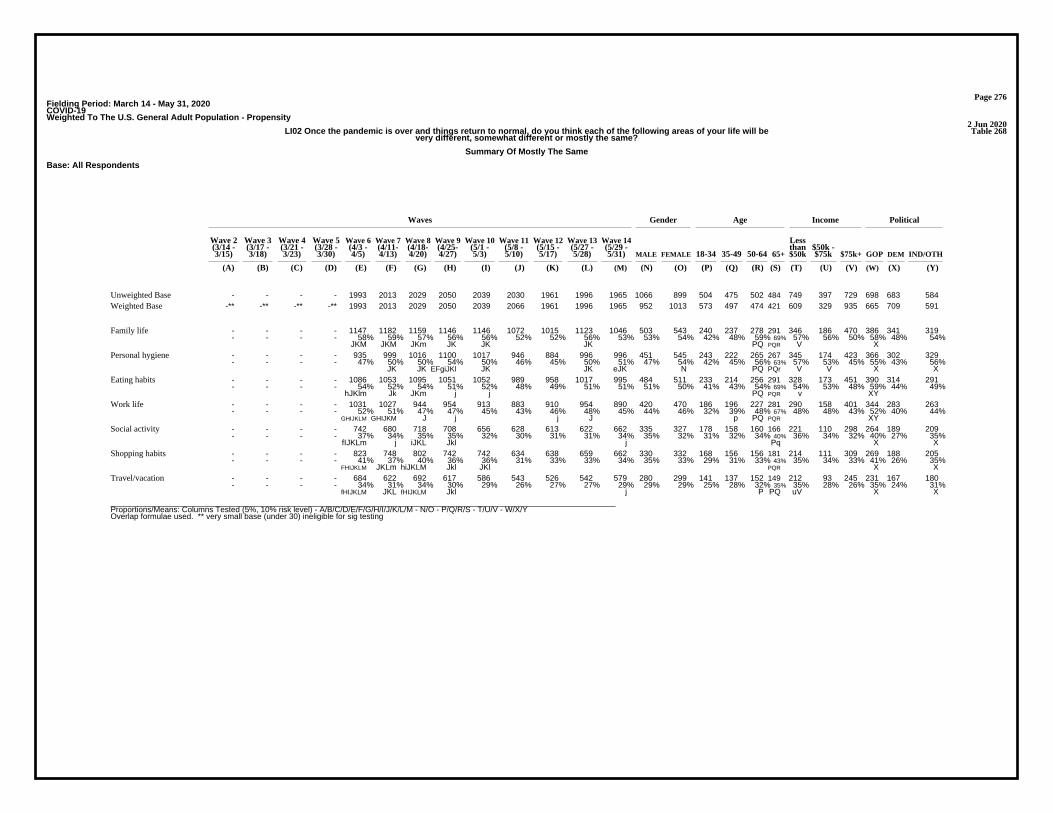
Page 276Fielding Period: March 14 - May 31, 2020COVID-19Weighted To The U.S. General Adult Population - Propensity
2 Jun 2020Table 268LI02 Once the pandemic is over and things return to normal, do you think each of the following areas of your life will be
very different, somewhat different or mostly the same?
Summary Of Mostly The Same
Base: All Respondents
Waves Gender Age Income Political
Wave 2 Wave 3 Wave 4 Wave 5 Wave 6 Wave 7 Wave 8 Wave 9 Wave 10 Wave 11 Wave 12 Wave 13 Wave 14 Less(3/14 - (3/17 - (3/21 - (3/28 - (4/3 - (4/11- (4/18- (4/25- (5/1 - (5/8 - (5/15 - (5/27 - (5/29 - than $50k -3/15) 3/18) 3/23) 3/30) 4/5) 4/13) 4/20) 4/27) 5/3) 5/10) 5/17) 5/28) 5/31) MALE FEMALE 18-34 35-49 50-64 65+ $50k $75k $75k+ GOP DEM IND/OTH
(A) (B) (C) (D) (E) (F) (G) (H) (I) (J) (K) (L) (M) (N) (O) (P) (Q) (R) (S) (T) (U) (V) (W) (X) (Y)
- - - - 1993 2013 2029 2050 2039 2030 1961 1996 1965 1066 899 504 475 502 484 749 397 729 698 683 584Unweighted Base-** -** -** -** 1993 2013 2029 2050 2039 2066 1961 1996 1965 952 1013 573 497 474 421 609 329 935 665 709 591Weighted Base
- - - - 1147 1182 1159 1146 1146 1072 1015 1123 1046 503 543 240 237 278 291 346 186 470 386 341 319- - - - 58% 59% 57% 56% 56% 52% 52% 56% 53% 53% 54% 42% 48% 59% 69% 57% 56% 50% 58% 48% 54%
JKM JKM JKm JK JK JK PQ PQR V X
Family life
- - - - 935 999 1016 1100 1017 946 884 996 996 451 545 243 222 265 267 345 174 423 366 302 329- - - - 47% 50% 50% 54% 50% 46% 45% 50% 51% 47% 54% 42% 45% 56% 63% 57% 53% 45% 55% 43% 56%
JK JK EFgiJKl JK JK eJK N PQ PQr V V X X
Personal hygiene
- - - - 1086 1053 1095 1051 1052 989 958 1017 995 484 511 233 214 256 291 328 173 451 390 314 291- - - - 54% 52% 54% 51% 52% 48% 49% 51% 51% 51% 50% 41% 43% 54% 69% 54% 53% 48% 59% 44% 49%
hJKlm Jk JKm j j PQ PQR v XY
Eating habits
- - - - 1031 1027 944 954 913 883 910 954 890 420 470 186 196 227 281 290 158 401 344 283 263- - - - 52% 51% 47% 47% 45% 43% 46% 48% 45% 44% 46% 32% 39% 48% 67% 48% 48% 43% 52% 40% 44%
GHIJKLM GHIJKM J j j J p PQ PQR XY
Work life
- - - - 742 680 718 708 656 628 613 622 662 335 327 178 158 160 166 221 110 298 264 189 209- - - - 37% 34% 35% 35% 32% 30% 31% 31% 34% 35% 32% 31% 32% 34% 40% 36% 34% 32% 40% 27% 35%
fIJKLm j iJKL Jkl j Pq X X
Social activity
- - - - 823 748 802 742 742 634 638 659 662 330 332 168 156 156 181 214 111 309 269 188 205- - - - 41% 37% 40% 36% 36% 31% 33% 33% 34% 35% 33% 29% 31% 33% 43% 35% 34% 33% 41% 26% 35%
FHIJKLM JKLm hiJKLM Jkl JKl PQR X X
Shopping habits
- - - - 684 622 692 617 586 543 526 542 579 280 299 141 137 152 149 212 93 245 231 167 180- - - - 34% 31% 34% 30% 29% 26% 27% 27% 29% 29% 29% 25% 28% 32% 35% 35% 28% 26% 35% 24% 31%
fHIJKLM JKL fHIJKLM Jkl j P PQ uV X X
Travel/vacation
__________________________________________________________________________________________________________________Proportions/Means: Columns Tested (5%, 10% risk level) - A/B/C/D/E/F/G/H/I/J/K/L/M - N/O - P/Q/R/S - T/U/V - W/X/YOverlap formulae used. ** very small base (under 30) ineligible for sig testing
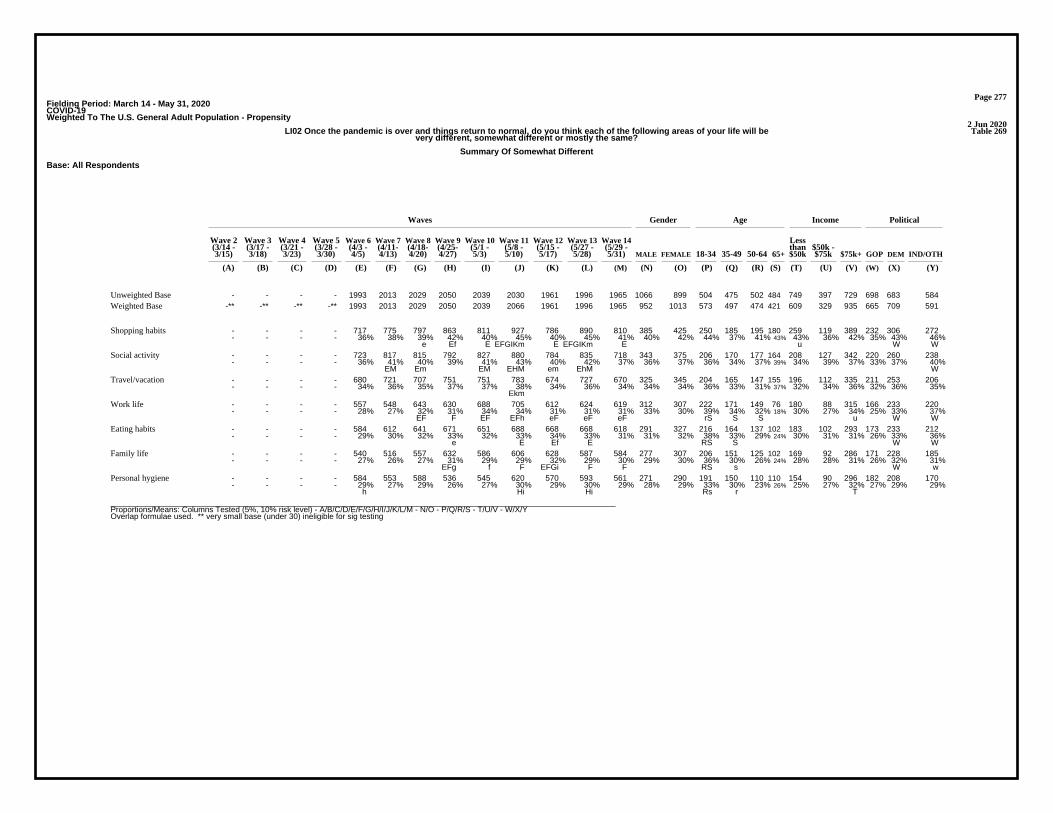
Page 277Fielding Period: March 14 - May 31, 2020COVID-19Weighted To The U.S. General Adult Population - Propensity
2 Jun 2020Table 269LI02 Once the pandemic is over and things return to normal, do you think each of the following areas of your life will be
very different, somewhat different or mostly the same?
Summary Of Somewhat Different
Base: All Respondents
Waves Gender Age Income Political
Wave 2 Wave 3 Wave 4 Wave 5 Wave 6 Wave 7 Wave 8 Wave 9 Wave 10 Wave 11 Wave 12 Wave 13 Wave 14 Less(3/14 - (3/17 - (3/21 - (3/28 - (4/3 - (4/11- (4/18- (4/25- (5/1 - (5/8 - (5/15 - (5/27 - (5/29 - than $50k -3/15) 3/18) 3/23) 3/30) 4/5) 4/13) 4/20) 4/27) 5/3) 5/10) 5/17) 5/28) 5/31) MALE FEMALE 18-34 35-49 50-64 65+ $50k $75k $75k+ GOP DEM IND/OTH
(A) (B) (C) (D) (E) (F) (G) (H) (I) (J) (K) (L) (M) (N) (O) (P) (Q) (R) (S) (T) (U) (V) (W) (X) (Y)
- - - - 1993 2013 2029 2050 2039 2030 1961 1996 1965 1066 899 504 475 502 484 749 397 729 698 683 584Unweighted Base-** -** -** -** 1993 2013 2029 2050 2039 2066 1961 1996 1965 952 1013 573 497 474 421 609 329 935 665 709 591Weighted Base
- - - - 717 775 797 863 811 927 786 890 810 385 425 250 185 195 180 259 119 389 232 306 272- - - - 36% 38% 39% 42% 40% 45% 40% 45% 41% 40% 42% 44% 37% 41% 43% 43% 36% 42% 35% 43% 46%
e Ef E EFGIKm E EFGIKm E u W W
Shopping habits
- - - - 723 817 815 792 827 880 784 835 718 343 375 206 170 177 164 208 127 342 220 260 238- - - - 36% 41% 40% 39% 41% 43% 40% 42% 37% 36% 37% 36% 34% 37% 39% 34% 39% 37% 33% 37% 40%
EM Em EM EHM em EhM W
Social activity
- - - - 680 721 707 751 751 783 674 727 670 325 345 204 165 147 155 196 112 335 211 253 206- - - - 34% 36% 35% 37% 37% 38% 34% 36% 34% 34% 34% 36% 33% 31% 37% 32% 34% 36% 32% 36% 35%
Ekm
Travel/vacation
- - - - 557 548 643 630 688 705 612 624 619 312 307 222 171 149 76 180 88 315 166 233 220- - - - 28% 27% 32% 31% 34% 34% 31% 31% 31% 33% 30% 39% 34% 32% 18% 30% 27% 34% 25% 33% 37%
EF F EF EFh eF eF eF rS S S u W W
Work life
- - - - 584 612 641 671 651 688 668 668 618 291 327 216 164 137 102 183 102 293 173 233 212- - - - 29% 30% 32% 33% 32% 33% 34% 33% 31% 31% 32% 38% 33% 29% 24% 30% 31% 31% 26% 33% 36%
e E Ef E RS S W W
Eating habits
- - - - 540 516 557 632 586 606 628 587 584 277 307 206 151 125 102 169 92 286 171 228 185- - - - 27% 26% 27% 31% 29% 29% 32% 29% 30% 29% 30% 36% 30% 26% 24% 28% 28% 31% 26% 32% 31%
EFg f F EFGi F F RS s W w
Family life
- - - - 584 553 588 536 545 620 570 593 561 271 290 191 150 110 110 154 90 296 182 208 170- - - - 29% 27% 29% 26% 27% 30% 29% 30% 29% 28% 29% 33% 30% 23% 26% 25% 27% 32% 27% 29% 29%
h Hi Hi Rs r T
Personal hygiene
__________________________________________________________________________________________________________________Proportions/Means: Columns Tested (5%, 10% risk level) - A/B/C/D/E/F/G/H/I/J/K/L/M - N/O - P/Q/R/S - T/U/V - W/X/YOverlap formulae used. ** very small base (under 30) ineligible for sig testing

Page 278Fielding Period: March 14 - May 31, 2020COVID-19Weighted To The U.S. General Adult Population - Propensity
2 Jun 2020Table 270LI02 Once the pandemic is over and things return to normal, do you think each of the following areas of your life will be
very different, somewhat different or mostly the same?
Summary Of Very Different
Base: All Respondents
Waves Gender Age Income Political
Wave 2 Wave 3 Wave 4 Wave 5 Wave 6 Wave 7 Wave 8 Wave 9 Wave 10 Wave 11 Wave 12 Wave 13 Wave 14 Less(3/14 - (3/17 - (3/21 - (3/28 - (4/3 - (4/11- (4/18- (4/25- (5/1 - (5/8 - (5/15 - (5/27 - (5/29 - than $50k -3/15) 3/18) 3/23) 3/30) 4/5) 4/13) 4/20) 4/27) 5/3) 5/10) 5/17) 5/28) 5/31) MALE FEMALE 18-34 35-49 50-64 65+ $50k $75k $75k+ GOP DEM IND/OTH
(A) (B) (C) (D) (E) (F) (G) (H) (I) (J) (K) (L) (M) (N) (O) (P) (Q) (R) (S) (T) (U) (V) (W) (X) (Y)
- - - - 1993 2013 2029 2050 2039 2030 1961 1996 1965 1066 899 504 475 502 484 749 397 729 698 683 584Unweighted Base-** -** -** -** 1993 2013 2029 2050 2039 2066 1961 1996 1965 952 1013 573 497 474 421 609 329 935 665 709 591Weighted Base
- - - - 630 670 631 681 702 741 761 727 716 346 370 229 196 175 117 200 125 355 222 289 205- - - - 32% 33% 31% 33% 34% 36% 39% 36% 36% 36% 37% 40% 39% 37% 28% 33% 38% 38% 33% 41% 35%
g EG EFGHI EfGh EGh S S S Wy
Travel/vacation
- - - - 528 516 496 549 556 559 564 538 584 273 312 189 169 137 90 180 91 295 181 260 144- - - - 26% 26% 24% 27% 27% 27% 29% 27% 30% 29% 31% 33% 34% 29% 21% 30% 28% 32% 27% 37% 24%
g fG eFG S S S WY
Social activity
- - - - 453 490 430 446 487 506 537 447 493 236 257 155 156 122 59 135 99 237 163 215 114- - - - 23% 24% 21% 22% 24% 24% 27% 22% 25% 25% 25% 27% 31% 26% 14% 22% 30% 25% 25% 30% 19%
g Gh EfGHIL GH S S S T y wY
Shopping habits
- - - - 405 438 441 466 438 479 438 419 456 220 237 165 131 97 63 139 83 219 155 193 109- - - - 20% 22% 22% 23% 21% 23% 22% 21% 23% 23% 23% 29% 26% 20% 15% 23% 25% 23% 23% 27% 18%
e e RS rS s Y
Work life
- - - - 474 461 425 414 476 501 507 407 408 230 179 139 126 99 44 110 65 216 117 199 93- - - - 24% 23% 21% 20% 23% 24% 26% 20% 21% 24% 18% 24% 25% 21% 11% 18% 20% 23% 18% 28% 16%
gHLm h hl GHLM fGHLM O S S S t WY
Personal hygiene
- - - - 323 348 293 329 336 390 335 311 352 177 175 124 119 81 28 98 54 191 102 162 88- - - - 16% 17% 14% 16% 16% 19% 17% 16% 18% 19% 17% 22% 24% 17% 7% 16% 16% 20% 15% 23% 15%
G eGhL g G S RS S t WY
Eating habits
- - - - 306 316 313 272 306 389 317 286 335 172 164 127 109 70 29 94 51 180 108 141 87- - - - 15% 16% 15% 13% 15% 19% 16% 14% 17% 18% 16% 22% 22% 15% 7% 15% 15% 19% 16% 20% 15%
h EFGHIkL H Hl RS RS S y
Family life
__________________________________________________________________________________________________________________Proportions/Means: Columns Tested (5%, 10% risk level) - A/B/C/D/E/F/G/H/I/J/K/L/M - N/O - P/Q/R/S - T/U/V - W/X/YOverlap formulae used. ** very small base (under 30) ineligible for sig testing

Page 279Fielding Period: March 14 - May 31, 2020COVID-19Weighted To The U.S. General Adult Population - Propensity
2 Jun 2020Table 271LI02_1 Once the pandemic is over and things return to normal, do you think each of the following areas of your life will be
very different, somewhat different or mostly the same?
Shopping habits
Base: All Respondents
Waves Gender Age Income Political
Wave 2 Wave 3 Wave 4 Wave 5 Wave 6 Wave 7 Wave 8 Wave 9 Wave 10 Wave 11 Wave 12 Wave 13 Wave 14 Less(3/14 - (3/17 - (3/21 - (3/28 - (4/3 - (4/11- (4/18- (4/25- (5/1 - (5/8 - (5/15 - (5/27 - (5/29 - than $50k -3/15) 3/18) 3/23) 3/30) 4/5) 4/13) 4/20) 4/27) 5/3) 5/10) 5/17) 5/28) 5/31) MALE FEMALE 18-34 35-49 50-64 65+ $50k $75k $75k+ GOP DEM IND/OTH
(A) (B) (C) (D) (E) (F) (G) (H) (I) (J) (K) (L) (M) (N) (O) (P) (Q) (R) (S) (T) (U) (V) (W) (X) (Y)
- - - - 1993 2013 2029 2050 2039 2030 1961 1996 1965 1066 899 504 475 502 484 749 397 729 698 683 584Unweighted Base-** -** -** -** 1993 2013 2029 2050 2039 2066 1961 1996 1965 952 1013 573 497 474 421 609 329 935 665 709 591Weighted Base
- - - - 823 748 802 742 742 634 638 659 662 330 332 168 156 156 181 214 111 309 269 188 205- - - - 41% 37% 40% 36% 36% 31% 33% 33% 34% 35% 33% 29% 31% 33% 43% 35% 34% 33% 41% 26% 35%
FHIJKLM JKLm hiJKLM Jkl JKl PQR X X
Mostly the same
- - - - 717 775 797 863 811 927 786 890 810 385 425 250 185 195 180 259 119 389 232 306 272- - - - 36% 38% 39% 42% 40% 45% 40% 45% 41% 40% 42% 44% 37% 41% 43% 43% 36% 42% 35% 43% 46%
e Ef E EFGIKm E EFGIKm E u W W
Somewhat different
- - - - 453 490 430 446 487 506 537 447 493 236 257 155 156 122 59 135 99 237 163 215 114- - - - 23% 24% 21% 22% 24% 24% 27% 22% 25% 25% 25% 27% 31% 26% 14% 22% 30% 25% 25% 30% 19%
g Gh EfGHIL GH S S S T y wY
Very different
- - - - 1993 2013 2029 2050 2039 2066 1961 1996 1965 952 1013 573 497 474 421 609 329 935 665 709 591- - - - 100% 100% 100% 100% 100% 100% 100% 100% 100% 100% 100% 100% 100% 100% 100% 100% 100% 100% 100% 100% 100%
Sigma
__________________________________________________________________________________________________________________Proportions/Means: Columns Tested (5%, 10% risk level) - A/B/C/D/E/F/G/H/I/J/K/L/M - N/O - P/Q/R/S - T/U/V - W/X/YOverlap formulae used. ** very small base (under 30) ineligible for sig testing
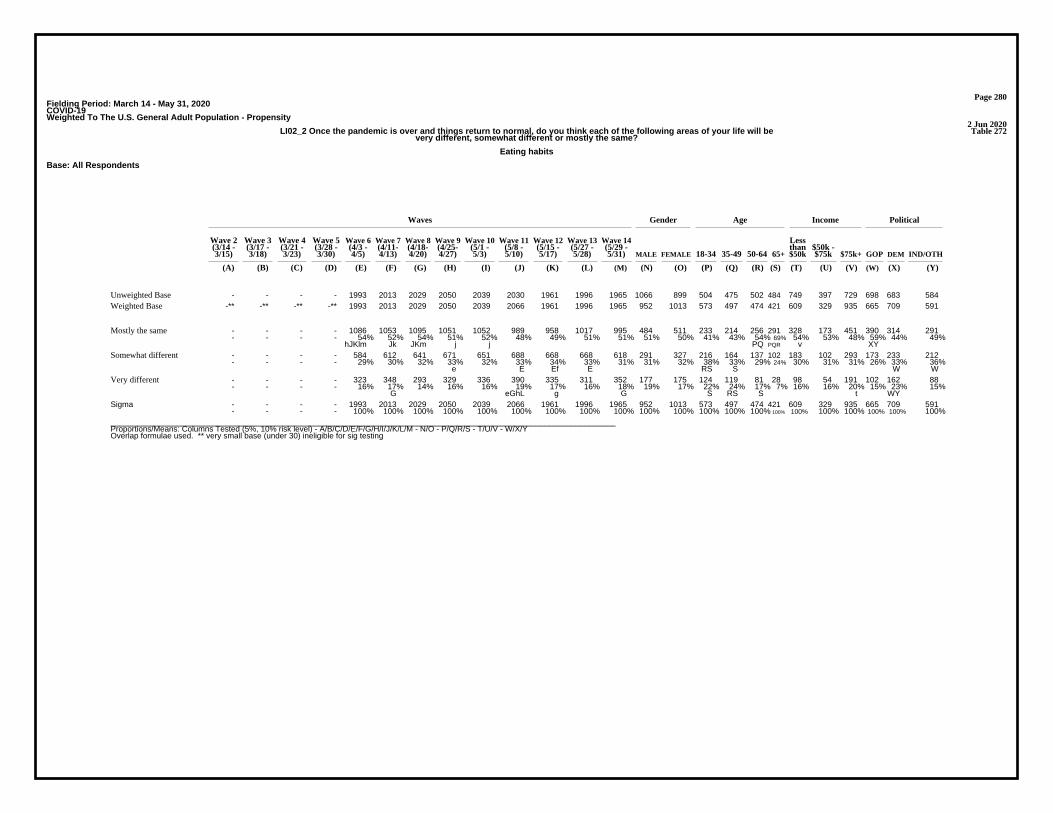
Page 280Fielding Period: March 14 - May 31, 2020COVID-19Weighted To The U.S. General Adult Population - Propensity
2 Jun 2020Table 272LI02_2 Once the pandemic is over and things return to normal, do you think each of the following areas of your life will be
very different, somewhat different or mostly the same?
Eating habits
Base: All Respondents
Waves Gender Age Income Political
Wave 2 Wave 3 Wave 4 Wave 5 Wave 6 Wave 7 Wave 8 Wave 9 Wave 10 Wave 11 Wave 12 Wave 13 Wave 14 Less(3/14 - (3/17 - (3/21 - (3/28 - (4/3 - (4/11- (4/18- (4/25- (5/1 - (5/8 - (5/15 - (5/27 - (5/29 - than $50k -3/15) 3/18) 3/23) 3/30) 4/5) 4/13) 4/20) 4/27) 5/3) 5/10) 5/17) 5/28) 5/31) MALE FEMALE 18-34 35-49 50-64 65+ $50k $75k $75k+ GOP DEM IND/OTH
(A) (B) (C) (D) (E) (F) (G) (H) (I) (J) (K) (L) (M) (N) (O) (P) (Q) (R) (S) (T) (U) (V) (W) (X) (Y)
- - - - 1993 2013 2029 2050 2039 2030 1961 1996 1965 1066 899 504 475 502 484 749 397 729 698 683 584Unweighted Base-** -** -** -** 1993 2013 2029 2050 2039 2066 1961 1996 1965 952 1013 573 497 474 421 609 329 935 665 709 591Weighted Base
- - - - 1086 1053 1095 1051 1052 989 958 1017 995 484 511 233 214 256 291 328 173 451 390 314 291- - - - 54% 52% 54% 51% 52% 48% 49% 51% 51% 51% 50% 41% 43% 54% 69% 54% 53% 48% 59% 44% 49%
hJKlm Jk JKm j j PQ PQR v XY
Mostly the same
- - - - 584 612 641 671 651 688 668 668 618 291 327 216 164 137 102 183 102 293 173 233 212- - - - 29% 30% 32% 33% 32% 33% 34% 33% 31% 31% 32% 38% 33% 29% 24% 30% 31% 31% 26% 33% 36%
e E Ef E RS S W W
Somewhat different
- - - - 323 348 293 329 336 390 335 311 352 177 175 124 119 81 28 98 54 191 102 162 88- - - - 16% 17% 14% 16% 16% 19% 17% 16% 18% 19% 17% 22% 24% 17% 7% 16% 16% 20% 15% 23% 15%
G eGhL g G S RS S t WY
Very different
- - - - 1993 2013 2029 2050 2039 2066 1961 1996 1965 952 1013 573 497 474 421 609 329 935 665 709 591- - - - 100% 100% 100% 100% 100% 100% 100% 100% 100% 100% 100% 100% 100% 100% 100% 100% 100% 100% 100% 100% 100%
Sigma
__________________________________________________________________________________________________________________Proportions/Means: Columns Tested (5%, 10% risk level) - A/B/C/D/E/F/G/H/I/J/K/L/M - N/O - P/Q/R/S - T/U/V - W/X/YOverlap formulae used. ** very small base (under 30) ineligible for sig testing

Page 281Fielding Period: March 14 - May 31, 2020COVID-19Weighted To The U.S. General Adult Population - Propensity
2 Jun 2020Table 273LI02_3 Once the pandemic is over and things return to normal, do you think each of the following areas of your life will be
very different, somewhat different or mostly the same?
Social activity
Base: All Respondents
Waves Gender Age Income Political
Wave 2 Wave 3 Wave 4 Wave 5 Wave 6 Wave 7 Wave 8 Wave 9 Wave 10 Wave 11 Wave 12 Wave 13 Wave 14 Less(3/14 - (3/17 - (3/21 - (3/28 - (4/3 - (4/11- (4/18- (4/25- (5/1 - (5/8 - (5/15 - (5/27 - (5/29 - than $50k -3/15) 3/18) 3/23) 3/30) 4/5) 4/13) 4/20) 4/27) 5/3) 5/10) 5/17) 5/28) 5/31) MALE FEMALE 18-34 35-49 50-64 65+ $50k $75k $75k+ GOP DEM IND/OTH
(A) (B) (C) (D) (E) (F) (G) (H) (I) (J) (K) (L) (M) (N) (O) (P) (Q) (R) (S) (T) (U) (V) (W) (X) (Y)
- - - - 1993 2013 2029 2050 2039 2030 1961 1996 1965 1066 899 504 475 502 484 749 397 729 698 683 584Unweighted Base-** -** -** -** 1993 2013 2029 2050 2039 2066 1961 1996 1965 952 1013 573 497 474 421 609 329 935 665 709 591Weighted Base
- - - - 742 680 718 708 656 628 613 622 662 335 327 178 158 160 166 221 110 298 264 189 209- - - - 37% 34% 35% 35% 32% 30% 31% 31% 34% 35% 32% 31% 32% 34% 40% 36% 34% 32% 40% 27% 35%
fIJKLm j iJKL Jkl j Pq X X
Mostly the same
- - - - 723 817 815 792 827 880 784 835 718 343 375 206 170 177 164 208 127 342 220 260 238- - - - 36% 41% 40% 39% 41% 43% 40% 42% 37% 36% 37% 36% 34% 37% 39% 34% 39% 37% 33% 37% 40%
EM Em EM EHM em EhM W
Somewhat different
- - - - 528 516 496 549 556 559 564 538 584 273 312 189 169 137 90 180 91 295 181 260 144- - - - 26% 26% 24% 27% 27% 27% 29% 27% 30% 29% 31% 33% 34% 29% 21% 30% 28% 32% 27% 37% 24%
g fG eFG S S S WY
Very different
- - - - 1993 2013 2029 2050 2039 2066 1961 1996 1965 952 1013 573 497 474 421 609 329 935 665 709 591- - - - 100% 100% 100% 100% 100% 100% 100% 100% 100% 100% 100% 100% 100% 100% 100% 100% 100% 100% 100% 100% 100%
Sigma
__________________________________________________________________________________________________________________Proportions/Means: Columns Tested (5%, 10% risk level) - A/B/C/D/E/F/G/H/I/J/K/L/M - N/O - P/Q/R/S - T/U/V - W/X/YOverlap formulae used. ** very small base (under 30) ineligible for sig testing

Page 282Fielding Period: March 14 - May 31, 2020COVID-19Weighted To The U.S. General Adult Population - Propensity
2 Jun 2020Table 274LI02_4 Once the pandemic is over and things return to normal, do you think each of the following areas of your life will be
very different, somewhat different or mostly the same?
Travel/vacation
Base: All Respondents
Waves Gender Age Income Political
Wave 2 Wave 3 Wave 4 Wave 5 Wave 6 Wave 7 Wave 8 Wave 9 Wave 10 Wave 11 Wave 12 Wave 13 Wave 14 Less(3/14 - (3/17 - (3/21 - (3/28 - (4/3 - (4/11- (4/18- (4/25- (5/1 - (5/8 - (5/15 - (5/27 - (5/29 - than $50k -3/15) 3/18) 3/23) 3/30) 4/5) 4/13) 4/20) 4/27) 5/3) 5/10) 5/17) 5/28) 5/31) MALE FEMALE 18-34 35-49 50-64 65+ $50k $75k $75k+ GOP DEM IND/OTH
(A) (B) (C) (D) (E) (F) (G) (H) (I) (J) (K) (L) (M) (N) (O) (P) (Q) (R) (S) (T) (U) (V) (W) (X) (Y)
- - - - 1993 2013 2029 2050 2039 2030 1961 1996 1965 1066 899 504 475 502 484 749 397 729 698 683 584Unweighted Base-** -** -** -** 1993 2013 2029 2050 2039 2066 1961 1996 1965 952 1013 573 497 474 421 609 329 935 665 709 591Weighted Base
- - - - 684 622 692 617 586 543 526 542 579 280 299 141 137 152 149 212 93 245 231 167 180- - - - 34% 31% 34% 30% 29% 26% 27% 27% 29% 29% 29% 25% 28% 32% 35% 35% 28% 26% 35% 24% 31%
fHIJKLM JKL fHIJKLM Jkl j P PQ uV X X
Mostly the same
- - - - 680 721 707 751 751 783 674 727 670 325 345 204 165 147 155 196 112 335 211 253 206- - - - 34% 36% 35% 37% 37% 38% 34% 36% 34% 34% 34% 36% 33% 31% 37% 32% 34% 36% 32% 36% 35%
Ekm
Somewhat different
- - - - 630 670 631 681 702 741 761 727 716 346 370 229 196 175 117 200 125 355 222 289 205- - - - 32% 33% 31% 33% 34% 36% 39% 36% 36% 36% 37% 40% 39% 37% 28% 33% 38% 38% 33% 41% 35%
g EG EFGHI EfGh EGh S S S Wy
Very different
- - - - 1993 2013 2029 2050 2039 2066 1961 1996 1965 952 1013 573 497 474 421 609 329 935 665 709 591- - - - 100% 100% 100% 100% 100% 100% 100% 100% 100% 100% 100% 100% 100% 100% 100% 100% 100% 100% 100% 100% 100%
Sigma
__________________________________________________________________________________________________________________Proportions/Means: Columns Tested (5%, 10% risk level) - A/B/C/D/E/F/G/H/I/J/K/L/M - N/O - P/Q/R/S - T/U/V - W/X/YOverlap formulae used. ** very small base (under 30) ineligible for sig testing

Page 283Fielding Period: March 14 - May 31, 2020COVID-19Weighted To The U.S. General Adult Population - Propensity
2 Jun 2020Table 275LI02_5 Once the pandemic is over and things return to normal, do you think each of the following areas of your life will be
very different, somewhat different or mostly the same?
Work life
Base: All Respondents
Waves Gender Age Income Political
Wave 2 Wave 3 Wave 4 Wave 5 Wave 6 Wave 7 Wave 8 Wave 9 Wave 10 Wave 11 Wave 12 Wave 13 Wave 14 Less(3/14 - (3/17 - (3/21 - (3/28 - (4/3 - (4/11- (4/18- (4/25- (5/1 - (5/8 - (5/15 - (5/27 - (5/29 - than $50k -3/15) 3/18) 3/23) 3/30) 4/5) 4/13) 4/20) 4/27) 5/3) 5/10) 5/17) 5/28) 5/31) MALE FEMALE 18-34 35-49 50-64 65+ $50k $75k $75k+ GOP DEM IND/OTH
(A) (B) (C) (D) (E) (F) (G) (H) (I) (J) (K) (L) (M) (N) (O) (P) (Q) (R) (S) (T) (U) (V) (W) (X) (Y)
- - - - 1993 2013 2029 2050 2039 2030 1961 1996 1965 1066 899 504 475 502 484 749 397 729 698 683 584Unweighted Base-** -** -** -** 1993 2013 2029 2050 2039 2066 1961 1996 1965 952 1013 573 497 474 421 609 329 935 665 709 591Weighted Base
- - - - 1031 1027 944 954 913 883 910 954 890 420 470 186 196 227 281 290 158 401 344 283 263- - - - 52% 51% 47% 47% 45% 43% 46% 48% 45% 44% 46% 32% 39% 48% 67% 48% 48% 43% 52% 40% 44%
GHIJKLM GHIJKM J j j J p PQ PQR XY
Mostly the same
- - - - 557 548 643 630 688 705 612 624 619 312 307 222 171 149 76 180 88 315 166 233 220- - - - 28% 27% 32% 31% 34% 34% 31% 31% 31% 33% 30% 39% 34% 32% 18% 30% 27% 34% 25% 33% 37%
EF F EF EFh eF eF eF rS S S u W W
Somewhat different
- - - - 405 438 441 466 438 479 438 419 456 220 237 165 131 97 63 139 83 219 155 193 109- - - - 20% 22% 22% 23% 21% 23% 22% 21% 23% 23% 23% 29% 26% 20% 15% 23% 25% 23% 23% 27% 18%
e e RS rS s Y
Very different
- - - - 1993 2013 2029 2050 2039 2066 1961 1996 1965 952 1013 573 497 474 421 609 329 935 665 709 591- - - - 100% 100% 100% 100% 100% 100% 100% 100% 100% 100% 100% 100% 100% 100% 100% 100% 100% 100% 100% 100% 100%
Sigma
__________________________________________________________________________________________________________________Proportions/Means: Columns Tested (5%, 10% risk level) - A/B/C/D/E/F/G/H/I/J/K/L/M - N/O - P/Q/R/S - T/U/V - W/X/YOverlap formulae used. ** very small base (under 30) ineligible for sig testing

Page 284Fielding Period: March 14 - May 31, 2020COVID-19Weighted To The U.S. General Adult Population - Propensity
2 Jun 2020Table 276LI02_6 Once the pandemic is over and things return to normal, do you think each of the following areas of your life will be
very different, somewhat different or mostly the same?
Family life
Base: All Respondents
Waves Gender Age Income Political
Wave 2 Wave 3 Wave 4 Wave 5 Wave 6 Wave 7 Wave 8 Wave 9 Wave 10 Wave 11 Wave 12 Wave 13 Wave 14 Less(3/14 - (3/17 - (3/21 - (3/28 - (4/3 - (4/11- (4/18- (4/25- (5/1 - (5/8 - (5/15 - (5/27 - (5/29 - than $50k -3/15) 3/18) 3/23) 3/30) 4/5) 4/13) 4/20) 4/27) 5/3) 5/10) 5/17) 5/28) 5/31) MALE FEMALE 18-34 35-49 50-64 65+ $50k $75k $75k+ GOP DEM IND/OTH
(A) (B) (C) (D) (E) (F) (G) (H) (I) (J) (K) (L) (M) (N) (O) (P) (Q) (R) (S) (T) (U) (V) (W) (X) (Y)
- - - - 1993 2013 2029 2050 2039 2030 1961 1996 1965 1066 899 504 475 502 484 749 397 729 698 683 584Unweighted Base-** -** -** -** 1993 2013 2029 2050 2039 2066 1961 1996 1965 952 1013 573 497 474 421 609 329 935 665 709 591Weighted Base
- - - - 1147 1182 1159 1146 1146 1072 1015 1123 1046 503 543 240 237 278 291 346 186 470 386 341 319- - - - 58% 59% 57% 56% 56% 52% 52% 56% 53% 53% 54% 42% 48% 59% 69% 57% 56% 50% 58% 48% 54%
JKM JKM JKm JK JK JK PQ PQR V X
Mostly the same
- - - - 540 516 557 632 586 606 628 587 584 277 307 206 151 125 102 169 92 286 171 228 185- - - - 27% 26% 27% 31% 29% 29% 32% 29% 30% 29% 30% 36% 30% 26% 24% 28% 28% 31% 26% 32% 31%
EFg f F EFGi F F RS s W w
Somewhat different
- - - - 306 316 313 272 306 389 317 286 335 172 164 127 109 70 29 94 51 180 108 141 87- - - - 15% 16% 15% 13% 15% 19% 16% 14% 17% 18% 16% 22% 22% 15% 7% 15% 15% 19% 16% 20% 15%
h EFGHIkL H Hl RS RS S y
Very different
- - - - 1993 2013 2029 2050 2039 2066 1961 1996 1965 952 1013 573 497 474 421 609 329 935 665 709 591- - - - 100% 100% 100% 100% 100% 100% 100% 100% 100% 100% 100% 100% 100% 100% 100% 100% 100% 100% 100% 100% 100%
Sigma
__________________________________________________________________________________________________________________Proportions/Means: Columns Tested (5%, 10% risk level) - A/B/C/D/E/F/G/H/I/J/K/L/M - N/O - P/Q/R/S - T/U/V - W/X/YOverlap formulae used. ** very small base (under 30) ineligible for sig testing

Page 285Fielding Period: March 14 - May 31, 2020COVID-19Weighted To The U.S. General Adult Population - Propensity
2 Jun 2020Table 277LI02_7 Once the pandemic is over and things return to normal, do you think each of the following areas of your life will be
very different, somewhat different or mostly the same?
Personal hygiene
Base: All Respondents
Waves Gender Age Income Political
Wave 2 Wave 3 Wave 4 Wave 5 Wave 6 Wave 7 Wave 8 Wave 9 Wave 10 Wave 11 Wave 12 Wave 13 Wave 14 Less(3/14 - (3/17 - (3/21 - (3/28 - (4/3 - (4/11- (4/18- (4/25- (5/1 - (5/8 - (5/15 - (5/27 - (5/29 - than $50k -3/15) 3/18) 3/23) 3/30) 4/5) 4/13) 4/20) 4/27) 5/3) 5/10) 5/17) 5/28) 5/31) MALE FEMALE 18-34 35-49 50-64 65+ $50k $75k $75k+ GOP DEM IND/OTH
(A) (B) (C) (D) (E) (F) (G) (H) (I) (J) (K) (L) (M) (N) (O) (P) (Q) (R) (S) (T) (U) (V) (W) (X) (Y)
- - - - 1993 2013 2029 2050 2039 2030 1961 1996 1965 1066 899 504 475 502 484 749 397 729 698 683 584Unweighted Base-** -** -** -** 1993 2013 2029 2050 2039 2066 1961 1996 1965 952 1013 573 497 474 421 609 329 935 665 709 591Weighted Base
- - - - 935 999 1016 1100 1017 946 884 996 996 451 545 243 222 265 267 345 174 423 366 302 329- - - - 47% 50% 50% 54% 50% 46% 45% 50% 51% 47% 54% 42% 45% 56% 63% 57% 53% 45% 55% 43% 56%
JK JK EFgiJKl JK JK eJK N PQ PQr V V X X
Mostly the same
- - - - 584 553 588 536 545 620 570 593 561 271 290 191 150 110 110 154 90 296 182 208 170- - - - 29% 27% 29% 26% 27% 30% 29% 30% 29% 28% 29% 33% 30% 23% 26% 25% 27% 32% 27% 29% 29%
h Hi Hi Rs r T
Somewhat different
- - - - 474 461 425 414 476 501 507 407 408 230 179 139 126 99 44 110 65 216 117 199 93- - - - 24% 23% 21% 20% 23% 24% 26% 20% 21% 24% 18% 24% 25% 21% 11% 18% 20% 23% 18% 28% 16%
gHLm h hl GHLM fGHLM O S S S t WY
Very different
- - - - 1993 2013 2029 2050 2039 2066 1961 1996 1965 952 1013 573 497 474 421 609 329 935 665 709 591- - - - 100% 100% 100% 100% 100% 100% 100% 100% 100% 100% 100% 100% 100% 100% 100% 100% 100% 100% 100% 100% 100%
Sigma
__________________________________________________________________________________________________________________Proportions/Means: Columns Tested (5%, 10% risk level) - A/B/C/D/E/F/G/H/I/J/K/L/M - N/O - P/Q/R/S - T/U/V - W/X/YOverlap formulae used. ** very small base (under 30) ineligible for sig testing

Page 286Fielding Period: March 14 - May 31, 2020COVID-19Weighted To The U.S. General Adult Population - Propensity
2 Jun 2020Table 278Q33A How many months do you it will take for us to find a vaccine/ cure for the coronavirus?
Base: All Respondents
Waves Gender Age Income Political
Wave 2 Wave 3 Wave 4 Wave 5 Wave 6 Wave 7 Wave 8 Wave 9 Wave 10 Wave 11 Wave 12 Wave 13 Wave 14 Less(3/14 - (3/17 - (3/21 - (3/28 - (4/3 - (4/11- (4/18- (4/25- (5/1 - (5/8 - (5/15 - (5/27 - (5/29 - than $50k -3/15) 3/18) 3/23) 3/30) 4/5) 4/13) 4/20) 4/27) 5/3) 5/10) 5/17) 5/28) 5/31) MALE FEMALE 18-34 35-49 50-64 65+ $50k $75k $75k+ GOP DEM IND/OTH
(A) (B) (C) (D) (E) (F) (G) (H) (I) (J) (K) (L) (M) (N) (O) (P) (Q) (R) (S) (T) (U) (V) (W) (X) (Y)
- - 2023 - - 2013 2029 - - - - - 1965 1066 899 504 475 502 484 749 397 729 698 683 584Unweighted Base-** -** 2023 -** -** 2013 2029 -** -** -** -** -** 1965 952 1013 573 497 474 421 609 329 935 665 709 591Weighted Base
- - 17 - - 15 16 - - - - - 32 9 23 16 10 5 1 17 8 3 5 4 22- - 1% - - 1% 1% - - - - - 2% 1% 2% 3% 2% 1% * 3% 2% * 1% 1% 4%
cfg n S S V V WX
0
- - 1249 - - 1124 1069 - - - - - 908 506 402 335 266 145 162 245 141 491 368 312 228- - 62% - - 56% 53% - - - - - 46% 53% 40% 58% 54% 31% 38% 40% 43% 53% 55% 44% 39%
FGM M M O RS RS R TU XY
1-10
- - 561 - - 709 745 - - - - - 732 329 402 148 140 230 214 232 129 330 206 285 241- - 28% - - 35% 37% - - - - - 37% 35% 40% 26% 28% 49% 51% 38% 39% 35% 31% 40% 41%
C C C n PQ PQ W W
11-20
- - 115 - - 119 138 - - - - - 187 65 121 45 51 58 33 67 38 67 50 77 60- - 6% - - 6% 7% - - - - - 10% 7% 12% 8% 10% 12% 8% 11% 11% 7% 8% 11% 10%
CFG N ps V V
21-30
- - 32 - - 18 32 - - - - - 39 11 27 5 9 15 9 17 6 16 11 12 16- - 2% - - 1% 2% - - - - - 2% 1% 3% 1% 2% 3% 2% 3% 2% 2% 2% 2% 3%
f F n P
31-40
- - 24 - - 12 12 - - - - - 28 10 18 8 9 9 1 14 5 10 10 13 5- - 1% - - 1% 1% - - - - - 1% 1% 2% 1% 2% 2% * 2% 1% 1% 2% 2% 1%
g FG s s
41-50
- - 22 - - 8 11 - - - - - 23 13 10 7 7 8 1 9 1 11 10 4 8- - 1% - - * 1% - - - - - 1% 1% 1% 1% 1% 2% * 2% * 1% 2% 1% 1%
F F s
51-100
- - 3 - - 7 5 - - - - - 17 8 9 8 5 4 * 8 2 6 3 2 12- - * - - * * - - - - - 1% 1% 1% 1% 1% 1% * 1% 1% 1% 1% * 2%
CG s wX
101+
- - 11.0 - - 13.2 11.5 - - - - - 17.7 16.3 19.0 21.1 15.0 20.6 12.8 25.6 12.8 14.1 12.6 13.7 28.1CfG s uV WX
Mean
- - 35.41 - - 55.81 23.84 - - - - - 68.42 67.17 69.59 95.31 52.61 70.56 24.25 104.22 12.01 46.78 27.91 30.35 115.94Std. Dev.- - 0.79 - - 1.24 0.53 - - - - - 1.54 2.06 2.32 4.25 2.41 3.15 1.10 3.81 0.60 1.73 1.06 1.16 4.80Std. Err.- - 6 - - 8 9 - - - - - 12 9 12 8 8 12 12 12 12 10 9 12 12Median- - 2023 - - 2013 2029 - - - - - 1965 952 1013 573 497 474 421 609 329 935 665 709 591- - 100% - - 100% 100% - - - - - 100% 100% 100% 100% 100% 100% 100% 100% 100% 100% 100% 100% 100%
Sigma
__________________________________________________________________________________________________________________Proportions/Means: Columns Tested (5%, 10% risk level) - A/B/C/D/E/F/G/H/I/J/K/L/M - N/O - P/Q/R/S - T/U/V - W/X/YOverlap formulae used. ** very small base (under 30) ineligible for sig testing
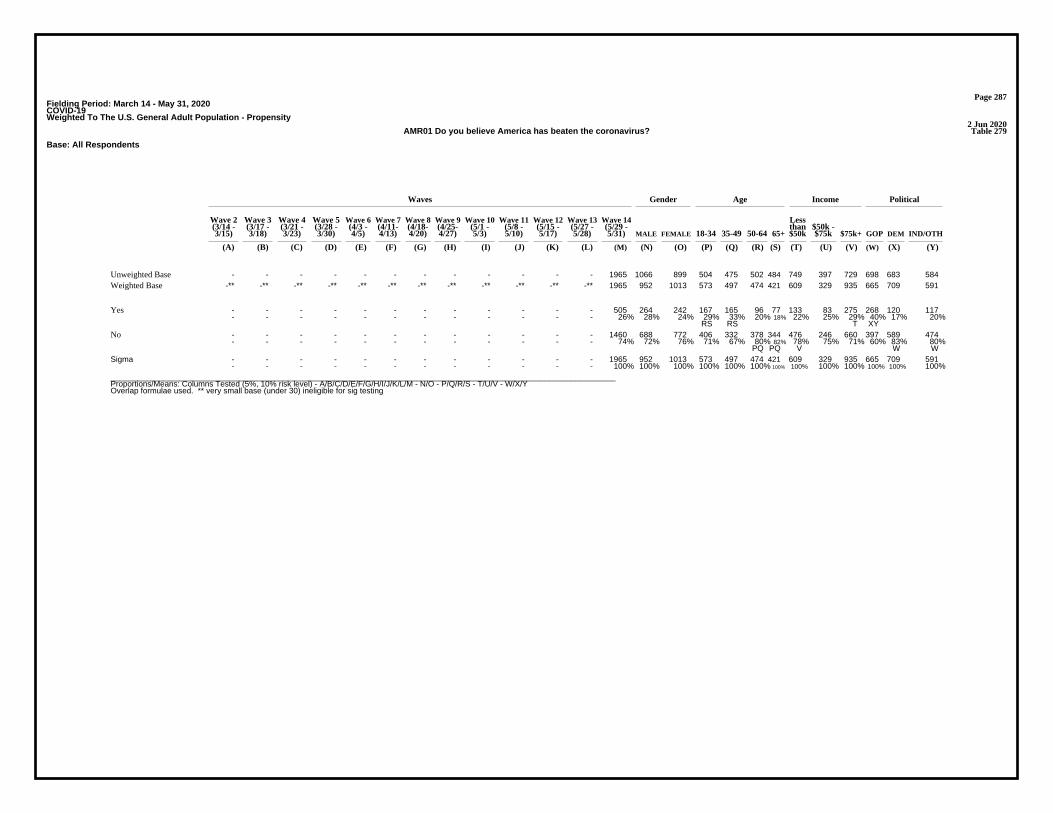
Page 287Fielding Period: March 14 - May 31, 2020COVID-19Weighted To The U.S. General Adult Population - Propensity
2 Jun 2020Table 279AMR01 Do you believe America has beaten the coronavirus?
Base: All Respondents
Waves Gender Age Income Political
Wave 2 Wave 3 Wave 4 Wave 5 Wave 6 Wave 7 Wave 8 Wave 9 Wave 10 Wave 11 Wave 12 Wave 13 Wave 14 Less(3/14 - (3/17 - (3/21 - (3/28 - (4/3 - (4/11- (4/18- (4/25- (5/1 - (5/8 - (5/15 - (5/27 - (5/29 - than $50k -3/15) 3/18) 3/23) 3/30) 4/5) 4/13) 4/20) 4/27) 5/3) 5/10) 5/17) 5/28) 5/31) MALE FEMALE 18-34 35-49 50-64 65+ $50k $75k $75k+ GOP DEM IND/OTH
(A) (B) (C) (D) (E) (F) (G) (H) (I) (J) (K) (L) (M) (N) (O) (P) (Q) (R) (S) (T) (U) (V) (W) (X) (Y)
- - - - - - - - - - - - 1965 1066 899 504 475 502 484 749 397 729 698 683 584Unweighted Base-** -** -** -** -** -** -** -** -** -** -** -** 1965 952 1013 573 497 474 421 609 329 935 665 709 591Weighted Base
- - - - - - - - - - - - 505 264 242 167 165 96 77 133 83 275 268 120 117- - - - - - - - - - - - 26% 28% 24% 29% 33% 20% 18% 22% 25% 29% 40% 17% 20%
RS RS T XY
Yes
- - - - - - - - - - - - 1460 688 772 406 332 378 344 476 246 660 397 589 474- - - - - - - - - - - - 74% 72% 76% 71% 67% 80% 82% 78% 75% 71% 60% 83% 80%
PQ PQ V W W
No
- - - - - - - - - - - - 1965 952 1013 573 497 474 421 609 329 935 665 709 591- - - - - - - - - - - - 100% 100% 100% 100% 100% 100% 100% 100% 100% 100% 100% 100% 100%
Sigma
__________________________________________________________________________________________________________________Proportions/Means: Columns Tested (5%, 10% risk level) - A/B/C/D/E/F/G/H/I/J/K/L/M - N/O - P/Q/R/S - T/U/V - W/X/YOverlap formulae used. ** very small base (under 30) ineligible for sig testing

Page 288Fielding Period: March 14 - May 31, 2020COVID-19Weighted To The U.S. General Adult Population - Propensity
2 Jun 2020Table 280AMR02 How many months do you think it’ll take before everyone has access to COVID-19 testing?
Base: All Respondents
Waves Gender Age Income Political
Wave 2 Wave 3 Wave 4 Wave 5 Wave 6 Wave 7 Wave 8 Wave 9 Wave 10 Wave 11 Wave 12 Wave 13 Wave 14 Less(3/14 - (3/17 - (3/21 - (3/28 - (4/3 - (4/11- (4/18- (4/25- (5/1 - (5/8 - (5/15 - (5/27 - (5/29 - than $50k -3/15) 3/18) 3/23) 3/30) 4/5) 4/13) 4/20) 4/27) 5/3) 5/10) 5/17) 5/28) 5/31) MALE FEMALE 18-34 35-49 50-64 65+ $50k $75k $75k+ GOP DEM IND/OTH
(A) (B) (C) (D) (E) (F) (G) (H) (I) (J) (K) (L) (M) (N) (O) (P) (Q) (R) (S) (T) (U) (V) (W) (X) (Y)
- - - - - - - - - - - - 1965 1066 899 504 475 502 484 749 397 729 698 683 584Unweighted Base-** -** -** -** -** -** -** -** -** -** -** -** 1965 952 1013 573 497 474 421 609 329 935 665 709 591Weighted Base
- - - - - - - - - - - - 61 28 33 14 25 13 9 17 17 22 13 11 37- - - - - - - - - - - - 3% 3% 3% 2% 5% 3% 2% 3% 5% 2% 2% 1% 6%
ps V WX
0
- - - - - - - - - - - - 115 58 57 34 36 21 24 39 13 57 60 21 35- - - - - - - - - - - - 6% 6% 6% 6% 7% 4% 6% 6% 4% 6% 9% 3% 6%
X X
1
- - - - - - - - - - - - 180 105 75 62 52 27 40 40 38 98 73 60 48- - - - - - - - - - - - 9% 11% 7% 11% 10% 6% 10% 7% 12% 11% 11% 8% 8%
O R R r T T
2
- - - - - - - - - - - - 193 114 79 55 64 39 36 44 24 118 91 58 44- - - - - - - - - - - - 10% 12% 8% 10% 13% 8% 8% 7% 7% 13% 14% 8% 8%
O rs TU XY
3
- - - - - - - - - - - - 126 59 67 47 41 19 20 22 23 80 42 51 33- - - - - - - - - - - - 6% 6% 7% 8% 8% 4% 5% 4% 7% 9% 6% 7% 6%
R Rs T T
4
- - - - - - - - - - - - 117 57 60 54 30 22 12 32 14 68 41 42 34- - - - - - - - - - - - 6% 6% 6% 9% 6% 5% 3% 5% 4% 7% 6% 6% 6%
RS s
5
- - - - - - - - - - - - 336 177 159 66 77 88 104 102 60 162 116 129 90- - - - - - - - - - - - 17% 19% 16% 11% 16% 19% 25% 17% 18% 17% 18% 18% 15%
P PQr
6
- - - - - - - - - - - - 45 17 27 13 12 13 6 19 4 21 11 24 10- - - - - - - - - - - - 2% 2% 3% 2% 2% 3% 1% 3% 1% 2% 2% 3% 2%
u
7
- - - - - - - - - - - - 55 31 24 26 8 9 12 17 7 29 10 30 15- - - - - - - - - - - - 3% 3% 2% 4% 2% 2% 3% 3% 2% 3% 1% 4% 2%
Qr W
8
- - - - - - - - - - - - 39 25 14 13 9 7 10 21 4 12 10 14 15- - - - - - - - - - - - 2% 3% 1% 2% 2% 2% 2% 4% 1% 1% 1% 2% 3%
uV
9
- - - - - - - - - - - - 48 17 31 24 7 9 8 16 5 22 19 11 19- - - - - - - - - - - - 2% 2% 3% 4% 1% 2% 2% 3% 2% 2% 3% 1% 3%
Q
10
- - - - - - - - - - - - 16 3 13 11 - 1 4 7 2 7 3 5 8- - - - - - - - - - - - 1% * 1% 2% - * 1% 1% * 1% * 1% 1%
n Qr q
11
- - - - - - - - - - - - 341 142 198 81 64 119 76 125 72 124 114 135 92- - - - - - - - - - - - 17% 15% 20% 14% 13% 25% 18% 21% 22% 13% 17% 19% 16%
N PQS q V V
12
- - - - - - - - - - - - 98 37 61 25 18 33 22 38 14 41 13 36 50- - - - - - - - - - - - 5% 4% 6% 4% 4% 7% 5% 6% 4% 4% 2% 5% 8%
n q W Wx
13-20
- - - - - - - - - - - - 105 34 71 25 19 32 28 37 18 38 29 46 30- - - - - - - - - - - - 5% 4% 7% 4% 4% 7% 7% 6% 5% 4% 4% 6% 5%
N
21-30
__________________________________________________________________________________________________________________Proportions/Means: Columns Tested (5%, 10% risk level) - A/B/C/D/E/F/G/H/I/J/K/L/M - N/O - P/Q/R/S - T/U/V - W/X/YOverlap formulae used. ** very small base (under 30) ineligible for sig testing
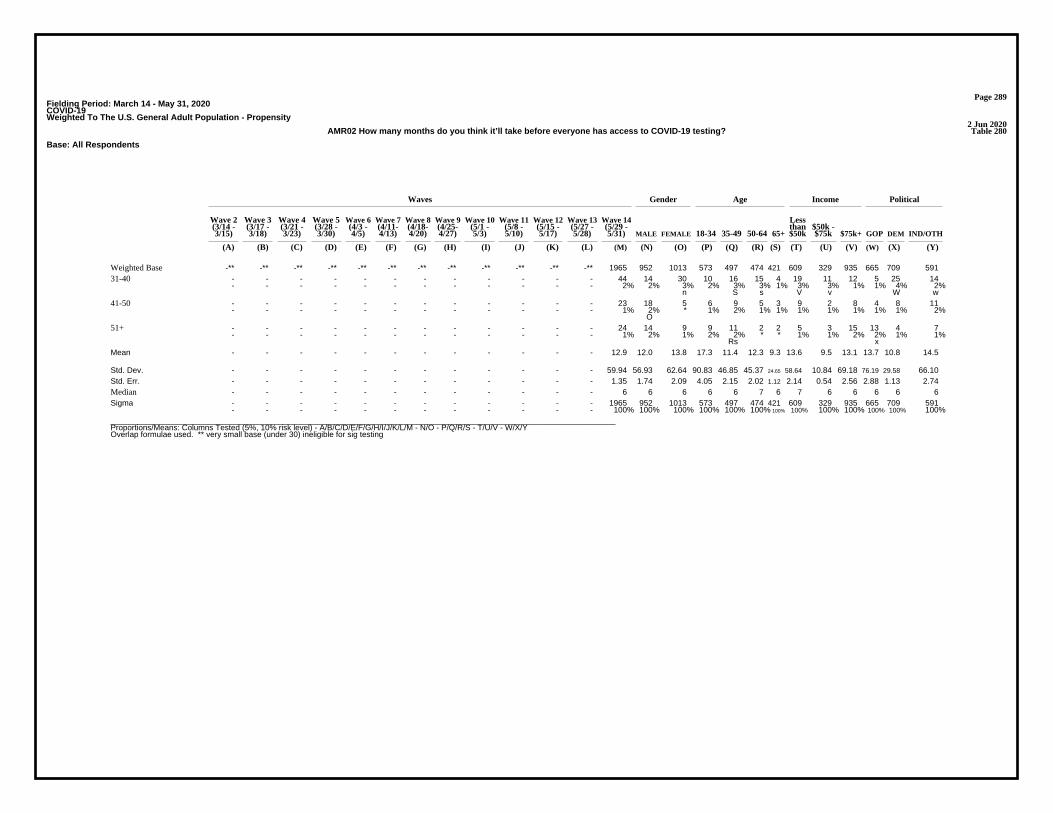
Page 289Fielding Period: March 14 - May 31, 2020COVID-19Weighted To The U.S. General Adult Population - Propensity
2 Jun 2020Table 280AMR02 How many months do you think it’ll take before everyone has access to COVID-19 testing?
Base: All Respondents
Waves Gender Age Income Political
Wave 2 Wave 3 Wave 4 Wave 5 Wave 6 Wave 7 Wave 8 Wave 9 Wave 10 Wave 11 Wave 12 Wave 13 Wave 14 Less(3/14 - (3/17 - (3/21 - (3/28 - (4/3 - (4/11- (4/18- (4/25- (5/1 - (5/8 - (5/15 - (5/27 - (5/29 - than $50k -3/15) 3/18) 3/23) 3/30) 4/5) 4/13) 4/20) 4/27) 5/3) 5/10) 5/17) 5/28) 5/31) MALE FEMALE 18-34 35-49 50-64 65+ $50k $75k $75k+ GOP DEM IND/OTH
(A) (B) (C) (D) (E) (F) (G) (H) (I) (J) (K) (L) (M) (N) (O) (P) (Q) (R) (S) (T) (U) (V) (W) (X) (Y)
-** -** -** -** -** -** -** -** -** -** -** -** 1965 952 1013 573 497 474 421 609 329 935 665 709 591Weighted Base- - - - - - - - - - - - 44 14 30 10 16 15 4 19 11 12 5 25 14- - - - - - - - - - - - 2% 2% 3% 2% 3% 3% 1% 3% 3% 1% 1% 4% 2%
n S s V v W w
31-40
- - - - - - - - - - - - 23 18 5 6 9 5 3 9 2 8 4 8 11- - - - - - - - - - - - 1% 2% * 1% 2% 1% 1% 1% 1% 1% 1% 1% 2%
O
41-50
- - - - - - - - - - - - 24 14 9 9 11 2 2 5 3 15 13 4 7- - - - - - - - - - - - 1% 2% 1% 2% 2% * * 1% 1% 2% 2% 1% 1%
Rs x
51+
- - - - - - - - - - - - 12.9 12.0 13.8 17.3 11.4 12.3 9.3 13.6 9.5 13.1 13.7 10.8 14.5Mean
- - - - - - - - - - - - 59.94 56.93 62.64 90.83 46.85 45.37 24.65 58.64 10.84 69.18 76.19 29.58 66.10Std. Dev.- - - - - - - - - - - - 1.35 1.74 2.09 4.05 2.15 2.02 1.12 2.14 0.54 2.56 2.88 1.13 2.74Std. Err.- - - - - - - - - - - - 6 6 6 6 6 7 6 7 6 6 6 6 6Median- - - - - - - - - - - - 1965 952 1013 573 497 474 421 609 329 935 665 709 591- - - - - - - - - - - - 100% 100% 100% 100% 100% 100% 100% 100% 100% 100% 100% 100% 100%
Sigma
__________________________________________________________________________________________________________________Proportions/Means: Columns Tested (5%, 10% risk level) - A/B/C/D/E/F/G/H/I/J/K/L/M - N/O - P/Q/R/S - T/U/V - W/X/YOverlap formulae used. ** very small base (under 30) ineligible for sig testing

Page 290Fielding Period: March 14 - May 31, 2020COVID-19Weighted To The U.S. General Adult Population - Propensity
2 Jun 2020Table 281AMR03 How many months do you think it’ll take before everyone gets tested for COVID-19?
Base: All Respondents
Waves Gender Age Income Political
Wave 2 Wave 3 Wave 4 Wave 5 Wave 6 Wave 7 Wave 8 Wave 9 Wave 10 Wave 11 Wave 12 Wave 13 Wave 14 Less(3/14 - (3/17 - (3/21 - (3/28 - (4/3 - (4/11- (4/18- (4/25- (5/1 - (5/8 - (5/15 - (5/27 - (5/29 - than $50k -3/15) 3/18) 3/23) 3/30) 4/5) 4/13) 4/20) 4/27) 5/3) 5/10) 5/17) 5/28) 5/31) MALE FEMALE 18-34 35-49 50-64 65+ $50k $75k $75k+ GOP DEM IND/OTH
(A) (B) (C) (D) (E) (F) (G) (H) (I) (J) (K) (L) (M) (N) (O) (P) (Q) (R) (S) (T) (U) (V) (W) (X) (Y)
- - - - - - - - - - - - 1965 1066 899 504 475 502 484 749 397 729 698 683 584Unweighted Base-** -** -** -** -** -** -** -** -** -** -** -** 1965 952 1013 573 497 474 421 609 329 935 665 709 591Weighted Base
- - - - - - - - - - - - 62 20 42 20 30 8 4 29 16 13 12 12 37- - - - - - - - - - - - 3% 2% 4% 3% 6% 2% 1% 5% 5% 1% 2% 2% 6%
N S RS V V WX
0
- - - - - - - - - - - - 61 41 20 29 21 8 3 18 7 33 32 16 13- - - - - - - - - - - - 3% 4% 2% 5% 4% 2% 1% 3% 2% 4% 5% 2% 2%
O RS rS Xy
1
- - - - - - - - - - - - 105 70 35 52 36 9 8 27 26 50 41 44 20- - - - - - - - - - - - 5% 7% 3% 9% 7% 2% 2% 4% 8% 5% 6% 6% 3%
O RS RS t y y
2
- - - - - - - - - - - - 117 68 48 36 37 18 26 25 15 72 48 33 35- - - - - - - - - - - - 6% 7% 5% 6% 7% 4% 6% 4% 5% 8% 7% 5% 6%
o r T
3
- - - - - - - - - - - - 106 54 52 39 41 15 12 17 19 68 46 37 24- - - - - - - - - - - - 5% 6% 5% 7% 8% 3% 3% 3% 6% 7% 7% 5% 4%
RS RS t T y
4
- - - - - - - - - - - - 92 49 43 37 32 13 10 24 10 57 35 35 23- - - - - - - - - - - - 5% 5% 4% 6% 6% 3% 2% 4% 3% 6% 5% 5% 4%
RS RS u
5
- - - - - - - - - - - - 235 113 122 51 62 60 62 61 43 121 77 86 72- - - - - - - - - - - - 12% 12% 12% 9% 12% 13% 15% 10% 13% 13% 12% 12% 12%
P
6
- - - - - - - - - - - - 48 23 25 27 12 5 3 16 3 28 15 25 7- - - - - - - - - - - - 2% 2% 2% 5% 2% 1% 1% 3% 1% 3% 2% 4% 1%
RS s u u Y
7
- - - - - - - - - - - - 73 40 33 26 18 16 13 28 6 38 25 31 16- - - - - - - - - - - - 4% 4% 3% 5% 4% 3% 3% 5% 2% 4% 4% 4% 3%
U
8
- - - - - - - - - - - - 69 31 38 14 8 25 22 27 13 27 20 31 18- - - - - - - - - - - - 3% 3% 4% 2% 2% 5% 5% 4% 4% 3% 3% 4% 3%
pQ pQ
9
- - - - - - - - - - - - 59 29 30 21 10 12 17 14 7 35 28 18 14- - - - - - - - - - - - 3% 3% 3% 4% 2% 3% 4% 2% 2% 4% 4% 2% 2%
10
- - - - - - - - - - - - 8 7 1 2 - 3 3 2 1 5 2 5 1- - - - - - - - - - - - * 1% * * - 1% 1% * * * * 1% *
11
- - - - - - - - - - - - 406 161 245 107 90 107 102 145 69 168 142 145 120- - - - - - - - - - - - 21% 17% 24% 19% 18% 23% 24% 24% 21% 18% 21% 20% 20%
N q V
12
- - - - - - - - - - - - 159 66 93 52 26 45 36 50 24 69 35 55 69- - - - - - - - - - - - 8% 7% 9% 9% 5% 9% 9% 8% 7% 7% 5% 8% 12%
q Q Wx
13-20
- - - - - - - - - - - - 199 75 123 31 39 67 62 67 44 74 57 76 66- - - - - - - - - - - - 10% 8% 12% 5% 8% 14% 15% 11% 13% 8% 9% 11% 11%
N PQ PQ V
21-30
__________________________________________________________________________________________________________________Proportions/Means: Columns Tested (5%, 10% risk level) - A/B/C/D/E/F/G/H/I/J/K/L/M - N/O - P/Q/R/S - T/U/V - W/X/YOverlap formulae used. ** very small base (under 30) ineligible for sig testing
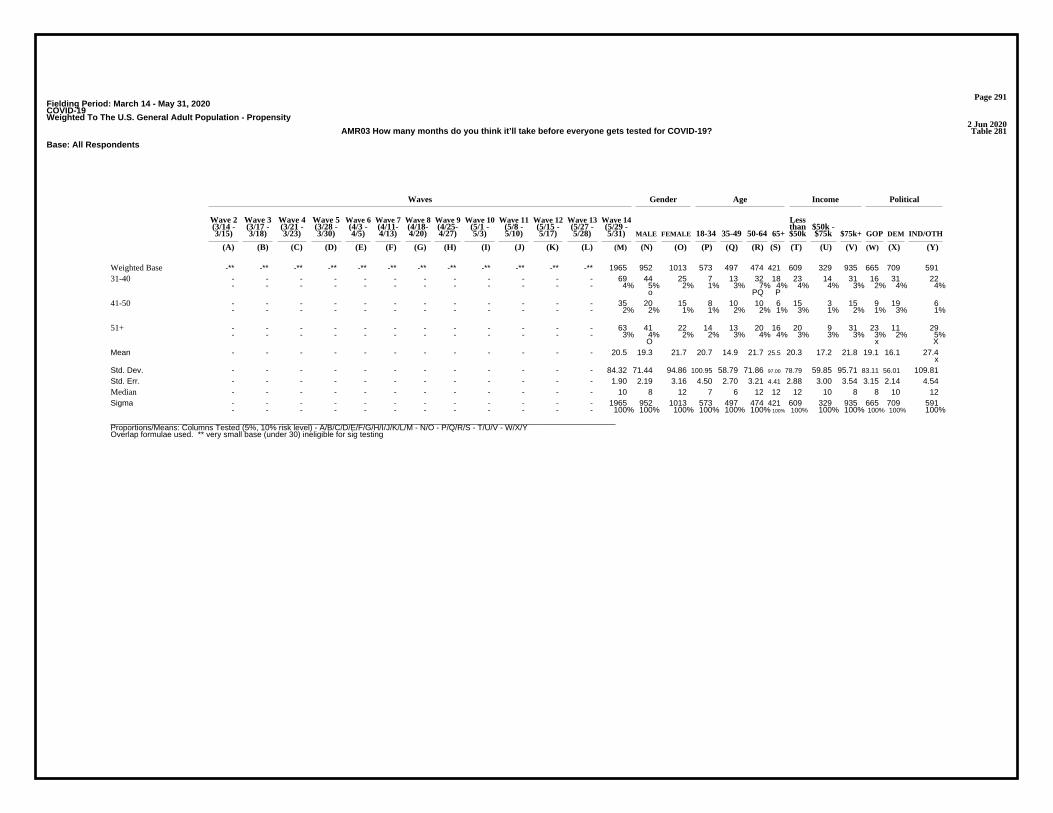
Page 291Fielding Period: March 14 - May 31, 2020COVID-19Weighted To The U.S. General Adult Population - Propensity
2 Jun 2020Table 281AMR03 How many months do you think it’ll take before everyone gets tested for COVID-19?
Base: All Respondents
Waves Gender Age Income Political
Wave 2 Wave 3 Wave 4 Wave 5 Wave 6 Wave 7 Wave 8 Wave 9 Wave 10 Wave 11 Wave 12 Wave 13 Wave 14 Less(3/14 - (3/17 - (3/21 - (3/28 - (4/3 - (4/11- (4/18- (4/25- (5/1 - (5/8 - (5/15 - (5/27 - (5/29 - than $50k -3/15) 3/18) 3/23) 3/30) 4/5) 4/13) 4/20) 4/27) 5/3) 5/10) 5/17) 5/28) 5/31) MALE FEMALE 18-34 35-49 50-64 65+ $50k $75k $75k+ GOP DEM IND/OTH
(A) (B) (C) (D) (E) (F) (G) (H) (I) (J) (K) (L) (M) (N) (O) (P) (Q) (R) (S) (T) (U) (V) (W) (X) (Y)
-** -** -** -** -** -** -** -** -** -** -** -** 1965 952 1013 573 497 474 421 609 329 935 665 709 591Weighted Base- - - - - - - - - - - - 69 44 25 7 13 32 18 23 14 31 16 31 22- - - - - - - - - - - - 4% 5% 2% 1% 3% 7% 4% 4% 4% 3% 2% 4% 4%
o PQ P
31-40
- - - - - - - - - - - - 35 20 15 8 10 10 6 15 3 15 9 19 6- - - - - - - - - - - - 2% 2% 1% 1% 2% 2% 1% 3% 1% 2% 1% 3% 1%
41-50
- - - - - - - - - - - - 63 41 22 14 13 20 16 20 9 31 23 11 29- - - - - - - - - - - - 3% 4% 2% 2% 3% 4% 4% 3% 3% 3% 3% 2% 5%
O x X
51+
- - - - - - - - - - - - 20.5 19.3 21.7 20.7 14.9 21.7 25.5 20.3 17.2 21.8 19.1 16.1 27.4x
Mean
- - - - - - - - - - - - 84.32 71.44 94.86 100.95 58.79 71.86 97.00 78.79 59.85 95.71 83.11 56.01 109.81Std. Dev.- - - - - - - - - - - - 1.90 2.19 3.16 4.50 2.70 3.21 4.41 2.88 3.00 3.54 3.15 2.14 4.54Std. Err.- - - - - - - - - - - - 10 8 12 7 6 12 12 12 10 8 8 10 12Median- - - - - - - - - - - - 1965 952 1013 573 497 474 421 609 329 935 665 709 591- - - - - - - - - - - - 100% 100% 100% 100% 100% 100% 100% 100% 100% 100% 100% 100% 100%
Sigma
__________________________________________________________________________________________________________________Proportions/Means: Columns Tested (5%, 10% risk level) - A/B/C/D/E/F/G/H/I/J/K/L/M - N/O - P/Q/R/S - T/U/V - W/X/YOverlap formulae used. ** very small base (under 30) ineligible for sig testing
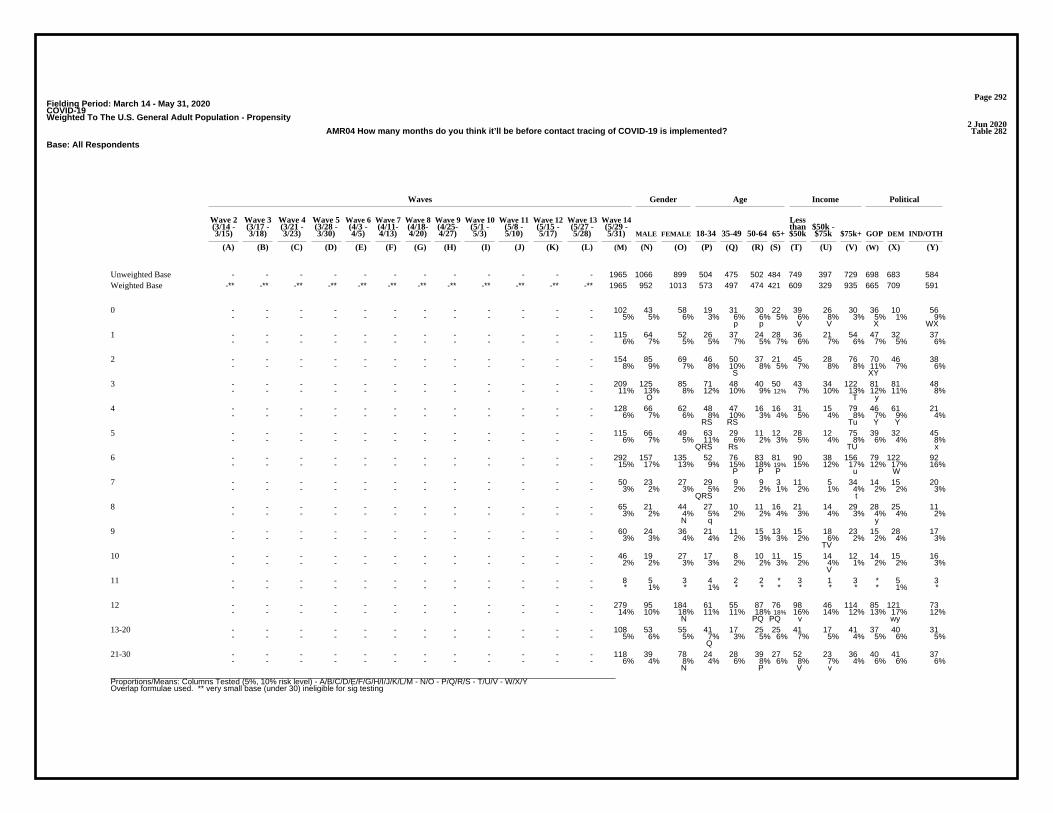
Page 292Fielding Period: March 14 - May 31, 2020COVID-19Weighted To The U.S. General Adult Population - Propensity
2 Jun 2020Table 282AMR04 How many months do you think it’ll be before contact tracing of COVID-19 is implemented?
Base: All Respondents
Waves Gender Age Income Political
Wave 2 Wave 3 Wave 4 Wave 5 Wave 6 Wave 7 Wave 8 Wave 9 Wave 10 Wave 11 Wave 12 Wave 13 Wave 14 Less(3/14 - (3/17 - (3/21 - (3/28 - (4/3 - (4/11- (4/18- (4/25- (5/1 - (5/8 - (5/15 - (5/27 - (5/29 - than $50k -3/15) 3/18) 3/23) 3/30) 4/5) 4/13) 4/20) 4/27) 5/3) 5/10) 5/17) 5/28) 5/31) MALE FEMALE 18-34 35-49 50-64 65+ $50k $75k $75k+ GOP DEM IND/OTH
(A) (B) (C) (D) (E) (F) (G) (H) (I) (J) (K) (L) (M) (N) (O) (P) (Q) (R) (S) (T) (U) (V) (W) (X) (Y)
- - - - - - - - - - - - 1965 1066 899 504 475 502 484 749 397 729 698 683 584Unweighted Base-** -** -** -** -** -** -** -** -** -** -** -** 1965 952 1013 573 497 474 421 609 329 935 665 709 591Weighted Base
- - - - - - - - - - - - 102 43 58 19 31 30 22 39 26 30 36 10 56- - - - - - - - - - - - 5% 5% 6% 3% 6% 6% 5% 6% 8% 3% 5% 1% 9%
p p V V X WX
0
- - - - - - - - - - - - 115 64 52 26 37 24 28 36 21 54 47 32 37- - - - - - - - - - - - 6% 7% 5% 5% 7% 5% 7% 6% 7% 6% 7% 5% 6%
1
- - - - - - - - - - - - 154 85 69 46 50 37 21 45 28 76 70 46 38- - - - - - - - - - - - 8% 9% 7% 8% 10% 8% 5% 7% 8% 8% 11% 7% 6%
S XY
2
- - - - - - - - - - - - 209 125 85 71 48 40 50 43 34 122 81 81 48- - - - - - - - - - - - 11% 13% 8% 12% 10% 9% 12% 7% 10% 13% 12% 11% 8%
O T y
3
- - - - - - - - - - - - 128 66 62 48 47 16 16 31 15 79 46 61 21- - - - - - - - - - - - 6% 7% 6% 8% 10% 3% 4% 5% 4% 8% 7% 9% 4%
RS RS Tu Y Y
4
- - - - - - - - - - - - 115 66 49 63 29 11 12 28 12 75 39 32 45- - - - - - - - - - - - 6% 7% 5% 11% 6% 2% 3% 5% 4% 8% 6% 4% 8%
QRS Rs TU x
5
- - - - - - - - - - - - 292 157 135 52 76 83 81 90 38 156 79 122 92- - - - - - - - - - - - 15% 17% 13% 9% 15% 18% 19% 15% 12% 17% 12% 17% 16%
P P P u W
6
- - - - - - - - - - - - 50 23 27 29 9 9 3 11 5 34 14 15 20- - - - - - - - - - - - 3% 2% 3% 5% 2% 2% 1% 2% 1% 4% 2% 2% 3%
QRS t
7
- - - - - - - - - - - - 65 21 44 27 10 11 16 21 14 29 28 25 11- - - - - - - - - - - - 3% 2% 4% 5% 2% 2% 4% 3% 4% 3% 4% 4% 2%
N q y
8
- - - - - - - - - - - - 60 24 36 21 11 15 13 15 18 23 15 28 17- - - - - - - - - - - - 3% 3% 4% 4% 2% 3% 3% 2% 6% 2% 2% 4% 3%
TV
9
- - - - - - - - - - - - 46 19 27 17 8 10 11 15 14 12 14 15 16- - - - - - - - - - - - 2% 2% 3% 3% 2% 2% 3% 2% 4% 1% 2% 2% 3%
V
10
- - - - - - - - - - - - 8 5 3 4 2 2 * 3 1 3 * 5 3- - - - - - - - - - - - * 1% * 1% * * * * * * * 1% *
11
- - - - - - - - - - - - 279 95 184 61 55 87 76 98 46 114 85 121 73- - - - - - - - - - - - 14% 10% 18% 11% 11% 18% 18% 16% 14% 12% 13% 17% 12%
N PQ PQ v wy
12
- - - - - - - - - - - - 108 53 55 41 17 25 25 41 17 41 37 40 31- - - - - - - - - - - - 5% 6% 5% 7% 3% 5% 6% 7% 5% 4% 5% 6% 5%
Q
13-20
- - - - - - - - - - - - 118 39 78 24 28 39 27 52 23 36 40 41 37- - - - - - - - - - - - 6% 4% 8% 4% 6% 8% 6% 8% 7% 4% 6% 6% 6%
N P V v
21-30
__________________________________________________________________________________________________________________Proportions/Means: Columns Tested (5%, 10% risk level) - A/B/C/D/E/F/G/H/I/J/K/L/M - N/O - P/Q/R/S - T/U/V - W/X/YOverlap formulae used. ** very small base (under 30) ineligible for sig testing
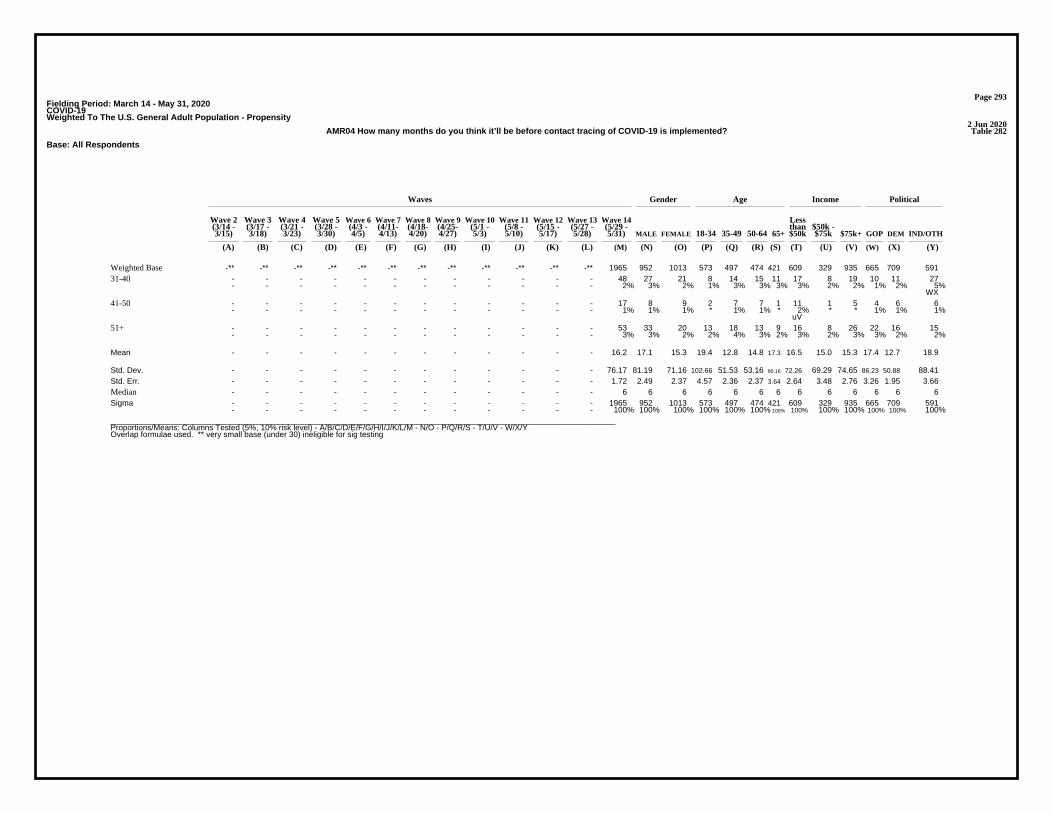
Page 293Fielding Period: March 14 - May 31, 2020COVID-19Weighted To The U.S. General Adult Population - Propensity
2 Jun 2020Table 282AMR04 How many months do you think it’ll be before contact tracing of COVID-19 is implemented?
Base: All Respondents
Waves Gender Age Income Political
Wave 2 Wave 3 Wave 4 Wave 5 Wave 6 Wave 7 Wave 8 Wave 9 Wave 10 Wave 11 Wave 12 Wave 13 Wave 14 Less(3/14 - (3/17 - (3/21 - (3/28 - (4/3 - (4/11- (4/18- (4/25- (5/1 - (5/8 - (5/15 - (5/27 - (5/29 - than $50k -3/15) 3/18) 3/23) 3/30) 4/5) 4/13) 4/20) 4/27) 5/3) 5/10) 5/17) 5/28) 5/31) MALE FEMALE 18-34 35-49 50-64 65+ $50k $75k $75k+ GOP DEM IND/OTH
(A) (B) (C) (D) (E) (F) (G) (H) (I) (J) (K) (L) (M) (N) (O) (P) (Q) (R) (S) (T) (U) (V) (W) (X) (Y)
-** -** -** -** -** -** -** -** -** -** -** -** 1965 952 1013 573 497 474 421 609 329 935 665 709 591Weighted Base- - - - - - - - - - - - 48 27 21 8 14 15 11 17 8 19 10 11 27- - - - - - - - - - - - 2% 3% 2% 1% 3% 3% 3% 3% 2% 2% 1% 2% 5%
WX
31-40
- - - - - - - - - - - - 17 8 9 2 7 7 1 11 1 5 4 6 6- - - - - - - - - - - - 1% 1% 1% * 1% 1% * 2% * * 1% 1% 1%
uV
41-50
- - - - - - - - - - - - 53 33 20 13 18 13 9 16 8 26 22 16 15- - - - - - - - - - - - 3% 3% 2% 2% 4% 3% 2% 3% 2% 3% 3% 2% 2%
51+
- - - - - - - - - - - - 16.2 17.1 15.3 19.4 12.8 14.8 17.3 16.5 15.0 15.3 17.4 12.7 18.9Mean
- - - - - - - - - - - - 76.17 81.19 71.16 102.66 51.53 53.16 80.16 72.26 69.29 74.65 86.23 50.88 88.41Std. Dev.- - - - - - - - - - - - 1.72 2.49 2.37 4.57 2.36 2.37 3.64 2.64 3.48 2.76 3.26 1.95 3.66Std. Err.- - - - - - - - - - - - 6 6 6 6 6 6 6 6 6 6 6 6 6Median- - - - - - - - - - - - 1965 952 1013 573 497 474 421 609 329 935 665 709 591- - - - - - - - - - - - 100% 100% 100% 100% 100% 100% 100% 100% 100% 100% 100% 100% 100%
Sigma
__________________________________________________________________________________________________________________Proportions/Means: Columns Tested (5%, 10% risk level) - A/B/C/D/E/F/G/H/I/J/K/L/M - N/O - P/Q/R/S - T/U/V - W/X/YOverlap formulae used. ** very small base (under 30) ineligible for sig testing
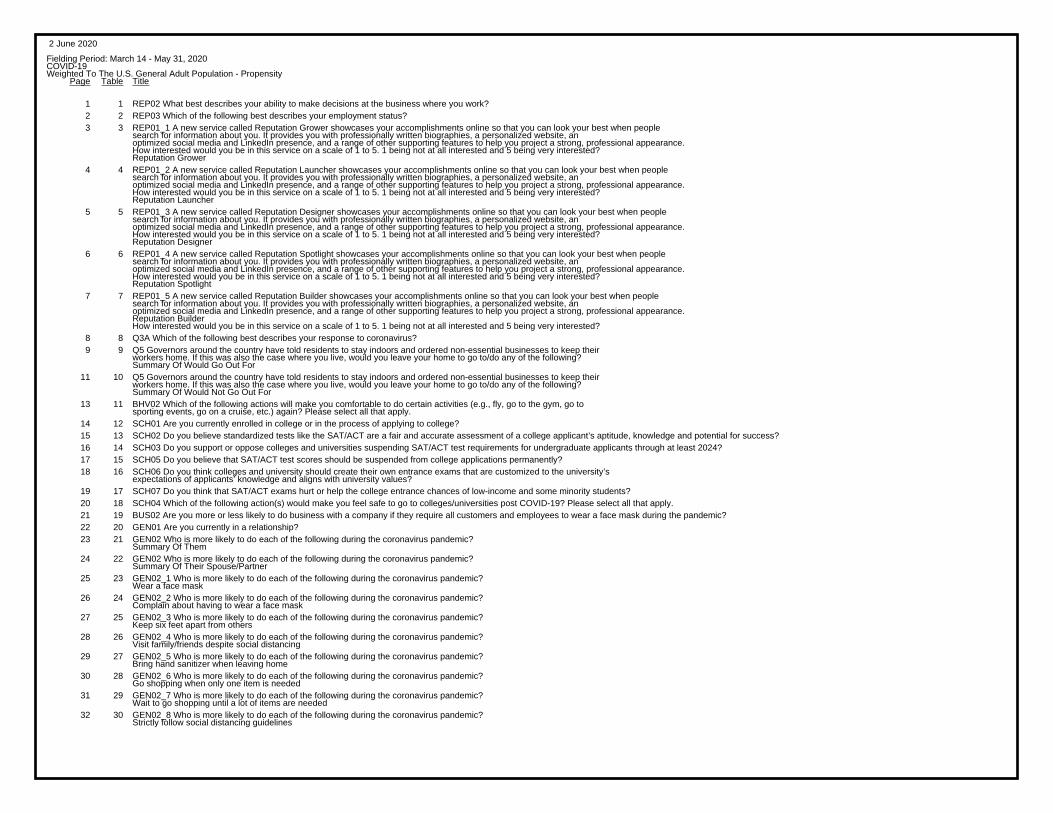
2 June 2020
Fielding Period: March 14 - May 31, 2020COVID-19Weighted To The U.S. General Adult Population - Propensity
TitleTablePage
1 1 REP02 What best describes your ability to make decisions at the business where you work?2 2 REP03 Which of the following best describes your employment status?3 3 REP01_1 A new service called Reputation Grower showcases your accomplishments online so that you can look your best when people
search for information about you. It provides you with professionally written biographies, a personalized website, anoptimized social media and LinkedIn presence, and a range of other supporting features to help you project a strong, professional appearance.How interested would you be in this service on a scale of 1 to 5. 1 being not at all interested and 5 being very interested?Reputation Grower
4 4 REP01_2 A new service called Reputation Launcher showcases your accomplishments online so that you can look your best when peoplesearch for information about you. It provides you with professionally written biographies, a personalized website, anoptimized social media and LinkedIn presence, and a range of other supporting features to help you project a strong, professional appearance.How interested would you be in this service on a scale of 1 to 5. 1 being not at all interested and 5 being very interested?Reputation Launcher
5 5 REP01_3 A new service called Reputation Designer showcases your accomplishments online so that you can look your best when peoplesearch for information about you. It provides you with professionally written biographies, a personalized website, anoptimized social media and LinkedIn presence, and a range of other supporting features to help you project a strong, professional appearance.How interested would you be in this service on a scale of 1 to 5. 1 being not at all interested and 5 being very interested?Reputation Designer
6 6 REP01_4 A new service called Reputation Spotlight showcases your accomplishments online so that you can look your best when peoplesearch for information about you. It provides you with professionally written biographies, a personalized website, anoptimized social media and LinkedIn presence, and a range of other supporting features to help you project a strong, professional appearance.How interested would you be in this service on a scale of 1 to 5. 1 being not at all interested and 5 being very interested?Reputation Spotlight
7 7 REP01_5 A new service called Reputation Builder showcases your accomplishments online so that you can look your best when peoplesearch for information about you. It provides you with professionally written biographies, a personalized website, anoptimized social media and LinkedIn presence, and a range of other supporting features to help you project a strong, professional appearance.Reputation BuilderHow interested would you be in this service on a scale of 1 to 5. 1 being not at all interested and 5 being very interested?
8 8 Q3A Which of the following best describes your response to coronavirus?9 9 Q5 Governors around the country have told residents to stay indoors and ordered non-essential businesses to keep their
workers home. If this was also the case where you live, would you leave your home to go to/do any of the following?Summary Of Would Go Out For
11 10 Q5 Governors around the country have told residents to stay indoors and ordered non-essential businesses to keep theirworkers home. If this was also the case where you live, would you leave your home to go to/do any of the following?Summary Of Would Not Go Out For
13 11 BHV02 Which of the following actions will make you comfortable to do certain activities (e.g., fly, go to the gym, go tosporting events, go on a cruise, etc.) again? Please select all that apply.
14 12 SCH01 Are you currently enrolled in college or in the process of applying to college?15 13 SCH02 Do you believe standardized tests like the SAT/ACT are a fair and accurate assessment of a college applicant’s aptitude, knowledge and potential for success?16 14 SCH03 Do you support or oppose colleges and universities suspending SAT/ACT test requirements for undergraduate applicants through at least 2024?17 15 SCH05 Do you believe that SAT/ACT test scores should be suspended from college applications permanently?18 16 SCH06 Do you think colleges and university should create their own entrance exams that are customized to the university’s
expectations of applicants’ knowledge and aligns with university values?19 17 SCH07 Do you think that SAT/ACT exams hurt or help the college entrance chances of low-income and some minority students?20 18 SCH04 Which of the following action(s) would make you feel safe to go to colleges/universities post COVID-19? Please select all that apply.21 19 BUS02 Are you more or less likely to do business with a company if they require all customers and employees to wear a face mask during the pandemic?22 20 GEN01 Are you currently in a relationship?23 21 GEN02 Who is more likely to do each of the following during the coronavirus pandemic?
Summary Of Them24 22 GEN02 Who is more likely to do each of the following during the coronavirus pandemic?
Summary Of Their Spouse/Partner25 23 GEN02_1 Who is more likely to do each of the following during the coronavirus pandemic?
Wear a face mask26 24 GEN02_2 Who is more likely to do each of the following during the coronavirus pandemic?
Complain about having to wear a face mask27 25 GEN02_3 Who is more likely to do each of the following during the coronavirus pandemic?
Keep six feet apart from others28 26 GEN02_4 Who is more likely to do each of the following during the coronavirus pandemic?
Visit family/friends despite social distancing29 27 GEN02_5 Who is more likely to do each of the following during the coronavirus pandemic?
Bring hand sanitizer when leaving home30 28 GEN02_6 Who is more likely to do each of the following during the coronavirus pandemic?
Go shopping when only one item is needed31 29 GEN02_7 Who is more likely to do each of the following during the coronavirus pandemic?
Wait to go shopping until a lot of items are needed32 30 GEN02_8 Who is more likely to do each of the following during the coronavirus pandemic?
Strictly follow social distancing guidelines
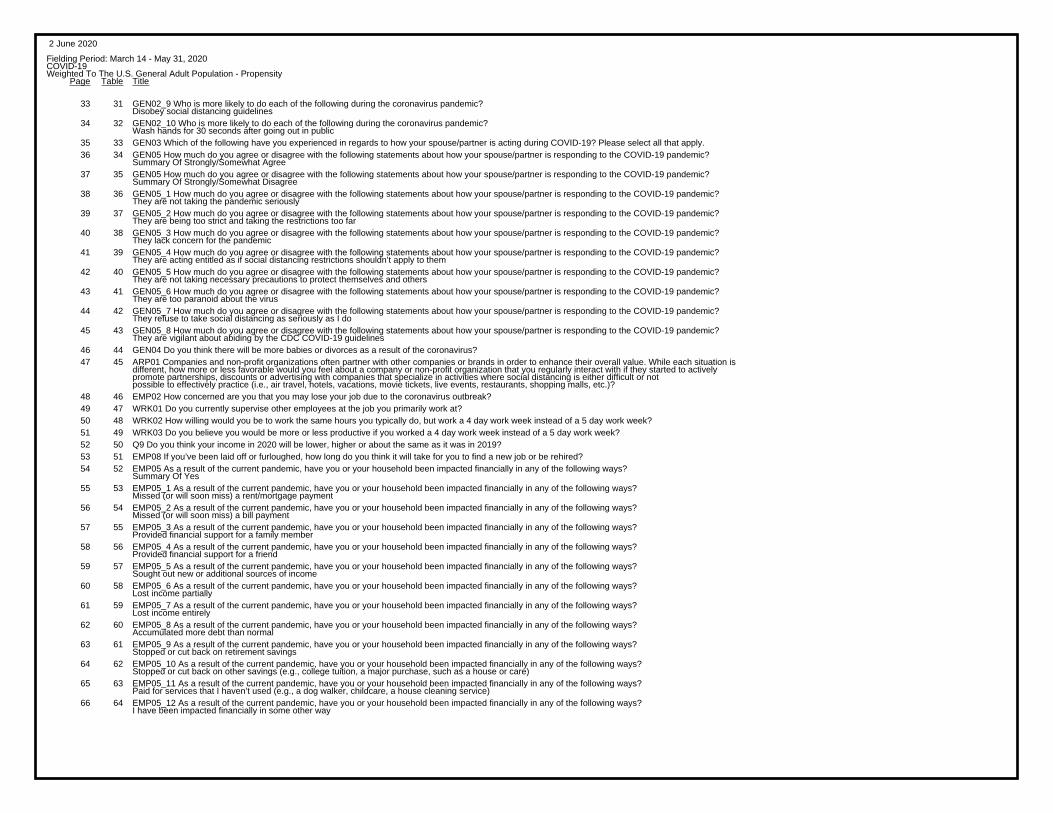
2 June 2020
Fielding Period: March 14 - May 31, 2020COVID-19Weighted To The U.S. General Adult Population - Propensity
TitleTablePage
33 31 GEN02_9 Who is more likely to do each of the following during the coronavirus pandemic?Disobey social distancing guidelines
34 32 GEN02_10 Who is more likely to do each of the following during the coronavirus pandemic?Wash hands for 30 seconds after going out in public
35 33 GEN03 Which of the following have you experienced in regards to how your spouse/partner is acting during COVID-19? Please select all that apply.36 34 GEN05 How much do you agree or disagree with the following statements about how your spouse/partner is responding to the COVID-19 pandemic?
Summary Of Strongly/Somewhat Agree37 35 GEN05 How much do you agree or disagree with the following statements about how your spouse/partner is responding to the COVID-19 pandemic?
Summary Of Strongly/Somewhat Disagree38 36 GEN05_1 How much do you agree or disagree with the following statements about how your spouse/partner is responding to the COVID-19 pandemic?
They are not taking the pandemic seriously39 37 GEN05_2 How much do you agree or disagree with the following statements about how your spouse/partner is responding to the COVID-19 pandemic?
They are being too strict and taking the restrictions too far40 38 GEN05_3 How much do you agree or disagree with the following statements about how your spouse/partner is responding to the COVID-19 pandemic?
They lack concern for the pandemic41 39 GEN05_4 How much do you agree or disagree with the following statements about how your spouse/partner is responding to the COVID-19 pandemic?
They are acting entitled as if social distancing restrictions shouldn’t apply to them42 40 GEN05_5 How much do you agree or disagree with the following statements about how your spouse/partner is responding to the COVID-19 pandemic?
They are not taking necessary precautions to protect themselves and others43 41 GEN05_6 How much do you agree or disagree with the following statements about how your spouse/partner is responding to the COVID-19 pandemic?
They are too paranoid about the virus44 42 GEN05_7 How much do you agree or disagree with the following statements about how your spouse/partner is responding to the COVID-19 pandemic?
They refuse to take social distancing as seriously as I do45 43 GEN05_8 How much do you agree or disagree with the following statements about how your spouse/partner is responding to the COVID-19 pandemic?
They are vigilant about abiding by the CDC COVID-19 guidelines46 44 GEN04 Do you think there will be more babies or divorces as a result of the coronavirus?47 45 ARP01 Companies and non-profit organizations often partner with other companies or brands in order to enhance their overall value. While each situation is
different, how more or less favorable would you feel about a company or non-profit organization that you regularly interact with if they started to activelypromote partnerships, discounts or advertising with companies that specialize in activities where social distancing is either difficult or notpossible to effectively practice (i.e., air travel, hotels, vacations, movie tickets, live events, restaurants, shopping malls, etc.)?
48 46 EMP02 How concerned are you that you may lose your job due to the coronavirus outbreak?49 47 WRK01 Do you currently supervise other employees at the job you primarily work at?50 48 WRK02 How willing would you be to work the same hours you typically do, but work a 4 day work week instead of a 5 day work week?51 49 WRK03 Do you believe you would be more or less productive if you worked a 4 day work week instead of a 5 day work week?52 50 Q9 Do you think your income in 2020 will be lower, higher or about the same as it was in 2019?53 51 EMP08 If you’ve been laid off or furloughed, how long do you think it will take for you to find a new job or be rehired?54 52 EMP05 As a result of the current pandemic, have you or your household been impacted financially in any of the following ways?
Summary Of Yes55 53 EMP05_1 As a result of the current pandemic, have you or your household been impacted financially in any of the following ways?
Missed (or will soon miss) a rent/mortgage payment56 54 EMP05_2 As a result of the current pandemic, have you or your household been impacted financially in any of the following ways?
Missed (or will soon miss) a bill payment57 55 EMP05_3 As a result of the current pandemic, have you or your household been impacted financially in any of the following ways?
Provided financial support for a family member58 56 EMP05_4 As a result of the current pandemic, have you or your household been impacted financially in any of the following ways?
Provided financial support for a friend59 57 EMP05_5 As a result of the current pandemic, have you or your household been impacted financially in any of the following ways?
Sought out new or additional sources of income60 58 EMP05_6 As a result of the current pandemic, have you or your household been impacted financially in any of the following ways?
Lost income partially61 59 EMP05_7 As a result of the current pandemic, have you or your household been impacted financially in any of the following ways?
Lost income entirely62 60 EMP05_8 As a result of the current pandemic, have you or your household been impacted financially in any of the following ways?
Accumulated more debt than normal63 61 EMP05_9 As a result of the current pandemic, have you or your household been impacted financially in any of the following ways?
Stopped or cut back on retirement savings64 62 EMP05_10 As a result of the current pandemic, have you or your household been impacted financially in any of the following ways?
Stopped or cut back on other savings (e.g., college tuition, a major purchase, such as a house or care)65 63 EMP05_11 As a result of the current pandemic, have you or your household been impacted financially in any of the following ways?
Paid for services that I haven’t used (e.g., a dog walker, childcare, a house cleaning service)66 64 EMP05_12 As a result of the current pandemic, have you or your household been impacted financially in any of the following ways?
I have been impacted financially in some other way
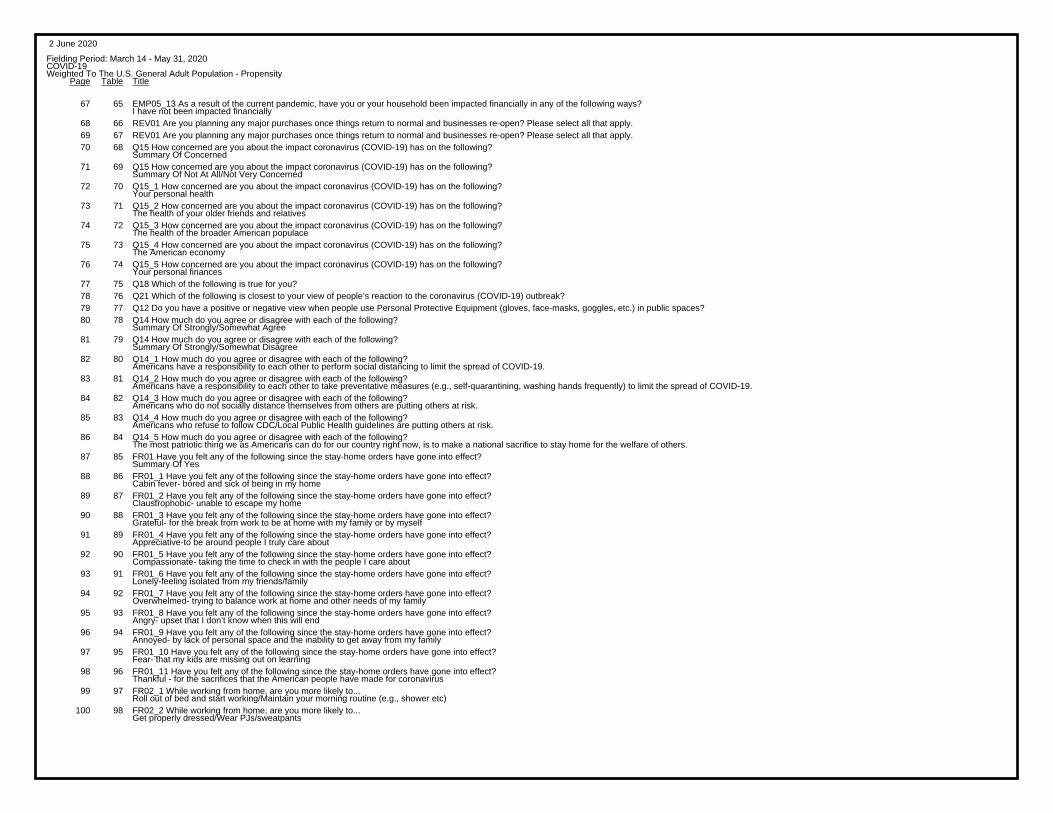
2 June 2020
Fielding Period: March 14 - May 31, 2020COVID-19Weighted To The U.S. General Adult Population - Propensity
TitleTablePage
67 65 EMP05_13 As a result of the current pandemic, have you or your household been impacted financially in any of the following ways?I have not been impacted financially
68 66 REV01 Are you planning any major purchases once things return to normal and businesses re-open? Please select all that apply.69 67 REV01 Are you planning any major purchases once things return to normal and businesses re-open? Please select all that apply.70 68 Q15 How concerned are you about the impact coronavirus (COVID-19) has on the following?
Summary Of Concerned71 69 Q15 How concerned are you about the impact coronavirus (COVID-19) has on the following?
Summary Of Not At All/Not Very Concerned72 70 Q15_1 How concerned are you about the impact coronavirus (COVID-19) has on the following?
Your personal health73 71 Q15_2 How concerned are you about the impact coronavirus (COVID-19) has on the following?
The health of your older friends and relatives74 72 Q15_3 How concerned are you about the impact coronavirus (COVID-19) has on the following?
The health of the broader American populace75 73 Q15_4 How concerned are you about the impact coronavirus (COVID-19) has on the following?
The American economy76 74 Q15_5 How concerned are you about the impact coronavirus (COVID-19) has on the following?
Your personal finances77 75 Q18 Which of the following is true for you?78 76 Q21 Which of the following is closest to your view of people’s reaction to the coronavirus (COVID-19) outbreak?79 77 Q12 Do you have a positive or negative view when people use Personal Protective Equipment (gloves, face-masks, goggles, etc.) in public spaces?80 78 Q14 How much do you agree or disagree with each of the following?
Summary Of Strongly/Somewhat Agree81 79 Q14 How much do you agree or disagree with each of the following?
Summary Of Strongly/Somewhat Disagree82 80 Q14_1 How much do you agree or disagree with each of the following?
Americans have a responsibility to each other to perform social distancing to limit the spread of COVID-19.83 81 Q14_2 How much do you agree or disagree with each of the following?
Americans have a responsibility to each other to take preventative measures (e.g., self-quarantining, washing hands frequently) to limit the spread of COVID-19.84 82 Q14_3 How much do you agree or disagree with each of the following?
Americans who do not socially distance themselves from others are putting others at risk.85 83 Q14_4 How much do you agree or disagree with each of the following?
Americans who refuse to follow CDC/Local Public Health guidelines are putting others at risk.86 84 Q14_5 How much do you agree or disagree with each of the following?
The most patriotic thing we as Americans can do for our country right now, is to make a national sacrifice to stay home for the welfare of others.87 85 FR01 Have you felt any of the following since the stay-home orders have gone into effect?
Summary Of Yes88 86 FR01_1 Have you felt any of the following since the stay-home orders have gone into effect?
Cabin fever- bored and sick of being in my home89 87 FR01_2 Have you felt any of the following since the stay-home orders have gone into effect?
Claustrophobic- unable to escape my home90 88 FR01_3 Have you felt any of the following since the stay-home orders have gone into effect?
Grateful- for the break from work to be at home with my family or by myself91 89 FR01_4 Have you felt any of the following since the stay-home orders have gone into effect?
Appreciative-to be around people I truly care about92 90 FR01_5 Have you felt any of the following since the stay-home orders have gone into effect?
Compassionate- taking the time to check in with the people I care about93 91 FR01_6 Have you felt any of the following since the stay-home orders have gone into effect?
Lonely-feeling isolated from my friends/family94 92 FR01_7 Have you felt any of the following since the stay-home orders have gone into effect?
Overwhelmed- trying to balance work at home and other needs of my family95 93 FR01_8 Have you felt any of the following since the stay-home orders have gone into effect?
Angry- upset that I don’t know when this will end96 94 FR01_9 Have you felt any of the following since the stay-home orders have gone into effect?
Annoyed- by lack of personal space and the inability to get away from my family97 95 FR01_10 Have you felt any of the following since the stay-home orders have gone into effect?
Fear- that my kids are missing out on learning98 96 FR01_11 Have you felt any of the following since the stay-home orders have gone into effect?
Thankful - for the sacrifices that the American people have made for coronavirus99 97 FR02_1 While working from home, are you more likely to...
Roll out of bed and start working/Maintain your morning routine (e.g., shower etc)100 98 FR02_2 While working from home, are you more likely to...
Get properly dressed/Wear PJs/sweatpants

2 June 2020
Fielding Period: March 14 - May 31, 2020COVID-19Weighted To The U.S. General Adult Population - Propensity
TitleTablePage
101 99 FR02_3 While working from home, are you more likely to...Take a shower daily/Skip a couple of days of showering
102 100 FR02_4 While working from home, are you more likely to...Work more/Work less
103 101 FR02_5 While working from home, are you more likely to...Maintain clear time boundaries (e.g., 9-5)/Work anytime that is needed
104 102 FR05 How much would you say you miss each of the following during this time of virus-related shutdowns?Summary Of A Lot/Somewhat
105 103 FR05 How much would you say you miss each of the following during this time of virus-related shutdowns?Summary Of Not At All/Not Very
106 104 FR05_1 How much would you say you miss each of the following during this time of virus-related shutdowns?Traveling on an airplane
107 105 FR05_2 How much would you say you miss each of the following during this time of virus-related shutdowns?Going to a movie theatre
108 106 FR05_3 How much would you say you miss each of the following during this time of virus-related shutdowns?Shopping in stores
109 107 FR05_4 How much would you say you miss each of the following during this time of virus-related shutdowns?Working from the office
110 108 FR05_5 How much would you say you miss each of the following during this time of virus-related shutdowns?Attending events like concerts, theatre and sporting events
111 109 FR05_6 How much would you say you miss each of the following during this time of virus-related shutdowns?Dining out at a restaurant/bar
112 110 FR05_7 How much would you say you miss each of the following during this time of virus-related shutdowns?Watching sports on TV
113 111 FR05_8 How much would you say you miss each of the following during this time of virus-related shutdowns?Gatherings with friends and family
114 112 FR05_9 How much would you say you miss each of the following during this time of virus-related shutdowns?Going to church
115 113 FR05_10 How much would you say you miss each of the following during this time of virus-related shutdowns?Going to school or university
116 114 FR05_13 How much would you say you miss each of the following during this time of virus-related shutdowns?Going to the gym/work out class
117 115 FR05_14 How much would you say you miss each of the following during this time of virus-related shutdowns?Going to a social gathering,
118 116 FR05_15 How much would you say you miss each of the following during this time of virus-related shutdowns?Going to my local coffee shop
119 117 Q22 How concerned are you about each of the following potential shortages from coronavirus (COVID-19) in the healthcaresystem?Summary Of Concerned
120 118 Q22 How concerned are you about each of the following potential shortages from coronavirus (COVID-19) in the healthcaresystem?Summary Of Not At All/Not Very Concerned
121 119 Q22_1 How concerned are you about each of the following potential shortages from coronavirus (COVID-19) in the healthcaresystem?Surgical masks and gloves
122 120 Q22_2 How concerned are you about each of the following potential shortages from coronavirus (COVID-19) in the healthcaresystem?Testing kits for COVID-19
123 121 Q22_3 How concerned are you about each of the following potential shortages from coronavirus (COVID-19) in the healthcaresystem?Hospital beds (room for patients)
124 122 Q22_4 How concerned are you about each of the following potential shortages from coronavirus (COVID-19) in the healthcaresystem?Hospital ventilators (for assisted breathing)
125 123 Q22_5 How concerned are you about each of the following potential shortages from coronavirus (COVID-19) in the healthcaresystem?Healthcare workers (doctors, nurses, supporting staff)
126 124 FR11 How concerned are you about you or your loved one’s risk of being exposed to coronavirus when you leave your homefor essential errands during stay-home orders?
127 125 FR13 How concerned are you about you or your loved one’s risk of accidentally exposing others to coronavirus when youleave your home for essential errands during stay-home orders?
128 126 FR12 When stay-at-home orders are lifted, how concerned are you about the following situations, as it relates to the risk ofyou/your loved ones being exposed to, or accidentally exposing others to coronavirus?Summary Of Very/Somewhat Concerned
129 127 FR12 When stay-at-home orders are lifted, how concerned are you about the following situations, as it relates to the risk ofyou/your loved ones being exposed to, or accidentally exposing others to coronavirus?Summary Of Not At All/Not Very Concerned

2 June 2020
Fielding Period: March 14 - May 31, 2020COVID-19Weighted To The U.S. General Adult Population - Propensity
TitleTablePage
130 128 FR12_1 When stay-at-home orders are lifted, how concerned are you about the following situations, as it relates to the risk ofyou/your loved ones being exposed to, or accidentally exposing others to coronavirus?Leaving my home for the first time to go to non-essential businesses (e.g., bars, hair dressers, etc.)
131 129 FR12_2 When stay-at-home orders are lifted, how concerned are you about the following situations, as it relates to the risk ofyou/your loved ones being exposed to, or accidentally exposing others to coronavirus?Returning to my normal activities in public (e.g., public transit, socializing)
132 130 FR12_3 When stay-at-home orders are lifted, how concerned are you about the following situations, as it relates to the risk ofyou/your loved ones being exposed to, or accidentally exposing others to coronavirus?Taking my first flight
133 131 FR12_4 When stay-at-home orders are lifted, how concerned are you about the following situations, as it relates to the risk ofyou/your loved ones being exposed to, or accidentally exposing others to coronavirus?My kids going back to school for the first time
134 132 FR12_5 When stay-at-home orders are lifted, how concerned are you about the following situations, as it relates to the risk ofyou/your loved ones being exposed to, or accidentally exposing others to coronavirus?Going back to the office
135 133 SM01 In general, do you think people on your social media feeds are mostly posting facts or misleading information?136 134 SM03 Do social media platforms have a responsibility to monitor whether things said on their platform are true or false?137 135 SM04 Do you think social media platforms should or should not censor information they believe to be false/ misleading?138 136 SM05 Do you think that social media platforms are generally more favorable to Republicans or Democrats?139 137 Q24 How trustworthy do you think each of the following sources are to provide accurate information regarding the coronavirus outbreak?
Summary Of Trustworthy141 138 Q24_1 How trustworthy do you think each of the following sources are to provide accurate information regarding the coronavirus outbreak?
Social media (e.g., Facebook, Instagram)142 139 Q24_2 How trustworthy do you think each of the following sources are to provide accurate information regarding the coronavirus outbreak?
National media143 140 Q24_3 How trustworthy do you think each of the following sources are to provide accurate information regarding the coronavirus outbreak?
Local media144 141 Q24_4 How trustworthy do you think each of the following sources are to provide accurate information regarding the coronavirus outbreak?
Medical journals145 142 Q24_5 How trustworthy do you think each of the following sources are to provide accurate information regarding the coronavirus outbreak?
Government PSA’s/website146 143 Q24_6 How trustworthy do you think each of the following sources are to provide accurate information regarding the coronavirus outbreak?
CDC147 144 Q24_7 How trustworthy do you think each of the following sources are to provide accurate information regarding the coronavirus outbreak?
Friends and family148 145 Q24_8 How trustworthy do you think each of the following sources are to provide accurate information regarding the coronavirus outbreak?
Doctors and nurses149 146 Q24_9 How trustworthy do you think each of the following sources are to provide accurate information regarding the coronavirus outbreak?
The White House/President150 147 Q24_10 How trustworthy do you think each of the following sources are to provide accurate information regarding the coronavirus outbreak?
My governor151 148 Q24_11 How trustworthy do you think each of the following sources are to provide accurate information regarding the coronavirus outbreak?
My local government152 149 Q24_12 How trustworthy do you think each of the following sources are to provide accurate information regarding the coronavirus outbreak?
Chinese President, Xi Jinping153 150 Q24_13 How trustworthy do you think each of the following sources are to provide accurate information regarding the coronavirus outbreak?
My employer154 151 Q24_14 How trustworthy do you think each of the following sources are to provide accurate information regarding the coronavirus outbreak?
Local county agencies/health departments155 152 Q24_15 How trustworthy do you think each of the following sources are to provide accurate information regarding the coronavirus outbreak?
International health organizations (e.g., World Health Organization)156 153 Q24_16 How trustworthy do you think each of the following sources are to provide accurate information regarding the coronavirus outbreak?
Scientists157 154 MED05 What is your opinion of companies who create advertisements about COVID-19?158 155 Q23 Once they are allowed to reopen, should certain businesses that host events (e.g., concert venues, convention centers)
be required to conduct health screening before allowing people to enter?159 156 Q33B Once the government provides information that the spread of the virus is flattening how long will it take you to do each
of the following?160 157 Q33B Once the government provides information that the spread of the virus is flattening how long will it take you to do each
of the following?Summary Of Immediately/1-30 Days
161 158 Q33B Once the government provides information that the spread of the virus is flattening how long will it take you to do eachof the following?Summary Of Up To 3 Months
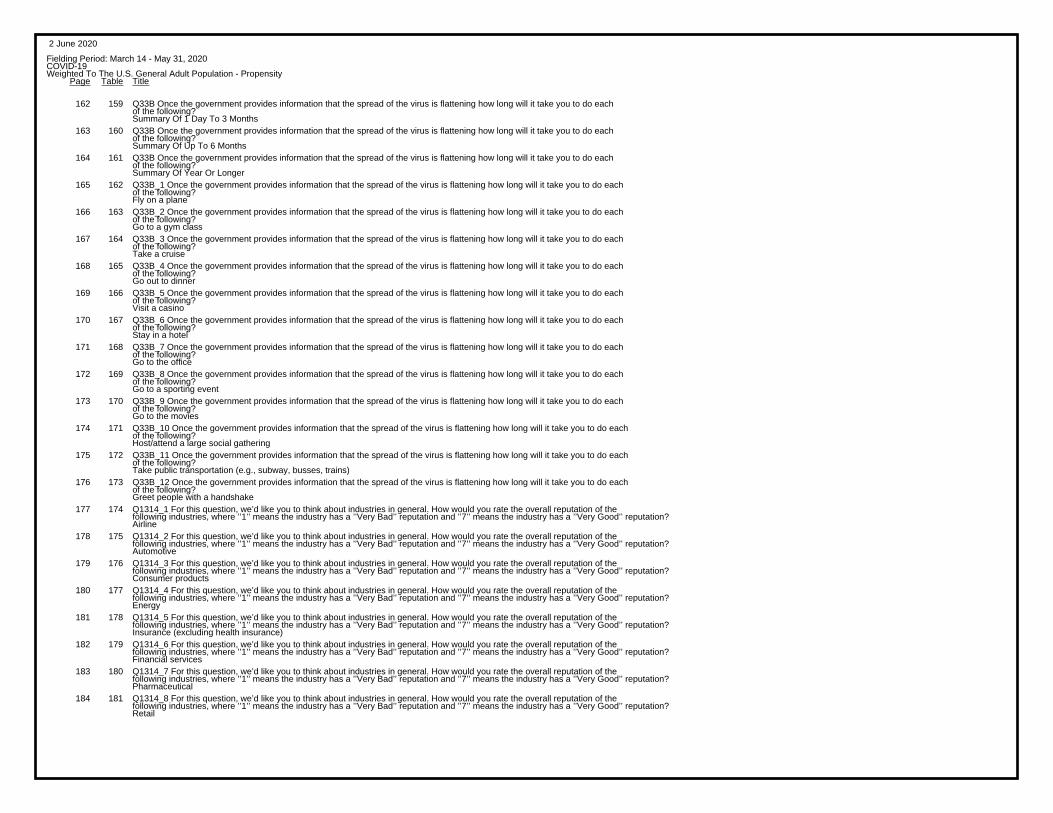
2 June 2020
Fielding Period: March 14 - May 31, 2020COVID-19Weighted To The U.S. General Adult Population - Propensity
TitleTablePage
162 159 Q33B Once the government provides information that the spread of the virus is flattening how long will it take you to do eachof the following?Summary Of 1 Day To 3 Months
163 160 Q33B Once the government provides information that the spread of the virus is flattening how long will it take you to do eachof the following?Summary Of Up To 6 Months
164 161 Q33B Once the government provides information that the spread of the virus is flattening how long will it take you to do eachof the following?Summary Of Year Or Longer
165 162 Q33B_1 Once the government provides information that the spread of the virus is flattening how long will it take you to do eachof the following?Fly on a plane
166 163 Q33B_2 Once the government provides information that the spread of the virus is flattening how long will it take you to do eachof the following?Go to a gym class
167 164 Q33B_3 Once the government provides information that the spread of the virus is flattening how long will it take you to do eachof the following?Take a cruise
168 165 Q33B_4 Once the government provides information that the spread of the virus is flattening how long will it take you to do eachof the following?Go out to dinner
169 166 Q33B_5 Once the government provides information that the spread of the virus is flattening how long will it take you to do eachof the following?Visit a casino
170 167 Q33B_6 Once the government provides information that the spread of the virus is flattening how long will it take you to do eachof the following?Stay in a hotel
171 168 Q33B_7 Once the government provides information that the spread of the virus is flattening how long will it take you to do eachof the following?Go to the office
172 169 Q33B_8 Once the government provides information that the spread of the virus is flattening how long will it take you to do eachof the following?Go to a sporting event
173 170 Q33B_9 Once the government provides information that the spread of the virus is flattening how long will it take you to do eachof the following?Go to the movies
174 171 Q33B_10 Once the government provides information that the spread of the virus is flattening how long will it take you to do eachof the following?Host/attend a large social gathering
175 172 Q33B_11 Once the government provides information that the spread of the virus is flattening how long will it take you to do eachof the following?Take public transportation (e.g., subway, busses, trains)
176 173 Q33B_12 Once the government provides information that the spread of the virus is flattening how long will it take you to do eachof the following?Greet people with a handshake
177 174 Q1314_1 For this question, we’d like you to think about industries in general. How would you rate the overall reputation of thefollowing industries, where ’’1’’ means the industry has a ’’Very Bad’’ reputation and ’’7’’ means the industry has a ’’Very Good’’ reputation?Airline
178 175 Q1314_2 For this question, we’d like you to think about industries in general. How would you rate the overall reputation of thefollowing industries, where ’’1’’ means the industry has a ’’Very Bad’’ reputation and ’’7’’ means the industry has a ’’Very Good’’ reputation?Automotive
179 176 Q1314_3 For this question, we’d like you to think about industries in general. How would you rate the overall reputation of thefollowing industries, where ’’1’’ means the industry has a ’’Very Bad’’ reputation and ’’7’’ means the industry has a ’’Very Good’’ reputation?Consumer products
180 177 Q1314_4 For this question, we’d like you to think about industries in general. How would you rate the overall reputation of thefollowing industries, where ’’1’’ means the industry has a ’’Very Bad’’ reputation and ’’7’’ means the industry has a ’’Very Good’’ reputation?Energy
181 178 Q1314_5 For this question, we’d like you to think about industries in general. How would you rate the overall reputation of thefollowing industries, where ’’1’’ means the industry has a ’’Very Bad’’ reputation and ’’7’’ means the industry has a ’’Very Good’’ reputation?Insurance (excluding health insurance)
182 179 Q1314_6 For this question, we’d like you to think about industries in general. How would you rate the overall reputation of thefollowing industries, where ’’1’’ means the industry has a ’’Very Bad’’ reputation and ’’7’’ means the industry has a ’’Very Good’’ reputation?Financial services
183 180 Q1314_7 For this question, we’d like you to think about industries in general. How would you rate the overall reputation of thefollowing industries, where ’’1’’ means the industry has a ’’Very Bad’’ reputation and ’’7’’ means the industry has a ’’Very Good’’ reputation?Pharmaceutical
184 181 Q1314_8 For this question, we’d like you to think about industries in general. How would you rate the overall reputation of thefollowing industries, where ’’1’’ means the industry has a ’’Very Bad’’ reputation and ’’7’’ means the industry has a ’’Very Good’’ reputation?Retail

2 June 2020
Fielding Period: March 14 - May 31, 2020COVID-19Weighted To The U.S. General Adult Population - Propensity
TitleTablePage
185 182 Q1314_9 For this question, we’d like you to think about industries in general. How would you rate the overall reputation of thefollowing industries, where ’’1’’ means the industry has a ’’Very Bad’’ reputation and ’’7’’ means the industry has a ’’Very Good’’ reputation?Technology
186 183 Q1314_10 For this question, we’d like you to think about industries in general. How would you rate the overall reputation of thefollowing industries, where ’’1’’ means the industry has a ’’Very Bad’’ reputation and ’’7’’ means the industry has a ’’Very Good’’ reputation?Telecommunications
187 184 Q1314_11 For this question, we’d like you to think about industries in general. How would you rate the overall reputation of thefollowing industries, where ’’1’’ means the industry has a ’’Very Bad’’ reputation and ’’7’’ means the industry has a ’’Very Good’’ reputation?Tobacco
188 185 Q1314_12 For this question, we’d like you to think about industries in general. How would you rate the overall reputation of thefollowing industries, where ’’1’’ means the industry has a ’’Very Bad’’ reputation and ’’7’’ means the industry has a ’’Very Good’’ reputation?Manufacturing
189 186 Q1314_13 For this question, we’d like you to think about industries in general. How would you rate the overall reputation of thefollowing industries, where ’’1’’ means the industry has a ’’Very Bad’’ reputation and ’’7’’ means the industry has a ’’Very Good’’ reputation?Government
190 187 Q1314_14 For this question, we’d like you to think about industries in general. How would you rate the overall reputation of thefollowing industries, where ’’1’’ means the industry has a ’’Very Bad’’ reputation and ’’7’’ means the industry has a ’’Very Good’’ reputation?Banking
191 188 Q1314_15 For this question, we’d like you to think about industries in general. How would you rate the overall reputation of thefollowing industries, where ’’1’’ means the industry has a ’’Very Bad’’ reputation and ’’7’’ means the industry has a ’’Very Good’’ reputation?Media
192 189 Q1314_16 For this question, we’d like you to think about industries in general. How would you rate the overall reputation of thefollowing industries, where ’’1’’ means the industry has a ’’Very Bad’’ reputation and ’’7’’ means the industry has a ’’Very Good’’ reputation?Health insurance
193 190 Q1314_17 For this question, we’d like you to think about industries in general. How would you rate the overall reputation of thefollowing industries, where ’’1’’ means the industry has a ’’Very Bad’’ reputation and ’’7’’ means the industry has a ’’Very Good’’ reputation?Retail (grocery)
194 191 Q1314_18 For this question, we’d like you to think about industries in general. How would you rate the overall reputation of thefollowing industries, where ’’1’’ means the industry has a ’’Very Bad’’ reputation and ’’7’’ means the industry has a ’’Very Good’’ reputation?Retail (apparel)
195 192 Q1314_19 For this question, we’d like you to think about industries in general. How would you rate the overall reputation of thefollowing industries, where ’’1’’ means the industry has a ’’Very Bad’’ reputation and ’’7’’ means the industry has a ’’Very Good’’ reputation?E-commerce
196 193 Q1314_20 For this question, we’d like you to think about industries in general. How would you rate the overall reputation of thefollowing industries, where ’’1’’ means the industry has a ’’Very Bad’’ reputation and ’’7’’ means the industry has a ’’Very Good’’ reputation?Aerospace
197 194 Q38 How has your view of each of the following industries changed since the start of the coronavirus pandemic?Summary Of More Positive
199 195 Q38 How has your view of each of the following industries changed since the start of the coronavirus pandemic?Summary Of More Negative
201 196 Q38_1 How has your view of each of the following industries changed since the start of the coronavirus pandemic?Financial services
202 197 Q38_2 How has your view of each of the following industries changed since the start of the coronavirus pandemic?Retail
203 198 Q38_3 How has your view of each of the following industries changed since the start of the coronavirus pandemic?Technology
204 199 Q38_4 How has your view of each of the following industries changed since the start of the coronavirus pandemic?Media
205 200 Q38_5 How has your view of each of the following industries changed since the start of the coronavirus pandemic?Automotive
206 201 Q38_6 How has your view of each of the following industries changed since the start of the coronavirus pandemic?Healthcare (Doctors/Nurses/Hospital)
207 202 Q38_7 How has your view of each of the following industries changed since the start of the coronavirus pandemic?Food & Beverage
208 203 Q38_8 How has your view of each of the following industries changed since the start of the coronavirus pandemic?Entertainment
209 204 Q38_9 How has your view of each of the following industries changed since the start of the coronavirus pandemic?Travel and hospitality (hotels, cruise lines)
210 205 Q38_10 How has your view of each of the following industries changed since the start of the coronavirus pandemic?Airlines
211 206 Q38_11 How has your view of each of the following industries changed since the start of the coronavirus pandemic?Non-profits
212 207 Q38_12 How has your view of each of the following industries changed since the start of the coronavirus pandemic?Real estate
213 208 Q38_13 How has your view of each of the following industries changed since the start of the coronavirus pandemic?Retail - grocery

2 June 2020
Fielding Period: March 14 - May 31, 2020COVID-19Weighted To The U.S. General Adult Population - Propensity
TitleTablePage
214 209 Q38_14 How has your view of each of the following industries changed since the start of the coronavirus pandemic?Pharmaceutical/drugs
215 210 Q38_15 How has your view of each of the following industries changed since the start of the coronavirus pandemic?Oil
216 211 Q38_16 How has your view of each of the following industries changed since the start of the coronavirus pandemic?Restaurants
217 212 Q38_17 How has your view of each of the following industries changed since the start of the coronavirus pandemic?Manufacturing
218 213 Q38_18 How has your view of each of the following industries changed since the start of the coronavirus pandemic?Small Businesses
219 214 Q38_19 How has your view of each of the following industries changed since the start of the coronavirus pandemic?Telecommunications
220 215 Q38_20 How has your view of each of the following industries changed since the start of the coronavirus pandemic?Retail - apparel
221 216 Q38_21 How has your view of each of the following industries changed since the start of the coronavirus pandemic?Energy and Utilities
222 217 Q38_22 How has your view of each of the following industries changed since the start of the coronavirus pandemic?Insurance
223 218 Q8 Which airline would be your first choice to use for business travel and leisure travel?Summary Of Delta Air Lines
224 219 Q8 Which airline would be your first choice to use for business travel and leisure travel?Summary Of American Airlines
225 220 Q8 Which airline would be your first choice to use for business travel and leisure travel?Summary Of United Airlines
226 221 Q8 Which airline would be your first choice to use for business travel and leisure travel?Summary Of Southwest Airlines
227 222 Q8 Which airline would be your first choice to use for business travel and leisure travel?Summary Of Jetblue Airways
228 223 Q8 Which airline would be your first choice to use for business travel and leisure travel?Summary Of Alaska Airlines
229 224 Q8_1 Which airline would be your first choice to use for business travel and leisure travel?Business travel
230 225 Q8_2 Which airline would be your first choice to use for business travel and leisure travel?Leisure travel
231 226 Q11 For each of the following companies, do you think that the company has had a good response or a poor response to the coronavirus pandemic?Summary Of Good
232 227 Q11 For each of the following companies, do you think that the company has had a good response or a poor response to the coronavirus pandemic?Summary Of Poor
233 228 Q11_1 For each of the following companies, do you think that the company has had a good response or a poor response to the coronavirus pandemic?Delta Air Lines
234 229 Q11_2 For each of the following companies, do you think that the company has had a good response or a poor response to the coronavirus pandemic?American Airlines
235 230 Q11_3 For each of the following companies, do you think that the company has had a good response or a poor response to the coronavirus pandemic?United Airlines
236 231 Q11_4 For each of the following companies, do you think that the company has had a good response or a poor response to the coronavirus pandemic?Southwest Airlines
237 232 Q11_5 For each of the following companies, do you think that the company has had a good response or a poor response to the coronavirus pandemic?JetBlue Airways
238 233 Q11_6 For each of the following companies, do you think that the company has had a good response or a poor response to the coronavirus pandemic?Alaska Airlines
239 234 Q11_7 For each of the following companies, do you think that the company has had a good response or a poor response to the coronavirus pandemic?Tesla Motors
240 235 Q11_8 For each of the following companies, do you think that the company has had a good response or a poor response to the coronavirus pandemic?AirBnb
241 236 Q11_9 For each of the following companies, do you think that the company has had a good response or a poor response to the coronavirus pandemic?Patagonia
242 237 Q11_10 For each of the following companies, do you think that the company has had a good response or a poor response to the coronavirus pandemic?Lyft
243 238 Q11_11 For each of the following companies, do you think that the company has had a good response or a poor response to the coronavirus pandemic?Marriott
244 239 Q11_12 For each of the following companies, do you think that the company has had a good response or a poor response to the coronavirus pandemic?Hilton
245 240 IND01 For each of the following industries, do you think that the industry has had a good response or a poor response to thecoronavirus pandemic?Summary Of Good
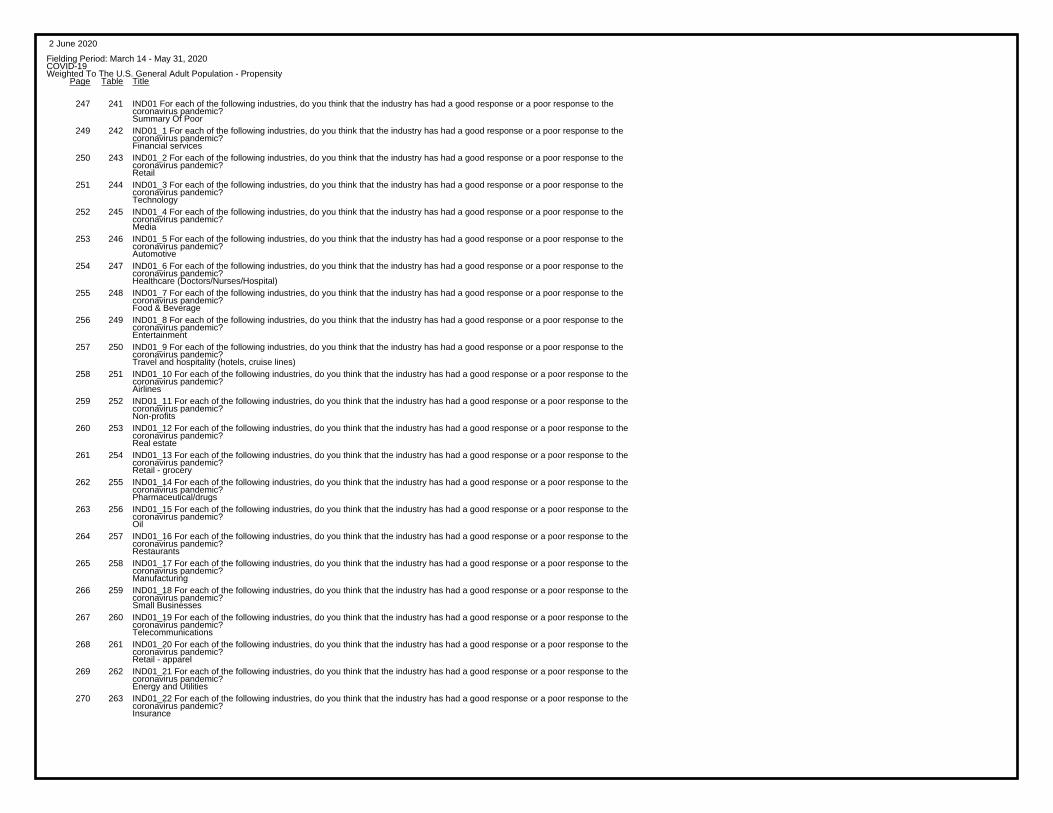
2 June 2020
Fielding Period: March 14 - May 31, 2020COVID-19Weighted To The U.S. General Adult Population - Propensity
TitleTablePage
247 241 IND01 For each of the following industries, do you think that the industry has had a good response or a poor response to thecoronavirus pandemic?Summary Of Poor
249 242 IND01_1 For each of the following industries, do you think that the industry has had a good response or a poor response to thecoronavirus pandemic?Financial services
250 243 IND01_2 For each of the following industries, do you think that the industry has had a good response or a poor response to thecoronavirus pandemic?Retail
251 244 IND01_3 For each of the following industries, do you think that the industry has had a good response or a poor response to thecoronavirus pandemic?Technology
252 245 IND01_4 For each of the following industries, do you think that the industry has had a good response or a poor response to thecoronavirus pandemic?Media
253 246 IND01_5 For each of the following industries, do you think that the industry has had a good response or a poor response to thecoronavirus pandemic?Automotive
254 247 IND01_6 For each of the following industries, do you think that the industry has had a good response or a poor response to thecoronavirus pandemic?Healthcare (Doctors/Nurses/Hospital)
255 248 IND01_7 For each of the following industries, do you think that the industry has had a good response or a poor response to thecoronavirus pandemic?Food & Beverage
256 249 IND01_8 For each of the following industries, do you think that the industry has had a good response or a poor response to thecoronavirus pandemic?Entertainment
257 250 IND01_9 For each of the following industries, do you think that the industry has had a good response or a poor response to thecoronavirus pandemic?Travel and hospitality (hotels, cruise lines)
258 251 IND01_10 For each of the following industries, do you think that the industry has had a good response or a poor response to thecoronavirus pandemic?Airlines
259 252 IND01_11 For each of the following industries, do you think that the industry has had a good response or a poor response to thecoronavirus pandemic?Non-profits
260 253 IND01_12 For each of the following industries, do you think that the industry has had a good response or a poor response to thecoronavirus pandemic?Real estate
261 254 IND01_13 For each of the following industries, do you think that the industry has had a good response or a poor response to thecoronavirus pandemic?Retail - grocery
262 255 IND01_14 For each of the following industries, do you think that the industry has had a good response or a poor response to thecoronavirus pandemic?Pharmaceutical/drugs
263 256 IND01_15 For each of the following industries, do you think that the industry has had a good response or a poor response to thecoronavirus pandemic?Oil
264 257 IND01_16 For each of the following industries, do you think that the industry has had a good response or a poor response to thecoronavirus pandemic?Restaurants
265 258 IND01_17 For each of the following industries, do you think that the industry has had a good response or a poor response to thecoronavirus pandemic?Manufacturing
266 259 IND01_18 For each of the following industries, do you think that the industry has had a good response or a poor response to thecoronavirus pandemic?Small Businesses
267 260 IND01_19 For each of the following industries, do you think that the industry has had a good response or a poor response to thecoronavirus pandemic?Telecommunications
268 261 IND01_20 For each of the following industries, do you think that the industry has had a good response or a poor response to thecoronavirus pandemic?Retail - apparel
269 262 IND01_21 For each of the following industries, do you think that the industry has had a good response or a poor response to thecoronavirus pandemic?Energy and Utilities
270 263 IND01_22 For each of the following industries, do you think that the industry has had a good response or a poor response to thecoronavirus pandemic?Insurance
2 June 2020
Fielding Period: March 14 - May 31, 2020COVID-19Weighted To The U.S. General Adult Population - Propensity
TitleTablePage
271 264 Q43 Which of the following industries do you think should provide solutions during the Covid-19 outbreak? Please select all that apply.273 265 Q36 How likely do you think it is that coronavirus (COVID-19) will cause a global recession?274 266 Q36A Would you say we are in a global recession due to the coronavirus outbreak?275 267 LI01 Which do you think will have a bigger effect on the life of you and your family?276 268 LI02 Once the pandemic is over and things return to normal, do you think each of the following areas of your life will be
very different, somewhat different or mostly the same?Summary Of Mostly The Same
277 269 LI02 Once the pandemic is over and things return to normal, do you think each of the following areas of your life will bevery different, somewhat different or mostly the same?Summary Of Somewhat Different
278 270 LI02 Once the pandemic is over and things return to normal, do you think each of the following areas of your life will bevery different, somewhat different or mostly the same?Summary Of Very Different
279 271 LI02_1 Once the pandemic is over and things return to normal, do you think each of the following areas of your life will bevery different, somewhat different or mostly the same?Shopping habits
280 272 LI02_2 Once the pandemic is over and things return to normal, do you think each of the following areas of your life will bevery different, somewhat different or mostly the same?Eating habits
281 273 LI02_3 Once the pandemic is over and things return to normal, do you think each of the following areas of your life will bevery different, somewhat different or mostly the same?Social activity
282 274 LI02_4 Once the pandemic is over and things return to normal, do you think each of the following areas of your life will bevery different, somewhat different or mostly the same?Travel/vacation
283 275 LI02_5 Once the pandemic is over and things return to normal, do you think each of the following areas of your life will bevery different, somewhat different or mostly the same?Work life
284 276 LI02_6 Once the pandemic is over and things return to normal, do you think each of the following areas of your life will bevery different, somewhat different or mostly the same?Family life
285 277 LI02_7 Once the pandemic is over and things return to normal, do you think each of the following areas of your life will bevery different, somewhat different or mostly the same?Personal hygiene
286 278 Q33A How many months do you it will take for us to find a vaccine/ cure for the coronavirus?287 279 AMR01 Do you believe America has beaten the coronavirus?288 280 AMR02 How many months do you think it’ll take before everyone has access to COVID-19 testing?290 281 AMR03 How many months do you think it’ll take before everyone gets tested for COVID-19?292 282 AMR04 How many months do you think it’ll be before contact tracing of COVID-19 is implemented?