Embed Size (px)
Citation preview

Home Health Care in Arizona Facts & Figures
2015 Update
Prevalence of Chronic Conditions Among Home Health Users, Arizona
4
0-2 CCs 3 CCs 4 CCs 5 or more CCs
14.5%
11.7%
13.7% 60.1%
Home Health Users
85.0%
4.6% 3.6%
6.8%
All Medicare Beneficiaries
Source: Avalere Health, LLC analysis of Medicare Standard Analytic Files, 2012 Note: Having a chronic condition is defined as having a Medicare claim with a chronic condition listed in 2012. Medicare beneficiaries without any claims in 2012 are categorized as having no chronic conditions in 2012.
Percentage of Home Health Users by Number of Chronic Conditions (CCs) Compared to all Medicare Beneficiaries, 2012
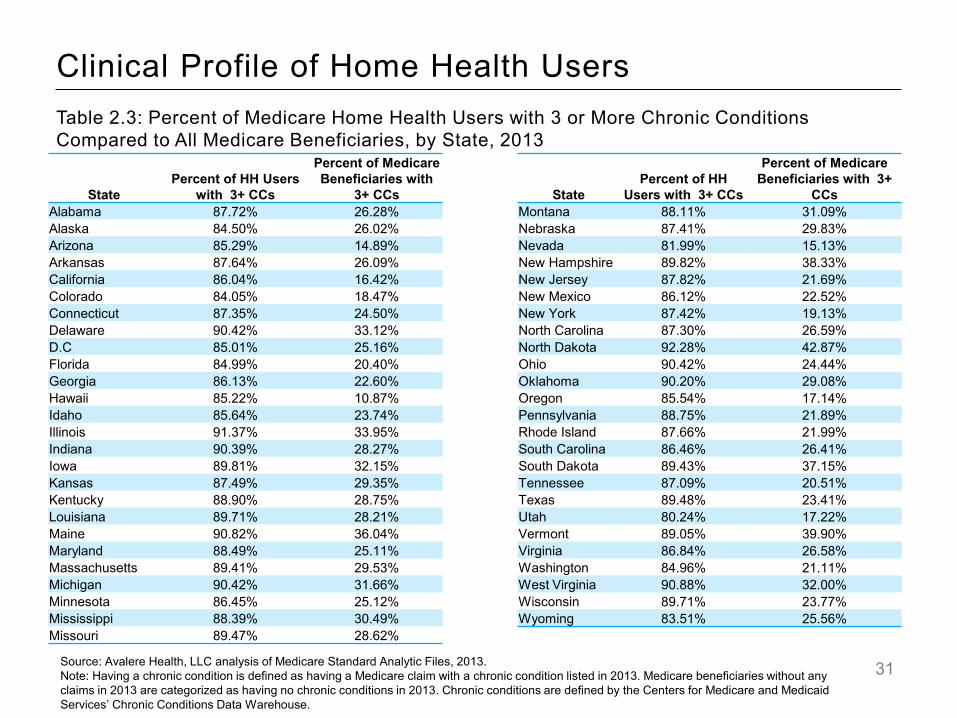
Clinical Profile of Home Health UsersTable 2.3: Percent of Medicare Home Health Users with 3 or More Chronic Conditions Compared to All Medicare Beneficiaries, by State, 2013
StatePercent of HH Users
with 3+ CCs
Percent of Medicare Beneficiaries with
3+ CCsAlabama 87.72% 26.28% Alaska 84.50% 26.02% Arizona 85.29% 14.89% Arkansas 87.64% 26.09% California 86.04% 16.42% Colorado 84.05% 18.47% Connecticut 87.35% 24.50% Delaware 90.42% 33.12% D.C 85.01% 25.16% Florida 84.99% 20.40% Georgia 86.13% 22.60% Hawaii 85.22% 10.87% Idaho 85.64% 23.74% Illinois 91.37% 33.95% Indiana 90.39% 28.27% Iowa 89.81% 32.15% Kansas 87.49% 29.35% Kentucky 88.90% 28.75% Louisiana 89.71% 28.21% Maine 90.82% 36.04% Maryland 88.49% 25.11% Massachusetts 89.41% 29.53% Michigan 90.42% 31.66% Minnesota 86.45% 25.12% Mississippi 88.39% 30.49% Missouri 89.47% 28.62%
StatePercent of HH
Users with 3+ CCs
Percent of Medicare Beneficiaries with 3+
CCsMontana 88.11% 31.09% Nebraska 87.41% 29.83% Nevada 81.99% 15.13% New Hampshire 89.82% 38.33% New Jersey 87.82% 21.69% New Mexico 86.12% 22.52% New York 87.42% 19.13% North Carolina 87.30% 26.59% North Dakota 92.28% 42.87% Ohio 90.42% 24.44% Oklahoma 90.20% 29.08% Oregon 85.54% 17.14% Pennsylvania 88.75% 21.89% Rhode Island 87.66% 21.99% South Carolina 86.46% 26.41% South Dakota 89.43% 37.15% Tennessee 87.09% 20.51% Texas 89.48% 23.41% Utah 80.24% 17.22% Vermont 89.05% 39.90% Virginia 86.84% 26.58% Washington 84.96% 21.11% West Virginia 90.88% 32.00% Wisconsin 89.71% 23.77% Wyoming 83.51% 25.56%
Source: Avalere Health, LLC analysis of Medicare Standard Analytic Files, 2013.Note: Having a chronic condition is defined as having a Medicare claim with a chronic condition listed in 2013. Medicare beneficiaries without any claims in 2013 are categorized as having no chronic conditions in 2013. Chronic conditions are defined by the Centers for Medicare and Medicaid Services’ Chronic Conditions Data Warehouse.
31
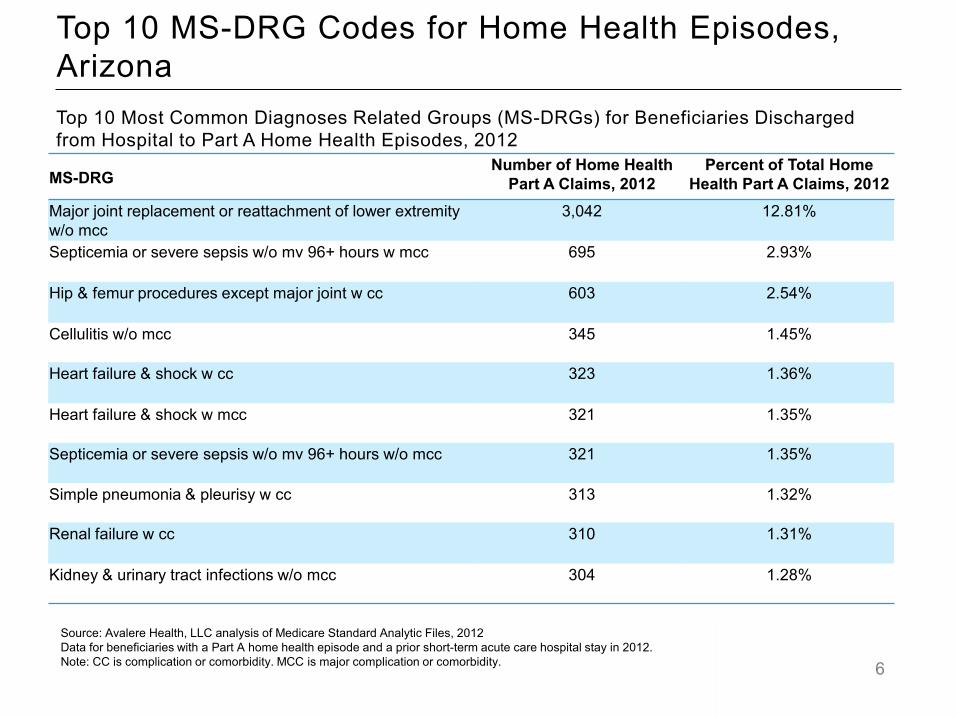
Top 10 MS-DRG Codes for Home Health Episodes, Arizona
6
MS-DRG Number of Home Health
Part A Claims, 2012 Percent of Total Home
Health Part A Claims, 2012
Major joint replacement or reattachment of lower extremity w/o mcc
3,042 12.81%
Septicemia or severe sepsis w/o mv 96+ hours w mcc 695 2.93%
Hip & femur procedures except major joint w cc 603 2.54%
Cellulitis w/o mcc 345 1.45%
Heart failure & shock w cc 323 1.36%
Heart failure & shock w mcc 321 1.35%
Septicemia or severe sepsis w/o mv 96+ hours w/o mcc 321 1.35%
Simple pneumonia & pleurisy w cc 313 1.32%
Renal failure w cc 310 1.31%
Kidney & urinary tract infections w/o mcc 304 1.28%
Source: Avalere Health, LLC analysis of Medicare Standard Analytic Files, 2012 Data for beneficiaries with a Part A home health episode and a prior short-term acute care hospital stay in 2012. Note: CC is complication or comorbidity. MCC is major complication or comorbidity.
Top 10 Most Common Diagnoses Related Groups (MS-DRGs) for Beneficiaries Discharged from Hospital to Part A Home Health Episodes, 2012
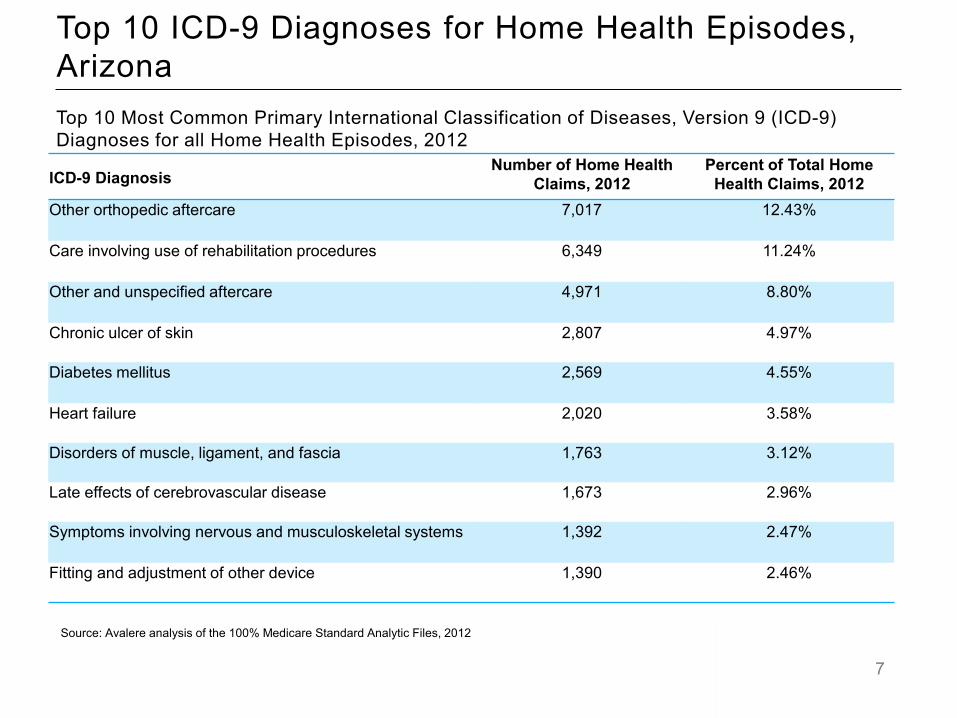
Top 10 ICD-9 Diagnoses for Home Health Episodes, Arizona
7
Source: Avalere analysis of the 100% Medicare Standard Analytic Files, 2012
ICD-9 Diagnosis Number of Home Health
Claims, 2012 Percent of Total Home
Health Claims, 2012 Other orthopedic aftercare 7,017 12.43%
Care involving use of rehabilitation procedures 6,349 11.24%
Other and unspecified aftercare 4,971 8.80%
Chronic ulcer of skin 2,807 4.97%
Diabetes mellitus 2,569 4.55%
Heart failure 2,020 3.58%
Disorders of muscle, ligament, and fascia 1,763 3.12%
Late effects of cerebrovascular disease 1,673 2.96%
Symptoms involving nervous and musculoskeletal systems 1,392 2.47%
Fitting and adjustment of other device 1,390 2.46%
Top 10 Most Common Primary International Classification of Diseases, Version 9 (ICD-9) Diagnoses for all Home Health Episodes, 2012
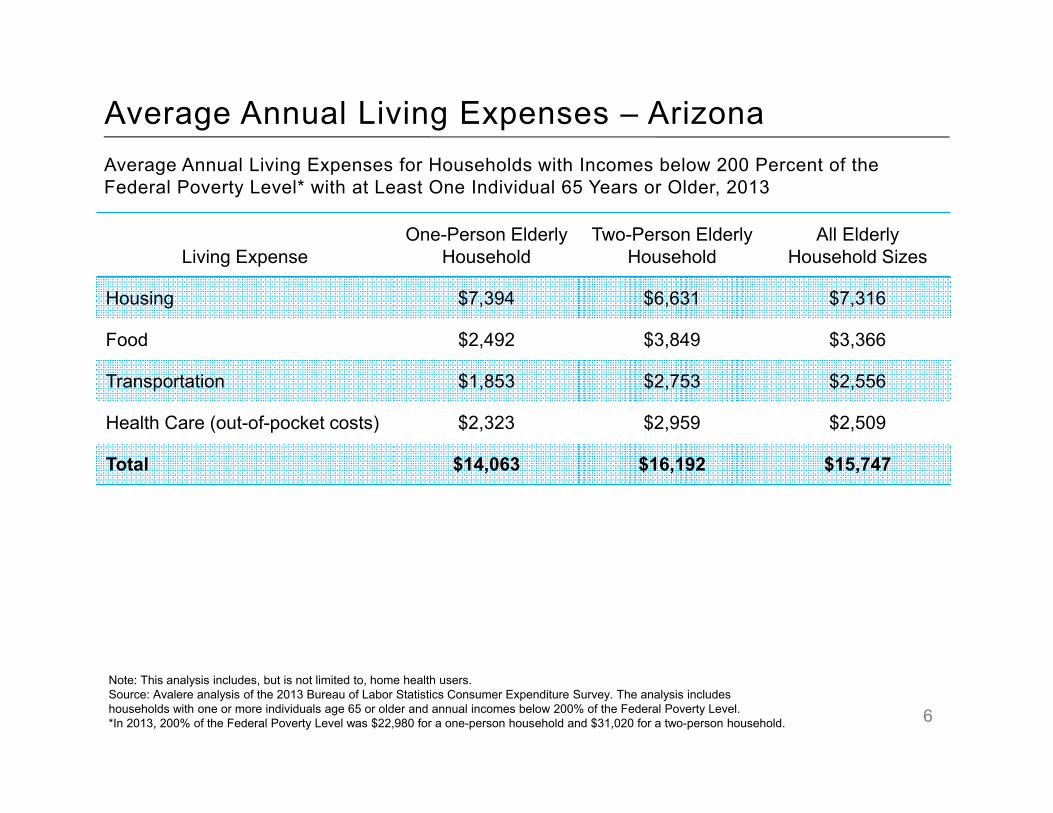
Average Annual Living Expenses – Arizona
6
Average Annual Living Expenses for Households with Incomes below 200 Percent of the Federal Poverty Level* with at Least One Individual 65 Years or Older, 2013
Note: This analysis includes, but is not limited to, home health users.Source: Avalere analysis of the 2013 Bureau of Labor Statistics Consumer Expenditure Survey. The analysis includes households with one or more individuals age 65 or older and annual incomes below 200% of the Federal Poverty Level.*In 2013, 200% of the Federal Poverty Level was $22,980 for a one-person household and $31,020 for a two-person household.
Living ExpenseOne-Person Elderly
HouseholdTwo-Person Elderly
HouseholdAll Elderly
Household Sizes
Housing $7,394 $6,631 $7,316
Food $2,492 $3,849 $3,366
Transportation $1,853 $2,753 $2,556
Health Care (out-of-pocket costs) $2,323 $2,959 $2,509
Total $14,063 $16,192 $15,747
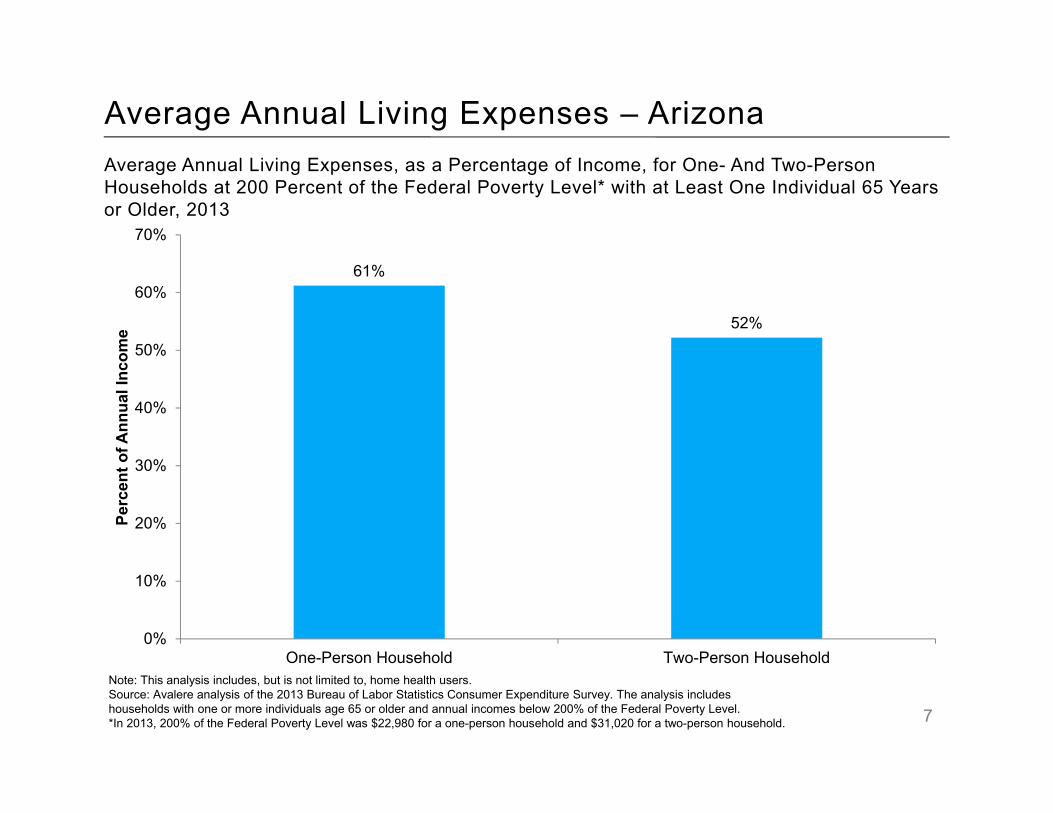
Average Annual Living Expenses – Arizona
7
Average Annual Living Expenses, as a Percentage of Income, for One- And Two-Person Households at 200 Percent of the Federal Poverty Level* with at Least One Individual 65 Years or Older, 2013
Note: This analysis includes, but is not limited to, home health users.Source: Avalere analysis of the 2013 Bureau of Labor Statistics Consumer Expenditure Survey. The analysis includes households with one or more individuals age 65 or older and annual incomes below 200% of the Federal Poverty Level.*In 2013, 200% of the Federal Poverty Level was $22,980 for a one-person household and $31,020 for a two-person household.
61%
52%
0%
10%
20%
30%
40%
50%
60%
70%
One-Person Household Two-Person Household
Per
cent
of A
nnua
l Inc
ome
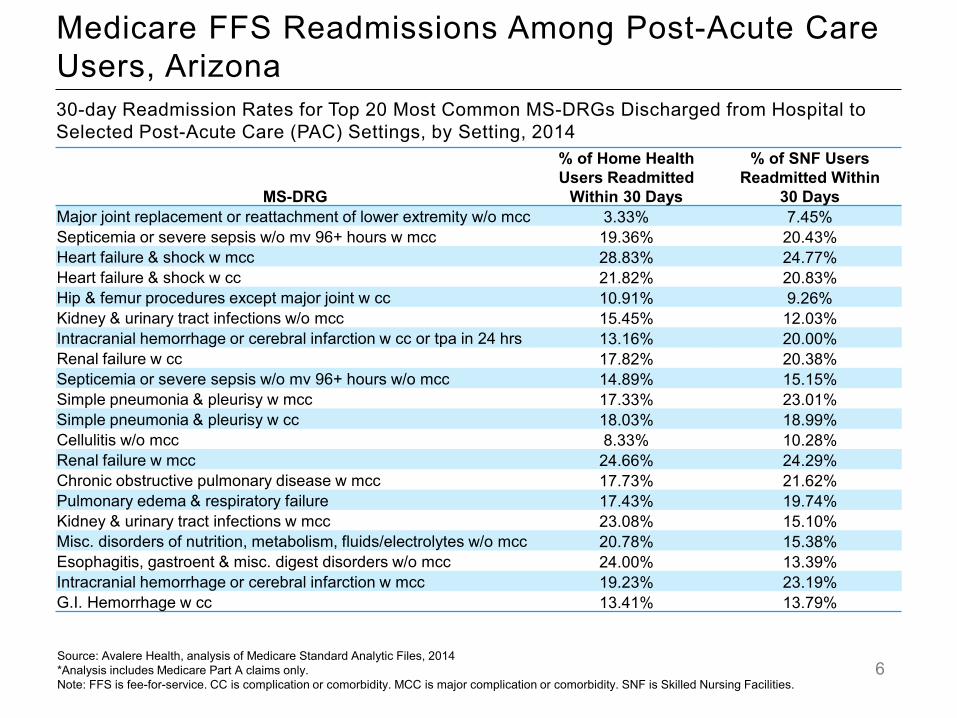
Medicare FFS Readmissions Among Post-Acute Care Users, Arizona30-day Readmission Rates for Top 20 Most Common MS-DRGs Discharged from Hospital to Selected Post-Acute Care (PAC) Settings, by Setting, 2014
MS-DRG
% of Home Health Users Readmitted
Within 30 Days
% of SNF Users Readmitted Within
30 DaysMajor joint replacement or reattachment of lower extremity w/o mcc 3.33% 7.45% Septicemia or severe sepsis w/o mv 96+ hours w mcc 19.36% 20.43% Heart failure & shock w mcc 28.83% 24.77% Heart failure & shock w cc 21.82% 20.83% Hip & femur procedures except major joint w cc 10.91% 9.26% Kidney & urinary tract infections w/o mcc 15.45% 12.03% Intracranial hemorrhage or cerebral infarction w cc or tpa in 24 hrs 13.16% 20.00% Renal failure w cc 17.82% 20.38% Septicemia or severe sepsis w/o mv 96+ hours w/o mcc 14.89% 15.15% Simple pneumonia & pleurisy w mcc 17.33% 23.01% Simple pneumonia & pleurisy w cc 18.03% 18.99% Cellulitis w/o mcc 8.33% 10.28% Renal failure w mcc 24.66% 24.29% Chronic obstructive pulmonary disease w mcc 17.73% 21.62% Pulmonary edema & respiratory failure 17.43% 19.74% Kidney & urinary tract infections w mcc 23.08% 15.10% Misc. disorders of nutrition, metabolism, fluids/electrolytes w/o mcc 20.78% 15.38% Esophagitis, gastroent & misc. digest disorders w/o mcc 24.00% 13.39% Intracranial hemorrhage or cerebral infarction w mcc 19.23% 23.19% G.I. Hemorrhage w cc 13.41% 13.79%
6Source: Avalere Health, analysis of Medicare Standard Analytic Files, 2014*Analysis includes Medicare Part A claims only. Note: FFS is fee-for-service. CC is complication or comorbidity. MCC is major complication or comorbidity. SNF is Skilled Nursing Facilities.
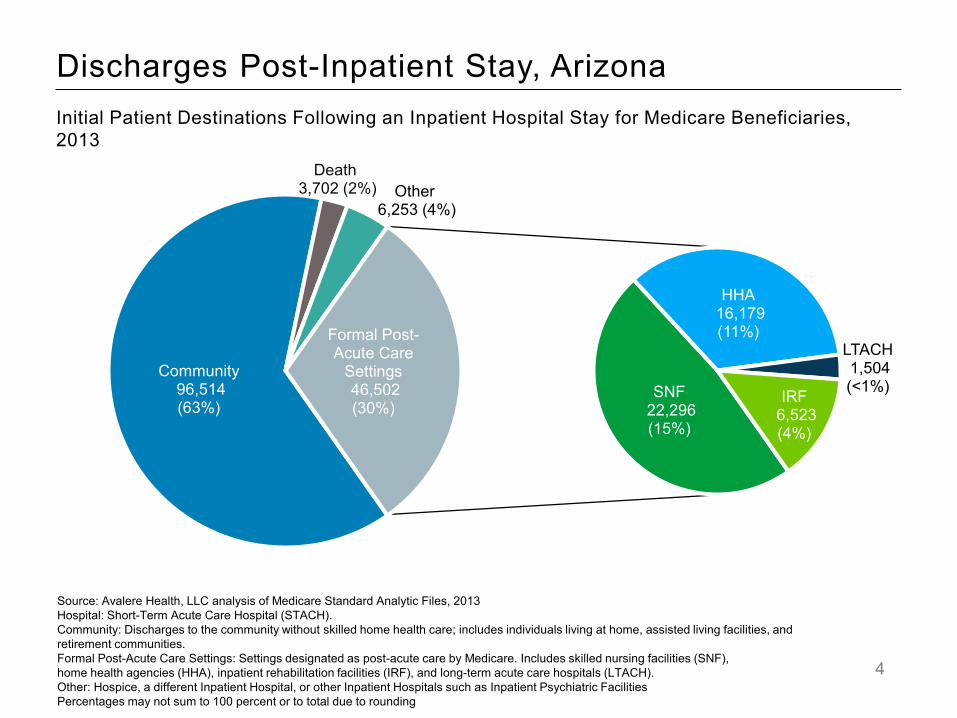
Discharges Post-Inpatient Stay, Arizona
4
Initial Patient Destinations Following an Inpatient Hospital Stay for Medicare Beneficiaries, 2013
Source: Avalere Health, LLC analysis of Medicare Standard Analytic Files, 2013Hospital: Short-Term Acute Care Hospital (STACH).Community: Discharges to the community without skilled home health care; includes individuals living at home, assisted living facilities, and retirement communities. Formal Post-Acute Care Settings: Settings designated as post-acute care by Medicare. Includes skilled nursing facilities (SNF), home health agencies (HHA), inpatient rehabilitation facilities (IRF), and long-term acute care hospitals (LTACH). Other: Hospice, a different Inpatient Hospital, or other Inpatient Hospitals such as Inpatient Psychiatric FacilitiesPercentages may not sum to 100 percent or to total due to rounding
Community96,514 (63%)
Death3,702 (2%) Other
6,253 (4%)
SNF22,296 (15%)
HHA16,179 (11%)
LTACH1,504 (<1%)IRF
6,523 (4%)
Formal Post-Acute Care
Settings46,502 (30%)
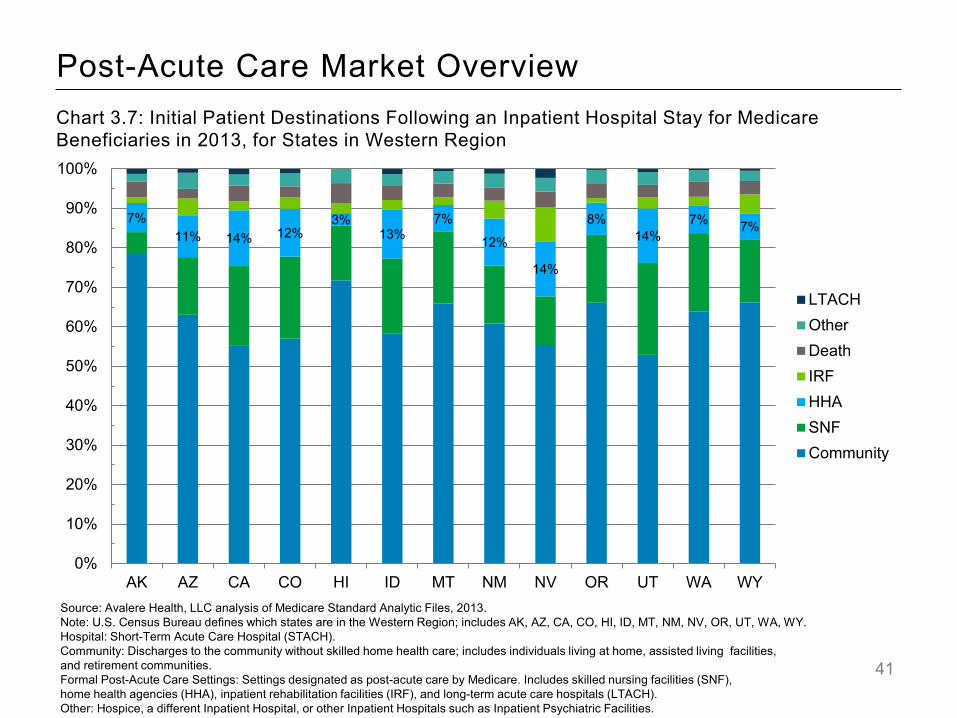
Post-Acute Care Market Overview
7%11% 14% 12%
3%13%
7%
12%
14%
8%14%
7% 7%
0%
10%
20%
30%
40%
50%
60%
70%
80%
90%
100%
AK AZ CA CO HI ID MT NM NV OR UT WA WY
LTACHOtherDeathIRFHHASNFCommunity
Chart 3.7: Initial Patient Destinations Following an Inpatient Hospital Stay for Medicare Beneficiaries in 2013, for States in Western Region
Source: Avalere Health, LLC analysis of Medicare Standard Analytic Files, 2013.Note: U.S. Census Bureau defines which states are in the Western Region; includes AK, AZ, CA, CO, HI, ID, MT, NM, NV, OR, UT, WA, WY.Hospital: Short-Term Acute Care Hospital (STACH).Community: Discharges to the community without skilled home health care; includes individuals living at home, assisted living facilities, and retirement communities. Formal Post-Acute Care Settings: Settings designated as post-acute care by Medicare. Includes skilled nursing facilities (SNF), home health agencies (HHA), inpatient rehabilitation facilities (IRF), and long-term acute care hospitals (LTACH). Other: Hospice, a different Inpatient Hospital, or other Inpatient Hospitals such as Inpatient Psychiatric Facilities.
41
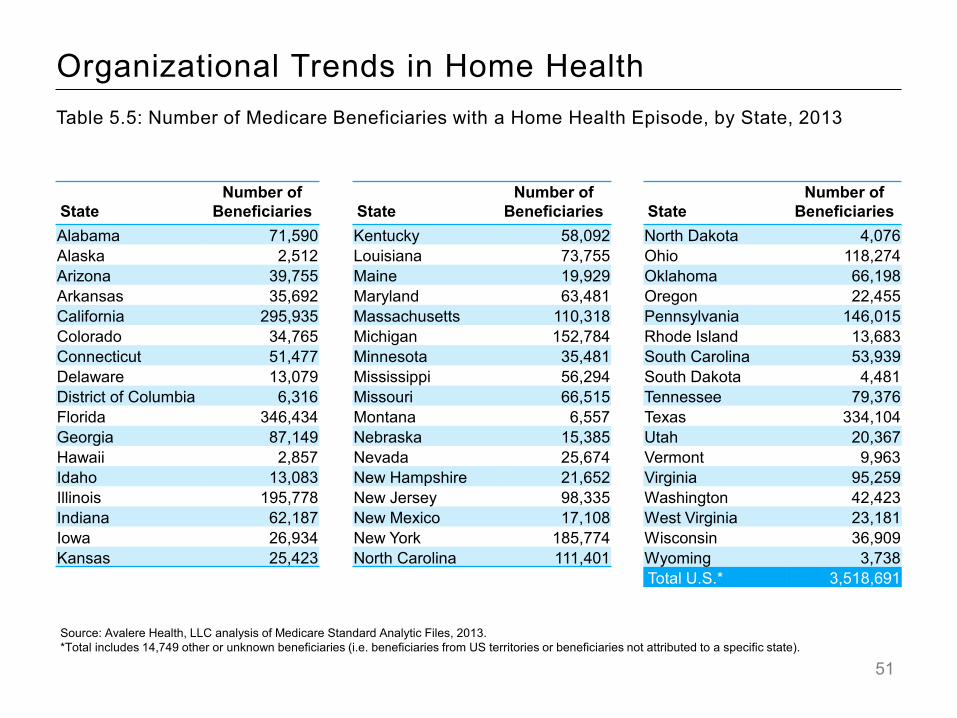
Organizational Trends in Home HealthTable 5.5: Number of Medicare Beneficiaries with a Home Health Episode, by State, 2013
Source: Avalere Health, LLC analysis of Medicare Standard Analytic Files, 2013.*Total includes 14,749 other or unknown beneficiaries (i.e. beneficiaries from US territories or beneficiaries not attributed to a specific state).
StateNumber of
Beneficiaries Kentucky 58,092Louisiana 73,755 Maine 19,929 Maryland 63,481 Massachusetts 110,318 Michigan 152,784 Minnesota 35,481 Mississippi 56,294 Missouri 66,515 Montana 6,557 Nebraska 15,385 Nevada 25,674 New Hampshire 21,652 New Jersey 98,335 New Mexico 17,108 New York 185,774 North Carolina 111,401
StateNumber of
BeneficiariesNorth Dakota 4,076 Ohio 118,274 Oklahoma 66,198 Oregon 22,455 Pennsylvania 146,015 Rhode Island 13,683 South Carolina 53,939 South Dakota 4,481 Tennessee 79,376 Texas 334,104 Utah 20,367 Vermont 9,963 Virginia 95,259 Washington 42,423 West Virginia 23,181 Wisconsin 36,909 Wyoming 3,738 Total U.S.* 3,518,691
StateNumber of
Beneficiaries Alabama 71,590Alaska 2,512 Arizona 39,755 Arkansas 35,692 California 295,935 Colorado 34,765 Connecticut 51,477 Delaware 13,079 District of Columbia 6,316 Florida 346,434 Georgia 87,149 Hawaii 2,857 Idaho 13,083 Illinois 195,778 Indiana 62,187 Iowa 26,934 Kansas 25,423
51
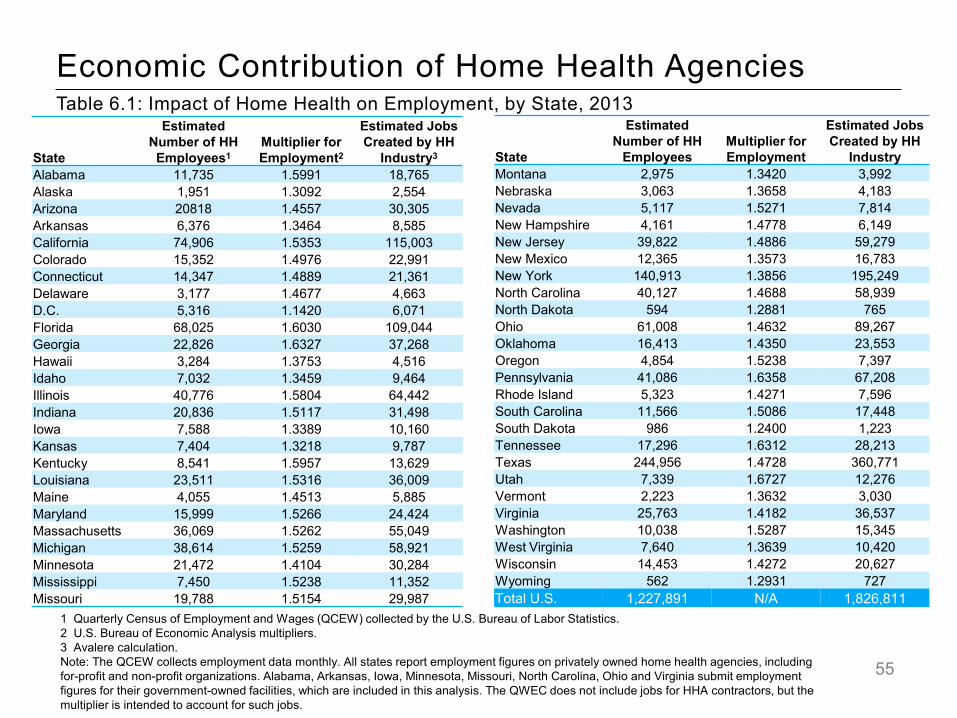
Table 6.1: Impact of Home Health on Employment, by State, 2013
Economic Contribution of Home Health Agencies
1 Quarterly Census of Employment and Wages (QCEW) collected by the U.S. Bureau of Labor Statistics.2 U.S. Bureau of Economic Analysis multipliers.3 Avalere calculation.Note: The QCEW collects employment data monthly. All states report employment figures on privately owned home health agencies, including for-profit and non-profit organizations. Alabama, Arkansas, Iowa, Minnesota, Missouri, North Carolina, Ohio and Virginia submit employment figures for their government-owned facilities, which are included in this analysis. The QWEC does not include jobs for HHA contractors, but the multiplier is intended to account for such jobs.
State
Estimated Number of HH Employees1
Multiplier for Employment2
Estimated Jobs Created by HH
Industry3
Alabama 11,735 1.5991 18,765 Alaska 1,951 1.3092 2,554 Arizona 20818 1.4557 30,305 Arkansas 6,376 1.3464 8,585 California 74,906 1.5353 115,003 Colorado 15,352 1.4976 22,991 Connecticut 14,347 1.4889 21,361 Delaware 3,177 1.4677 4,663 D.C. 5,316 1.1420 6,071 Florida 68,025 1.6030 109,044 Georgia 22,826 1.6327 37,268 Hawaii 3,284 1.3753 4,516 Idaho 7,032 1.3459 9,464 Illinois 40,776 1.5804 64,442 Indiana 20,836 1.5117 31,498 Iowa 7,588 1.3389 10,160 Kansas 7,404 1.3218 9,787 Kentucky 8,541 1.5957 13,629 Louisiana 23,511 1.5316 36,009 Maine 4,055 1.4513 5,885Maryland 15,999 1.5266 24,424 Massachusetts 36,069 1.5262 55,049 Michigan 38,614 1.5259 58,921 Minnesota 21,472 1.4104 30,284 Mississippi 7,450 1.5238 11,352 Missouri 19,788 1.5154 29,987
State
Estimated Number of HH
EmployeesMultiplier for Employment
Estimated Jobs Created by HH
IndustryMontana 2,975 1.3420 3,992 Nebraska 3,063 1.3658 4,183 Nevada 5,117 1.5271 7,814 New Hampshire 4,161 1.4778 6,149 New Jersey 39,822 1.4886 59,279 New Mexico 12,365 1.3573 16,783 New York 140,913 1.3856 195,249 North Carolina 40,127 1.4688 58,939North Dakota 594 1.2881 765 Ohio 61,008 1.4632 89,267 Oklahoma 16,413 1.4350 23,553 Oregon 4,854 1.5238 7,397 Pennsylvania 41,086 1.6358 67,208 Rhode Island 5,323 1.4271 7,596 South Carolina 11,566 1.5086 17,448 South Dakota 986 1.2400 1,223 Tennessee 17,296 1.6312 28,213 Texas 244,956 1.4728 360,771 Utah 7,339 1.6727 12,276 Vermont 2,223 1.3632 3,030 Virginia 25,763 1.4182 36,537 Washington 10,038 1.5287 15,345 West Virginia 7,640 1.3639 10,420 Wisconsin 14,453 1.4272 20,627 Wyoming 562 1.2931 727 Total U.S. 1,227,891 N/A 1,826,811
55
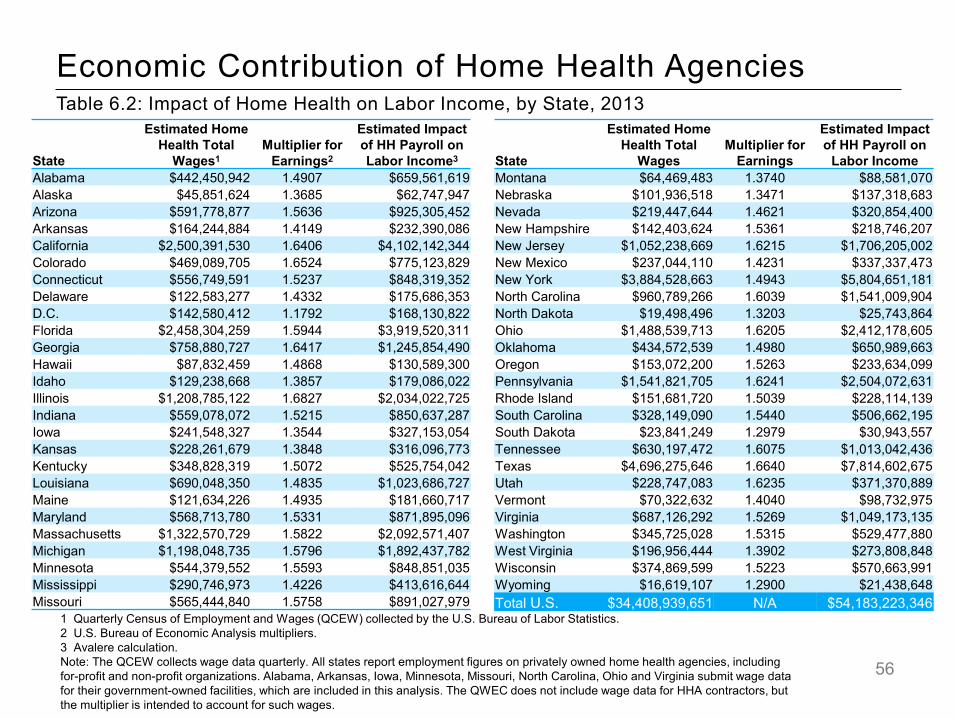
Economic Contribution of Home Health AgenciesTable 6.2: Impact of Home Health on Labor Income, by State, 2013
State
Estimated HomeHealth Total
Wages1Multiplier for
Earnings2
Estimated Impact of HH Payroll on Labor Income3
Alabama $442,450,942 1.4907 $659,561,619 Alaska $45,851,624 1.3685 $62,747,947 Arizona $591,778,877 1.5636 $925,305,452 Arkansas $164,244,884 1.4149 $232,390,086 California $2,500,391,530 1.6406 $4,102,142,344 Colorado $469,089,705 1.6524 $775,123,829 Connecticut $556,749,591 1.5237 $848,319,352 Delaware $122,583,277 1.4332 $175,686,353 D.C. $142,580,412 1.1792 $168,130,822 Florida $2,458,304,259 1.5944 $3,919,520,311 Georgia $758,880,727 1.6417 $1,245,854,490 Hawaii $87,832,459 1.4868 $130,589,300 Idaho $129,238,668 1.3857 $179,086,022 Illinois $1,208,785,122 1.6827 $2,034,022,725 Indiana $559,078,072 1.5215 $850,637,287 Iowa $241,548,327 1.3544 $327,153,054 Kansas $228,261,679 1.3848 $316,096,773 Kentucky $348,828,319 1.5072 $525,754,042 Louisiana $690,048,350 1.4835 $1,023,686,727 Maine $121,634,226 1.4935 $181,660,717 Maryland $568,713,780 1.5331 $871,895,096 Massachusetts $1,322,570,729 1.5822 $2,092,571,407 Michigan $1,198,048,735 1.5796 $1,892,437,782 Minnesota $544,379,552 1.5593 $848,851,035 Mississippi $290,746,973 1.4226 $413,616,644 Missouri $565,444,840 1.5758 $891,027,979
State
Estimated HomeHealth Total
WagesMultiplier for
Earnings
Estimated Impact of HH Payroll on
Labor IncomeMontana $64,469,483 1.3740 $88,581,070 Nebraska $101,936,518 1.3471 $137,318,683 Nevada $219,447,644 1.4621 $320,854,400 New Hampshire $142,403,624 1.5361 $218,746,207 New Jersey $1,052,238,669 1.6215 $1,706,205,002 New Mexico $237,044,110 1.4231 $337,337,473 New York $3,884,528,663 1.4943 $5,804,651,181 North Carolina $960,789,266 1.6039 $1,541,009,904 North Dakota $19,498,496 1.3203 $25,743,864 Ohio $1,488,539,713 1.6205 $2,412,178,605 Oklahoma $434,572,539 1.4980 $650,989,663 Oregon $153,072,200 1.5263 $233,634,099 Pennsylvania $1,541,821,705 1.6241 $2,504,072,631 Rhode Island $151,681,720 1.5039 $228,114,139 South Carolina $328,149,090 1.5440 $506,662,195 South Dakota $23,841,249 1.2979 $30,943,557 Tennessee $630,197,472 1.6075 $1,013,042,436 Texas $4,696,275,646 1.6640 $7,814,602,675 Utah $228,747,083 1.6235 $371,370,889 Vermont $70,322,632 1.4040 $98,732,975 Virginia $687,126,292 1.5269 $1,049,173,135 Washington $345,725,028 1.5315 $529,477,880 West Virginia $196,956,444 1.3902 $273,808,848 Wisconsin $374,869,599 1.5223 $570,663,991 Wyoming $16,619,107 1.2900 $21,438,648 Total U.S. $34,408,939,651 N/A $54,183,223,346
1 Quarterly Census of Employment and Wages (QCEW) collected by the U.S. Bureau of Labor Statistics.2 U.S. Bureau of Economic Analysis multipliers.3 Avalere calculation.Note: The QCEW collects wage data quarterly. All states report employment figures on privately owned home health agencies, including for-profit and non-profit organizations. Alabama, Arkansas, Iowa, Minnesota, Missouri, North Carolina, Ohio and Virginia submit wage data for their government-owned facilities, which are included in this analysis. The QWEC does not include wage data for HHA contractors, but the multiplier is intended to account for such wages.
56
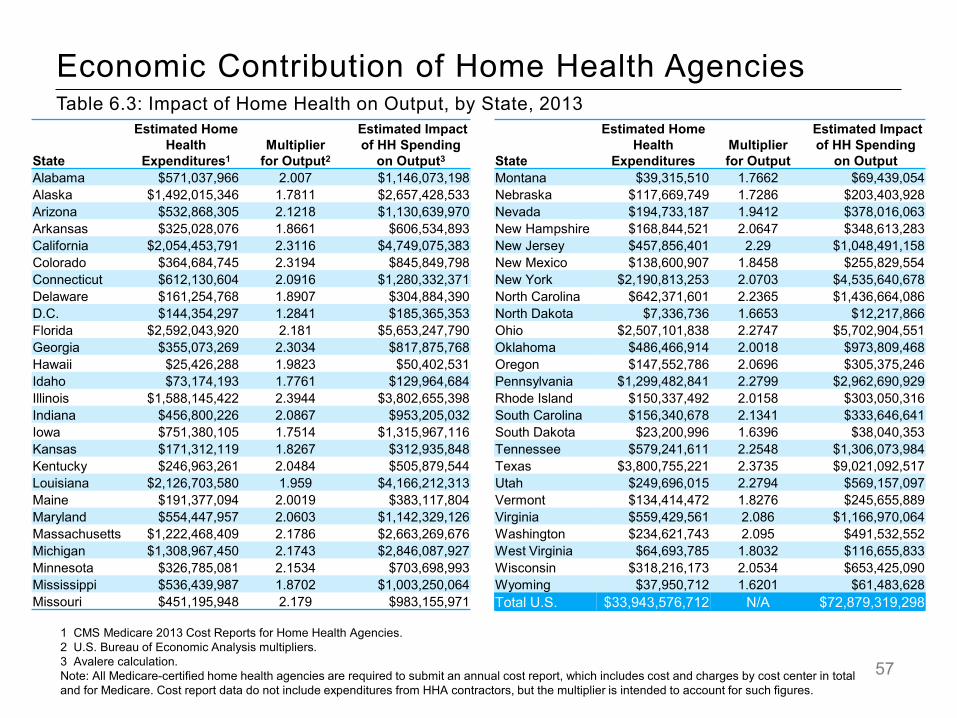
Economic Contribution of Home Health AgenciesTable 6.3: Impact of Home Health on Output, by State, 2013
State
Estimated HomeHealth
Expenditures1Multiplier
for Output2
Estimated Impact of HH Spending
on Output3
Alabama $571,037,966 2.007 $1,146,073,198 Alaska $1,492,015,346 1.7811 $2,657,428,533 Arizona $532,868,305 2.1218 $1,130,639,970 Arkansas $325,028,076 1.8661 $606,534,893 California $2,054,453,791 2.3116 $4,749,075,383 Colorado $364,684,745 2.3194 $845,849,798 Connecticut $612,130,604 2.0916 $1,280,332,371 Delaware $161,254,768 1.8907 $304,884,390 D.C. $144,354,297 1.2841 $185,365,353 Florida $2,592,043,920 2.181 $5,653,247,790 Georgia $355,073,269 2.3034 $817,875,768 Hawaii $25,426,288 1.9823 $50,402,531 Idaho $73,174,193 1.7761 $129,964,684 Illinois $1,588,145,422 2.3944 $3,802,655,398 Indiana $456,800,226 2.0867 $953,205,032 Iowa $751,380,105 1.7514 $1,315,967,116 Kansas $171,312,119 1.8267 $312,935,848 Kentucky $246,963,261 2.0484 $505,879,544 Louisiana $2,126,703,580 1.959 $4,166,212,313 Maine $191,377,094 2.0019 $383,117,804 Maryland $554,447,957 2.0603 $1,142,329,126 Massachusetts $1,222,468,409 2.1786 $2,663,269,676 Michigan $1,308,967,450 2.1743 $2,846,087,927 Minnesota $326,785,081 2.1534 $703,698,993 Mississippi $536,439,987 1.8702 $1,003,250,064 Missouri $451,195,948 2.179 $983,155,971
State
Estimated HomeHealth
ExpendituresMultiplier for Output
Estimated Impact of HH Spending
on Output Montana $39,315,510 1.7662 $69,439,054 Nebraska $117,669,749 1.7286 $203,403,928 Nevada $194,733,187 1.9412 $378,016,063 New Hampshire $168,844,521 2.0647 $348,613,283 New Jersey $457,856,401 2.29 $1,048,491,158 New Mexico $138,600,907 1.8458 $255,829,554 New York $2,190,813,253 2.0703 $4,535,640,678 North Carolina $642,371,601 2.2365 $1,436,664,086 North Dakota $7,336,736 1.6653 $12,217,866 Ohio $2,507,101,838 2.2747 $5,702,904,551 Oklahoma $486,466,914 2.0018 $973,809,468 Oregon $147,552,786 2.0696 $305,375,246 Pennsylvania $1,299,482,841 2.2799 $2,962,690,929 Rhode Island $150,337,492 2.0158 $303,050,316 South Carolina $156,340,678 2.1341 $333,646,641 South Dakota $23,200,996 1.6396 $38,040,353 Tennessee $579,241,611 2.2548 $1,306,073,984 Texas $3,800,755,221 2.3735 $9,021,092,517 Utah $249,696,015 2.2794 $569,157,097 Vermont $134,414,472 1.8276 $245,655,889 Virginia $559,429,561 2.086 $1,166,970,064 Washington $234,621,743 2.095 $491,532,552 West Virginia $64,693,785 1.8032 $116,655,833 Wisconsin $318,216,173 2.0534 $653,425,090 Wyoming $37,950,712 1.6201 $61,483,628 Total U.S. $33,943,576,712 N/A $72,879,319,298
1 CMS Medicare 2013 Cost Reports for Home Health Agencies.2 U.S. Bureau of Economic Analysis multipliers.3 Avalere calculation.Note: All Medicare-certified home health agencies are required to submit an annual cost report, which includes cost and charges by cost center in total and for Medicare. Cost report data do not include expenditures from HHA contractors, but the multiplier is intended to account for such figures.
57