Embed Size (px)
Citation preview

Bloomington Environmental Quality Indicators (BEQI) :
Water Quality Section Update
Home Page Text:
Water Quality Basics
• Introduction: What is Water Quality? o Environmental Water Quality versus Drinking Water Quality o What human factors affect Bloomington’s water quality?
• Defining Environmental Water Quality o Clean Water Act: Designated Uses and Water Quality Standards o Monitoring and Major Assessment Reports o Total Maximum Daily Loads (TMDLs) o Categorizing Water Pollution: Point Sources versus Nonpoint Sources o Common Water Pollutants
� Phosphorus and Nitrogen � Sediment � Other Water Quality Threats
o Water Quality Indices � Index of Biotic Integrity � Qualitative Habitat Evaluation Index � Carlson Trophic State Index
• Bloomington/Monroe County Surface Waters: What are the major water bodies in Monroe County?
o Streams o Lakes
• Defining Drinking Water Quality o The Safe Drinking Water Act o National Primary and Secondary Drinking Water Regulations
Water Consumption in Bloomington
• Background • Drinking Water
o Water Extraction from Lake Monroe o Drinking Water Treatment in Bloomington
� Chemical Treatment � Removal of Physical Impurities
o Drinking Water Quality in Bloomington � Interpreting Bloomington’s Consumer Confidence Report � Does Bloomington test for pharmaceuticals in drinking water?
• Wastewater (Sanitary Sewer System)
o Sanitary versus Combined Sewer Systems o Wastewater Pretreatment in Bloomington o Wastewater Treatment
Bloomington and Monroe County Environmental Water Quality
• Introduction • Indiana’s Integrated Water Monitoring and Assessment Report • Streams
o Support for Designated Uses o Contaminants of Concern o Featured Streams o Other Local Streams
• Lakes o Support for Designated Uses o Contaminants of Concern o Trophic Status o Specific Lakes
Water Quality Questions from the Public
• Drinking Water • Environmental Water Quality • Wastewater
Information in BEQI Water
• Webpages o Water Quality Basics o Water Consumption in Bloomington o Bloomington and Monroe County Environmental Water Quality o Water Quality Questions from the Public

Water Basics
Introduction: What is Water Quality?
Environmental Water Quality versus Drinking Water Quality
The U.S. Geological Survey defines water quality as “a measure of the suitability of water for a particular use based on selected physical, chemical, and biological characteristics.1” The “particular use” part of this definition is important because what makes water suitable for different uses can vary. For example, water from a pond with lots of algae may provide good habitat for fish2 but not be healthy for people to drink.
Broadly speaking, there is a difference between environmental water quality and drinking water quality. Environmental water includes water out in the environment, including groundwater, surface water present in streams and lakes, and stormwater runoff. Stormwater runoff is rainfall that is not absorbed when it hits the ground. Instead, the runoff flows along the land or through drainage infrastructure until it reaches a stream or lake.
Public drinking water is sourced from the environment but is treated in a water treatment facility before being passed onto a municipal distribution network. Therefore, the contaminant profiles for environmental water and drinking water from the same area should not be the same. A finding of E. coli contamination in a local lake, for example, does not mean that E. coli will also be present in a community’s drinking water. The purpose of a water treatment plant is to remove such environmental contaminants before they enter a city’s drinking water supply.
In addition to this conceptual distinction between environmental water and drinking water, there is also a legal division in how the two categories of water quality are regulated. In the United States there are two primary federal statutes regulating water quality. Environmental water quality is overseen by the Clean Water Act (CWA) while drinking water quality is regulated by the Safe Drinking Water Act (SDWA). Both acts have the goal of promoting good water quality in the US. However, each act requires different types of testing and sets different permissible levels for the presence of certain contaminants. The CWA regulates the discharge of pollutants into water via a permitting program, called the National Pollutant Discharge Elimination System (NPDES), while the SDWA establishes national health-based standards for the quality of drinking water.
1 U.S. Geological Survey. “A Primer on Water Quality.” [Online] Available at http://pubs.usgs.gov/fs/fs-027-01/. Last accessed 26 Oct 2011. 2 Ney, John. J. “Oligotrophication and Its Discontents: Effects of Reduced Nutrient Loading on Reservoir Fisheries.” American Fisheries Society Symposium. 16. 285-295.
The Clean Water Act and Safe Drinking Water Act were developed in the wake of increasing public concern about water quality. In the United States, water quality issues caught the nation's attention in 1969 when oil and debris floating on the surface of the polluted Cuyahoga River caught fire outside of Cleveland, Ohio. Fires had occurred on the Cuyahoga River as early as 19363, but it was the 1969 fire that attracted the largest amount of media coverage. A few years later in 1972, Congress passed the Federal Water Pollution Controls Act, which later became known as the Clean Water Act. The Safe Drinking Water Act was passed shortly thereafter in 1974.
What human factors affect Bloomington’s water quality?
The facilities of the City of Bloomington’s Utilities Department (CBU) play a major role in local water quality issues. Bloomington sources its drinking water from Lake Monroe and cleans it for public distribution in the Monroe Water Treatment Plant. Wastewater (sometimes referred to as sewage) is treated in two facilities in Bloomington: the Dillman Road Wastewater Treatment Plant and the Blucher Poole Wastewater Treatment Plant. Treated water from these wastewater treatment facilities discharges into Clear Creek and Beanblossom Creek4, respectively. Both the drinking water and wastewater treatment plants are operated by the City of Bloomington Utilities Department and conduct all reporting and testing mandated by the Clean Water Act and Safe Drinking Water Act.
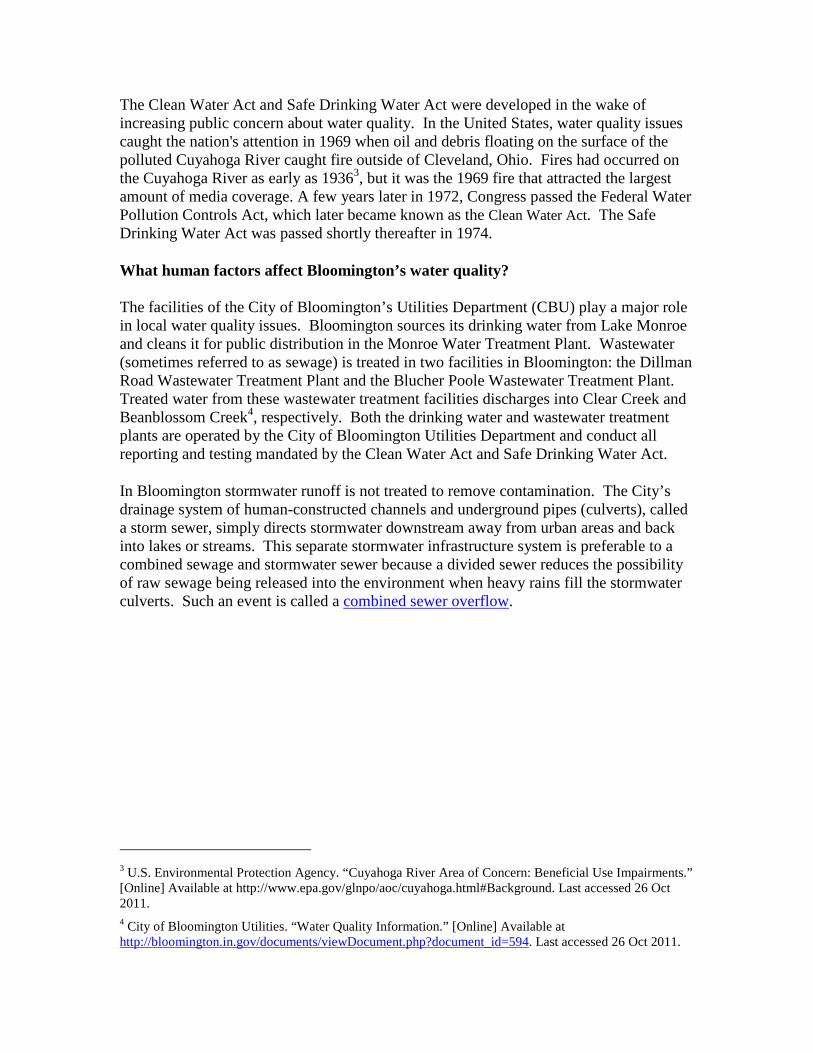
In Bloomington stormwater runoff is not treated to remove contamination. The City’s drainage system of human-constructed channels and underground pipes (culverts), called a storm sewer, simply directs stormwater downstream away from urban areas and back into lakes or streams. This separate stormwater infrastructure system is preferable to a combined sewage and stormwater sewer because a divided sewer reduces the possibility of raw sewage being released into the environment when heavy rains fill the stormwater culverts. Such an event is called a combined sewer overflow.
3 U.S. Environmental Protection Agency. “Cuyahoga River Area of Concern: Beneficial Use Impairments.” [Online] Available at http://www.epa.gov/glnpo/aoc/cuyahoga.html#Background. Last accessed 26 Oct 2011. 4 City of Bloomington Utilities. “Water Quality Information.” [Online] Available at http://bloomington.in.gov/documents/viewDocument.php?document_id=594. Last accessed 26 Oct 2011.

Figure 1 - Students at Bloomington North High School placing a "do not dump" sign on an inlet grate for Bloomington's storm drain system. Bloomington has a sanitary sewer (for transporting raw sewage to one of Bloomington's two wastewater treatment plants) separate from its storm sewer (for transporting stormwater downstream out of densely populated areas and back into local streams). You can help the environment by never dumping chemicals or trash down a storm sewer drain. (Photo by Kriste Lindberg)
In addition to the role of the Utilities Department, water quality in Bloomington is affected by various other local facilities that have permits to discharge effluent into the environment through the Clean Water Act’s permitting program.
Ultimately, however, Bloomington’s water quality is a reflection of cumulative actions of everyone who lives and works in the Bloomington area. This is because pollutants that are improperly disposed of can leach into or be washed by precipitation into our local waterways. There are many steps citizens can take to make a difference and improve local water quality. Positive actions include…
• Minimizing fertilizer use • Refraining from dumping
substances down storm drains • Installing silt fences when
remodeling • Cleaning up after your dogs on
walks • Regularly servicing your septic
system • Not littering
• Properly maintaining cars to prevent fluids from leaking onto the roads
• Using a commercial car wash facility [they must treat wash water before discharging it] or washing your own car on a permeable surface like gravel with only biodegradable soaps
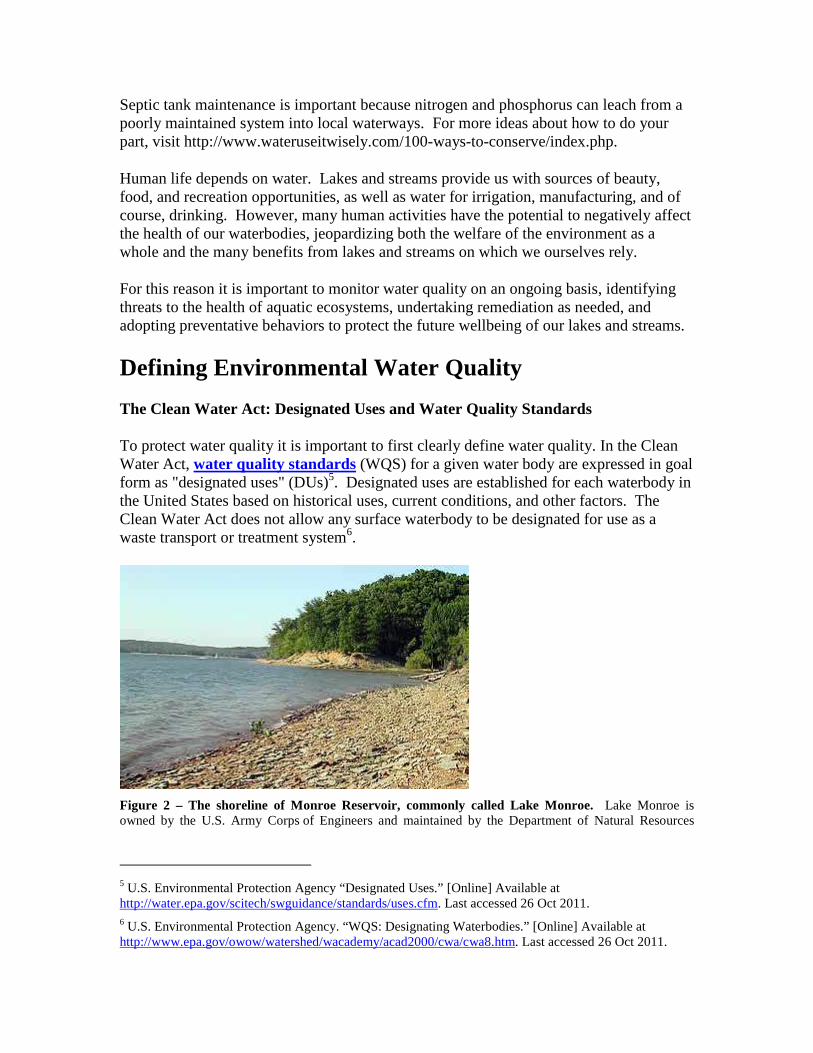
Septic tank maintenance is important because nitrogen and phosphorus can leach from a poorly maintained system into local waterways. For more ideas about how to do your part, visit http://www.wateruseitwisely.com/100-ways-to-conserve/index.php.
Human life depends on water. Lakes and streams provide us with sources of beauty, food, and recreation opportunities, as well as water for irrigation, manufacturing, and of course, drinking. However, many human activities have the potential to negatively affect the health of our waterbodies, jeopardizing both the welfare of the environment as a whole and the many benefits from lakes and streams on which we ourselves rely.
For this reason it is important to monitor water quality on an ongoing basis, identifying threats to the health of aquatic ecosystems, undertaking remediation as needed, and adopting preventative behaviors to protect the future wellbeing of our lakes and streams.
Defining Environmental Water Quality
The Clean Water Act: Designated Uses and Water Quality Standards
To protect water quality it is important to first clearly define water quality. In the Clean Water Act, water quality standards (WQS) for a given water body are expressed in goal form as "designated uses" (DUs)5. Designated uses are established for each waterbody in the United States based on historical uses, current conditions, and other factors. The Clean Water Act does not allow any surface waterbody to be designated for use as a waste transport or treatment system6.
Figure 2 – The shoreline of Monroe Reservoir, commonly called Lake Monroe. Lake Monroe is owned by the U.S. Army Corps of Engineers and maintained by the Department of Natural Resources
5 U.S. Environmental Protection Agency “Designated Uses.” [Online] Available at http://water.epa.gov/scitech/swguidance/standards/uses.cfm. Last accessed 26 Oct 2011. 6 U.S. Environmental Protection Agency. “WQS: Designating Waterbodies.” [Online] Available at http://www.epa.gov/owow/watershed/wacademy/acad2000/cwa/cwa8.htm. Last accessed 26 Oct 2011.
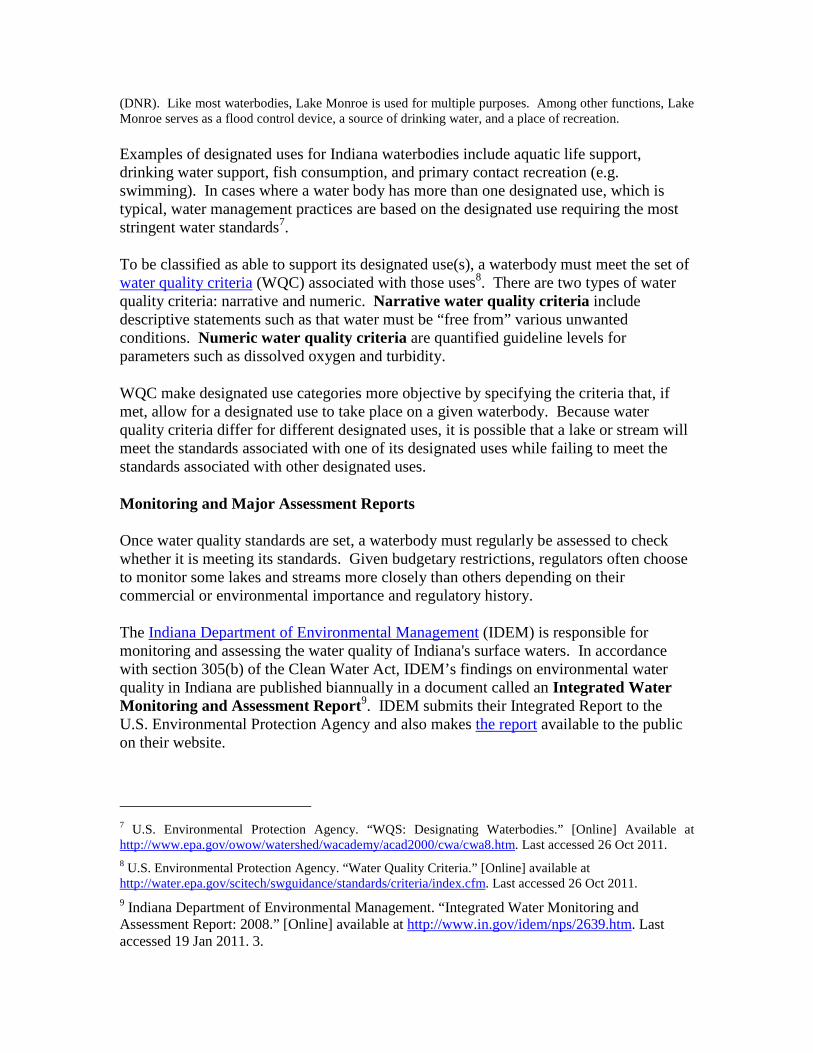
(DNR). Like most waterbodies, Lake Monroe is used for multiple purposes. Among other functions, Lake Monroe serves as a flood control device, a source of drinking water, and a place of recreation.
Examples of designated uses for Indiana waterbodies include aquatic life support, drinking water support, fish consumption, and primary contact recreation (e.g. swimming). In cases where a water body has more than one designated use, which is typical, water management practices are based on the designated use requiring the most stringent water standards7.
To be classified as able to support its designated use(s), a waterbody must meet the set of water quality criteria (WQC) associated with those uses8. There are two types of water quality criteria: narrative and numeric. Narrative water quality criteria include descriptive statements such as that water must be “free from” various unwanted conditions. Numeric water quality criteria are quantified guideline levels for parameters such as dissolved oxygen and turbidity.
WQC make designated use categories more objective by specifying the criteria that, if met, allow for a designated use to take place on a given waterbody. Because water quality criteria differ for different designated uses, it is possible that a lake or stream will meet the standards associated with one of its designated uses while failing to meet the standards associated with other designated uses.
Monitoring and Major Assessment Reports
Once water quality standards are set, a waterbody must regularly be assessed to check whether it is meeting its standards. Given budgetary restrictions, regulators often choose to monitor some lakes and streams more closely than others depending on their commercial or environmental importance and regulatory history.
The Indiana Department of Environmental Management (IDEM) is responsible for monitoring and assessing the water quality of Indiana's surface waters. In accordance with section 305(b) of the Clean Water Act, IDEM’s findings on environmental water quality in Indiana are published biannually in a document called an Integrated Water Monitoring and Assessment Report9. IDEM submits their Integrated Report to the U.S. Environmental Protection Agency and also makes the report available to the public on their website.
7 U.S. Environmental Protection Agency. “WQS: Designating Waterbodies.” [Online] Available at http://www.epa.gov/owow/watershed/wacademy/acad2000/cwa/cwa8.htm. Last accessed 26 Oct 2011. 8 U.S. Environmental Protection Agency. “Water Quality Criteria.” [Online] available at http://water.epa.gov/scitech/swguidance/standards/criteria/index.cfm. Last accessed 26 Oct 2011. 9 Indiana Department of Environmental Management. “Integrated Water Monitoring and Assessment Report: 2008.” [Online] available at http://www.in.gov/idem/nps/2639.htm. Last accessed 19 Jan 2011. 3.
Indiana’s Integrated Water Monitoring and Assessment Report is a comprehensive assessment of the state's waterbodies and the degree to which they have met their respective water quality standards. The Integrated Report gets its name from the fact that it contains data from two important lists that, prior to 2002, were produced by IDEM as separate reports.
The two lists that make up the bulk of the Integrated Water Monitoring and Assessment Report are Indiana’s Consolidated List and List of Impaired Waters. The Consolidated List, as required by section 305(b) of the Clean Water Act, contains monitoring and assessment data on all waters of the state of Indiana10. Publication of the List of Impaired Waters is mandated by section 303(d) of the Clean Water Act11.
The 303(d) List of Impaired Waters contains a subset of the waterbodies covered by the 305(b) Consolidated List12. It includes data on only those waterbodies that are "impaired13” and for which a TMDL (Total Maximum Daily Load, a pollution management plan that involves calculating the maximum amount of a pollutant a waterbody can receive and still meet water quality standards) is required.
Upon assessment, waterbodies are classified into one of 5 categories based on the degree to which they attain or violate water quality standards14. A waterbody is considered to be impaired if it does not meet its water quality standards. If a waterbody is expected to violate the standards at some point within the next reporting cycle, it is considered threatened.
In Indiana, the water monitoring data used to develop the 305(b) assessments is collected on a five-year rotating basis15. A group of lakes and streams representing roughly one-fifth of the state's surface waters is monitored each year so that over the course of five years, the entire state has been monitored. Because of this staggered review process, water quality reports do not always reflect the most current conditions. The 305(b)
10 Ibid. 11 Indiana Department of Environmental Management. “Integrated Water Monitoring and Assessment Report: 2008.” [Online] available at http://www.in.gov/idem/nps/2639.htm. Last accessed 19 Jan 2011. 3.
12 Ibid. 13 Indiana Department of Environmental Management. “Integrated Water Monitoring and Assessment Report: 2008.” [Online] available at http://www.in.gov/idem/nps/2639.htm. Last accessed 19 Jan 2011. 3. 14 Indiana Department of Environmental Management. “Integrated Water Monitoring and Assessment Report: 2008.” [Online] available at http://www.in.gov/idem/nps/2639.htm. Last accessed 10 Jan 2012. 42. 15 Indiana Department of Environmental Management. “Integrated Water Monitoring and Assessment Report: 2008.” [Online] available at http://www.in.gov/idem/nps/2639.htm. Last accessed 28 Oct 2011.
Integrated Water Monitoring and Assessment Report is published every other year in even years16.
The most recent Integrated Water Monitoring and Assessment Report for Indiana can be found here on IDEM’s website or here in pdf form. Indiana also prepares a separate annual report detailing fish consumption advisories by waterbody and fish species. Fish consumption advisories are assigned to a particular fish species living within a particular water body. Due to differing contamination sensitivities, it is possible for different fish species within the same water body to be assigned to a different one of five possible consumption advisory groups. A group 1 consumption advisory implies that a fish species from a given waterway is safe for unrestricted consumption by the general population and for up to one meal per week for women who are breastfeeding, pregnant, or plan to have children. A group 5 consumption advisory signals that no fish of the species in question should be consumed from a given waterway17. The latest Indiana Fish Consumption Advisory Report can be downloaded here from the Indiana State Department of Health’s website.
Total Maximum Daily Loads (TMDLs)
States are required to develop strategies for bringing water bodies listed on the 303(d) list into compliance with water quality standards. This usually involves the development of Total Maximum Daily Loads (TMDLs). The TMDL process establishes the maximum amount of a particular pollutant that a waterbody can withstand over a specified time period while still meeting water quality standards. After providing for a margin of safety and accounting for uncontrollable levels of pollution (e.g., background sources), each polluter or group of polluters is allocated a portion of the remaining TMDL.
Once the TMDL process has been successfully completed, the waterbody in question is listed under Category 4A on the 305(b) list. A schematic of how TMDLs fit into the methodology of how water bodies are classified in the Indiana Integrated Water Monitoring and Assessment Report can be seen in Figure 3. The list of Indiana waters with TMDLs and TMDLs under development for Indiana is subject to change as the Indiana Department of Environmental Management (IDEM) undertakes new remediation projects.
16 Indiana Department of Environmental Management. “Impaired Waters – Integrated Report.” [Online] available at http://www.in.gov/idem/nps/2348.htm. Last accessed 12 Jan 2012. 17 Indiana State Department of Health. “2010 Indiana Fish Consumption Advisory Complete Report.” [Online] available at http://www.in.gov/isdh/23650.htm. Last accessed 28 Oct 2011.

Figure 3 – Flowchart of 305(b) classification methodology. AU stands for waterbody “assessment unit.” A local example of an assessment unit would be Griffy Lake. Some particularly large or long water features in the Bloomington area, such as Lake Monroe and Clear Creek, are divided into multiple assessment units for monitoring purposes. Note how the flowchart shows that Category 3 waterbodies represent cases were there is insufficient data to determine an impairment level. (Graphic from IDEM18)
Water Pollution
Categorizing Water Pollution: Point Sources versus Nonpoint Sources
When a business or other source discharges contaminants into a stream or lake through a “discernible, confined, and discrete conveyance19” such as an outlet pipe, it is classified as a point source. Common point source examples include factories, large construction
18 Indiana Department of Environmental Management. “Integrated Water Monitoring and Assessment Report: 2010. Appendix C.”
19 U.S. Environmental Protection Agency. “Clean Water Act, Section 502 General Definitions.” [Online] available at http://water.epa.gov/lawsregs/guidance/wetlands/sec502.cfm. Last accessed 28 Oct 2011.

sites, and wastewater treatment plants. Significantly, return flows from irrigated agriculture are not classified as point source pollution and are therefore not subject to the Clean Water Act regulations associated with point sources.
Point sources are generally required to obtain a National Pollution Discharge Elimination System (NPDES) permit. NPDES permits specify effluent limits, or how much of a given pollutant a particular point source can discharge. After the NPDES permit has been issued, the polluter is required to monitor its effluent and report the results to a regulatory agency. NPDES permit holders can be sued for permit violations by the government or by members of the public in what are known as "citizen suits." More details about the EPA’s NPDES permit program can be found here. The role of the Indiana Department of Environmental Management in administering the NPDES permit process in Indiana is explained here.
Nonpoint sources can include any source of water pollution not considered to be a point source20. Typical examples include runoff from agriculture, construction sites, streets, parking lots, and other impervious surfaces. Nonpoint source pollution can also come from sites used for the storage of industrial equipment or waste drums. Common pollutants introduced into the environment by nonpoint sources include phosphorus, nitrogen, pesticides, sediment, and pathogens like E coli. Although point sources are a significant concern, nonpoint sources are actually responsible for a greater portion of water body impairments than point sources21. Contaminants from parking lots and high traffic streets tend to be the greatest contributors to stormwater pollution for most chemicals22, but lawns have been found to contribute high phosphorus levels to runoff23.
In 2009, a stream chemistry monitoring study funded by the Monroe County Drainage Board found that in the Bloomington-Ellettsville area, concentrations of nutrients, chloride compounds (from road salt), and pharmaceutical and personal care products increased in response to precipitation. This indicates non-point sources for these pollutants. The results of the study also suggest that protecting the water quality of Bloomington’s streams is largely a matter of managing the quantity and quality of stormwater runoff.
Regulating nonpoint sources is difficult because they are numerous and varied, but a range of techniques broadly referred to as best management practices (BMPs) can be used to minimize the effects of nonpoint source pollution. Examples include the
20 U.S. Environmental Protection Agency. “What is Nonpoint Source Pollution?” [Online] available at
http://water.epa.gov/polwaste/nps/whatis.cfm. Last accessed 28 October 2011. 21 U.S. Environmental Protection Agency. “Introduction to the Clean Water Act. Section 319: Nonpoint
Source Program.” [Online] available at http://water.epa.gov/lawsregs/rulesregs/sdwa/. Last accessed 28 October 2011.
22 Bannerman, R., D. Owens, and N. Hornewer. “Sources of Pollutants in Wisconsin Stormwater.” Water Science Technology. 28(3-5). 1993. 241-259.
23 Steuer, J.. “Stormwater pollution sources areas isolated in Marquette, Michigan.” Technical Note #105 from Watershed Protection Techniques. 3(1). 609-612. 1997.

installation of vegetated roofs, rain gardens, bioswales, permeable pavers, and other Low-Impact Development practices. In Bloomington, for example, Miller-Showers Park functions not only as an attractive welcoming point for the City but as a stormwater retention facility, complete with holding ponds designed to retain stormwater that drains into the park from over 170 acres of downtown Bloomington. Another way to protect the environment from nonpoint source discharges is to cover storm drains if a spill of dangerous substances occurs. The purpose of this action is to prevent contaminants from spreading throughout the environment.
Everyone contributes to nonpoint water pollution in some way. From the drips of fuel from your car’s tailpipe to your dog’s waste left on the grass, everything adds up. Even reducing the area of pervious land (land able to absorb runoff) in town by building a home or sidewalk will affect stormwater runoff levels. To learn more about what you can do to reduce nonpoint source pollution, see EPA's page, "What you can do to prevent NPS pollution."
Common Water Pollutants
I. Phosphorus and Nitrogen
Runoff from fertilized fields, lawns, livestock operations, construction sites, pet wastes, and other nonpoint sources can carry phosphorus (P) and nitrogen (N) into streams and lakes. The growth of algae and rooted aquatic plants (macrophytes) in lakes is generally limited by a shortage of either nitrogen or, much more commonly, phosphorus. When runoff containing a waterbody’s limiting nutrient is flushed into a lake or stream, algae and aquatic weeds grow rapidly. This excess plant growth changes the character of the waterbody and can interfere with recreational uses and strain the filtration systems of drinking water treatment systems. For suggestions on how you can help prevent excess nutrient loading of the lakes near where you live, visit the shoreline management resources available through the education section of the Indiana Lakes Management Society’s website.
Rapid algal and macrophyte growth due to excess nutrient loading can also cause serious ecological problems. Heavy plant growth changes the type of habitat and nutrients available to aquatic wildlife. It can also lead to fish kills. The process used by bacteria to break down organic matter after plants die off uses up oxygen in the water. When large growths of algae or macrophytes die off, so much dissolved oxygen in the water can be used up that oxygen levels are depleted to levels below those needed to sustain other aquatic organisms, like fish. Lakes and streams are complex ecosystems. When nutrient loading from human sources is introduced to a body of water, the wildlife community in that body of water can become destabilized.

Water Quality Threat: Harmful Algal Blooms Some blooms of blue-green algae (more accurately called cyanobacteria ) can produce toxins that can lead to health problems and occasionally death for humans and domestic animals. Not all cyanobacteria produce toxins but the best practice if you see a water body that looks “soupy” from heavy algal growth is to not swim in it and be sure your children and pets also stay out of the water.
For more information on harmful algal blooms, read the U.S. Geological Survey’s fact sheet on harmful algae blooms (HABs) or the latest updates on blue-green algae in Indiana.
II. Sediment
It may seem strange that sediment is considered to be a pollutant but when human activities cause lakes and rivers to receive more sediment than they would naturally, it can lead to significant problems for aquatic ecosystems. Excess sediment generally comes from runoff that has flowed over areas with exposed soil or other debris, such as construction sites, logging areas, farms, and roads. Streambed erosion also contributes to sediment pollution.
Sediment can reduce the amount of light available to aquatic plants, increase water temperature, bury and suffocate fish eggs, and irritate fish gills24. Additionally, sediment can carry other pollutants such as phosphorus, nitrogen, heavy metals, oil and grease, PCBs, and pesticides, which themselves cause considerable damage. Contaminated sediment is especially problematic for organisms living at the bottom of a waterbody because it tends to settle on the bed of streams or lakes.
Sediment pollution concerns are addressed in the Siltation and Erosion Prevention section of Bloomington’s Municipal Code, which is 20.05.040 - EN-03. Environmental standards for erosion control are also discussed in sections 20.05.041 - EN-04, 20.05.045 - EN-08, and 20.07.150 - SM-01 of the Code. Erosion control measures required for construction projects are discussed in sections 10.21.070 and 10.21.080 of the Bloomington Municipal Code. Erosion mitigation required for developments on steep slopes is described in 20.05.039 - EN-02 and general drainage standards are outlined in section 20.05.034 - DS-01.
III. Toxic Contaminants
Physical and chemical characteristics of water such as temperature and pH can be altered to a problematic degree as a result of human activity within a watershed. Various chemicals such as heavy metals (e.g., lead and mercury), pesticides, polycyclic aromatic
24 Water on the Web. “Soil Erosion and Sediment Pollution.” [Online] available at
http://www.waterontheweb.org/under/waterquality/sediment.html. 2004. Last Accessed 28 October 2011.

hydrocarbons (PAHs) are common sources of concern as potential threats to water quality.
Often pollutants can become present at higher and higher concentrations as they travel up the levels of a local food chain. This process is called biomagnification. As an organism (such as a fish) consumes many smaller organisms (such as insects) each containing a comparatively low amount of a given pollutant, that pollutant can build up in the tissues of the organism doing the eating. Thus, the concentrations of a pollutant in the body of organisms living in a waterbody will tend to be higher than the concentration of that pollutant in the surrounding water. Biomagnification applies particularly to contaminants that take a long time to break down, such as PCBs, and is generally the biological reason why certain fish are designated in fish consumption advisories as unsafe to for people to eat.
Water Quality Indices
Because there are so many possible sources of water quality degradation, scientists and environmental agencies use a variety of parameters to describe water quality. Some of the more common measurements for streams include the Index of Biotic Integrity (IBI), which analyses streams in terms of the biological community they support, and the Qualitative Habitat Evaluation Index (QHEI), which looks at a stream’s physical characteristics.
For lakes, the Carlson Trophic State Index (TSI) is often used. The Carlson TSI uses a mix of physical and biological measurements, including Secchi disc transparency (a measure of water clarity), chlorophyll a levels (a measurement of algal growth), and total phosphorus (a measure of nutrient loading). For both lakes and streams, measurements of dissolved oxygen, nutrient (most commonly nitrogen and phosphorus) levels, pH, light transmission, and dissolved solids are relevant. For information about how to monitor a lake, visit the website of the Indiana Clean Lakes Program. For a local example of how TSI data is used, read the latest annual lake monitoring report from the Lake Lemon Conservancy District.
I. Index of Biotic Integrity : The IBI is a composite index that compares a stream's water quality to a reference stream that is considered to be of high quality. Researchers gather fish samples that are used to determine a variety of factors such as the number and diversity of species present, whether the stream supports sensitive species, and whether various levels of the food chain are adequately represented. Many versions of the IBI have been developed but in each incarnation, individual metrics are assessed and the values assigned for each metric are then summed to produce an overall IBI score for the stream25. The higher the overall score, the higher the quality of the stream’s biological community.
25 U.S. Environmental Protection Agency. “An Introduction to the Index of Biotic Integrity.” [Online] available at http://www.epa.gov/bioiweb1/html/ibi_history.html. Last accessed1 November 2011.

II. Qualitative Habitat Evaluation Index : The QHEI complements the IBI, providing a physical characterization of the stream habitat in question. Factors such as the type and quality of substrate, the width and quality of the floodplain, the degree to which the stream banks suffer from erosion, sinuosity (whether the stream is straight or bends), and whether the stream has been channelized, are analyzed to determine the overall quality of the stream habitat26. The maximum possible score, indicating the highest possible habitat quality, is 100.
III. Carlson Trophic State Index: With the Carlson Trophic State Index (TSI), scientists use water clarity (measured as Secchi disc transparency) and the levels of total phosphorus and chlorophyll pigments in a lake to estimate a lake’s algal biomass, or productivity27. Lakes with TSI values greater than 50 are said to be eutrophic, or very productive lakes (i.e. those that support large populations of plants and algae). Lakes scoring between 40 and 50 are mesotrophic, or moderately productive. Those scoring less than 40 are called oligotrophic. Oligotrophic lakes are associated with low biological productivity and are typically characterized by high water clarity. Nutrient loading influenced by human activity, such as when storm runoff from fertilized lawns or cropland runs into a lake, has the potential to lead to rapid lake eutrophication.
Eutrophication is not a byword for water quality de gradation.
The point at which a lake is considered overly eutrophic (producing too much plant and algal biomass) depends on how that lake is used.
Example: Oligotrophic lakes are attractive to water skiers and other recreational water users because of their high water clarity but cannot sustain high populations of sport fish. Research has found that in temperate lakes where phosphorus is the nutrient limiting algal growth (as is true for most Indiana lakes), lakes become eutrophic once the total phosphorus concentration exceeds about 40 µg/L. Sport fish populations, however, do not peak at less than approximately 100 µg/L of total phosphorus28.
Large algal blooms can be a nuisance to humans, but algae are the base of the food chain in lakes. In crystal-clear, algae-free waters fish populations are limited, if present at all. Therefore, lake users advocating for maximum water clarity may be in conflict with those who want to use a lake primarily for fishing.
26 Ohio State University. “Qualitative Habitat Evaluation Index.”[Online] available at http://tycho.knowlton.ohio-state.edu/qhei.html#substrate. Last accessed 1 November 2011.
27 Carlson, R.E. and J. Simpson. “A Coordinator's Guide to Volunteer Lake Monitoring Methods.” North American Lake Management Society (Summary). 1996. [Online] available at http://www.secchidipin.org/tsi.htm. Last accessed 1 November 2011.
28 Ney, John. J. “Oligotrophication and Its Discontents: Effects of Reduced Nutrient Loading on Reservoir Fisheries.” American Fisheries Society Symposium. 16. 285-295.
Bloomington/Monroe County Surface Waters
Streams
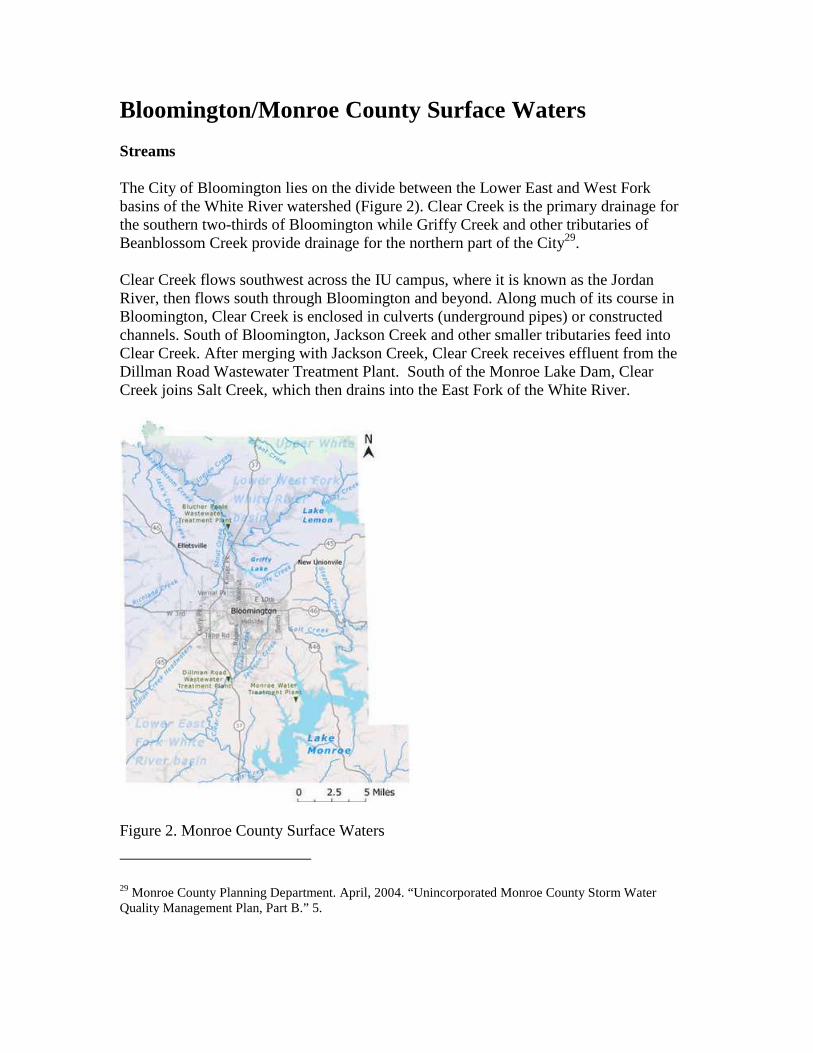
The City of Bloomington lies on the divide between the Lower East and West Fork basins of the White River watershed (Figure 2). Clear Creek is the primary drainage for the southern two-thirds of Bloomington while Griffy Creek and other tributaries of Beanblossom Creek provide drainage for the northern part of the City29.
Clear Creek flows southwest across the IU campus, where it is known as the Jordan River, then flows south through Bloomington and beyond. Along much of its course in Bloomington, Clear Creek is enclosed in culverts (underground pipes) or constructed channels. South of Bloomington, Jackson Creek and other smaller tributaries feed into Clear Creek. After merging with Jackson Creek, Clear Creek receives effluent from the Dillman Road Wastewater Treatment Plant. South of the Monroe Lake Dam, Clear Creek joins Salt Creek, which then drains into the East Fork of the White River.
Figure 2. Monroe County Surface Waters
29 Monroe County Planning Department. April, 2004. “Unincorporated Monroe County Storm Water Quality Management Plan, Part B.” 5.
Stout Creek and Griffy Creek flow north from Bloomington and drain into Beanblossom Creek along with other small tributaries. Beanblossom Creek flows to the northwest, eventually draining into the West Fork of the White River. The East and West Forks of the White River merge about 75 miles southwest of Bloomington at the northern border of Pike County, just east of Vincennes. The White River eventually discharges to the Wabash River in southwestern Indiana.
Lakes
There are three significant lakes in Monroe County: Lake Monroe, Lake Lemon, and Griffy Lake. Each of these is a human-constructed impoundment (reservoir) rather than a naturally formed lake.
The largest of the three is Lake Monroe, which provides drinking water to Bloomington. Though almost entirely within Monroe County, the reservoir also extends into Brown County. Lake Monroe’s watershed (the area of land from which water drains into the reservoir) includes not only Monroe County but Brown, Bartholomew, Jackson, and Lawrence Counties as well. 88% of Lake Monroe’s surface area but only 21% of the reservoir’s watershed is located in Monroe County30. Approximately 56.1% of Lake Monroe’s watershed is situated in Brown County31.
Lake Lemon is the second largest lake in the Monroe County area. The lake is managed by the Lake Lemon Conservancy District, which is responsible for maintaining the lake's water quality and value as both a wildlife habitat and recreational site.
Located on the north side of Bloomington, Griffy Lake is the only sizable lake within Bloomington itself. Griffy Lake once served as Bloomington's water supply and is now considered to be an emergency backup source for drinking water. Though it is owned by the City of Bloomington Utilities, the Bloomington Parks & Recreation Department manages the lake and surrounding land. Information on management strategies for Griffy Lake as well as additional history about the reservoir can be found in the latest Griffy Lake master plan.
30 Eakin, Jason. Monroe County Planning Department. Natural Features Inventory: Watershed &
Floodplains. [Online] available at http://www.co.monroe.in.us/TSD/DesktopModules/Bring2mind/DMX/Download.aspx?TabID=383&Command=Core_Download&EntryId=24829&PortalId=0&TabId=383. Last accessed 2 November 2011. August 2003.
31 Ibid.
Defining Drinking Water Quality
The Safe Drinking Water Act
The Safe Drinking Water Act (SDWA) establishes national standards for the quality of drinking water supplied by public water systems. Unlike the Clean Water Act, which focuses on minimizing water pollution in surfaces water bodies (rivers and lakes), the Safe Drinking Water Act regulates all drinking water whether it is sourced from surface water or groundwater supplies32. The SDWA sets standards for acceptable levels of various water contaminants based on the risk posed by a given substance to public health. The SDWA does not regulate private wells which serve fewer than 25 individuals33.
Once the EPA has identified a contaminant it wants to regulate under the Safe Drinking Water Act, it determines two guidelines for the contaminant: a maximum contaminant level goal (MCLG) and a maximum contaminant level (MCL)34. The MCLG is the level of a contaminant in drinking water below which there is no known or expected health risk. The MCL is the maximum permissible level of a contaminant in public drinking water. An MCL is an enforceable standard set as close to the MCLG as is economically or technologically feasible. MCLs can change as new treatment technologies are developed.
In some cases when it is not feasible to set a maximum contaminant level or when it is difficult to detect contaminants in drinking water, the EPA will instead establish a required treatment technique (TT)35. A treatment technique is a procedure that specifies how public water systems must treat their water to remove certain contaminants.
National Primary and Secondary Drinking Water Regulations
Together, the list of maximum contaminant levels (or treatment techniques) required for all drinking water contaminants regulated by the EPA make up a set of legally enforceable standards that apply to public water systems and are called the National Primary Drinking Water Regulations (NPDWRs, or primary standards). The full list of primary standards that public water systems, such as the City of Bloomington Utilities, are federally mandated to test for can be found here. Primary standards protect
32 Ferrey, Steven. Environmental Law: Examples and Explanations. Fifth Edition. “Additional Federal Water Pollution Statutes.” New York: Aspen, 2010. 283-290. 33 U.S. Environmental Protection Agency. “Safe Drinking Water Act.” [Online] available at
http://water.epa.gov/lawsregs/rulesregs/sdwa/. Last accessed 28 October 2011. 34 U.S. Environmental Protection Agency. “Understanding the Safe Drinking Water Act.” [Online]
available at http://www.epa.gov/ogwdw/sdwa/pdfs/fs_30ann_sdwa_web.pdf.. Last accessed 28 Oct 2011.
35 U.S. Environmental Protection Agency. “Understanding the Safe Drinking Water Act.” [Online] available at http://www.epa.gov/ogwdw/sdwa/pdfs/fs_30ann_sdwa_web.pdf. Last accessed 28 Oct 2011.
drinking water quality by setting limits for contaminants that can adversely affect public health and are known or anticipated to be present in water.
In addition to primary standards, the EPA also has a list of secondary standards, which are standards for contaminants that may adversely affect aesthetic qualities of water such as odor and taste. Because secondary contaminants have no known adverse public health impact, it is suggested but not required for public water systems to monitor for them36. Secondary contaminants include aluminum, chloride, color, copper, corrosivity, fluoride, foaming agents, iron, manganese, odor, pH, silver, sulfate, total dissolved solids, and zinc. Bloomington’s drinking water is tested for all primary and secondary standards37.
36 U.S. Environmental Protection Agency. “Drinking Water Contaminants.” [Online] available at
http://water.epa.gov/drink/contaminants/. Last accessed 1 Nov 2011. 37 Miya, Shawn (City of Bloomington Utilities, Pretreatment Program Inspector). 15 November 2011. Personal communication.

Water Consumption in Bloomington
Background
The City of Bloomington is served by one drinking water plant and two wastewater treatment plants. The Monroe Water Treatment Plant obtains water from Lake Monroe, located six miles southeast of Bloomington. The City purchases the water for treatment and distribution from the State of Indiana, which owns the reservoir.
Wastewater (sewage) from Bloomington is handled by the Dillman Road and Blucher Poole wastewater treatment plants (WWTPs). These facilities use activated sludge systems to treat wastewater. The Dillman Road WWTP discharges treated effluent into Clear Creek and the Blucher Poole WWTP discharges into Beanblossom Creek.
Humans need water to live but using water requires being mindful of our impact on the environment. Meeting the demand for potable water can stress ecosystems by diverting water from its natural course. Wastewater can also create problems for receiving waterbodies. Bloomington’s drinking and wastewater processing plants follow all state and federal regulations, maintaining careful testing records about the quality and volume of water entering and leaving their facilities.
Drinking Water
Water Extraction from Lake Monroe
Drinking water for Bloomington is taken up from Lake Monroe (officially Monroe Reservoir) and treated at the Monroe Water Treatment Plant prior to public distribution. Lake Monroe is owned by the US Army Corps of Engineers and managed by the Indiana Department of Natural Resources38. The City pays the Indiana Department of Natural Resources for the water they extract from Lake Monroe. With an area of 10.750 acres, the reservoir is the largest human-constructed body of water in Indiana. Lake Monroe was constructed in 1965 and began being used as a source of drinking water for Bloomington in 1967.
The Monroe Water Treatment Plant extracts and treats an average of 15 million gallons per day (mgd) but can treat as much as 24 mgd during periods of peak demand for water.
38 City of Bloomington Utilities. “Lake Monroe.” [Online] available at
http://bloomington.in.gov/documents/viewDocument.php?document_id=598. Last accessed at 17 November 2011.
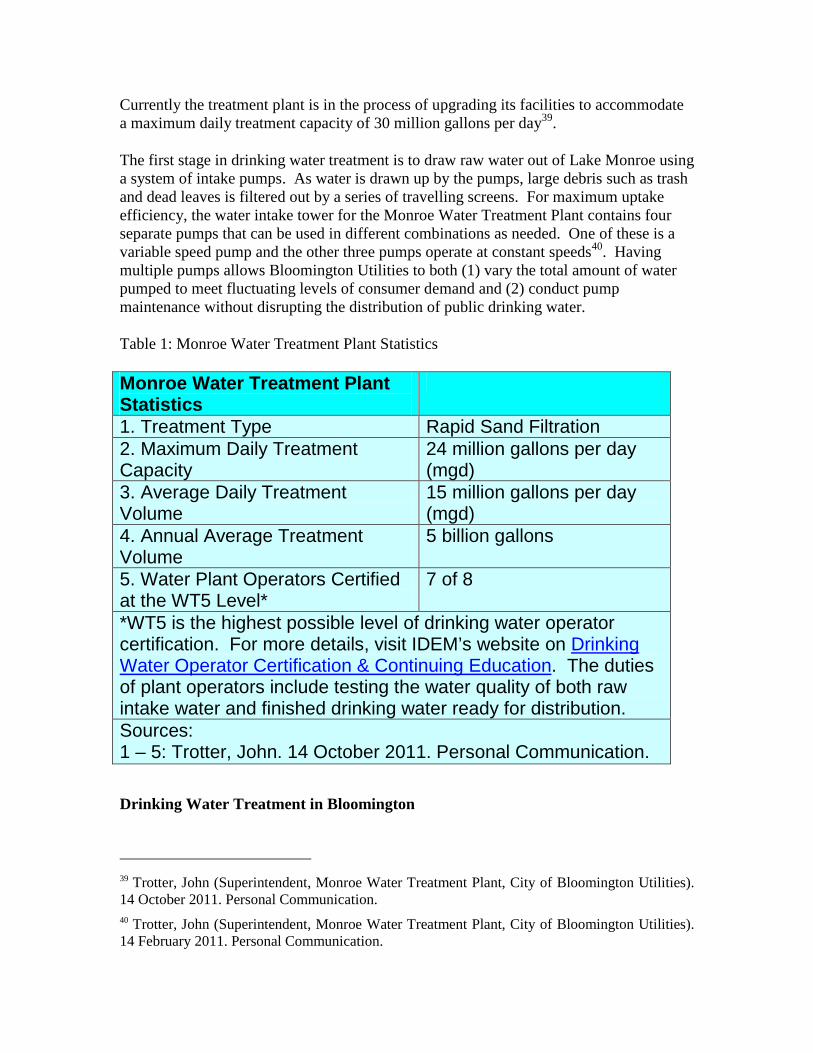
Currently the treatment plant is in the process of upgrading its facilities to accommodate a maximum daily treatment capacity of 30 million gallons per day39.
The first stage in drinking water treatment is to draw raw water out of Lake Monroe using a system of intake pumps. As water is drawn up by the pumps, large debris such as trash and dead leaves is filtered out by a series of travelling screens. For maximum uptake efficiency, the water intake tower for the Monroe Water Treatment Plant contains four separate pumps that can be used in different combinations as needed. One of these is a variable speed pump and the other three pumps operate at constant speeds40. Having multiple pumps allows Bloomington Utilities to both (1) vary the total amount of water pumped to meet fluctuating levels of consumer demand and (2) conduct pump maintenance without disrupting the distribution of public drinking water.
Table 1: Monroe Water Treatment Plant Statistics
Monroe Water Treatment Plant Statistics
1. Treatment Type Rapid Sand Filtration 2. Maximum Daily Treatment Capacity
24 million gallons per day (mgd)
3. Average Daily Treatment Volume
15 million gallons per day (mgd)
4. Annual Average Treatment Volume
5 billion gallons
5. Water Plant Operators Certified at the WT5 Level*
7 of 8
*WT5 is the highest possible level of drinking water operator certification. For more details, visit IDEM’s website on Drinking Water Operator Certification & Continuing Education. The duties of plant operators include testing the water quality of both raw intake water and finished drinking water ready for distribution. Sources: 1 – 5: Trotter, John. 14 October 2011. Personal Communication.
Drinking Water Treatment in Bloomington
39 Trotter, John (Superintendent, Monroe Water Treatment Plant, City of Bloomington Utilities). 14 October 2011. Personal Communication.
40 Trotter, John (Superintendent, Monroe Water Treatment Plant, City of Bloomington Utilities). 14 February 2011. Personal Communication.
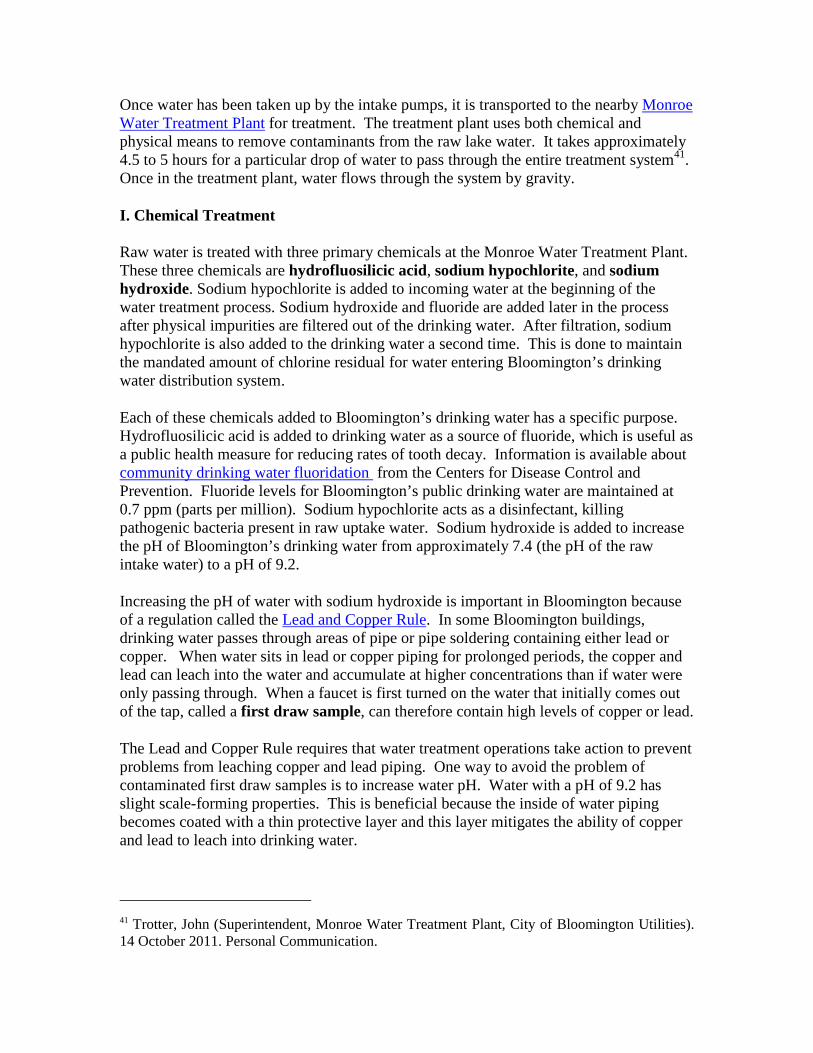
Once water has been taken up by the intake pumps, it is transported to the nearby Monroe Water Treatment Plant for treatment. The treatment plant uses both chemical and physical means to remove contaminants from the raw lake water. It takes approximately 4.5 to 5 hours for a particular drop of water to pass through the entire treatment system41. Once in the treatment plant, water flows through the system by gravity.
I. Chemical Treatment
Raw water is treated with three primary chemicals at the Monroe Water Treatment Plant. These three chemicals are hydrofluosilicic acid, sodium hypochlorite, and sodium hydroxide. Sodium hypochlorite is added to incoming water at the beginning of the water treatment process. Sodium hydroxide and fluoride are added later in the process after physical impurities are filtered out of the drinking water. After filtration, sodium hypochlorite is also added to the drinking water a second time. This is done to maintain the mandated amount of chlorine residual for water entering Bloomington’s drinking water distribution system.
Each of these chemicals added to Bloomington’s drinking water has a specific purpose. Hydrofluosilicic acid is added to drinking water as a source of fluoride, which is useful as a public health measure for reducing rates of tooth decay. Information is available about community drinking water fluoridation from the Centers for Disease Control and Prevention. Fluoride levels for Bloomington’s public drinking water are maintained at 0.7 ppm (parts per million). Sodium hypochlorite acts as a disinfectant, killing pathogenic bacteria present in raw uptake water. Sodium hydroxide is added to increase the pH of Bloomington’s drinking water from approximately 7.4 (the pH of the raw intake water) to a pH of 9.2.
Increasing the pH of water with sodium hydroxide is important in Bloomington because of a regulation called the Lead and Copper Rule. In some Bloomington buildings, drinking water passes through areas of pipe or pipe soldering containing either lead or copper. When water sits in lead or copper piping for prolonged periods, the copper and lead can leach into the water and accumulate at higher concentrations than if water were only passing through. When a faucet is first turned on the water that initially comes out of the tap, called a first draw sample, can therefore contain high levels of copper or lead.
The Lead and Copper Rule requires that water treatment operations take action to prevent problems from leaching copper and lead piping. One way to avoid the problem of contaminated first draw samples is to increase water pH. Water with a pH of 9.2 has slight scale-forming properties. This is beneficial because the inside of water piping becomes coated with a thin protective layer and this layer mitigates the ability of copper and lead to leach into drinking water.
41 Trotter, John (Superintendent, Monroe Water Treatment Plant, City of Bloomington Utilities). 14 October 2011. Personal Communication.

Sometimes the Monroe Water Treatment Plant also uses a fourth compound, powered activated carbon (PAC), to treat drinking water. PAC is generally added at the headworks of the treatment plant and acts to absorb taste and odor compounds in the raw water taken up from Lake Monroe. PAC is added during the times of the year when the most organic material is found in Lake Monroe’s water, typically late summer42.
II. Removal of Physical Impurities
In addition to receiving chemical treatment, raw intake water is also treated at the Monroe Water Treatment Plant to remove physical impurities. The first step in the removal of impurities is to add aluminum sulfate (also called alum) to the water. The purpose of the alum is to cause impurities such as silt to coagulate and fall to the bottom of the water column. The chemical process of causing suspended matter to come out of suspension and form clumps, or floc, is called flocculation. To ensure thorough mixing, water is violently agitated as alum is added. This process of adding alum, which takes place at the headworks of the treatment plant, is called flash mixing.
Flocculation continues after the initial flash mixing stage. Flash-mixed water passes into one of the Monroe Water Treatment Plant’s two flocculation basins, large holding tanks in which water is gently stirred to encourage the floc particles to trap additional impurities, grow in size, and fall to the bottom of the water column. This stage of drinking water treatment is called slow mix flocculation.
After slow mix flocculation, water passes into settling tanks with no agitation where more suspended particles settle to the bottom of the water column. Water flows over the rim at the far end of the settling tanks and moves onto the next stage of treatment, leaving the sediments behind.
The final stage of physical impurity removal is filtration . Water is passed through layers of different filtering materials that capture small particles which may still be suspended in the water. The filtering media used at Monroe Water Treatment Plant include, from top to bottom of the filtration system, anthracite, silica sand, high density garnet sand, high density garnet gravel, fine silica gravel, and coarse silica gravel. The difference in density and particle size between each of these filtration layers is carefully chosen to ensure both that the filter is able to properly trap contaminants and that the layers do not mix even when backwashed.
Backwashing is the procedure of flushing collected particles out of the treatment plant’s filter layers by forcing water backwards through the filtration material. Regular backwashing is necessary to clean the Monroe Water Treatment Plant’s filtration system and keep it operating efficiently. After a backwashing session takes place, the fluid
42 Trotter, John (Superintendent, Monroe Water Treatment Plant, City of Bloomington Utilities). 14 February 2011. Personal Communication.

resulting from backwashing is separated into its liquid and particulate components for disposal.
Backwash from the Monroe Water Treatment Plant flows by gravity into a backwash holding basin and can then be pumped to a clarifier (sedimentation tank) to allow solids to settle out. Clear water flows off from the top of the clarifiers through a system of weirs and, after additional treatment and testing, is discharged back into Lake Monroe. Filtrate water reclaimed from the backwash can be discharged back into Lake Monroe so long as various restrictions specified in the Monroe Water Treatment Plant’s NPDES permit are met. These requirements include de-chlorination and pH readjustment. The NPDES permit number for the Monroe WTP is IN0035718.
The thickened mixture of solids left in the clarifiers left after most of the water has been removed is not discharged back into Lake Monroe. Instead, the solids mixture is transferred a residuals holding basin for storage before being pumped into a mechanical plate and frame press. The purpose of the press is to squeeze the remaining water out of backwash sludge. This machine dries a batch of sludge in approximately three hours. After Monroe Water Treatment Plant accumulates approximately 3 tons of solids mixture from backwashing, the material is transported by truck to the Dillman Road Wastewater Plant for disposal.
Drinking Water Quality in Bloomington
Bloomington has an excellent track record as far as drinking water quality is concerned. To date, the Bloomington Utilities Department has never received a maximum contaminant level (MCL) violation. This means that drinking water exiting Bloomington’s water treatment plant for public distribution has never been found to be over the limit for a contaminant regulated by the Safe Water Drinking Act (SDWA)43.
Water Fact: What is Bloomington’s Drinking Water Te sted For?
All contaminants listed under the EPA’s…
• National Primary Drinking Water Regulations : City of Bloomington Utilities is legally responsible for monitoring the levels of all contaminants in this list.
• National Secondary Drinking Water Regulations : These contaminants impact the look/taste of water. Bloomington tests for these contaminants but is not legally responsible for ensuring drinking water meets any particular standard for these substances unless the substance is already included in the National Primary Drinking Water Regulations.
The Safe Drinking Water Act (SDWA) was passed in 1974. Since 1999 the SDWA’s Consumer Confidence Report Rule has required utilities to distribute annual water quality reports to the communities they serve.
43 Adz, Rachel. (Water Quality Coordinator, City of Bloomington Utilities). Personal communication. 10
Oct 2011.
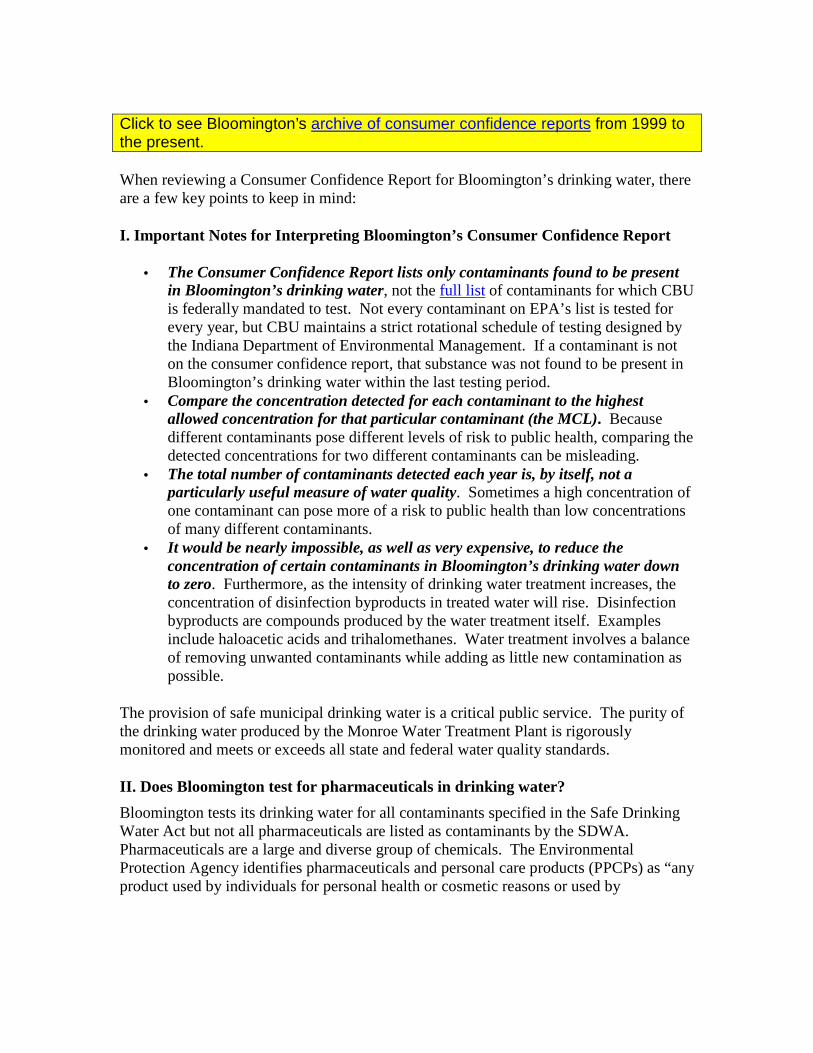
Click to see Bloomington’s archive of consumer confidence reports from 1999 to the present.
When reviewing a Consumer Confidence Report for Bloomington’s drinking water, there are a few key points to keep in mind:
I. Important Notes for Interpreting Bloomington’s C onsumer Confidence Report
• The Consumer Confidence Report lists only contaminants found to be present in Bloomington’s drinking water, not the full list of contaminants for which CBU is federally mandated to test. Not every contaminant on EPA’s list is tested for every year, but CBU maintains a strict rotational schedule of testing designed by the Indiana Department of Environmental Management. If a contaminant is not on the consumer confidence report, that substance was not found to be present in Bloomington’s drinking water within the last testing period.
• Compare the concentration detected for each contaminant to the highest allowed concentration for that particular contaminant (the MCL). Because different contaminants pose different levels of risk to public health, comparing the detected concentrations for two different contaminants can be misleading.
• The total number of contaminants detected each year is, by itself, not a particularly useful measure of water quality. Sometimes a high concentration of one contaminant can pose more of a risk to public health than low concentrations of many different contaminants.
• It would be nearly impossible, as well as very expensive, to reduce the concentration of certain contaminants in Bloomington’s drinking water down to zero. Furthermore, as the intensity of drinking water treatment increases, the concentration of disinfection byproducts in treated water will rise. Disinfection byproducts are compounds produced by the water treatment itself. Examples include haloacetic acids and trihalomethanes. Water treatment involves a balance of removing unwanted contaminants while adding as little new contamination as possible.
The provision of safe municipal drinking water is a critical public service. The purity of the drinking water produced by the Monroe Water Treatment Plant is rigorously monitored and meets or exceeds all state and federal water quality standards.
II. Does Bloomington test for pharmaceuticals in drinking water?
Bloomington tests its drinking water for all contaminants specified in the Safe Drinking Water Act but not all pharmaceuticals are listed as contaminants by the SDWA. Pharmaceuticals are a large and diverse group of chemicals. The Environmental Protection Agency identifies pharmaceuticals and personal care products (PPCPs) as “any product used by individuals for personal health or cosmetic reasons or used by
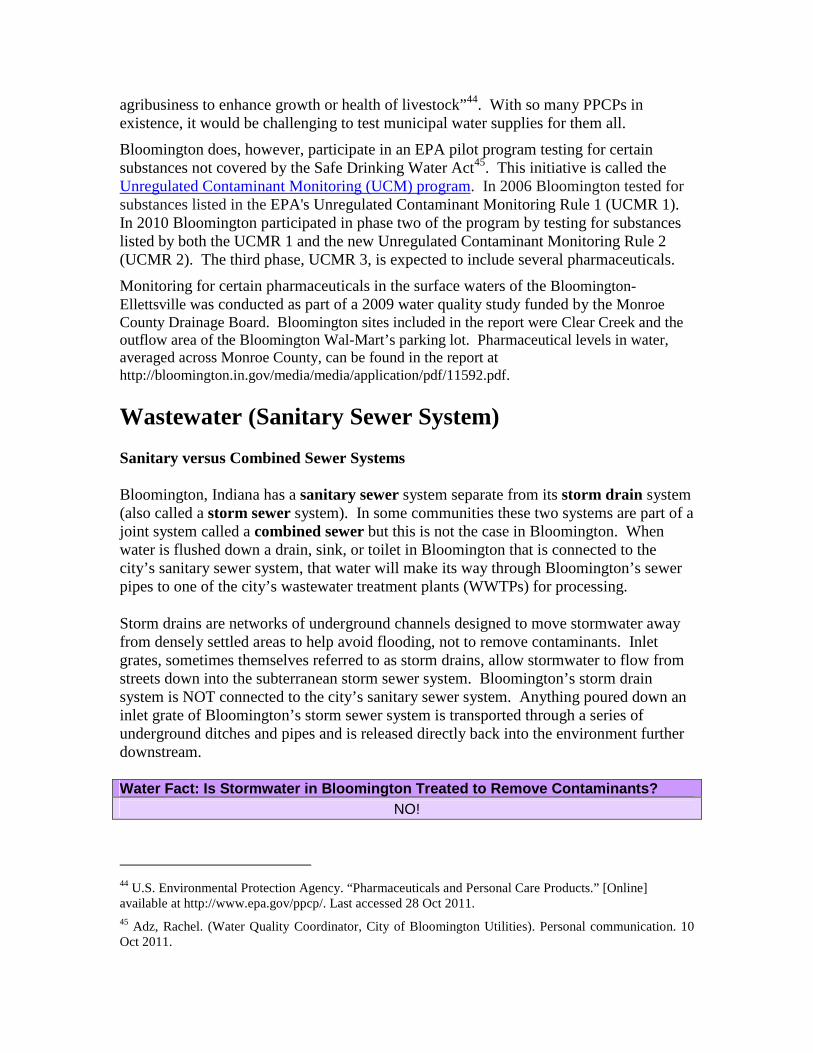
agribusiness to enhance growth or health of livestock”44. With so many PPCPs in existence, it would be challenging to test municipal water supplies for them all.
Bloomington does, however, participate in an EPA pilot program testing for certain substances not covered by the Safe Drinking Water Act45. This initiative is called the Unregulated Contaminant Monitoring (UCM) program. In 2006 Bloomington tested for substances listed in the EPA's Unregulated Contaminant Monitoring Rule 1 (UCMR 1). In 2010 Bloomington participated in phase two of the program by testing for substances listed by both the UCMR 1 and the new Unregulated Contaminant Monitoring Rule 2 (UCMR 2). The third phase, UCMR 3, is expected to include several pharmaceuticals.
Monitoring for certain pharmaceuticals in the surface waters of the Bloomington-Ellettsville was conducted as part of a 2009 water quality study funded by the Monroe County Drainage Board. Bloomington sites included in the report were Clear Creek and the outflow area of the Bloomington Wal-Mart’s parking lot. Pharmaceutical levels in water, averaged across Monroe County, can be found in the report at http://bloomington.in.gov/media/media/application/pdf/11592.pdf.
Wastewater (Sanitary Sewer System)
Sanitary versus Combined Sewer Systems
Bloomington, Indiana has a sanitary sewer system separate from its storm drain system (also called a storm sewer system). In some communities these two systems are part of a joint system called a combined sewer but this is not the case in Bloomington. When water is flushed down a drain, sink, or toilet in Bloomington that is connected to the city’s sanitary sewer system, that water will make its way through Bloomington’s sewer pipes to one of the city’s wastewater treatment plants (WWTPs) for processing.
Storm drains are networks of underground channels designed to move stormwater away from densely settled areas to help avoid flooding, not to remove contaminants. Inlet grates, sometimes themselves referred to as storm drains, allow stormwater to flow from streets down into the subterranean storm sewer system. Bloomington’s storm drain system is NOT connected to the city’s sanitary sewer system. Anything poured down an inlet grate of Bloomington’s storm sewer system is transported through a series of underground ditches and pipes and is released directly back into the environment further downstream. Water Fact: Is Stormwater in Bloomington Treated to Remove Contaminants?
NO!
44 U.S. Environmental Protection Agency. “Pharmaceuticals and Personal Care Products.” [Online] available at http://www.epa.gov/ppcp/. Last accessed 28 Oct 2011. 45 Adz, Rachel. (Water Quality Coordinator, City of Bloomington Utilities). Personal communication. 10 Oct 2011.

• Bloomington’s storm drain system is separate from the city’s sanitary sewer system. • The purpose of storm drains is not to send water to a treatment plant, as is true of
the sanitary sewer, but to transport water away from zones susceptible to flooding. • Any substance you pour down a storm drain inlet grate will end up in a local stream
or lake. So be a good neighbor and don’t dump anything down the storm drain!
It is therefore important not to dump anything down a storm drain. For advice on the proper disposal of hazardous substances, consult the Monroe County Solid Waste Management District. You can also make a difference by getting involved with Bloomington’s storm drain marking program. From both an environmental and a public health perspective, Bloomington’s system of a separated sanitary and storm sewers is preferable to having a combined sewer system. This is because separated sewer systems reduce the possibility of overflows of raw sewage. All sewer systems, both sanitary and combined, are susceptible to backups/overflows due to severe weather, pipe blockages, line breaks, poor system maintenance, inadequate sewer design, and vandalism. However, combined sewers present a problem that separated sanitary and storm sewer systems do not: combined sewer overflows. In a combined sewer system, both storm drains and raw sewage drain through a single pipe system down to a wastewater treatment plant. During periods of heavy precipitation, the high volume of stormwater mixing with the raw sewage can mean that the combined volume of liquid is greater than what the combined sewer’s piping is capable of conveying to a treatment plant. When this happens, some of the excess liquid is discharged back into the environment via an outfall pipe (Figure 1). This is called a combined sewer overflow (CSO). Although they can be necessary to relieve pressure on the infrastructure of a combined sewer system, CSOs mean that untreated raw sewage is discharged directly back into the environment. This has negative consequences for both public health and the environment.

Figure 1 – Combined Sewer System. During wet weather, when total flows exceed the capacity of a combined sewer system (CSS), CSSs are designed to discharge excess liquid directly to surface waterbodies such as rivers. When this happens, it is called a combined sewer overflow (CSO). Note: Publically owned treatment works (POTW) is another name for a wastewater treatment plant. (Graphic from EPA46) With a separated storm and sanitary sewer system such as Bloomington’s, this type of wet-weather induced sewer overflow is far less likely to occur (Figure 2). Because the pipes containing sewage and stormwater are separate, an increased flow of stormwater does not affect the volume of liquid in the pipe transporting sewage to a water treatment plant. In practice, infrastructure leaks in separated sewer systems can result in sewer overflows still sometimes occurring. However, separated sewer systems face this issue to a much smaller degree than combined sewers do.
Figure 2 – Separate Sanitary and Storm Sewers. With separate sanitary and storm sewers, wet weather does not affect the volume of sewage traveling to a water treatment plant or cause the discharge of raw sewage into the environment unless there are leaks in the infrastructure. Bloomington, Indiana has separate sanitary and storm sewer systems. (Graphic from the EPA47)
Wastewater Pretreatment in Bloomington
City of Bloomington Utilities monitors the wastewater entering their treatment plants via two sets of types of regulations: local limits and industrial pretreatment standards. Wastewater present in the public sewer lines is subject to a set of local limits for what is able to be processed by Bloomington’s wastewater treatment plants. These local limits
46 U.S. Environmental Protection Agency. Figure 2.1: Typical Combined Sewer System from “Report to Congress: Impacts and Control of CSOs and SSOs”. Document No. EPA 833-R-04-001. Chapter 2. 2-2. [Online] available at http://www.epa.gov/npdes/pubs/csossoRTC2004_chapter02.pdf. Last accessed 10 Jan 2012. 47 U.S. Environmental Protection Agency. Figure 2.2: Typical Separate and Storm Sewer System from “Report to Congress: Impacts and Control of CSOs and SSOs”. Document No. EPA 833-R-04-001. Chapter 2. 2-2. [Online] available at http://www.epa.gov/npdes/pubs/csossoRTC2004_chapter02.pdf. Last accessed 10 Jan 2012.

are listed in Bloomington’s Municipal Code under Title 10.12.030, Limitations on Wastewater Strength.
If wastewater reaching either Blucher Poole or Dillman Road were found to contain an ongoing and significant excess of a particular contaminant according to Bloomington’s local limits, CBU would begin sampling to determine the source of the problem. To date Bloomington has never had such an emergency48, as can be seen in the annual NPDES data submitted by Bloomington’s wastewater treatment plants, but CBU is prepared should one occur. In the event of a problem, samples would first be collected from sewer lift stations. As the location of a contamination incident were pinpointed, CBU would collect additional samples tracing the problem back to the particular manhole or pipe from which the problem is originating. Short-term spikes in the amount of contaminants entering Bloomington’s sanitary sewer can be impossible to trace because by the time a problem is detected, the pollution incident has ended and there is no chemical trail to track upstream.
The local limits level of monitoring looks at the combined mix of wastewater discharged into the municipal system by all users, including that from businesses, private homes, and industrial facilities alike. Not all discharges of wastewater into the sewer system are created equal, however. Wastewater from industrial facilities often contains especially harmful substances and substances not typically found in wastewater from other dischargers49. Examples include cyanide from electroplating shops or lead from the manufacturing of batteries.
To reduce the burden on municipal treatment plants, many industrial facilities are required to partially treat their own wastewater before releasing it into the public sewer system. This practice is called “pretreatment.” Pretreatment minimizes problems such as hazardous substances damaging the machinery of the municipal treatment plants or being passed on into the environment by a municipal treatment plant not designed to remove a particular contaminant. Thus, pretreatment helps safeguard the environment and promotes equity by placing some of the burden of wastewater treatment onto the facilities that have the potential to produce the most heavily contaminated effluent.
The City of Bloomington Utilities Department (CBU) is required by federal law to enforce all pretreatment-related portions of the Clean Water Act in Bloomington. CBU has the authority to do this directly, unlike in smaller communities where a state-level agency such as the Indiana Department of Environmental Management (IDEM) would be the responsible party. The City performs its own pretreatment permitting, inspecting, sampling and enforcement. Bloomington is one of fewer than 50 “pretreatment cities,” or communities that run local pretreatment programs, in the state of Indiana.
48 Miya, Shawn (City of Bloomington Utilities, Pretreatment Program Inspector). 15 November 2011. Personal communication. 49 Indiana Department of Environmental Management. “Industrial Pretreatment Permits.” [Online] available at http://www.in.gov/idem/4882.htm. Last accessed 4 November 2011.
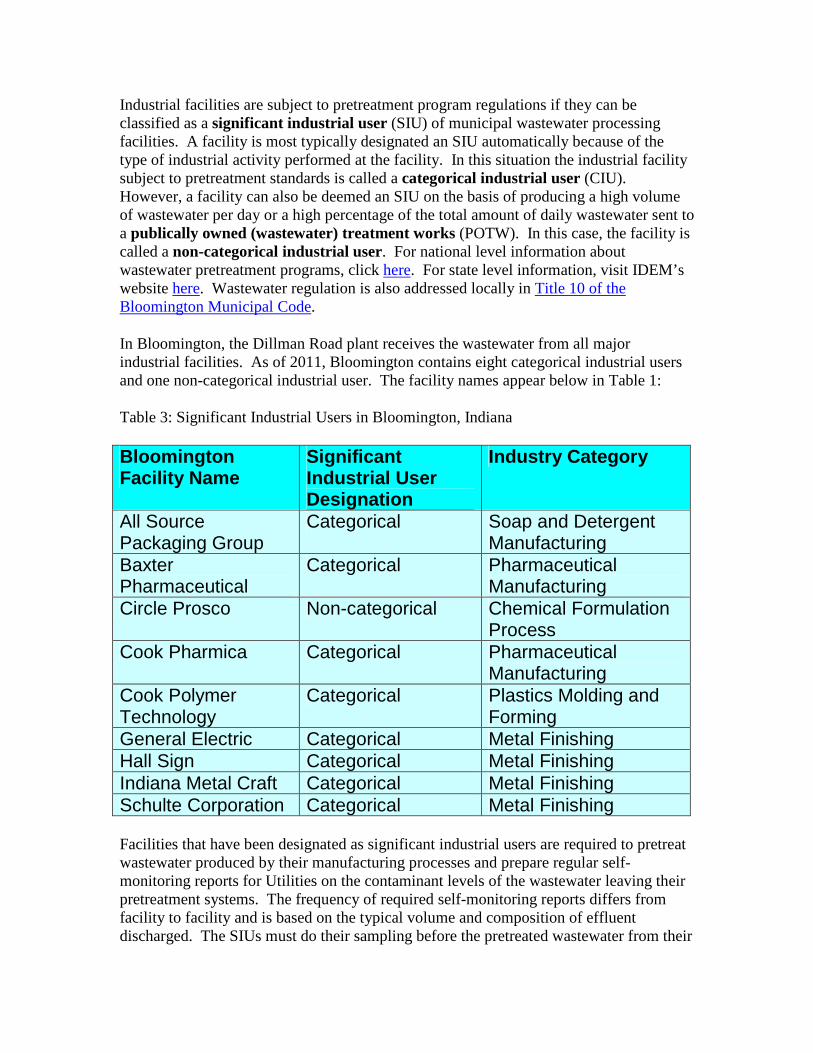
Industrial facilities are subject to pretreatment program regulations if they can be classified as a significant industrial user (SIU) of municipal wastewater processing facilities. A facility is most typically designated an SIU automatically because of the type of industrial activity performed at the facility. In this situation the industrial facility subject to pretreatment standards is called a categorical industrial user (CIU). However, a facility can also be deemed an SIU on the basis of producing a high volume of wastewater per day or a high percentage of the total amount of daily wastewater sent to a publically owned (wastewater) treatment works (POTW). In this case, the facility is called a non-categorical industrial user. For national level information about wastewater pretreatment programs, click here. For state level information, visit IDEM’s website here. Wastewater regulation is also addressed locally in Title 10 of the Bloomington Municipal Code.
In Bloomington, the Dillman Road plant receives the wastewater from all major industrial facilities. As of 2011, Bloomington contains eight categorical industrial users and one non-categorical industrial user. The facility names appear below in Table 1:
Table 3: Significant Industrial Users in Bloomington, Indiana
Bloomington Facility Name
Significant Industrial User Designation
Industry Category
All Source Packaging Group
Categorical Soap and Detergent Manufacturing
Baxter Pharmaceutical
Categorical Pharmaceutical Manufacturing
Circle Prosco Non-categorical Chemical Formulation Process
Cook Pharmica Categorical Pharmaceutical Manufacturing
Cook Polymer Technology
Categorical Plastics Molding and Forming
General Electric Categorical Metal Finishing Hall Sign Categorical Metal Finishing Indiana Metal Craft Categorical Metal Finishing Schulte Corporation Categorical Metal Finishing
Facilities that have been designated as significant industrial users are required to pretreat wastewater produced by their manufacturing processes and prepare regular self-monitoring reports for Utilities on the contaminant levels of the wastewater leaving their pretreatment systems. The frequency of required self-monitoring reports differs from facility to facility and is based on the typical volume and composition of effluent discharged. The SIUs must do their sampling before the pretreated wastewater from their
manufacturing processes is combined with wastewater generated by non-manufacturing activities such as facility cleaning and operating employee washrooms.
The City of Bloomington Utilities Department checks the self-monitoring data submitted by industrial users by visiting SIU facilities for both site inspections and collecting wastewater samples to conduct testing of its own. CBU visits each significant industrial user in Bloomington at least once a year, but may also visit a single site many times in the same year. All compliance and reporting data is summarized yearly by City of Bloomington Utilities in their Industrial Pretreatment Program Annual Report , which is submitted to the Indiana Department of Environmental Management and the U.S. Environmental Protection Agency.
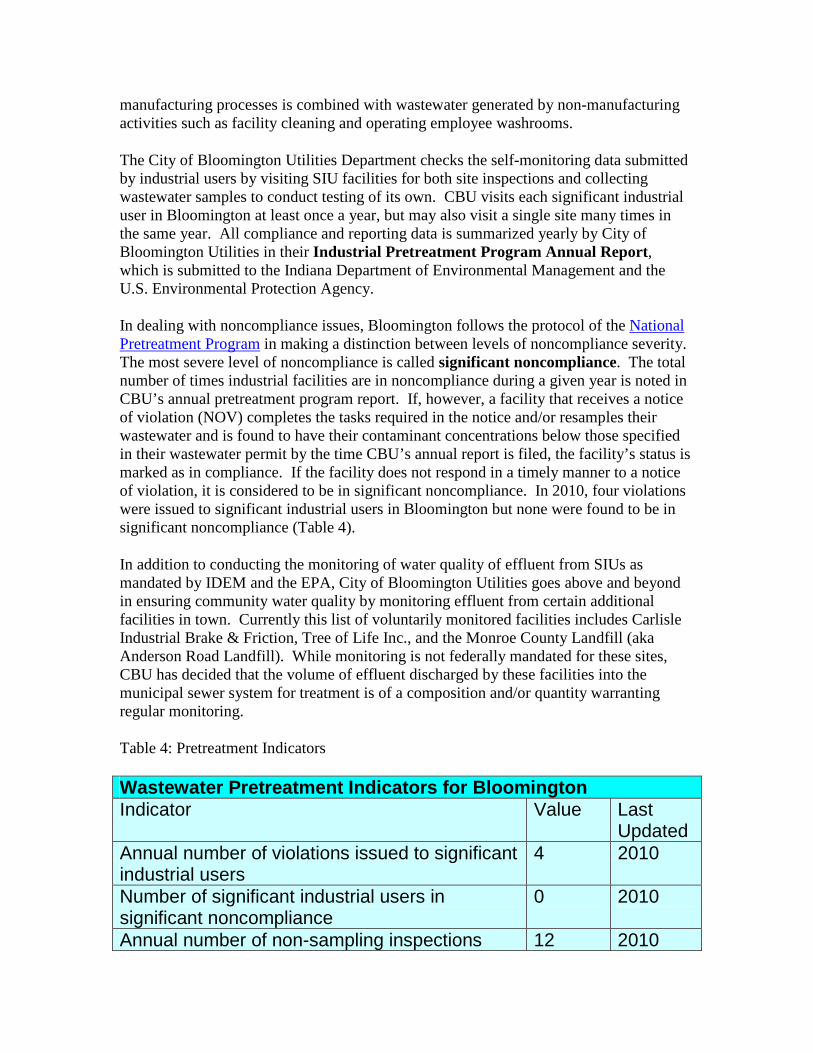
In dealing with noncompliance issues, Bloomington follows the protocol of the National Pretreatment Program in making a distinction between levels of noncompliance severity. The most severe level of noncompliance is called significant noncompliance. The total number of times industrial facilities are in noncompliance during a given year is noted in CBU’s annual pretreatment program report. If, however, a facility that receives a notice of violation (NOV) completes the tasks required in the notice and/or resamples their wastewater and is found to have their contaminant concentrations below those specified in their wastewater permit by the time CBU’s annual report is filed, the facility’s status is marked as in compliance. If the facility does not respond in a timely manner to a notice of violation, it is considered to be in significant noncompliance. In 2010, four violations were issued to significant industrial users in Bloomington but none were found to be in significant noncompliance (Table 4).
In addition to conducting the monitoring of water quality of effluent from SIUs as mandated by IDEM and the EPA, City of Bloomington Utilities goes above and beyond in ensuring community water quality by monitoring effluent from certain additional facilities in town. Currently this list of voluntarily monitored facilities includes Carlisle Industrial Brake & Friction, Tree of Life Inc., and the Monroe County Landfill (aka Anderson Road Landfill). While monitoring is not federally mandated for these sites, CBU has decided that the volume of effluent discharged by these facilities into the municipal sewer system for treatment is of a composition and/or quantity warranting regular monitoring.
Table 4: Pretreatment Indicators
Wastewater Pretreatment Indicators for Bloomington Indicator Value Last
Updated Annual number of violations issued to significant industrial users
4 2010
Number of significant industrial users in significant noncompliance
0 2010
Annual number of non-sampling inspections 12 2010

conducted by CBU* Annual number of sampling inspections conducted by CBU*
12 2010
Annual number of sanitary sewer overflows attributable to grease blockages
1 2010
Note: These numbers indicate that a total of 12 site visits were conducted, each of which included both a site inspection and sampling, not a total of 24 visits. Source: 2010 Industrial Pretreatment Program Annual Report, City of Bloomington Utilities.
Wastewater Treatment
Wastewater that enters the Bloomington municipal sewer system eventually travels to either the Dillman Road or Blucher Poole wastewater treatment plants (WWTPs). Blucher Poole serves the northern third of Bloomington and Dillman Road handles the southern two-thirds, which includes the discharges from all major industrial facilities in town. On average Blucher Poole and Dillman Road process, respectively, 4.5 and 9.6 million gallons per day (mgd) of wastewater50. The maximum operating capacity for each facility is much higher. Dillman Road discharges treated effluent into Clear Creek and Blucher Poole discharges into Beanblossom Creek.
Wastewater coming into a WWTP is called influent . Water leaving the facility is called effluent. While in the process of being treated in a wastewater treatment plant, wastewater is referred to as sludge. A single drop of water moving from start to finish of the wastewater treatment process will complete its journey in approximately four hours.
Bloomington’s WWTPs use an activated sludge treatment process. After raw sewage is pumped in and passed through a grit removal system including screens to remove large particulate matter, wastewater is mixed with oxygen and oxygen-dependent microorganisms51. The microorganisms digest nutrients in the sludge and form clumps of material that can be skimmed off of the water in large clarifying tanks. Dillman Road, the larger of Bloomington’s two WWTPs, has six aerators (tanks where oxygen is injected into the sludge), two large digestors (pools where wastewater circulates as the microorganisms eat the sludge), and six clarifying tanks. Some of the microorganism-containing material separated off from the wastewater in the clarifiers is pumped back into the aeration tanks to digest the next batch of newly pumped in wastewater. This
50 City of Bloomington Utilities. Industrial Pretreatment Program Annual Report: 2010. 51 National Small Flows Clearinghouse. “Explaining the Activated Sludge Process.” Pipeline. 14:2. West Virginia University, Spring 2003. [Online] at http://www.nesc.wvu.edu/pdf/WW/publications/pipline/PL_SP03.pdf. Last accessed 9 November, 2011.
material is called RAS, or return activated sludge. Solids removed from the wastewater processed from both facilities are dried and placed for decomposition in a landfill located beside the Dillman Road WWTP.
After the activated sludge process is complete, wastewater is filtered a final time and treated for 45 minutes in a non-chlorine beach solution. The bleach is removed by means of a chemical reaction. The cleaned water is then discharged to Clear Creek.
Wastewater treatment plant effluent in Bloomington is subject to quality standards specified in a National Pollutant Discharge Elimination System (NPDES) permit issued by IDEM for each facility. The Blucher Poole Wastewater Treatment Plant holds NPDES permit number IN0035726 and the Dillman Road Wastewater Treatment Plant holds NPDES permit number IN0035718. Contaminant levels and other water quality parameters are measured for WWTP effluent as specified in the NPDES permit. This mostly involves daily or weekly sampling, depending on the water quality parameter. Most samples from both Blucher Poole and Dillman Road are analyzed in an onsite laboratory at Dillman Road. All reporting data is forwarded to IDEM. Annual reports are sent to both EPA and IDEM.
In addition to their regular monitoring activities specified by their NPDES permits, City of Bloomington Utilities also conducts an annual analysis of all organic pollutants detected in the influent, sludge, and effluent of their treatment plants, regardless of whether testing for those compounds is required by a facility’s NPDES permit or not.

Bloomington and Monroe County Environmental Water Quality
Introduction
Water quality is an excellent indicator of the overall health of the environment. It is influenced not only by water pollution itself, but also by air pollution, agricultural runoff, vehicle emissions, land development, the amount of impervious surface in the surrounding watershed, and urbanization in general.
Because of the variety of potential sources of water pollution it can be difficult to directly identify and mitigate threats to water quality. Citizens can play a significant role in contributing to water quality problems through their daily activities, but can also help improve water quality through practices such as using alternative transportation, planning landscaping to reduce stormwater runoff, and applying fertilizers and pesticides judiciously (or not at all). Government also plays a significant role by ensuring that developers adhere to strict water protection measures and by minimizing development in sensitive watersheds. Encouraging low-impact development is one way that local government can improve water quality. Ultimately, however, the protection of water quality requires the commitment and cooperation of citizens and all levels of government.
Data on environmental water quality in Bloomington indicates that many local lakes and streams in the Bloomington area are impaired for at least one designated use. Because many waterbodies have not recently been assessed for various water quality parameters, it is possible that more waterways are impaired than the available data shows.
Erosion and sedimentation are problems in many streams and all of the reservoirs in Monroe County, degrading water quality and reducing the streams' ability to support healthy aquatic communities. Eroding streambanks as well as runoff from developed or disturbed areas, such as construction sites, can contribute to the problem. Algae blooms and E. coli contamination are also an issue in some areas.
Contamination from toxic substances is also a source of concern in Bloomington’s lakes and streams. Along with the residual effects of historic PCB contamination, stormwater runoff from urban areas contributes toxic chemicals (such as mercury) to some Bloomington area waterbodies. For the most up-to-date information on contamination in local fish, please consult the Indiana Fish Consumption Advisory Report.
The latest Indiana Fish Consumption Advisory Report can be downloaded here from the Indiana State Department of Health’s website.

Indiana’s Integrated Water Monitoring and Assessment Report
Most of the stream and lake water quality data in this report is sourced from Indiana’s Integrated Water Monitoring and Assessment Report. This document, also known as Indiana’s 305(b) water quality report, is single most comprehensive and regularly updated report containing data on environmental water quality in the Bloomington area. This document is updated biannually by the Indiana Department of Environmental Management. Each year’s updates include new monitoring data for approximately one-fifth of the state's surface waters each year, which are surveyed on a five-year rotational basis.
The most recent Integrated Water Monitoring and Assessment Report for the state of Indiana can be found on IDEM’s website or here in pdf form. The Integrated Report classifies how well waterbodies meet each of their designated uses using a five category classification scheme. However, the 1-5 categories DO NOT represent a simple scale of increasing impairment intensity. IDEM’s classification designations can be seen in Table 1. Waterbodies currently meeting all applicable water quality standards for a given designated use are said to be unimpaired and fully supporting that designated use. Those currently meeting water quality standards but expected to not meet them within the next reporting cycle are called threatened for a given designated use. Waterbodies currently failing water quality standards are said to be impaired and not supportive of a given designated use.
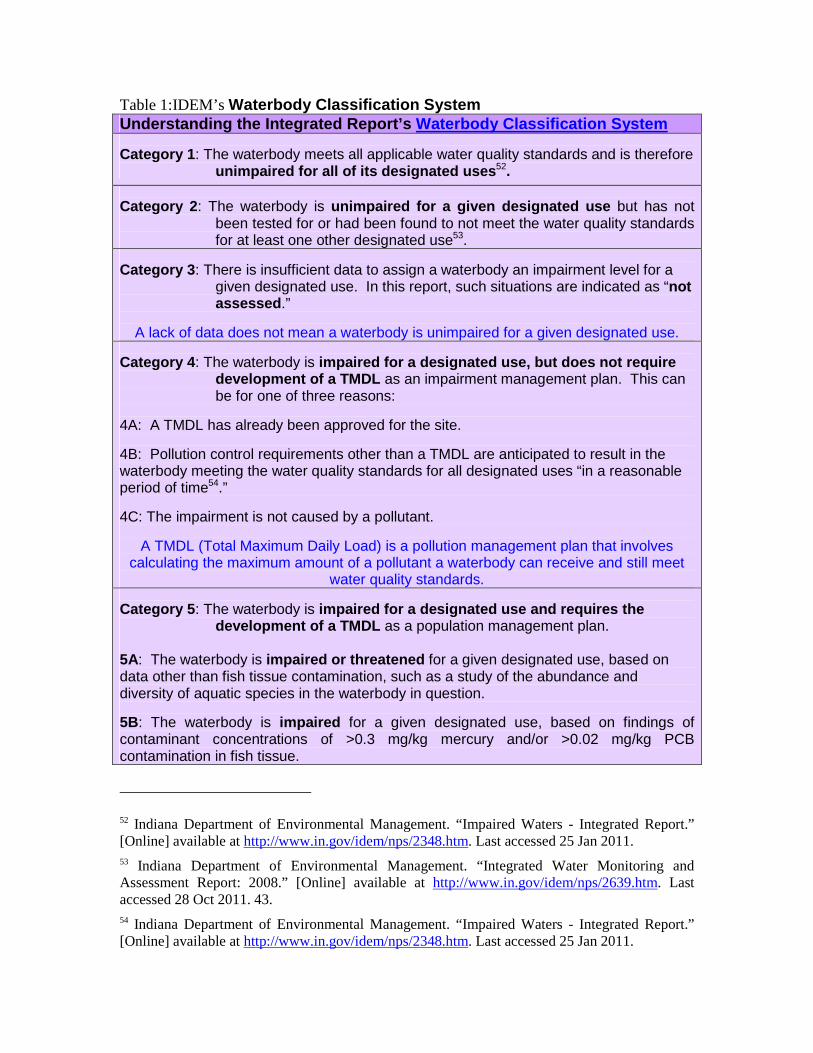
Table 1:IDEM’s Waterbody Classification System Understanding the Integrated Report’s Waterbody Classification System
Category 1 : The waterbody meets all applicable water quality standards and is therefore unimpaired for all of its designated uses 52.
Category 2 : The waterbody is unimpaired for a given designated use but has not been tested for or had been found to not meet the water quality standards for at least one other designated use53.
Category 3 : There is insufficient data to assign a waterbody an impairment level for a given designated use. In this report, such situations are indicated as “not assessed .”
A lack of data does not mean a waterbody is unimpaired for a given designated use.
Category 4 : The waterbody is impaired for a designated use, but does not require development of a TMDL as an impairment management plan. This can be for one of three reasons:
4A: A TMDL has already been approved for the site.
4B: Pollution control requirements other than a TMDL are anticipated to result in the waterbody meeting the water quality standards for all designated uses “in a reasonable period of time54.”
4C: The impairment is not caused by a pollutant.
A TMDL (Total Maximum Daily Load) is a pollution management plan that involves calculating the maximum amount of a pollutant a waterbody can receive and still meet
water quality standards.
Category 5 : The waterbody is impaired for a designated use and requires the development of a TMDL as a population management plan.
5A: The waterbody is impaired or threatened for a given designated use, based on data other than fish tissue contamination, such as a study of the abundance and diversity of aquatic species in the waterbody in question.
5B: The waterbody is impaired for a given designated use, based on findings of contaminant concentrations of >0.3 mg/kg mercury and/or >0.02 mg/kg PCB contamination in fish tissue.
52 Indiana Department of Environmental Management. “Impaired Waters - Integrated Report.” [Online] available at http://www.in.gov/idem/nps/2348.htm. Last accessed 25 Jan 2011. 53 Indiana Department of Environmental Management. “Integrated Water Monitoring and Assessment Report: 2008.” [Online] available at http://www.in.gov/idem/nps/2639.htm. Last accessed 28 Oct 2011. 43. 54 Indiana Department of Environmental Management. “Impaired Waters - Integrated Report.” [Online] available at http://www.in.gov/idem/nps/2348.htm. Last accessed 25 Jan 2011.

For additional background about Indiana’s Integrated Water Monitoring and Assessment Report, please see Water Basics: Monitoring and Major Assessment Reports. For a detailed explanation of the impairment level designations used by IDEM, visit IDEM’s Consolidated List classification overview.
Streams
Support for Designated Uses
Indiana’s 2008 Integrated Water Monitoring and Assessment Report contains many data gaps. Also, interpretation of the data that is available for local streams requires a nuanced take because IDEM samples certain streams in multiple locations and each location may yield different test results. However, patterns do emerge. Of those locations that were assessed for 2008, all Bloomington area streams except the South Fork of Griffy Creek were deemed as fully supportive of aquatic life. Bank erosion and high levels of sediment loading is a general concern. Of streams accessed for their ability to support fish consumption by humans, all but the North Fork of Salt Creek were found to be impaired (note: the Indiana State Department of Health advised citizens to not eat more than one carp over 23 inches in length per week from North Fork Salt Creek, due to mercury contamination, and to eat no fish from Salt Creek south of Clear Creek55). Of streams accessed for their ability to support recreational use, all but Salt Creek were found to be impaired. Finally, no streams in the Bloomington area are tapped as a source of public drinking water, so the ability of streams to support drinking water supply was not studied. Contaminants of Concern A variety of parameters of concern exist for Bloomington’s streams. Improperly maintained septic systems are an ongoing concern in the Bloomington area because they can contribute to E. coli contamination in local streams. In 2008, the Bloomington area streams found to have E. coli contamination were Clear Creek and the South Fork of Griffy Creek. PCB contamination was found in Beanblossom Creek, Clear Creek, the South Fork of Griffy Creek, and Bucky Creek/Muddy Fork. Mercury contamination has been detected in Clear Creek, the South Fork of Griffy Creek, Jackson Creek, and Little Clear Creek. Much of the contamination is likely conveyed to Bloomington’s streams in the form of polluted stormwater runoff. Featured Streams
55 Indiana State Department of Health. “2010 Indiana Fish Consumption Advisory Complete Report.” [Online] available at http://www.in.gov/isdh/23650.htm. Last accessed 28 Oct 2011.
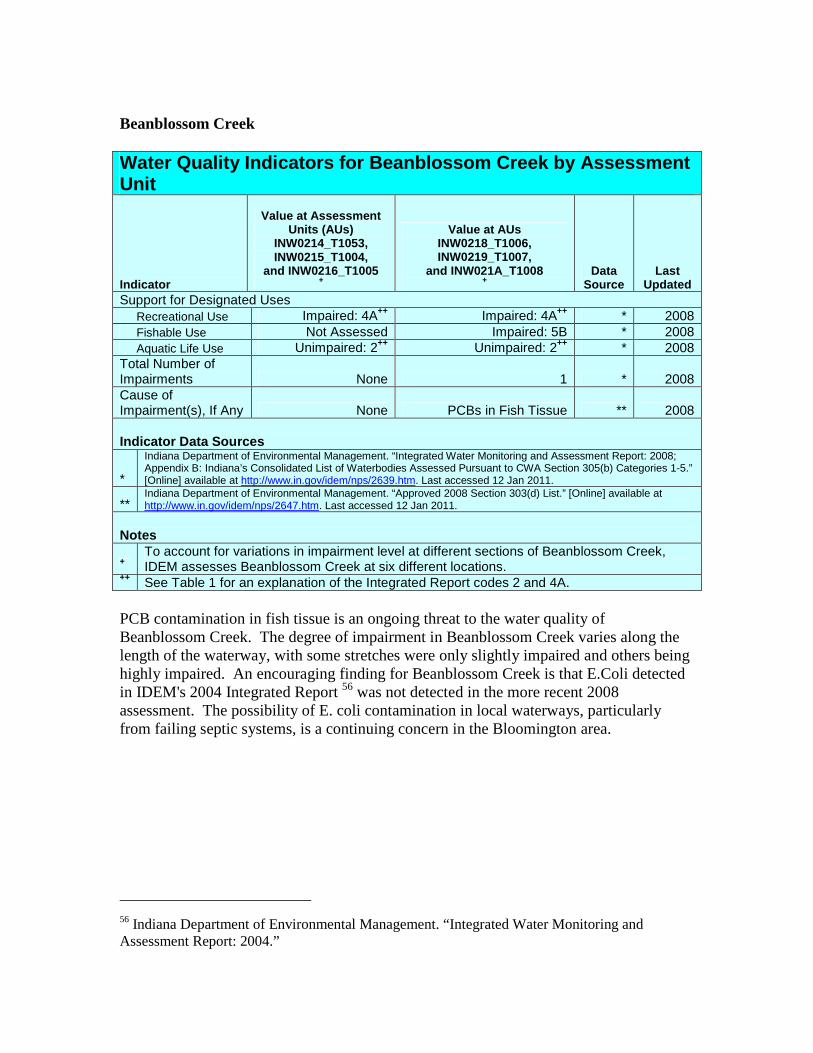
Beanblossom Creek
Water Quality Indicators for Beanblossom Creek by A ssessment Unit
Indicator
Value at Assessment Units (AUs)
INW0214_T1053, INW0215_T1004,
and INW0216_T1005 +
Value at AUs INW0218_T1006, INW0219_T1007,
and INW021A_T1008 +
Data Source
Last Updated
Support for Designated Uses Recreational Use Impaired: 4A++ Impaired: 4A++ * 2008 Fishable Use Not Assessed Impaired: 5B * 2008 Aquatic Life Use Unimpaired: 2++ Unimpaired: 2++ * 2008 Total Number of Impairments None 1 * 2008 Cause of Impairment(s), If Any None PCBs in Fish Tissue ** 2008 Indicator Data Sources
*
Indiana Department of Environmental Management. “Integrated Water Monitoring and Assessment Report: 2008; Appendix B: Indiana’s Consolidated List of Waterbodies Assessed Pursuant to CWA Section 305(b) Categories 1-5.” [Online] available at http://www.in.gov/idem/nps/2639.htm. Last accessed 12 Jan 2011.
** Indiana Department of Environmental Management. “Approved 2008 Section 303(d) List.” [Online] available at http://www.in.gov/idem/nps/2647.htm. Last accessed 12 Jan 2011.
Notes
+ To account for variations in impairment level at different sections of Beanblossom Creek, IDEM assesses Beanblossom Creek at six different locations.
++ See Table 1 for an explanation of the Integrated Report codes 2 and 4A.
PCB contamination in fish tissue is an ongoing threat to the water quality of Beanblossom Creek. The degree of impairment in Beanblossom Creek varies along the length of the waterway, with some stretches were only slightly impaired and others being highly impaired. An encouraging finding for Beanblossom Creek is that E.Coli detected in IDEM's 2004 Integrated Report 56 was not detected in the more recent 2008 assessment. The possibility of E. coli contamination in local waterways, particularly from failing septic systems, is a continuing concern in the Bloomington area.
56 Indiana Department of Environmental Management. “Integrated Water Monitoring and Assessment Report: 2004.”

Clear Creek Water Quality Indicators for Clear Creek by Assessm ent Unit
Indicator
Value at Assessment
Unit (AU) INW0891_T1020+
Value at AU INW0892_T1021+
Value at AU INW0893_T1022+
Data Source
Last Updated
Support for Designated Uses Recreational Use Not Assessed Not Assessed Impaired: 5A * 2008 Fishable Use Not Assessed Impaired: 5B Impaired: 5B * 2008 Aquatic Life Use Unimpaired: 2++ Not Assessed Unimpaired: 2++ * 2008 Total Number of Impairments None 1 3 * 2008
Cause of Impairment(s), If Any None
PCBs in Fish Tissue
E. coli, Mercury in Fish Tissue,
PCBs in Fish Tissue *; ** 2008
Indicator Data Sources
*
Indiana Department of Environmental Management. “Integrated Water Monitoring and Assessment Report: 2008; Appendix B: Indiana’s Consolidated List of Waterbodies Assessed Pursuant to CWA Section 305(b) Categories 1-5.” [Online] available at http://www.in.gov/idem/nps/2639.htm. Last accessed 12 Jan 2011.
** Indiana Department of Environmental Management. “Approved 2008 Section 303(d) List.” [Online] available at http://www.in.gov/idem/nps/2647.htm. Last accessed 12 Jan 2011.
Notes
+ To account for variations in impairment level at different sections of Clear Creek, IDEM assesses Clear Creek at three different locations.
++ See Table 1 for an explanation of the Integrated Report code 2.
Riparian habitat damage, sedimentation, excess nutrients and algae, toxic substances, and sewage-related problems contribute to severe habitat degradation in some stretches of Clear Creek57. In Indiana’s most recent Integrated Water Monitoring and Assessment Report, Clear Creek was in multiple locations not assessed for its ability to support certain designated uses. However, the data that is available shows that certain stretches of Clear Creek are impaired by contamination from E. coli, mercury, and PCBs. These findings are consistent with the history of Clear Creek, which has consistently been described as impaired by the presence of toxic contaminants58.
As discussed in the PCBs portion of the BEQI waste section and the Environmental Commission’s Toxics Report, Clear Creek became contaminated with PCBs during the 1960s and 1970s when the Winston-Thomas sewage treatment plant (which discharged into Clear Creek) received contaminated wastewater from the Westinghouse Electric
57 Commonwealth Biomonitoring. 1997. Bloomington/Monroe County Urban Nonpoint Source Water Pollution Assessment Project.
58 U.S. Environmental Protection Agency. “Indiana Assessment Data. Assessed Waters of Indiana by Watershed.” Available [online] at http://iaspub.epa.gov/waters10/attains_state.report_control?p_state=IN&p_cycle=2010&p_report_type=A. Last accessed 31 January 2012. 2002, 2004, 2006, 2008, and 2010.

Corporation plant59. Westinghouse used PCBs in the manufacturing of electrical capacitors. Bloomington residents are advised not to consume any fish from Clear Creek60 due to PCB contamination.
Clear Creek is also impacted in Bloomington by the Dillman Road Wastewater Treatment Plant, which discharges treated wastewater into the stream. Dillman Road adheres to strict standards regarding the chemical composition of its effluent and monitors the water quality of Clear Creek at their discharge location. As is true of any discharge, however, the effluent from Clear Creek does locally impact Clear Creek’s water chemistry. Annual sampling of Clear Creek by limonology graduate students in Indiana University’s School of Public and Environmental Affairs (IU SPEA)61 indicates that just downstream of Dillman Road is where the stream has the highest water temperature and lowest dissolved oxygen content of any Clear Creek site sampled. However, both parameters soon return to upstream site levels, suggesting that Dillman Road is successfully managing their effluent in such a way as to have minimal impact on the receiving stream. A similar temporary peak in nitrate levels occurs in Clear Creek just downstream of Dillman Road. Downstream nitrate levels were not found to return all the way down to those found upstream of Dillman Road.
Griffy Creek (and South Fork Griffy Creek)
Water Quality Indicators for Griffy Creek Indicator
Griffy Creek Value
South Fork Griffy Creek Value
Data Source
Last Updated
Support for Designated Uses Recreational Use Not Assessed Not Assessed * 2008 Fishable Use Not Assessed Not Assessed * 2008
Aquatic Life Use Unimpaired: 2 (See Table 1) Impaired: 5A * 2008
Total Number of Impairments None 1 * 2008
Cause of Impairment(s), If Any None
Impaired Biological Communities; Mercury
and PCBs in Fish Tissue; E.Coli * 2008
Indicator Data Source * Indiana Department of Environmental Management. “Integrated Water Monitoring and Assessment Report: 2008;
59 The City of Bloomington Environmental Commission Toxics Committee. “Toxics Report for Bloomington, Indiana: Releases, Remediation, Inventory, and Recommendations.” Available [online] at http://bloomington.in.gov/media/media/application/pdf/5162.pdf. Last accessed 27 January 2012. September 2011. 8. 60 Indiana State Department of Health. “2010 Indiana Fish Consumption Advisory Complete Report.” [Online] available at http://www.in.gov/isdh/23650.htm. Last accessed 28 Oct 2011. 61 Jones, William and Mellissa Clark. Laboratory results from Indiana University’s E455 Limnology course. 2011.
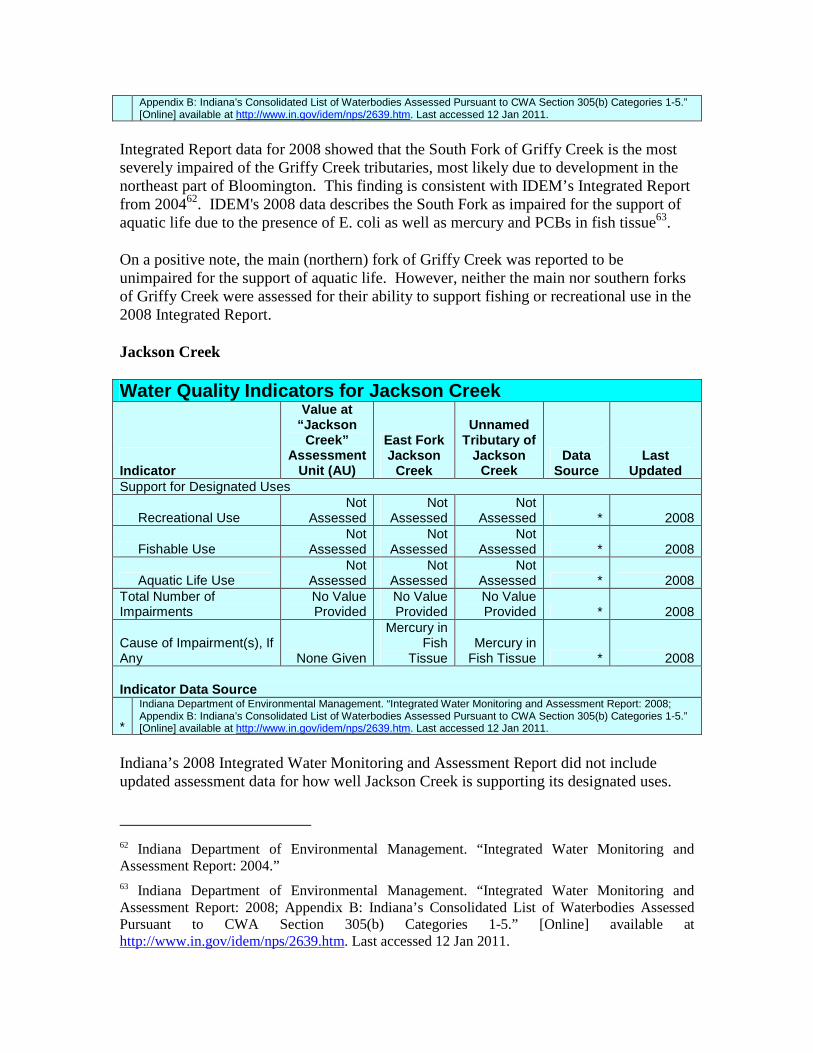
Appendix B: Indiana’s Consolidated List of Waterbodies Assessed Pursuant to CWA Section 305(b) Categories 1-5.” [Online] available at http://www.in.gov/idem/nps/2639.htm. Last accessed 12 Jan 2011.
Integrated Report data for 2008 showed that the South Fork of Griffy Creek is the most severely impaired of the Griffy Creek tributaries, most likely due to development in the northeast part of Bloomington. This finding is consistent with IDEM’s Integrated Report from 200462. IDEM's 2008 data describes the South Fork as impaired for the support of aquatic life due to the presence of E. coli as well as mercury and PCBs in fish tissue63.
On a positive note, the main (northern) fork of Griffy Creek was reported to be unimpaired for the support of aquatic life. However, neither the main nor southern forks of Griffy Creek were assessed for their ability to support fishing or recreational use in the 2008 Integrated Report.
Jackson Creek Water Quality Indicators for Jackson Creek
Indicator
Value at “Jackson
Creek” Assessment
Unit (AU)
East Fork Jackson
Creek
Unnamed Tributary of
Jackson Creek
Data Source
Last Updated
Support for Designated Uses
Recreational Use Not
Assessed Not
Assessed Not
Assessed * 2008
Fishable Use Not
Assessed Not
Assessed Not
Assessed * 2008
Aquatic Life Use Not
Assessed Not
Assessed Not
Assessed * 2008 Total Number of Impairments
No Value Provided
No Value Provided
No Value Provided * 2008
Cause of Impairment(s), If Any None Given
Mercury in Fish
Tissue Mercury in
Fish Tissue * 2008 Indicator Data Source
*
Indiana Department of Environmental Management. “Integrated Water Monitoring and Assessment Report: 2008; Appendix B: Indiana’s Consolidated List of Waterbodies Assessed Pursuant to CWA Section 305(b) Categories 1-5.” [Online] available at http://www.in.gov/idem/nps/2639.htm. Last accessed 12 Jan 2011.
Indiana’s 2008 Integrated Water Monitoring and Assessment Report did not include updated assessment data for how well Jackson Creek is supporting its designated uses.
62 Indiana Department of Environmental Management. “Integrated Water Monitoring and Assessment Report: 2004.”
63 Indiana Department of Environmental Management. “Integrated Water Monitoring and Assessment Report: 2008; Appendix B: Indiana’s Consolidated List of Waterbodies Assessed Pursuant to CWA Section 305(b) Categories 1-5.” [Online] available at http://www.in.gov/idem/nps/2639.htm. Last accessed 12 Jan 2011.

However, mercury was detected in the tissue of fish from the assessment units of “east fork Jackson Creek” and “unnamed tributary of Jackson Creek.64”
Stout Creek
Water Quality Indicators for Stout Creek Indicator Value Data Source Last Updated Support for Designated Uses Recreational Use Not Assessed * 2008 Fishable Use Not Assessed * 2008 Aquatic Life Use Unimpaired: 2+ * 2008 Total Number of Impairments None * 2008 Cause of Impairment(s), If Any None * 2008 Indicator Data Source
*
Indiana Department of Environmental Management. “Integrated Water Monitoring and Assessment Report: 2008; Appendix B: Indiana’s Consolidated List of Waterbodies Assessed Pursuant to CWA Section 305(b) Categories 1-5.” [Online] available at http://www.in.gov/idem/nps/2639.htm. Last accessed 12 Jan 2011.
Notes + See Table 1 for an explanation of the Integrated Report code 2.
Stout Creek is located north of Bloomington. Indiana’s 2008 Integrated Water Monitoring and Assessment Report indicates that the Creek fully supports (i.e., is unimpaired for) the designated use of supporting aquatic life65.
However, Stout Creek has historically been a site of mercury66 and PCB contamination67. Updated data was not included in the Integrated Report for designated uses other than the support of aquatic life. Cleanup of the source of PCBs in Stout Creek, Bennett's Dump, has yet to be completed68.
Other Local Streams
64 Indiana Department of Environmental Management. “Integrated Water Monitoring and Assessment Report: 2008; Appendix B: Indiana’s Consolidated List of Waterbodies Assessed Pursuant to CWA Section 305(b) Categories 1-5.” [Online] available at http://www.in.gov/idem/nps/2639.htm. Last accessed 12 Jan 2011. 65 Ibid. 66 Indiana Department of Environmental Management. “Integrated Water Monitoring and Assessment Report: 2004.”
67 The City of Bloomington Environmental Commission Toxics Committee. “Toxics Report for Bloomington, Indiana: Releases, Remediation, Inventory, and Recommendations.” Available [online] at http://bloomington.in.gov/media/media/application/pdf/5162.pdf. Last accessed 27 January 2012. September 2011. 9.
68 Ibid.

Water Quality Indicators for other Local Streams
Stream Name 305(b) Support Level Value by Designated Use +++
Total Number of
Impairments
Cause of Impairment(s),
If Any
Data Source
Late Updated
Recreational Use
Fishable Use
Aquatic Life Use
Buck Creek / Muddy Fork
Impaired: 5A Not
Assessed Unimpaired:
2++ No Value Provided
PCBs in Fish Tissue
* 2008
Ramp Creek Not
Assessed Not
Assessed Not
Assessed No Value Provided
None Given * 2008
Little Clear Creek
Unimpaired: 2++
Impaired: 5B
Unimpaired: 2++ 1
Mercury in Fish Tissue *;** 2008
Saddle Creek Not
Assessed Not
Assessed Not
Assessed No Value Provided None Given *
2008
Moore Creek Not
Assessed Not
Assessed Not
Assessed No Value Provided
None Given * 2008
Jacks Defeat Creek
Impaired: 4A++
Not Assessed
Unimpaired: 2++ 0 None * 2008
North Fork Salt Creek
Not Assessed
Unimpaired: 2++
Unimpaired: 2++ 0 None * 2008
Salt Creek+ Unimpaired: 2++
Not Assessed
Unimpaired: 2++ 0 None *
2008 Indicator Data Source
*
Indiana Department of Environmental Management. “Integrated Water Monitoring and Assessment Report: 2008; Appendix B: Indiana’s Consolidated List of Waterbodies Assessed Pursuant to CWA Section 305(b) Categories 1-5.” [Online] available at http://www.in.gov/idem/nps/2639.htm. Last accessed 12 Jan 2011.
** Indiana Department of Environmental Management. “Approved 2008 Section 303(d) List.” [Online] available at http://www.in.gov/idem/nps/2647.htm. Last accessed 12 Jan 2011.
Notes
+ Clear Creek is divided into two assessment units (INW0886_T1026 & INW0893_T1025). For 2008, the indicator values for both AUs were are same.
++ See Table 1 for an explanation of the Integrated Report codes 2 and 4A. +++ None of the streams listed on this chart have drinking water as a designated use.
In IDEM’s 2008 Integrated Report69 the ability of many streams to support a certain designated use was not accessed. Among those that were assessed, contaminants of concern include PCBs in the Muddy Fork/Buck Creek area as well as mercury in Little Clear Creek. Information about other streams located further from Bloomington than those in listed in the tables in this section of the report, but still located in Monroe County, can be found in appendix B of Indiana’s Integrated Report.
69 Indiana Department of Environmental Management. “Integrated Water Monitoring and Assessment Report: 2008.” [Online] available at http://www.in.gov/idem/nps/2639.htm. Last accessed 12 Jan 2011.
Discussion
Riparian habitat restoration would improve the water quality of local streams by reducing pollutant and sediment inflows. Implementation of stormwater management techniques and strict adherence to erosion control measures in construction sites could also reduce the flow of pollutants into Bloomington’s streams. In addition to restoring natural ecosystems, improved riparian habitats could also enhance the outdoor recreation opportunities available in Bloomington.
Education and community cooperation are required to reverse urban stream degradation within the City. Bloomington residents can play an important part in protecting the region's water resources by supporting zoning regulations that protect water quality, maintaining septic systems, and otherwise avoiding actions that contribute to sedimentation or other forms of water pollution.
Lakes
Support for Designated Uses
Unfortunately, the ability of Bloomington’s lakes to support aquatic life and recreational use was not assessed in Indiana’s 2008 305(b) Integrated Water Monitoring and Assessment Report. Griffy Lake, Lake Lemon, and Lake Monroe were each found to be impaired for fishable use due to mercury contamination. As the only of the three lakes currently used as a source of drinking water, only Lake Monroe was assessed for drinking water use.
Contaminants of Concern
Mercury contamination in fish tissue is a concern for Lakes Griffy, Lemon and Monroe70. Detectable levels of PCB contamination in fish were not found in any of these three lakes in Indiana’s 2008 305(b) Integrated Water Monitoring and Assessment Report, though PCBs were detected in certain local streams71. In addition to mercury contamination, the Integrated Report states that Lake Monroe’s has poor taste and odor issues and is impaired by high levels of algal production72. Finally, like most lakes, Bloomington’s reservoirs remain at risk for having biological communities disrupted by the presence of non-native invasive species.
70 Ibid. 71 Indiana Department of Environmental Management. “Integrated Water Monitoring and Assessment Report: 2008.” [Online] available at http://www.in.gov/idem/nps/2639.htm. Last accessed 12 Jan 2011.
72 Indiana Department of Environmental Management. “Approved 2008 Section 303(d) List.” [Online] available at http://www.in.gov/idem/nps/2647.htm. Last accessed 12 Jan 2011.
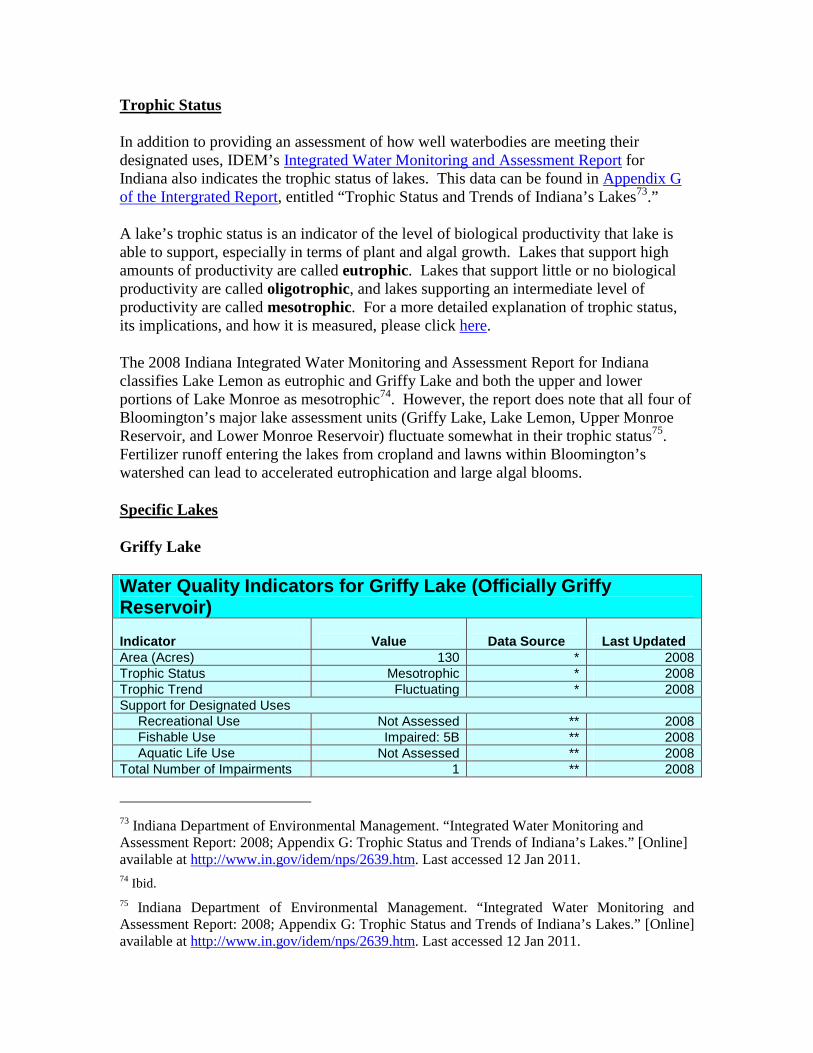
Trophic Status
In addition to providing an assessment of how well waterbodies are meeting their designated uses, IDEM’s Integrated Water Monitoring and Assessment Report for Indiana also indicates the trophic status of lakes. This data can be found in Appendix G of the Intergrated Report, entitled “Trophic Status and Trends of Indiana’s Lakes73.”
A lake’s trophic status is an indicator of the level of biological productivity that lake is able to support, especially in terms of plant and algal growth. Lakes that support high amounts of productivity are called eutrophic. Lakes that support little or no biological productivity are called oligotrophic, and lakes supporting an intermediate level of productivity are called mesotrophic. For a more detailed explanation of trophic status, its implications, and how it is measured, please click here.
The 2008 Indiana Integrated Water Monitoring and Assessment Report for Indiana classifies Lake Lemon as eutrophic and Griffy Lake and both the upper and lower portions of Lake Monroe as mesotrophic74. However, the report does note that all four of Bloomington’s major lake assessment units (Griffy Lake, Lake Lemon, Upper Monroe Reservoir, and Lower Monroe Reservoir) fluctuate somewhat in their trophic status75. Fertilizer runoff entering the lakes from cropland and lawns within Bloomington’s watershed can lead to accelerated eutrophication and large algal blooms.
Specific Lakes
Griffy Lake
Water Quality Indicators for Griffy Lake (Officiall y Griffy Reservoir) Indicator Value Data Source Last Updated Area (Acres) 130 * 2008 Trophic Status Mesotrophic * 2008 Trophic Trend Fluctuating * 2008 Support for Designated Uses Recreational Use Not Assessed ** 2008 Fishable Use Impaired: 5B ** 2008 Aquatic Life Use Not Assessed ** 2008 Total Number of Impairments 1 ** 2008
73 Indiana Department of Environmental Management. “Integrated Water Monitoring and Assessment Report: 2008; Appendix G: Trophic Status and Trends of Indiana’s Lakes.” [Online] available at http://www.in.gov/idem/nps/2639.htm. Last accessed 12 Jan 2011. 74 Ibid.
75 Indiana Department of Environmental Management. “Integrated Water Monitoring and Assessment Report: 2008; Appendix G: Trophic Status and Trends of Indiana’s Lakes.” [Online] available at http://www.in.gov/idem/nps/2639.htm. Last accessed 12 Jan 2011.

Cause of Impairment(s), If Any Mercury in Fish Tissue ** 2008 Indicator Data Sources
*
Indiana Department of Environmental Management. “Integrated Water Monitoring and Assessment Report: 2008; Appendix G: Trophic Status and Trends of Indiana’s Lakes.” [Online] available at http://www.in.gov/idem/nps/2639.htm. Last accessed 12 Jan 2011.
**
Indiana Department of Environmental Management. “Integrated Water Monitoring and Assessment Report: 2008; Appendix B: Indiana’s Consolidated List of Waterbodies Assessed Pursuant to CWA Section 305(b) Categories 1-5.” [Online] available at http://www.in.gov/idem/nps/2639.htm. Last accessed 12 Jan 2011.
I. Background: Griffy Lake, situated in Griffy Lake Nature Preserve, is a unique resource for the Bloomington community because of its proximity to downtown. Affording recreational opportunities from hiking, canoeing, and fishing to just having a picnic with friends, Griffy Lake offers everyone in Bloomington a chance to get out and enjoy nature. Recent exciting news for the lake includes the City’s receiving of a $1.5 million grant to repair Griffy Lake’s dam. This project, starting in July 2012, will allow for greater control of lake levels and improve the quality of Lake Griffy as boating destination76. II. Current conditions and concerns: Griffy Lake's trophic status has shifted from eutrophic in the 1970s (Trophic State Index scores of 45-75) to mesotrophic (TSI scores of 40 to 50) in the 1990s77. These scores correspond with a tenfold reduction in phosphorus levels in Griffy Lake between the 1970s and 1990s78. The reduction in phosphorus loading has reduced algal bloom problems in Griffy Lake79.
However, while some aspects of water quality have improved, invasive species management, deforestation and development in the surrounding watershed, and increased sediment loading remain significant challenges80. Additionally, IDEM lists Griffy Lake impaired due to mercury contamination in fish tissue81,82. The Department of Health
76 Cotter, Steve. (Natural Resources Manager, City of Bloomington Parks and Recreation Department). Personal communication. 23 March 2012.
77 Commonwealth Biomonitoring. “Griffy Lake Watershed GIS Mapping and Management Plan.” Prepared for the City of Bloomington, Indiana Planning Department. 2000. Available [online] at http://www.biomonitor.com/images/GRIFFY.PDF. Last accessed 10 February 2012. 50.
78 Ibid. 79 Cotter, Steve. (Natural Resources Manager, City of Bloomington Parks and Recreation Department). Personal communication. 23 March 2012.
80 Ibid. 81 Indiana Department of Environmental Management. “Integrated Water Monitoring and Assessment Report: 2008; Appendix B: Indiana’s Consolidated List of Waterbodies Assessed Pursuant to CWA Section 305(b) Categories 1-5.” [Online] available at http://www.in.gov/idem/nps/2639.htm. Last accessed 12 Jan 2011. 82 Indiana Department of Environmental Management. “Approved 2008 Section 303(d) List.” [Online] available at http://www.in.gov/idem/nps/2647.htm. Last accessed 12 Jan 2011.

warns residents that meals including largemouth bass larger than 13 inches caught at Griffy Lake should be limited to one per month83. Invasive aquatic plants are a severe problem in Griffy Lake84. Eurasian watermilfoil and curlyleaf pondweed have inhabited Griffy Lake for over 20 years85, but Brazilian elodea is a relative newcomer, having first been identified in 199986.
As mentioned, sedimentation rates into Griffy Lake also continue to be a point of concern. At the mouth of Griffy Creek, a large sediment delta and marshy area continues to expand. Erosion from construction sites and other unprotected areas, along with decreasing forest cover in the middle and south forks of Griffy Creek, are probably responsible. In 2004, sampling of the middle and south forks showed sediment levels considerably higher than those in the relatively pristine north fork87. There are also concerns regarding the chemical content of the sediments in Griffy Lake. Analysis of Griffy Lake sediment has also found arsenic at levels that exceed IDEM guidelines, with the highest detected concentration of arsenic in the lake’s sediments being 19 mg/kg 88.
III. Management of Invasive Plant Species:
Eurasian watermilfoil is a very common invasive aquatic species in Indiana. Eurasian watermilfoil is problematic because it forms dense mats of vegetation just under the water’s surface that clog boat motors and industrial equipment89, and shade out lower portions of the lake. The shading effect of Eurasian Milfoil prevents other plants from receiving sunlight and thus reduces the area of useful habitat in the lake90. For a guide on how to distinguish between invasive Eurasian watermilfoil and the beneficial native Northern watermilfoil, read the fact sheet from the Wisconsin DNR.
83 Indiana State Department of Health. “2010 Indiana Fish Consumption Advisory Complete Report.” [Online] available at http://www.in.gov/isdh/23650.htm. Last accessed 28 Oct 2011. 84 Aquatic Control, Inc. “Griffy Lake Aquatic Vegetation Management Plan 2008 Update - Draft.” Prepared for: Indiana Department of Natural Resources. 2008. 85 Aquatic Control, Inc. “Griffy Lake Aquatic Vegetation Management Plan 2008 Update - Draft.” Prepared for: Indiana Department of Natural Resources. 2008. 1.
86 Cotter, Steve. (Natural Resources Manager, City of Bloomington Parks and Recreation Department). Personal communication. 23 March 2012.
87 Cotter, Steve and William Jones. Data from Griffy Lake Sedimentation Survey. 2004.
88 Fields Environmental, LLC. “Griffy Lake Limited Sediment Characterization
Investigation (Addendum): Griffy Reservoir, Bloomington, IN.” 24 February, 2012.
89 Wisconsin Department of Natural Resources. “Eurasian Water Milfoil (Myriophyllum spicatum).” [Online] available at http://dnr.wi.gov/invasives/fact/milfoil.htm. Last accessed 13 Jan 2011. 90 Wisconsin Department of Natural Resources. “The Facts… On Eurasian Milfoil.” [Online] available at http://dnr.wi.gov/invasives/publications/pdfs/EWMbrochure.pdf. Last accessed 13 Jan 2011.

Curlyleaf pondweed is most abundant during the spring91, at which time thick patches can interfere with boating and other forms of recreation. Later in the season, the release of nutrients by decaying curlyleaf pondweed can contribute to summer algal blooms92. Long-term plans are needed to control curlyleaf pondweed is necessary because the plant reproduces primarily via turions, or fleshy propugules. Curlyleaf pondweed turions are not affected by herbicides, can overwinter in lake sediments, and remain viable for several years93.
Water Quality Threat: Invasive Aquatic Plants Help prevent the spread of invasive plants in the Bloomington area by… 1. Keeping personal watercraft and boat trailers clean of plant debris, which can be
transferred between waterbodies. 2. Not dumping the contents of aquariums into the environment. Many popular
aquarium species are highly invasive. 3. Disposing of old aquariums properly. The City of Bloomington Animal Shelter
accepts donations of aquarium for reuse or recycling. For more information on this topic, including how to responsibly dispose of unwanted pet fish, please refer to the BEQI frequently asked questions page.
Brazilian elodea was first discovered in Lake Griffy in 1990 during a study conducted to help control the lake’s infestation with Eurasian watermilfoil94. It is believed that this was the first confirmed case of Brazilian elodea's presence in Indiana95. Brazilian elodea is problematic because it is very durable and small cuttings can easily propagate. This hardiness makes Brazilian elodea a popular plant for aquariums but also enables Brazilian elodea to outcompete native vegetation and negatively impact fish communities.
Upon the discovery of Brazilian elodea in Griffy Lake, its presence was reported to the Indiana Department of Natural Resources. The DNR and the City of Bloomington were both anxious to eliminate the plant from Griffy Lake because it could easily spread to other waterbodies by hitchhiking on boating equipment. Waiting to control Brazilian elodea could therefore have potentially cost taxpayers far more in remediation funds than if an aggressive management plan had not been undertaken while the problem was still confined to Griffy Lake.
91 Indiana Department of Natural Resources. “Aquatic Invasive Species: Curlyleaf Pondweed.” Available [online] at http://www.in.gov/dnr/files/CURLYLEAF_PONDWEED.pdf. Last accessed 10 February 2012.
92 Ibid. 93 Aquatic Control, Inc. “Griffy Lake Aquatic Vegetation Management Plan 2008 Update - Draft.” Prepared for: Indiana Department of Natural Resources. 2008. 21.
94 Cotter, Steve. (Natural Resources Manager, City of Bloomington Parks and Recreation Department). Personal communication. 23 March 2012.
95 Aquatic Control, Inc. “Griffy Lake Aquatic Vegetation Management Plan 2008 Update - Draft.” Prepared for: Indiana Department of Natural Resources. 2008. 1.
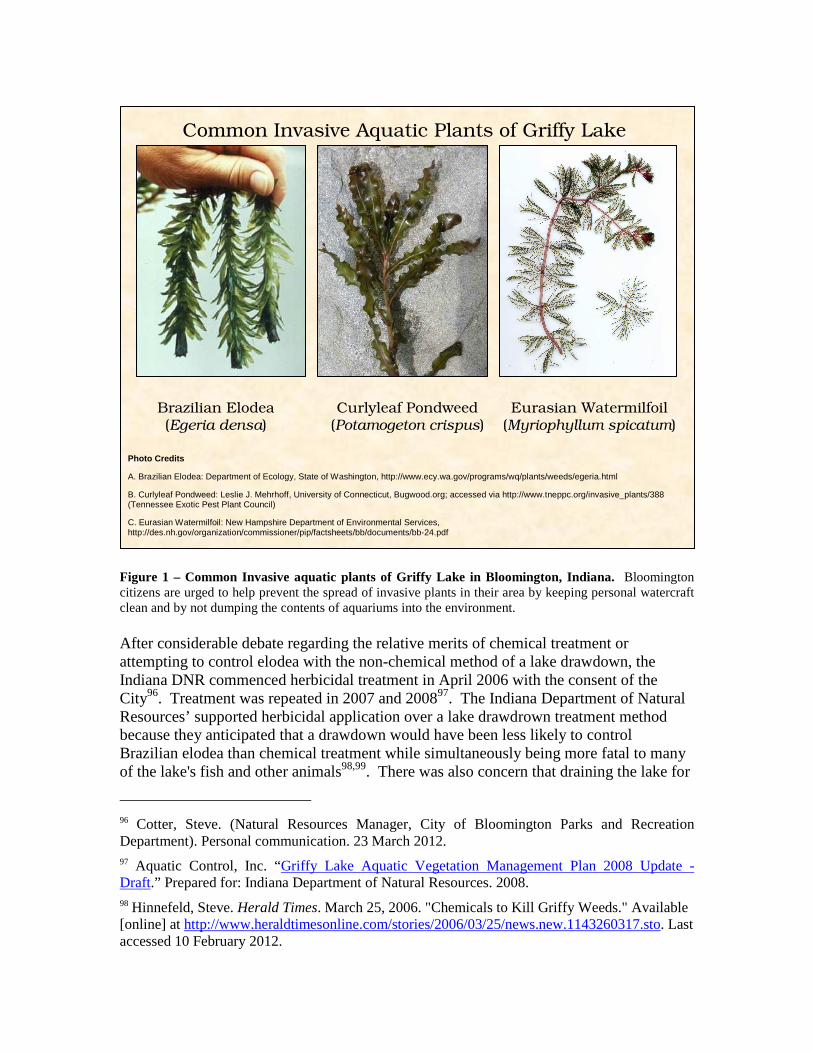
Figure 1 – Common Invasive aquatic plants of Griffy Lake in Bloomington, Indiana. Bloomington citizens are urged to help prevent the spread of invasive plants in their area by keeping personal watercraft clean and by not dumping the contents of aquariums into the environment.
After considerable debate regarding the relative merits of chemical treatment or attempting to control elodea with the non-chemical method of a lake drawdown, the Indiana DNR commenced herbicidal treatment in April 2006 with the consent of the City96. Treatment was repeated in 2007 and 200897. The Indiana Department of Natural Resources’ supported herbicidal application over a lake drawdrown treatment method because they anticipated that a drawdown would have been less likely to control Brazilian elodea than chemical treatment while simultaneously being more fatal to many of the lake's fish and other animals98,99. There was also concern that draining the lake for
96 Cotter, Steve. (Natural Resources Manager, City of Bloomington Parks and Recreation Department). Personal communication. 23 March 2012.
97 Aquatic Control, Inc. “Griffy Lake Aquatic Vegetation Management Plan 2008 Update - Draft.” Prepared for: Indiana Department of Natural Resources. 2008. 98 Hinnefeld, Steve. Herald Times. March 25, 2006. "Chemicals to Kill Griffy Weeds." Available [online] at http://www.heraldtimesonline.com/stories/2006/03/25/news.new.1143260317.sto. Last accessed 10 February 2012.
Common Invasive Aquatic Plants of Griffy Lake
Brazilian Elodea (Egeria densa)
Eurasian Watermilfoil (Myriophyllum spicatum)
Curlyleaf Pondweed (Potamogeton crispus)
Photo Credits
A. Brazilian Elodea: Department of Ecology, State of Washington, http://www.ecy.wa.gov/programs/wq/plants/weeds/egeria.html
B. Curlyleaf Pondweed: Leslie J. Mehrhoff, University of Connecticut, Bugwood.org; accessed via http://www.tneppc.org/invasive_plants/388 (Tennessee Exotic Pest Plant Council)
C. Eurasian Watermilfoil: New Hampshire Department of Environmental Services, http://des.nh.gov/organization/commissioner/pip/factsheets/bb/documents/bb-24.pdf

a drawdown would have flushed Brazilian elodea into downstream areas and caused the infestation problem to spread100.
The DNR reports that herbicidal treatment has been highly successful in reducing the population of invasive plants in Lake Griffy101. Brazilian elodea has not been found in Lake Griffy since 2008102. Yet although the control of Brazilian elodea is an important success story for Bloomington, the City’s Parks and Recreation Department implores citizens to avoid the need for further invasive species removal projects by never dumping their aquariums in local lakes again103.
Lake Lemon
Water Quality Indicators for Lake Lemon Indicator Value Data Source Last Updated Area (Acres) 1650 * 2008 Trophic Status Eutrophic * 2008 Trophic Trend Fluctuating * 2008 Support for Designated Uses Recreational Use Not Assessed ** 2008 Fishable Use Impaired: 5B ** 2008 Aquatic Life Use Not Assessed ** 2008 Total Number of Impairments 1 ** 2008 Cause of Impairment(s), If Any Mercury in Fish Tissue *** 2008 Indicator Data Sources
*
Indiana Department of Environmental Management. “Integrated Water Monitoring and Assessment Report: 2008; Appendix G: Trophic Status and Trends of Indiana’s Lakes.” [Online] available at http://www.in.gov/idem/nps/2639.htm. Last accessed 12 Jan 2011.
**
Indiana Department of Environmental Management. “Integrated Water Monitoring and Assessment Report: 2008; Appendix B: Indiana’s Consolidated List of Waterbodies Assessed Pursuant to CWA Section 305(b) Categories 1-5.” [Online] available at http://www.in.gov/idem/nps/2639.htm. Last accessed 12 Jan 2011.
*** Indiana Department of Environmental Management. “Approved 2008 Section 303(d) List.” [Online] available at http://www.in.gov/idem/nps/2647.htm. Last accessed 12 Jan 2011.
99 Morin, Sarah. Herald Times. March 31, 2006. "Griffy Lake Chemical Treatment to Start." Available [online] at http://www.heraldtimesonline.com/stories/2007/04/08/news.qp-270902.sto. Last accessed 10 February 2012.
100 Cotter, Steve. (Natural Resources Manager, City of Bloomington Parks and Recreation Department). Personal communication. 23 March 2012.
101 Ibid. 102 Cotter, Steve. (Natural Resources Manager, City of Bloomington Parks and Recreation Department). Personal communication. 23 March 2012. 103 Ibid.

IDEM data for 2008 shows that mercury in fish tissue is a problem in Lake Lemon104. Additionally, concerns about PCB contamination have led the Department of Health to issue a fish consumption advisory for Lake Lemon catfish larger than 20 inches in length105. Lake Lemon’s ability to support recreational use and aquatic life was not accessed in IDEM’s most recent integrated report.
Historically high fecal coliform levels (a measure of the potential presence of pathogenic organisms such as E. coli) has been a concern at Lake Lemon. Monitoring results for 2010 indicated a substantial reduction in fecal coliform levels as compared to 2009106. Even so, the possibility of contamination from disease-causing microbes remains an ongoing threat to water quality in the Bloomington area, in part due to the high number of local residents using septic systems. Improperly maintained septic systems along Beanblossom Creek and the Lake Lemon shoreline have been identified in the past as significant sources of bacteria and nutrients to Lake Lemon107.
Data using Carlson's Trophic State Index show that Lake Lemon has historically been rated as eutrophic to hypereutrophic in its trophic state108. Compared to a group of 355 Indiana assessed between July-August 1994-2006 by the Indiana Clean Lakes Program, Lake Lemon’s chlorophyll a and nitrogen levels were higher than average but still far below the maximum value observed109. These findings reflect the high levels of algae production in Lake Lemon and are consistent with the reservoir’s eutrophic state and observed poor water clarity. The low transparency is caused by algae and suspended sediments in the water.
Sediments enter Lake Lemon primary from Beanblossom Creek, the reservoir’s primary tributary110. High sediment loads resulting from stream bank erosion of Beanblossom Creek contribute to high levels of suspended solids in the lake. In order to slow the filling in of Lake Lemon with sediment, the Lake Lemon Conservancy District is
104 Indiana Department of Environmental Management. “Approved 2008 Section 303(d) List.” Available [online] at http://www.in.gov/idem/nps/2647.htm. Last accessed 12 Jan 2011.
105 Indiana State Department of Health. “2010 Indiana Fish Consumption Advisory Complete Report.” Available [online] at http://www.in.gov/isdh/23650.htm. Last accessed 28 Oct 2011.
106 Clark, Mellissa A.L. March 2011. “Lake Lemon Monitoring Program 2010 Results.” Available [online] at http://www.lakelemon.org/wp-content/uploads/2011/05/REPORT-2010.pdf. Last accessed 3 February 2012.
107 Jones, William and Louise Clemency. “Lake Lemon Enhancement Study.” 1992. Available [online] at http://www.in.gov/dnr/fishwild/files/Lake_Lemon_Feasibility_Study-Monroe-July92.pdf. Last accessed 3 February 2012.
108 Ibid. 109 Clark, Mellissa A.L. March 2011. “Lake Lemon Monitoring Program 2010 Results.” Available [online] at http://www.lakelemon.org/wp-content/uploads/2011/05/REPORT-2010.pdf. Last accessed 3 February 2012.
110 Lake Lemon Conservancy District. “Sustainability.” Available [online] at http://www.lakelemon.org/sustainability/. Last accessed 3 February 2012.
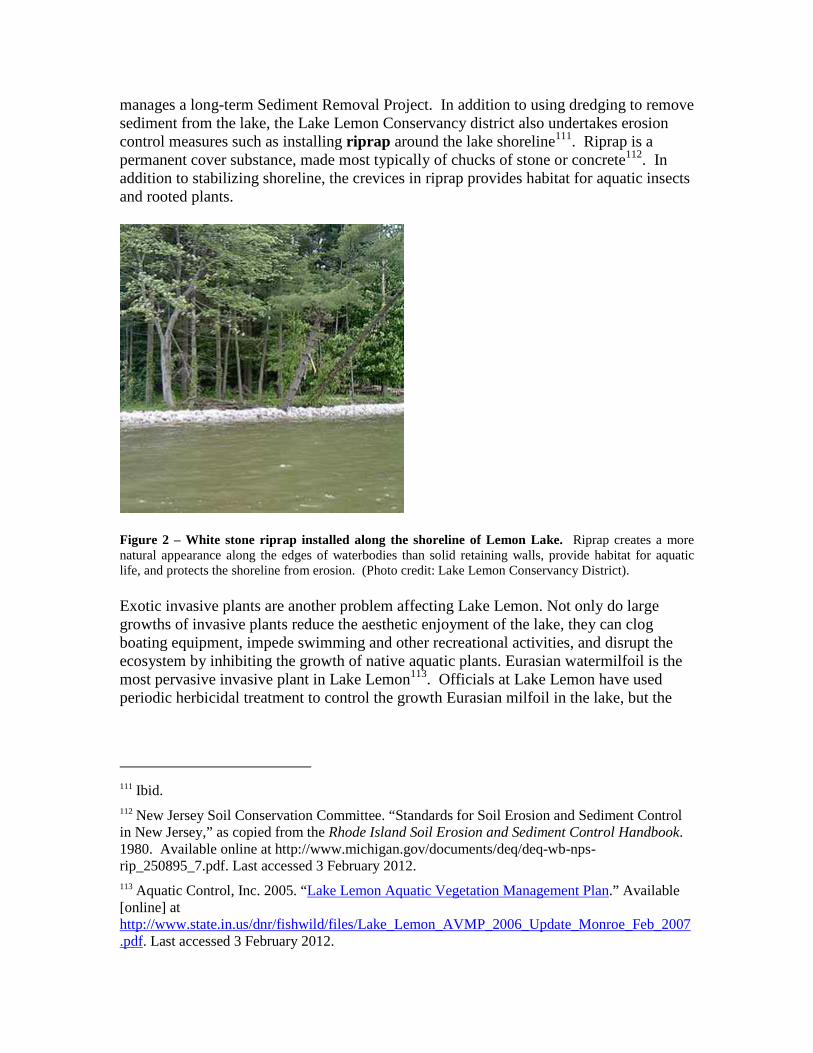
manages a long-term Sediment Removal Project. In addition to using dredging to remove sediment from the lake, the Lake Lemon Conservancy district also undertakes erosion control measures such as installing riprap around the lake shoreline111. Riprap is a permanent cover substance, made most typically of chucks of stone or concrete112. In addition to stabilizing shoreline, the crevices in riprap provides habitat for aquatic insects and rooted plants.
Figure 2 – White stone riprap installed along the shoreline of Lemon Lake. Riprap creates a more natural appearance along the edges of waterbodies than solid retaining walls, provide habitat for aquatic life, and protects the shoreline from erosion. (Photo credit: Lake Lemon Conservancy District).
Exotic invasive plants are another problem affecting Lake Lemon. Not only do large growths of invasive plants reduce the aesthetic enjoyment of the lake, they can clog boating equipment, impede swimming and other recreational activities, and disrupt the ecosystem by inhibiting the growth of native aquatic plants. Eurasian watermilfoil is the most pervasive invasive plant in Lake Lemon113. Officials at Lake Lemon have used periodic herbicidal treatment to control the growth Eurasian milfoil in the lake, but the
111 Ibid. 112 New Jersey Soil Conservation Committee. “Standards for Soil Erosion and Sediment Control in New Jersey,” as copied from the Rhode Island Soil Erosion and Sediment Control Handbook. 1980. Available online at http://www.michigan.gov/documents/deq/deq-wb-nps-rip_250895_7.pdf. Last accessed 3 February 2012.
113 Aquatic Control, Inc. 2005. “Lake Lemon Aquatic Vegetation Management Plan.” Available [online] at http://www.state.in.us/dnr/fishwild/files/Lake_Lemon_AVMP_2006_Update_Monroe_Feb_2007.pdf. Last accessed 3 February 2012.
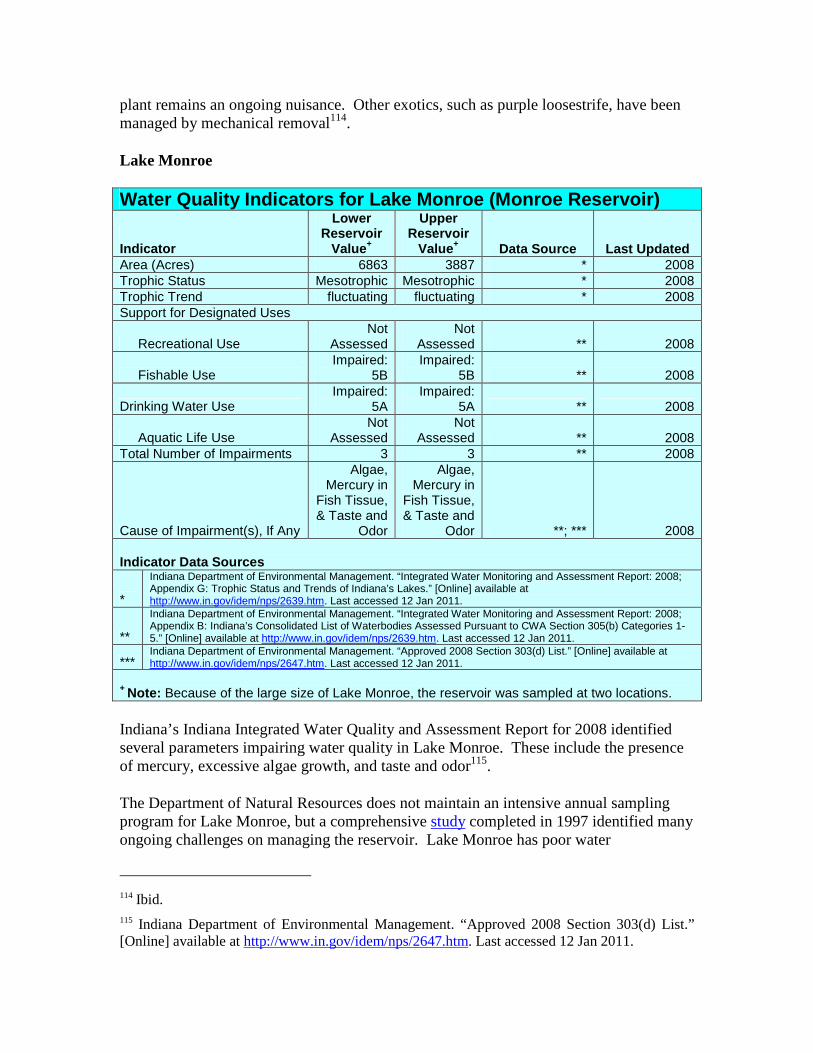
plant remains an ongoing nuisance. Other exotics, such as purple loosestrife, have been managed by mechanical removal114.
Lake Monroe
Water Quality Indicators for Lake Monroe (Monroe Re servoir)
Indicator
Lower Reservoir
Value+
Upper Reservoir
Value+ Data Source Last Updated Area (Acres) 6863 3887 * 2008 Trophic Status Mesotrophic Mesotrophic * 2008 Trophic Trend fluctuating fluctuating * 2008 Support for Designated Uses
Recreational Use Not
Assessed Not
Assessed ** 2008
Fishable Use Impaired:
5B Impaired:
5B ** 2008
Drinking Water Use Impaired:
5A Impaired:
5A ** 2008
Aquatic Life Use Not
Assessed Not
Assessed ** 2008 Total Number of Impairments 3 3 ** 2008
Cause of Impairment(s), If Any
Algae, Mercury in
Fish Tissue, & Taste and
Odor
Algae, Mercury in
Fish Tissue, & Taste and
Odor **; *** 2008 Indicator Data Sources
*
Indiana Department of Environmental Management. “Integrated Water Monitoring and Assessment Report: 2008; Appendix G: Trophic Status and Trends of Indiana’s Lakes.” [Online] available at http://www.in.gov/idem/nps/2639.htm. Last accessed 12 Jan 2011.
**
Indiana Department of Environmental Management. “Integrated Water Monitoring and Assessment Report: 2008; Appendix B: Indiana’s Consolidated List of Waterbodies Assessed Pursuant to CWA Section 305(b) Categories 1-5.” [Online] available at http://www.in.gov/idem/nps/2639.htm. Last accessed 12 Jan 2011.
*** Indiana Department of Environmental Management. “Approved 2008 Section 303(d) List.” [Online] available at http://www.in.gov/idem/nps/2647.htm. Last accessed 12 Jan 2011.
+ Note: Because of the large size of Lake Monroe, the reservoir was sampled at two locations.
Indiana’s Indiana Integrated Water Quality and Assessment Report for 2008 identified several parameters impairing water quality in Lake Monroe. These include the presence of mercury, excessive algae growth, and taste and odor115.
The Department of Natural Resources does not maintain an intensive annual sampling program for Lake Monroe, but a comprehensive study completed in 1997 identified many ongoing challenges on managing the reservoir. Lake Monroe has poor water
114 Ibid. 115 Indiana Department of Environmental Management. “Approved 2008 Section 303(d) List.” [Online] available at http://www.in.gov/idem/nps/2647.htm. Last accessed 12 Jan 2011.
transparency, especially in the Upper Basin section of Lake Monroe to the northeast. This turbidity issue exists because of suspended sediments from runoff and extensive shoreline erosion. This sedimentation also degrades lake appearance and impedes boating in certain sections of Lake Monroe. Other problems identified for Lake Monroe include impacts from heavy recreational use and moderately high phosphorus levels in the Upper Basin, and elevated concentrations of arsenic, chromium, nickel, and zinc in sediment from the from Sugar Camp Creek Bay area116.
Steep slopes along the Norman Uplands region of Lake Monroe’s shoreline makes erosion control an ongoing challenge. Additionally, the reservoir’s function as a flood control system means that Lake Monroe experiences regular high water events that limit the establishment of vegetation along the shoreline. With less vegetation holding sediments in place, the shoreline of Lake Monroe is more susceptible to undercutting from the erosive force of wave actions117.
However, the same fluctuations in water level that exacerbate erosion along Lake Monroe’s shoreline also limit the ability of invasive aquatic plants to become established. Like all plants, aquatic ones need light to make food via photosynthesis. Light levels decrease quickly with depth in most waterways, and fluctuations in lake depth can create inhospitable conditions for photosynthesis. Lake Monroe does however, have a problem with the invasive fish gizzard shad118.
116 Jones, William. “Lake Monroe Diagnostic and Feasibility Study.” 1997. Available [online] at https://scholarworks.iu.edu/dspace/handle/2022/199. Last accessed 3 February 2012.
117 Vance, Jill (Interpretive Naturalist for Monroe Lake). 12 February 2011. Personal Communication. 118 Ibid.
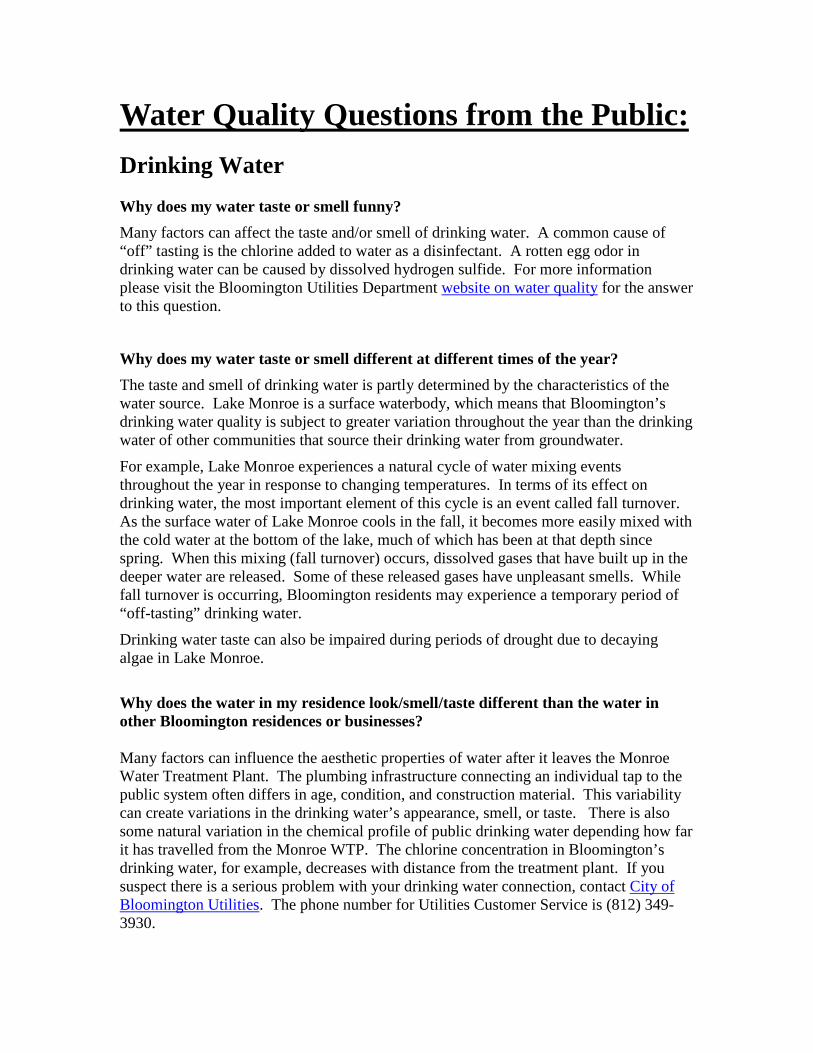
Water Quality Questions from the Public:
Drinking Water
Why does my water taste or smell funny?
Many factors can affect the taste and/or smell of drinking water. A common cause of “off” tasting is the chlorine added to water as a disinfectant. A rotten egg odor in drinking water can be caused by dissolved hydrogen sulfide. For more information please visit the Bloomington Utilities Department website on water quality for the answer to this question.
Why does my water taste or smell different at different times of the year?
The taste and smell of drinking water is partly determined by the characteristics of the water source. Lake Monroe is a surface waterbody, which means that Bloomington’s drinking water quality is subject to greater variation throughout the year than the drinking water of other communities that source their drinking water from groundwater.
For example, Lake Monroe experiences a natural cycle of water mixing events throughout the year in response to changing temperatures. In terms of its effect on drinking water, the most important element of this cycle is an event called fall turnover. As the surface water of Lake Monroe cools in the fall, it becomes more easily mixed with the cold water at the bottom of the lake, much of which has been at that depth since spring. When this mixing (fall turnover) occurs, dissolved gases that have built up in the deeper water are released. Some of these released gases have unpleasant smells. While fall turnover is occurring, Bloomington residents may experience a temporary period of “off-tasting” drinking water.
Drinking water taste can also be impaired during periods of drought due to decaying algae in Lake Monroe.
Why does the water in my residence look/smell/taste different than the water in other Bloomington residences or businesses?
Many factors can influence the aesthetic properties of water after it leaves the Monroe Water Treatment Plant. The plumbing infrastructure connecting an individual tap to the public system often differs in age, condition, and construction material. This variability can create variations in the drinking water’s appearance, smell, or taste. There is also some natural variation in the chemical profile of public drinking water depending how far it has travelled from the Monroe WTP. The chlorine concentration in Bloomington’s drinking water, for example, decreases with distance from the treatment plant. If you suspect there is a serious problem with your drinking water connection, contact City of Bloomington Utilities. The phone number for Utilities Customer Service is (812) 349-3930.

Why does Bloomington’s drinking water have a higher/lower level of contaminant X than town Y?
Again, the quality of drinking water is in part determined by the characteristics of the water source. The greatest differences will be found between towns using surface water as their drinking water source (like Bloomington) and those that rely on groundwater. The need to remove decaying leaf matter present in Lake Monroe water, for instance, means that Bloomington’s drinking water generally contains higher levels of disinfection byproducts than water from communities that use groundwater, into which leaves do not fall prior to processing. Examples of disinfection byproducts include trihalomethanes and haloacetic acids.
Even among communities using surface water resources, however, there will be differences. At any given time, the chemistry of Lake Monroe’s water will be somewhat different than that of the water sources used by other communities. The size of the community living near a water source will also influence the contaminant levels in a particular waterbody.
Some nearby communities receive drinking water that is purchased by wholesalers from the Monroe Water Treatment Plant and transported to the area of need. Does the Monroe WTP take any special measures to ensure the purity of this water?
All drinking water produced by the WTP is held to the same strict quality standards specified by the Safe Drinking Water Act. Once the water is purchased by a wholesaler, however, the Monroe WTP is no longer legally responsible for the quality of that water.
Environmental Water Quality
If Bloomington’s drinking water comes from Lake Monroe, why are fuel-powered boats allowed on the lake?
Lake Monroe (officially Monroe Lake or Monroe Reservoir) is a reservoir owned by the U.S. Army Corps of Engineers. It is maintained and operated by the Department of Natural Resources (DNR). Flood control is officially the primary function of the reservoir. Other key functions include low flow augmentation (adjusting reservoir depth to ensure that downstream creeks with fisheries operations have stable water conditions), and serving as a drinking water source.
Recreation is also an approved lake use. It is listed as a permissible use of the reservoir in Lake Monroe’s original master plan and well as in the current Lake Monroe operations management and shoreline management manuals used by the U.S. Army Corps of Engineers119. As such, boats are permitted on Lake Monroe so long as they have a valid boating permit from the DNR.
119 Cable, David. (Operations Division Manager, Monroe Lake, US Army Corps of Engineers). Personal communication. 2 December 2011.
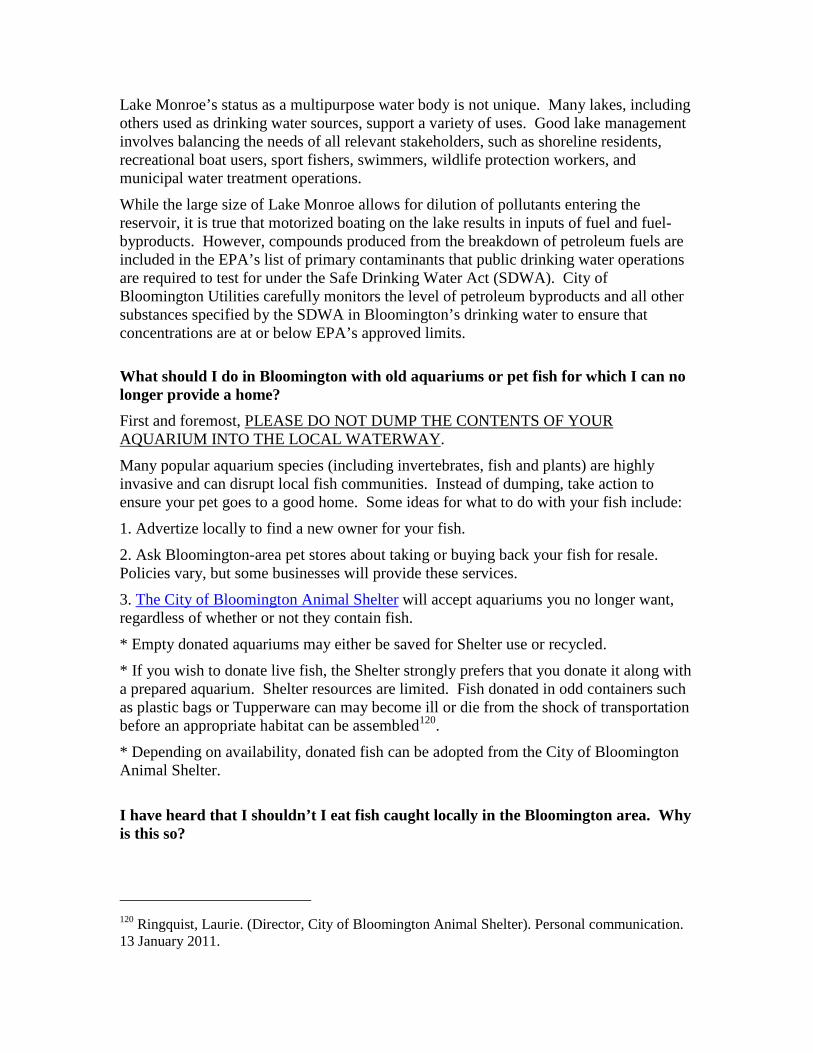
Lake Monroe’s status as a multipurpose water body is not unique. Many lakes, including others used as drinking water sources, support a variety of uses. Good lake management involves balancing the needs of all relevant stakeholders, such as shoreline residents, recreational boat users, sport fishers, swimmers, wildlife protection workers, and municipal water treatment operations.
While the large size of Lake Monroe allows for dilution of pollutants entering the reservoir, it is true that motorized boating on the lake results in inputs of fuel and fuel-byproducts. However, compounds produced from the breakdown of petroleum fuels are included in the EPA’s list of primary contaminants that public drinking water operations are required to test for under the Safe Drinking Water Act (SDWA). City of Bloomington Utilities carefully monitors the level of petroleum byproducts and all other substances specified by the SDWA in Bloomington’s drinking water to ensure that concentrations are at or below EPA’s approved limits.
What should I do in Bloomington with old aquariums or pet fish for which I can no longer provide a home?
First and foremost, PLEASE DO NOT DUMP THE CONTENTS OF YOUR AQUARIUM INTO THE LOCAL WATERWAY.
Many popular aquarium species (including invertebrates, fish and plants) are highly invasive and can disrupt local fish communities. Instead of dumping, take action to ensure your pet goes to a good home. Some ideas for what to do with your fish include:
1. Advertize locally to find a new owner for your fish.
2. Ask Bloomington-area pet stores about taking or buying back your fish for resale. Policies vary, but some businesses will provide these services.
3. The City of Bloomington Animal Shelter will accept aquariums you no longer want, regardless of whether or not they contain fish.
* Empty donated aquariums may either be saved for Shelter use or recycled.
* If you wish to donate live fish, the Shelter strongly prefers that you donate it along with a prepared aquarium. Shelter resources are limited. Fish donated in odd containers such as plastic bags or Tupperware can may become ill or die from the shock of transportation before an appropriate habitat can be assembled120.
* Depending on availability, donated fish can be adopted from the City of Bloomington Animal Shelter.
I have heard that I shouldn’t I eat fish caught locally in the Bloomington area. Why is this so?
120 Ringquist, Laurie. (Director, City of Bloomington Animal Shelter). Personal communication. 13 January 2011.
Unfortunately, many waterbodies in the Bloomington area impaired for use as fishing sites. This can be seen in the results of Indiana’s biannual Integrated Water Monitoring and Assessment Report. The report includes findings of contamination from mercury and PCBs in the flesh of fish from various local waterways. This type of contamination makes certain fish in Bloomington’s lakes and streams unsafe for human consumption.
However, the degree to which local fish are safe to eat varies by many factors. Even within the same waterbody, for example, the health risk from fish consumption will differ by the size and species of fish in question. To find the most current data on fish consumption advisories for the Bloomington area, consult the latest edition of Indiana’s annual Fish Consumption Advisory Report from the Indiana State Department of Health. What is Bloomington doing to minimize problems from stormwater runoff? Various Bloomington and Monroe County ordinances regulate stormwater management. Many sections of Title 10 and Title 20 of Bloomington’s Municipal Code and Title 8 of the Monroe County Code outline requirements that help protect local water quality. Examples include bioretention facilities in parking lots and erosion control requirements for construction sites. Water quality is discussed further in Monroe County’s Final Storm Water Management Ordinance, which can be found on the website of the Monroe County Drainage Board’s website. Bloomington is also responsible for following all Phase II stormwater management regulations for municipal separate storm sewer systems (MS4s) mandated by the Environmental Protection Agency for Indiana. In addition to the City of Bloomington, other local MS4 entities currently registered with and regulated by EPA are Indiana University, Ivy Tech State College-Bloomington, Monroe County, and Town of Ellettsville. Bloomington has been proactive in recognizing the importance of a citywide scheme for stormwater management. With the passing of Ordinance No. 98-29 in 1998, Bloomington established a Stormwater Utility funded by an associated stormwater fee. The purpose of this Utility is to develop sound stormwater management plans, design and evaluate proposals for the expansion of stormwater management facilities, and maintain existing stormwater collection infrastructure121. Many best management practices (BMPs) currently being used to improve stormwater quality in Bloomington are outlined in Bloomington’s Storm Water Quality Management Plan. Currently Monroe County is developing a stormwater fee to fund maintenance of stormwater infrastructure across the county. Bloomington’s Street Department also helps reduce the amount of contaminants in stormwater runoff by sweeping the City’s streets twice a year with mechanical sweepers. Street sweeping gathers up debris that would otherwise travel through Bloomington’s storm drains and be discharged into local streams.
121 City of Bloomington Utilities. “Stormwater Utility Credit Manual.” Available [online] at http://bloomington.in.gov/media/media/application/pdf/208.pdf. Last accessed 9 February 2012.

To learn more about stormwater management in the Bloomington area, citizens are welcome to attend the public meetings of various stormwater management related groups. There are also many ways for you to get involved in local stormwater management. The Stormwater Environmental Education Team (SWEET) - a collaboration of representatives from many local educational and municipal institutions, including all five designated MS4 entities in Indiana, offers many ways for you to help protect our community's stormwater resources. Meeting times for SWEET, as well as Monroe County’s Stormwater Management Board and updates on the development of the Monroe County Stormwater Fee, are available on Monroe County’s Stormwater News and Events page. Citizens can also learn more by reading Indiana’s Storm Water Quality Manual. Consider volunteering with Bloomington’s Storm Drain Marking Program (SDMP), Adopt-a-Trail program, Adopt-a-Stream program (in progress, to be launched in Summer 2012), Citizen Scientist Certification Program, or on a watershed site cleanup organized by agencies such as the City of Bloomington Parks and Recreation Department and Utilities Department, and partners such as the Monroe County Solid Waste Management District and Sycamore Land Trust. We also invite you to register your raingarden or other stormwater best management practice with Green Spots, a public database celebrating nature-friendly spots in Monroe County.
Wastewater
What types of materials can place particular strain on my city’s wastewater treatment system? Fats, oils, and grease (FOG) generated during food preparation can impair Bloomington’s wastewater treatment system by accumulating in and clogging private drains, sewer pipes, and sewage treatment structures after they are flushed down the drain. FOGs travel down the drain easily when warm but cause problems when they cool and solidfy down in your drain or sewer pipes. Clogging from FOG material reduces the capacity of Bloomington's sewer treatment system and can cause sewer backups, attract vermin, shorten the lifespan of municipal infrastructure 122, and require taxpayer money to be spent removing grease buildups from sewer lines. Currently Bloomington annually spends $80,000 to $100,000 on such cleanups 123.
For all these reasons, it is important for food preparing establishments to avoid sending fats, oils, and greases down the drain. Restaurants in Bloomington are required to maintain special grease catchment systems and keep a log of their cleaning schedule. For
122 City of Bloomington Utilities. “Frequently Asked Questions about Fats, Oils and Grease (FOG).”[Online] available at http://bloomington.in.gov/media/media/application/pdf/1535.pdf. Last accessed 4 November 2011. 123 Langley, John. Deputy Director, City of Bloomington Utilities. Personal communication. 17 April 2012.

more information about Bloomington’s FOG program for food service establishments, look here on the City of Bloomington Utilities website under “management resources.”
It is important for private citizens to help too, however. Rather than pouring FOGs down the drain, pour them into a container such as an empty milk carton or glass jar, allow the material to cool, and then place in your trash. Improperly disposing of fats, oils, and greases causes wastewater treatment problems in many communities (for a prominent example, learn more about London’s “Bin it – Don’t Block It” campaign), but you can do your part to help.
Citizens should also NEVER flush or dump hazardous materials such as antifreeze, expired medications, gasoline, paint, pesticides, or used motor oil. For information about how to properly dispose of these or other hazardous substances, contact the Monroe County Solid Waste Management District.
How does the water I flush travel all the way to a wastewater treatment plant?
Wastewater flows in through the pipes of City’s sanitary sewage system to one of Bloomington's wastewater treatment plants. The water flows mostly by gravity but is moved up in elevation where needed via sewer lift stations. For more information please visit the Bloomington Utilities Department’s FAQ website.
What happens to Bloomington’s sanitary sewer system when it rains? Bloomington’s sanitary sewer system is in principle separate from the City’s storm drain system. Most stormwater will flow down a storm drain and through the storm drain system of below-ground culverts, ultimately being discharged back into the environment further from the center of town. However, cracks and leaks in Bloomington’s storm drain and sanitary sewer infrastructure mean that during storm events, storm water can leak into the sanitary sewer system. This additional water in the sewer system will travel to a water treatment plant and be treated along with the rest of Bloomington’s municipal wastewater.
The Dillman Road wastewater treatment plant is equipped with an equalization basin, a large tank for temporarily holding sudden, high inflows of wastewater until it can be treated by the plant. By evening out how much water the Dillman Road plant is treating at any one time, the equalization basin reduces the hydraulic pressure on the plant’s equipment. Dillman Road’s equalization basin has a capacity of 43 million gallons124. This large size is important because while Dillman Road is designed to process a peak
124 Drake, Steve. Plant Superintendent, Dillman Road Wastewater Treatment Plant, City of Bloomington Utilities. Personal communication. 14 February 2011.

capacity of over 30 million gallons daily125, the plant can receive inflows as high as 60-65 million gallons a day during a heavy storm126.
125 City of Bloomington Utilities. “Dillman Wastewater Treatment Plant.” [Online] available at http://bloomington.in.gov/documents/viewDocument.php?document_id=3695. Last accessed at 4 November 2011. 126 Drake, Steve. Plant Superintendent, Dillman Road Wastewater Treatment Plant, City of Bloomington Utilities. Personal communication. 14 February 2011.

BEQI Water Quality References Adz, Rachel. (Water Quality Coordinator, City of Bloomington Utilities). Personal communication. 10 Oct
2011.
Aquatic Control, Inc. “Griffy Lake Aquatic Vegetation Management Plan 2008 Update - Draft.” Prepared for: Indiana Department of Natural Resources. 2008.
Bannerman, R., D. Owens, and N. Hornewer. “Sources of Pollutants in Wisconsin Stormwater.” Water Science Technology. 28(3-5). 1993. 241-259.
Cable, David. (Operations Division Manager, Monroe Lake, US Army Corps of Engineers.) Personal communication. 2 December 2011.
Carlson, R.E. and J. Simpson. “A Coordinator's Guide to Volunteer Lake Monitoring Methods.” North American Lake Management Society (Summary). 1996. [Online] available at http://www.secchidipin.org/tsi.htm. Last accessed 1 November 2011.
City of Bloomington Utilities. “Dillman Wastewater Treatment Plant.” [Online] available at http://bloomington.in.gov/documents/viewDocument.php?document_id=3695. Last accessed at 4 November 2011.
City of Bloomington Utilities. “Frequently Asked Questions about Fats, Oils and Grease (FOG).”[Online] available at http://bloomington.in.gov/media/media/application/pdf/1535.pdf. Last accessed 4 November 2011.
City of Bloomington Utilities. “Lake Monroe.” [Online] available at http://bloomington.in.gov/documents/viewDocument.php?document_id=598. Last accessed at 17 November 2011.
City of Bloomington Utilities. “Stormwater Utility Credit Manual.” Available [online] at http://bloomington.in.gov/media/media/application/pdf/208.pdf. Last accessed 9 February 2012.
City of Bloomington Utilities. “Water Quality Information.” [Online] Available at http://bloomington.in.gov/documents/viewDocument.php?document_id=594. Last accessed 26 Oct 2011.
Commonwealth Biomonitoring. 1997. Bloomington/Monroe County Urban Nonpoint Source Water Pollution Assessment Project.
Cotter, Steve. (Natural Resources Manager, City of Bloomington Parks and Recreation Department). Personal communication. 23 March 2012.
Drake, Steve (Plant Superintendent, Dillman Road Wastewater Treatment Plant, City of Bloomington Utilities). Personal communication. 14 February 2011.
Eakin, Jason. Monroe County Planning Department. Natural Features Inventory: Watershed & Floodplains. [Online] available at http://www.co.monroe.in.us/TSD/DesktopModules/Bring2mind/DMX/Download.aspx?TabID=383&Command=Core_Download&EntryId=24829&PortalId=0&TabId=383. Last accessed 2 November 2011. August 2003.
Ferrey, Steven. Environmental Law: Examples and Explanations. Fifth Edition. “Additional Federal Water Pollution Statutes.” New York: Aspen Publishers, 2010. 283-290.
Hinnefeld, Steve. Herald Times. March 25, 2006. "Chemicals to Kill Griffy Weeds." Available [online] at http://www.heraldtimesonline.com/stories/2006/03/25/news.new.1143260317.sto. Last accessed 10 February 2012.
Indiana Department of Environmental Management. “Industrial Pretreatment Permits.” [Online] available at http://www.in.gov/idem/4882.htm. Last accessed 4 November 2011.
Indiana Department of Environmental Management. “Integrated Water Monitoring and Assessment Report: 2002.”
Indiana Department of Environmental Management. “Integrated Water Monitoring and Assessment Report: 2004.”
Indiana Department of Environmental Management. “Integrated Water Monitoring and Assessment Report: 2010. Appendix C.”
Indiana Department of Environmental Management. “Integrated Water Monitoring and Assessment Report: 2008.” [Online] available at http://www.in.gov/idem/nps/2639.htm. Last accessed 28 Oct 2011.
Indiana Department of Natural Resources. “Aquatic Invasive Species: Curlyleaf Pondweed.” Available [online] at http://www.in.gov/dnr/files/CURLYLEAF_PONDWEED.pdf. Last accessed 10 February 2012.
Indiana State Department of Health. “2010 Indiana Fish Consumption Advisory Complete Report.” [Online] available at http://www.in.gov/isdh/23650.htm. Last accessed 28 Oct 2011.
Jones, William and Louise Clemency. “Lake Lemon Enhancement Study.” 1992. Available [online] at http://www.in.gov/dnr/fishwild/files/Lake_Lemon_Feasibility_Study-Monroe-July92.pdf. Last accessed 3 February 2012.
Jones, William. “Lake Monroe Diagnostic and Feasibility Study.” 1997. Available [online] at https://scholarworks.iu.edu/dspace/handle/2022/199. Last accessed 3 February 2012.
Langley, John. Deputy Director, City of Bloomington Utilities. Personal communication. 17 April 2012.
Miya, Shawn (City of Bloomington Utilities, Pretreatment Program Inspector). 15 November 2011. Personal communication.
Monroe County Planning Department. April, 2004. “Unincorporated Monroe County Storm Water Quality Management Plan, Part B.” 5.
Morin, Sarah. Herald Times. March 31, 2006. "Griffy Lake Chemical Treatment to Start." Available [online] at http://www.heraldtimesonline.com/stories/2007/04/08/news.qp-270902.sto. Last accessed 10 February 2012.
New Jersey Soil Conservation Committee. “Standards for Soil Erosion and Sediment Control in New Jersey,” as copied from the Rhode Island Soil Erosion and Sediment Control Handbook. 1980. Available online at http://www.michigan.gov/documents/deq/deq-wb-nps-rip_250895_7.pdf. Last accessed 3 February 2012.
Ney, John. J. “Oligotrophication and Its Discontents: Effects of Reduced Nutrient Loading on Reservoir Fisheries.” American Fisheries Society Symposium. 16. 285-295.
Ohio State University. “Qualitative Habitat Evaluation Index.”[Online] available at http://tycho.knowlton.ohio-state.edu/qhei.html#substrate. Last accessed 1 November 2011.
Steuer, J.. “Stormwater pollution sources areas isolated in Marquette, Michigan.” Technical Note #105 from Watershed Protection Techniques. 3(1). 609-612. 1997.
Trotter, John (Superintendent, Monroe Water Treatment Plant, City of Bloomington Utilities). 14 October 2011. Personal Communication.
Trotter, John (Superintendent, Monroe Water Treatment Plant, City of Bloomington Utilities). 14 February 2011. Personal Communication.
U.S. Environmental Protection Agency. “Clean Water Act, Section 502 General Definitions.” [Online] available at http://water.epa.gov/lawsregs/guidance/wetlands/sec502.cfm. Last accessed 28 Oct 2011.
U.S. Environmental Protection Agency. “Cuyahoga River Area of Concern: Beneficial Use Impairments.” [Online] available at http://www.epa.gov/glnpo/aoc/cuyahoga.html#Background. Last accessed 26 Oct 2011.

U.S. Environmental Protection Agency “Designated Uses.” [Online] Available at http://water.epa.gov/scitech/swguidance/standards/uses.cfm. Last accessed 26 Oct 2011.
U.S. Environmental Protection Agency. “Drinking Water Contaminants.” [Online] available at http://water.epa.gov/drink/contaminants/. Last accessed 1 Nov 2011.
U.S. Environmental Protection Agency. Figure 2.1: Typical Combined Sewer System from “Report to Congress: Impacts and Control of CSOs and SSOs”. Document No. EPA 833-R-04-001. Chapter 2. 2-2. [Online] available at http://www.epa.gov/npdes/pubs/csossoRTC2004_chapter02.pdf. Last accessed 10 Jan 2012.
U.S. Environmental Protection Agency. Figure 2.2: Typical Separate and Storm Sewer System from “Report to Congress: Impacts and Control of CSOs and SSOs”. Document No. EPA 833-R-04-001. Chapter 2. 2-2. [Online] available at http://www.epa.gov/npdes/pubs/csossoRTC2004_chapter02.pdf. Last accessed 10 Jan 2012.
U.S. Environmental Protection Agency. “Indiana Assessment Data. Assessed Waters of Indiana by Watershed.” Available [online] at http://iaspub.epa.gov/waters10/attains_state.report_control?p_state=IN&p_cycle=2010&p_report_type=A. Last accessed 31 January 2012. 2002, 2004, 2006, 2008, and 2010.
U.S. Environmental Protection Agency. “Pharmaceuticals and Personal Care Products.” [Online] available at http://www.epa.gov/ppcp/. Last accessed 28 Oct 2011.
U.S. Environmental Protection Agency. “Safe Drinking Water Act.” [Online] available at http://water.epa.gov/lawsregs/rulesregs/sdwa/. Last accessed 28 October 2011.
U.S. Geological Survey. “A Primer on Water Quality.” [Online] Available at http://pubs.usgs.gov/fs/fs-027-01/. Last accessed 26 Oct 2011.
U.S. Environmental Protection Agency. “Water Quality Criteria.” [Online] available at http://water.epa.gov/scitech/swguidance/standards/criteria/index.cfm. Last accessed 26 Oct 2011.
U.S. Environmental Protection Agency. “What is Nonpoint Source Pollution?” [Online] available at http://water.epa.gov/polwaste/nps/whatis.cfm. Last accessed 28 October 2011.
U.S. Environmental Protection Agency. “WQS: Designating Waterbodies.” [Online] Available at http://www.epa.gov/owow/watershed/wacademy/acad2000/cwa/cwa8.htm. Last accessed 26 Oct 2011.
U.S. Environmental Protection Agency. “Understanding the Safe Drinking Water Act.” [Online] available at http://www.epa.gov/ogwdw/sdwa/pdfs/fs_30ann_sdwa_web.pdf. Last accessed 28 Oct 2011.
Vance, Jill (Interpretive Naturalist for Monroe Lake). 12 February 2011. Personal Communication.
Water on the Web. “Soil Erosion and Sediment Pollution.” [Online] available at http://www.waterontheweb.org/under/waterquality/sediment.html. 2004. Last Accessed 28 October 2011.
Wisconsin Department of Natural Resources. “Eurasian Water Milfoil (Myriophyllum spicatum).” [Online] available at http://dnr.wi.gov/invasives/fact/milfoil.htm. Last accessed 13 Jan 2011.
Wisconsin Department of Natural Resources. “The Facts… On Eurasian Milfoil.” [Online] available at http://dnr.wi.gov/invasives/publications/pdfs/EWMbrochure.pdf. Last accessed 13 Jan 2011.
Further Reading
Water: Use It Wisely. “100 Ways to Conserve.” [Online] Available at http://www.wateruseitwisely.com/100-ways-to-conserve/index.php. Last accessed 26 Oct 2011.
Wetzel, Robert G. Limnology: Lake and River Ecosystems. Third Edition. San Diego: Academic Press, 2001.