Embed Size (px)
Citation preview


‘Promoting Good Practices & Standards’
CONTENTS
SUBJECT Page
No.
CHAPTER 1INTRODUCTION
1-5DATA COLLECTION TECHNIQUEINDIAN DEMOGRAPHY
CHAPTER 2
BASIC POLICE STATISTICS
6-12
POLICE – POPULATION RATIO (PPR) (PER LAKH OF POPULATION)POLICE – AREA RATIO (PAR) (PER 100 SQ. KM. OF AREA)POPULATION PER POLICEMEN (PPP)AREA PER POLICEMEN (APP) (IN SQ. KMS)TRANSPORT PER 100 POLICEMEN (TPP)
CHAPTER 3
INDIAN POLICE: HUMAN RESOURCES
13-28STRENGTH OF POLICESCs/STs & OBCs IN STATES/UTs POLICE
WOMEN IN POLICE
CHAPTER 4POLICE BUDGET
29-33BUDGET & EXPENDITURE ON STATES/UTS POLICEBUDGET & EXPENDITURE ON (CAPFS)
CHAPTER 5
POLICE INFRASTRUCTURE
34-44
STATE POLICE ADMINISTRATIVE OFFICESPOLICE STATIONS/POSTSPOLICE COMMISSIONERATES IN INDIATRANSPORT FACILITIESPOLICE COMMUNICATION FACILITIESPOLICE HOUSING
CHAPTER 6
OTHER DATA/INFORMATIONS
45-55
INSTRUMENTS TO FACILIATE POLICESECURITY TO PROTECTED PERSONSTRAINING AND DEVELOPMENTSTATISTICS REGARDING IPS OFFICERSDEPARTMENTAL PROCEDINGS & POLICE DISTRICT AFFECTED BY TERRORISTS/EXTREMISTSPAY SCALES OF POLICE PERSONNEL

‘Promoting Good Practices & Standards’
TABLESLIST OF TABLES Page
No.
TABLE 2.1.1 NATIONAL POLICE STATISTICS ( 2007 - 2017 ) 56
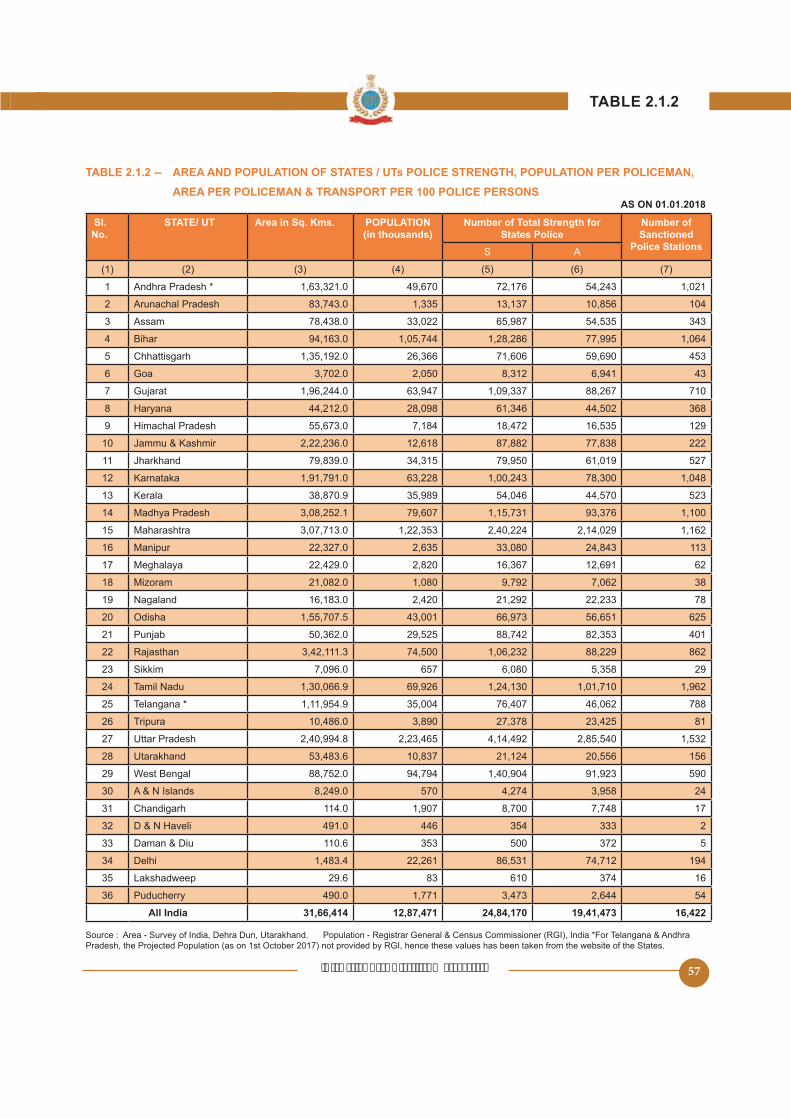
TABLE 2.1.2 AREA AND POPULATION OF STATES / UTs POLICE STRENGTH, POPULATION PER POLICEMAN, AREA PER POLICEMAN & TRANSPORT PER 100 POLICE PERSONS
57
TABLE 2.1.3 SANCTIONED AND ACTUAL POLICE - POPULATION AND AREA RATIO IN STATES/UTs
59
TABLE 3.1.1 SANCTIONED (S) AND ACTUAL (A) STRENGTH OF POLICE FORCES IN STATES / UTs
61
TABLE 3.1.2 SANCTIONED (S) & ACTUAL (A) STRENGTH OF DIFFERENT RANKS IN CIVIL POLICE
63
TABLE 3.1.3 (A) SANCTIONED (S) & ACTUAL (A) STRENGTH OF DIFFERENT RANKS IN DISTRICT ARMED RESERVE (DAR) POLICE IN STATES/UTs
67
TABLE 3.1.3 (B) SANCTIONED (S) & ACTUAL (A) STRENGTH OF DIFFERENT RANKS IN ARMED POLICE IN STATES/UTs
71
TABLE 3.1.4 SANCTIONED (S) & ACTUAL (A) STRENGTH IN VARIOUS RANKS WITH VACANCIES(V) OF TOTAL (CIVIL+ DISTRICT ARMED RESERVE + ARMED) POLICE FORCE
75
TABLE 3.1.5 OFFICERS TO FIELD STAFF RATIO OF SANCTIONED & ACTUAL STRENGTH OF POLICE IN STATES & UTs
79
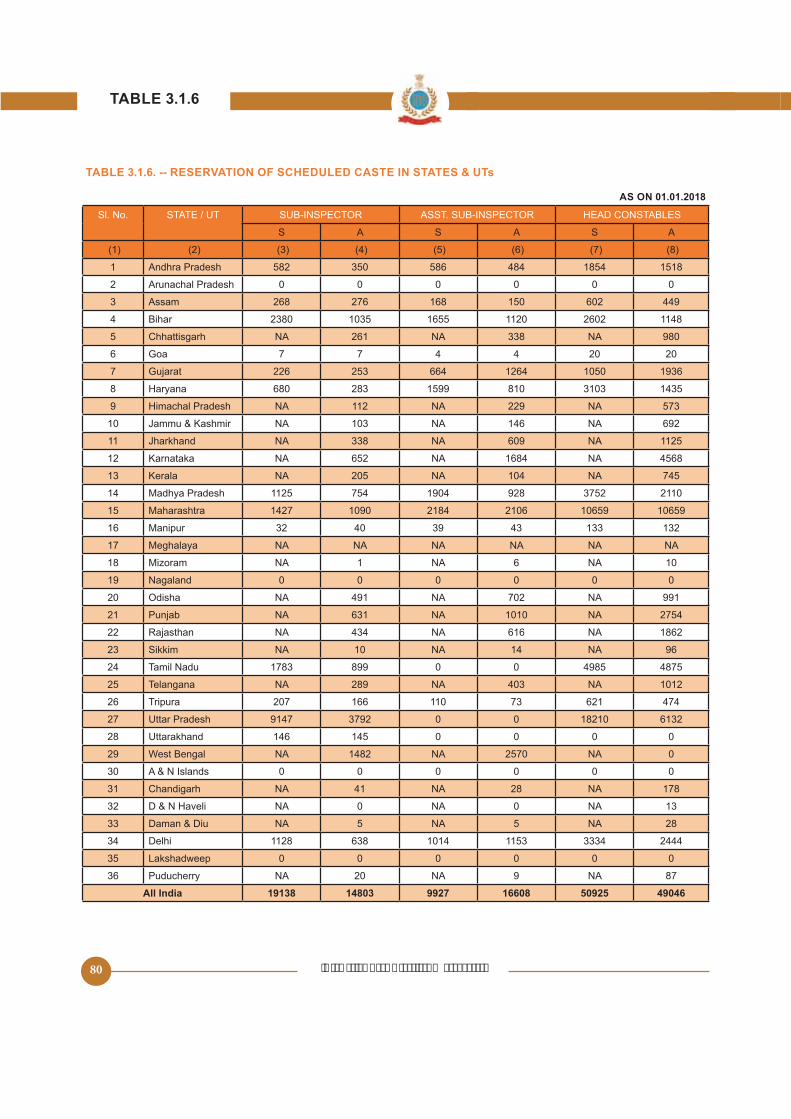
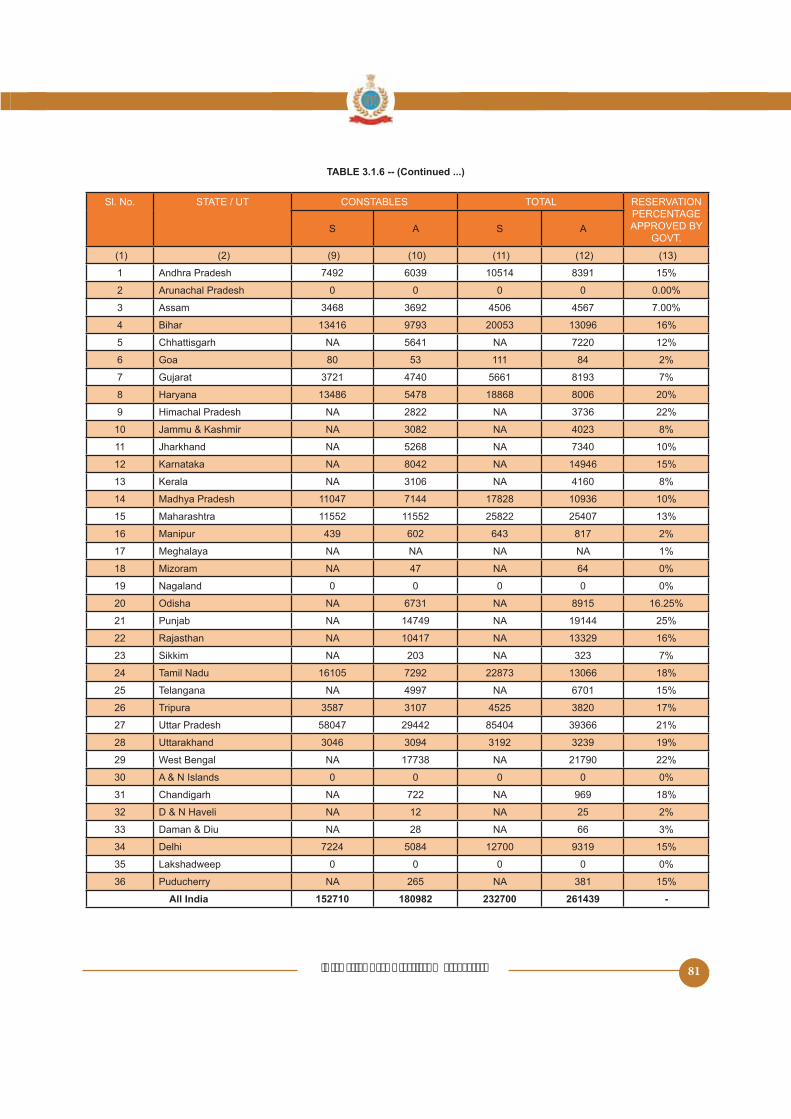
TABLE 3.1.6 RESERVATION OF SCHEDULED CASTE IN STATES & UTs 80
TABLE 3.1.7 RESERVATION OF SCHEDULED TRIBES IN STATES & UTs 82
TABLE 3.1.8 RESERVATION OF OTHER BACKWARD CLASSES IN STATES & UTs 84
TABLE 3.1.9 ACTUAL STRENGTH OF WOMEN POLICE (CIVIL INCLUDING DAR) IN STATES / UTs
86
TABLE 3.1.10 ACTUAL STRENGTH OF WOMEN POLICE (ARMED) IN STATES / UTs 88
TABLE 3.2.1 STRENGTH OF WOMEN POLICE, RESERVATION OF WOMEN POLICE, FEMALE POPULATION PER POLICE WOMAN
90
TABLE 3.2.2 SANCTIONED (S) / ACTUAL (A) STRENGTH OF VARIOUS RANKS IN TRAFFIC POLICE
92
TABLE 3.2.3 ACTUAL STRENGTH OF WOMEN POLICE OF VARIOUS RANKS IN TRAFFIC POLICE
94
TABLE 3.2.4 SANCTIONED (S) & ACTUAL (A) STRENGTH OF SPECIAL BRANCH DEALING WITH INTELLIGENCE
96
TABLE 3.2.5 ACTUAL STRENGTH OF WOMEN POLICE IN SPECIAL BRANCH DEALING WITH INTELLIGENCE
99
TABLE 3.2.6 SANCTIONED (S) & ACTUAL (A) STRENGTH OF CRIME INVESTIGATION DEPARTMENT(CID/COD/CRIME BRANCH (CB) CID)
101
TABLE 3.2.7 ACTUAL STRENGTH OF WOMEN OFFICERS IN CRIME INVESTIGATION DEPARTMENT(CID/COD/CB CID)
104
‘Promoting Good Practices & Standards’
LIST OF TABLES Page
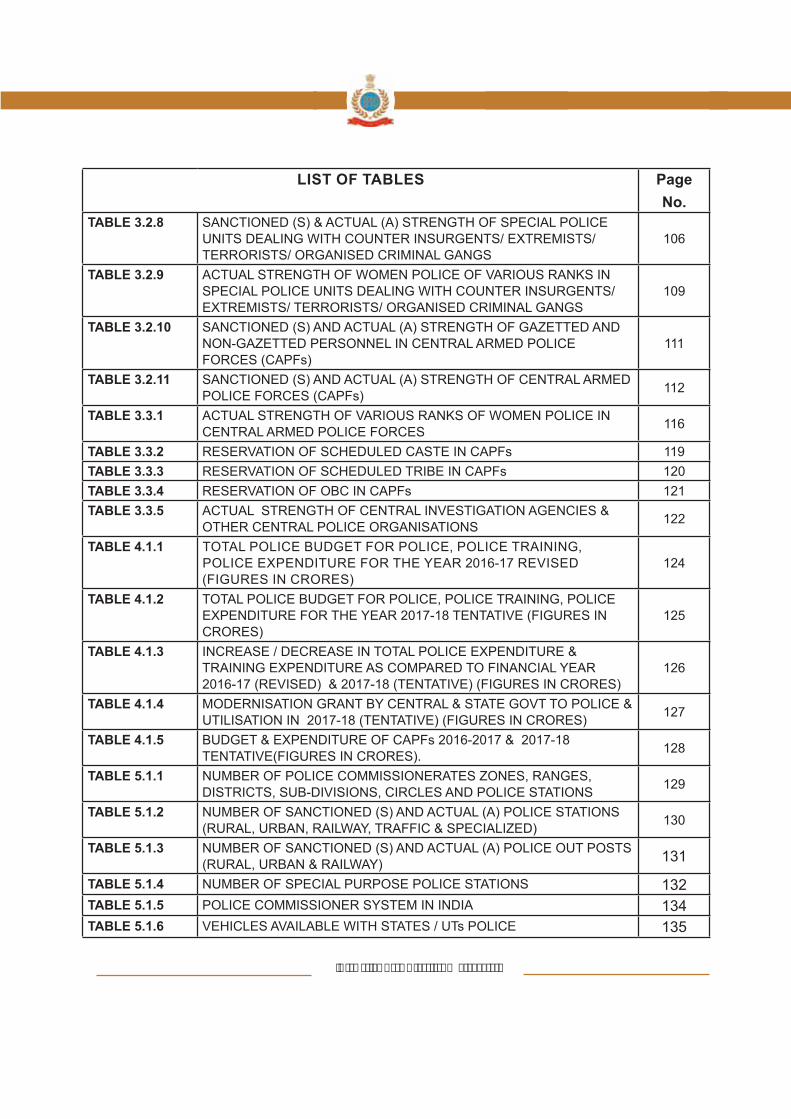
No.TABLE 3.2.8 SANCTIONED (S) & ACTUAL (A) STRENGTH OF SPECIAL POLICE
UNITS DEALING WITH COUNTER INSURGENTS/ EXTREMISTS/ TERRORISTS/ ORGANISED CRIMINAL GANGS
106
TABLE 3.2.9 ACTUAL STRENGTH OF WOMEN POLICE OF VARIOUS RANKS IN SPECIAL POLICE UNITS DEALING WITH COUNTER INSURGENTS/ EXTREMISTS/ TERRORISTS/ ORGANISED CRIMINAL GANGS
109
TABLE 3.2.10 SANCTIONED (S) AND ACTUAL (A) STRENGTH OF GAZETTED AND NON-GAZETTED PERSONNEL IN CENTRAL ARMED POLICE FORCES (CAPFs)
111
TABLE 3.2.11 SANCTIONED (S) AND ACTUAL (A) STRENGTH OF CENTRAL ARMED POLICE FORCES (CAPFs)
112
TABLE 3.3.1 ACTUAL STRENGTH OF VARIOUS RANKS OF WOMEN POLICE IN CENTRAL ARMED POLICE FORCES
116
TABLE 3.3.2 RESERVATION OF SCHEDULED CASTE IN CAPFs 119
TABLE 3.3.3 RESERVATION OF SCHEDULED TRIBE IN CAPFs 120
TABLE 3.3.4 RESERVATION OF OBC IN CAPFs 121
TABLE 3.3.5 ACTUAL STRENGTH OF CENTRAL INVESTIGATION AGENCIES & OTHER CENTRAL POLICE ORGANISATIONS
122
TABLE 4.1.1 TOTAL POLICE BUDGET FOR POLICE, POLICE TRAINING, POLICE EXPENDITURE FOR THE YEAR 2016-17 REVISED (FIGURES IN CRORES)
124
TABLE 4.1.2 TOTAL POLICE BUDGET FOR POLICE, POLICE TRAINING, POLICE EXPENDITURE FOR THE YEAR 2017-18 TENTATIVE (FIGURES IN CRORES)
125
TABLE 4.1.3 INCREASE / DECREASE IN TOTAL POLICE EXPENDITURE & TRAINING EXPENDITURE AS COMPARED TO FINANCIAL YEAR 2016-17 (REVISED) & 2017-18 (TENTATIVE) (FIGURES IN CRORES)
126
TABLE 4.1.4 MODERNISATION GRANT BY CENTRAL & STATE GOVT TO POLICE & UTILISATION IN 2017-18 (TENTATIVE) (FIGURES IN CRORES)
127
TABLE 4.1.5 BUDGET & EXPENDITURE OF CAPFs 2016-2017 & 2017-18 TENTATIVE(FIGURES IN CRORES).
128
TABLE 5.1.1 NUMBER OF POLICE COMMISSIONERATES ZONES, RANGES, DISTRICTS, SUB-DIVISIONS, CIRCLES AND POLICE STATIONS
129
TABLE 5.1.2 NUMBER OF SANCTIONED (S) AND ACTUAL (A) POLICE STATIONS (RURAL, URBAN, RAILWAY, TRAFFIC & SPECIALIZED)
130
TABLE 5.1.3 NUMBER OF SANCTIONED (S) AND ACTUAL (A) POLICE OUT POSTS (RURAL, URBAN & RAILWAY)
131
TABLE 5.1.4 NUMBER OF SPECIAL PURPOSE POLICE STATIONS 132TABLE 5.1.5 POLICE COMMISSIONER SYSTEM IN INDIA 134TABLE 5.1.6 VEHICLES AVAILABLE WITH STATES / UTs POLICE 135

‘Promoting Good Practices & Standards’
LIST OF TABLES Page
No.TABLE 5.1.7 TRANSPORT RESOURCES PER 100 POLICEMEN 137TABLE 5.1.8 VEHICLES AVAILABLE WITH CAPFs 138TABLE 5.1.9 NUMBER OF POLICE STATIONS HAVING / NOT HAVING VEHICLES,
TELEPHONES & WIRELESS / MOBILES 139
TABLE 5.1.10 FAMILY QUARTERS FOR OFFICERS OF THE RANK OF Dy. SP & ABOVE, ASIs TO INSPECTORS, CONSTABLES & HEAD CONSTABLES
140
TABLE 5.2.1 FAMILY QUARTERS IN CAPFs/ OTHER ORGANISATIONS FOR OFFICERS OF THE RANK OF DySP & ABOVE, ASIs TO INSPECTORS, CONSTABLES & HEAD CONSTABLES
142
TABLE 5.2.2 PERCENTAGE SATISFACTION OF FAMILY ACCOMMODATION 143TABLE 5.2.3 POLICE OFFICE BUILDINGS OPERATED FROM GOVERNMENT /
HIRED BUILDINGS 144
TABLE 6.1.1 FORENSIC SCIENCE LABORATORIES / MOBILE FORENSIC VANS 146TABLE 6.1.2 NUMBER OF SERVERS, COMPUTERS, LAPTOPS AVAILABLE WITH
STATES/ UTs POLICE 147
TABLE 6.1.3 CCTV CAMERAS, SPEEDOMETERS & BREATH ANALYZERS 148TABLE 6.1.4 NUMBER OF TRACKER/ SNIFFER DOGS IN THE STATES/ UTs
POLICE 149
TABLE 6.1.5 NUMBER OF TRACKER/ SNIFFER DOGS IN THE CAPFs 150TABLE 6.1.6 NUMBER OF PERSONS WHO WERE PROVIDED POLICE
PROTECTION FOR MORE THAN SIX MONTHS AND TOTAL NUMBER OF POLICE PERSONNEL SANCTIONED AND DEPLOYED THERE OF IN 2016 & 2017
151
TABLE 6.1.7 NUMBER OF COMPANIES OF CENTRAL ARMED POLICE FORCES (BSF, CRPF, CISF, ITBP ETC.) DEPLOYED IN THE STATES FOR OVER SIX MONTHS DURING 2017
152
TABLE 6.1.8 NUMBER OF POLICE PERSONNEL DIRECTLY RECRUITED/ INDUCTED IN STATES / UTs DURING 2017 153
TABLE 6.1.9 NUMBER OF POLICE PERSONNEL DIRECTLY RECRUITED/ INDUCTED IN CAPFs DURING 2007 155
TABLE 6.1.10 NUMBER OF NEWLY RECRUITED POLICE PERSONNEL TRAINED IN YEAR 2017 156
TABLE 6.2.1 NUMBER OF DIRECTLY RECRUITED/ INDUCTED CAPF PERSONNEL TRAINED DURING 2017 158
TABLE 6.2.2 STATISTICS REGARDING IPS OFFICERS 159
‘Promoting Good Practices & Standards’
LIST OF TABLES Page
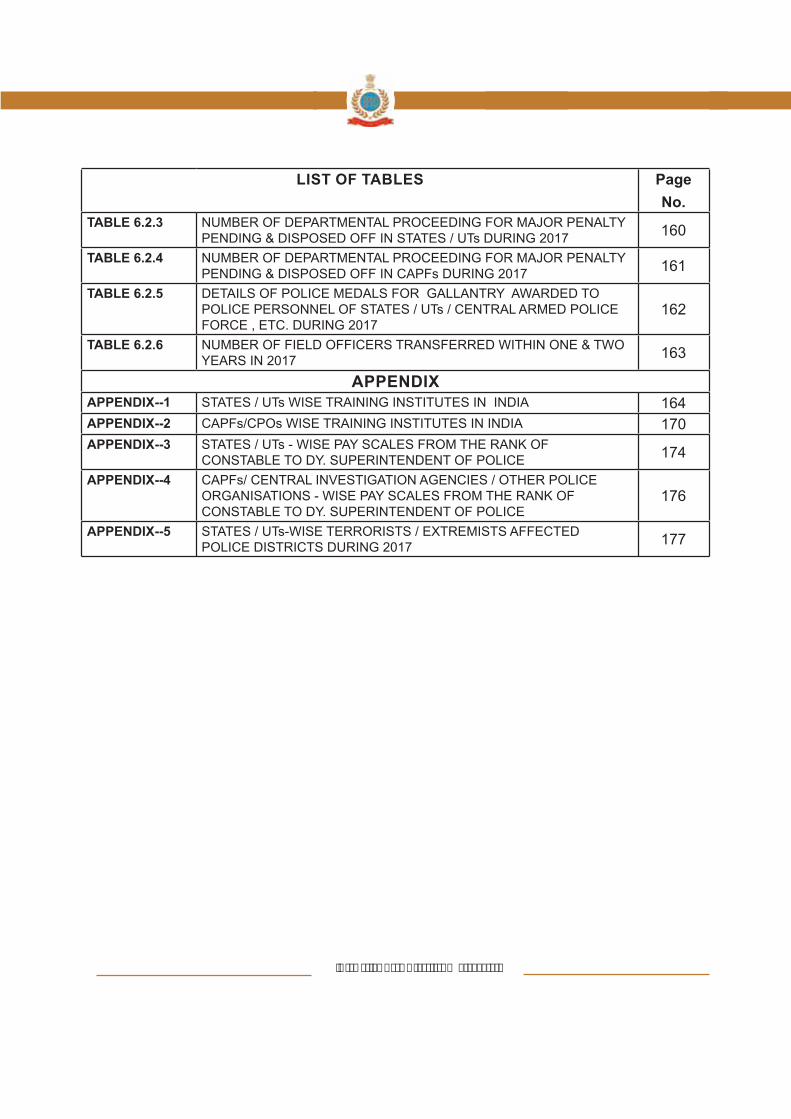
No.TABLE 6.2.3 NUMBER OF DEPARTMENTAL PROCEEDING FOR MAJOR PENALTY
PENDING & DISPOSED OFF IN STATES / UTs DURING 2017 160
TABLE 6.2.4 NUMBER OF DEPARTMENTAL PROCEEDING FOR MAJOR PENALTY PENDING & DISPOSED OFF IN CAPFs DURING 2017 161
TABLE 6.2.5 DETAILS OF POLICE MEDALS FOR GALLANTRY AWARDED TO POLICE PERSONNEL OF STATES / UTs / CENTRAL ARMED POLICE FORCE , ETC. DURING 2017
162
TABLE 6.2.6 NUMBER OF FIELD OFFICERS TRANSFERRED WITHIN ONE & TWO YEARS IN 2017 163
APPENDIXAPPENDIX--1 STATES / UTs WISE TRAINING INSTITUTES IN INDIA 164APPENDIX--2 CAPFs/CPOs WISE TRAINING INSTITUTES IN INDIA 170APPENDIX--3 STATES / UTs - WISE PAY SCALES FROM THE RANK OF
CONSTABLE TO DY. SUPERINTENDENT OF POLICE 174
APPENDIX--4 CAPFs/ CENTRAL INVESTIGATION AGENCIES / OTHER POLICE ORGANISATIONS - WISE PAY SCALES FROM THE RANK OF CONSTABLE TO DY. SUPERINTENDENT OF POLICE
176
APPENDIX--5 STATES / UTs-WISE TERRORISTS / EXTREMISTS AFFECTED POLICE DISTRICTS DURING 2017 177

‘Promoting Good Practices & Standards’
GLOSSARYSHORT FULL FORM
A ACTUALADDL. DGP ADDITIONAL DIRECTOR GENERAL OF POLICEA & N ISLANDS ANDAMAN & NICOBAR ISLANDSAPP AREA PER POLICEMENAIGP ASSISTANT INSPECTOR GENERAL OF POLICEASI ASSISTANT SUB INSPECTOR BSF BORDER SECURITY FORCEBPR&D BUREAU OF POLICE RESEARCH & DEVELOPMENTCBI CENTRAL BUREAU OF INVESTIGATIONCISF CENTRAL INDUSTRIAL SECURITY FORCE CRPF CENTRAL RESERVE POLICE FORCE D&N HAVELI DADRA & NAGAR HAVELI DIG DEPUTY INSPECTOR GENERAL OF POLICE DoPO DATA ON POLICE ORGANISATION Dy SP DEPUTY SUPERINTENDENT OF POLICE DGP DIRECTOR GENERAL OF POLICEDAR DISTRICT ARMED RESERVEGOs GAZETTED OFFICERSHC HEAD CONSTABLEITBP INDO-TIBETAN BORDER POLICEIGP INSPECTOR GENERAL OF POLICEMLAs MEMBERS OF LEGISLATIVE ASSEMBLYMPs MEMBERS OF PARLIAMENTMHA MINISTRY OF HOME AFFAIRSNCRB NATIONAL CRIME RECORD BUREAUNDRF NATIONAL DISASTER RESPONSE FORCENIA NATIONAL INVESTIGATION AGENCYNSG NATIONAL SECURITY GUARDS NA NOT AVAILABLEOBCs OTHER BACKWARD CLASSES PAR POLICE AREA RATIOPMG POLICE MEDAL FOR GALLANTRYPPMG PRESIDENT’S POLICE MEDAL FOR GALLANTRY PPR POLICE POPULATION RATIO
‘Promoting Good Practices & Standards’
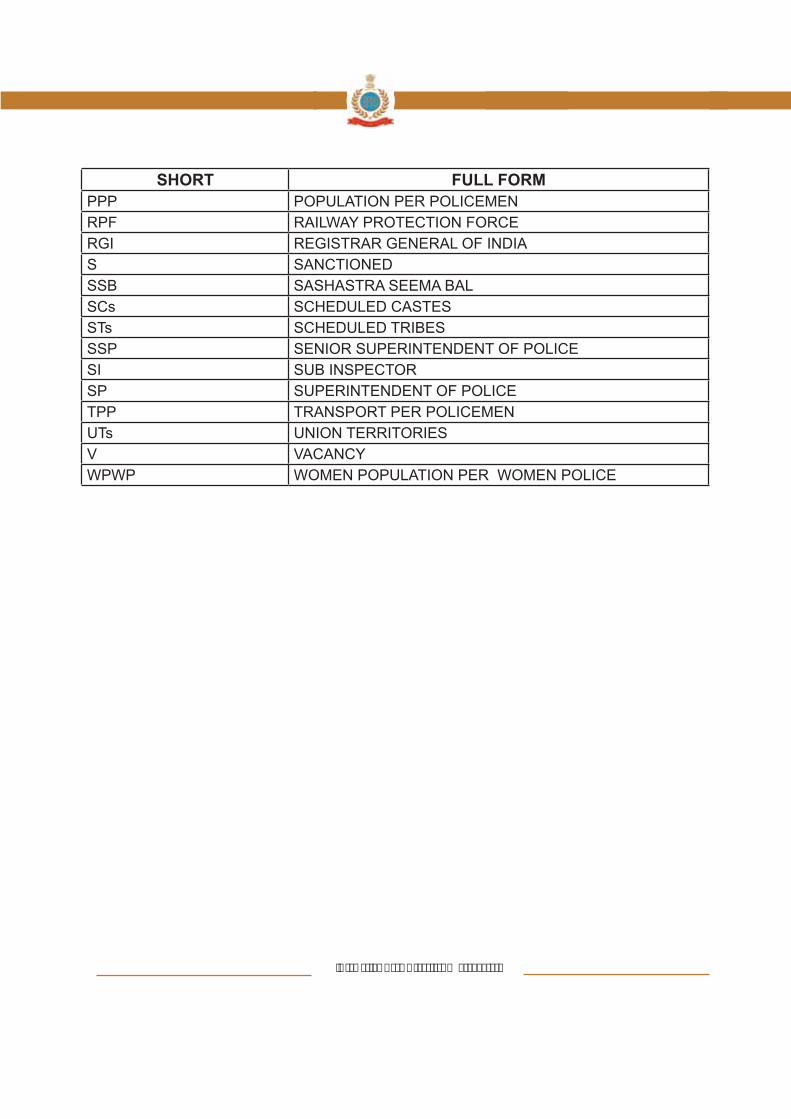
SHORT FULL FORMPPP POPULATION PER POLICEMEN RPF RAILWAY PROTECTION FORCE RGI REGISTRAR GENERAL OF INDIAS SANCTIONEDSSB SASHASTRA SEEMA BAL SCs SCHEDULED CASTESSTs SCHEDULED TRIBESSSP SENIOR SUPERINTENDENT OF POLICESI SUB INSPECTORSP SUPERINTENDENT OF POLICE TPP TRANSPORT PER POLICEMEN UTs UNION TERRITORIESV VACANCYWPWP WOMEN POPULATION PER WOMEN POLICE

‘Promoting Good Practices & Standards’

‘Promoting Good Practices & Standards’ 1
SECTION- I: DATA COLLECTION TECHNIQUE
Purpose of the publication
• Data Collection tool
This section provides information regarding the purpose of this publication,
user guide to Indian Police Statistics, data source and quality, statistical
tools, procedure of data collection, data limitation and implications.
Purpose of publication:
BPR&D has been publishing the “Data on Police Organisations” in
India since 1986 annually. From time to time, some of the important features like
women police, police expenditure, citizen constabulary ratio, transport facilities,
communication facilities, representation of SCs/STs and police training centers
were also added.
CHAPTER 1
INTRODUCTION
CHAPTER 1INTRODUCTION
‘Promoting Good Practices & Standards’2
CHAPTER 1
In this publication new dimensions like infrastructure of CAPFs (vehicles
Gender Wise data of Police Forces, District Armed Reserve Police Force,
Ratio of Police Strength, Database of Women Police, Sanctioned and Actual
Strength of SCs/STs and OBCs have been added.
This publication “Data on Police Organisation in India” as on 01.01.2018 is
libraries, academicians, police administrators and other stakeholders.
BPR&D’s annual publication “Data on Police Organisation in India”
has been prepared on the basis of data provided by States/UTs, CAPFs,
other police organisations. Further data have also been obtained from Registrar
Statistical Tools:-
Statistical methods involved in carrying out a study includes planning,
designing, collecting data, analyzing, drawing meaningful interpretation and
INTRODUCTION

‘Promoting Good Practices & Standards’ 3
CHAPTER 1
Presentation of Data:-
Data are collected in a raw format, however in this format, it has inherent
summarized, processed, analyzed and presented in charts & tables.
facilitates comparison and can reveal trends and relationships within the data
such as changes over time, frequency distribution and correlation. Bar graphs,
Pie charts and other statistical tools have been used.
DoPO has been prepared on the basis of data provided by States/UTs/
CAPFs and other Police Organisations.
Since the Police structure of all States/UTs, CAPFs and other Police are
not same, in a few cases states have not been able to provide complete data.
and at some places relevant previous year data has also been incorporated.
INTRODUCTION

‘Promoting Good Practices & Standards’4
This section depicts the information/data of States/UTs in respect of
Indian demography containning male-female population and geo-graphical
area of the country.
Demography is the statistical study of populations, especially human
beings. As general science, it can analyze any kind of dynamic living
population, i.e., one that changes over time or space and in response to birth,
migration, aging and death.
education, nationality, religion and ethnicity. Demographic studies also analysed
the relationships between economic, social, cultural and biological processes
The total population of India as on 01.10.2017 provided by Registrar
General and Census Commissioner of India stood at 128.7 crore approx,
comprising 66.9 crore males and 61.8 crore females.
CHAPTER 1 INTRODUCTION

‘Promoting Good Practices & Standards’ 5
CHAPTER 1INTRODUCTION
Among the States, Uttar Pradesh with a population of more than 22.34
crore holds distinction of being the most populous state in the country followed by
Maharastra with a population of 12.23 crore.
Among the Union Territories, Delhi with a population of more than 2.23
crore holds distinction of being the most populous UT in the country followed by
Chandigarh with a population of 0.19 crore.
The total geo-graphical area of the country is 31,66,414 sq.km
approximately. The largest state in India in terms of geographical area is
Rajasthan with an area of 3,42,111 sq.km and the smallest state is UT of
Lakshadweep with an area of 30 sq.km.

‘Promoting Good Practices & Standards’6
The basic police data is the compilation of information on sanctioned /
actual strength of Civil, District Armed Reserve Police & Armed Police,
Stations, Police Posts and Number of Armed Police Battalions in the country.
An analysis of national data on police for the period of last eleven years for
alternate years is given in Table -2.1.1. It also gives comparative change with
CHAPTER 2
BASIC POLICE STATISTICS
CHAPTER 2 BASIC POLICE STATISTICS
‘Promoting Good Practices & Standards’ 7
Table No.2.1.3
Details are given at Table No. 2.1.3
Population per Policemen against Sanctioned Total Police (Civil + DAR+
Table No.2.1.2
CHAPTER 2BASIC POLICE STATISTICS
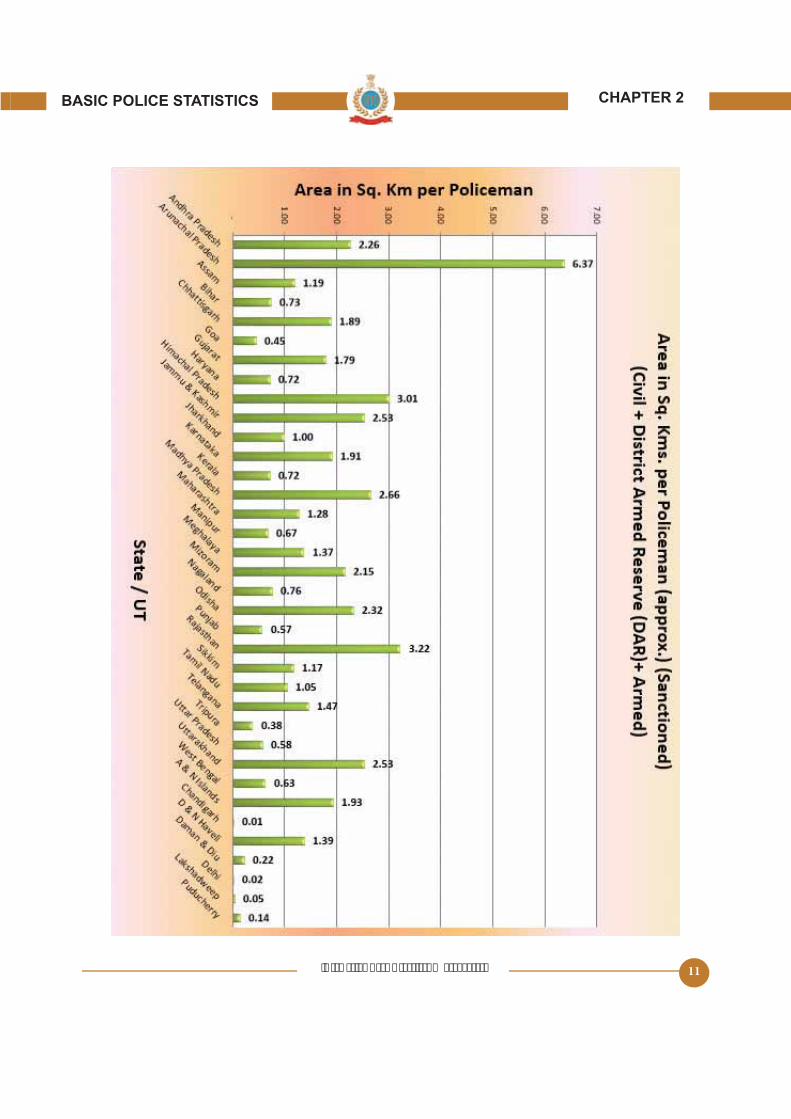
‘Promoting Good Practices & Standards’8
year data. The highest ratio is 6.37 in Arunachal Pradesh. Details are given at
Table No.2.1.2
Transport per 100 Policemen against Sanctioned Total Police (Civil + DAR+
Table No.2.1.2
At the end of this Chapter, State-wise Policeperson Per Lakh Popultion
CHAPTER 2 BASIC POLICE STATISTICS

‘Promoting Good Practices & Standards’ 9
CHAPTER 2BASIC POLICE STATISTICS
State/UT-Wise Policepersons Per Lakh Population: Sanctioned
31
2
20
1. Manipur ...................... 1,255
2. Arunachal Pradesh ......984
3. Sikkim ...........................925
4. Mizoram .......................907
5. Nagaland ..................... 880
6. A & N Islands ................750
7. Lakshadweep ............... 735
8. Tripura ..........................704
9. Jammu & Kashmir.......696
10. Meghalaya ..................580
11. Chandigarh .................456
12. Goa ..............................405
13. Delhi ............................389
14. Punjab ......................... 301
15. Chhattisgarh .............. 272
16. Himachal Pradesh ..... 257
17. Jharkhand ...................233
18. Haryana ...................... 218
19. Telangana ................... 218
20. Assam........................ 200
21. Maharashtra ............... 196
22. Puducherry ................ 196
23. Uttarakhand ............... 195
24. Uttar Pradesh ............ 185
25. Tamil Nadu ..................178
26. Gujarat ........................ 171
27. Karnataka ................... 159
28. Odisha ........................ 156
29. Kerala ......................... 150
30. West Bengal ............... 149
31. Andhra Pradesh ......... 14
32. Madhya Pradesh ........145
33. Rajasthan ....................143
34. Daman & Diu ..............142
35. Bihar ............................ 121
36. D & N Haveli ................. 79
0 to 200
201 to 400
401 to 800
Above 800
State/UTs-Wise Policepersons Per Lakh Population: Sanctioned
Policepersons per lakh population
1
5
28
10
14
33
3
84
6
11
24
23
30
35
17
15
12
3634
722
13
27
29 25
19
32
21
26
18
16
9

‘Promoting Good Practices & Standards’10
CHAPTER 2 BASIC POLICE STATISTICS
‘Promoting Good Practices & Standards’ 11
CHAPTER 2BASIC POLICE STATISTICS

‘Promoting Good Practices & Standards’12
CHAPTER 2 BASIC POLICE STATISTICS

‘Promoting Good Practices & Standards’ 13
CHAPTER 3
This section provides information on sanctioned and actual strength of Civil
Police, District Armed Reserve & State Armed Police and the total strength of
Police. Rank wise sanctioned and actual strength of Police Forces of States/UTs
have been computed for sanctioned and actual police strength of States/UTs.
CHAPTER 3
INDIAN POLICE : HUMAN RESOURCES
HUMAN RESOURCES
‘Promoting Good Practices & Standards’14
CHAPTER 3
Data on the sanctioned strength of State Police Forces indicate that out
of 24.84 lakh of the total police forces in the country, 16.04 lakh are civil Police
and 2.80 lakh District Armed Police and the remaining 6.00 lakh are State Armed
The sanctioned strength of the Civil Police is the highest in Uttar Pradesh
The sanctioned strength of the District Armed Reserve Police is the highest
The sanctioned strength of the State Armed Police is the highest in Uttar
Table No.3.1.1
Data on the actual strength of State Police Forces indicate that out of
19.41 lakh of the total police forces in the country, 12.36 lakh are civil Police and
2.34 lakh District Armed Police and the remaining 4.71 lakh are State Armed
HUMAN RESOURCES

‘Promoting Good Practices & Standards’ 15
The actual strength of the Civil Police is the highest in Uttar Pradesh (1.89
The actual strength of the District Armed Reserve Police is the highest in
The actual strength of the State Armed Police is the highest in 96,439
Table No.3.1.1
Armed Reserve Police forces against 2,79,428 sanctioned strength and 3,67,716
24,84,170 at national level. Details are given at Table No.3.1.1
Details are given at Table No.3.2.2
CHAPTER 3HUMAN RESOURCES

‘Promoting Good Practices & Standards’16
There are 31,764 Police personnel actually deployed against the
sanctioned strength of 42,360. The highest number of personnel is 3,816 in
Punjab. Details are given at Table No.3.2.4
Table No.3.2.6
Unit force against sanctioned strength of 37,388. The highest number is 2,997 in
The CRPF assists the State Governments in maintenance of Law and
Order and in the performance of various internal security duties. BSF, ITBP,
need based assistance to the civil administration for maintenance of law and
order and internal security.
CHAPTER 3 HUMAN RESOURCES
‘Promoting Good Practices & Standards’ 17
The highest 3,02,632 of police personnel are in the Central Reserve Police
It is popularly known as the teeth to tail ratio. It is an important indicator
organizations in preparing management plan of the Police force. Generally,
This teeth to tail ratio for sanctioned strength of total police forces is approx.
CHAPTER 3HUMAN RESOURCES

‘Promoting Good Practices & Standards’18
CHAPTER 3 HUMAN RESOURCES

‘Promoting Good Practices & Standards’ 19
CHAPTER 3HUMAN RESOURCES

‘Promoting Good Practices & Standards’20
POLICE
Since independence, the Scheduled Castes and Scheduled Tribes are given
reservation status, guaranteeing constitutional representation. The constitution
classify castes which are socially and educationally disadvantaged. It is one of
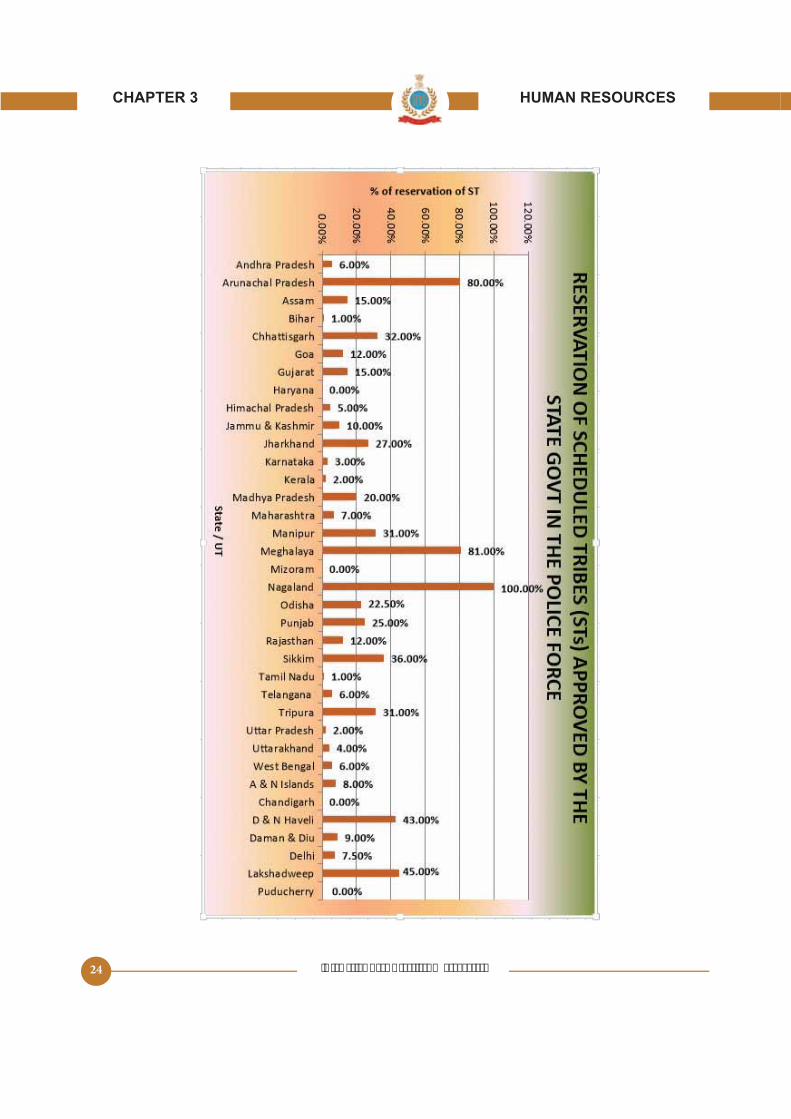
This section provides State/UT wise information about reservation of
reservation for Scheduled Castes, Scheduled Tribes and Other Backward
CHAPTER 3 HUMAN RESOURCES

‘Promoting Good Practices & Standards’ 21
Total number of actual strength of Police Personnel belonging to
UT. Details are given at Table No.3.1.6
Total number of actual strength of Police Personnel belonging to
State/UT. Details are given at Table No.3.1.7
Total number of actual strength of Police Personnel belonging to other
UT. Details are given at Table No.3.1.8
UT.
CHAPTER 3HUMAN RESOURCES

‘Promoting Good Practices & Standards’22
CHAPTER 3 HUMAN RESOURCES
Sikkim. The last column of the concerned table indicates reservation for OBCs in
At the end of this section, Reservation approved by State Government in

‘Promoting Good Practices & Standards’ 23
CHAPTER 3HUMAN RESOURCES
‘Promoting Good Practices & Standards’24
CHAPTER 3 HUMAN RESOURCES

‘Promoting Good Practices & Standards’ 25
CHAPTER 3HUMAN RESOURCES

‘Promoting Good Practices & Standards’26
SECTION-III: WOMEN IN POLICE
Availability of adequate women in police is essential for reducing the
vulnerability of women becoming victims of crime. It is seen that the existing
women police population ratio is still very low which should be increased. As
of events takes place in the form of medical examination of the victims,
recording of statement before the Magistrate, assigning the case to public
prosecutor and appearance in the Court proceedings. Overall shortage of
women police personnel is posing challenges in the form of increased crimes
against women, thereby emphasizing the need to bring women police to
frontline duties.
CHAPTER 3 HUMAN RESOURCES

‘Promoting Good Practices & Standards’ 27
It is essential that women are visible at the cutting edge level of public
interface. There is a tendency to engage women police only in situations like
security checks and other specialized duties relating to women, but unless
they are assigned main stream duties in the police stations, there would not be
adequate impact on the community.
Total strength of Women in police from 2013 to 2017 has shown an
increasing trend which is self-explanatory from the graph.
CHAPTER 3HUMAN RESOURCES

‘Promoting Good Practices & Standards’28
police personnel are working in Maharashtra. Details are given at Table No.3.2.1
Data on Actual Strength of Rank wise Women Police in Central Armed
number of 28,061 Women Police, the highest number is 8,303 in Central
Percentage of Reservation of women approved by Government in CAPFs
as on 01.01.2018 is shown in the last column of the concerned table.
States/UTs-Wise data for Actual Percentage of Women Police in
are given at Table No.3.2.1
At all India level, the Actual Strength of Women Police in other
CHAPTER 3 HUMAN RESOURCES

‘Promoting Good Practices & Standards’ 29
UTS POLICE
This section provides information regarding the total Budget for States
/ UTs, expenditure of State/UT Police forces, Police training expenditure &
modernization grants by the Central Government, State Governments.
The sanctioned strength of State Police Forces has increased to 24.84 lakh
in 2017 over 24.64 lakh in 2016 and the expenditure on State Police Forces has
increased to Rs. 108174.88 crores in 2017-18 over Rs. 10,6821.16 crores
CHAPTER 4
CHAPTER 4
‘Promoting Good Practices & Standards’30
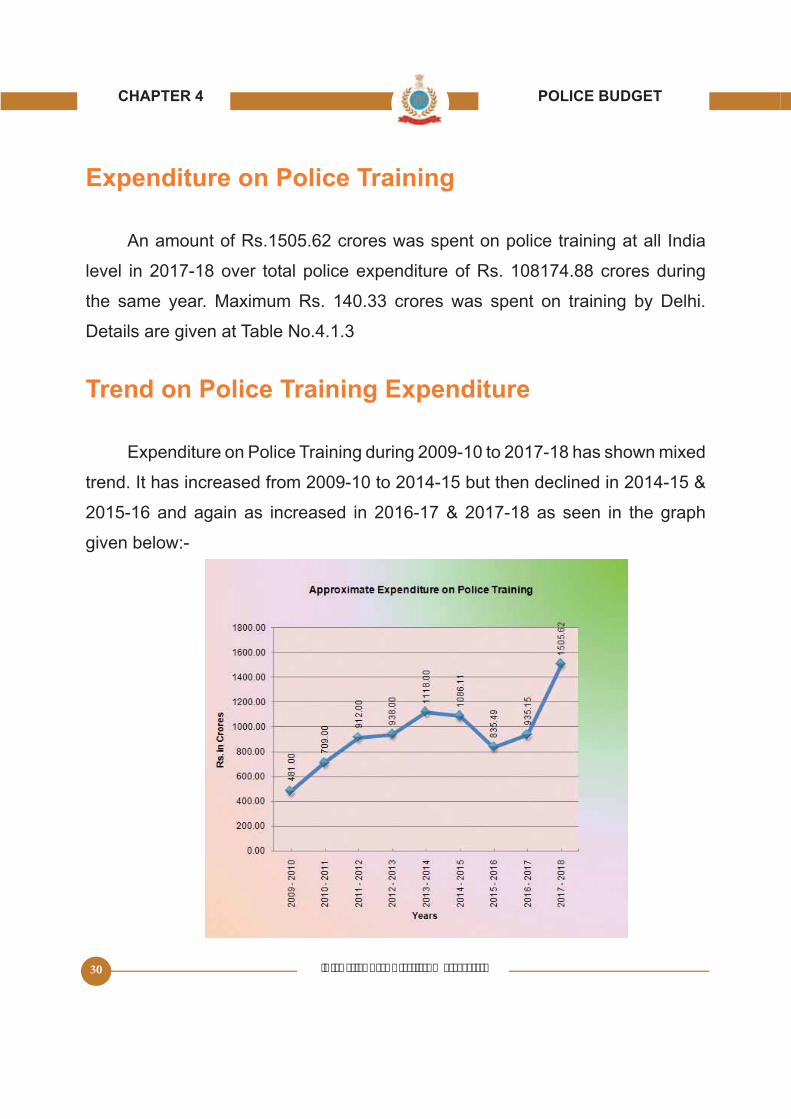
level in 2017-18 over total police expenditure of Rs. 108174.88 crores during
the same year. Maximum Rs. 140.33 crores was spent on training by Delhi.
Details are given at Table No.4.1.3
Expenditure on Police Training during 2009-10 to 2017-18 has shown mixed
given below:-
CHAPTER 4
‘Promoting Good Practices & Standards’ 31
especially meant to upgrade the infrastructure of the state police forces in
order to improve their capabilities to meet the emerging challenges to internal
security in the form of terrorism, extremism, naxalism etc. besides improving
The focus of the scheme is on the strengthening of the police
infrastructure by way of construction of secure and people friendly Police
computeriza-
tion,
equipment.
At all India level the grants made available to the police forces in the
the total amount utilized for modernization by the State Government for State
Police Forces are given at the table No. 4.1.4
At the end of this section, all India level percentage of expenditure of police
training budget is shown in the graph.
CHAPTER 4

‘Promoting Good Practices & Standards’32
CHAPTER 4

‘Promoting Good Practices & Standards’ 33
during the year 2017-18 is presented in the section.
Central Armed Police Forces are raised and maintained by the Ministry of
Ministry of Railways has also been included in this category.
CHAPTER 4

‘Promoting Good Practices & Standards’34
Districts, Police Sub-Divisions / Circles and Police Stations (Rural &
Stations for special purposes, number of Armed Police Battalions and the Police
Commissionerates in India.
total of 16,422 Police Stations in the country. The state of Tamil Nadu has the
CHAPTER 5
CHAPTER 5

‘Promoting Good Practices & Standards’ 35
maximum of 1,962 Police Stations. The lowest number i.e. 2 Police Stations,
Police Stations
Out of total 16,422 sanctioned Police Stations the maximum number, that is
Police Posts
Data on the sanctioned Police Posts/Outposts reveals that out of the total
few others have either not set up or have changed the nomenclature of some
Police Stations for Special Purposes
Data on Police Stations for Special Purposes, namely – Crime against SC/
ST/Weaker Sections, Crime against Children, Anti-Corruption/Vigilance, Costal
CHAPTER 5
‘Promoting Good Practices & Standards’36
The total number of Armed Police Battalions with all the States/UTs in the
country are 362. The highest number of 36 Armed Police Battalions are with
There are 61 Police Commissionerates functioning in the Country, out of
which the highest 10 is in the Maharashtra followed by 9 in Karnataka. Details
At the end of this section, State/UT wise police stations : sanctioned is
shown in the graph.
CHAPTER 5

‘Promoting Good Practices & Standards’ 37
CHAPTER 5

‘Promoting Good Practices & Standards’38
available with States / UTs Police & CAPFs. Number of vehicles available per
100 policemen has also been given.
Mobility is measured in terms of the ability of the entire strength of a Police
unit to move immediately. Police mobility is directly linked to Police performance.
protecting life and property.
Vehicles required to provide mobility to Police Forces have been
CHAPTER 5

‘Promoting Good Practices & Standards’ 39
Apart from these vehicles, state police have also procured special purpose
vehicles like mine proof, riot control vehicles, ambulances, mobile forensic
vehicles have been covered under the ‘other category’.
Total number of 2,01,127 vehicles were available with States/UTs
Police during year 2017 which is an increase as compared to 1,99,062 of the
previous year data. Out of the total of 2,01,127 vehicles, 12,273 are heavy duty
policemen was 8.10 at national level which has increased in comparision
with State/UT police is shown in the graph.
CHAPTER 5

‘Promoting Good Practices & Standards’40
CHAPTER 5

‘Promoting Good Practices & Standards’ 41
SECTION III: POLICE COMMUNICATION
This section deals with States/UTs wise data on Police Communications.
Number of Police Stations having / not having vehicle, telephones and wireless/
mobiles have also been given.
police organization. Some Police Stations are yet to be connected from Police
Following information have emerged from the data collected from all States/
CHAPTER 5
‘Promoting Good Practices & Standards’42
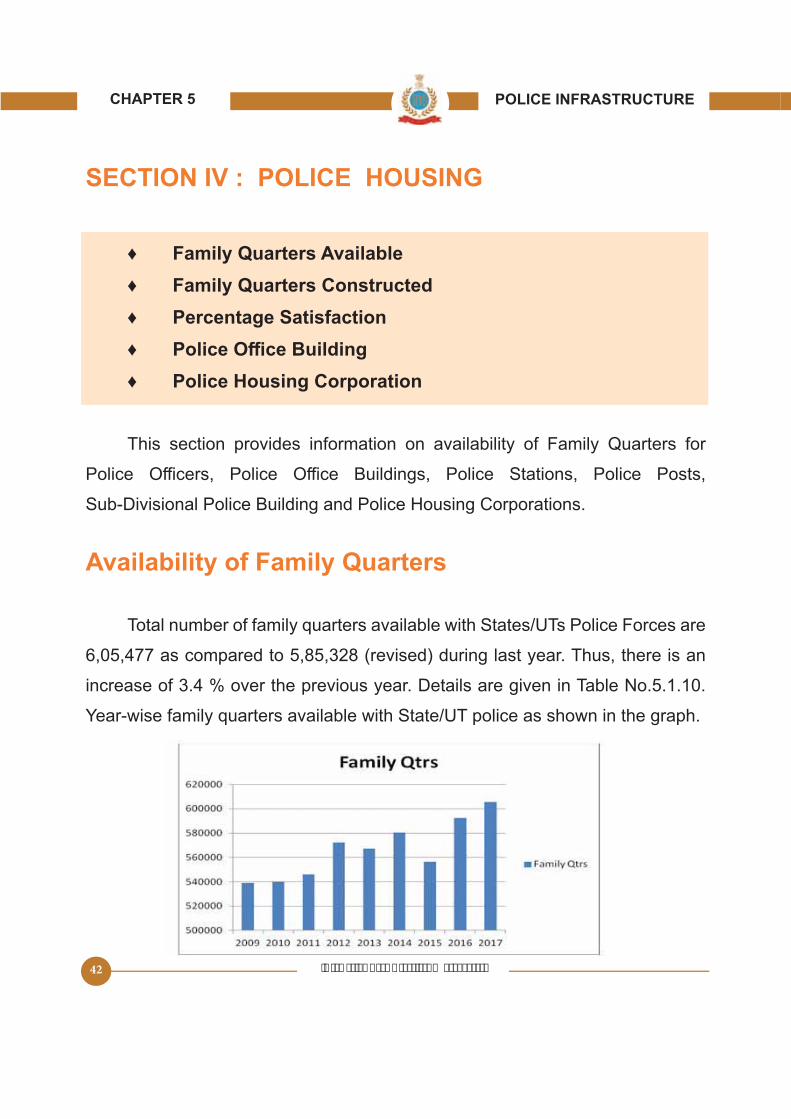
This section provides information on availability of Family Quarters for
Total number of family quarters available with States/UTs Police Forces are
Year-wise family quarters available with State/UT police as shown in the graph.
CHAPTER 5

‘Promoting Good Practices & Standards’ 43
In all States/UTs 20,149 family quarters are constructed during the year
The percentage satisfaction level of family accommodation for Gazetted
2017.
Overall the Satisfaction level of family accommodation during the year
CHAPTER 5

‘Promoting Good Practices & Standards’44
CHAPTER 5

‘Promoting Good Practices & Standards’ 45
This section provides information on State/UT wise data on availability of
CCTV Camera, Computers, Servers & Laptops, Speedometers, Breath Analyzers
& Forensic Science Laboratories / Mobile Forensic Science Vans held by the
police.
are facilitated with basic necessities like computers, cameras for security,
Forensic Science Laboratories / Mobile Forensic Vans etc. to work smoothly &
CHAPTER 6
CHAPTER 6
‘Promoting Good Practices & Standards’46
States/UTs wise information about Forensic Science Laboratories /
Mobile Forensic Science Vans collected and compiled as on 01.01.2018.
At national level data, total 718 FSL/MFSV in which 71 are Main Laboratories,
Details are given at Table No.6.1.1
are available with State/UTs Police Forces as on 1.1.2018. Details are given at
Table No.6.1.2
Analyzers are used by State/UTs Police as on 01.01.2018. Details are given at
Table No. 6.1.3
CHAPTER 6

‘Promoting Good Practices & Standards’ 47
Tracker dogs are available with Police as on 01.01.2018. Details are given at
during the year 2017 which decrease as compared to 20,828 during 2016. Details
are given in Table No.6.1.6.
From the analysis of State/UT wise data, it is observed that during 2017
a total number of Sanctioned Police Personnel for giving protection are
A total of 1769 companies of Central Armed Police Forces (BSF, CRPF,
CHAPTER 6

‘Promoting Good Practices & Standards’48
of the country for more than six months during 2017. Details are given at Table
No.6.1.7
UTs has shown a steady increase from the year 2009 to 2014 but decreased in
At state level, it is observed that out of 1,769 the total Number of
companies, the maximum of 713 companies of CAPFs were deployed in
CHAPTER 6

‘Promoting Good Practices & Standards’ 49
This Section depicts the information/data of States/UTs in respect of
number of newly recruited police personnel trained.
2017 against 71,711 in 2016 in the country. At state level the highest
numbers of 33,347 recruitments are made in Uttar Pradesh followed by 16,980 in
Gujarat. Details are given at Table No.6.1.8
level the highest number SIs/ASIs recruited are1,019 in Tamil Nadu.
CHAPTER 6

‘Promoting Good Practices & Standards’50
Police, followed by 44 Dy.SsP from Odisha got training during 2017. 1,398
SIs/ASIs from Odisha, followed by 700 from Goa are trained during the
period. The highest number 29,000 constables from Uttar Pradesh, followed by
Details are given at Table No.6.2.2
It contains the detailed information about the Training Institutes of States,
UTs and Central Police Organizations. These Training Institutes provide Basic
CHAPTER 6

‘Promoting Good Practices & Standards’ 51
training to newly recruited police personnel, in service training to working police
personnel and specialized training to Special Task Forces, Special Investigation
Squads, Commandoes etc. Some Training Institutes have been recognized as
Centers of Excellence in imparting specialized training course in a
particular craft by virtue of requisite upgradation in their training infrastructure.
Regular and adequate training of police personnel at all levels is necessary to
personnel.
During 2017, a total of 164 Training Institutes run by the State Police
Forces are functioning in the country. The States wise names and addresses
/ Contact Numbers of each institute are given. The highest number of training
institutes are 17 in Madhya Pradesh followed by 14 in Karnataka.
During 2017 a total of 8 Training Institutes run by the UTs Police
Forces are functioning in the country. The UTs wise names and addresses /
Conatct Numbers of each institute are given. The highest numbers of Training
Institutes are 4 in Delhi.
CHAPTER 6

‘Promoting Good Practices & Standards’52
Central
running under the Central Police Organizations out of which highest 23
under BSF followed by 17 under CRPF, SSB and ITBP. Details are given
at Appendix 1 & 2.
CHAPTER 6

‘Promoting Good Practices & Standards’ 53
This Section provides States/UTs wise data on Departmental Proceed-
forward from previous year against Police personnel are reported during 2017.
followed by 8,144 in Bihar. Details are given at Table No.6.2.3
CHAPTER 6

‘Promoting Good Practices & Standards’54
Medals are awarded to the police personnel for exhibiting conspicuous
gallant act in saving life and property, or in preventing crime or arresting dangerous
performance to the Police personnel from the States/UTs and Central Armed
Police Forces.
have been given to CRPF followed by 64 in Andhra Pradesh. Details are given
A comparative pay scales of police personnel from the rank of Constable to
of the country are given at the Appendix 3 & 4.
CHAPTER 6

‘Promoting Good Practices & Standards’ 55
CHAPTER 6
last nine years 2009 to 2017 has shown mixed trend. Increasing trend has been
witnessed in 2010. There is a slight decrease in 2009. During 2010 to 2014
than one and two years during 2017 are given at Table – 6.2.6.

‘Promoting Good Practices & Standards’56
Sl No Particulars
1 Projected Population (in 12,32,708 12,62,940 12,87,471
2 Total Sanctioned Police Force (Civil + District Armed Reserve
13,34,344 18,38,616 18,30,131 24,84,170
3 Sanctioned Strength of Civil Police 4,11,871 4,31,873
4 Sanctioned Strength of District 279428
Sanctioned strength of State Armed Police
20,69,918 22,83,646 22,80,691
6 Population per policeperson
7
Policeperson per lakh of population
Civil Police 117 140 140 149
District Armed Reserve Police 21.70
Armed Police 46.68
Total Police 176 176 181
8
Police person per 100sq kms.
Civil Police 42 23
District Armed Reserve Police 8.82
Armed Police 18.98
Total Police 67 72 72
9 43 84 100 101 101 101
10 Number of Police Ranges 167 177 177 179 184
11 Number of Police Districts 672 690 708 718 727 764
12 Number of Police Sub-divisions 1,761 2,014 2,011 2,386
13 Number of Police Circles 2,479 2,467 2,387 2,422
14 Number of Police Stations 13,719 14,786 16,422
Number of Police Out-Posts
8,368 9,081
16 Number of State Armed Police Battalions
377+2 Coys
414+4 Coys
422+1 Coys
434+4 Coys Coys
362
17 Number of Central Reserve Police Force Battalions
‘Promoting Good Practices & Standards’ 57
POPULATION States Police
Police StationsS A
1 Andhra Pradesh * 1,63,321.0 49,670 72,176 1,021
2 Arunachal Pradesh 83,743.0 13,137 104
3 Assam 78,438.0 33,022 343
4 Bihar 94,163.0 1,28,286 1,064
Chhattisgarh 26,366 71,606
6 Goa 3,702.0 8,312 6,941 43
7 Gujarat 1,96,244.0 63,947 1,09,337 88,267 710
8 44,212.0 28,098 61,346 368
9 7,184 18,472 129
10 2,22,236.0 12,618 87,882 77,838 222
11 79,839.0 61,019
12 Karnataka 1,91,791.0 63,228 1,00,243 78,300 1,048
13 Kerala 38,870.9
14 Madhya Pradesh 79,607 93,376 1,100
Maharashtra 3,07,713.0 2,40,224 2,14,029 1,162
16 Manipur 22,327.0 33,080 24,843 113
17 Meghalaya 22,429.0 2,820 16,367 12,691 62
18 Mizoram 21,082.0 1,080 9,792 7,062 38
19 Nagaland 16,183.0 2,420 21,292 22,233 78
20 Odisha 43,001 66,973
21 Punjab 88,742 401
22 Rajasthan 3,42,111.3 1,06,232 88,229 862
23 Sikkim 7,096.0 6,080 29
24 Tamil Nadu 1,30,066.9 69,926 1,24,130 1,01,710 1,962
Telangana * 76,407 46,062 788
26 Tripura 10,486.0 3,890 27,378 81
27 Uttar Pradesh 2,40,994.8 4,14,492
28 Utarakhand 10,837 21,124
29 West Bengal 94,794 1,40,904 91,923
30 A & N Islands 8,249.0 4,274 24
31 Chandigarh 114.0 1,907 8,700 7,748 17
32 491.0 446 333 2
33 Daman & Diu 110.6 372
34 Delhi 1,483.4 22,261 74,712 194
Lakshadweep 29.6 83 610 374 16
36 Puducherry 490.0 1,771 3,473 2,644

‘Promoting Good Practices & Standards’58
-
-
-
S A S A S A
1 Andhra Pradesh * 688.18 2.26 3.01 10.89 14.48
2 Arunachal Pradesh 101.62 122.97 6.37 7.71 8.72
3 Assam 1.19 1.44 7.12 8.62
4 Bihar 824.28 0.73 1.21 6.98 11.48
Chhattisgarh 368.21 441.72 1.89 2.26 6.63
6 Goa 246.63 8.17 9.78
7 Gujarat 724.47 1.79 2.22 11.83
8 631.39 0.72 0.99 7.21 9.94
9 388.91 434.47 3.01 3.37 6.22
10 162.11 2.86 10.16 11.48
11 429.21 1.00 1.31 8.92 11.69
12 Karnataka 1.91 11.60
13 Kerala 807.47 0.72 0.87 13.19
14 Madhya Pradesh 687.86 2.66 3.30 10.64
Maharashtra 1.28 1.44 7.36 8.26
16 Manipur 79.66 106.07 0.67 0.90 6.73 8.96
17 Meghalaya 172.30 222.20 1.37 1.77 7.06 9.10
18 Mizoram 110.29 2.99 6.84 9.49
19 Nagaland 113.66 0.76 0.73 6.37 6.10
20 Odisha 642.06 2.32 9.71 11.48
21 Punjab 332.71 0.61 7.41 7.98
22 Rajasthan 701.30 844.39 3.22 3.88 6.88 8.29
23 Sikkim 108.06 122.62 1.17 1.32 7.29 8.27
24 Tamil Nadu 1.28 14.69 17.93
Telangana * 1.47 2.43 13.10 21.73
26 Tripura 142.08 166.06 0.38 7.00 8.18
27 Uttar Pradesh 782.60 0.84 3.40 4.93
28 Utarakhand 2.60 7.89 8.10
29 West Bengal 672.76 1,031.23 0.63 0.97 10.33
30 A & N Islands 133.36 144.01 1.93 2.08 16.30
31 Chandigarh 219.20 246.13 0.01 0.01 8.01 9.00
32 1,339.34 1.39 1.47 22.03 23.42
33 Daman & Diu 706.00 948.92 0.22 0.30 20.16
34 Delhi 297.96 0.02 0.02 7.73
Lakshadweep 136.07 221.93 0.08
36 Puducherry 669.82 0.14 0.19 19.86
663

‘Promoting Good Practices & Standards’ 59
Sl. No. STATE/ UT Civil Police per lakh of Population
District Armed Reserve Police per lakh of
Population
Armed Police per lakh of Population
Total Police per lakh of Population
S A S A S A S A
1 Andhra Pradesh 88.43 69.13 31.16 24.72 109.21
2 Arunachal Pradesh 396.33 116.78 300.07 984.04 813.18
3 Assam 69.41 36.69 93.73 83.22 199.83
4 Bihar 4.29 2.18 7.42 121.32 73.76
Chhattisgarh 177.36 0.00 0.00 94.22 83.88 226.39
6 Goa 274.63 248.78 0.00 0.00 130.83 89.80
7 Gujarat 91.83 77.60 36.36 30.19 42.79 30.24 170.98 138.03
8 129.91 0.00 0.00 33.30 28.48 218.33
9 144.43 11.43 90.33 74.30 230.16
10 383.71 0.00 0.00 280.63 233.17 696.48 616.88
11 28.17 122.60 44.14 232.99 177.82
12 Karnataka 101.14 84.07 13.84 123.84
13 Kerala 113.63 93.97 11.43 9.08 20.79 123.84
14 Madhya Pradesh 0.00 0.00 31.39 117.30
Maharashtra 147.20 13.84 16.43 13.88 196.34 174.93
16 Manipur 430.40 0.00 0.00 942.81
17 Meghalaya 160.92 96.88 81.63 278.37 207.48
18 Mizoram 276.76 0.00 0.00 377.13 906.67
19 Nagaland 242.60 209.71 107.69 879.83 918.72
20 Odisha 72.06 24.32 23.06 48.87 131.74
21 Punjab 218.24 0.00 0.00 60.69 278.93
22 Rajasthan 119.69 99.29 0.00 0.00 22.90 19.14 118.43
23 Sikkim 377.63 380.82 0.00 0.00 434.70
24 Tamil Nadu 127.04 28.41 46.78 22.07 19.16
Telangana 121.43 26.88 38.84 19.38 218.28
26 Tripura 208.48 169.33 337.84 703.80 602.19
27 Uttar Pradesh 84.62 0.00 0.00 43.16 127.78
28 Uttarakhand 98.60 102.21 44.13 194.92 189.68
29 West Bengal 94.10 24.09 16.96 21.27 148.64 96.97
30 A & N Islands 82.81 162.63 749.82 694.39
31 Chandigarh 347.19 301.47 60.41 60.41 48.61 44.42 406.29
32 79.37 74.66 0.00 0.00 0.00 0.00 79.37 74.66
33 Daman & Diu 141.64 0.00 0.00 0.00 0.00 141.64
34 Delhi 347.46 0.00 0.00 41.26 388.71
Lakshadweep 734.94 0.00 0.00 0.00 0.00 734.94
36 Puducherry 148.28 119.03 0.00 0.00 47.83 30.27 196.10 149.29
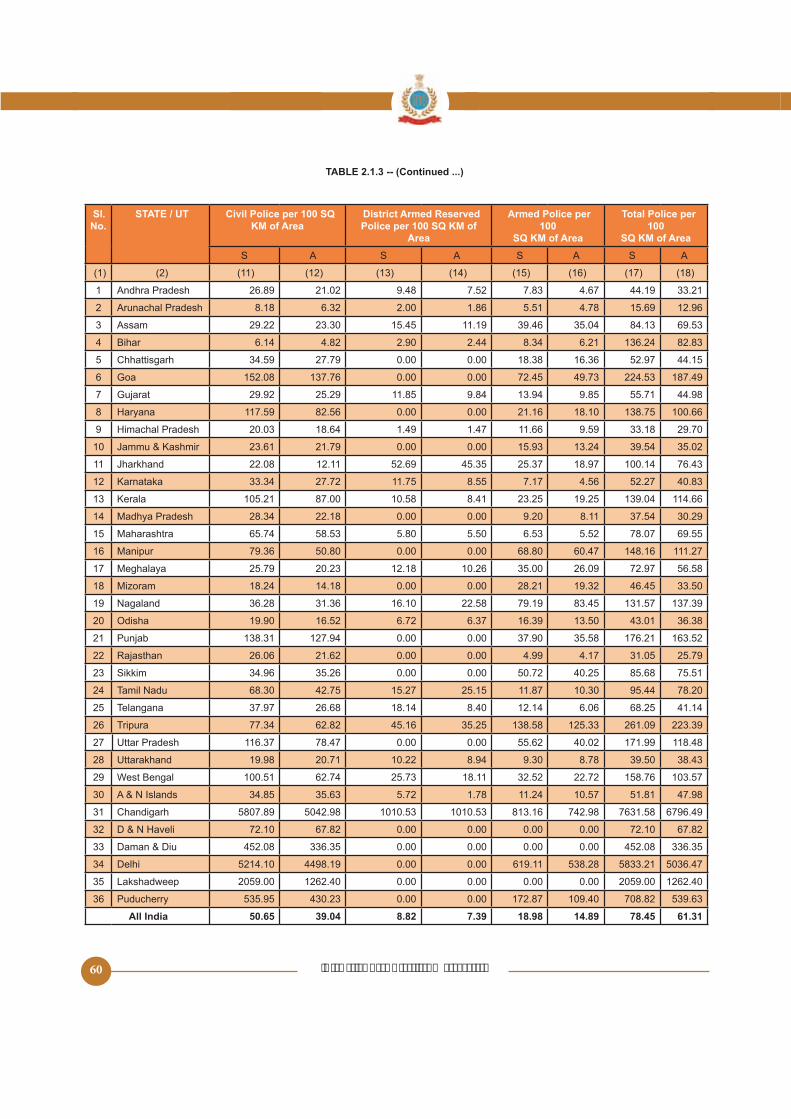
‘Promoting Good Practices & Standards’60
Area
Total Police per
S A S A S A S A
1 Andhra Pradesh 26.89 21.02 9.48 7.83 4.67 44.19 33.21
2 Arunachal Pradesh 8.18 6.32 2.00 1.86 4.78 12.96
3 Assam 29.22 23.30 11.19 39.46 84.13
4 Bihar 6.14 4.82 2.90 2.44 8.34 6.21 136.24 82.83
Chhattisgarh 27.79 0.00 0.00 18.38 16.36
6 Goa 137.76 0.00 0.00 49.73 187.49
7 Gujarat 29.92 9.84 13.94 44.98
8 0.00 0.00 21.16 18.10 100.66
9 20.03 18.64 1.49 1.47 11.66 33.18 29.70
10 23.61 21.79 0.00 0.00 13.24
11 22.08 12.11 18.97 100.14 76.43
12 Karnataka 33.34 27.72 7.17 40.83
13 Kerala 87.00 8.41 139.04 114.66
14 Madhya Pradesh 28.34 22.18 0.00 0.00 9.20 8.11 30.29
Maharashtra 78.07
16 Manipur 79.36 0.00 0.00 68.80 60.47 148.16 111.27
17 Meghalaya 20.23 12.18 10.26 26.09 72.97
18 Mizoram 18.24 14.18 0.00 0.00 28.21 19.32
19 Nagaland 36.28 31.36 16.10 79.19 137.39
20 Odisha 19.90 6.72 6.37 16.39 43.01 36.38
21 Punjab 138.31 127.94 0.00 0.00 37.90 176.21
22 Rajasthan 26.06 21.62 0.00 0.00 4.99 4.17
23 Sikkim 34.96 0.00 0.00
24 Tamil Nadu 68.30 11.87 10.30 78.20
Telangana 37.97 26.68 18.14 8.40 12.14 6.06 41.14
26 Tripura 77.34 62.82 261.09 223.39
27 Uttar Pradesh 116.37 78.47 0.00 0.00 40.02 171.99 118.48
28 Uttarakhand 19.98 20.71 10.22 8.94 9.30 8.78 38.43
29 West Bengal 62.74 18.11 22.72
30 A & N Islands 1.78 11.24 47.98
31 Chandigarh 813.16 742.98 6796.49
32 72.10 67.82 0.00 0.00 0.00 0.00 72.10 67.82
33 Daman & Diu 0.00 0.00 0.00 0.00
34 Delhi 4498.19 0.00 0.00 619.11
Lakshadweep 1262.40 0.00 0.00 0.00 0.00 1262.40
36 Puducherry 430.23 0.00 0.00 172.87 109.40 708.82

‘Promoting Good Practices & Standards’ 61
Police Police
Police
S A S A S A S A
1 Andhra Pradesh 43,921 34,337 12276 12,780 7,630 72,176
2 Arunachal Pradesh 1672 4,614 4,006 13,137
3 Assam 22,920 18,279 12116 8774 27,482
4 Bihar 28,320 48872 24,430 1,28,286
Chhattisgarh 46,764 0 0 24,842 22,117 71,606
6 Goa 0 0 2,682 1,841 8,312 6,941
7 Gujarat 49,624 19308 27,362 1,09,337 88,267
8 0 0 8,001 61,346
9 10,376 832 821 6,489 18,472
10 48,416 0 0 29,422 87,882 77,838
11 42070 36209 61,019
12 Karnataka 63,948 16392 1,00,243 78,300
13 Kerala 33,819 4114 3269 9,037 7,482
14 Madhya Pradesh 87,371 0 0 28,360 24,991 93,376
Maharashtra 2,02,276 1,80,108 16938 20,098 16,983 2,40,224 2,14,029
16 Manipur 17,719 11,341 0 0 33,080 24,843
17 Meghalaya 2732 2302 16,367 12,691
18 Mizoram 2,989 0 0 4,073 9,792 7,062
19 Nagaland 2606 21,292 22,233
20 Odisha 30,988 9917 66,973
21 Punjab 0 0 19,088 17,918 88,742
22 Rajasthan 89,169 73,969 0 0 17,063 14,260 1,06,232 88,229
23 Sikkim 2,481 0 0 6,080
24 Tamil Nadu 88,832 32714 1,24,130 1,01,710
Telangana 29,870 20308 9409 6,783 76,407 46,062
26 Tripura 8,110 4736 3696 13,142 27,378
27 Uttar Pradesh 1,89,101 0 0 1,34,036 96,439 4,14,492
28 Uttarakhand 11,076 4782 4,972 4,698 21,124
29 West Bengal 89,203 22838 16076 28,863 20,162 1,40,904 91,923
30 A & N Islands 2,939 472 147 927 872 4,274
31 Chandigarh 6,621 927 847 8,700 7,748
32 333 0 0 0 0 333
33 Daman & Diu 372 0 0 0 0 372
34 Delhi 77,347 66,727 0 0 9,184 74,712
Lakshadweep 610 374 0 0 0 0 610 374
36 Puducherry 2,626 2,108 0 0 847 3,473 2,644

‘Promoting Good Practices & Standards’62
Sl. No. STATE / UT Vacancy / Surplus Total Actual Strength of Women Police (Civil + District Armed
1 Andhra Pradesh 17,933 2,069
2 Arunachal Pradesh 2,281 876
3 Assam 3,047
4 Bihar 7,397
Chhattisgarh 11,916 3,279
6 Goa 1,371
7 Gujarat 21,070 9,279
8 16,844
9 1,937 1,947
10 10,044 2,913
11 18,931 4,099
12 Karnataka 21,943 6,162
13 Kerala 9,476
14 Madhya Pradesh
Maharashtra 27,167
16 Manipur 8,237 2,063
17 Meghalaya 3,676
18 Mizoram 2,730
19 Nagaland -941 1,629
20 Odisha 10,322
21 Punjab 6,389 6,668
22 Rajasthan 18,003
23 Sikkim 722 369
24 Tamil Nadu 22,420 17,968
Telangana 1,490
26 Tripura 1,190
27 Uttar Pradesh 22,778
28 Uttarakhand
29 West Bengal 48,981 7,487
30 A & N Islands 316 491
31 Chandigarh 1,167
32 21 49
33 Daman & Diu 128 44
34 Delhi 11,819 7,099
Lakshadweep 236 30
36 Puducherry 829 264

‘Promoting Good Practices & Standards’ 63
Sl. No.
STATE / UT DGP/Spl.DGP Addl.DGP IGP DIG
S A V S A V S A V S A V
1 Andhra Pradesh 6 6 0 0 22 23 -1 13 11 2
2 Arunachal Pradesh 1 1 0 0 2 2 0 6 3 3
3 Assam 4 4 0 14 11 3 8 7 14 6 8
4 Bihar 3 -2 9 9 0 23 18 20 12 8
Chhattisgarh 2 -3 3 -2 8 8 0 10 14 -4
6 Goa 1 1 0 0 0 0 1 1 0 2 2 0
7 Gujarat 9 4 21 17 4 31 6 21 14 7
8 16 12 4 13 9 4 19 6 19 14
9 1 4 -3 6 1 18 12 6 14 10 4
10 4 7 -3 6 11 19 21 -2 22 8 14
11 2 2 0 0 9 -9 0 10 -10 0
12 Karnataka 6 6 0 21 19 2 29 19 10 23 14 9
13 Kerala 8 7 1 10 10 0 18 10 8 10 10 0
14 Madhya Pradesh 10 -30 30 24 6 22 29 -7
Maharashtra 8 7 1 26 26 0 31 30 1 33 30 3
16 Manipur 1 1 0 0 9 2 7 9 8 1
17 Meghalaya 1 1 0 6 2 4 6 2 4 6 4 2
18 Mizoram 1 1 0 1 0 1 2 2 0 3 2
19 Nagaland 1 1 0 2 2 0 9 9 0 13 13 0
20 Odisha 1 1 0 6 11 18 12 6 17 7 10
21 Punjab 6 6 0 9 7 2 36 36 0 14 11 3
22 Rajasthan 2 2 0 8 18 -10 22 26 -4 16 7 9
23 Sikkim 2 -2 2 4 -2 3 3 0 4 2 2
24 Tamil Nadu 6 1 24 21 3 43 37 6 20
Telangana 3 3 0 7 7 0 23 23 0 8 8 0
26 Tripura 2 1 1 2 1 1 6 3 3 7 3 4
27 Uttar Pradesh 7 14 -7 21 39 -18 31 20 19 31
28 Uttarakhand 2 1 1 2 1 1 6 3 3 7 3 4
29 West Bengal 10 10 0 30 26 4 47 42 31 27
30 A & N Islands 0 0 0 1 1 0 1 2 -1 2 2 0
31 Chandigarh 0 0 0 0 1 -1 1 0 1 1 1 0
32 0 0 0 0 0 0 0 0 0 0 0 0
33 Daman & Diu 0 0 0 0 0 0 0 0 0 1 1 0
34 Delhi 1 1 0 12 14 -2 20 14 6 20 6 14
Lakshadweep 0 0 0 0 0 0 0 0 0 0 0 0
36 Puducherry 1 1 0 0 0 0 1 1 0 0 1 -1
133 -13 353 -56 575 336

‘Promoting Good Practices & Standards’64
Sl. No.
STATE / UT AIGP/SSP/SP/ COMMANDANT Addl.SP/Dy. COMMANDANT ASP/DY.SP
S A V S A V S A V
1 Andhra Pradesh 68 17 91 72 19 137 317
2 Arunachal Pradesh 19 6 19 9 10 20 20 0
3 Assam 78 70 8 77 61 16 188 167 21
4 Bihar 69 -18 24 1 333 219
Chhattisgarh 48 41 7 -40 -26
6 Goa 14 12 2 0 0 0 32 18 14
7 Gujarat 117 81 36 0 0 0 298 272 26
8 61 36 14 13 1 191 189 2
9 37 34 3 16 12 4 64 64 0
10 138 -27 0 0 0 390
11 149 113 36 0 8 -8 390 180 210
12 Karnataka 83 2 110 77 33 418 374 44
13 Kerala 1 22 22 0 248 27
14 Madhya Pradesh -30 266 236 30 1,009 692 317
Maharashtra 217 210 7 42 3 831 247
16 Manipur 31 26 23 12 96 70 26
17 Meghalaya 30 31 -1 8 3 40 12
18 Mizoram 19 19 0 11 -14 44 49
19 Nagaland 42 42 0 63 61 2 0
20 Odisha 82 60 22 121 113 8 473 287 186
21 Punjab 163 176 -13 0 0 0 329 173
22 Rajasthan 132 292 216 76 470 409 61
23 Sikkim 27 26 1 22 29 -7 47
24 Tamil Nadu 121 121 0 116 89 27 700 122
Telangana 0 137 130 7 90
26 Tripura 28 27 1 16 6 10 111 114 -3
27 Uttar Pradesh 191 -40 296 11 968 702 266
28 Uttarakhand 16 28 -12 6 11 33 43 -10
29 West Bengal 133 111 22 79 61 18 417 86
30 A & N Islands 8 -3 0 0 0 17 -2
31 Chandigarh 0 3 0 3 21 18 3
32 1 1 0 1 0 1 1 1 0
33 Daman & Diu 2 3 -1 0 0 0 2 2 0
34 Delhi -6 36 19 17 300 187 113
Lakshadweep 1 2 -1 0 0 0 1 2 -1
36 Puducherry 22 18 4 0 0 0 0 0 0
238

‘Promoting Good Practices & Standards’ 65
Sl. No.
STATE / UT INSPECTOR S.I. A.S.I.
S A V S A V S A V
1 Andhra Pradesh 871 826 2,349 604
2 Arunachal Pradesh 97 96 1 130 432 80
3 Assam 2,789 2,193 2,178 1,968 210
4 Bihar 1,410 11,747 6,710 9,984 2,169
Chhattisgarh 732 600 132 2,133 1,186 947 2,871 1,880 991
6 Goa 10 370 233 137 201 189 12
7 Gujarat 611 494 3,233 2,388 7,271
8 812 670 142 2,048 1,240 808 4,863 4,010
9 214 169 433 76 1,009 860 149
10 832 792 40 922 3,244 499
11 1,143 2,824 7,388
12 Karnataka 1,247 1,193 2,766 1,861
13 Kerala 433 420 13 1,398 1,190 2,122 1,063
14 Madhya Pradesh 2,293 1,367 926 4,816 1,034 9,979 4,020
Maharashtra 7,939 6,844 6,649 3,103 3,218
16 Manipur 291 26 1,197 1,096 101 1,948 1,049 899
17 Meghalaya 177 166 11 697 161 173 12
18 Mizoram 176 171 389 69 488 133
19 Nagaland 280 274 6 20 473 20
20 Odisha 1,162 993 169 2,260 1,279 4,719 1,183
21 Punjab 988 838 2,693 2,272 421 3,977
22 Rajasthan 1,069 136 4,007 2,493 3,760 2,228
23 Sikkim 84 -30 160 170 221
24 Tamil Nadu 2,411 2,274 137 8,210 7,212 998 0 0 0
Telangana 888 679 209 3,039 764 2,478 2,011 467
26 Tripura 184 119 706 168 404 241
27 Uttar Pradesh 429 40,000 30,676 9,324 0 0 0
28 Uttarakhand 207 172 1,306 1,324 -18 0 0 0
29 West Bengal 1,631 1,110 10,238 7,181 13,167 8,402
30 A & N Islands -1 209 177 32 103 86 17
31 Chandigarh 63 63 0 239 239 0 223
32 3 3 0 18 16 2 8 0 8
33 Daman & Diu 8 4 4 29 4 29 13 16
34 Delhi 1,283 1,268 7,120 4,906 2,214 6,498 7,414 -916
Lakshadweep 6 6 0 18 4 14 43 16 27
36 Puducherry 62 3 274 117 101 42
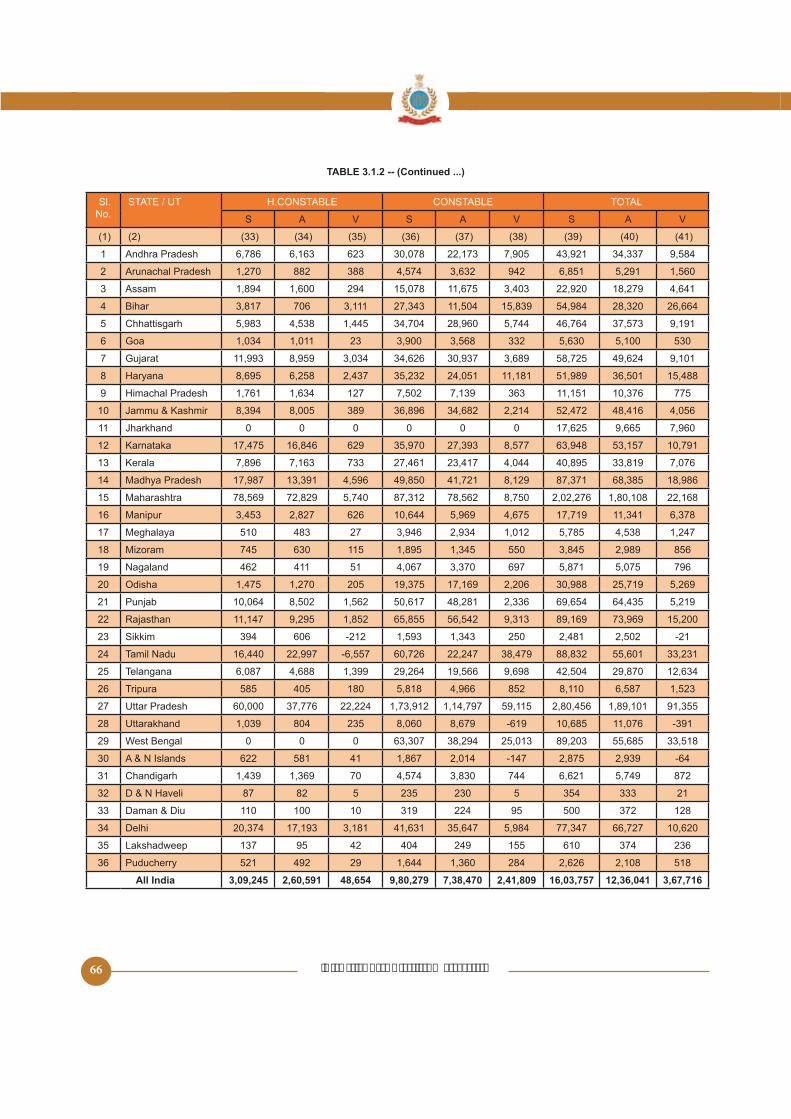
‘Promoting Good Practices & Standards’66
Sl. No.
STATE / UT CONSTABLE TOTAL
S A V S A V S A V
1 Andhra Pradesh 6,786 6,163 623 30,078 22,173 43,921 34,337
2 Arunachal Pradesh 1,270 882 388 3,632 942
3 Assam 1,894 1,600 294 3,403 22,920 18,279 4,641
4 Bihar 3,817 706 3,111 27,343 28,320 26,664
Chhattisgarh 34,704 28,960 46,764 9,191
6 Goa 1,034 1,011 23 3,900 332
7 Gujarat 11,993 3,034 34,626 30,937 3,689 49,624 9,101
8 2,437 11,181
9 1,761 1,634 127 7,139 363 10,376
10 8,394 389 36,896 34,682 2,214 48,416
11 0 0 0 0 0 0 7,960
12 Karnataka 16,846 629 27,393 63,948 10,791
13 Kerala 7,896 7,163 733 27,461 23,417 4,044 33,819 7,076
14 Madhya Pradesh 17,987 13,391 41,721 8,129 87,371 18,986
Maharashtra 72,829 87,312 2,02,276 1,80,108 22,168
16 Manipur 2,827 626 10,644 17,719 11,341 6,378
17 Meghalaya 483 27 3,946 2,934 1,012 1,247
18 Mizoram 630 2,989
19 Nagaland 462 411 4,067 3,370 697 796
20 Odisha 1,270 17,169 2,206 30,988
21 Punjab 10,064 48,281 2,336
22 Rajasthan 11,147 9,313 89,169 73,969
23 Sikkim 394 606 -212 1,343 2,481 -21
24 Tamil Nadu 16,440 22,997 60,726 22,247 38,479 88,832 33,231
Telangana 6,087 4,688 1,399 29,264 9,698 29,870 12,634
26 Tripura 180 4,966 8,110
27 Uttar Pradesh 60,000 37,776 22,224 1,73,912 1,14,797 1,89,101
28 Uttarakhand 1,039 804 8,060 8,679 -619 11,076 -391
29 West Bengal 0 0 0 63,307 38,294 89,203
30 A & N Islands 622 41 1,867 2,014 -147 2,939 -64
31 Chandigarh 1,439 1,369 70 3,830 744 6,621 872
32 87 82 230 333 21
33 Daman & Diu 110 100 10 319 224 372 128
34 Delhi 20,374 17,193 3,181 41,631 77,347 66,727 10,620
Lakshadweep 137 42 404 249 610 374 236
36 Puducherry 492 29 1,644 1,360 284 2,626 2,108

‘Promoting Good Practices & Standards’ 67
s
Sl. No.
STATE / UT Addl.DGP IGP DIG
S A V S A V S A V
1 Andhra Pradesh 0 0 0 0 0 0 0 0 0
2 Arunachal Pradesh 0 0 0 0 0 0 0 0 0
3 Assam 0 0 0 0 0 0 0 0 0
4 Bihar 0 0 0 0 0 0 0 0 0
Chhattisgarh 0 0 0 0 0 0 0 0 0
6 Goa 0 0 0 0 0 0 0 0 0
7 Gujarat 0 0 0 0 0 0 0 0 0
8 0 0 0 0 0 0 0 0 0
9 1 0 1 1 1 0 0 0 0
10 0 0 0 0 0 0 0 0 0
11 0 0 0 0 0 0 0 0 0
12 Karnataka 0 0 0 0 0 0 0 0 0
13 Kerala 1 1 0 0 0 0 1 1 0
14 Madhya Pradesh 0 0 0 0 0 0 0 0 0
Maharashtra 0 0 0 6 3 3 8 3
16 Manipur 0 0 0 0 0 0 0 0 0
17 Meghalaya 0 0 0 0 0 0 0 0 0
18 Mizoram 0 0 0 0 0 0 0 0 0
19 Nagaland 0 0 0 0 9 9 0
20 Odisha 0 0 0 0 0 0 0 0 0
21 Punjab 0 0 0 0 0 0 0 0 0
22 Rajasthan 0 0 0 0 0 0 0 0 0
23 Sikkim 0 0 0 0 0 0 0 0 0
24 Tamil Nadu 0 0 0 0 0 0 0 0 0
Telangana 0 0 0 0 0 0 0 0 0
26 Tripura 0 0 0 0 0 0 0 0 0
27 Uttar Pradesh 0 0 0 0 0 0 0 0 0
28 Uttarakhand 0 0 0 0 0 0 0 0 0
29 West Bengal 0 0 0 0 0 0 0 0 0
30 A & N Islands 0 0 0 0 0 0 0 0 0
31 Chandigarh 0 0 0 0 0 0 0 0 0
32 0 0 0 0 0 0 0 0 0
33 Daman & Diu 0 0 0 0 0 0 0 0 0
34 Delhi 0 0 0 0 0 0 0 0 0
Lakshadweep 0 0 0 0 0 0 0 0 0
36 Puducherry 0 0 0 0 0 0 0 0 0
2 1 1 12 3 18 13 5

‘Promoting Good Practices & Standards’68
Sl. No.
STATE / UT AIGP/SSP/SP/ COMMANDANT Addl.SP/Dy. COMMANDANT ASP/DY.SP
S A V S A V S A V
(1)
1 Andhra Pradesh 0 0 0 23 23 0 0
2 Arunachal Pradesh 2 2 0 2 2 0 6 6 0
3 Assam 0 0 0 0 0 0 0 0 0
4 Bihar 0 0 0 0 0 0 0 0 0
5 Chhattisgarh 0 0 0 0 0 0 0 0 0
6 Goa 0 0 0 0 0 0 0 0 0
7 Gujarat 0 0 0 0 0 0 88 87 1
8 0 0 0 0 0 0 0 0 0
9 7 7 0 12 11 1 40 31 9
10 0 0 0 0 0 0 0 0 0
11 0 0 0 0 0 0 0 0 0
12 Karnataka 20 12 8 0 0 0 38 12
13 Kerala 8 6 2 8 4 4 44 30 14
14 Madhya Pradesh 0 0 0 0 0 0 0 0 0
15 Maharashtra 2 0 2 16 16 0 0 0 0
16 Manipur 0 0 0 0 0 0 0 0 0
17 Meghalaya 0 0 0 0 0 0 0 0 0
18 Mizoram 0 0 0 0 0 0 0 0 0
19 Nagaland 0 16 16 0 0
20 Odisha 0 0 0 0 0 0 0 0 0
21 Punjab 0 0 0 0 0 0 0 0 0
22 Rajasthan 0 0 0 0 0 0 0 0 0
23 Sikkim 0 0 0 0 0 0 0 0 0
24 Tamil Nadu 6 1 6 0 6 78 22
25 Telangana 2 1 1 17 9 8 42 19 23
26 Tripura 0 0 0 0 0 0 16 7 9
27 Uttar Pradesh 0 0 0 0 0 0 0 0 0
28 Uttarakhand 0 0 0 7 8 36
29 West Bengal 0 0 0 0 0 0 17 12
30 A & N Islands 0 0 0 0 0 0 1 1 0
31 Chandigarh 0 0 0 0 0 0 1 1 0
32 0 0 0 0 0 0 0 0 0
33 Daman & Diu 0 0 0 0 0 0 0 0 0
34 Delhi 0 0 0 0 0 0 0 0 0
35 Lakshadweep 0 0 0 0 0 0 0 0 0
36 Puducherry 0 0 0 0 0 0 0 0 0
72 58 14 115 88 27 542 432

‘Promoting Good Practices & Standards’ 69
Sl. No.
STATE / UT INSPECTOR S.I. A.S.I.
S A V S A V S A V
1 Andhra Pradesh 167 137 30 419 238 181 847 774 73
2 Arunachal Pradesh 14 11 3 42 41 1 0
3 Assam 32 27 139 128 11 0 0 0
4 Bihar 107 388 1,997 1,067 930 0 0 0
Chhattisgarh 0 0 0 0 0 0 0 0 0
6 Goa 0 0 0 0 0 0 0 0 0
7 Gujarat 191 46 1,008 824 184 710
8 0 0 0 0 0 0 0 0 0
9 1 1 0 0 17 17 0
10 0 0 0 0 0 0 0 0 0
11 0 0 0 0 0 0 0 0 0
12 Karnataka 126 100 26 491 202 289 2,064 1,793 271
13 Kerala 43 24 19 107 98 9 88 17
14 Madhya Pradesh 0 0 0 0 0 0 0 0 0
Maharashtra 489 447 42 1,280 949 331 1,291 1,232
16 Manipur 0 0 0 0 0 0 0 0 0
17 Meghalaya 3 3 0 27 0 0 0
18 Mizoram 0 0 0 0 0 0 0 0 0
19 Nagaland 139 138 1 99 99 0 0 0 0
20 Odisha 40 33 7 174 133 41 83 42
21 Punjab 0 0 0 0 0 0 0 0 0
22 Rajasthan 0 0 0 0 0 0 0 0 0
23 Sikkim 0 0 0 0 0 0 0 0 0
24 Tamil Nadu 311 311 0 1,218 981 237 0 0 0
Telangana 146 90 210 1,061
26 Tripura 20 31 117 97 20 0 0 0
27 Uttar Pradesh 0 0 0 0 0 0 0 0 0
28 Uttarakhand 46 31 103 0 0 0
29 West Bengal 130 67 63 671 417 1,836
30 A & N Islands 2 2 0 8 7 1 1 0
31 Chandigarh 8 8 0 28 28 0 0 0 0
32 0 0 0 0 0 0 0 0 0
33 Daman & Diu 0 0 0 0 0 0 0 0 0
34 Delhi 0 0 0 0 0 0 0 0 0
Lakshadweep 0 0 0 0 0 0 0 0 0
36 Puducherry 0 0 0 0 0 0 0 0 0
766

‘Promoting Good Practices & Standards’70
Sl. No.
STATE / UT CONSTABLE TOTAL
S A V S A V S A V
1 Andhra Pradesh 2,746 2,481 11,220 12,276 3,199
2 Arunachal Pradesh 319 306 13 1,282 1,186 96 1,672 113
3 Assam 2,233 1,904 329 9,712 2,997 12,116 8,774 3,342
4 Bihar 8,127 4,342 28,987 9,266 48,872 14,369
Chhattisgarh 0 0 0 0 0 0 0 0 0
6 Goa 0 0 0 0 0 0 0 0 0
7 Gujarat 2,064 1,727 337 17,944 2,664 19,308 3,942
8 0 0 0 0 0 0 0 0 0
9 78 78 0 670 670 0 832 821 11
10 0 0 0 0 0 0 0 0 0
11 8,132 6,009 2,123 33,938 30,200 3,738 42,070 36,209
12 Karnataka 6,131 692 13,661 8,808 16,392
13 Kerala 983 302 2,034 478 4,114 3,269
14 Madhya Pradesh 0 0 0 0 0 0 0 0 0
Maharashtra 8,928 8,683 16,938 912
16 Manipur 0 0 0 0 0 0 0 0 0
17 Meghalaya 223 219 4 401 2,732 2,302 430
18 Mizoram 0 0 0 0 0 0 0 0 0
19 Nagaland 616 -99 1,642 2,606 -1,048
20 Odisha 1,709 1,603 106 8,410 9,917
21 Punjab 0 0 0 0 0 0 0 0 0
22 Rajasthan 0 0 0 0 0 0 0 0 0
23 Sikkim 0 0 0 0 0 0 0 0 0
24 Tamil Nadu 2,641 46 28,766 -13,161 32,714 -12,849
Telangana 3,327 2,134 1,193 6,447 20,308 9,409 10,899
26 Tripura 1,146 717 429 3,406 4,736 3,696 1,040
27 Uttar Pradesh 0 0 0 0 0 0 0 0 0
28 Uttarakhand 1,100 243 3,801 4,782
29 West Bengal 0 0 0 13,907 22,838 16,076 6,762
30 A & N Islands 67 26 41 386 109 277 472 147
31 Chandigarh 179 179 0 936 936 0 0
32 0 0 0 0 0 0 0 0 0
33 Daman & Diu 0 0 0 0 0 0 0 0 0
34 Delhi 0 0 0 0 0 0 0 0 0
Lakshadweep 0 0 0 0 0 0 0 0 0
36 Puducherry 0 0 0 0 0 0 0 0 0

‘Promoting Good Practices & Standards’ 71
Sl. No.
STATE / UT NO. OF BATTALIONS
Addl.DGP IGP DIG
S A V S A V S A V
1 Andhra Pradesh 8 0 0 0 0 0 0 0 0 0
2 Arunachal Pradesh 0 0 0 0 0 0 0 0 0 0
3 Assam 29 1 1 0 1 1 0 2 1 1
4 Bihar 22 1 1 0 0 1 -1 2 1 1
Chhattisgarh 22 1 1 0 1 0 1 4 0 4
6 Goa 3 0 0 0 0 0 0 0 0 0
7 Gujarat 0 0 0 0 0 0 0 0 0 0
8 9 0 0 0 2 2 0 0 0 0
9 7 0 0 0 1 1 0 0 0 0
10 36 1 1 0 2 2 0 4 1 3
11 18 0 0 0 0 0 0 0 0 0
12 Karnataka 8 0 0 0 0 0 0 1 0 1
13 Kerala NA 1 1 0 0 0 0 1 1 0
14 Madhya Pradesh 22 1 1 0 4 1 0 3 -3
Maharashtra 16 1 1 0 2 2 0 1 1 0
16 Manipur 1 1 0 1 1 0 2 2 0
17 Meghalaya 0 0 0 0 0 0 0 0 0 0
18 Mizoram 8 0 0 0 0 0 0 1 1 0
19 Nagaland 0 0 0 0 3 3 0 4 4 0
20 Odisha 0 0 0 0 0 0 0 0 0 0
21 Punjab 20 1 1 0 3 3 0 2 2 0
22 Rajasthan 17 1 1 0 1 1 0 2 0 2
23 Sikkim 4 0 1 -1 1 0 1 0 0 0
24 Tamil Nadu 0 0 0 0 0 0 0 0 0
Telangana 12 0 0 0 1 1 0 1 0 1
26 Tripura 12 0 0 0 1 1 0 1 0 1
27 Uttar Pradesh 33 1 1 0 2 3 8 4 4
28 Uttarakhand 0 0 0 1 1 0 0 0 0
29 West Bengal 18 1 1 0 2 2 0 6 3 3
30 A & N Islands 1 0 0 0 0 0 0 0 0 0
31 Chandigarh 1 0 0 0 0 0 0 0 0 0
32 0 0 0 0 0 0 0 0 0 0
33 Daman & Diu 0 0 0 0 0 0 0 0 0 0
34 Delhi 0 0 1 -1 0 1 -1 0 4 -4
Lakshadweep 0 0 0 0 0 0 0 0 0 0
36 Puducherry 1 0 0 0 0 0 0 0 0 0
362 12 14 -2 33 4 42 28 14
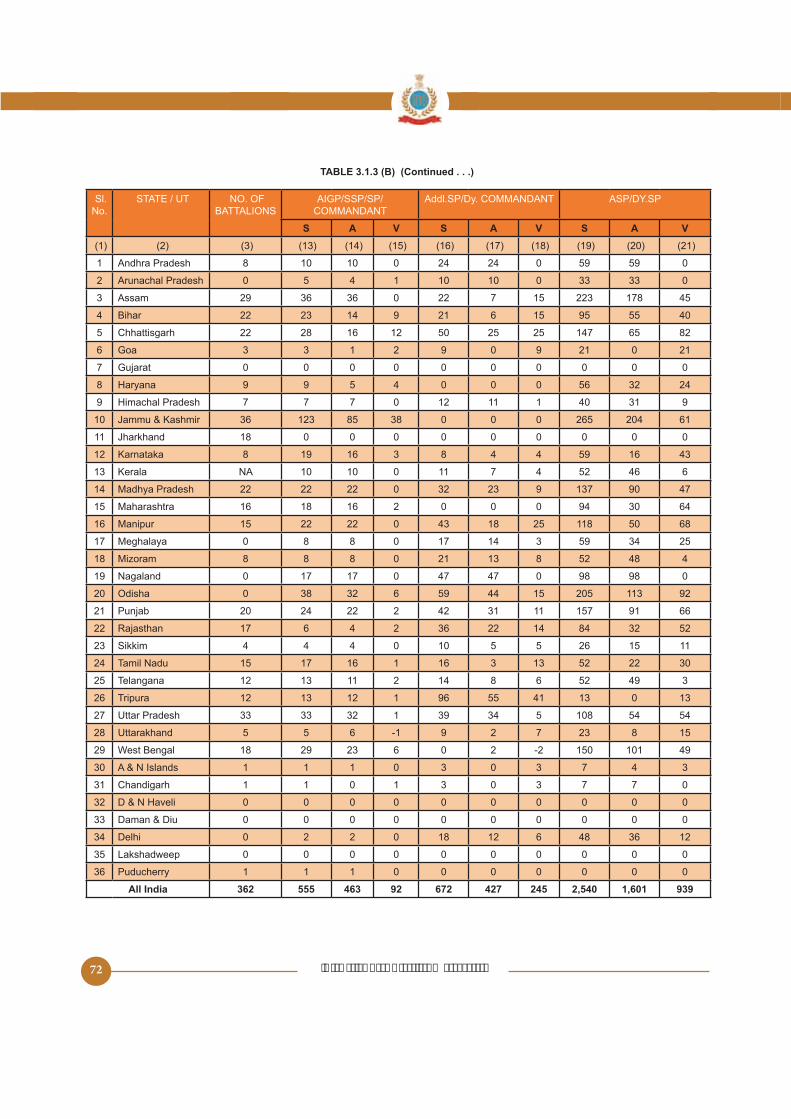
‘Promoting Good Practices & Standards’72
Sl. No.
STATE / UT NO. OF BATTALIONS
AIGP/SSP/SP/ COMMANDANT
Addl.SP/Dy. COMMANDANT ASP/DY.SP
S A S A S A
1 Andhra Pradesh 8 10 10 0 24 24 0 0
2 Arunachal Pradesh 0 4 1 10 10 0 33 33 0
3 Assam 29 36 36 0 22 7 223 178
4 Bihar 22 23 14 9 21 6 40
Chhattisgarh 22 28 16 12 147 82
6 Goa 3 3 1 2 9 0 9 21 0 21
7 Gujarat 0 0 0 0 0 0 0 0 0 0
8 9 9 4 0 0 0 32 24
9 7 7 7 0 12 11 1 40 31 9
10 36 123 38 0 0 0 204 61
11 18 0 0 0 0 0 0 0 0 0
12 Karnataka 8 19 16 3 8 4 4 16 43
13 Kerala NA 10 10 0 11 7 4 46 6
14 Madhya Pradesh 22 22 22 0 32 23 9 137 90 47
Maharashtra 16 18 16 2 0 0 0 94 30 64
16 Manipur 22 22 0 43 18 118 68
17 Meghalaya 0 8 8 0 17 14 3 34
18 Mizoram 8 8 8 0 21 13 8 48 4
19 Nagaland 0 17 17 0 47 47 0 98 98 0
20 Odisha 0 38 32 6 44 113 92
21 Punjab 20 24 22 2 42 31 11 91 66
22 Rajasthan 17 6 4 2 36 22 14 84 32
23 Sikkim 4 4 4 0 10 26 11
24 Tamil Nadu 17 16 1 16 3 13 22 30
Telangana 12 13 11 2 14 8 6 49 3
26 Tripura 12 13 12 1 96 41 13 0 13
27 Uttar Pradesh 33 33 32 1 39 34 108
28 Uttarakhand 6 -1 9 2 7 23 8
29 West Bengal 18 29 23 6 0 2 -2 101 49
30 A & N Islands 1 1 1 0 3 0 3 7 4 3
31 Chandigarh 1 1 0 1 3 0 3 7 7 0
32 0 0 0 0 0 0 0 0 0 0
33 Daman & Diu 0 0 0 0 0 0 0 0 0 0
34 Delhi 0 2 2 0 18 12 6 48 36 12
Lakshadweep 0 0 0 0 0 0 0 0 0 0
36 Puducherry 1 1 1 0 0 0 0 0 0 0
362 555 463 672 427 245

‘Promoting Good Practices & Standards’ 73
Sl. No.
STATE / UT NO. OF BATTALIONS
INSPECTOR S.I. A.S.I.
S A V S A V S A V
1 Andhra Pradesh 8 200 147 302 212 494 136
2 Arunachal Pradesh 0 40 28 12 10 132 101 31
3 Assam 29 263 188 909 238 206 32
4 Bihar 22 230 94 136 1,132 906 226 110 247
Chhattisgarh 22 224 204 20 927 706
6 Goa 3 21 7 14 69 11 0
7 Gujarat 0 12 12 0 267 87 2,290 1,860 430
8 9 226 207 19 284 280 4
9 7 6 197 121 76 8
10 36 244 223 21 868 294 670
11 18 0 0 0 0 0 0 0 0 0
12 Karnataka 8 130 77 377 226 1,278 1,118 160
13 Kerala NA 88 23 262 237 101 4
14 Madhya Pradesh 22 407 334 73 1,179 1,919 1,672 247
Maharashtra 16 211 163 48 437 389 48 1,396 182
16 Manipur 176 149 27 433 331 102 49 32 17
17 Meghalaya 0 90 70 20 266 193 73 72 71 1
18 Mizoram 8 69 69 0 200 0 0 0
19 Nagaland 0 141 136 330 316 14 0 0 0
20 Odisha 0 133 768 267 326 312 14
21 Punjab 20 223 82 644 13 1,219 1,134
22 Rajasthan 17 109 44 483 271 212 0 0 0
23 Sikkim 4 32 13 19 89 37 96 94 2
24 Tamil Nadu 147 4 477 477 0 0 0 0
Telangana 12 142 73 69 382 198 184 792 181 611
26 Tripura 12 162 124 38 398 338 60 0 0 0
27 Uttar Pradesh 33 1,066 419 647 1,132 2,423 0 0 0
28 Uttarakhand 43 26 17 128 -28 36 0 36
29 West Bengal 18 268 182 86 1,003 678 2,834
30 A & N Islands 1 8 7 1 14 11 18 0 18
31 Chandigarh 1 8 8 0 0 18 18 0
32 0 0 0 0 0 0 0 0 0 0
33 Daman & Diu 0 0 0 0 0 0 0 0 0 0
34 Delhi 0 67 10 403 262 141 261 -44
Lakshadweep 0 0 0 0 0 0 0 0 0 0
36 Puducherry 1 6 6 0 18 10 8 3 3 0
362 1,777 17,216 11,032 6,184 18,799 13,707

‘Promoting Good Practices & Standards’74
Sl. No.
STATE / UT NO. OF BATTALIONS
CONSTABLE TOTAL
S A V S A V S A V
1 Andhra Pradesh 8 2,829 1,730 1,099 12,780 7,630
2 Arunachal Pradesh 0 899 641 3,370 3,074 296 4,614 4,006 608
3 Assam 29 4,496 491 24,760 22,009 27,482 3,469
4 Bihar 22 4,316 3,103 1,213 10,881 7,372 24,430
Chhattisgarh 22 901 17,267 978 24,842 22,117
6 Goa 3 480 1,770 2,682 1,841 841
7 Gujarat 0 4,033 3,719 314 20,673 13,477 7,196 27,362 8,027
8 9 1,338 7,367 6,667 700 8,001
9 7 1,183 944 239 4,831 4,019 812 6,489
10 36 717 27,408 4,839 29,422
11 18 4,127 3,091 1,036 16,128 4,074
12 Karnataka 8 3,924 3,804
13 Kerala NA 1,637 186 6,870 1,307 9,037 7,482
14 Madhya Pradesh 22 4,866 17,122 2,073 28,360 24,991 3,369
Maharashtra 16 3,118 832 13,806 11,867 1,939 20,098 16,983
16 Manipur 3,199 2,633 11,317 10,263
17 Meghalaya 0 1,143 939 204 1,673 1,999
18 Mizoram 8 1,087 28 4,481 1,829 4,073 1,874
19 Nagaland 0 2,934 -216 9,241 9,733 -492 -689
20 Odisha 0 4,006 19,867 3,338
21 Punjab 20 3,619 3,079 12,688 371 19,088 17,918 1,170
22 Rajasthan 17 2,726 2,292 434 2,043 17,063 14,260 2,803
23 Sikkim 4 660 493 167 2,681 2,194 487 743
24 Tamil Nadu 1,491 89 13,140 11,239 1,901 2,038
Telangana 12 2,821 1,326 9,377 4,936 4,441 6,783 6,812
26 Tripura 12 1,920 161 11,928 13,142 1,390
27 Uttar Pradesh 33 26,717 17,132 17,328 1,34,036 96,439
28 Uttarakhand 898 203 3,829 3,804 4,972 4,698 274
29 West Bengal 18 0 0 0 22,119 16,689 28,863 20,162 8,701
30 A & N Islands 1 164 164 0 701 682 19 927 872
31 Chandigarh 1 164 164 0 701 76 927 847 80
32 0 0 0 0 0 0 0 0 0 0
33 Daman & Diu 0 0 0 0 0 0 0 0 0 0
34 Delhi 0 1,022 9,184 1,199
Lakshadweep 0 0 0 0 0 0 0 0 0 0
36 Puducherry 1 100 81 19 719 284 847 311
362
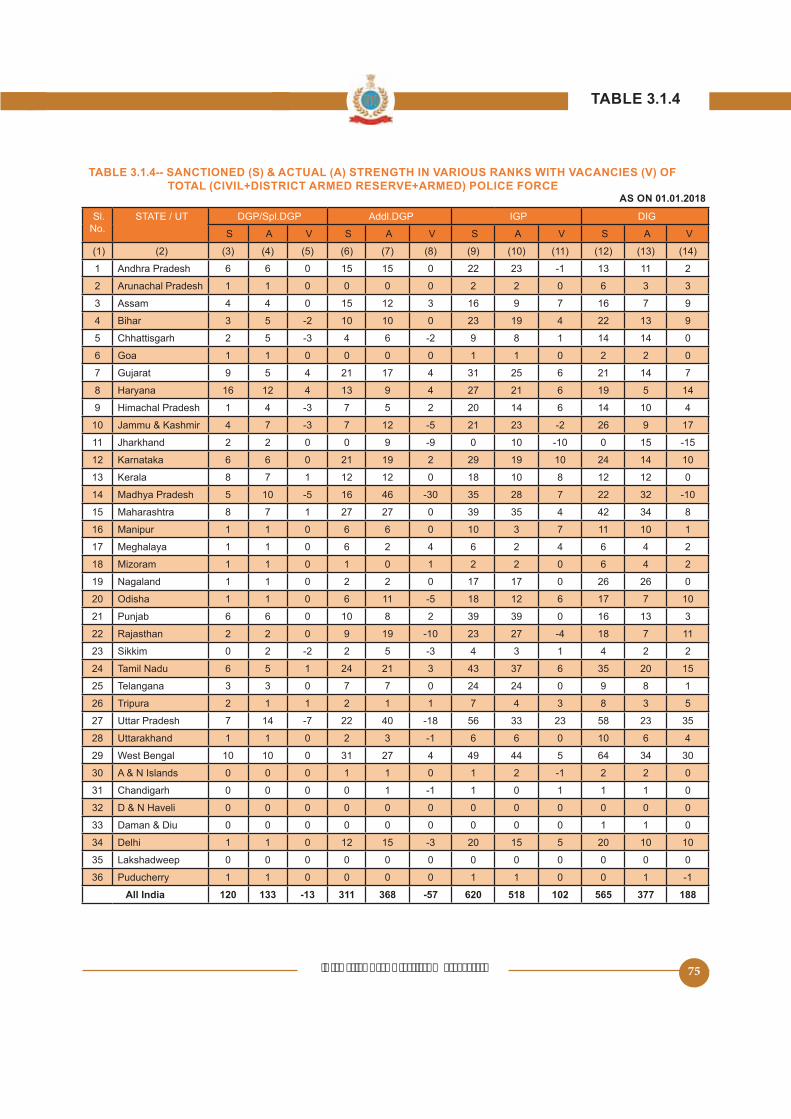
‘Promoting Good Practices & Standards’ 75
Sl. No.
STATE / UT DGP/Spl.DGP Addl.DGP IGP DIG
S A V S A V S A V S A V
1 Andhra Pradesh 6 6 0 0 22 23 -1 13 11 2
2 Arunachal Pradesh 1 1 0 0 0 0 2 2 0 6 3 3
3 Assam 4 4 0 12 3 16 9 7 16 7 9
4 Bihar 3 -2 10 10 0 23 19 4 22 13 9
Chhattisgarh 2 -3 4 6 -2 9 8 1 14 14 0
6 Goa 1 1 0 0 0 0 1 1 0 2 2 0
7 Gujarat 9 4 21 17 4 31 6 21 14 7
8 16 12 4 13 9 4 27 21 6 19 14
9 1 4 -3 7 2 20 14 6 14 10 4
10 4 7 -3 7 12 21 23 -2 26 9 17
11 2 2 0 0 9 -9 0 10 -10 0
12 Karnataka 6 6 0 21 19 2 29 19 10 24 14 10
13 Kerala 8 7 1 12 12 0 18 10 8 12 12 0
14 Madhya Pradesh 10 16 46 -30 28 7 22 32 -10
Maharashtra 8 7 1 27 27 0 39 4 42 34 8
16 Manipur 1 1 0 6 6 0 10 3 7 11 10 1
17 Meghalaya 1 1 0 6 2 4 6 2 4 6 4 2
18 Mizoram 1 1 0 1 0 1 2 2 0 6 4 2
19 Nagaland 1 1 0 2 2 0 17 17 0 26 26 0
20 Odisha 1 1 0 6 11 18 12 6 17 7 10
21 Punjab 6 6 0 10 8 2 39 39 0 16 13 3
22 Rajasthan 2 2 0 9 19 -10 23 27 -4 18 7 11
23 Sikkim 0 2 -2 2 -3 4 3 1 4 2 2
24 Tamil Nadu 6 1 24 21 3 43 37 6 20
Telangana 3 3 0 7 7 0 24 24 0 9 8 1
26 Tripura 2 1 1 2 1 1 7 4 3 8 3
27 Uttar Pradesh 7 14 -7 22 40 -18 33 23 23
28 Uttarakhand 1 1 0 2 3 -1 6 6 0 10 6 4
29 West Bengal 10 10 0 31 27 4 49 44 64 34 30
30 A & N Islands 0 0 0 1 1 0 1 2 -1 2 2 0
31 Chandigarh 0 0 0 0 1 -1 1 0 1 1 1 0
32 0 0 0 0 0 0 0 0 0 0 0 0
33 Daman & Diu 0 0 0 0 0 0 0 0 0 1 1 0
34 Delhi 1 1 0 12 -3 20 20 10 10
Lakshadweep 0 0 0 0 0 0 0 0 0 0 0 0
36 Puducherry 1 1 0 0 0 0 1 1 0 0 1 -1
133 -13 311 368 -57 518 565 377 188

‘Promoting Good Practices & Standards’76
Sl. No.
STATE / UT AIGP/SSP/SP/COMN Addl.SP/Dy. COMN ASP/DY.SP
S A V S A V S A V
1 Andhra Pradesh 78 61 17 138 119 19 249 317
2 Arunachal Pradesh 32 7 31 21 10 0
3 Assam 114 106 8 99 68 31 411 66
4 Bihar 74 83 -9 46 30 16 647 388
Chhattisgarh 76 19 110 372 316
6 Goa 17 13 4 9 0 9 18
7 Gujarat 117 81 36 0 0 0 386 27
8 70 30 40 14 13 1 247 221 26
9 48 3 40 34 6 144 126 18
10 261 11 0 0 0 670 76
11 149 113 36 0 8 -8 390 180 210
12 Karnataka 124 111 13 118 81 37 428 99
13 Kerala 70 67 3 41 33 8 371 324 47
14 Madhya Pradesh 87 117 -30 298 39 1,146 782 364
Maharashtra 237 226 11 61 3 614 311
16 Manipur 48 78 41 37 214 120 94
17 Meghalaya 38 39 -1 19 6 111 74 37
18 Mizoram 27 27 0 32 38 -6 96 97 -1
19 Nagaland 84 84 0 126 124 2 307 307 0
20 Odisha 120 92 28 180 23 678 400 278
21 Punjab 187 198 -11 42 31 11 420 239
22 Rajasthan 163 136 27 328 238 90 441 113
23 Sikkim 31 30 1 32 34 -2 78 62 16
24 Tamil Nadu 144 142 2 138 92 46 830 174
Telangana 90 87 3 168 147 21 473 116
26 Tripura 41 39 2 112 61 140 121 19
27 Uttar Pradesh 184 223 -39 319 16 1,076 320
28 Uttarakhand 21 34 -13 30 20 10 107 87 20
29 West Bengal 162 134 28 79 63 16 670 140
30 A & N Islands 6 9 -3 3 0 3 23 22 1
31 Chandigarh 6 1 6 0 6 29 26 3
32 1 1 0 1 0 1 1 1 0
33 Daman & Diu 2 3 -1 0 0 0 2 2 0
34 Delhi 60 -6 31 23 348 223
Lakshadweep 1 2 -1 0 0 0 1 2 -1
36 Puducherry 23 19 4 0 0 0 0 0 0

‘Promoting Good Practices & Standards’ 77
Sl. No.
STATE / UT INSPECTOR S.I. A.S.I.
S A V S A V S A V
1 Andhra Pradesh 1,238 1,110 128 3,886 2,889 997 3,643 262
2 Arunachal Pradesh 16 431 141 111
3 Assam 886 731 3,837 3,171 666 2,416 2,174 242
4 Bihar 1,316 819 14,876 8,683 6,193 10,341 2,416
Chhattisgarh 804 3,060 1,762 1,298 3,928 1,342
6 Goa 96 72 24 439 291 148 189 66
7 Gujarat 1,308 768 3,479 1,116 9,420 2,096
8 887 720 167 2,274 1,447 827 4,290
9 280 229 711 1,179 1,022
10 1,076 61 3,380 2,164 1,216 3,929
11 1,143 2,824 7,388
12 Karnataka 1,346 3,634 2,214 1,420 9,140 8,183
13 Kerala 1,733 1,224 2,332 1,080
14 Madhya Pradesh 2,700 1,701 999 7,029 11,898 7,631 4,267
Maharashtra 8,639 11,469 7,987 3,482 20,382 16,923
16 Manipur 467 414 1,630 1,427 203 1,997 1,081 916
17 Meghalaya 270 239 31 1,176 917 244 13
18 Mizoram 240 74 488 133
19 Nagaland 12 734 700 34 473 20
20 Odisha 1460 301 4481 2894 3931 1,239
21 Punjab 1,293 1,061 232 2,916 434 670
22 Rajasthan 1,178 180 4,490 2,764 1,726 3,760 2,228
23 Sikkim 86 97 -11 249 172 77 266 -49
24 Tamil Nadu 2,873 2,732 141 8,670 0 0 0
Telangana 1,176 808 368 3,836 2,683 4,331 1,606
26 Tripura 397 263 134 1,221 973 248 404 241
27 Uttar Pradesh 6,066 4,990 1,076 31,808 11,747 0 0 0
28 Uttarakhand 296 229 67 7 36 0 36
29 West Bengal 2,029 670 11,912 7,760 20,847 13,072
30 A & N Islands 60 60 0 249 199 122 87
31 Chandigarh 79 79 0 292 292 0 293 241
32 3 3 0 18 16 2 8 0 8
33 Daman & Diu 8 4 4 29 4 29 13 16
34 Delhi 7,719 -960
Lakshadweep 6 6 0 18 4 14 43 16 27
36 Puducherry 68 3 292 127 104 62 42

‘Promoting Good Practices & Standards’78
Sl. No.
STATE / UT CONSTABLE TOTAL
S A V S A V S A V
1 Andhra Pradesh 12,361 10,374 1,987 49,948 72,176 17,933
2 Arunachal Pradesh 2,488 1,829 9,226 7,892 1,334 13,137 2,281
3 Assam 8,623 1,114 40,399
4 Bihar 16,260 8,109 83,849 32,477 1,28,286
Chhattisgarh 10,141 2,346 46,227 6,722 71,606 11,916
6 Goa 1,016 498 8,312 6,941 1,371
7 Gujarat 18,090 73,243 1,09,337 88,267 21,070
8 10,033 7,016 3,017 30,718 11,881 61,346 16,844
9 3,022 366 13,003 11,828 18,472 1,937
10 14,204 13,098 1,106 64,304 87,882 77,838 10,044
11 9,100 7,812 61,019 18,931
12 Karnataka 1,00,243 78,300 21,943
13 Kerala 10,818 1,221 36,843 31,014 9,476
14 Madhya Pradesh 10,202 93,376
Maharashtra 88,349 6,797 1,10,046 99,112 10,934 2,40,224 2,14,029
16 Manipur 1,192 21,961 16,232 33,080 24,843 8,237
17 Meghalaya 1,876 1,641 3,086 16,367 12,691 3,676
18 Mizoram 1,860 1,717 143 6,376 3,997 2,379 9,792 7,062 2,730
19 Nagaland 4,012 4,276 -264 21,292 22,233 -941
20 Odisha 7190 6224 966 41763 66,973 10,322
21 Punjab 13,683 2,102 63,676 60,969 2,707 88,742 6,389
22 Rajasthan 13,873 2,286 79,426 68,070 1,06,232 88,229 18,003
23 Sikkim 1,099 4,274 737 6,080 722
24 Tamil Nadu 20,661 27,083 -6,422 89,471 27,219 1,24,130 1,01,710 22,420
Telangana 8,148 4,087 30,949 22,990 76,407 46,062
26 Tripura 2,881 770 18,674 2,478 27,378
27 Uttar Pradesh 86,717 47,361 2,76,416 1,99,973 76,443 4,14,492
28 Uttarakhand 3,037 681 16,041 16,284 -243 21,124
29 West Bengal 0 0 0 68,890 36,161 1,40,904 91,923 48,981
30 A & N Islands 771 82 149 4,274 316
31 Chandigarh 1,782 1,712 70 6,211 820 8,700 7,748
32 87 82 230 333 21
33 Daman & Diu 110 100 10 319 224 372 128
34 Delhi 22,227 18,988 3,239 48,163 7,006 74,712 11,819
Lakshadweep 137 42 404 249 610 374 236
36 Puducherry 621 48 2,363 3,473 2,644 829

‘Promoting Good Practices & Standards’ 79
s
Sl. No.
STATE / UT Sanctioned Police Strength Actual Police Strength
D.G. to DySP
INSP. to ASI Const.
D.G. to DySP
INSP. to ASI Const.
1 Andhra Pradesh 838 9,029 62,309 1:10.8:74.4 484 7,642 46,117
2 Arunachal Pradesh 131 1,292 11,714 1:9.9:89.4 111 1,024 9,721 1:9.2:74.2
3 Assam 7,139 1:10.6:86.2 6,076 47,908 1:11:71
4 Bihar 1,00,109 1:33.2:121.3 17,924 1:32.7:72.1
Chhattisgarh 7,944 63,090 1:13.9:110.3 1:10:94.4
6 Goa 83 790 7,439
7 Gujarat 17,419 91,333 13,667 74,099 1:27.3:126.7
8 406 8,308 311 37,734 1:20.8:92.9
9 277 2,170 241 1,810 14,484
10 989 70,349 1:7.4:71.1
11 17,084 337 9,328 1:27.7:94.9
12 Karnataka 849 14,277 1:16.8:100.3 678 11,743 1:17.3:77.6
13 Kerala 47,661 1:11:89.6 3,494 40,611
14 Madhya Pradesh 1,609 21,627 1,274 77,100 1:11.8:47.9
Maharashtra 1,339 40,490 1:30.2:148.2 1,001 32,364 1,80,664 1:32.3:134.9
16 Manipur 373 4,094 28,613 1:11:76.7 229 2,922 21,692
17 Meghalaya 193 1,703 14,471 141 1,400
18 Mizoram 1,391 8,236 1:8.4:49.9 169 1,179 1:7:34.6
19 Nagaland 1,767 18,962 1:3.1:33.7 1,701 19,971
20 Odisha 1,020 11,111 680 7,984 47,987 1:11.7:47
21 Punjab 10,424 1:10.9:80.7 9,088
22 Rajasthan 1,097 11,836 93,299 870 7,702 1:8.9:72.6
23 Sikkim 601 138 4,636 1:4.2:30.7
24 Tamil Nadu 1,220 12,778 1,10,132 973 11,402 1:11.7:73.2
Telangana 890 9,343 66,174 749 6,216 39,097 1:8.3:43.9
26 Tripura 312 2,263 24,803 230 1,640 1:7.1:69.1
27 Uttar Pradesh 1,738 49,621 3,63,133 1:28.6:208.9 1,408 36,798 2,47,334 1:26.1:142.3
28 Uttarakhand 177 1,869 19,078 1:10.6:107.8 18,640
29 West Bengal 34,788 1:32.7:98.6 842 22,191 68,890 1:26.4:64.7
30 A & N Islands 36 431 3,807 36 346 1:9.6:99.3
31 Chandigarh 43 664 7,993 33 612 7,103
32 3 29 322 1:9.7:107.3 2 19 312
33 Daman & Diu 66 429 6 42 324 1:7:64.8
34 Delhi 70,390 1:30.7:138.3 14,212 1:40:118.2
Lakshadweep 2 67 4 26 344
36 Puducherry 464 2,984 1:18.6:119.4 22 2,368
‘Promoting Good Practices & Standards’80
s
Sl. No. STATE / UT SUB-INSPECTOR ASST. SUB-INSPECTOR
S A S A S A
1 Andhra Pradesh 484
2 Arunachal Pradesh 0 0 0 0 0 0
3 Assam 268 276 168 602 449
4 Bihar 2380 1120 2602 1148
Chhattisgarh NA 261 NA 338 NA 980
6 Goa 7 7 4 4 20 20
7 Gujarat 226 664 1264 1936
8 680 283 810 3103
9 NA 112 NA 229 NA
10 NA 103 NA 146 NA 692
11 NA 338 NA 609 NA
12 Karnataka NA NA 1684 NA
13 Kerala NA NA 104 NA
14 Madhya Pradesh 1904 928 2110
Maharashtra 1427 1090 2184 2106
16 Manipur 32 40 39 43 133 132
17 Meghalaya NA NA NA NA NA NA
18 Mizoram NA 1 NA 6 NA 10
19 Nagaland 0 0 0 0 0 0
20 Odisha NA 491 NA 702 NA 991
21 Punjab NA 631 NA 1010 NA
22 Rajasthan NA 434 NA 616 NA 1862
23 Sikkim NA 10 NA 14 NA 96
24 Tamil Nadu 1783 899 0 0
Telangana NA 289 NA 403 NA 1012
26 Tripura 207 166 110 73 621 474
27 Uttar Pradesh 9147 3792 0 0 18210 6132
28 Uttarakhand 146 0 0 0 0
29 West Bengal NA 1482 NA NA 0
30 A & N Islands 0 0 0 0 0 0
31 Chandigarh NA 41 NA 28 NA 178
32 NA 0 NA 0 NA 13
33 Daman & Diu NA NA NA 28
34 Delhi 1128 638 1014 3334 2444
Lakshadweep 0 0 0 0 0 0
36 Puducherry NA 20 NA 9 NA 87
‘Promoting Good Practices & Standards’ 81
Sl. No. STATE / UT CONSTABLES TOTAL RESERVATION PERCENTAGE APPROVED BY
GOVT.S A S A
1 Andhra Pradesh 7492 6039 8391
2 Arunachal Pradesh 0 0 0 0
3 Assam 3468 3692
4 Bihar 13416 9793 13096
Chhattisgarh NA NA 7220
6 Goa 80 111 84
7 Gujarat 3721 4740 8193
8 13486 18868 8006
9 NA 2822 NA 3736
10 NA 3082 NA 4023
11 NA NA 7340
12 Karnataka NA 8042 NA 14946
13 Kerala NA 3106 NA 4160
14 Madhya Pradesh 11047 7144 17828 10936
Maharashtra
16 Manipur 439 602 643 817
17 Meghalaya NA NA NA NA
18 Mizoram NA 47 NA 64
19 Nagaland 0 0 0 0
20 Odisha NA 6731 NA
21 Punjab NA 14749 NA 19144
22 Rajasthan NA 10417 NA 13329
23 Sikkim NA 203 NA 323
24 Tamil Nadu 7292 22873 13066
Telangana NA 4997 NA 6701
26 Tripura 3107 3820
27 Uttar Pradesh 29442 39366
28 Uttarakhand 3046 3094 3192 3239
29 West Bengal NA 17738 NA 21790
30 A & N Islands 0 0 0 0
31 Chandigarh NA 722 NA 969
32 NA 12 NA
33 Daman & Diu NA 28 NA 66
34 Delhi 7224 12700 9319
Lakshadweep 0 0 0 0
36 Puducherry NA NA 381
-

‘Promoting Good Practices & Standards’82
s
Sl. No. STATE / UT SUB-INSPECTOR ASST. SUB-INSPECTOR
S A S A S A
1 Andhra Pradesh NA 141 NA 227 NA 698
2 Arunachal Pradesh 431 2488 1829
3 Assam 462 361 312 1292
4 Bihar 149 289 103 179 163 762
Chhattisgarh NA NA NA 2922
6 Goa 44 30 24 22 124 124
7 Gujarat 362 1422 1447 2072
8 0 0 0 0 0 0
9 NA NA 61 NA
10 NA NA 229 NA 977
11 NA NA 1174 NA
12 Karnataka NA NA 464 NA
13 Kerala NA 38 NA 40 NA 249
14 Madhya Pradesh 1406 988 2380 1199 4690
Maharashtra 768 1240 1192 6012
16 Manipur 394 619 178 2062
17 Meghalaya NA 730 NA 179 NA 1236
18 Mizoram NA NA 331 NA 1660
19 Nagaland NA 700 NA NA 4276
20 Odisha NA NA NA 1116
21 Punjab NA 1 NA 2 NA 2
22 Rajasthan NA 307 NA 436 NA 1412
23 Sikkim NA 66 NA 110 NA
24 Tamil Nadu NA 98 NA 0 NA 117
Telangana NA 171 NA 238 NA 810
26 Tripura 379 270 199 129 1130 798
27 Uttar Pradesh 871 0 0 1734 126
28 Uttarakhand 31 31 0 0 0 0
29 West Bengal NA 307 NA NA 0
30 A & N Islands 12 11 4 4 37 34
31 Chandigarh 0 0 0 0 0 0
32 NA 3 NA 0 0 38
33 Daman & Diu NA 3 NA 2 NA
34 Delhi 1667 1497
Lakshadweep NA 0 3 NA 0
36 Puducherry 0 0 0 0 0 0
7428 11266 23688 37344
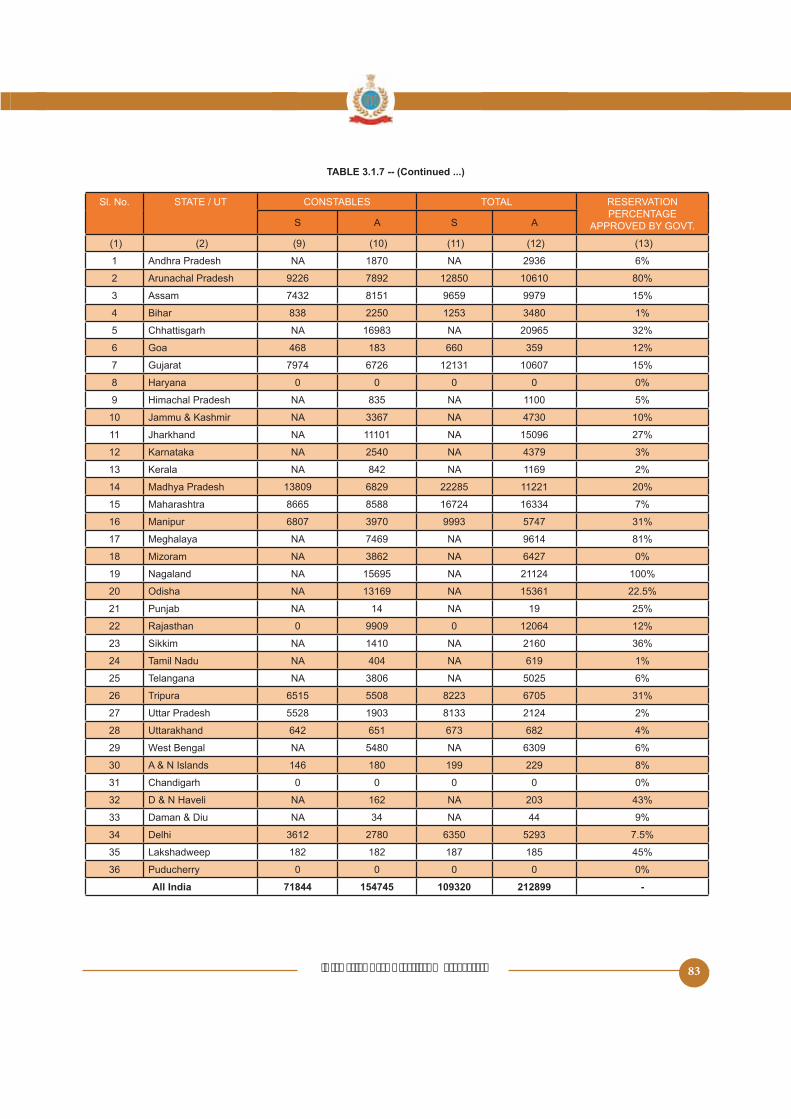
‘Promoting Good Practices & Standards’ 83
Sl. No. STATE / UT CONSTABLES TOTAL RESERVATION PERCENTAGE
APPROVED BY GOVT.S A S A
1 Andhra Pradesh NA 1870 NA 2936
2 Arunachal Pradesh 9226 7892 10610
3 Assam 7432 9979
4 Bihar 838 3480
Chhattisgarh NA 16983 NA
6 Goa 468 183 660
7 Gujarat 7974 6726 12131 10607
8 0 0 0 0
9 NA NA 1100
10 NA 3367 NA 4730
11 NA 11101 NA
12 Karnataka NA NA 4379
13 Kerala NA 842 NA 1169
14 Madhya Pradesh 13809 6829 11221
Maharashtra 16724 16334
16 Manipur 6807 3970 9993
17 Meghalaya NA 7469 NA 9614
18 Mizoram NA 3862 NA 6427
19 Nagaland NA NA 21124
20 Odisha NA 13169 NA
21 Punjab NA 14 NA 19
22 Rajasthan 0 9909 0 12064
23 Sikkim NA 1410 NA 2160
24 Tamil Nadu NA 404 NA 619
Telangana NA 3806 NA
26 Tripura 8223
27 Uttar Pradesh 1903 8133 2124
28 Uttarakhand 642 673 682
29 West Bengal NA NA 6309
30 A & N Islands 146 180 199 229
31 Chandigarh 0 0 0 0
32 NA 162 NA 203
33 Daman & Diu NA 34 NA 44
34 Delhi 3612 2780
Lakshadweep 182 182 187
36 Puducherry 0 0 0 0
71844 154745 -

‘Promoting Good Practices & Standards’84
s
Sl. No. STATE / UT SUB-INSPECTOR ASST. SUB-INSPECTOR
S A S A S A
1 Andhra Pradesh NA 1144 NA 1171 NA 4039
2 Arunachal Pradesh 0 0 0 0 0 0
3 Assam 769 2327 3048
4 Bihar 1762 0 2430 0 2417
Chhattisgarh NA 336 NA NA
6 Goa 100 34 7 279 37
7 Gujarat 436 392 238 4049 3030
8 662 371 968 3011
9 NA 40 NA NA 282
10 NA NA NA NA NA NA
11 NA NA 1172 NA 1968
12 Karnataka NA 1428 NA 3221 NA 14379
13 Kerala NA 911 NA 618 NA 3480
14 Madhya Pradesh 984 1666 3283 1166
Maharashtra 2698 2126 1878 1488 9133 9133
16 Manipur 101 41 83 44 0 133
17 Meghalaya NA 18 NA 4 NA 34
18 Mizoram NA 9 NA 18 NA 47
19 Nagaland NA NA NA NA NA NA
20 Odisha NA NA 369 NA 1163
21 Punjab NA 678 NA 1016 NA 2236
22 Rajasthan NA 378 NA 119 NA 329
23 Sikkim NA NA 87 NA 467
24 Tamil Nadu NA 3386 NA 0 NA 13627
Telangana NA NA 1773 NA
26 Tripura 0 0 0 0 0 0
27 Uttar Pradesh 11760 8270 0 0 23414 11939
28 Uttarakhand 108 107 0 0 0 0
29 West Bengal NA NA 422 NA 0
30 A & N Islands 43 32 0 0 0 0
31 Chandigarh NA 70 NA 47 NA 222
32 NA 0 NA 0 NA 3
33 Daman & Diu NA 7 NA 3 NA
34 Delhi 2031 648 44 6001 3344
Lakshadweep 0 0 0 0 0 0
36 Puducherry 0 39 0 21 0 190
26673 65828

‘Promoting Good Practices & Standards’ 85
Sl. No. STATE / UT CONSTABLES TOTAL RESERVATION PERCENTAGE
APPROVED BY GOVT.
S A S A
1 Andhra Pradesh NA 16233 NA
2 Arunachal Pradesh 0 0 0 0
3 Assam 13378 16174 17392 21147
4 Bihar 26917
Chhattisgarh NA 10840 NA 13242
6 Goa 293 1486 371
7 Gujarat 18111 19406 21771
8 7721 20423 10711
9 NA NA 1977
10 NA NA NA NA
11 NA 9122 NA 12719
12 Karnataka NA 32100 NA
13 Kerala NA NA 20493
14 Madhya Pradesh 9666
Maharashtra 17199 17199 30908 29946
16 Manipur 1719 606 1903 824
17 Meghalaya NA 136 NA 192
18 Mizoram NA 88 NA 162
19 Nagaland NA NA NA NA
20 Odisha NA 10181 NA 12248
21 Punjab NA 9938 NA 13868
22 Rajasthan NA 12426 NA
23 Sikkim NA 1022 NA 1671
24 Tamil Nadu 28033 49868
Telangana NA 16188 NA 23212
26 Tripura 0 0 0 0
27 Uttar Pradesh 74633 109807
28 Uttarakhand 2246 2280 2387
29 West Bengal NA 7969 NA
30 A & N Islands 696 324 739
31 Chandigarh NA 1216 NA
32 NA 17 NA 20
33 Daman & Diu NA NA 180
34 Delhi 13004 13041 22861 17077
Lakshadweep 0 0 0 0
36 Puducherry 0 0 833
218864 474317

‘Promoting Good Practices & Standards’86
s
Sl. No.
STATE / UT DGP/Spl.DGP Addl.DGP IGP DIG AIGP/SSP/SP/ COMMANDA
NTS
Addl.SP/Dy. COMMANDANTS
ASP/DY.SP
A A A A A A A
1 Andhra Pradesh 0 0 0 0 4 4 28
2 Arunachal Pradesh NA NA NA NA NA NA 3
3 Assam NA NA 1 NA 9 29
4 Bihar NA NA NA NA 8 2 18
Chhattisgarh 0 0 0 1 3 23 34
6 Goa 0 0 0 0 3 0 4
7 Gujarat 0 0 1 2 0 0
8 0 0 3 1 4 0 16
9 0 0 1 1 10 2 6
10 NA 1 NA NA 8 NA 24
11 0 0 3 0 8 0 0
12 Karnataka * 1 1 1 0 17 14 16
13 Kerala 0 2 0 1 2 2 3
14 Madhya Pradesh 1 4 3 0 13 70
Maharashtra 0 2 1 1 39 0
16 Manipur 0 0 0 2 2 7
17 Meghalaya 0 0 0 0 3 0 3
18 Mizoram 0 0 0 0 0 1
19 Nagaland NA NA NA NA NA NA NA
20 Odisha 0 1 0 3 4 2 19
21 Punjab 0 0 4 0 0 30
22 Rajasthan 0 1 1 21 19 42
23 Sikkim NA NA NA 2 1 10
24 Tamil Nadu 0 2 3 13 33 8 24
Telangana 0 0 6 0 7 9 12
26 Tripura 0 0 0 0 1 6
27 Uttar Pradesh 0 4 2 1 32 0 0
28 Uttarakhand 0 0 0 1 8 3 4
29 West Bengal 1 0 2 2 9 6 26
30 A & N Islands 0 0 1 0 2 1 0
31 Chandigarh NA NA NA NA NA NA NA
32 0 0 0 0 0 0 0
33 Daman & Diu 0 0 0 0 0 0 0
34 Delhi 0 0 1 0 7 3 13
Lakshadweep 0 0 0 0 0 0 0
36 Puducherry 0 0 0 0 2 0 0
3 18 38 32 282 157 536

‘Promoting Good Practices & Standards’ 87
Sl. No.
STATE / UT INSPECTOR S.I. A.S.I. CONSTABLE DAR TOTAL
A A A A A A A
1 Andhra Pradesh 18 46 167 317 1,421 64 2,069
2 Arunachal Pradesh NA 32 691 821
3 Assam 4 139 27 28 1,496 9 1,747
4 Bihar NA 183 2,496 2,906
Chhattisgarh 63 88 221 0
6 Goa 4 43 22 128 0
7 Gujarat 27 471 6,490 0
8 139 243 367 2,316 0 3,142
9 4 32 19 64 937 0 1,076
10 48 29 1,847 2,913
11 41 108 0 0 2,439 2,774
12 Karnataka * 47 316 341 876 4,366 0
13 Kerala 20 92 3 88 2,929 0 3,142
14 Madhya Pradesh 179 880 190 403 0
Maharashtra 641 1,012 262 6,020 19,127 3 27,167
16 Manipur 1 76 100 148 1,022 0 1,363
17 Meghalaya 10 62 7 30 198 38
18 Mizoram 1 121 80 141 0
19 Nagaland NA 32 39 90 794
20 Odisha 431 2 2,884 1,419
21 Punjab 39 406 89 392 0 6,367
22 Rajasthan 44 234 210 6,696 0 7,338
23 Sikkim 19 13 4 280 0 369
24 Tamil Nadu 208 1,268 0 2,618 8,048 17,434
Telangana 16 28 101 248 991 72 1,490
26 Tripura 71 29 42 46 1,190
27 Uttar Pradesh 240 0 20,884 112
28 Uttarakhand 11 0 41 1,923 0 2,266
29 West Bengal 344 0 6,649 0
30 A & N Islands 10 17 6 43 409 2 491
31 Chandigarh NA NA NA 63 0 1,020
32 0 0 9 0 49
33 Daman & Diu 0 4 3 4 33 0 44
34 Delhi 94 601 644 764 4,706 0 6,833
Lakshadweep 0 0 0 7 23 0 30
36 Puducherry 0 9 0 30 144 0

‘Promoting Good Practices & Standards’88
s
Sl. No.
STATE / UT DGP/Spl.DGP Addl.DGP IGP DIG AIGP/SSP/SP/ COMMANDANTS
Addl.SP/Dy. COMMANDANTS
A A A A A A
1 Andhra Pradesh 0 0 0 0 0 0
2 Arunachal Pradesh NA NA NA NA NA NA
3 Assam 0 0 0 0 0 2
4 Bihar NA NA NA NA 2 0
Chhattisgarh 0 0 0 0 0 0
6 Goa 0 0 0 0 0 0
7 Gujarat 0 0 0 0 0 0
8 0 0 0 0 0 0
9 0 0 0 0 2 0
10 0 0 0 0 0 0
11 0 0 0 0 0 0
12 Karnataka 0 0 0 0 0 0
13 Kerala 0 0 0 0 1 0
14 Madhya Pradesh 0 0 0 0 2 1
Maharashtra 0 0 0 0 0 0
16 Manipur 0 0 0 1 4 3
17 Meghalaya 0 0 0 0 1 0
18 Mizoram 0 0 0 0 0 0
19 Nagaland NA NA NA NA NA NA
20 Odisha 0 0 0 0 0 0
21 Punjab 0 0 0 0 4 0
22 Rajasthan 0 0 0 0 3 3
23 Sikkim 0 0 0 0 0 0
24 Tamil Nadu 0 0 0 0 1 0
Telangana 0 0 0 0 0 0
26 Tripura 0 0 0 0 0 0
27 Uttar Pradesh 0 0 0 0 0
28 Uttarakhand 0 0 0 0 0 0
29 West Bengal 0 0 1 0 3 0
30 A & N Islands 0 0 0 0 0 0
31 Chandigarh 0 0 0 0 0 0
32 0 0 0 0 0 0
33 Daman & Diu 0 0 0 0 0 0
34 Delhi 0 0 0 0 0 0
Lakshadweep 0 0 0 0 0 0
36 Puducherry 0 0 0 0 0 0
1 1 23 24

‘Promoting Good Practices & Standards’ 89
Sl. No.
STATE / UT ASP/DY.SP INSPECTOR S.I. A.S.I. CONSTABLE TOTAL
A A A A A A A
1 Andhra Pradesh 0 0 0 0 0 0 0
2 Arunachal Pradesh NA NA NA NA NA
3 Assam 27 4 13 1 29 1,224 1,300
4 Bihar 3 NA NA NA 1
Chhattisgarh 0 0 0 0 0 274 274
6 Goa 0 0 3 0 0 191 194
7 Gujarat 0 0 0 0 0 1,034 1,034
8 0 0 8 0 0 0 8
9 1 2 1 6 824 871
10 0 0 0 0 0 0 0
11 0 0 0 8 1,160
12 Karnataka 0 0 0 20 141 166
13 Kerala 0 2 0 0 20 773
14 Madhya Pradesh 1 2 7 40 113
Maharashtra 0 0 0 0 0 0 0
16 Manipur 10 1 7 23 102 700
17 Meghalaya 0 0 0 173 184
18 Mizoram 0 0 0 0 0
19 Nagaland NA NA 21 0 192 622
20 Odisha 0 0 0 0 0 203 203
21 Punjab 13 0 21 0 9 301
22 Rajasthan 3 11 13 0 1,104 1,190
23 Sikkim 0 0 0 0 0 0 0
24 Tamil Nadu 0 3 64 0 141
Telangana 0 0 0 0 0 0 0
26 Tripura 0 0 0 0 0 0 0
27 Uttar Pradesh 0 0 0 0 0 73
28 Uttarakhand 1 0 19 0 30 283 333
29 West Bengal 0 0 0 0 0 29 33
30 A & N Islands 0 0 0 0 0 0 0
31 Chandigarh 0 0 0 0 0 147 147
32 0 0 0 0 0 0 0
33 Daman & Diu 0 0 0 0 0 0 0
34 Delhi 1 2 6 4 23 230 266
Lakshadweep 0 0 0 0 0 0 0
36 Puducherry 0 0 3 0 13 63 79
128 27

‘Promoting Good Practices & Standards’90
PER POLICE WOMEN
Sl No. STATE / UTTOTAL POLICE (CIVIL +
DISTRICT ARMED WOMEN POLICE (CIVIL +
DISTRICT ARMED
PERCENTAGE OF WOMEN POLICE (CIVIL +
DISTRICT ARMED
1 Andhra Pradesh 2,069
2 Arunachal Pradesh 876
3 Assam 3,047
4 Bihar 7,397
Chhattisgarh 3,279
6 Goa 6,941
7 Gujarat 88,267 9,279
8
9 1,947
10 77,838 2,913
11 61,019 4,099
12 Karnataka 78,300 6,162
13 Kerala
14 Madhya Pradesh 93,376
Maharashtra 2,14,029 27,167
16 Manipur 24,843 2,063
17 Meghalaya 12,691
18 Mizoram 7,062
19 Nagaland 22,233 1,629
20 Odisha
21 Punjab 6,668
22 Rajasthan 88,229
23 Sikkim 369
24 Tamil Nadu 1,01,710 17,968
Telangana 46,062 1,490
26 Tripura 1,190
27 Uttar Pradesh 22,778
28 Uttarakhand
29 West Bengal 91,923 7,487
30 A & N Islands 491
31 Chandigarh 7,748 1,167
32 333 49
33 Daman & Diu 372 44
34 Delhi 74,712 7,099
Lakshadweep 374 30
36 Puducherry 2,644 264

‘Promoting Good Practices & Standards’ 91
Sl. No.
STATE / UT RESERVATION PERCENTAGE OF WOMEN POLICE, IF ANY
FEMALE POPULATION FEMALE POPULATION PER POLICE WOMAN
1 Andhra Pradesh 33.33 24629 11903.69
2 Arunachal Pradesh 10 633 722.6
3 Assam 30
4 Bihar 38 6918.48
Chhattisgarh 30 13133
6 Goa 0 1236.77
7 Gujarat 33 30173
8 0 3827.3
9 0 3382 1737.17
10 0 6044 2074.84
11 33 16680 4069.29
12 Karnataka 20 33011
13 Kerala 0 18383
14 Madhya Pradesh 33 38033 7370.74
Maharashtra 33 2144.96
16 Manipur 0 1309
17 Meghalaya 4 1397 2611.21
18 Mizoram 0
19 Nagaland 33 707.18
20 Odisha 33 20762
21 Punjab 33 2034.34
22 Rajasthan 30 4173.9
23 Sikkim 30 308 834.69
24 Tamil Nadu 30 34883 1941.4
Telangana 33 17392
26 Tripura 10 1989 1671.24
27 Uttar Pradesh 20
28 Uttarakhand 30 4949 1904.01
29 West Bengal 0 44420
30 A & N Islands 33 178 361.93
31 Chandigarh 33 763
32 33 4183.67
33 Daman & Diu 33 93 2112.41
34 Delhi 33 9879 1391.6
Lakshadweep 33 31 1044.1
36 Puducherry 33 2406.98
-

‘Promoting Good Practices & Standards’92
Sl. No.
STATE / UT DGP/ Spl DG/ ADGP
IGP DIG SP ADDL SP ASP/ Dy.SP
S A S A S A S A S A S A
1 Andhra Pradesh 0 0 0 0 0 0 1 0 3 2 22 18
2 Arunachal Pradesh 0 0 0 0 0 0 0 0 0 0 0 0
3 Assam 0 0 0 0 0 0 1 1 2 2 3 2
4 Bihar 0 0 0 0 0 0 1 1 0 0 4 3
Chhattisgarh 1 1 0 0 0 0 1 1 1 4 6 4
6 Goa 0 0 0 0 0 0 1 1 0 0 1 1
7 Gujarat 2 2 3 3 0 0 6 2 0 0 16 11
8 0 0 0 0 0 0 1 1 0 0 10
9 1 0 1 0 1 1 0 1 1 1 0 2
10 0 0 1 1 2 0 6 8 0 0 13 12
11 0 0 0 0 0 0 1 1 0 0 4 3
12 Karnataka 1 1 1 1 0 0 0 0 16 14 0 0
13 Kerala 0 0 0 0 0 0 0 0 0 0 1 1
14 Madhya Pradesh 1 1 1 0 0 1 2 2 4 4 34 28
Maharashtra 1 1 0 0 0 0 4 4 0 0 4 3
16 Manipur 0 0 0 0 0 0 1 1 2 0 1 2
17 Meghalaya 0 0 0 0 0 0 0 0 0 0 2 1
18 Mizoram 0 0 0 0 0 0 1 1 1 1 1 1
19 Nagaland 0 0 0 0 0 0 0 0 0 0 0 0
20 Odisha 0 0 0 0 0 0 1 1 0 0 0 2
21 Punjab 0 0 0 0 0 0 4 3 0 1 3 8
22 Rajasthan 0 1 0 0 0 1 2 2 4 4 13 10
23 Sikkim 0 0 0 0 0 0 0 1 1 1 1 1
24 Tamil Nadu 0 0 1 1 2 2 6 6 2 2 31
Telangana 0 0 0 0 0 0 0 0 0 0 9 10
26 Tripura 0 0 0 0 0 0 1 1 0 1 2 1
27 Uttar Pradesh 1 1 1 0 0 1 1 2 11 17 0 0
28 Uttarakhand 0 0 0 0 1 1 0 1 0 1 0 3
29 West Bengal 1 1 11 1 1 1 4 4 0 0 48 40
30 A & N Islands 0 0 0 0 0 0 0 1 0 0 1 1
31 Chandigarh 0 0 0 0 0 0 0 1 0 0 0 3
32 0 0 0 0 0 0 0 0 0 0 0 0
33 Daman & Diu 0 0 0 0 0 0 0 0 0 0 0 0
34 Delhi 1 1 1 1 4 4 3 0 2 2 21 8
Lakshadweep 0 0 0 0 0 0 0 0 0 0 0 0
36 Puducherry 0 0 0 0 0 0 2 2 0 0 0 0
21 8 11 12 51 57
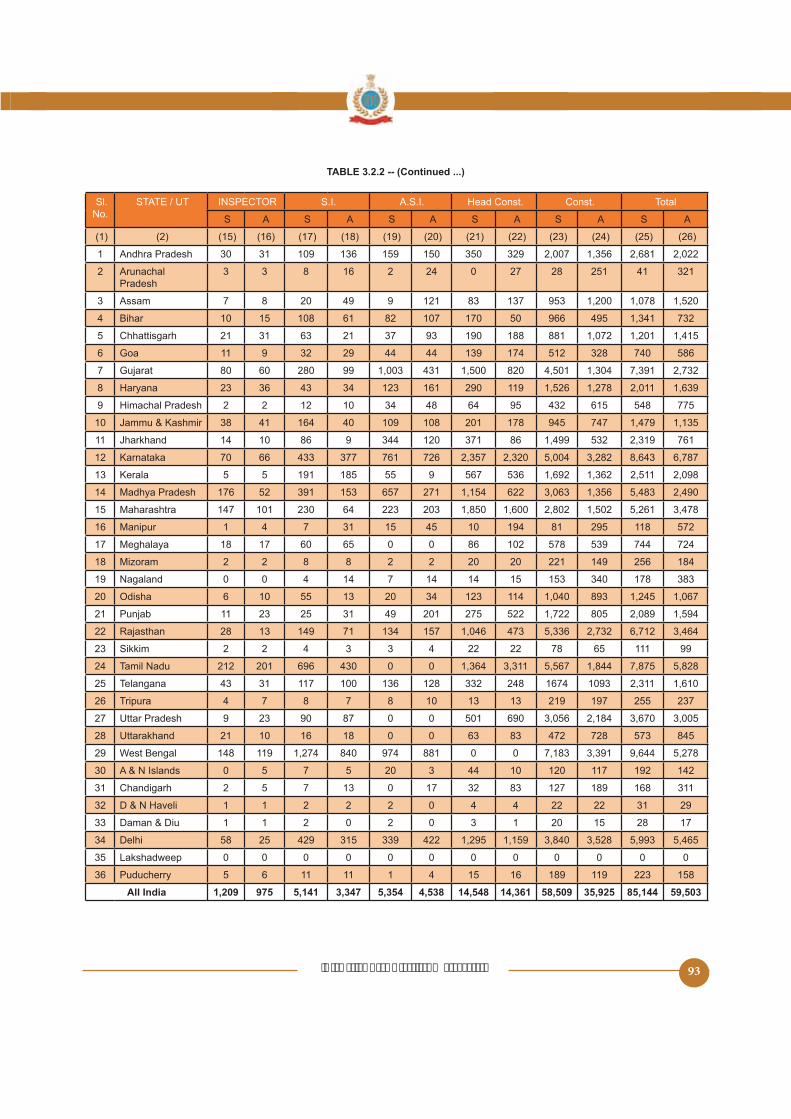
‘Promoting Good Practices & Standards’ 93
Sl. No.
STATE / UT INSPECTOR S.I. A.S.I. Const. Total
S A S A S A S A S A S A
1 Andhra Pradesh 30 31 109 136 329 2,007 2,681 2,022
2 Arunachal Pradesh
3 3 8 16 2 24 0 27 28 41 321
3 Assam 7 8 20 49 9 121 83 137 1,200 1,078
4 Bihar 10 108 61 82 107 170 966 1,341 732
Chhattisgarh 21 31 63 21 37 93 190 188 881 1,072 1,201
6 Goa 11 9 32 29 44 44 139 174 328 740
7 Gujarat 80 60 280 99 1,003 431 820 1,304 7,391 2,732
8 23 36 43 34 123 161 290 119 1,278 2,011 1,639
9 2 2 12 10 34 48 64 432
10 38 41 164 40 109 108 201 178 747 1,479
11 14 10 86 9 344 120 371 86 1,499 2,319 761
12 Karnataka 70 66 433 377 761 726 2,320 3,282 8,643 6,787
13 Kerala 191 9 1,692 1,362 2,098
14 Madhya Pradesh 176 391 271 622 3,063 2,490
Maharashtra 147 101 230 64 223 203 1,600 2,802 3,478
16 Manipur 1 4 7 31 10 194 81 118
17 Meghalaya 18 17 60 0 0 86 102 744 724
18 Mizoram 2 2 8 8 2 2 20 20 221 149 184
19 Nagaland 0 0 4 14 7 14 14 340 178 383
20 Odisha 6 10 13 20 34 123 114 1,040 893 1,067
21 Punjab 11 23 31 49 201 1,722 2,089
22 Rajasthan 28 13 149 71 134 1,046 473 2,732 6,712 3,464
23 Sikkim 2 2 4 3 3 4 22 22 78 111 99
24 Tamil Nadu 212 201 696 430 0 0 1,364 3,311 1,844
Telangana 43 31 117 100 136 128 332 248 1674 1093 2,311 1,610
26 Tripura 4 7 8 7 8 10 13 13 219 197 237
27 Uttar Pradesh 9 23 90 87 0 0 690 2,184 3,670
28 Uttarakhand 21 10 16 18 0 0 63 83 472 728
29 West Bengal 148 119 1,274 840 974 881 0 0 7,183 3,391 9,644
30 A & N Islands 0 7 20 3 44 10 120 117 192 142
31 Chandigarh 2 7 13 0 17 32 83 127 189 168 311
32 1 1 2 2 2 0 4 4 22 22 31 29
33 Daman & Diu 1 1 2 0 2 0 3 1 20 28 17
34 Delhi 429 339 422 3,840
Lakshadweep 0 0 0 0 0 0 0 0 0 0 0 0
36 Puducherry 6 11 11 1 4 16 189 119 223

‘Promoting Good Practices & Standards’94
Sl. No.
STATE / UT DGP/ Spl DG/ ADGP
IGP DIG SP / AIG ADDL SP ASP/ Dy.SP
1 Andhra Pradesh 0 0 0 0 0 1
2 Arunachal Pradesh NA NA NA NA NA NA
3 Assam 0 0 0 1 0 0
4 Bihar NA NA NA NA NA 0
Chhattisgarh 0 0 0 0 0 0
6 Goa 0 0 0 0 0 0
7 Gujarat 0 1 0 0 0 1
8 0 0 0 0 0 0
9 0 0 1 1 1 0
10 NA NA NA NA NA NA
11 0 0 0 0 0 0
12 Karnataka 0 0 0 0 1 0
13 Kerala 0 0 0 0 0 0
14 Madhya Pradesh 0 0 0 0 1 0
Maharashtra 0 0 0 1 0 0
16 Manipur 0 0 0 1 0 1
17 Meghalaya 0 0 0 0 0 0
18 Mizoram 0 0 0 0 0 0
19 Nagaland NA NA NA NA NA NA
20 Odisha 0 0 0 0 0 0
21 Punjab 0 0 0 0 0 0
22 Rajasthan 0 0 0 1 2 3
23 Sikkim NA NA NA 1 1 1
24 Tamil Nadu 0 0 1 1 0 3
Telangana 0 0 0 0 0 0
26 Tripura 0 0 0 0 0 0
27 Uttar Pradesh 0 0 0 0 0 0
28 Uttarakhand 0 0 0 0 0 0
29 West Bengal 0 0 0 0 0 0
30 A & N Islands 0 0 0 0 0 0
31 Chandigarh 0 0 0 0 0 0
32 0 0 0 0 0 0
33 Daman & Diu 0 0 0 0 0 0
34 Delhi 0 1 0 1 0 0
Lakshadweep 0 0 0 0 0 0
36 Puducherry 0 0 0 0 0 0
2 2 8 6

‘Promoting Good Practices & Standards’ 95
Sl. No.
STATE / UT INSPECTOR S.I. A.S.I. Const. Total
1 Andhra Pradesh 2 2 7 11 46 69
2 Arunachal Pradesh NA NA NA NA NA NA
3 Assam 0 0 0 0 44
4 Bihar 2 1 3 2 100 108
Chhattisgarh 0 0 0 0 82 82
6 Goa 0 2 4 17 8 31
7 Gujarat 0 6 12 3 23 46
8 0 1 0 0 9 10
9 1 0 2 4 70 80
10 NA NA NA NA NA NA
11 2 1 10 6 123 142
12 Karnataka 3 60 4 81 281 430
13 Kerala 0 0 0
14 Madhya Pradesh 12 20 3 11 31 78
Maharashtra 2 7 108 182
16 Manipur 0 0 2 8 99 111
17 Meghalaya 1 0 0 1 6 8
18 Mizoram 0 0 1 1 10 12
19 Nagaland NA NA NA NA NA NA
20 Odisha 1 0 0 0 176 177
21 Punjab 3 1 0 1 76 81
22 Rajasthan 0 2 8 267 288
23 Sikkim NA NA NA NA 16 19
24 Tamil Nadu 61 28 0 133 331
Telangana 0 1 0 30 36
26 Tripura 0 0 0 0 20 20
27 Uttar Pradesh 0 0 0 0 0 0
28 Uttarakhand 0 0 0 0 16 16
29 West Bengal 0 1 3 0 226 230
30 A & N Islands 1 0 0 0 24
31 Chandigarh 2 0 0 0 61 63
32 0 0 0 0 0 0
33 Daman & Diu 0 0 0 0 1 1
34 Delhi 4 3 7 218 249
Lakshadweep 0 0 0 0 0 0
36 Puducherry 0 0 0 1 10 11
65 372
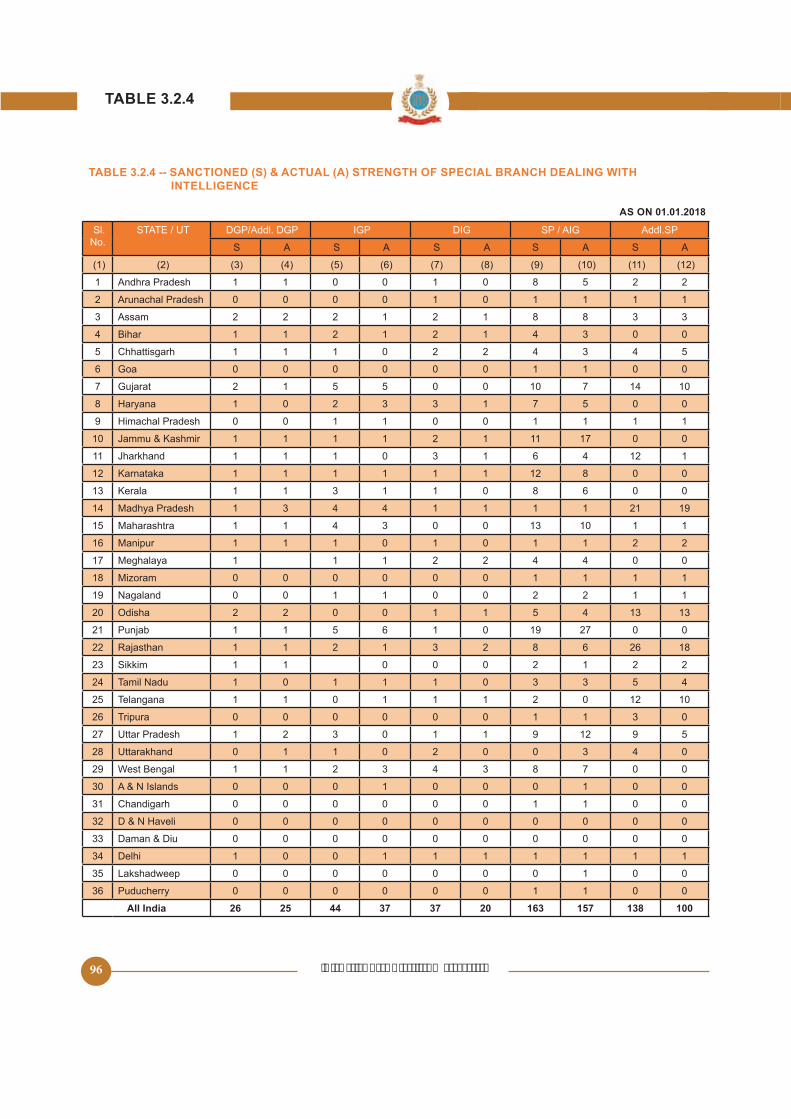
‘Promoting Good Practices & Standards’96
Sl. No.
STATE / UT DGP/Addl. DGP IGP DIG SP / AIG Addl.SP
S A S A S A S A S A
1 Andhra Pradesh 1 1 0 0 1 0 8 2 2
2 Arunachal Pradesh 0 0 0 0 1 0 1 1 1 1
3 Assam 2 2 2 1 2 1 8 8 3 3
4 Bihar 1 1 2 1 2 1 4 3 0 0
Chhattisgarh 1 1 1 0 2 2 4 3 4
6 Goa 0 0 0 0 0 0 1 1 0 0
7 Gujarat 2 1 0 0 10 7 14 10
8 1 0 2 3 3 1 7 0 0
9 0 0 1 1 0 0 1 1 1 1
10 1 1 1 1 2 1 11 17 0 0
11 1 1 1 0 3 1 6 4 12 1
12 Karnataka 1 1 1 1 1 1 12 8 0 0
13 Kerala 1 1 3 1 1 0 8 6 0 0
14 Madhya Pradesh 1 3 4 4 1 1 1 1 21 19
Maharashtra 1 1 4 3 0 0 13 10 1 1
16 Manipur 1 1 1 0 1 0 1 1 2 2
17 Meghalaya 1 1 1 2 2 4 4 0 0
18 Mizoram 0 0 0 0 0 0 1 1 1 1
19 Nagaland 0 0 1 1 0 0 2 2 1 1
20 Odisha 2 2 0 0 1 1 4 13 13
21 Punjab 1 1 6 1 0 19 27 0 0
22 Rajasthan 1 1 2 1 3 2 8 6 26 18
23 Sikkim 1 1 0 0 0 2 1 2 2
24 Tamil Nadu 1 0 1 1 1 0 3 3 4
Telangana 1 1 0 1 1 1 2 0 12 10
26 Tripura 0 0 0 0 0 0 1 1 3 0
27 Uttar Pradesh 1 2 3 0 1 1 9 12 9
28 Uttarakhand 0 1 1 0 2 0 0 3 4 0
29 West Bengal 1 1 2 3 4 3 8 7 0 0
30 A & N Islands 0 0 0 1 0 0 0 1 0 0
31 Chandigarh 0 0 0 0 0 0 1 1 0 0
32 0 0 0 0 0 0 0 0 0 0
33 Daman & Diu 0 0 0 0 0 0 0 0 0 0
34 Delhi 1 0 0 1 1 1 1 1 1 1
Lakshadweep 0 0 0 0 0 0 0 1 0 0
36 Puducherry 0 0 0 0 0 0 1 1 0 0
26 25 44 37 37 163 157 138
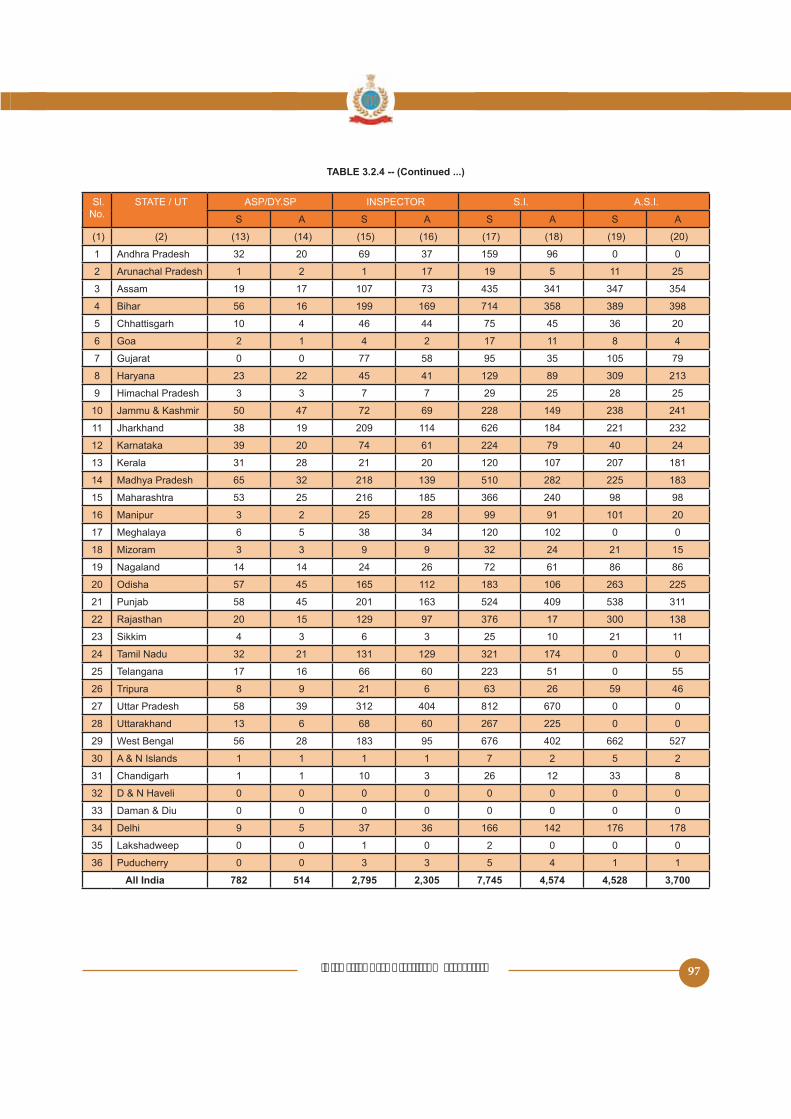
‘Promoting Good Practices & Standards’ 97
Sl. No.
STATE / UT ASP/DY.SP INSPECTOR S.I. A.S.I.
S A S A S A S A
1 Andhra Pradesh 32 20 69 37 96 0 0
2 Arunachal Pradesh 1 2 1 17 19 11
3 Assam 19 17 107 73 341 347
4 Bihar 16 199 169 714 389 398
Chhattisgarh 10 4 46 44 36 20
6 Goa 2 1 4 2 17 11 8 4
7 Gujarat 0 0 77 79
8 23 22 41 129 89 309 213
9 3 3 7 7 29 28
10 47 72 69 228 149 238 241
11 38 19 209 114 626 184 221 232
12 Karnataka 39 20 74 61 224 79 40 24
13 Kerala 31 28 21 20 120 107 207 181
14 Madhya Pradesh 32 218 139 282 183
Maharashtra 216 366 240 98 98
16 Manipur 3 2 28 99 91 101 20
17 Meghalaya 6 38 34 120 102 0 0
18 Mizoram 3 3 9 9 32 24 21
19 Nagaland 14 14 24 26 72 61 86 86
20 Odisha 112 183 106 263
21 Punjab 201 163 409 311
22 Rajasthan 20 129 97 376 17 300 138
23 Sikkim 4 3 6 3 10 21 11
24 Tamil Nadu 32 21 131 129 321 174 0 0
Telangana 17 16 66 60 223 0
26 Tripura 8 9 21 6 63 26 46
27 Uttar Pradesh 39 312 404 812 670 0 0
28 Uttarakhand 13 6 68 60 267 0 0
29 West Bengal 28 183 676 402 662
30 A & N Islands 1 1 1 1 7 2 2
31 Chandigarh 1 1 10 3 26 12 33 8
32 0 0 0 0 0 0 0 0
33 Daman & Diu 0 0 0 0 0 0 0 0
34 Delhi 9 37 36 166 142 176 178
Lakshadweep 0 0 1 0 2 0 0 0
36 Puducherry 0 0 3 3 4 1 1
782 514

‘Promoting Good Practices & Standards’98
Sl. No.
STATE / UT CONSTABLE TOTAL
S A S A S A
1 Andhra Pradesh 219 290 222 913 602
2 Arunachal Pradesh 22 168 172 276
3 Assam 342 248 632 618 1,899 1,666
4 Bihar 130 467 401 1,964 1,463
Chhattisgarh 62 60 127 36 368 220
6 Goa 34 47 90 113
7 Gujarat 140 116 808
8 800 342 794 909 2,113
9 34 84 87 188
10 486 341 962 976 1,843
11 46 1,126 2,299 1,177
12 Karnataka 280 1,286 780
13 Kerala 464 172 169 1,028 938
14 Madhya Pradesh 220 610 660
Maharashtra 337 337 1,107 714 2,196 1,614
16 Manipur 193 134 472 384
17 Meghalaya 34 34 319 208 390
18 Mizoram 28 28 80 61 142
19 Nagaland 227 224 399 431 826 846
20 Odisha 89 82 333 303 1,111 893
21 Punjab 868 2,079 4,671 3,816
22 Rajasthan 274 781 609 1,920 1,109
23 Sikkim 44 119 236 131
24 Tamil Nadu 691 479 404 319 1,130
Telangana 189 233 617
26 Tripura 3 11 208 366
27 Uttar Pradesh 1,107 1,184 3,496 3,237
28 Uttarakhand 320 224 472 446 1,147
29 West Bengal 0 0 2,173 1,311 2,377
30 A & N Islands 27 17 9 33
31 Chandigarh 26 72 39 199 90
32 0 0 0 0 0 0
33 Daman & Diu 0 0 0 0 0 0
34 Delhi 216 241 111 719 741
Lakshadweep 7 11 8 19 16
36 Puducherry 20 16 3 2 33 27

‘Promoting Good Practices & Standards’ 99
Sl. No.
STATE / UT DGP/Addl. DGP IGP DIG SP / AIG Addl.SP ASP/DY.SP
1 Andhra Pradesh 0 0 0 0 0 0
2 Arunachal Pradesh 0 0 0 0 0 0
3 Assam 0 0 0 3 0 0
4 Bihar 0 0 0 0 0 1
Chhattisgarh 0 0 0 0 4 0
6 Goa 0 0 0 0 0 0
7 Gujarat 0 0 0 0 0 1
8 0 0 0 0 0 0
9 0 0 0 0 0 0
10 0 0 0 0 1 1
11 0 0 0 0 0 0
12 Karnataka 0 0 0 4 0 0
13 Kerala 0 0 0 0 0 0
14 Madhya Pradesh 0 0 0 0 4 2
Maharashtra 0 0 0 0 0 1
16 Manipur 0 0 0 0 1 1
17 Meghalaya 0 0 0 0 0 0
18 Mizoram 0 0 0 0 0 0
19 Nagaland 0 0 0 2 0
20 Odisha 0 0 0 0 0 6
21 Punjab 0 0 0 1 0 0
22 Rajasthan 0 0 0 2 2
23 Sikkim 0 0 0 0 0 2
24 Tamil Nadu 0 0 0 0 0 0
Telangana 0 0 0 1 2 1
26 Tripura 0 0 0 0 0 0
27 Uttar Pradesh 0 0 0 0 0 6
28 Uttarakhand 0 0 0 1 0 6
29 West Bengal 0 0 0 0 0 1
30 A & N Islands 0 0 0 0 0 0
31 Chandigarh 0 0 0 0 0 0
32 0 0 0 0 0 0
33 Daman & Diu 0 0 0 0 0 0
34 Delhi 0 0 0 0 0 0
Lakshadweep 0 0 0 0 0 0
36 Puducherry 0 0 0 0 0 0
14 17 36

‘Promoting Good Practices & Standards’100
Sl. No.
STATE / UT INSPECTOR S.I. A.S.I. CONSTABLE TOTAL
1 Andhra Pradesh 0 0 0 0 0 0
2 Arunachal Pradesh 1 0 1 2 21
3 Assam 0 43 16 9 126
4 Bihar 17 16 18 102
Chhattisgarh 2 1 4 3 19
6 Goa 0 0 1 12 18
7 Gujarat 0 4 11 4 12 32
8 0 0 0 0 0 0
9 0 0 0 3 12
10 4 6 4 11 26
11 8 27 13 2 41 91
12 Karnataka 1 4 2 27 13
13 Kerala 0 0 0 1 1 2
14 Madhya Pradesh 10 39 2 7 122
Maharashtra 0 0 16 87
16 Manipur 1 0 2 3 27
17 Meghalaya 0 0 0 0 27 27
18 Mizoram 0 2 1 2 11 16
19 Nagaland 8 12 26 16 97 166
20 Odisha 24 6 2 0 8 46
21 Punjab 6 13 14 19 130 183
22 Rajasthan 19 14 22 11 126
23 Sikkim 2 0 0 7 16
24 Tamil Nadu 13 22 0 8 13
Telangana 0 0 0 2 0 6
26 Tripura 0 2 1 2 30
27 Uttar Pradesh 0 34 383
28 Uttarakhand 11 34 0 16 87
29 West Bengal 2 16 7 0 39
30 A & N Islands 0 0 0 2 4 6
31 Chandigarh 0 1 0 2 11 14
32 0 0 0 0 0 0
33 Daman & Diu 0 0 0 0 0 0
34 Delhi 1 10 9 10 26
Lakshadweep 0 0 0 0 0 0
36 Puducherry 0 0 0 1 1 2
228 336 153

‘Promoting Good Practices & Standards’ 101
DEPARTMENT
Sl. No.
STATE / UT DGP/ADDL. DGP IGP DIG SP/AIG
S A S A S A S A
1 Andhra Pradesh 1 1 2 2 3 0 6 3
2 Arunachal Pradesh 0 0 1 1 0 0 1 1
3 Assam 1 1 1 1 1 1 2 2
4 Bihar 1 1 3 3 2 1
Chhattisgarh 1 1 1 0 1 1 4 4
6 Goa 0 0 0 0 0 0 1 1
7 Gujarat 3 3 4 3 3 1 6 2
8 2 1 1 3 1 0 3 3
9 1 1 2 1 2 0 3 4
10 1 1 2 1 2 1 16 22
11 1 1 2 1 2 0 6 3
12 Karnataka 2 2 1 1 2 0 8 7
13 Kerala 2 2 3 2 0 0 16 13
14 Madhya Pradesh 2 2 2 2 2 1 6
Maharashtra 1 1 4 2 2 1 13 8
16 Manipur 0 0 0 0 1 1 2 2
17 Meghalaya 0 0 1 0 0 0 2 2
18 Mizoram 0 0 1 1 1 1 1 1
19 Nagaland 0 0 1 1 1 1 1 1
20 Odisha 1 1 2 1 1 1 3 2
21 Punjab 1 1 3 1 1 10 14
22 Rajasthan 4 3 4 3 1 11 9
23 Sikkim 1 1 0 0 0 1 1 0
24 Tamil Nadu 2 2 3 2 1 0 7 7
Telangana 1 1 3 1 2 1 8 7
26 Tripura 0 0 0 0 1 1 1 1
27 Uttar Pradesh 1 1 2 2 1 1 6 8
28 Uttarakhand 1 1 0 0 1 1 0 0
29 West Bengal 2 0 2 2 2 11 8
30 A & N Islands NA 0 NA 0 NA 0 NA 1
31 Chandigarh NA 0 NA 0 NA 0 NA 0
32 0 0 0 0 0 0 0 0
33 Daman & Diu 0 0 0 0 0 0 0 0
34 Delhi 1 1 3 1 1 0 4 1
Lakshadweep 0 0 0 0 0 0 0 0
36 Puducherry 0 0 0 0 0 0 1 1
34 55 43 43 174

‘Promoting Good Practices & Standards’102
Sl. No.
STATE / UT Addl.SP ASP/DY.SP INSPECTOR S.I. A.S.I.
S A S A S A S A S A
1 Andhra Pradesh 8 6 48 44 86 77 0 26
2 Arunachal Pradesh 0 0 2 1 2 1 8 1 2 0
3 Assam 0 0 8 8 84 66 72 68
4 Bihar 0 1 22 16 70 67 177 141 141
Chhattisgarh 2 2 9 9 34 19 49 10 1 0
6 Goa 0 0 1 1 3 7 4 3 4
7 Gujarat 19 16 0 0 78 31 42 88 67
8 0 0 8 8 22 21 38 89 79
9 1 1 10 11 12 11 18 12 13 9
10 0 0 89 86 274 183 271 278
11 0 1 6 96
12 Karnataka 0 0 61 43 60 70 42 0 0
13 Kerala 0 0 43 33 70 68 83 81 163 123
14 Madhya Pradesh 3 3 21 149 44 72 38 27
Maharashtra 16 9 6 221 114 31 13 11
16 Manipur 0 0 8 4 12 11 22 16 11 4
17 Meghalaya 0 0 3 2 19 17 36 34 0 0
18 Mizoram 1 1 1 1 9 9 7 7 3
19 Nagaland NA NA 2 1 2 3 2 3 3 2
20 Odisha 4 27 17 73 60 64 23 100 92
21 Punjab 0 0 10 8 9 9 9 9
22 Rajasthan 21 23 14 11 62 60 72 40 32 22
23 Sikkim 0 1 1 6 4 10 9 7 3
24 Tamil Nadu 4 3 41 114 131 61 0 0
Telangana 9 11 37 32 100 84 88 34 8
26 Tripura 2 0 7 4 30 12 11 11 0 1
27 Uttar Pradesh 11 10 42 10 200 31 0 0
28 Uttarakhand 2 2 3 3 20 20 3 3 0 0
29 West Bengal 0 0 32 31 166 628 349 364
30 A & N Islands NA 0 NA 1 NA 2 NA 10 NA
31 Chandigarh NA 0 NA 1 NA 3 NA 8 NA 2
32 0 0 0 0 0 0 0 0 0 0
33 Daman & Diu 0 0 0 0 0 0 0 0 0 0
34 Delhi 2 2 21 8 94 286 87 300 88
Lakshadweep 0 0 0 0 0 0 0 0 0 0
36 Puducherry 0 0 0 0 3 4 3 4 0 0
1477

‘Promoting Good Practices & Standards’ 103
Sl. No.
STATE / UT CONSTABLE TOTAL
S A S A S A
1 Andhra Pradesh 148 87 231 121 686 423
2 Arunachal Pradesh 0 2 12 12 28 19
3 Assam 23 17 133 399
4 Bihar 43 43 299 237 692
Chhattisgarh 33 33 64 37 199 116
6 Goa 13 20 33 61
7 Gujarat 189 180 379 724
8 186 232 620
9 26 24 42 133 116
10 433 1289 1279 2342
11 33 30 146 141 428 383
12 Karnataka 106 104 294 164 604 414
13 Kerala 200 194 443 408 1023 924
14 Madhya Pradesh 190 801
Maharashtra 461 383 767 1699 1440
16 Manipur 8 13 40 26 104 77
17 Meghalaya 7 7 27 24 86
18 Mizoram 11 11 27 26 64 61
19 Nagaland 3 1 20 24 37
20 Odisha 17 17 136 109 429 327
21 Punjab 22 22 27 21 117
22 Rajasthan 183 162 709 690 1116
23 Sikkim 6 14 43 0 74 39
24 Tamil Nadu 338 440 141 1168 796
Telangana 146 89 220
26 Tripura 22 19 9 19 83 68
27 Uttar Pradesh 48 123 260 42 343
28 Uttarakhand 10 14 60 100
29 West Bengal 0 0 729 1960 1429
30 A & N Islands NA 28 NA 73 NA 120
31 Chandigarh NA 34 NA 39 NA 87
32 0 0 0 0 0 0
33 Daman & Diu 0 0 0 0 0 0
34 Delhi 429 840 663 2120 1330
Lakshadweep 0 0 0 0 0 0
36 Puducherry 3 3 2 3 12
3638 6842

‘Promoting Good Practices & Standards’104
Sl. No.
STATE / UT DGP/ADDL. DGP IGP DIG SP/AIG Addl.SP ASP/DY.SP
1 Andhra Pradesh 0 0 0 1 1 3
2 Arunachal Pradesh 0 0 0 1 0 1
3 Assam 0 0 0 1 0 2
4 Bihar 0 0 0 1 0 1
Chhattisgarh 0 0 0 0 2 1
6 Goa 0 0 0 0 0 0
7 Gujarat 0 0 0 1 0 0
8 0 1 0 0 0 0
9 0 0 0 0 0 0
10 0 0 0 0 0 2
11 0 0 0 0 0 1
12 Karnataka 0 0 0 3 0 1
13 Kerala 0 0 0 0 0 0
14 Madhya Pradesh 0 0 0 1 0 3
Maharashtra 0 0 0 3 3 17
16 Manipur 0 0 1 1 0 0
17 Meghalaya 0 0 0 0 0 0
18 Mizoram 0 0 0 0 0 0
19 Nagaland 0 0 0 0 0 0
20 Odisha 0 0 0 0 0 0
21 Punjab 0 1 0 2 0 0
22 Rajasthan 0 1 0 1 2 2
23 Sikkim 0 0 0 0 0 2
24 Tamil Nadu 0 0 0 4 1 2
Telangana 0 0 0 2 2 3
26 Tripura 0 0 0 0 0 0
27 Uttar Pradesh 0 0 0 2 2 2
28 Uttarakhand 0 0 0 0 1 0
29 West Bengal 0 0 0 1 0 3
30 A & N Islands 0 0 0 0 0 0
31 Chandigarh 0 0 0 0 0 0
32 0 0 0 0 0 0
33 Daman & Diu 0 0 0 0 0 0
34 Delhi 0 0 0 0 0 1
Lakshadweep 0 0 0 0 0 0
36 Puducherry 0 0 0 0 0 0
3 1 25 14 47

‘Promoting Good Practices & Standards’ 105
Sl. No.
STATE / UT INSPECTOR S.I. A.S.I. CONSTABLE TOTAL
1 Andhra Pradesh 1 1 10 27
2 Arunachal Pradesh 0 0 0 0 4 6
3 Assam 1 9 1 1 16 31
4 Bihar 6 17 16 3 27 71
Chhattisgarh 1 3 0 6 28
6 Goa 0 0 0 3 2
7 Gujarat 0 0 33 13 100
8 1 3 3 20 33
9 0 0 0 1 3 4
10 4 8 4 11 32 61
11 10 7 8 22 63
12 Karnataka 0 18 13
13 Kerala 0 0 0 0 0 0
14 Madhya Pradesh 9 2 6 68 104
Maharashtra 187 70 380 1244
16 Manipur 0 0 0 0 0 2
17 Meghalaya 0 0 0 0 4 4
18 Mizoram 0 1 0 0 6
19 Nagaland 0 0 0 0 0 0
20 Odisha 29 4 7 0 16
21 Punjab 2 0 0 3 2 10
22 Rajasthan 2 4 1 2 101 116
23 Sikkim 1 1 0 3 9 16
24 Tamil Nadu 68 23 0 31 164
Telangana 7 8 2 6 13 43
26 Tripura 1 0 1 0 3
27 Uttar Pradesh 11 3 0 42 6 68
28 Uttarakhand 4 1 0 0 14 20
29 West Bengal 16 20 14 0 22 76
30 A & N Islands 0 0 0 0 0 0
31 Chandigarh 0 0 1 1 1 3
32 0 0 0 0 0 0
33 Daman & Diu 0 0 0 0 0 0
34 Delhi 1 12 20 90
Lakshadweep 0 0 0 0 0 0
36 Puducherry 0 0 0 0 1 1
367 223 156 571
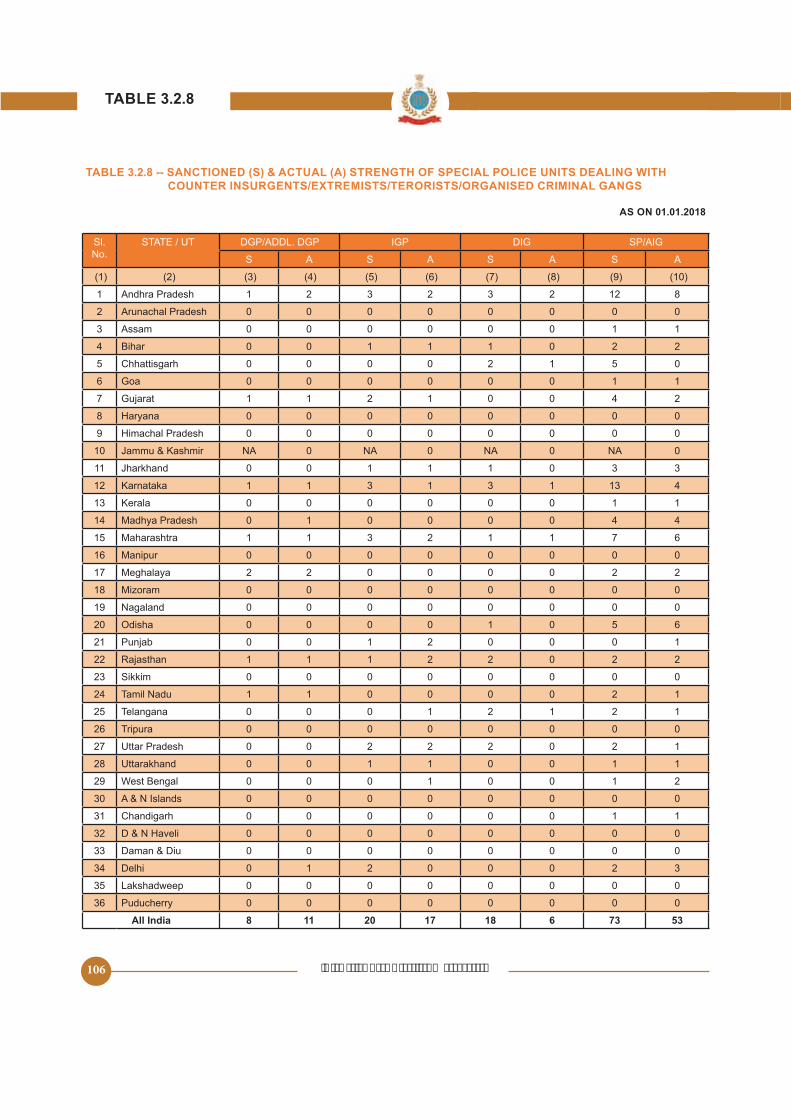
‘Promoting Good Practices & Standards’106
Sl. No.
STATE / UT DGP/ADDL. DGP IGP DIG SP/AIG
S A S A S A S A
1 Andhra Pradesh 1 2 3 2 3 2 12 8
2 Arunachal Pradesh 0 0 0 0 0 0 0 0
3 Assam 0 0 0 0 0 0 1 1
4 Bihar 0 0 1 1 1 0 2 2
Chhattisgarh 0 0 0 0 2 1 0
6 Goa 0 0 0 0 0 0 1 1
7 Gujarat 1 1 2 1 0 0 4 2
8 0 0 0 0 0 0 0 0
9 0 0 0 0 0 0 0 0
10 NA 0 NA 0 NA 0 NA 0
11 0 0 1 1 1 0 3 3
12 Karnataka 1 1 3 1 3 1 13 4
13 Kerala 0 0 0 0 0 0 1 1
14 Madhya Pradesh 0 1 0 0 0 0 4 4
Maharashtra 1 1 3 2 1 1 7 6
16 Manipur 0 0 0 0 0 0 0 0
17 Meghalaya 2 2 0 0 0 0 2 2
18 Mizoram 0 0 0 0 0 0 0 0
19 Nagaland 0 0 0 0 0 0 0 0
20 Odisha 0 0 0 0 1 0 6
21 Punjab 0 0 1 2 0 0 0 1
22 Rajasthan 1 1 1 2 2 0 2 2
23 Sikkim 0 0 0 0 0 0 0 0
24 Tamil Nadu 1 1 0 0 0 0 2 1
Telangana 0 0 0 1 2 1 2 1
26 Tripura 0 0 0 0 0 0 0 0
27 Uttar Pradesh 0 0 2 2 2 0 2 1
28 Uttarakhand 0 0 1 1 0 0 1 1
29 West Bengal 0 0 0 1 0 0 1 2
30 A & N Islands 0 0 0 0 0 0 0 0
31 Chandigarh 0 0 0 0 0 0 1 1
32 0 0 0 0 0 0 0 0
33 Daman & Diu 0 0 0 0 0 0 0 0
34 Delhi 0 1 2 0 0 0 2 3
Lakshadweep 0 0 0 0 0 0 0 0
36 Puducherry 0 0 0 0 0 0 0 0
8 11 17 18 6 73 53

‘Promoting Good Practices & Standards’ 107
Sl. No.
STATE / UT Addl.SP ASP/DY.SP INSPECTOR S.I. A.S.I.
S A S A S A S A S A
1 Andhra Pradesh 13 13 37 33 130 210 0 0
2 Arunachal Pradesh 0 0 0 0 0 0 0 0 0 0
3 Assam 0 0 1 1 6 6 0 4 0 2
4 Bihar 23 14 18 19 8 208 102 32 14
Chhattisgarh 4 39 7 67 11 106 144 79
6 Goa 0 0 0 0 2 1 14 2 0 1
7 Gujarat 3 2 0 0 12 8
8 0 0 0 0 7 8 17 14 48 48
9 0 0 0 0 6 4 9 4
10 NA 4 NA 33 NA NA NA
11 0 0 27 34 297 88 217
12 Karnataka 3 11 47 7 141 64 384 246 438 109
13 Kerala 1 1 3 2 1 10 8 17 1
14 Madhya Pradesh 1 1 16 41 30 110 32 26
Maharashtra 1 1 18 12 113 171 117 27 20
16 Manipur 0 0 8 9 16 18 82 98 31
17 Meghalaya 3 1 13 6 40 22 112 89 3 3
18 Mizoram 0 0 0 0 0 0 0 0 0 0
19 Nagaland 0 0 0 0 2 2 2 4 3 1
20 Odisha 10 10 96 80 12
21 Punjab 0 0 7 3 36 238 176 181 86
22 Rajasthan 14 14 7 4 33 69 13 14 7
23 Sikkim 1 0 0 1 2 0 0 2 0 0
24 Tamil Nadu 1 1 4 4 9 9 27 20 0 0
Telangana 7 7 10 40 106 29 0 27
26 Tripura 0 0 0 0 0 0 0 0 0 0
27 Uttar Pradesh 18 9 20 34 68 0 0
28 Uttarakhand 1 1 1 1 0 3 3 3 0 0
29 West Bengal 0 0 32 88 436 178 637
30 A & N Islands 0 0 0 0 0 0 0 0 0 0
31 Chandigarh 0 0 1 1 4 2
32 0 0 0 0 0 0 0 0 0 0
33 Daman & Diu 0 0 0 0 0 0 0 0 0 0
34 Delhi 0 0 7 3 40 48 191 186 190 148
Lakshadweep 0 0 0 0 0 0 0 0 0 0
36 Puducherry 0 0 0 0 0 0 0 0 0 0
487 763 3413 1258
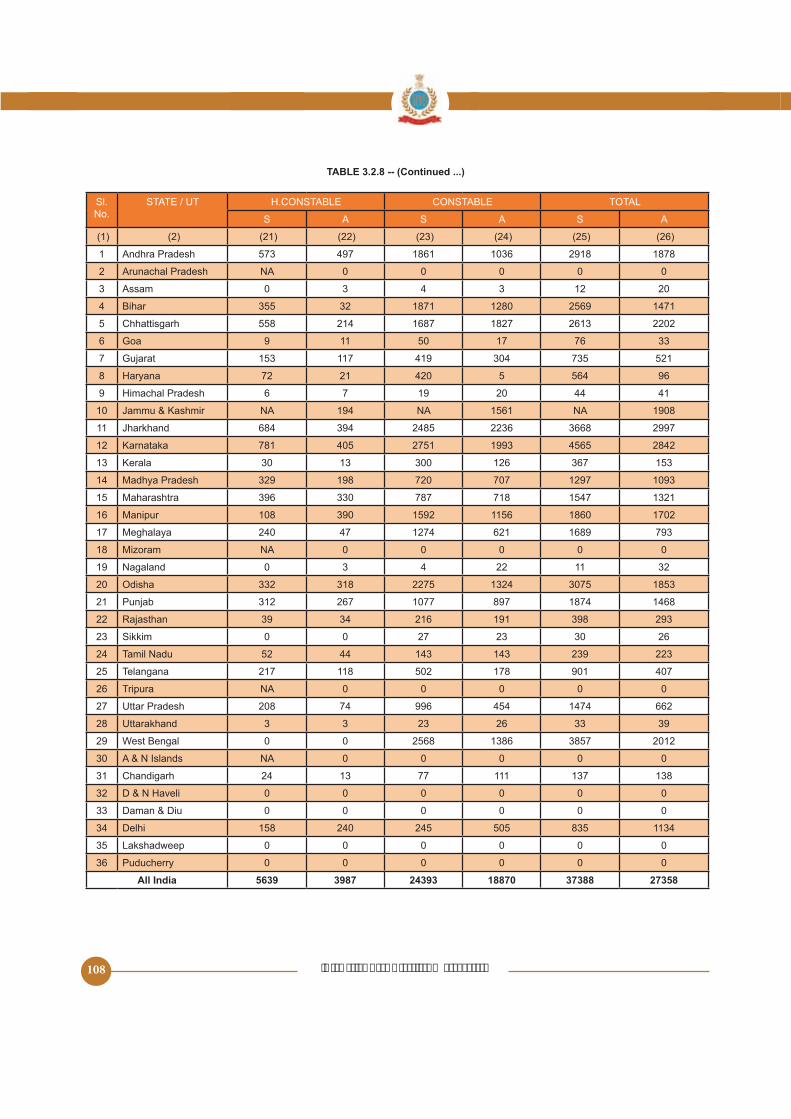
‘Promoting Good Practices & Standards’108
Sl. No.
STATE / UT CONSTABLE TOTAL
S A S A S A
1 Andhra Pradesh 497 1861 1036 2918 1878
2 Arunachal Pradesh NA 0 0 0 0 0
3 Assam 0 3 4 3 12 20
4 Bihar 32 1871 1280 1471
Chhattisgarh 214 1687 1827 2613 2202
6 Goa 9 11 17 76 33
7 Gujarat 117 419 304
8 72 21 420 96
9 6 7 19 20 44 41
10 NA 194 NA NA 1908
11 684 394 2236 3668 2997
12 Karnataka 781 1993 2842
13 Kerala 30 13 300 126 367
14 Madhya Pradesh 329 198 720 707 1297 1093
Maharashtra 396 330 787 718 1321
16 Manipur 108 390 1860 1702
17 Meghalaya 240 47 1274 621 1689 793
18 Mizoram NA 0 0 0 0 0
19 Nagaland 0 3 4 22 11 32
20 Odisha 332 318 1324
21 Punjab 312 267 1077 897 1874 1468
22 Rajasthan 39 34 216 191 398 293
23 Sikkim 0 0 27 23 30 26
24 Tamil Nadu 44 143 143 239 223
Telangana 217 118 178 901 407
26 Tripura NA 0 0 0 0 0
27 Uttar Pradesh 208 74 996 1474 662
28 Uttarakhand 3 3 23 26 33 39
29 West Bengal 0 0 1386 2012
30 A & N Islands NA 0 0 0 0 0
31 Chandigarh 24 13 77 111 137 138
32 0 0 0 0 0 0
33 Daman & Diu 0 0 0 0 0 0
34 Delhi 240 1134
Lakshadweep 0 0 0 0 0 0
36 Puducherry 0 0 0 0 0 0
37388 27358

‘Promoting Good Practices & Standards’ 109
Sl. No.
STATE / UT DGP/SPL DGP ADGP IGP DIG SP/ AIG ADDL SP
1 Andhra Pradesh 0 0 0 0 0 0
2 Arunachal Pradesh 0 0 0 0 0 0
3 Assam 0 0 0 0 0 0
4 Bihar 0 0 0 0 0 0
Chhattisgarh 0 0 0 0 0 0
6 Goa 0 0 0 0 1 0
7 Gujarat 0 0 0 0 0 0
8 0 0 0 0 0 0
9 0 0 0 0 0 0
10 0 0 0 0 0 0
11 0 0 0 0 0 0
12 Karnataka 0 0 0 0 0 0
13 Kerala 0 0 0 0 0 0
14 Madhya Pradesh 0 0 0 0 0 0
Maharashtra 0 0 0 0 1 0
16 Manipur 0 0 0 0 0 0
17 Meghalaya 0 0 0 0 0 0
18 Mizoram 0 0 0 0 0 0
19 Nagaland 0 0 0 0 0 0
20 Odisha 0 0 0 0 0 0
21 Punjab 0 0 0 0 0 0
22 Rajasthan 0 0 0 0 0 1
23 Sikkim 0 0 0 0 0 0
24 Tamil Nadu 0 0 0 0 0 0
Telangana 0 0 0 0 0 0
26 Tripura 0 0 0 0 0 0
27 Uttar Pradesh 0 0 0 0 0 0
28 Uttarakhand 0 0 0 0 1 0
29 West Bengal 0 0 0 1 3 0
30 A & N Islands 0 0 0 0 0 0
31 Chandigarh 0 0 0 0 0 0
32 0 0 0 0 0 0
33 Daman & Diu 0 0 0 0 0 0
34 Delhi 0 0 0 0 0 0
Lakshadweep 0 0 0 0 0 0
36 Puducherry 0 0 0 0 0 0
1 6 1

‘Promoting Good Practices & Standards’110
Sl. No.
STATE / UT ASP/DSP INSPECTOR SI ASI CONSTABLE TOTAL
1 Andhra Pradesh 0 1 1 0 0 0 2
2 Arunachal Pradesh 0 0 0 0 0 0 0
3 Assam 1 0 0 0 0 0 1
4 Bihar 0 1 0 0 0 0 1
Chhattisgarh 0 0 0 0 0 0 0
6 Goa 0 0 0 0 1 0 2
7 Gujarat 0 0 3 10 8 26
8 0 0 0 0 0 0 0
9 0 0 0 0 0 3 3
10 0 0 0 0 0 0 0
11 0 1 0 3 0 0 4
12 Karnataka 0 3 30 2 18 204
13 Kerala 0 0 0 0 0 0 0
14 Madhya Pradesh 0 2 0 0 0 4 6
Maharashtra 0 2 11 0 2 1 17
16 Manipur 0 0 0 0 1 24
17 Meghalaya 0 0 0 0 0 0 0
18 Mizoram 0 0 0 0 0 0 0
19 Nagaland 0 0 0 0 0 0 0
20 Odisha 3 0 0 0 0 8
21 Punjab 0 0 0 0 0 0 0
22 Rajasthan 0 2 6 0 1 6 16
23 Sikkim 0 0 0 0 0 0 0
24 Tamil Nadu 0 0 0 0 0 0 0
Telangana 1 1 0 0 0 0 2
26 Tripura 0 0 0 0 0 0 0
27 Uttar Pradesh 0 0 0 0 0
28 Uttarakhand 0 0 0 0 0 0 1
29 West Bengal 2 3 8 11 0 19 47
30 A & N Islands 0 0 0 0 0 0 0
31 Chandigarh 0 0 0 0 1 10 11
32 0 0 0 0 0 0 0
33 Daman & Diu 0 0 0 0 0 0 0
34 Delhi 0 0 3 2 1
Lakshadweep 0 0 0 0 0 0 0
36 Puducherry 0 0 0 0 0 0 0
62 28 447

‘Promoting Good Practices & Standards’ 111
Sl. No.
Central Armed Police Force & Specalised Force
Sanctioned Strength Actual Strength
Gazetted Non- Gazetted Total Gazetted Non- Gazetted Total
1 1,268 66,411 1116 62360 63,476
2 Border Security Force 4744 242646 2,47,390
3 Central Industrial Security Force
1,49,221 1296 1,42,071
4 Central Reserve Police Force
3,13,917 3,02,632
Indo-Tibetan Border Police
2,091 89,396 1633 81927
6 National Disaster Response Force
300 13,843 193 10,488
7 National Security Guards
10,297 10,844 417
8 Railway Protection Force
466 74,462 74,928 443
9 Sashastra Seema Bal 2,294 96,918 99,212 1419 78806
Total

‘Promoting Good Practices & Standards’112
s
Sl. No. Central Armed
Police Force & Specalised
Force
Total No of Battalions
DGP/ Spl.DG Addl.DG IGP DIG
S A S A S A S A
1 46 1 1 1 1 3 3 22 21
2 Border Security Force
186 4 2 6 188
3 Central Industrial Security Force
1 1 2 2 9 9 61 49
4 Central Reserve Police Force
3 4 4 48 224 204
Indo-Tibetan Border Police
1 1 2 2 12 11 74 68
6 National Disaster Response Force
12 0 0 1 1 1 1 1 1
7 National Security Guards
NA 1 1 0 0 4 4 7 6
8 Railway Protection Force
NA 1 1 1 1 21 19 21
9 Sashastra Seema Bal
73 1 1 1 1 13 72 42
TOTAL 15 11 17 18 168 153

‘Promoting Good Practices & Standards’ 113
Sl. No. Central Armed Police
Force & Specalised
Force
Total No of Battalions
Commandants 2I/C Dy.Commdts Asstt.Commdt.
S A S A S A S A
1 46 92 129 86 192 374 391 394
2 Border Security Force
186 414 601 1,303 1,202 2,214 2,063
3 Central Industrial Security Force
214 179 0 0 368 274 909 760
4 Central Reserve Police Force
378 373 3,221
Indo-Tibetan Border Police
126 92 112 104 897 700
6 National Disaster Response Force
12 12 13 12 10 42 110 68
7 National Security Guards
NA 37 14 14 83 270
8 Railway Protection Force
NA 0 0 67 61 284 274
9 Sashastra Seema Bal
73 141 81 128 89 233
Total

‘Promoting Good Practices & Standards’114
Sl. No.
Central Armed Police Force & Specalised
Force
Subedar Major INSP. S.I. A.S.I.
S A S A S A S A S A
1 1 216 186 1,382 2,492 3,141 3,481
2 Border Security Force 316 194 4,488 4,173 9,891 8,701 20,896 19,864
3 Central Industrial Security Force
93 41 0 0 2,289 13,329 8,218 11,393
4 Central Reserve Police Force
14 3 12,421 22,741 21,889
Indo-Tibetan Border Police
303 83 81 3,031 2,191 4,687 4,210 4,892 4,770
6 National Disaster Response Force
110 49 0 0 280 1,628 742 42
7 National Security Guards
4 0 0 1,746 1,441 0 0 0 0
8 Railway Protection Force
0 0 0 0 2,174 4,311 3,016 7,081 4,322
9 Sashastra Seema Bal 189 109 3 0 2,232 7,870 6,720
TOTAL 826 851
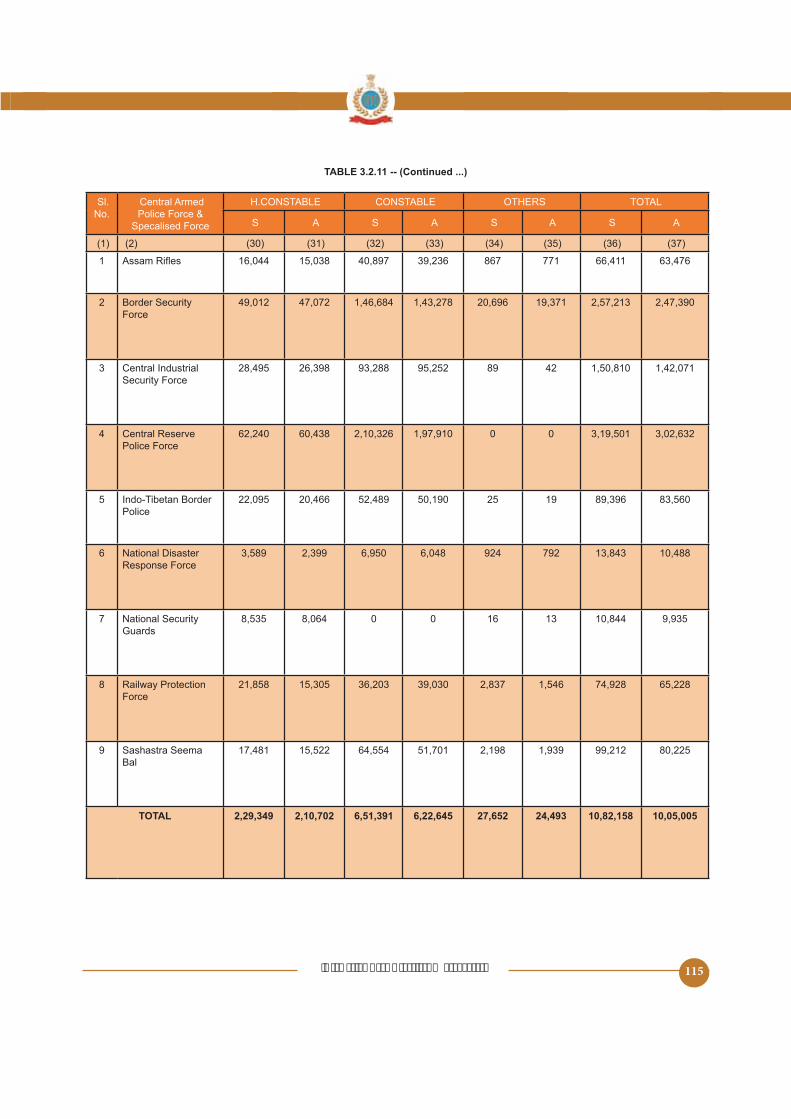
‘Promoting Good Practices & Standards’ 115
Sl. No.
Central Armed Police Force &
Specalised Force
CONSTABLE TOTAL
S A S A S A S A
1 16,044 40,897 39,236 867 771 66,411 63,476
2 Border Security Force
49,012 47,072 1,46,684 1,43,278 20,696 19,371 2,47,390
3 Central Industrial Security Force
26,398 93,288 89 42 1,42,071
4 Central Reserve Police Force
62,240 60,438 2,10,326 1,97,910 0 0 3,02,632
Indo-Tibetan Border Police
20,466 19 89,396
6 National Disaster Response Force
2,399 6,048 924 792 13,843 10,488
7 National Security Guards
8,064 0 0 16 13 10,844
8 Railway Protection Force
36,203 39,030 2,837 74,928
9 Sashastra Seema Bal
17,481 2,198 1,939 99,212
TOTAL

‘Promoting Good Practices & Standards’116
Sl. No. Central Armed Police Force &
Specialised Force
DGP/ Spl.DGP Addl.DGP IGP DIG AIG/ COMMANDANT 2 I/C
1 0 0 0 0 7 3
2 Border Security Force
0 0 3 0 38 10
3 Central Industrial Security Force
0 0 1 8 13 0
4 Central Reserve Police Force
0 0 2 8 7 8
Indo-Tibetan Border Police
0 0 0 3 0 0
6 National Disaster Respone Force
0 0 0 0 1 0
7 National Security Guards
0 0 0 0 0 0
8 Railway Protection Force
0 0 2 2 4 0
9 Sashastra Seema Bal
0 0 1 1 0 1
TOTAL 22 22

‘Promoting Good Practices & Standards’ 117
Sl. No. Central Armed Police Force &
Specialised Force
Dy. Commdts Asstt. Commdt. Subedar Major INSP. S.I.
1 17 12 0 0 0 32
2 Border Security Force
18 16 10 39 309
3 Central Industrial Security Force
11 11 9 0 169
4 Central Reserve Police Force
2 16 270
Indo-Tibetan Border Police
3 16 71 3 79 100
6 National Disaster Respone Force
1 1 12 0 2 3
7 National Security Guards
1 2 1 0 0
8 Railway Protection Force
2 1 0 0 13 133
9 Sashastra Seema Bal
2 10 21 0 11
TOTAL 284 131

‘Promoting Good Practices & Standards’118
Sl. No. Central Armed Police Force &
Specialised Force
A.S.I. CONSTABLE TOTAL Reservation Percentage approved by
Govt.
1 4 1 308 411
2 Border Security Force
197 4,346 28Constables
3 Central Industrial Security Force
464 362 6,497 1 8,303 Constables
4 Central Reserve Police Force
737 1,378 4,490 0 7,793 NA
Indo-Tibetan Border Police
74 200 1,364 10 1,923
6 National Disaster Respone Force
4 7 0 90 Deputationist Post
7 National Security Guards
0 0 0 24 Deputationist Post
8 Railway Protection Force
49 322 1,721 1
9 Sashastra Seema Bal
2 0 1,709
TOTAL 451
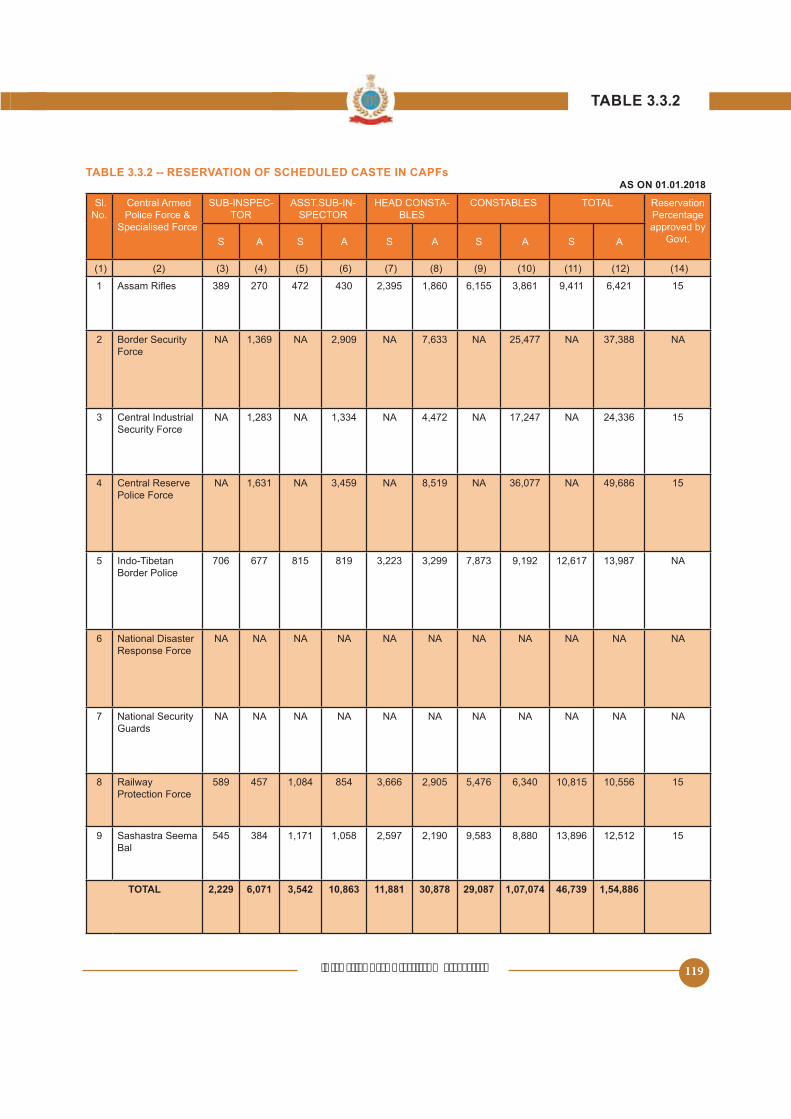
‘Promoting Good Practices & Standards’ 119
s
Sl. No.
Central Armed Police Force &
Specialised Force
SUB-INSPEC-TOR
ASST.SUB-IN-SPECTOR
-BLES
CONSTABLES TOTAL Reservation Percentage approved by
Govt.S A S A S A S A S A
1 389 270 472 430 1,860 3,861 9,411 6,421
2 Border Security Force
NA 1,369 NA 2,909 NA 7,633 NA NA 37,388 NA
3 Central Industrial Security Force
NA 1,283 NA 1,334 NA 4,472 NA 17,247 NA 24,336
4 Central Reserve Police Force
NA 1,631 NA NA NA 36,077 NA 49,686
Indo-Tibetan Border Police
706 677 819 3,223 3,299 7,873 9,192 12,617 13,987 NA
6 National Disaster Response Force
NA NA NA NA NA NA NA NA NA NA NA
7 National Security Guards
NA NA NA NA NA NA NA NA NA NA NA
8 Railway Protection Force
1,084 3,666 6,340
9 Sashastra Seema Bal
384 1,171 2,190 8,880 13,896
TOTAL
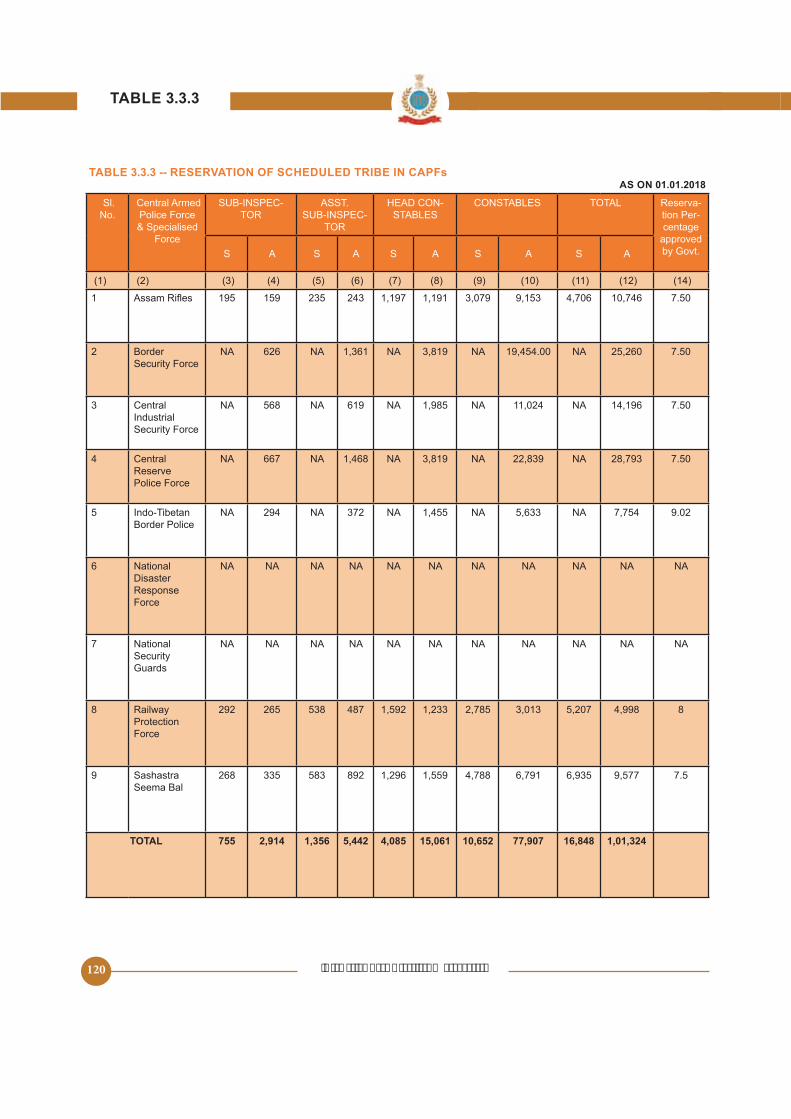
‘Promoting Good Practices & Standards’120
s
Sl. No.
Central Armed Police Force & Specialised
Force
SUB-INSPEC-TOR
ASST. SUB-INSPEC-
TOR
-STABLES
CONSTABLES TOTAL Reserva-tion Per-centage
approved by Govt.S A S A S A S A S A
1 243 1,197 1,191 3,079 4,706 10,746
2 Border Security Force
NA 626 NA 1,361 NA 3,819 NA NA
3 Central Industrial Security Force
NA NA 619 NA NA 11,024 NA 14,196
4 Central Reserve Police Force
NA 667 NA 1,468 NA 3,819 NA 22,839 NA 28,793
Indo-Tibetan Border Police
NA 294 NA 372 NA NA NA 9.02
6 National Disaster Response Force
NA NA NA NA NA NA NA NA NA NA NA
7 National Security Guards
NA NA NA NA NA NA NA NA NA NA NA
8 Railway Protection Force
292 487 1,233 3,013 4,998 8
9 Sashastra Seema Bal
268 892 1,296 4,788 6,791
TOTAL 755

‘Promoting Good Practices & Standards’ 121
s
Sl. No.
Central Armed Police Force &
Specialised Force
SUB-INSPEC-TOR
ASST. SUB-IN-SPECTOR
-STABLES
CONSTABLES TOTAL Reserva-tion Per-centage
approved by Govt.
S A S A S A S A S A
1 NA 182 NA 319 NA NA 8,366 NA 27
2 Border Security Force
NA 2,128 NA NA 8,310 NA 47,146 NA 60,839 27
3 Central Industrial Security Force
NA 2,439 NA 1,984 NA NA NA 42,346 27
4 Central Reserve Police Force
NA 2,168 NA 2,802 NA 10,090 NA NA 27
Indo-Tibetan Border Police
NA 48 NA 48 NA NA 18,691 NA 23
6 National Disaster Response Force
NA NA NA NA NA NA NA NA NA NA NA
7 National Security Guards
NA NA NA NA NA NA NA NA NA NA NA
8 Railway Protection Force
746 380 638 2,290 902 9,611 12,844 14,480 27
9 Sashastra Seema Bal
720 NA 1,311 NA 19,160 18,274 27
TOTAL 638

‘Promoting Good Practices & Standards’122
Sl. No.
CENTRAL INVESTIGATION
-ER POLICE OR-GANISATIONS
DGP SPL DGP /Addl.DG
IGP DIG SP ADDL SP DySP
1 CENTRAL BUREAU OF
INVESTIGATION
1 1 10 22 73 267
2 BUREAU OF POLICE
DEVELOPMENT
1 1 10 6 0 2
3 NATIONAL CRIME RECORD
BUREAU
0 1 2 0 0 0 9
4 NATIONAL INVESTIGATION
AGENCY
1 0 4 6 18 23
Total 3 3 21 38 78
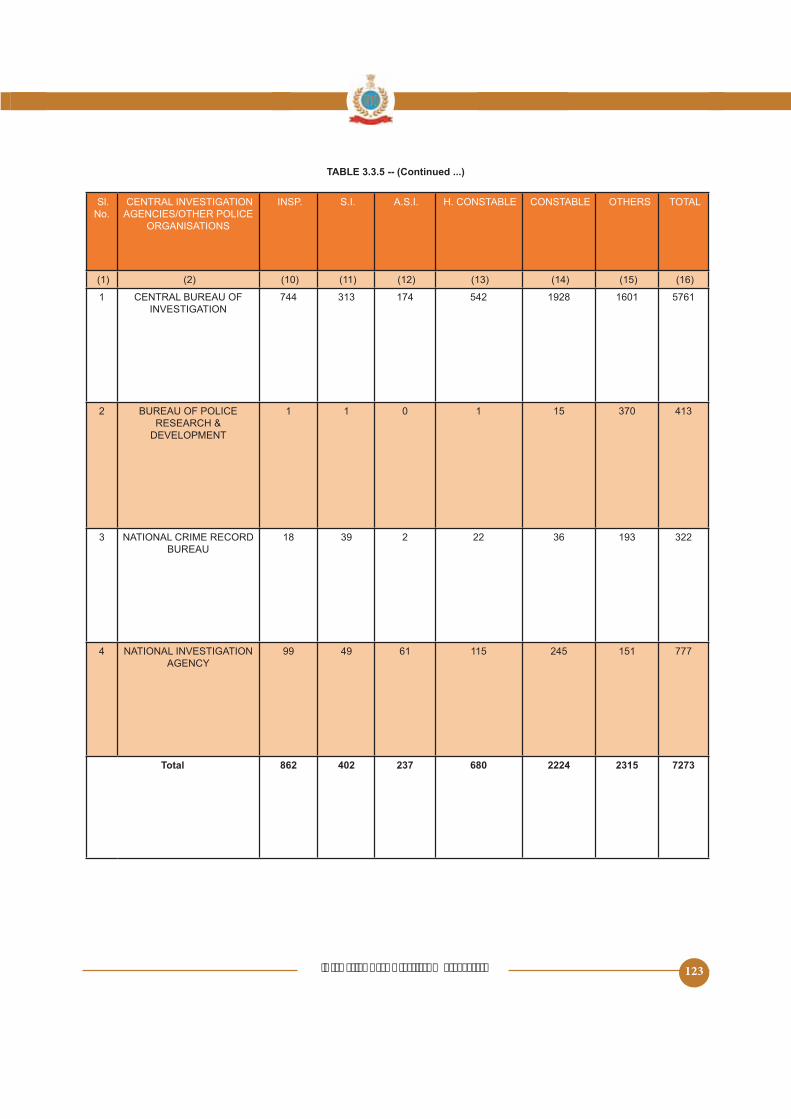
‘Promoting Good Practices & Standards’ 123
Sl. No.
CENTRAL INVESTIGATION
ORGANISATIONS
INSP. S.I. A.S.I. CONSTABLE TOTAL
1 CENTRAL BUREAU OF INVESTIGATION
744 313 174 1928 1601
2 BUREAU OF POLICE
DEVELOPMENT
1 1 0 1 370 413
3 NATIONAL CRIME RECORD BUREAU
18 39 2 22 36 193 322
4 NATIONAL INVESTIGATION AGENCY
99 49 61 777
Total 862 237 2224 2315 7273

‘Promoting Good Practices & Standards’124
Sl. No.
STATE / UT Total State Budget
Police Budget Percentage of Total State
Budget
Expenditure of Police Budget
Police Training Budget
Expenditure of Police Training Budget
1 Andhra Pradesh 3847.76 3879.40 38.68 38.13
2 Arunachal Pradesh 7616.97 741.16 12.64
3 Assam 3946.60 3119.73
4 Bihar 144696.00 4861.44 37.46 33.41
Chhattisgarh 37.63
6 Goa 14694.00 440.43 1.20 1.20
7 Gujarat
8 108788.16
9 949.67
10 61680.00 4293.64 4016.21 NA
11 3234.00 0.28 0.24
12 Karnataka 163419.00 4109.76 4020.62 40.49 44.01
13 Kerala 3110.03 NA
14 Madhya Pradesh 4934.90 82.29 82.29
Maharashtra 12006.93 11840.39 116.41 111.48
16 Manipur 9709.03 NA
17 Meghalaya 10682.07 666.26 448.49 NA 3.43
18 Mizoram 12.42 11.37
19 Nagaland NA NA
20 Odisha 2617.89 37.90 33.14
21 Punjab 4864.21
22 Rajasthan 174840.00 4494.11 4486.91 70.87
23 Sikkim NA 3.21
24 Tamil Nadu 196260.44 174.76 162.76
Telangana 2617.91 2800.01 89.39 40.98
26 Tripura 14941.34 1080.92 991.93 23.08 18.33
27 Uttar Pradesh 49607.93 144.90 130.43
28 Uttarakhand 40422.20 1360.37 11.16
29 West Bengal 193878.10 9.71
30 A & N Islands 4414.02 227.70 2.89 2.24
31 Chandigarh 4169.09 410.61 410.61
32 NA NA
33 Daman & Diu 21.42 21.42 0.64 0.38
34 Delhi NA 6011.06 NA 140.09 140.06
Lakshadweep 28.16 27.30 NA NA
36 Puducherry 199.70 199.70 NA NA
TOTAL

‘Promoting Good Practices & Standards’ 125
Sl. No.
STATE / UT Total State Budget
Police Budget Percentage of Total State
Budget
Expenditure of Police Budget
Police Training Budget
Expenditure of Police
Training Budget
1 Andhra Pradesh 3973.34 41.60 81.71
2 Arunachal Pradesh 8892.37 909.99 874.64 14.29 14.28
3 Assam 4208.14 31.20
4 Bihar 41.64 37.80
Chhattisgarh 83279.37 39.16
6 Goa 16270.00 1.91 1.82
7 Gujarat 172179.24 4430.86
8 113266.31 3838.40 33.19 33.60
9 1122.03 1042.00
10 4478.76 NA NA
11 0.39 0.34
12 Karnataka 47.19
13 Kerala 132730.28 3241.87 3110.03
14 Madhya Pradesh 3628.44 100.30 100.30
Maharashtra 12478.00 109.80 109.70
16 Manipur 1419.97 0.00 0.00
17 Meghalaya 13048.22 742.37 697.42 4.43
18 Mizoram 8803.10 478.02 12.20 12.67
19 Nagaland NA NA NA NA 112.49 112.49
20 Odisha 412481.00 3286.49 3081.47 47.22
21 Punjab 112797.42 64.30
22 Rajasthan 4782.94 89.07 76.71
23 Sikkim NA NA NA NA NA NA
24 Tamil Nadu 4660.31 118.90
Telangana 146000.00 3049.96 107.89
26 Tripura 1328.88 19.39
27 Uttar Pradesh 16239.92 126.09
28 Uttarakhand 1691.13 1618.34 12.09
29 West Bengal 7460.03 9.78
30 A & N Islands 4263.28 328.09 3.13 2.32
31 Chandigarh 4628.21 1.08 1.08
32 1121.29 28.63 28.10
33 Daman & Diu 21.88 21.88 0.00 0.00
34 Delhi NA 6781.79 - 6777.02 140.44 140.33
Lakshadweep 1249.00 29.02 0.00 0.00
36 Puducherry 210.49 191.27 0.00 0.00
TOTAL

‘Promoting Good Practices & Standards’126
Sl. No.
STATE / UT Total Police Expenditure Total Police Training Expenditurepercentage 2016-17 2017-2018 Increase/
Decrease2016-17 2017-2018 Increase/
Decrease
1 Andhra Pradesh 3879.40 3973.34 93.94 38.13 81.71
2 Arunachal Pradesh 741.16 874.64 133.48 12.64 14.28 1.64
3 Assam 3119.73 4208.14 1088.41 31.20
4 Bihar 4861.44 33.41 37.80 4.39
Chhattisgarh 37.63 39.16
6 Goa 1.20 1.82 0.62
7 Gujarat 4430.86 934.89 18.67
8 118.14 33.60
9 1042.00 141.49 0.03
10 4016.21 NA - 4.02 -
11 0.24 0.34 0.10
12 Karnataka 4020.62 44.01
13 Kerala 3110.03 3110.03 0.00 46.18
14 Madhya Pradesh 4934.90 3628.44 -1306.46 82.29 100.30 18.01
Maharashtra 11840.39 -481.17 111.48 109.70 -1.78
16 Manipur 113.43 0.00
17 Meghalaya 448.49 697.42 248.93 3.43 4.43 1.00
18 Mizoram 478.02 -6.48 11.37 12.67 1.30
19 Nagaland NA - 112.49 99.99 -
20 Odisha 2617.89 3081.47 33.14 7.81
21 Punjab 4864.21 476.88
22 Rajasthan 4486.91 4782.94 296.03 76.71 7.06
23 Sikkim NA - 3.21 NA - -
24 Tamil Nadu 4660.31 162.76 118.90 -43.86
Telangana 2800.01 3049.96 40.98 47.97
26 Tripura 991.93 226.64 18.33 19.39 1.06
27 Uttar Pradesh 1229.90 130.43 126.09 -4.34
28 Uttarakhand 1360.37 1618.34 12.09
29 West Bengal 61.09 9.71 -1.20
30 A & N Islands 227.70 24.36 2.24 2.32 0.08
31 Chandigarh 410.61 18.04 1.08 0.13
32 28.10 NA -
33 Daman & Diu 21.42 21.88 0.46 0.38 0.00 -0.38
34 Delhi 6777.02 771.48 140.06 140.33 0.27
Lakshadweep 27.30 1.23 NA 0.00 -
36 Puducherry 199.70 191.27 -8.43 NA 0.00 -
TOTAL

‘Promoting Good Practices & Standards’ 127
Sl. No.
STATE / UT Central Govt State Govt Total Total Utilized In Modernisation By
State Police
Utilisation Percentage Of
Total Grant
1 Andhra Pradesh 66.67 21.08 NA NA
2 Arunachal Pradesh 0.21 NA 0.21 NA NA
3 Assam 43.36 41.03 84.39
4 Bihar 3.77 NA 3.77 3.77
Chhattisgarh 1.33 9.49 10.82 3.61
6 Goa 0.26 NA 0.26 0.14
7 Gujarat 31.24 23.04
8 11.09 8.03 19.12 12.34
9 422.89 468.32 48
10 39.73
11 NA NA NA NA NA
12 Karnataka 37.62 39.06
13 Kerala 1024 682.67 1706.67
14 Madhya Pradesh 20.42 13.61 34.03 11.41
Maharashtra 6.43 NA 6.43 6.43
16 Manipur 8.86 0.9 9.76 NA
17 Meghalaya 0.14 0.016 0.16 NA NA
18 Mizoram 4.31 4.88 2.49
19 Nagaland 146 1311.00 1311
20 Odisha 1986.84 1324.78 3311.62 2277.69
21 Punjab 32.43 20.43 18.64
22 Rajasthan 18.38 19.1
23 Sikkim NA NA NA NA NA
24 Tamil Nadu 10.36
Telangana 21.36 14.23 NA NA
26 Tripura 0 19.47 19.47 9.82
27 Uttar Pradesh 23.71 NA NA
28 Uttarakhand 4.11 NA 4.11 4.11
29 West Bengal 33.43 87.62
30 A & N Islands NA NA NA NA -
31 Chandigarh NA NA NA NA -
32 NA NA NA NA -
33 Daman & Diu NA NA NA NA -
34 Delhi NA NA NA NA -
Lakshadweep NA NA NA NA -
36 Puducherry NA NA NA NA -
TOTAL

‘Promoting Good Practices & Standards’128
Sl. No. Central Armed Police Force & Specailised
Force
FINANCIAL YEAR 2016-17 FINANCIAL YEAR 2017-18
Total Budget Total Expenditure Total Budget Total Expenditure
1 4917 4814.04
2 Border Security Force 14114 17041.01 16971.46
3 Central Industrial Security Force
7074 8280.1 8279.11
4 Central Reserve Police Force
16992
Indo-Tibetan Border Police
6 National Disaster Relief Force
NA NA 1043.77 1040.77
7 National Security Guards
NA NA NA NA
8 Railway Protection Force
NA NA NA
9 Sashastra Seema Bal 4126 4126
TOTAL
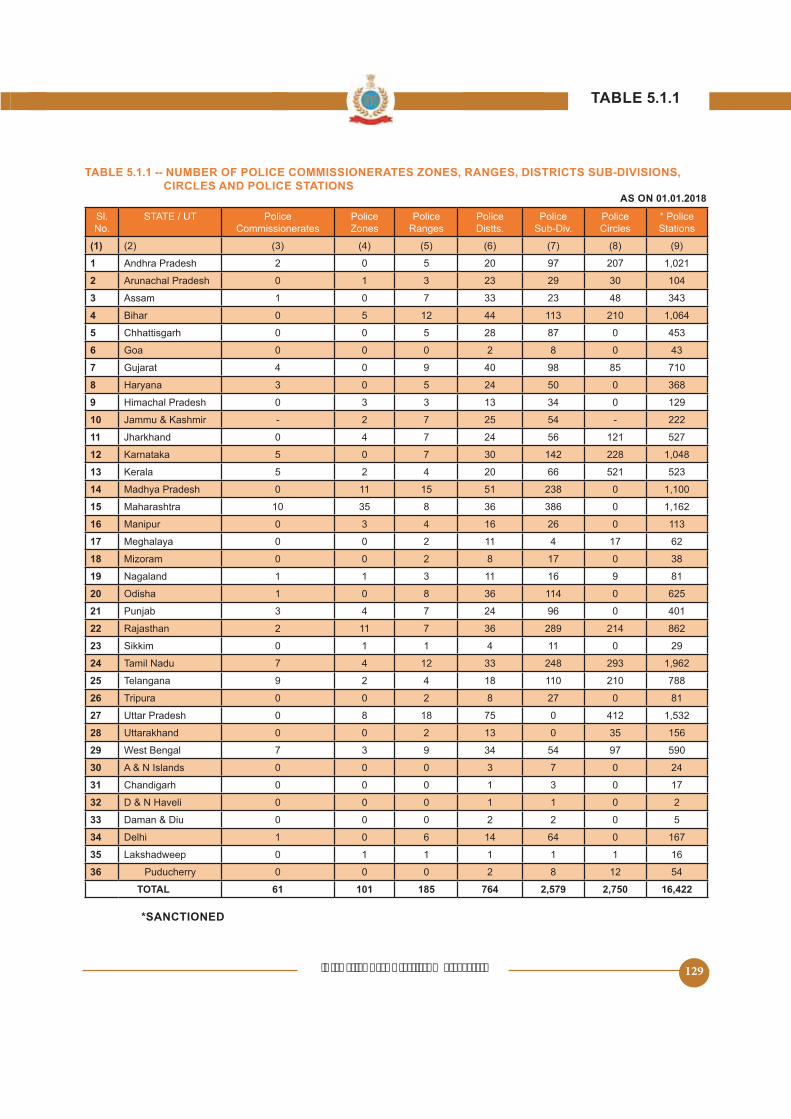
‘Promoting Good Practices & Standards’ 129
CIRCLES AND POLICE STATIONS
Sl. No.
STATE / UT Police Commissionerates
Police Police Ranges
Police Distts.
Police Sub-Div.
Police Circles
* Police Stations
1 Andhra Pradesh 2 0 20 97 207 1,021
2 Arunachal Pradesh 0 1 3 23 29 30 104
3 Assam 1 0 7 33 23 48 343
4 Bihar 0 12 44 113 210 1,064
5 Chhattisgarh 0 0 28 87 0
6 Goa 0 0 0 2 8 0 43
7 Gujarat 4 0 9 40 98 710
8 3 0 24 0 368
0 3 3 13 34 0 129
- 2 7 - 222
11 0 4 7 24 121
12 Karnataka 0 7 30 142 228 1,048
13 Kerala 2 4 20 66
14 Madhya Pradesh 0 11 238 0 1,100
15 Maharashtra 10 8 36 386 0 1,162
16 Manipur 0 3 4 16 26 0 113
17 Meghalaya 0 0 2 11 4 17 62
18 Mizoram 0 0 2 8 17 0 38
Nagaland 1 1 3 11 16 9 81
Odisha 1 0 8 36 114 0
21 Punjab 3 4 7 24 96 0 401
22 Rajasthan 2 11 7 36 289 214 862
23 Sikkim 0 1 1 4 11 0 29
24 Tamil Nadu 7 4 12 33 248 293 1,962
25 Telangana 9 2 4 18 110 210 788
26 Tripura 0 0 2 8 27 0 81
27 Uttar Pradesh 0 8 18 0 412
28 Uttarakhand 0 0 2 13 0
West Bengal 7 3 9 34 97
A & N Islands 0 0 0 3 7 0 24
31 Chandigarh 0 0 0 1 3 0 17
32 0 0 0 1 1 0 2
33 Daman & Diu 0 0 0 2 2 0
34 Delhi 1 0 6 14 64 0 167
35 Lakshadweep 0 1 1 1 1 1 16
36 Puducherry 0 0 0 2 8 12
TOTAL 61 185 764
*SANCTIONED

‘Promoting Good Practices & Standards’130
Sl. No.
STATE / UT RURAL POLICE STATION
URBAN POLICE STATION
RAILWAY POLICE STATIONS
TRAFFIC/SPECIAL-ISED ETC. POLICE
STATIONS
TOTAL POLICE STATIONS
S A S A S A S A S A
1 Andhra Pradesh 712 712 34 34 1,021 1,021
2 Arunachal Pradesh 61 43 26 0 0 0 1 104
3 Assam 178 178 147 147 13 13 343 343
4 Bihar 763 733 171 40 40 90 90 1,064 1,022
Chhattisgarh 342 330 101 6 0 0 436
6 Goa 19 19 8 8 1 1 43 43
7 Gujarat 107 24 24 123 123 710 708
8 184 133 123 16 16 368 324
9 79 79 38 38 2 2 10 9 129 128
10 120 120 91 91 11 11 0 0 222 222
11 330 330 91 91 23 23 83 83
12 Karnataka 321 321 18 18 166 166 1,048 1,048
13 Kerala 384 384 86 86 13 13 40 38
14 Madhya Pradesh 28 28 122 122 1,100 1,100
Maharashtra 844 844 279 279 39 39 0 0 1,162 1,162
16 Manipur 77 48 19 18 4 0 13 13 113 79
17 Meghalaya 43 43 19 19 0 0 0 0 62 62
18 Mizoram 27 27 11 11 0 0 0 0 38 38
19 Nagaland 20 20 1 1 3 3 81 81
20 Odisha 387 381 8 42
21 Punjab 163 11 11 0 0 401 429
22 Rajasthan 467 467 370 370 0 6 862 868
23 Sikkim 21 21 8 8 0 0 0 0 29 29
24 Tamil Nadu 1,146 1,146 348 348 47 47 421 421 1,962 1,962
Telangana 12 12 67 67 788 788
26 Tripura 44 44 32 32 0 0 81 81
27 Uttar Pradesh 970 970 2 2
28 Uttarakhand 99 99 4 4 3 3
29 West Bengal 266 266 21 21
30 A & N Islands 19 19 0 0 0 0 24 24
31 Chandigarh 0 0 17 17 0 0 0 0 17 17
32 1 1 1 1 0 0 0 0 2 2
33 Daman & Diu 0 0 4 0 0 0 0 4
34 Delhi 0 0 4 23 6 6 167 194
Lakshadweep 9 9 0 0 0 0 7 7 16 16
36 Puducherry 23 23 17 17 0 0 14 14
TOTAL

‘Promoting Good Practices & Standards’ 131
Sl. No.
STATE / UT RURAL POLICE OUT-POSTS
URBAN POLICE OUT-POSTS
RAILWAY POLICE OUTPOSTS
TOTAL POLICE OUT-POSTS
S A S A S A S A
1 Andhra Pradesh 0 0 30 30
2 Arunachal Pradesh 6 18 0 1 0 1 6 20
3 Assam 134 19 19 228 289
4 Bihar 216 216 221 221 0 0 437 437
Chhattisgarh 100 93 11 10 2 2 113
6 Goa 26 26 7 7 0 0 33 33
7 Gujarat 926 926 266 266 1,249 1,249
8 109 109 197 197 8 21 314 327
9 84 20 20 3 3 107 138
10 262 262 0 0 287 287
11 72 72 18 18
12 Karnataka 278 278 0 0 303 303
13 Kerala 21 21 2 2 0 0 23 23
14 Madhya Pradesh 109 109 19 19
Maharashtra 1,082 1,082 701 701 97 97 1,880 1,880
16 Manipur 40 11 11 6 0 73
17 Meghalaya 38 38 2 2 0 0 40 40
18 Mizoram 12 12 1 1 0 0 13 13
19 Nagaland 0 0 0 0 0 0
20 Odisha 331 331 124 124 23 23 478 478
21 Punjab 107 233 132 32 34 196 399
22 Rajasthan 649 649 36 36 1,189 1,189
23 Sikkim 29 29 18 18 0 0 47 47
24 Tamil Nadu 2 2 10 10 27 27
Telangana 60 60 0 0 0 0 60 60
26 Tripura 27 27 9 9 7 0 43 36
27 Uttar Pradesh 347 43 43 440
28 Uttarakhand
29 West Bengal 198 198 179 179 82 82
30 A & N Islands 17 22 0 0 0 0 17 22
31 Chandigarh 0 4 0 7 0 0 0 11
32 13 13 6 6 0 0 19 19
33 Daman & Diu 8 8 2 2 0 0 10 10
34 Delhi 0 0 17 3 2 20
Lakshadweep 3 3 0 0 0 0 3 3
36 Puducherry 6 6 2 2 0 0 8 8
TOTAL 512 514

‘Promoting Good Practices & Standards’132
Sl. No.
STATE / UT Crime Against SCs/STs/ Weaker
Sections
Crime Against Women & Children
Anti corruption/ Vigilance
Coastal Police Crime Investiga-tion Department
1 Andhra Pradesh 0 0 0 0 1
2 Arunachal Pradesh 0 0 1 0 1
3 Assam 0 0 1 0 1
4 Bihar 40 40 2 0 0
Chhattisgarh 13 0 1 0 1
6 Goa 0 1 1 7 1
7 Gujarat 0 39 37 22 10
8 0 23 0 0
9 0 8 12 0 1
10 0 0 2 0 2
11 22 34 6 0 0
12 Karnataka 0 0 0 9 8
13 Kerala 2 10 0 14 1
14 Madhya Pradesh 10 1 0
Maharashtra 0 0 0 44 0
16 Manipur 0 9 1 0 3
17 Meghalaya 0 0 0 0 1
18 Mizoram 0 0 1 0 2
19 Nagaland 0 2 1 0 1
20 Odisha 0 0 6 18 1
21 Punjab 0 8 0 0 0
22 Rajasthan 0 40 1 0 0
23 Sikkim 1 1 1 0 1
24 Tamil Nadu 3 13 36 42
Telangana 0 0 0 1
26 Tripura 0 0 0 0 0
27 Uttar Pradesh 0 0 0 0 0
28 Uttarakhand 0 2 3 0 0
29 West Bengal 0 0 0 14 0
30 A & N Islands 0 0 1 20 0
31 Chandigarh 0 1 1 0 1
32 0 1 0 0 0
33 Daman & Diu 0 0 0 3 0
34 Delhi 0 1 1 0 0
Lakshadweep 0 0 0 7 0
36 Puducherry 3 1 1 4 1
TOTAL 132 258 122

‘Promoting Good Practices & Standards’ 133
Sl. No.
STATE / UT Economic Cyber Crime Crime Against Wild Life
Narcotics and Drug
Any Other Total No. of Special Pur-pose Police
Stations
1 Andhra Pradesh 0 1 0 0 0 2
2 Arunachal Pradesh 1 1 0 0 0 4
3 Assam 1 0 0 0 2
4 Bihar 1 1 0 0 1
Chhattisgarh 0 1 0 0 0 16
6 Goa 1 1 0 1 3 16
7 Gujarat NA NA NA NA 1 109
8 0 0 0 0 8 36
9 0 1 0 0 3
10 0 0 0 0 10 14
11 0 4 0 1 0 67
12 Karnataka 36 0 0 1
13 Kerala 0 1 0 0 0 28
14 Madhya Pradesh 1 1 0 1 1 71
Maharashtra 0 43 0 0 0 87
16 Manipur 1 1 0 1 0 16
17 Meghalaya 0 1 0 0 0 2
18 Mizoram 0 0 0 1 0 4
19 Nagaland 0 1 0 1 1 7
20 Odisha 1 4 0 0 0 30
21 Punjab 0 2 0 1 19 30
22 Rajasthan 1 1 0 0 3 46
23 Sikkim 1 1 0 0 0 6
24 Tamil Nadu 7 0 29 14 216
Telangana 0 2 0 0 1 19
26 Tripura 0 0 0 0 0 0
27 Uttar Pradesh 0 2 0 0 0 2
28 Uttarakhand 1 0 0 0 0 6
29 West Bengal 0 6 0 0 2 22
30 A & N Islands 0 0 0 0 0 21
31 Chandigarh 1 1 0 0 1 6
32 0 0 0 0 0 1
33 Daman & Diu 0 0 0 0 0 3
34 Delhi 1 0 0 0 3 6
Lakshadweep 0 0 0 0 0 7
36 Puducherry 1 1 0 0 0 12
TOTAL 32 36 74

‘Promoting Good Practices & Standards’134
Sl. No. STATE / UT NUMBER OF CITIES
COMMISSIONER
NAME OF CITIES
1 Andhra Pradesh 2 -NAM
2 Assam 1
3 Gujarat 4 VADODARA SURAT
4 3 GURUGRAM FARIDABAD
Karnataka BENGALURU BELAGAVI MANGA-LORE
MYSORE
6 Kerala KOLLAM --
PURAM
7 Maharashtra 10 AMRAVATI AURANGABAD MUMBAI NAGPUR
NAVI MUMBAI PUNE RAILWAY MUMBAI
SOLAPUR
8 Nagaland 1 DIMAPUR
9 Odisha 1-CUTTACK
10 Punjab 3 AMRITSAR
11 Rajasthan 2
12 Tamil Nadu 7 COIMBATORE MADURAI SALEM
TIRUNELVELI TIRUPPUR
13 Telangana 9 CYBERABAD KARIMNAGAR -ABAD
RAMAGUNDAM SIDDIPET
WARANGAL
14 West Bengal 7 ASANSOL-DURGAPUR
BARRACKPUR KOLKATA
NAGARSILIGURI
Delhi 1
61
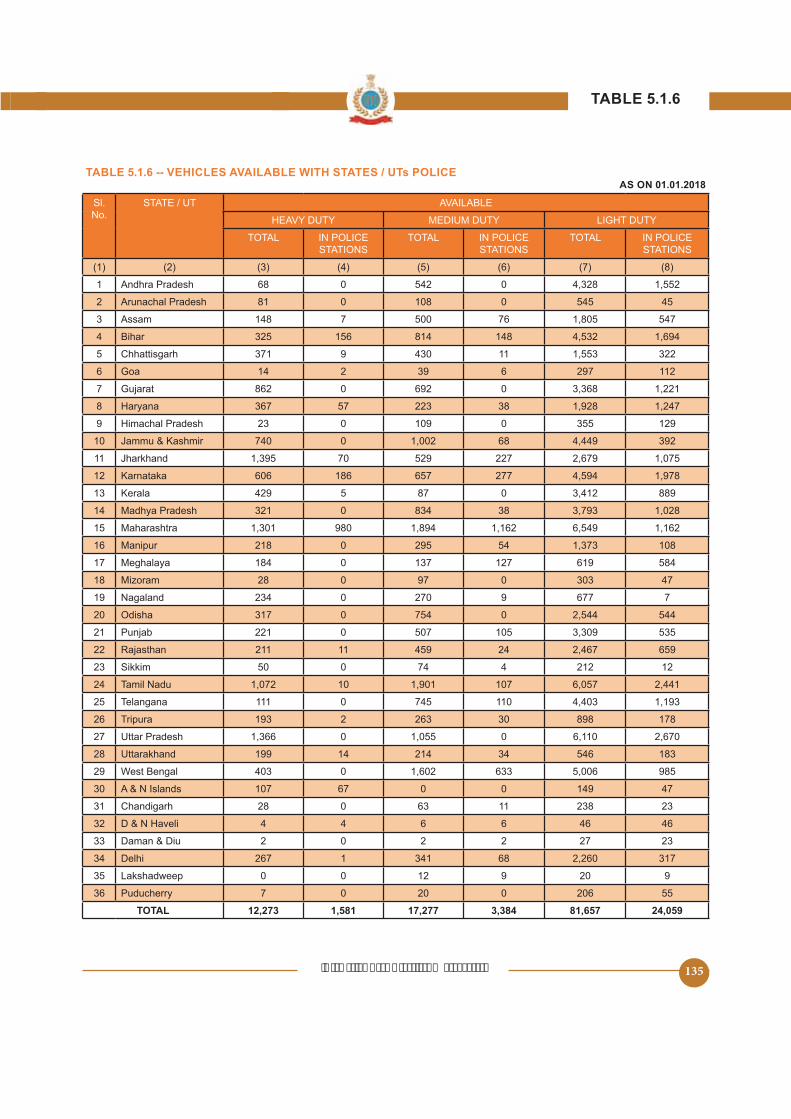
‘Promoting Good Practices & Standards’ 135
s POLICE
Sl. No.
STATE / UT AVAILABLE
MEDIUM DUTY
TOTAL IN POLICE STATIONS
TOTAL IN POLICE STATIONS
TOTAL IN POLICE STATIONS
1 Andhra Pradesh 68 0 0 4,328
2 Arunachal Pradesh 81 0 108 0
3 Assam 148 7 76
4 Bihar 814 148 1,694
Chhattisgarh 371 9 430 11 322
6 Goa 14 2 39 6 297 112
7 Gujarat 862 0 692 0 3,368 1,221
8 367 223 38 1,928 1,247
9 23 0 109 0 129
10 740 0 1,002 68 4,449 392
11 70 227 2,679
12 Karnataka 606 186 277 1,978
13 Kerala 429 87 0 3,412 889
14 Madhya Pradesh 321 0 834 38 3,793 1,028
Maharashtra 1,301 980 1,894 1,162 1,162
16 Manipur 218 0 1,373 108
17 Meghalaya 184 0 137 127 619
18 Mizoram 28 0 97 0 303 47
19 Nagaland 234 0 270 9 677 7
20 Odisha 317 0 0
21 Punjab 221 0 3,309
22 Rajasthan 211 11 24 2,467
23 Sikkim 0 74 4 212 12
24 Tamil Nadu 1,072 10 1,901 107 2,441
Telangana 111 0 110 4,403 1,193
26 Tripura 193 2 263 30 898 178
27 Uttar Pradesh 1,366 0 0 6,110 2,670
28 Uttarakhand 199 14 214 34 183
29 West Bengal 403 0 1,602 633
30 A & N Islands 107 67 0 0 149 47
31 Chandigarh 28 0 63 11 238 23
32 4 4 6 6 46 46
33 Daman & Diu 2 0 2 2 27 23
34 Delhi 267 1 341 68 2,260 317
Lakshadweep 0 0 12 9 20 9
36 Puducherry 7 0 20 0 206
TOTAL
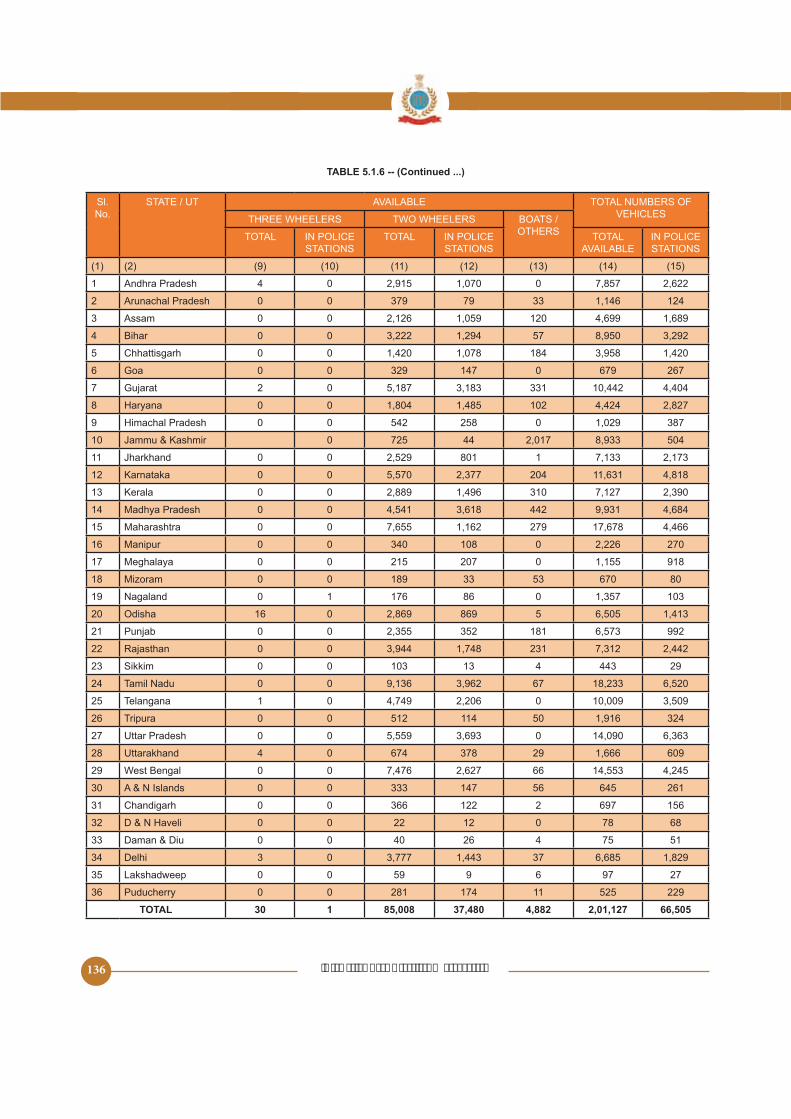
‘Promoting Good Practices & Standards’136
Sl. No.
STATE / UT AVAILABLE TOTAL NUMBERS OF
BOATS /
TOTAL IN POLICE STATIONS
TOTAL IN POLICE STATIONS
TOTAL AVAILABLE
IN POLICE STATIONS
1 Andhra Pradesh 4 0 1,070 0 2,622
2 Arunachal Pradesh 0 0 379 79 33 1,146 124
3 Assam 0 0 2,126 120 4,699 1,689
4 Bihar 0 0 3,222 1,294 3,292
Chhattisgarh 0 0 1,420 1,078 184 1,420
6 Goa 0 0 329 147 0 679 267
7 Gujarat 2 0 3,183 331 10,442 4,404
8 0 0 1,804 102 4,424 2,827
9 0 0 0 1,029 387
10 0 44 2,017 8,933
11 0 0 801 1 7,133 2,173
12 Karnataka 0 0 2,377 204 11,631 4,818
13 Kerala 0 0 2,889 1,496 310 7,127 2,390
14 Madhya Pradesh 0 0 3,618 442 9,931 4,684
Maharashtra 0 0 1,162 279 17,678 4,466
16 Manipur 0 0 340 108 0 2,226 270
17 Meghalaya 0 0 207 0 918
18 Mizoram 0 0 189 33 670 80
19 Nagaland 0 1 176 86 0 103
20 Odisha 16 0 2,869 869 1,413
21 Punjab 0 0 181 992
22 Rajasthan 0 0 3,944 1,748 231 7,312 2,442
23 Sikkim 0 0 103 13 4 443 29
24 Tamil Nadu 0 0 9,136 3,962 67 18,233
Telangana 1 0 4,749 2,206 0 10,009
26 Tripura 0 0 114 1,916 324
27 Uttar Pradesh 0 0 3,693 0 14,090 6,363
28 Uttarakhand 4 0 674 378 29 1,666 609
29 West Bengal 0 0 7,476 2,627 66
30 A & N Islands 0 0 333 147 261
31 Chandigarh 0 0 366 122 2 697
32 0 0 22 12 0 78 68
33 Daman & Diu 0 0 40 26 4
34 Delhi 3 0 3,777 1,443 37 1,829
Lakshadweep 0 0 9 6 97 27
36 Puducherry 0 0 281 174 11 229
TOTAL 1

‘Promoting Good Practices & Standards’ 137
Sl. No.
STATE / UT (CIVIL + DISTRICT ARMED
NUMBER OF TRANSPORT RESOURCES PER 100 POLICEMEN
S A S A
1 Andhra Pradesh 72,176 10.89 14.48
2 Arunachal Pradesh 13,137 1,146 8.72
3 Assam 4,699 7.12 8.62
4 Bihar 1,28,286 6.98 11.48
Chhattisgarh 71,606 6.63
6 Goa 8,312 6,941 679 8.17 9.78
7 Gujarat 1,09,337 88,267 10,442 11.83
8 61,346 4,424 7.21 9.94
9 18,472 1,029 6.22
10 87,882 77,838 8,933 10.16 11.48
11 61,019 7,133 8.92 11.69
12 Karnataka 1,00,243 78,300 11,631 11.60
13 Kerala 7,127 13.19
14 Madhya Pradesh 93,376 9,931 10.64
Maharashtra 2,40,224 2,14,029 17,678 7.36 8.26
16 Manipur 33,080 24,843 2,226 6.73 8.96
17 Meghalaya 16,367 12,691 7.06 9.10
18 Mizoram 9,792 7,062 670 6.84 9.49
19 Nagaland 21,292 22,233 6.37 6.10
20 Odisha 66,973 9.71 11.48
21 Punjab 88,742 7.41 7.98
22 Rajasthan 1,06,232 88,229 7,312 6.88 8.29
23 Sikkim 6,080 443 7.29 8.27
24 Tamil Nadu 1,24,130 1,01,710 18,233 14.69 17.93
Telangana 76,407 46,062 10,009 13.10 21.73
26 Tripura 27,378 1,916 7.00 8.18
27 Uttar Pradesh 4,14,492 14,090 3.40 4.93
28 Uttarakhand 21,124 1,666 7.89 8.10
29 West Bengal 1,40,904 91,923 10.33
30 A & N Islands 4,274 16.30
31 Chandigarh 8,700 7,748 697 8.01 9.00
32 333 78 22.03 23.42
33 Daman & Diu 372 20.16
34 Delhi 74,712 7.73
Lakshadweep 610 374 97
36 Puducherry 3,473 2,644 19.86
TOTAL
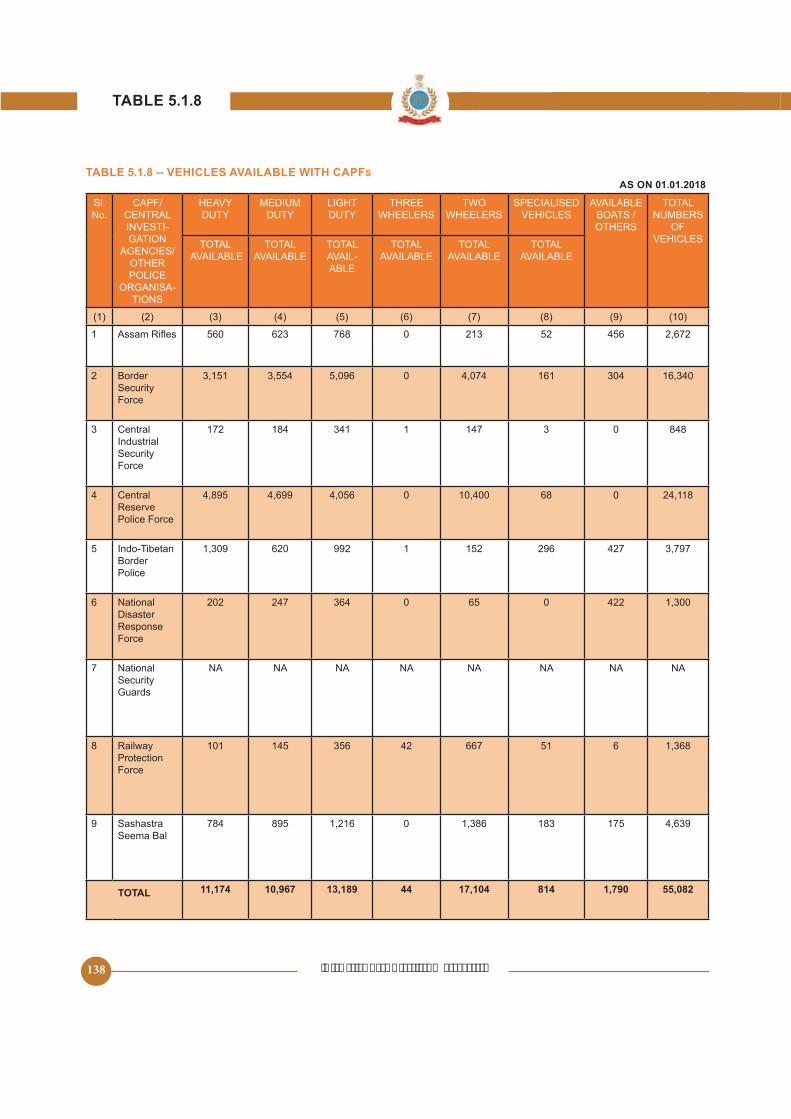
‘Promoting Good Practices & Standards’138
S
Sl. No.
CAPF/ CENTRAL INVESTI-GATION
AGENCIES/
POLICE ORGANISA-
TIONS
DUTYMEDIUM
DUTY DUTYTWO SPECIALISED AVAILABLE
BOATS / TOTAL
NUMBERS OF
TOTAL AVAILABLE
TOTAL AVAILABLE
TOTAL AVAIL-ABLE
TOTAL AVAILABLE
TOTAL AVAILABLE
TOTAL AVAILABLE
1 623 768 0 213 2,672
2 Border Security Force
0 4,074 161 304 16,340
3 Central Industrial Security Force
172 184 341 1 147 3 0 848
4 Central Reserve Police Force
4,699 0 10,400 68 0 24,118
Indo-Tibetan Border Police
1,309 620 992 1 296 427 3,797
6 National Disaster Response Force
202 247 364 0 0 422 1,300
7 National Security Guards
NA NA NA NA NA NA NA NA
8 Railway Protection Force
101 42 667 6 1,368
9 Sashastra Seema Bal
784 1,216 0 1,386 183 4,639
TOTAL 44 814

‘Promoting Good Practices & Standards’ 139
Sl. No.
STATE / UT TOTAL NUMBER
OF POLICE STATION
NOT NOT WIRELESS / MOBILES
NOT WIRE-LESS /
MOBILES
1 Andhra Pradesh 1,021 64 1021 0 1021 0
2 Arunachal Pradesh 104 104 0 104 0 104 0
3 Assam 343 343 0 227 116 293
4 Bihar 1,064 1,064 0 810 977 87
Chhattisgarh 322 131 412 41 0
6 Goa 43 43 0 43 0 43 0
7 Gujarat 710 710 0 710 0 710 0
8 368 368 0 368 0 368 0
9 129 129 0 127 2 120 9
10 222 222 0 222 0 222 0
11 27 309 218 0
12 Karnataka 1,048 1,048 0 1039 9 1048 0
13 Kerala 0 0 0
14 Madhya Pradesh 1,100 998 102 941 42
Maharashtra 1,162 1,162 0 1162 0 1162 0
16 Manipur 113 97 16 24 89 106 7
17 Meghalaya 62 62 0 62 0 62 0
18 Mizoram 38 38 0 38 0 38 0
19 Nagaland 81 81 0 81 0 78 3
20 Odisha 608 17 612 13 47
21 Punjab 401 401 0 331 70 386
22 Rajasthan 862 862 0 862 0 862 0
23 Sikkim 29 29 0 29 0 29 0
24 Tamil Nadu 1,962 1,962 0 1947 1962 0
Telangana 788 788 0 788 0 788 0
26 Tripura 81 81 0 73 8 76
27 Uttar Pradesh 0 0 0
28 Uttarakhand 0 0 0
29 West Bengal 0 0 0
30 A & N Islands 24 24 0 24 0 24 0
31 Chandigarh 17 12 17 0 17 0
32 2 2 0 2 0 2 0
33 Daman & Diu 0 0 0
34 Delhi 167 167 0 167 0 167 0
Lakshadweep 16 16 0 16 0 12 4
36 Puducherry 0 49 9
TOTAL 362 278

‘Promoting Good Practices & Standards’140
SL. NO.
STATE / UT YEAR OF INCORPORATION
FAMILY QUARTERES AS ON 31.12.2016
Dy. SP & ABOVE ASI TO INSPECTOR
CONSTABLES & TOTAL
1 Andhra Pradesh 1971 92 20,234 21,677
2 Arunachal Pradesh 88 262 3,120 3,470
3 Assam 1980 231 1,661 8,327 10,219
4 Bihar 1974 310 3,474 10,347 14,131
Chhattisgarh 2011 11 13,207
6 Goa NA 12 1,301 1,388
7 Gujarat 1988 196 2,319 43,628 46,143
8 1989 1,286 7,787 9,248
9 NA 81 407 3,033
10 1997 148 1,224
11 2002 1,706 6,366
12 Karnataka 3,349 42,969
13 Kerala 1999 61 6,949 7,860
14 Madhya Pradesh 1981 0 32,392 38,312
Maharashtra 1974 12,212 79,360 92,091
16 Manipur 1986 133 447 1,308 1,888
17 Meghalaya NA 44 2,379
18 Mizoram NA 92 279 2,021
19 Nagaland 1963 169 3,848 4,762
20 Odisha 1980 3,182 12,887
21 Punjab 1989 93 844
22 Rajasthan 2013 2,997 22,982 26,104
23 Sikkim NA 21 129 203
24 Tamil Nadu 1981 498 4,467
Telangana 2014 0 20,117
26 Tripura NA 98 770 1,810 2,678
27 Uttar Pradesh 1986 668 8,228 67,278
28 Uttarakhand NA 83 681
29 West Bengal 1992 7,912 20,301
30 A & N Islands NA 17 124 1,320 1,461
31 Chandigarh NA 11 344 1,879 2,234
32 NA 1 30 186 217
33 Daman & Diu NA 163 193
34 Delhi 2007 322 9,839
Lakshadweep NA 0 10 166
36 Puducherry NA 16 101 1,002
TOTAL 5628 77468
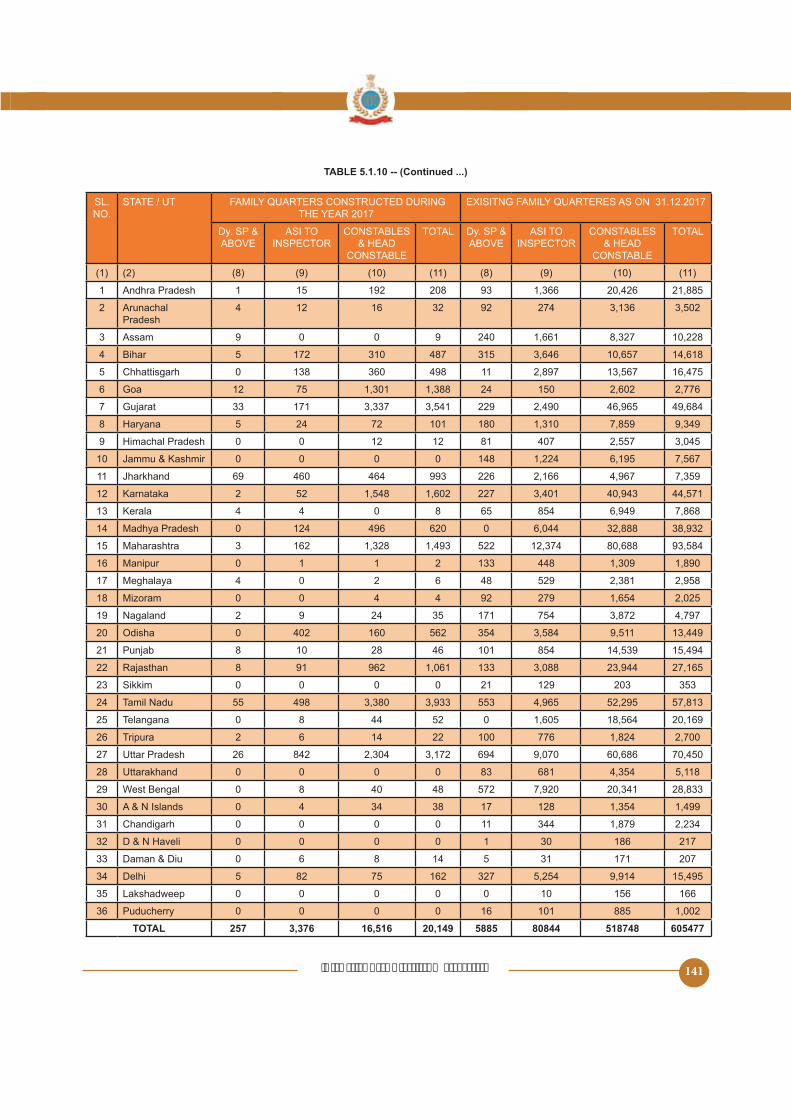
‘Promoting Good Practices & Standards’ 141
SL. NO.
STATE / UT FAMILY QUARTERS CONSTRUCTED DURING EXISITNG FAMILY QUARTERES AS ON 31.12.2017
Dy. SP & ABOVE
ASI TO INSPECTOR
CONSTABLES
CONSTABLE
TOTAL Dy. SP & ABOVE
ASI TO INSPECTOR
CONSTABLES
CONSTABLE
TOTAL
1 Andhra Pradesh 1 192 208 93 1,366 20,426
2 Arunachal Pradesh
4 12 16 32 92 274 3,136
3 Assam 9 0 0 9 240 1,661 8,327 10,228
4 Bihar 172 310 487 3,646 14,618
Chhattisgarh 0 138 360 498 11 2,897
6 Goa 12 1,301 1,388 24 2,602 2,776
7 Gujarat 33 171 3,337 229 2,490 49,684
8 24 72 101 180 1,310 9,349
9 0 0 12 12 81 407
10 0 0 0 0 148 1,224
11 69 460 464 993 226 2,166 4,967
12 Karnataka 2 1,602 227 3,401 40,943
13 Kerala 4 4 0 8 6,949 7,868
14 Madhya Pradesh 0 124 496 620 0 6,044 32,888 38,932
Maharashtra 3 162 1,328 1,493 12,374 80,688
16 Manipur 0 1 1 2 133 448 1,309 1,890
17 Meghalaya 4 0 2 6 48 2,381
18 Mizoram 0 0 4 4 92 279
19 Nagaland 2 9 24 171 3,872 4,797
20 Odisha 0 402 160 13,449
21 Punjab 8 10 28 46 101
22 Rajasthan 8 91 962 1,061 133 3,088 23,944
23 Sikkim 0 0 0 0 21 129 203
24 Tamil Nadu 498 3,380 3,933
Telangana 0 8 44 0 20,169
26 Tripura 2 6 14 22 100 776 1,824 2,700
27 Uttar Pradesh 26 842 2,304 3,172 694 9,070 60,686
28 Uttarakhand 0 0 0 0 83 681
29 West Bengal 0 8 40 48 7,920 20,341 28,833
30 A & N Islands 0 4 34 38 17 128 1,499
31 Chandigarh 0 0 0 0 11 344 1,879 2,234
32 0 0 0 0 1 30 186 217
33 Daman & Diu 0 6 8 14 31 171 207
34 Delhi 82 162 327 9,914
Lakshadweep 0 0 0 0 0 10 166
36 Puducherry 0 0 0 0 16 101 1,002
TOTAL 257 5885 518748

‘Promoting Good Practices & Standards’142
D s
SL. NO.
CAPF/ CENTRAL
INVESTIGATION AGENCIES /
ORGANISTIONS
EXISITNG FAMILY QUARTERES AS ON 31.12.2016
ASST. COMMADT. /
DySP & ABOVE
ASI TO INSP.
CONST.
CONST.
TOTAL ASST. COMADT. /
DySP & ABOVE
ASI TO INSP.
CONST.
CONST.
TOTAL
1 449 1,249 7,637 0 34 90 0 1,482
2 Border Security Force
1,324 3,173 0 30,446 13 188 0
3 Central Industrial Security Force
123 2,290 62 4,003 0 128 0
4 Central Reserve Police Force
1,392 1,979 34,633 0 38,004 0 0 0 0 0
Indo-Tibetan Border Police
7,183 0 8,473 43 148 0 643
6 National Disaster Response Force
40 212 0 1,447 16 42 240 0 298
7 National SecurityGuards
231 499 1,302 0 2,032 61 423 0 639
8 Railway Protection Force
327 3393 13024 18,342 174 242 324 898
9 Sashastra Seema Bal
NA NA NA NA NA NA NA NA NA NA
TOTAL 4411 341 861 158 4867

‘Promoting Good Practices & Standards’ 143
SL. NO. STATE / UT OFFICERS
UPPER SUBORDINATES LOWER SUBORDINATES
1 Andhra Pradesh 19.21 34.16 44.29
2 Arunachal Pradesh 82.88 48.41 32.26
3 Assam 17.38
4 Bihar 36.46 17.90
Chhattisgarh 2.13 100.00
6 Goa 41.32
7 Gujarat 63.38
8 20.83
9 33.61
10 8.81
11 67.46 62.62 9.67
12 Karnataka 33.48
13 Kerala 13.98 38.09 17.11
14 Madhya Pradesh 0.00 82.00 42.66
Maharashtra 80.14 44.66
16 Manipur 24.33 6.03
17 Meghalaya 34.29
18 Mizoram 33.86
19 Nagaland 60.42 19.39
20 Odisha 72.10 100.00 33.84
21 Punjab 14.13 21.47 20.04
22 Rajasthan 78.34 30.06
23 Sikkim 47.96 4.38
24 Tamil Nadu
Telangana 0.00 47.48
26 Tripura 43.48 62.78 8.46
27 Uttar Pradesh 49.64 33.94
28 Uttarakhand 38.72 23.36
29 West Bengal
30 A & N Islands
31 Chandigarh 33.33 92.72
32 100.00
33 Daman & Diu 83.33 100.00
34 Delhi 92.11 80.92 16.48
Lakshadweep 0.00 100.00
36 Puducherry 72.73 37.37
TOTAL

‘Promoting Good Practices & Standards’144
Sl. No.
STATE / UT POLICE STATION* POLICE POSTS* DIG/IG RANGE
GOVT. GOVT. GOVT.
1 Andhra Pradesh 746 20 0
2 Arunachal Pradesh 0 19 0 3 0
3 Assam 328 34 2
4 Bihar 668 277 160 3 1
Chhattisgarh 404 34 67 38 4 1
6 Goa 42 1 38 4 1 0
7 Gujarat 626 82 1198 9 0
8 294 23 71 0
9 4 103 39 2 1
10 188 34 168 120 6 1
11 467 36 94 24 8 0
12 Karnataka 931 117 249 8 6 1
13 Kerala 437 84 27 11 2 0
14 Madhya Pradesh 1088 19 12 26 0
Maharashtra 142 1074 806 38 1
16 Manipur 77 2 42 9 3 0
17 Meghalaya 16 24 2 0
18 Mizoram 38 0 12 1 6 0
19 Nagaland 72 18 7 2 1
20 Odisha 613 40 421 7 1
21 Punjab 372 244 2
22 Rajasthan 807 1079 110 9 0
23 Sikkim 27 0 42 1 0
24 Tamil Nadu 400 23 4 14 1
Telangana 649 131 28 31 4 0
26 Tripura 81 0 36 0 2 0
27 Uttar Pradesh 1431 101 291 171 16
28 Uttarakhand 132 24 127 108 2 0
29 West Bengal 471 124 287 8 4
30 A & N Islands 24 0 22 0 1 0
31 Chandigarh 17 0 12 0 1 0
32 2 0 6 0 1 0
33 Daman & Diu 0 10 0 0 0
34 Delhi 178 16 0 6 0
Lakshadweep 13 1 3 0 0 0
36 Puducherry 49 6 2 1 0
TOTAL 14156 2277 214 22

‘Promoting Good Practices & Standards’ 145
Sl. No.
STATE / UT DISTRICT SP SDPO/DySP DISTRICT POLICE LINES
DISTRICT ARMED POLICE LINES
GOVT. GOVT. GOVT. GOVT.
1 Andhra Pradesh 18 0 78 18 18 0 8 0
2 Arunachal Pradesh 21 0 9 0 21 0 7 0
3 Assam 30 3 11 12 33 0 33 0
4 Bihar 39 1 131 8 39 1 19 0
Chhattisgarh 16 11 44 40 27 0 17 2
6 Goa 2 0 7 1 0 0 3 0
7 Gujarat 1 98 0 197 0 40 0
8 24 0 0 9 24 0 9 0
9 13 0 24 6 13 0 1 0
10 24 1 27 20 0 29 2
11 32 1 80 18 30 2 11 0
12 Karnataka 30 2 129 2 33 0 49 7
13 Kerala 16 4 66 2 409 4 0
14 Madhya Pradesh 0 408 4 0 13 0
Maharashtra 11 220 41 2121 0
16 Manipur 1 26 0 1 0 0
17 Meghalaya 8 3 3 1 7 4 6 0
18 Mizoram 8 0 17 0 0 0 0 0
19 Nagaland 11 0 2 11 0 0
20 Odisha 36 0 108 6 34 2 22 0
21 Punjab 22 1 104 7 20 4 19 1
22 Rajasthan 38 0 188 26 38 0 17 0
23 Sikkim 4 0 11 0 1 0 0 0
24 Tamil Nadu 29 2 278 7661 3406 0
Telangana 3 74 42 18 0 19 0
26 Tripura 8 0 27 0 0 1 0
27 Uttar Pradesh 68 14 68 7 31 2
28 Uttarakhand 11 2 36 2 13 0 13 0
29 West Bengal 19 9 89 30 30 11
30 A & N Islands 3 0 7 0 2 0 1 0
31 Chandigarh 1 0 3 0 1 0 0 0
32 1 0 1 0 1 0 0 0
33 Daman & Diu 2 0 3 0 0 0 0 0
34 Delhi 14 0 62 0 14 0 8 0
Lakshadweep 1 0 2 0 0 0 0 0
36 Puducherry 2 1 0 0 0 0 0 0
TOTAL 71 878 15111 125 25

‘Promoting Good Practices & Standards’146
Sl. No. STATE / UT MAIN LABORATORY/IES REGIONAL LABORATORIES MOBILE LABORATORIES
AS ON 31.12.2016
ADDED
YEAR2017
AS ON 31.12.2016
ADDED
YEAR2017
AS ON 31.12.2016
ADDED DURING
2017
1 Andhra Pradesh 0 0 0 18 0
2 Arunachal Pradesh 1 0 0 0 8 0
3 Assam 1 0 1 0 0 0
4 Bihar 1 0 2 0 4 0
Chhattisgarh 1 0 3 0 2 0
6 Goa 1 0 0 0 2 0
7 Gujarat 1 0 6 0 62 1
8 1 0 4 0 22 0
9 1 0 2 0 0 1
10 2 0 0 0 13 0
11 1 0 0 0 18 0
12 Karnataka 0 0 0 0 23 0
13 Kerala 19 0 3 0 19 0
14 Madhya Pradesh 10 0 11 3 98 2
Maharashtra 1 0 6 0 29 0
16 Manipur 1 0 0 0 0 0
17 Meghalaya 7 0 0 0 7 0
18 Mizoram 1 0 0 0 1 0
19 Nagaland 1 0 0 0 10 0
20 Odisha 1 0 3 0 36 0
21 Punjab 1 0 3 0 21 0
22 Rajasthan 1 0 6 0 34 0
23 Sikkim 0 1 1 0 0
24 Tamil Nadu 4 4 6 3 34
Telangana 1 0 8 0 0 0
26 Tripura 1 0 0 0 2 0
27 Uttar Pradesh 1 0 4 0 0
28 Uttarakhand 3 0 2 1 2 0
29 West Bengal 1 NA 1 0 0 4
30 A & N Islands 1 0 0 0 1 0
31 Chandigarh 0 0 0 0 0 0
32 0 0 0 0 1 0
33 Daman & Diu 0 0 0 0 2 0
34 Delhi 1 0 1 0 2 0
Lakshadweep 0 0 0 0 0 0
36 Puducherry 0 0 1 0 1 0
TOTAL 67 4 8 547 13

‘Promoting Good Practices & Standards’ 147
s POLICE
Sl. No.
STATE / UT SERVERS PERSONAL COMPUTERS LAPTOPS
AS ON 31.12.2016
ADDED
YEAR 2017
AS ON 31.12.2016
ADDED
YEAR 2017
AS ON 31.12.2016
ADDED
YEAR 2017
1 Andhra Pradesh 2 1 0 17 6
2 Arunachal Pradesh 1 0 474 20 10 2
3 Assam 8 0 281 6 3
4 Bihar 0 0 1638 1174 0
Chhattisgarh 40 0 11
6 Goa 23 2 420 0 0 1
7 Gujarat 27 0 3376 1192 97
8 138 0 193 8
9 92 10 219 21
10 7 1 3334 10 30 12
11 20 4 112 396 31
12 Karnataka 194 2 10201 1804 906 1042
13 Kerala 12 4 6198 722 163
14 Madhya Pradesh 123 0 10634 228 1667 0
Maharashtra 11 9644 1431 243
16 Manipur 31 0 0 20 0
17 Meghalaya 3 1 346 11 6 2
18 Mizoram 1 0 347 37 0 0
19 Nagaland 1 0 266 0 1 0
20 Odisha 121 0 4484 63 0
21 Punjab 33 1 1324 303 111
22 Rajasthan 22 2 34 109
23 Sikkim 2 0 171 9 3 1
24 Tamil Nadu 296 304 2
Telangana 27 0 3632 274 129 88
26 Tripura 3 1 17 2
27 Uttar Pradesh 10 0 9637 73 407
28 Uttarakhand 186 2 1114 133
29 West Bengal 113 33 4886 768 262
30 A & N Islands 0 0 316 22 7 0
31 Chandigarh 9 6 31 48 12
32 49 0 23 0 10 0
33 Daman & Diu 2 1 3690 21 14 4
34 Delhi 1 403 7 0
Lakshadweep 0 0 80 30 1 0
36 Puducherry 1 0 643 0 6 1
TOTAL 1486 6544 2143

‘Promoting Good Practices & Standards’148
Sl. No. STATE / UT CCTV CAMERAS SPEEDOMETERS
1 Andhra Pradesh 1102 27
2 Arunachal Pradesh 71 9 69
3 Assam 673 17 74
4 Bihar 10
Chhattisgarh 16 418
6 Goa 2 29
7 Gujarat 7361 46 643
8 42 278
9 338
10 180 12 116
11 1 100
12 Karnataka 2773 90 1161
13 Kerala 103 1729
14 Madhya Pradesh 8263 30
Maharashtra 11777 164 1466
16 Manipur 0 10
17 Meghalaya 129 12 67
18 Mizoram 186 1
19 Nagaland 32 0 19
20 Odisha 790 39 88
21 Punjab
22 Rajasthan 2287 64 2693
23 Sikkim 7 3 9
24 Tamil Nadu 4924 960
Telangana 24 419
26 Tripura 72 1 7
27 Uttar Pradesh 2134 140
28 Uttarakhand 33 248
29 West Bengal 4109 273
30 A & N Islands 36 0 11
31 Chandigarh 326 9 118
32 2 14
33 Daman & Diu 1
34 Delhi 4390 699
Lakshadweep 0
36 Puducherry 103 4 27
TOTAL 275468 1352

‘Promoting Good Practices & Standards’ 149
s POLICE
Sl.No. STATE / UT TRACKER DOGS SNIFFER DOGS
1 Andhra Pradesh 38 106
2 Arunachal Pradesh 2 7
3 Assam 6 10
4 Bihar 20 29
Chhattisgarh 19 36
6 Goa 2
7 Gujarat 46 77
8 11 22
9
10 6
11 10 8
12 Karnataka 102
13 Kerala 40
14 Madhya Pradesh 60 82
Maharashtra 102 178
16 Manipur 0 2
17 Meghalaya 2 9
18 Mizoram 0 0
19 Nagaland 0 0
20 Odisha 21 19
21 Punjab 8
22 Rajasthan 16 31
23 Sikkim 1 4
24 Tamil Nadu 77 104
Telangana 37 131
26 Tripura 6 9
27 Uttar Pradesh 60 84
28 Uttarakhand 8
29 West Bengal 18 36
30 A & N Islands 2 7
31 Chandigarh 2 7
32 3 0
33 Daman & Diu 0 0
34 Delhi 16 49
Lakshadweep 0 0
36 Puducherry 1
TOTAL 727 1361

‘Promoting Good Practices & Standards’150
s
Sl.No. CAPF/ CENTRAL INVESTIGATION AGEN- TRACKER DOGS SNIFFER DOGS
1 48 100
2 Border Security Force
3 Central Industrial Security Force 422
4 Central Reserve Police Force 78
Indo-Tibetan Border Police 11 106
6 National Disaster Response Force 0 166*
7 National Security Guards NA NA
8 Railway Protection Force 77 279
9 Sashastra Seema Bal 41 178
TOTAL 622 1574

‘Promoting Good Practices & Standards’ 151
Sl. No. STATE / UTBureaucrats, etc
Total No. of Police Personnel Sanctioned for giving protection
Total No. of Police Personnel deployed for giving protection
2016 2017 2016 2017 2016 2017
1 Andhra Pradesh 432 476 601 1,461 1,973 1,461
2 Arunachal Pradesh 106 NA 737 NA
3 Assam 1,170 1,323 1,401
4 Bihar 3,200 6,248 6,248 6,368 6,127
Chhattisgarh 309 307 1,886 1,886 2,717 2,740
6 Goa 32 291 291 209 284
7 Gujarat 673 379 743 408 844 830
8 1,233 1,347 3,203 3,203
9 110 100 170 204 198 204
10 NA 4,499 NA
11 1,361 - 346
12 Karnataka 239 260 678 1,446
13 Kerala 79 226 226 214 226
14 Madhya Pradesh 402 404 860 906
Maharashtra 74 3,946 961 2,418
16 Manipur - 1,793 2,088
17 Meghalaya 177 178 140 377
18 Mizoram 91 88 210 239 221 243
19 Nagaland 161 NA 613 613 613 NA
20 Odisha 46 NA 79 79 NA
21 Punjab 2,344 7,324
22 Rajasthan 471 481
23 Sikkim NA 140 NA
24 Tamil Nadu 109 NA 161 161 228 NA
Telangana 444 494 399 94 831
26 Tripura 226 319 478 1,000 704 1,000
27 Uttar Pradesh 1,901 110 4,681 1,803
28 Uttarakhand 231 221 201 323 498
29 West Bengal 2,207 2,698 4,233
30 A&N Islands 8 8 219 438 78 77
31 Chandigarh 172 176 711 718 814
32 4 4 4 4 4
33 Daman & Diu 1 1 1 1 1 1
34 Delhi 489 7,293 7,293 7,420 7,293
Lakshadweep - - - - - -
36 Puducherry 23 23 81 81 198

‘Promoting Good Practices & Standards’152
Sl. No. STATES / UT Number of Companies
1 Andhra Pradesh 20
2 Arunachal Pradesh 26
3 Assam 124
4 Bihar
Chhatisgarh 262
6 Goa 0
7 Gujarat 0
8 4
9 0
10 713
11 166
12 Karnataka 0
13 Kerala 0
14 Madhya Pradesh 0
Maharashtra 0
16 Manipur
17 Meghalaya 2
18 Mizoram 12
19 Nagaland 0
20 Odisha 119
21 Punjab 6
22 Rajasthan 0
23 Sikkim 0
24 Tamil Nadu
Telangana
26 Tripura 102
27 Uttar Pradesh 26
28 Uttarakhand 6
29 West Bengal 40
30 A&N Islands 0
31 Chandigarh 13
32 0
33 Daman & Diu 0
34 Delhi 0
Lakshadweep 1
36 Puducherry 0

‘Promoting Good Practices & Standards’ 153
s
Sl. No.
STATE / UT CONSTABLES SUB-INSPECTORS
CIVIL POLICE
DISTRICT ARMED
RESERVE
ARMED POLICE
TOTAL CIVIL POLICE
DISTRICT ARMED
RESERVE
ARMED POLICE
TOTAL
1 Andhra Pradesh 1140 0 349 108 662
2 Arunachal Pradesh 300 0 27 327 0 0 0 0
3 Assam 11 343 0 0 343
4 Bihar 0 0 1330 1330 0 0
Chhattisgarh 723 0 2976 3699 0 0 0 0
6 Goa 0 0 3 3 0 0 0 0
7 Gujarat 3780 1700 16980 220 124 0 344
8 0 0 0 0 2 2
9 0 0 1448 1448 18 0 0 18
10 0 0 0 0 0 0
11 0 4267 0 0 0 0
12 Karnataka 3992 2912 8424 477 119 761
13 Kerala 0 0 0 0 0 0 0 0
14 Madhya Pradesh 10194 0 3832 14026 486 0 116 602
Maharashtra 0 683 6392 0 0 0 0
16 Manipur 2 0 0 2 0 0 0 0
17 Meghalaya 0 0 0 0 0 0 0 0
18 Mizoram 0 0 0 0 0 0 0 0
19 Nagaland 402 0 333 0 0 0 0
20 Odisha 12 0 0 0 0 0
21 Punjab 0 0 0 0 0 0 0 0
22 Rajasthan 812 0 109 921 17 0 6 23
23 Sikkim 0 0 0 0 0 0 0 0
24 Tamil Nadu 0 0 0 0 1018 0 1 1019
Telangana 2102 3346 208 74 207 489
26 Tripura 0 0 0 0 0 0 0 0
27 Uttar Pradesh 28997 0 33347 32 0 0 32
28 Uttarakhand 34 0 9 43 0 0 0 0
29 West Bengal 6164 0 0 6164 0 0 0 0
30 A & N Islands 0 0 0 0 0 0 0 0
31 Chandigarh 19 0 0 19 0 0 0 0
32 0 0 0 0 0 0 0 0
33 Daman & Diu 0 0 0 0 0 0 0 0
34 Delhi 294 0 0 294 0 0 0 0
Lakshadweep 0 0 0 0 0 0 0 0
36 Puducherry 164 0 0 164 0 0 0 0
TOTAL 75388 3425 425 4552

‘Promoting Good Practices & Standards’154
Sl. No. STATE / UT DySP/ASST COMMANDANT IPS OFFICERS
CIVIL POLICE DISTRICT ARMED
RESERVE
ARMED POLICE TOTAL
1 Andhra Pradesh 0 0 0 0
2 Arunachal Pradesh 0 0 0 0 NA
3 Assam 0 0 0 0 3
4 Bihar 0 0 0 0 4
Chhattisgarh 16 0 0 16 NA
6 Goa 0 0 0 0 NA
7 Gujarat 21 0 0 21
8 0 0 3 3 NA
9 0 0 0 0 NA
10 16 0 0 16 NA
11 0 0 0 0 NA
12 Karnataka 0 0 0 0 NA
13 Kerala 0 0 0 0 3
14 Madhya Pradesh 0 0 0 0 NA
Maharashtra 27 0 0 27 7
16 Manipur 0 16 0 16 NA
17 Meghalaya 0 0 0 0 NA
18 Mizoram 0 0 0 0 NA
19 Nagaland 0 0 0 0 NA
20 Odisha 17 0 0 17 3
21 Punjab 0 0 10 10 4
22 Rajasthan 47 0 0 47 NA
23 Sikkim 0 0 0 0 NA
24 Tamil Nadu 0 0 0 0 NA
Telangana 2 0 0 2
26 Tripura 0 0 0 0 NA
27 Uttar Pradesh 0 0 0 0 NA
28 Uttarakhand 19 0 0 19 4
29 West Bengal 6 0 0 6 16
30 A & N Islands 0 0 0 0 NA
31 Chandigarh 0 0 0 0 NA
32 0 0 0 0 NA
33 Daman & Diu 0 0 0 0 NA
34 Delhi 0 0 0 0 NA
Lakshadweep 0 0 0 0 NA
36 Puducherry 0 0 0 0 NA
TOTAL 16 13
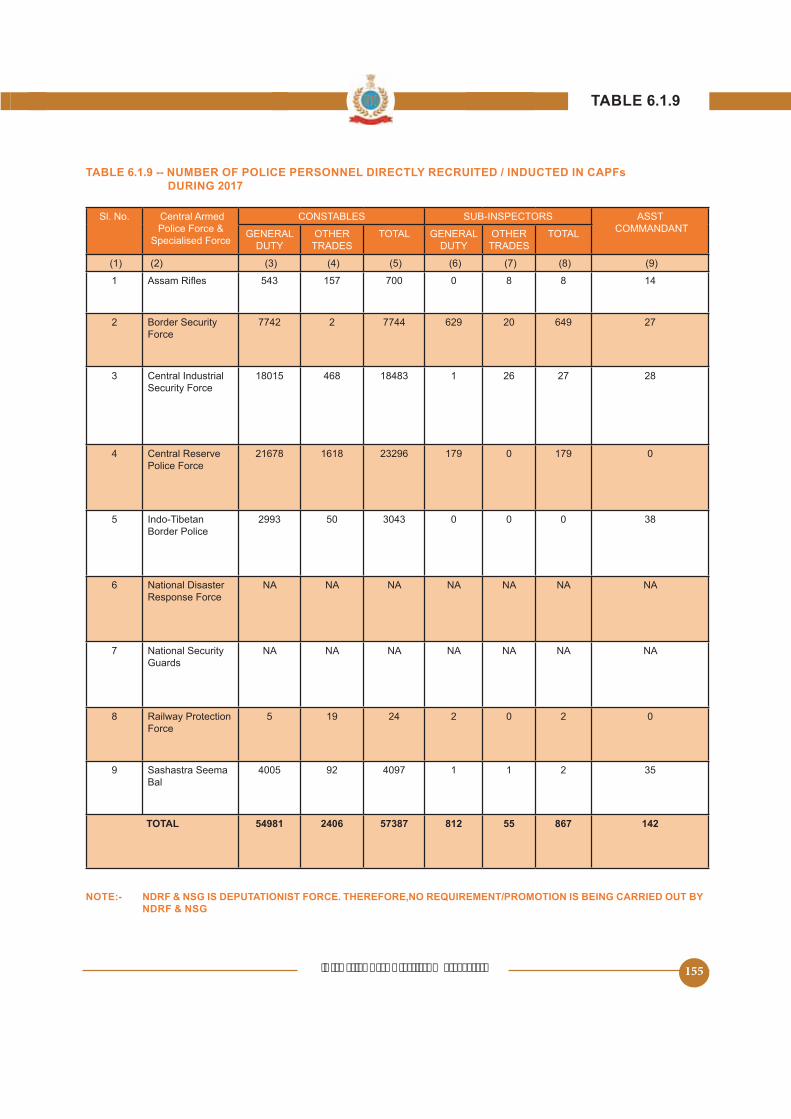
‘Promoting Good Practices & Standards’ 155
s
Sl. No. Central Armed Police Force &
Specialised Force
CONSTABLES SUB-INSPECTORS ASST COMMANDANTGENERAL
DUTY TRADESTOTAL GENERAL
DUTY TRADES TOTAL
1 700 0 8 8 14
2 Border Security Force
7742 2 7744 629 20 649 27
3 Central Industrial Security Force
468 18483 1 26 27 28
4 Central Reserve Police Force
21678 1618 23296 179 0 179 0
Indo-Tibetan Border Police
2993 3043 0 0 0 38
6 National Disaster Response Force
NA NA NA NA NA NA NA
7 National Security Guards
NA NA NA NA NA NA NA
8 Railway Protection Force
19 24 2 0 2 0
9 Sashastra Seema Bal
92 4097 1 1 2
TOTAL 57387 812 55 867 142

‘Promoting Good Practices & Standards’156
Sl. No.
STATE / UT CONSTABLES SUB-INSPECTOR
CIVIL DISTRICT ARMED
RESERVE
ARMED TOTAL CIVIL DISTRICT ARMED
RESERVE
ARMED TOTAL
1 Andhra Pradesh 1140 0 349 108 662
2 Arunachal Pradesh 0 11 16 0 0 0 0
3 Assam 0 22 27 0 0 0 0
4 Bihar 0 3010 2232 0 0 0 0
Chhattisgarh 0 1719 2318 12 0 0 12
6 Goa 0 121 286 322 28 700
7 Gujarat 1049 220 0 270
8 1392 0 760 0 0 2 2
9 0 0 1448 1448 18 0 0 18
10 1063 0 3178 0 0 0 0
11 0 400 2 0 0 2
12 Karnataka 1874 0 6219 48 168 0 216
13 Kerala 0 2220 2278 0 7
14 Madhya Pradesh 693 0 0 693 633 0 0 633
Maharashtra 0 0 0 0 0 0
16 Manipur 40 0 10 4 0 6 10
17 Meghalaya 0 0 0 0 0 0 0 0
18 Mizoram 0 0 0 0 0 0 0 0
19 Nagaland 402 0 333 0 0 0 0
20 Odisha 0 206 1401 1607 1241 123 34 1398
21 Punjab 0 1843 7702 646 0 0 646
22 Rajasthan 0 0 16 0 4 20
23 Sikkim 16 0 0 16 0 0 0 0
24 Tamil Nadu 0 8220 0 0 0 0
Telangana 1909 9029 201 0 0 201
26 Tripura 1 0 0 1 0 0 0 0
27 Uttar Pradesh 29000 0 0 29000 0 0 0 0
28 Uttarakhand 939 0 0 939 74 0 0 74
29 West Bengal 0 0 4788 4788 0 0 0 0
30 A & N Islands 109 0 0 109 0 0 0 0
31 Chandigarh 61 0 0 61 0 0 0 0
32 67 0 0 67 8 0 0 8
33 Daman & Diu 41 0 0 41 14 0 0 14
34 Delhi 0 0 0 0 0 0 0 0
Lakshadweep 0 0 0 0 0 0 0 0
36 Puducherry 164 0 0 164 0 0 0 0
TOTAL 22755 27757 477 5143

‘Promoting Good Practices & Standards’ 157
Sl. No. STATE / UT Dy.SP
CIVIL DISTRICT ARMED RESERVE
ARMED TOTAL
1 Andhra Pradesh 0 0 0 0
2 Arunachal Pradesh 0 0 0 0
3 Assam 41 0 0 41
4 Bihar 0 0 0 0
Chhattisgarh 21 0 0 21
6 Goa 0 0 0 0
7 Gujarat 21 0 0 21
8 2 0 0 2
9 0 0
10 0 0 0 0
11 0 0
12 Karnataka 36 0 0 36
13 Kerala 0 0 0 0
14 Madhya Pradesh 0 0 0 0
Maharashtra 0 0
16 Manipur 0 0 0 0
17 Meghalaya 0 0 0 0
18 Mizoram 2 0 0 2
19 Nagaland 0 0 0 0
20 Odisha 44 0 0 44
21 Punjab 0 0 18 18
22 Rajasthan 41 0 0 41
23 Sikkim 0 0 0 0
24 Tamil Nadu 0 0 0 0
Telangana 1 0 0 1
26 Tripura 0 0 0 0
27 Uttar Pradesh 0 0 0 0
28 Uttarakhand 0 0 0 0
29 West Bengal 0 0
30 A & N Islands 0 0 0 0
31 Chandigarh 0 0 0 0
32 0 0 0 0
33 Daman & Diu 0 0 0 0
34 Delhi 0 0 0 0
Lakshadweep 0 0 0 0
36 Puducherry 0 0 0 0
TOTAL 18 357

‘Promoting Good Practices & Standards’158
Sl. No. Central Armed Police Force & Spe
cialised Force
CONSTABLES SUB-INSPECTORS
GENERAL DUTY TRADES
TOTAL GENERAL DUTY TRADES
TOTAL OFFICERS TRAINED
1 709 0 4 4 14
2 Border Security Force
810 119 929 0 0
3 Central Industrial Security Force
17722 18937 1167 1221 60
4 Central Reserve Police Force
3764 1187 46
Indo-Tibetan Border Police
1992 202 9 221
6 National Disaster Response Force
NA NA NA NA NA NA NA
7 National Security Guards
NA NA NA NA NA NA NA
8 Railway Protection Force
276 628 0 29
9 Sashastra Seema Bal
1832 121 7 32 19
TOTAL 26654 2178 2267 273

‘Promoting Good Practices & Standards’ 159
Sl. No.
STATE / UT SANC-TIONED
ACTUAL WOMEN DEPU-TATION
RESERVE FOR
CENTRAL GOVT.
DEPU-TATION
TO CEN-TRAL GOVT
DEPU-TATION
TO STATE GOVT
OFFICERS DEPUTED TO LONG
TERM TRAIN-ING (MORE
OFFICERS DEPUTED ON LONG TERM
TRAINING(MORE
ABROAD
1 Andhra Pradesh 112 111 10 31 7 12 0 0
2 Arunachal Pradesh NA NA NA NA NA NA NA NA
3 Assam 134 113 8 29 12 14 0 0
4 Bihar 242 188 16 0 34 0 0 0
Chhattisgarh 142 91 4 31 11 7 0 0
6 Goa 8 9 3 0 0 0 0 0
7 Gujarat 208 167 14 16 0 0 0
8 137 104 14 30 8 18 0 0
9 94 14 20 21 3 0 0
10 80 82 4 32 26 20 0 0
11 149 113 11 32 13 0 0 0
12 Karnataka 139 22 46 10 2 3 0
13 Kerala 172 120 10 37 22 3 0 0
14 Madhya Pradesh 21 66 29 0 0
Maharashtra 240 19 13 12 22 2 0
16 Manipur 91 64 8 40 11 1 NA NA
17 Meghalaya 38 2 12 0 6 0 0
18 Mizoram 19 0 0 0 1 0 0
19 Nagaland 8 16 9 0 0 0
20 Odisha 188 114 18 41 22 0 0
21 Punjab 172 139 16 37 11 9 0 0
22 Rajasthan 188 22 46 18 7 0 0
23 Sikkim 32 29 3 0 8 2 0 0
24 Tamil Nadu 266 227 39 26 12 0 0
Telangana 139 101 18 30 10 1 0 0
26 Tripura 69 49 3 14 14 0 0 0
27 Uttar Pradesh 437 42 112 62 92 0 0
28 Uttarakhand 73 62 11 16 3 0 0 0
29 West Bengal 347 284 26 14 12 0 0
30 A & N Islands 10 13 4 0 0 0 0 0
31 Chandigarh 7 7 1 0 0 0 0 0
32 1 1 0 0 0 0 0 0
33 Daman & Diu 3 4 1 0 0 0 0 0
34 Delhi 102 119 13 0 0 0 0 0
Lakshadweep 1 2 0 0 0 0 0 0
36 Puducherry 2 0 0 0 0 0
TOTAL 432 5

‘Promoting Good Practices & Standards’160
s
Sl. No.
STATE / UT’ Pending as on 01.01.2017
Initiated In 2017 Total Pending in 2017 In 2017 (Both
Pending as on 01.01.2018
1 Andhra Pradesh 1741 1117 409 2449
2 Arunachal Pradesh 342 166 44 464
3 Assam 470 392 862 98 764
4 Bihar 2883 8144 1482 6662
Chhattisgarh 302 219 166
6 Goa 104 42 146 3 143
7 Gujarat 1296 730 1721
8 962 944
9 64 81 23 122
10 10131 1131 11262 1062 10200
11 1310 3196
12 Karnataka 293 833 34 799
13 Kerala 33 828 6 822
14 Madhya Pradesh 1920 1262 3182 361 2821
Maharashtra 1163 837 2000 441
16 Manipur 142 183 129 196
17 Meghalaya 48 101 36
18 Mizoram 67 2 69 1 68
19 Nagaland 8 13 21 13 8
20 Odisha 1613 1234 2847 721 2126
21 Punjab 0 1 4
22 Rajasthan 1464 341 130
23 Sikkim 9 2 11 4 7
24 Tamil Nadu 2232 1268 2971
Telangana 1209 6 2 1213
26 Tripura 68 119 30 89
27 Uttar Pradesh 14 607 621 686
28 Uttarakhand 169 296 204 261
29 West Bengal 968 818 1786 220
30 A & N Islands 19 14 33 9 24
31 Chandigarh 46 199 42
32 2 1 3 1 2
33 Daman & Diu 9 2 11 0 11
34 Delhi 1033 699 1732
Lakshadweep 7 7 14 0 14
36 Puducherry 40 40 80 10 70
TOTAL 35815 18868 54683
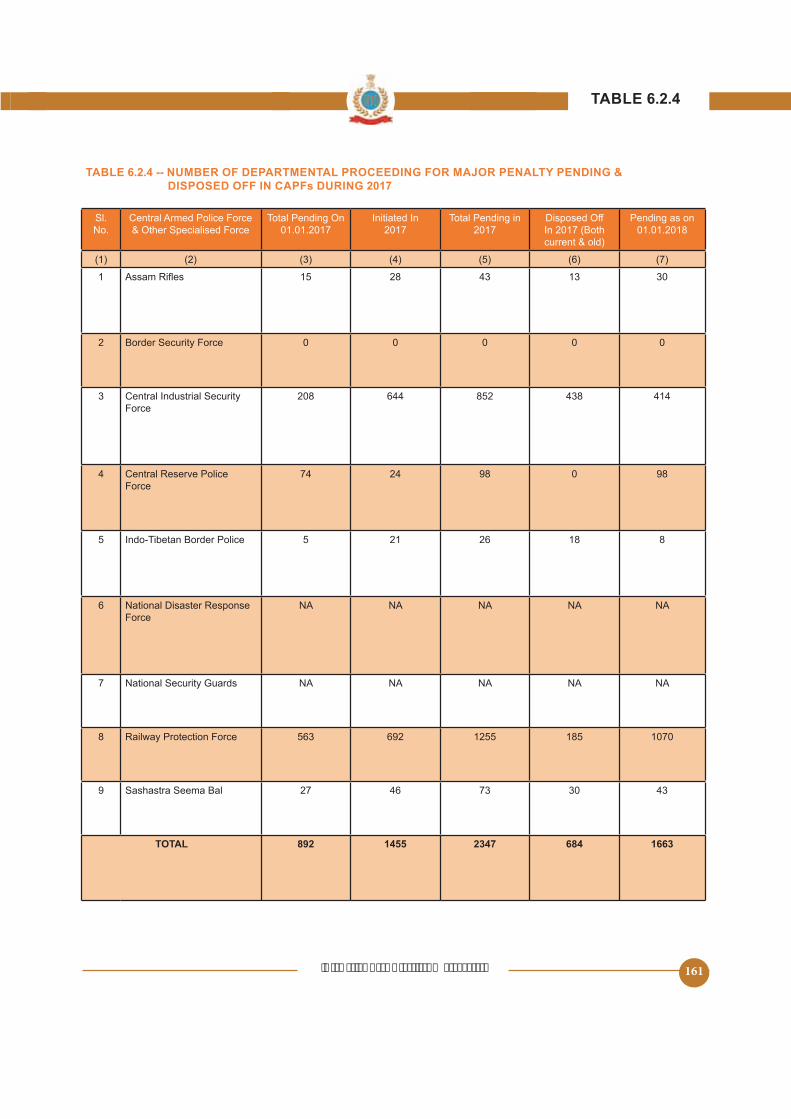
‘Promoting Good Practices & Standards’ 161
s
Sl. No.
Central Armed Police Force & Other Specialised Force
Total Pending On01.01.2017
Initiated In2017
Total Pending in 2017 In 2017 (Both
Pending as on 01.01.2018
1 28 43 13 30
2 Border Security Force 0 0 0 0 0
3 Central Industrial Security Force
208 644 438 414
4 Central Reserve Police Force
74 24 98 0 98
Indo-Tibetan Border Police 21 26 18 8
6 National Disaster Response Force
NA NA NA NA NA
7 National Security Guards NA NA NA NA NA
8 Railway Protection Force 692 1070
9 Sashastra Seema Bal 27 46 73 30 43
TOTAL 1455 2347 684 1663

‘Promoting Good Practices & Standards’162
s
Sl. No. STATE / UT PPMG PMG
1 Andhra Pradesh 0 64
2 Arunachal Pradesh 0 0
3 Assam 0 4
4 Bihar 0 0
Chhattisgarh 1 11
6 Delhi 0 4
7 Goa 0 0
8 Gujarat 0 0
9 0 1
10 0 0
11 0
12 0 13
13 Karnataka 0 0
14 Kerala 0 0
Madhya Pradesh 0 0
16 Maharashtra 0 12
17 Manipur 0 4
18 Meghalaya 0 7
19 Mizoram 0 0
20 Nagaland 0 0
21 Odhisa 0 17
22 Punjab 0 0
23 Rajasthan 0 0
24 Sikkim 0 0
Tamil Nadu 0 0
26 Telangana 0 0
27 Tripura 0 0
28 Uttar Pradesh 0 7
29 Uttarakhand 0 0
30 West Bengal 0 0
31 A&N Island 0 0
32 Chandigarh 0 0
33 0 0
34 Daman & Diu 0 0
Lakshadweep 0 0
36 Puducherry 0 0
37 0 0
38 BSF 0 19
39 CISF 0 0
40 CRPF 0 69
41 ITBP 0 0
42 NSG 0 0
43 SSB 0 1
44 BPR&D 0 0
NDRF 0 0
46 0 0
Total 1
SOURCE: MHA ANNUAL REPORT
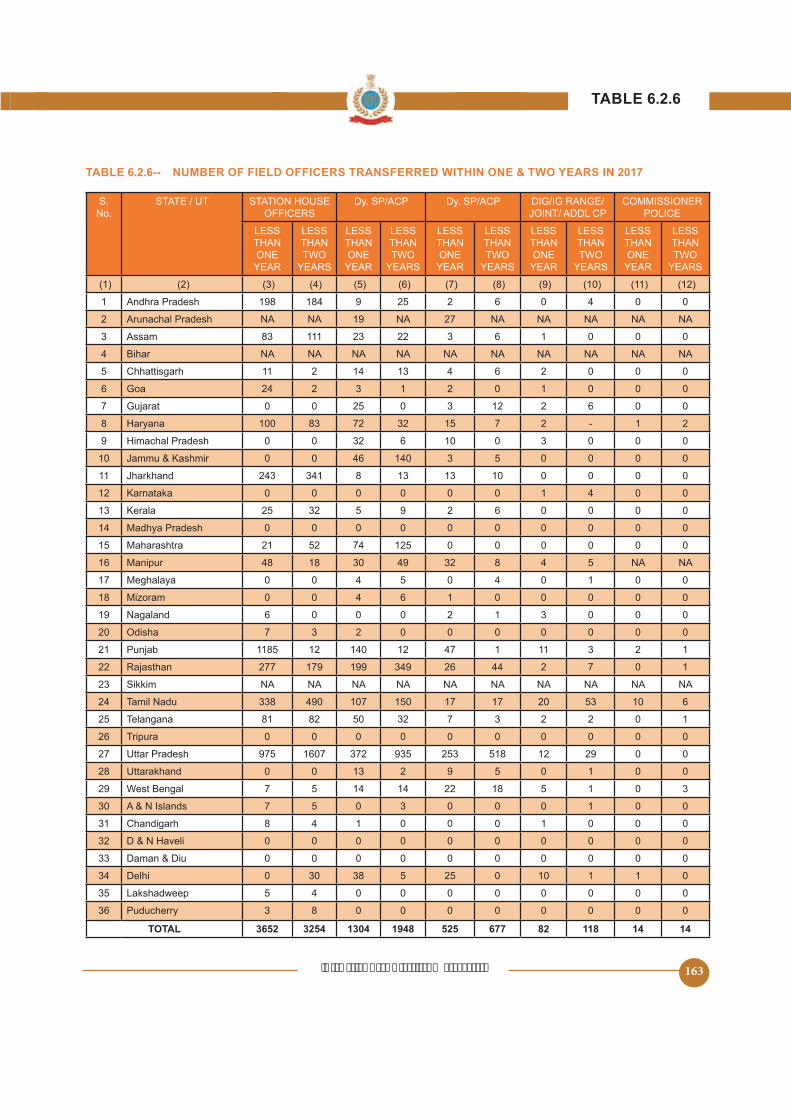
‘Promoting Good Practices & Standards’ 163
S. No.
STATE / UTOFFICERS
Dy. SP/ACP Dy. SP/ACP DIG/IG RANGE/ COMMISSIONER POLICE
LESS
ONE YEAR
LESS
TWO YEARS
LESS
ONE YEAR
LESS
TWO YEARS
LESS
ONE YEAR
LESS
TWO YEARS
LESS
ONE YEAR
LESS
TWO YEARS
LESS
ONE YEAR
LESS
TWO YEARS
1 Andhra Pradesh 198 184 9 2 6 0 4 0 0
2 Arunachal Pradesh NA NA 19 NA 27 NA NA NA NA NA
3 Assam 83 111 23 22 3 6 1 0 0 0
4 Bihar NA NA NA NA NA NA NA NA NA NA
Chhattisgarh 11 2 14 13 4 6 2 0 0 0
6 Goa 24 2 3 1 2 0 1 0 0 0
7 Gujarat 0 0 0 3 12 2 6 0 0
8 100 83 72 32 7 2 - 1 2
9 0 0 32 6 10 0 3 0 0 0
10 0 0 46 140 3 0 0 0 0
11 243 341 8 13 13 10 0 0 0 0
12 Karnataka 0 0 0 0 0 0 1 4 0 0
13 Kerala 32 9 2 6 0 0 0 0
14 Madhya Pradesh 0 0 0 0 0 0 0 0 0 0
Maharashtra 21 74 0 0 0 0 0 0
16 Manipur 48 18 30 49 32 8 4 NA NA
17 Meghalaya 0 0 4 0 4 0 1 0 0
18 Mizoram 0 0 4 6 1 0 0 0 0 0
19 Nagaland 6 0 0 0 2 1 3 0 0 0
20 Odisha 7 3 2 0 0 0 0 0 0 0
21 Punjab 12 140 12 47 1 11 3 2 1
22 Rajasthan 277 179 199 349 26 44 2 7 0 1
23 Sikkim NA NA NA NA NA NA NA NA NA NA
24 Tamil Nadu 338 490 107 17 17 20 10 6
Telangana 81 82 32 7 3 2 2 0 1
26 Tripura 0 0 0 0 0 0 0 0 0 0
27 Uttar Pradesh 1607 372 12 29 0 0
28 Uttarakhand 0 0 13 2 9 0 1 0 0
29 West Bengal 7 14 14 22 18 1 0 3
30 A & N Islands 7 0 3 0 0 0 1 0 0
31 Chandigarh 8 4 1 0 0 0 1 0 0 0
32 0 0 0 0 0 0 0 0 0 0
33 Daman & Diu 0 0 0 0 0 0 0 0 0 0
34 Delhi 0 30 38 0 10 1 1 0
Lakshadweep 4 0 0 0 0 0 0 0 0
36 Puducherry 3 8 0 0 0 0 0 0 0 0
TOTAL 3652 3254 525 677 82 118 14 14

‘Promoting Good Practices & Standards’164
s
Sl. No
Name Total No Name of Institute Telephone No. Fax No. Mobile No
1 Andhra Pradesh
4 Anantapuramu Police Training College
Tirupati Police Training College 0877-2236070 0877-2236696
Ongole Police Training College
Vizianagaram Police Training College 08922-274226 9121109333
2 Arunachal Pradesh
1 Police Training Centre,Bhanderdewa 0360-2266243 0360-2266243
3 Assam 4 PTC,Dergaon APTC, Dergaon RTS, Dergaon BTC, Dergaon
03762380237 03762380274 03762380216
03762380274 03762380216
4 Bihar 4 CTS, Nathnagar
- - 9471006283
Mptc, Dumraon - - 9431822981
Bihar Police Academy, Patna - - 9472901960
Chhattisgarh 12
SPA Chandkhiri, Distt Raipur
PTS Rajnandgaon 07744-224607 07744-224607 94791-90203
PTS Mana, Distt Raipur 0771-2418760 0771-2418028 94791-90202
PTS Mana, Distt Sarguja - -
07868-241768 07868-241768 94791-94101
CIAT, Rajnandgaon 07744-224607 07744-224607 94791-90203
07782-222610 07782-222610
CIAT, Chandkhuri, Raipur
CIAT, Bilaspur 94791-90820
IED School, RAIPUR 7712-418960 07712-418079 94791-90842
07782-228181 94791-90209
PTC Borgaon 07784-200830 - 94791-90210
6 Goa 1 Police Training School 0832-2374248 0832-2374248
7 Gujarat 4
Gujarat Police Academy, Karai 079-29289612 079-23277320
Police Training School Lalbaug Vadodara
Police Training Collage Bilkharoad
State Reserve Police Training Centre Chowki Sorath
8 3
Karnal0184-2380101 NA
Recruit Training Centre, Bhondsi, Gurugram
0124-2269900 0124-2269900 NA
Police Training College, Sunariya, Rhotak
NA NA NA

‘Promoting Good Practices & Standards’ 165
Sl. No
Name Total No Name of Institute Telephone No. Fax No. Mobile No
9Pradesh
4
Police Training College, Daroh District 88944-44806
Ist IRBn Bangarh, Training School
2nd IRBn Sakoh,, Training School 01892-222439-223126
01892-223146 94184-60003
3rd IRBn Sakoh , Training School82199-99806
10Kashmir
7
Sher -i-Kashmir Police Academy 01992-270200 01922-270200 9419160240
SPS Police Training College 9419103017
Police Technical Training Instute 1923.231734 01923-231734 9419909790
Subsidiary Training Centre
Commando Training Centre - -
Subsidiary Training Centre -
Police Training School 0194-241923/ 0194-2109381
0194-241923 9419166437
11 6
9470922222 9431381207
9431141187
9771432102
7033073940
CIAT school Netharhat 7033073940
12 Karnataka 14
Karnataka Police Academy, Mysuru 0821-2418627 - 9480800302
Police Training Collge, Kalaburgi 08472-263666 -
Karnataka State Police Training School, Channapatna, Ramanagar District
- 9480800313
Police Training School, Khanapura, Belagavi Dist.
08336-223223 - 9480800316
Armed Police training School, Yelahanka
080-22942930 - 9480800312
Police Driving Maintainance School, Yelahanka
- 9480800318
0836-2233248 - -
Police Training School, Kaduru - -
Police Training School, Aimangala 08193-273344 - -
Police Training School, Mysuru 0821-2418732 - -
- - 9742364644
Police Training School, Thanisandra - -
KSRP Training School, Munirabad
KSRP Training School, Kangrali, Belagavi
9480800831

‘Promoting Good Practices & Standards’166
Sl. No
Name Total No Name of Institute Telephone No. Fax No. Mobile No
13 Kerala 20471 2313497 9497999991
0471 232 3229
14Madhya Pradesh
17
Sagar
Rustamji, Armed Police Training, college , Indore
0731-2419771 8989997277
Police Training, college , Indore 0731-2701184 0731-2701184 7049100828
Police Training School, Tighra, Gwalior 7049100826
Police Training School, Sagar
Police Training School, Umariya 7049100827
Police Training School, Ujjain
Police Training School, Rewa 7049100830
Police Training Institute, Pachmadhi, 7049100829
0761-2676199 7049100804
PTS, 13bn SAF, Gwalior
Police RadioTraining School, Indore 0731-2419410 0731-2419410 9826017614
7049100741
S.B. Training Institute, Bhopal
7049100648
7th Bn Band, Training School, Bhopal 8989762033
Police Vahan Prasikshan Shala, Naubasta, Rewa
7049100806
Maharashtra 13
Director Maharashtra Police Academy, Nashik
Police Training Centre, Marol, Mumbai
Police Training Centre, Khandala, Pune
02114-269483
Police Training Centre, Nanveej, Daund, Pune
02117-262491
Police Training Centre, Solapur
02482-230608 02482-230902
Police Training Centre, Babhalgaon, Latur
Police Training Centre, Akola 0724-2434111 /2422817 / 2427800
Police Training Centre, Nagpur
Police Training Centre, Turchi, Tasgaon, Sangli
02346-232100 02336-632104
Police Training Centre, Dhule
Detective Traingin School, Nashik
Centre For Police Research, Pune
16 Manipur 1 Manipur Police Training College NA NA NA

‘Promoting Good Practices & Standards’ 167
Sl. No
Name Total No Name of Institute Telephone No. Fax No. Mobile No
17 Meghalaya 3
Police Training School, Meghalaya, Shillong
9436303074
1st MLP Bn, Armed Police Training Centre, Mawiong, Shillong
2nd MLP Bn, Armed Police Training Centre, Goerage, Tura 9436161336
18 Mizoram 1 Police Training School,Thenzawl Nil Nil Nil
19 Nagaland 1Nagaland Police School, Chemukedima
03862-240428 03862-240428 9774241326
20 Odisha 12
Biju Pattanaik State Police Academy, At-Ranasinghpur, Po-Sarkantara, Bhubaneswar
0674-2470366 -
Police Training College, Angul 06764-233669 06764-233668 -
Police Training Institute, Bairi -
Police Training School, Nayagarh -
Institute, Bhubneswar
-
Basic Training Institute Burla, Sambalpur
- - 9437760360
Armed Police Training Centre, - 9437176264
SOG Training & Research Cente, Chandaka, Bhubneswar
- 0674-2466009 -
Counter Insurgency - Anti Terrorist School, Chandaka Bhubneswar
- 0674-2466009 -
Counter Insurgency - Anti Terrorist School, Koraput
- - -
SOG Training and Research Centre, Koraput
- - -
Counter Insurgency - Anti Terrorist School, Rourkela
- - -
21 Punjab 6
Maharaja Ranjit Singh, Punjab Police Academy, Phillaur.
01826-222061 01826-223820 -
Commando Training Centre, Bhadurgarh.
-
In-Service Training Centre, Kapurthala 01822-231033 01822-231033 -
0181-2227882 0181-2227882 -
Khelan.-
Police Training Center, Ladha Kothi, Sangrur.
-
22 Rajasthan 11
0141-2303222 0141-2303222 9001234444
Rajasthan Police Training Centre, 9660090999
Police Training School, Kishangarh 01463-242008 01463-242008
94138444681
Police Training School,Khewara 02907-260006 02907-260006 9414003081

‘Promoting Good Practices & Standards’168
Sl. No
Name Total No Name of Institute Telephone No. Fax No. Mobile No
07432-240191 07432-240191 8290888801
Police Motor Driving School,Bikaner
Police Training School,Alwar 9829038883
Police Training School,Bharatpur 9829038883
Police Commando Training School, 9460024421
Police Training School, Bikaner
23 Sikkim 2Police Training Centre, Yangang -
Sikkim Armed Police, Pangthang 237382 -
24 Tamil Nadu 1
Tamil Nadu Police Academy, Land Survey No. 1 , Oonammanchery Village, Vandalur,Kelambakkam Road, Vandalur,m Chennai. 600127
Telangana 4
PTC, Amberpet 4027403331 4027401689 9440901929
PTC, Karimnagar 8782224043 9491398617
PTC, Warangal 9440906777
9440627794
26 Tripura 4
KTDS Police Training Academy, Narshingarh, Agartala, West Tripura District, Tripura
0381-2342287 0381-2342287
Counter Insurgency & Anti Terrorist School, Kachucherra, Dhalai District, Tripura
9436462947
A.Ch. Rama RAO tsr Training Center, R.K. Nagar , Khayerpur, Agartala, WEST Tripura District, Tripura
0381-2391069 -
commonly known as CTI, East Gakulnagar, Sepahijala District, Tripura
0381-2903408 0381-2903408 9436767481
27Uttar-
Pradesh9
DR-B-R-Ambedkar acadmy Moradabad
Police Trannig Degree Collage. Moradabad
Police Trannig Degree Collage. Sitapur
Armed Police Trannig Degree Collage. Sitapur
Police Trannig Collage. Moradabad
Police Trannig Collage. Gorakpur
Police Trannig Collage. Meerut 0121-2708121 0121-2708121
Police Trannig Collage. Unnao
Armed Police Trannig Collage. Mirzapur
28 Uttarakhand 4
PTC,Narendernagar 8191818029
01334-270087 01334-270087
RTC, Dehradun 9411112706
RTC, 31BN Pac, Udn 9411112783

‘Promoting Good Practices & Standards’ 169
Sl. No
Name Total No Name of Institute Telephone No. Fax No. Mobile No
29 West Bengal 9
Swami Vivekananda State Police Academy, West Bengal
Police Training School, Salua, Paschim Medinipu
- -
STC, SAP 9th Bn., Sandhya, Krishnanagar, Nadia
03472 -227040 -
STC, SAP 4th Bn., Kasba, Raigunj, Uttar Dinajpur
-
STC, EFR 2nd Bn., Salua, Paschim Medinipur
- -
STC, SAP 13th Bn., Barjora, Bankura -
STC, SAP 12th Bn., Dabgram, -
STC, SAP 1st Bn., Barackpore -
Police Training School, Kolkata, 247, 2248-3808 - -
30A and N Islands
1Police Training School
31 Chandigarh 1Recruits Training Center 0172-2746100
(Police Control
32Dadra and
1Police Training School, Saily 2602642707 2602630707
33Daman and
Diu0
NIL NIL NIL NIL
34 Delhi 4
Kalan, Delhi28742321 8130099002
Delhi- -
Police Training School, Wazirabad, Delhi
Police Training School, Sec. 09, Dwarka, Delhi
011-28081191 28081224 9990020079
Lakshad-weep
0NIL NIL NIL NIL
36 Puducherry 1Police Training School, Puducherry 04132277609
041322727334132272733 9944361429

‘Promoting Good Practices & Standards’170
s s
Sl. No Name Total No Name of Institute Telephone No. Fax No. Mobile No
1 4
Centre and School (Dimapur, Sukhovi (Na-
03862 261001 03862 261002 -
Assam
0376 2310439 0376 2310439 -
Technology Centre, Silchar, Assam
03842 267208 03842 267208 -
School, Teliamura, Tripura
03824 261007 03824 261007 -
2 Border Security Force 23
BSF Academy Tekanpur 274200 -
TC&S 236376 -
CSMT BSF Tekanpur 274013 -
NTCD BSF Tekanpur 274200 -
CSWT BSF Indore 0731-2621030 2621030 -
BIDR BSF Tekanpur 274100 -
BIAAT BSF Dehradun
-
CIAT BSF Karahali
080-28478427 28478161 -
GTS BSF New Delhi -
STS-I BSF New Delhi 011-29962940 29962940 -
STS-II BSF Bengaluru
-
STC BSF Srinagar
0194-2303396 2303396 -
STC BSF Udhampur
-
STC BSF Kharkan Camp
-
STC BSF -
STC BSF Chakur -
STC BSF Churachandpur
03874-234283 234283 -
STC BSF North Bengal -
236627 -
STC BSF Tekanpur -
STC BSF Bengaluru 080-28478427 28478161 -
STC BSF Indore -
SIW BSF New Delhi -

‘Promoting Good Practices & Standards’ 171
Sl. No Name Total No Name of Institute Telephone No. Fax No. Mobile No
3Central Industrial Security
Force9
National Industrial Security Academy
040-27872999 040-27863997 -
Fire Service Training
-
04177-246400/ 246318
04177-246300 -
07280-224307 -
0788-2673827 0788-2673827 -
01434-232040 01434-232199 -
01494-218180 01494-248003 -
RTC Mundali -
Canine Training School, Ranchi.
- -
4Central Reserve Police
Force17
Internal Security -
CRPF Academy, Kadarpur, Gurgaon
0124-2269601 0124-2269602 -
Intelligence School 0124-2269601 0124-2269602 -
TOT School, Dharampur, Kasaulee, Distt-Solan
- -
CTC,CRPF,Neemuch 07423-220223 -
CTC, CRPF,Sanjeevi 0422-2460600 0422-2461741 -
CTC, CRPF, Mudhkhed, Nanded
-
CTC,CRPF - -
CIAT School, CRPF, Dayapur
-
CIAT School 027492-280960 -
RTC,CRPF,Neemuch 07423-220131 07423-222749 -
RTC,CRPF, Avadi 044-26840312 044-26842109 -
RTC, CRPF, Aravanchal -
RTC, CRPF, Srinagar 0194-2303690 0194-23031171 -
RTC, CRPF, Rajgiri Extn. 06132-233008 09132-233033 -
Dog Breeding & Training School, Taralu
- -
Tiril Ashram-

‘Promoting Good Practices & Standards’172
Sl. No Name Total No Name of Institute Telephone No. Fax No. Mobile No
Indo-Tibetan Border Police
17
ITBP Academy -
Basic Training Centre -
RTC Karera -
RTC Kimin -
RTC Shivgangai
MDS Almora
01374-234381 01374-234383 -
M&SI Auli 01389-223239 -
Signal TRG. School 7492223382 07492-221313 -
SWTS School -
Centre Trg. College 0144-2730240 0144-2730240 -
Animal Trg. School 03804-266089 03804-266089 3804266090
NITSRDR -
NTCD&A -
Clercial Trg. School 011-27283996 -
01982-264419 01982-264619 -
UNCIVPOL Centre 011-26046340 011-26042291 9968289601
6National Disaster Reponse Force
1NDRF Academy, Nagpur 0712-2980244 - -
7 National Security Guards 1Training Centre, NSG 0124-2337028 -
8 Railway Protection Force 13
Protection Force Academy,
032-44080/ 9794836141
Institute, Kharagpur080-63640/ 9002081701
Centre,N.E Railway, 070-89278/
040-27242396- 9701370703
RPF Training Centre S Railways, Kimber Gar-den, Khajamalai
060-77823/ 9003864723 -
RPSF Training Centre, Rajahi Camp
040-63193/ - 9794840708
RPF Training Centre, -
para
9002027111
RPF Training Centre N.E Railway
Centre,N.W Railway, Bandikani,
9001199744
Centre, F.C Railway0613-2233479 0613-2233479 9162668179
Institute,W.Railway, Dharampur Road
“090-49016/
“
02632-246833 9724296318

‘Promoting Good Practices & Standards’ 173
Sl. No Name Total No Name of Institute Telephone No. Fax No. Mobile No
22344102183-223441 9766344168
Centre
Institute, South Side
03222-221892080-62841 -
9 Sashastra Seema Bal 17
SSB Academy Bhopal 6261838347
CTC Sapri 1970223389
CTC Srinagar
RTC Salonibari
RTC Gorakhpur
RTC Alwar -
1363274269 1363274269 -
MTC Shimla 1772802440 9434738202
TTC Kasumpti 1772620470 1772620470
DTC Dera 9999479026
ITS Kolkata 3324431984 3324431843
IT & TTC Faridabad 1292410743 1292411814
ATC Kumarsain 1782240087 1782240087 -
ATC Sarahan 9816022278
ITS Mahipalpur 1126782039 1126782033
AMTI PORBANDAR - 7086290290
10 BPR&D 6
CAPT Bhopal2706007
- -
CDTI Ghaziabad - -
CDTI Kolkata 033-22841049/ 1184/0036
-
040 2970 4170 - -
CDTI Chandigarh 0172-2602216/ 0172-2660312 -
0141 223 6098 - -
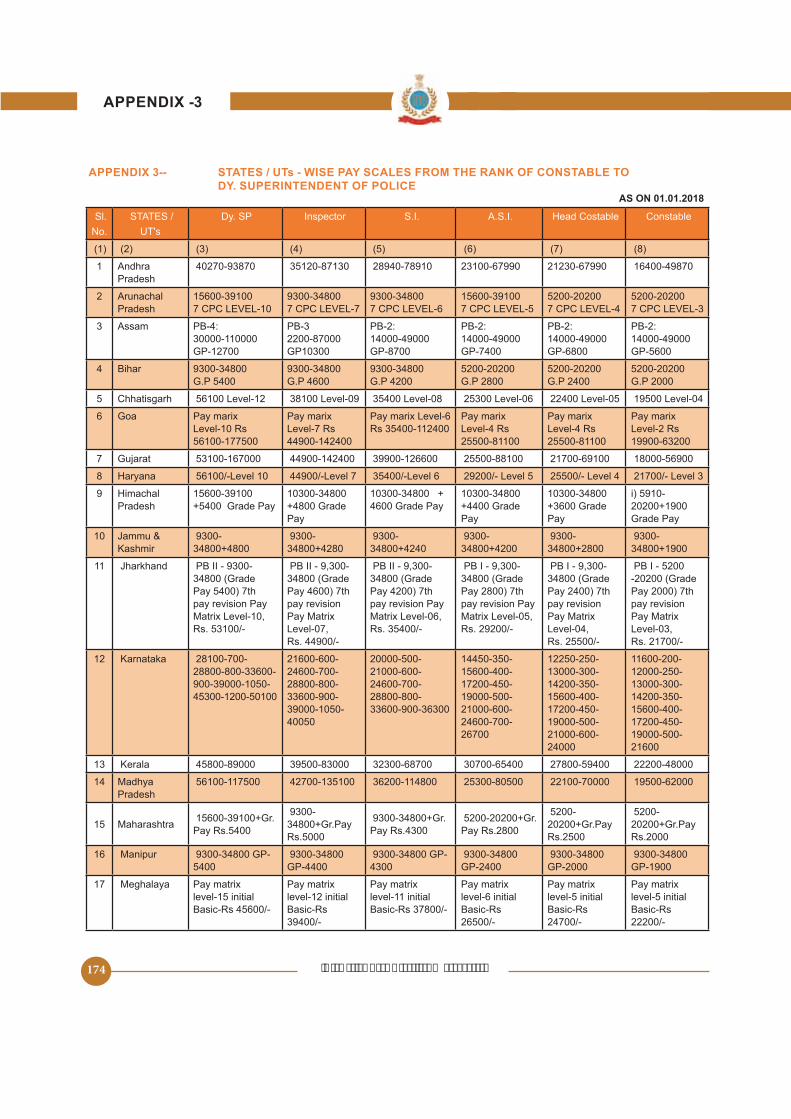
‘Promoting Good Practices & Standards’174
s
Sl.
No.
STATES /
UT's
Dy. SP Inspector S.I. A.S.I. Constable
1 Andhra Pradesh
40270-93870 28940-78910 23100-67990 21230-67990 16400-49870
2 Arunachal Pradesh
7 CPC LEVEL-10
9300-34800 7 CPC LEVEL-7
9300-34800 7 CPC LEVEL-6
7 CPC LEVEL-4
7 CPC LEVEL-3
3 Assam PB-4: 30000-110000 GP-12700
PB-3 2200-87000 GP10300
PB-2: 14000-49000 GP-8700
PB-2: 14000-49000 GP-7400
PB-2: 14000-49000 GP-6800
PB-2: 14000-49000
4 Bihar 9300-34800 9300-34800 G.P 4600
9300-34800 G.P 4200
G.P 2800
G.P 2400
G.P 2000
Chhatisgarh 38100 Level-09
6 Goa Pay marix Level-10 Rs
Pay marix Level-7 Rs 44900-142400
Pay marix Level-6 Pay marix Level-4 Rs
Pay marix Level-4 Rs
Pay marix Level-2 Rs 19900-63200
7 Gujarat 44900-142400 39900-126600 21700-69100
8 44900/-Level 7 21700/- Level 3
9Pradesh
10300-34800 +4800 Grade Pay
10300-34800 + 4600 Grade Pay
10300-34800 +4400 Grade Pay
10300-34800 +3600 Grade Pay
20200+1900 Grade Pay
10Kashmir
9300-34800+4800
9300-34800+4280
9300-34800+4240
9300-34800+4200
9300-34800+2800
9300-34800+1900
11 PB II - 9300-34800 (Grade
pay revision Pay Matrix Level-10,
PB II - 9,300-34800 (Grade
pay revision Pay Matrix Level-07, Rs. 44900/-
PB II - 9,300-34800 (Grade
pay revision Pay Matrix Level-06,
PB I - 9,300-34800 (Grade
pay revision Pay
Rs. 29200/-
PB I - 9,300-34800 (Grade
pay revision Pay Matrix Level-04,
-20200 (Grade
pay revision Pay Matrix Level-03, Rs. 21700/-
12 Karnataka 28100-700-28800-800-33600-
21600-600-24600-700-28800-800-33600-900-
21000-600-24600-700-28800-800-33600-900-36300 21000-600-
24600-700-26700
13000-300-
21000-600-24000
11600-200-
13000-300-
21600
13 Kerala 32300-68700 22200-48000
14 Madhya Pradesh
36200-114800 22100-70000
Maharashtra 9300-34800+Gr.Pay
9300-34800+Gr.Pay Rs.4300 Pay Rs.2800
20200+Gr.Pay 20200+Gr.Pay Rs.2000
16 Manipur 9300-34800 GP- 9300-34800 GP-4400
9300-34800 GP-4300
9300-34800 GP-2400
9300-34800 GP-2000
9300-34800 GP-1900
17 Meghalaya Pay matrix Pay matrix level-12 initial Basic-Rs 39400/-
Pay matrix level-11 initial Basic-Rs 37800/-
Pay matrix level-6 initial Basic-Rs
Pay matrix
Basic-Rs 24700/-
Pay matrix
Basic-Rs 22200/-

‘Promoting Good Practices & Standards’ 175
Sl.
No.
STATES /
UT's
Dy. SP Inspector S.I. A.S.I. Constable
18 Mizoram Pay Band 3-
Pay Band 2- Rs 9300-34800+4600
Pay Band 2- Rs 9300- 34800+4400
Pay Band 2- Rs 9300- 34800+4200
Pay Band 1-
20200+2400
Pay Band
20200+1900
19 Nagaland 9300
20 Odisha 9300-34800 9300-34801 9300-34802
21 Punjab
Grade Pay
Band Pay Rs. 10300-34800+ Grade Pay Rs. 4800 (Initial
Band Pay Rs. 10300-34800+Grade Pay Rs. 4600 (Initial
Band Pay Rs. 10300-34800+Grade Pay Rs. 4400 (Initial
Band Pay Rs. 10300-34800+Grade Pay Rs. 3600 (Initial
Band Pay Rs. 10300-34800+Grade Pay Rs. 3200 (Initial Pay
22 Rajasthan 4800 4200 3600 2800 2400
23 Sikkim 9300-34800- 9300-34800-3800
3400
3000 "
4400 "
24 Tamil Nadu 9300-34800+ 9300-34800+4800
NA 20200+2800 20200+2400
Telangana 40270-93780 28940-78910 23100-67990 21230-63010 16400-49870
26 Tripura
PB-4
Rs 10230-34800/-
PB-3 in PB-2
24000/-
PB-2
24000/-
in PB-2
24000/-
PB-2
27 Uttar Pradesh Revised pay matrix level-10
9300-34800 Revised pay matrix level-6(44900-
9300-34800 Revised pay matrix
Revised pay matrix
Revised pay matrix level-4
Revised pay matrix level-3
28 Uttarakhand Level-10 Level-8 Level-7 44900-142400
29200-92300
Level-4 Level-3 21700-69100
29 West Bengal Grade Pay- Grade Pay-RS4700
Grade Pay-RS 3900
Grade Pay-RS 3200
NA Grade Pay-RS 2600
30 A&N Islands Level - 8
167800
Level - 7 44900 - 142400 112400 92300
Level - 4 Level - 3 21700-69100
31 Chandigarh Rs 10300-34800
Rs 10300-34800 Rs 10300-34800 Rs 10300-34800
Rs 10300-34800
32PAY MATRIX IN LEVEL 8
44900-142400-PAY MATRIX IN LEVEL 7
PAY MATRIX IN LEVEL 6
29200-92300- PAY MATRIX IN PAY MATRIX IN
LEVEL 4
21700-69100-PAY MATRIX IN LEVEL 3
33 Daman & Diu PAY MATRIX IN LEVEL 8
44900-142400-PAY MATRIX IN LEVEL 7
PAY MATRIX IN LEVEL 6
" 29200-92300- PAY MATRIX IN PAY MATRIX IN
LEVEL 4
21700-69100-PAY MATRIX IN LEVEL 3
34 Delhi Level - 8 of matrix pay 47600 -
Level - 7 of ma-trix pay 44900 - 142400
Level - 6 of
- 112400
-trix pay 29200- 92300
Level - 4 of ma- Level - 3 of matrix pay 21700-69100
Lakshadweep IN PAY MAYTRIX 47,600
PAY MATRIX 44900
PAY METRIX ASI 29200
PAY METRIX PAY METRIX 21700
36 Puducherry Level 8 of the 7
CPC Pay Matrix
Level 7 of the 7
CPC Pay Matrix
Level 6 of the 7
CPC Pay Matrix CPC Pay Matrix
Level 4 of the 7
CPC Pay Matrix
Level 3 of the 7
CPC Pay Matrix

‘Promoting Good Practices & Standards’176
s
SL.
NO.
CAPF/ CENTRAL
INVESTIGATION
AGENCIES /
ORGANISATIONS
Dy. SP Inspector S.I. A.S.I.
Constable
Constable
1 Pay Level 10 Pay Level 7 Pay Level Pay Level 4 Pay Level 3 (21700-
2 Border Security Force
9300-34800 9300-34800
3 Central Industrial Security Force
NA Level-7 44900-142400
Level-6
112400
29200-92300
Level-4 Level-3 21700-69100
4 Central Reserve Police Force
NA NA NA NA NA NA
Indo-Tibetan Border Force
Level-10 Level-7 Level-6 Level-4 Level-3
6 National Disaster Response Force
Level-10 Level-7 Level-6 Level-4 Level-3
7 National Security Guards
44,900-1,42,400 1,12,400
29,200-92,300
21,700-69,100
8 Railway Protection Force
matrix level-10
9300-34800/-GP-4600/Pay Matrix Level-7
9300-34800/-GP-4200/Pay Matrix Level-6
2800/Pay Matrix
GP-2400/Pay Matrix Level-4
20200/-GP-2000/Pay Matrix Level-3
9 Sashastra Seema Bal
LEVEL-10 LEVEL-7 44900-142400
LEVEL-6 29200-92300
LEVEL-4 LEVEL-3 21700-69100
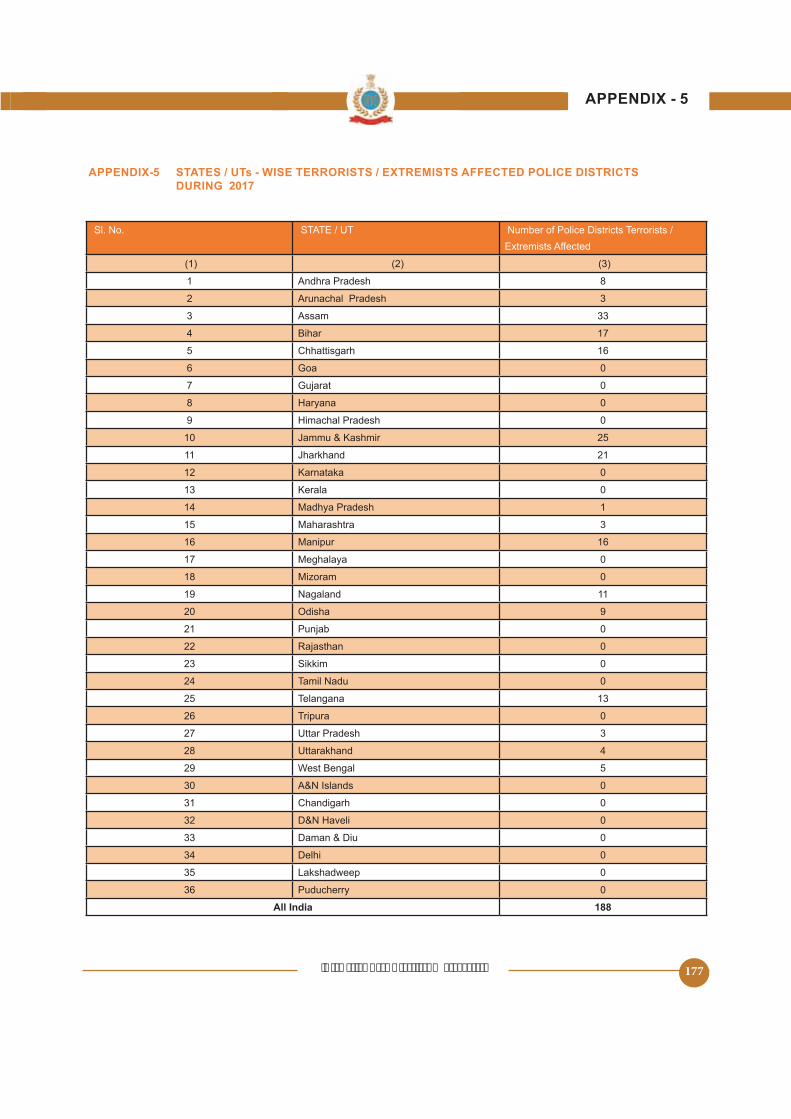
‘Promoting Good Practices & Standards’ 177
s
Sl. No. STATE / UT Number of Police Districts Terrorists /
1 Andhra Pradesh 8
2 Arunachal Pradesh 3
3 Assam 33
4 Bihar 17
Chhattisgarh 16
6 Goa 0
7 Gujarat 0
8 0
9 0
10
11 21
12 Karnataka 0
13 Kerala 0
14 Madhya Pradesh 1
Maharashtra 3
16 Manipur 16
17 Meghalaya 0
18 Mizoram 0
19 Nagaland 11
20 Odisha 9
21 Punjab 0
22 Rajasthan 0
23 Sikkim 0
24 Tamil Nadu 0
Telangana 13
26 Tripura 0
27 Uttar Pradesh 3
28 Uttarakhand 4
29 West Bengal
30 A&N Islands 0
31 Chandigarh 0
32 0
33 Daman & Diu 0
34 Delhi 0
Lakshadweep 0
36 Puducherry 0
188