Embed Size (px)
Citation preview

Ohio Office of Criminal Justice Services
1970 W. Broad Street, 4th Floor Columbus, OH 43223 Toll-Free: (800) 448-4842 Telephone: (614) 466-7782 Fax: (614) 466-8330 www.ocjs.ohio.gov
Homicides in Ohio 2012
This report was supported by Award #2013-BJ-CX-K005, 2012 State Justice Program, awarded by the Bureau of Justice Statistics, Office of Justice Programs, Department of Justice.

2
Since 1930, the Federal Bureau of Investigation (FBI) has annually collected data on
crime in the United States through its Uniform Crime Reporting (UCR) Program. The
UCR Program collects only those data that come to the attention of law enforcement
through victim reports or observation. Reporting is voluntary and, in 2012, law
enforcement agencies active in the UCR Program represented 98.1 percent of the total
population.
Data are collected on the eight Index offenses of murder, forcible rape, robbery,
aggravated assault, burglary, larceny-theft, motor vehicle theft, and arson. In addition to
collecting summary data on the eight Index crimes, the FBI collects detailed data on
homicides. Supplementary Homicide Reports (SHR) provide incident-based information
on criminal homicides, including information describing the victim(s), the offender(s),
the relationship between victim and offender, when the incident occurred, the weapon
used, and the circumstances leading to the homicide incident. Law enforcement agencies
in Ohio voluntarily report SHR data directly to the Federal Bureau of Investigation as
part of the UCR Program.
The following report is based on Ohio homicides reported by law enforcement to the FBI
for 2012. Unless otherwise stated, data come from SHR.
3
Homicides in Ohio and the U.S.
Homicides in Ohio occur at a rate of approximately four per 100,000 population. Over
the past 30 years both the number and rate of homicides has fluctuated. Highs occurred in
the late 1970s and early 1980s and again in the early-1990s. While homicides in recent
years are lower than in past decades, there was a slight upswing in the early 2000s that
has become relatively stable the past few years.
Source: FBI’s Crime in the United States, 1979-2012.
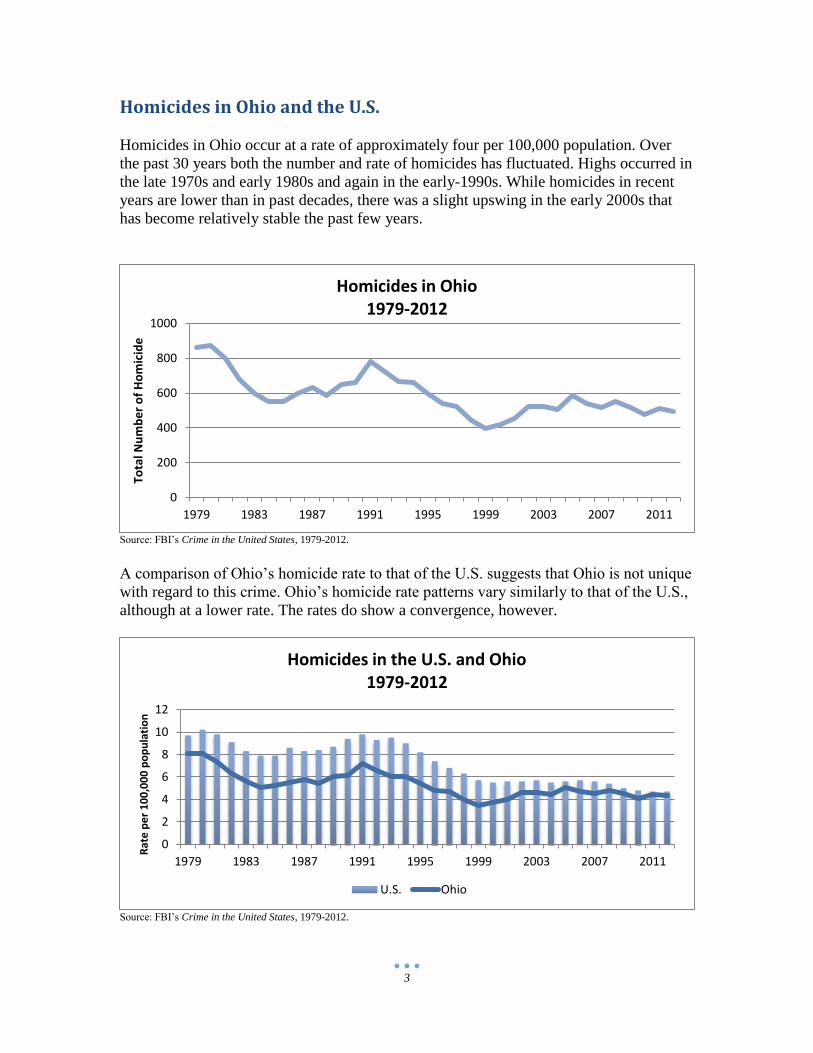
A comparison of Ohio’s homicide rate to that of the U.S. suggests that Ohio is not unique
with regard to this crime. Ohio’s homicide rate patterns vary similarly to that of the U.S.,
although at a lower rate. The rates do show a convergence, however.
Source: FBI’s Crime in the United States, 1979-2012.
0
200
400
600
800
1000
1979 1983 1987 1991 1995 1999 2003 2007 2011
Tota
l Nu
mb
er
of
Ho
mic
ide
Homicides in Ohio 1979-2012
0
2
4
6
8
10
12
1979 1983 1987 1991 1995 1999 2003 2007 2011
Rat
e p
er
10
0,0
00
po
pu
lati
on
Homicides in the U.S. and Ohio 1979-2012
U.S. Ohio

4
Ohio’s homicide rate of 4.3 ranked 27th
in the U.S. in 2012. In 2012 the Northeast
reported the lowest homicide rate, at 3.8 per 100,000 population, followed by the West at
4.2, and the Midwest, at 4.7. The South reported the highest homicide rate at 5.5 per
100,000 population in 2012.
A comparison of regional homicide rates suggests that within the last 20 years homicide
rates vary similarly among the four regions. Ohio’s homicide rate patterns vary similarly
to that of the Midwest, although at a lower rate.
Source: FBI’s Crime in the United States, 1992, 2002 & 2012
Source: FBI’s Crime in the United States, 1992, 2002 & 2012
0
2
4
6
8
10
12
Northeast Midwest West South
Ho
mic
ide
Rat
e p
er
10
0,0
00
U.S. Regional Homicide Rates
1992 2002 2012
0
1
2
3
4
5
6
7
8
1992 2002 2012
Ho
mic
ide
Rat
e p
er
10
0,0
00
Homicide Rate Ohio vs. Midwest
Ohio Midwest

5
Ohio’s three largest police departments—Cincinnati, Cleveland, and Columbus—
reported 42 percent (182) of Ohio’s homicide incidents in 2012.
0
10
20
30
40
50
60
70
80
Nu
mb
er
of
Ho
mic
ide
s
Ohio Homicides by City 2012

6
Homicides in Ohio in 2012
In 2012, Ohio law enforcement reported 495 homicides to the FBI in its annual Crime in
the United States publication. In the FBI’s Supplemental Homicide Report (SHR), 475
homicides were reported. This discrepancy often occurs when one data reporting
deadline is earlier or later than another reporting deadline. Given the more complete
information provided in the SHR, this report is based on data of the 475 homicides.
Number of homicides. There were 435 homicide incidents reported in SHR in Ohio in
2012, resulting in 475 victims. Of the 435 occurrences, 93 percent resulted in the murder
of a single victim and seven percent resulted in the murder of multiple victims.
Of all incidents in which there was a single victim, 55 percent were committed by a
single offender, 19 percent were committed by multiple offenders, and 26 percent were
committed by an unknown number of offenders.
Monthly homicide occurrences. Ohio had an average of 36 homicide incidents per
month. Homicides were at their highest in November, with 46 recorded incidents. The
spring/summer months of April, May, June and July had the largest number of homicide
incidents, accounting for about 38 percent of all homicide incidents in the year 2012.
0
5
10
15
20
25
30
35
40
45
50
Jan Feb Mar Apr May Jun Jul Aug Sep Oct Nov Dec
Nu
mb
er
of
Ho
mic
ide
s
Monthly Homicides In Ohio 2012

7
Ohio’s Homicide Victims
The following data were reported for the victims for whom all or some demographic
information was available. There are some incidents in which little or no demographic
data, such as age, gender, or race data, were available on victims.
Gender. Across nearly all age groups, males were more frequently victims of homicide.
Approximately 73 percent of all homicide victims were male. There were nearly 3 times
as many male victims of homicides as female victims of homicides.
Age1. Certain age groups appeared to be more frequent targets of homicide. Overall, the
median age of homicide victims was 29 years (mean = 33 years). Males had a median
homicide age of 29 years (mean = 32 years), and females had a median homicide age of
32 years (mean = 35 years).
The early adulthood years were notable particularly for males, as the peak in the
following graph indicates. Nearly 51 percent of all male homicide victims were between
the ages of 16 and 30. In contrast, 34 percent of female victims fell between the ages of
16 and 30. There were over four times as many male victims of homicide as female
victims of homicide in the 16 to 30 age range.
1 To calculate the median and mean of the victims, newborns (birth to one week old) and babies (one week
to 12 months old) ages were converted to one.
0
10
20
30
40
50
60
70
<11 11-15 16-20 21-25 26-30 31-35 36-40 41-45 46-50 51-55 56-60 61-65 >66
Nu
mb
er
of
Vic
tim
s
Male Homicide Victims by Age Range 2012

8
Race. Sixty-two percent of all homicide victims were Black and 36 percent were White.
Black males made up 70 percent of male homicide victims and 51 percent of all homicide
victims. White males made up 28 percent of male homicide victims and 21 percent of all
homicide victims. In contrast, Black female victims made up 40 percent of female
homicide victims and 11 percent of all homicide victims, whereas White females made
up 57 percent of female homicide victims and 15 percent of all victims.
0
5
10
15
20
<11 11-15 16-20 21-25 26-30 31-35 36-40 41-45 46-50 51-55 56-60 61-65 >66
Nu
mb
er
of
Vic
tim
s
Female Homicide Victims by Age Range 2012
0%
10%
20%
30%
40%
50%
60%
70%
80%
Female Male
Pe
rce
nt
Wit
hin
Eac
h G
en
de
r
Homicide Victims by Sex and Race 2012
Black
White

9
Looking at age, gender, and race together, different patterns emerge regarding Ohio’s
victims of homicide. Ages 16 through 30 appeared to be the deadliest time for Black
males, as indicated by the peak in the following chart. Sixty-two percent of Black male
homicide victims were between the ages of 16 and 30. There was no dramatic peak for
White males, as 27 percent of White males fell within this age group. Due to the low
number of female homicide victims, no patterns based on race and age were identifiable.
0%
5%
10%
15%
20%
25%
<11 11-15 16-20 21-25 26-30 31-35 36-40 41-45 46-50 51-55 56-60 61-65 >66
Pe
rce
nt
Wit
hin
Eac
h R
ace
Male Homicide Victims by Age and Race 2012
Black White
0%
5%
10%
15%
20%
25%
30%
<11 11-15 16-20 21-25 26-30 31-35 36-40 41-45 46-50 51-55 56-60 61-65 >66
Pe
rce
nt
Wit
hin
Eac
h R
ace
Female Homicide Victims by Age and Race 2012
Black White

10
Ohio’s Homicide Offenders Demographically, Ohio’s homicide offenders were similar to Ohio’s homicide victims.
The following data are reported only for those offenders for whom all or some
demographic information was available.
Gender. Male homicide offenders outnumbered female homicide offenders by seven to
one. The number of male offenders equaled or outnumbered the number of female
offenders across every age category.
Age. The median age for homicide offenders was 25 years (mean = 30 years). The
median offender age for males was 25 (mean = 30 years), which is the same median
female offender age of 25 (mean = 29 years).
The number of male homicide offenders was at its highest between the ages of 16 and 30.
Sixty-two percent of all male homicide offenders fell into this age range. Sixty-four
percent of female homicide offenders fell in this age range. However, because of the low
number of female offenders overall, the female offender data must be interpreted with
caution.
0
10
20
30
40
50
60
70
80
90
100
11-15 16-20 21-25 26-30 31-35 36-40 41-45 46-50 51-55 56-60 61-65 >66
Nu
mb
er
of
Off
en
de
rs
Male Homicide Offenders by Age Range 2012

11
Race. Of those offenders for whom race information was known, Black offenders made
up 62 percent of all homicide offenders and White offenders made up 38 percent of all
homicide offenders. When broken down by gender, Black males made up 65 percent of
male homicide offenders and 56 percent of all homicide offenders. White males made up
35 percent of male homicide offenders and 31 percent of all homicide offenders. Black
females made up 42 percent of all female homicide offenders and five percent of all
homicide offenders. White females made up 58 percent of all female homicide offenders
and seven percent of all offenders.
0
2
4
6
8
10
12
14
16
11-15 16-20 21-25 26-30 31-35 36-40 41-45 46-50 51-55 56-60 61-65 >66
NU
mb
er
of
Off
en
de
rs
Female Homicide Offenders by Age Range 2012
0%
10%
20%
30%
40%
50%
60%
70%
Female Male
Pe
rce
nt
Wit
hin
Eac
h G
en
de
r
Homicide Offenders by Sex and Race 2012
Black
White

12
The following two graphs highlight the patterns of offending when all three demographic
factors — age, sex, and race — are taken into consideration.
Seventy-four percent of all male offenders fall within the age range of 16 and 35. Broken
down further, Black male offenders show a definite peak of activity from age 16 through
age 25, with 82 percent of their offending occurring between these ages in particular. The
data for White male offenders showed a heightened period of activity between the ages of
16 and 30, but did not display quite as distinct of a peak as did the Black offenders.
Black females showed slight similarities in offending with an increase between the ages
of 16-30. White females showed a slightly different increase in offending between the
ages of 16-20 years. However, there were so few female offenders—and even fewer with
complete age, gender, and race information available—that small fluctuations in the
statistics are exaggerated. It is thus difficult to identify specific age trends in the female
offender group.
0%
5%
10%
15%
20%
25%
30%
35%
11-15 16-20 21-25 26-30 31-35 36-40 41-45 46-50 51-55 56-60 61-65 >66Pe
rce
nt
Wit
hin
Eac
h R
ace
Male Offenders by Age Range and Race 2012
Black White
0%
10%
20%
30%
40%
11-15 16-20 21-25 26-30 31-35 36-40 41-45 46-50 51-55 56-60 >66
Pe
rce
nt
Wit
hin
Eac
h R
ace
Female Offenders by Age Range and Race 2012
Black White

13
Characteristics of Victim-Offender Relationship
The majority of homicide victims knew their offender, either as a family member, an
acquaintance, or an intimate partner. Given that most homicides involve an offender
known to the victim, clear patterns of gender and racial relationships are also found
between victims and their offenders. The following statistics were obtained from those
incidents in which relationship information could be determined.
Victim-offender gender. Eighty-seven percent of male homicides and 89 percent of
female homicides were perpetrated by a male offender. Across all male and female
homicides, about 13 percent were perpetrated by a female offender.
Gender Relationship between Victim and Offender
Female Offender Male Offender
Female Victim 11% 89%
Male Victim 13% 87%
Victim-offender race. There is a great tendency for homicide victims and offenders to be
of the same race. Ninety-one percent of Black victims were killed by Black offenders.
Likewise, 78 percent of White victims were killed by White offenders.
Racial Relationship between Victim and Offender
Black Offender White Offender
Black Victim 91% 9%
White Victim 22% 78%
Single victim-single offender incidents. Ninety-three percent of homicide incidents
involved a single victim. Of these, 55 percent involved a single victim and a single
identified offender. Nineteen percent were committed by multiple offenders. Twenty-six
percent were committed by an unknown2 offender.
The single victim-single offender data were analyzed to gain a better understanding of the
relationship between victim and offender. Of the single victim-single offender incidents
for which relationship data were known, the overwhelming proportion of offenders were
known to the victim. As the following graph shows, only nine percent of homicide
offenders were identified as being strangers. For 65 percent of homicides the victim knew
the offender, and often the perpetrator was a non-family member or intimate/former
intimate partner3.
2 Note the distinction between ‘unknown’ and ‘stranger’. ‘Unknown’ means that there is no information on the relationship between victim and offender. ‘Stranger’ means that the victim and offender did not know each other. 3 Individuals are placed in only one category. For the purposes of this document, ‘intimate or former intimate’ refers to husband, wife, boyfriend, girlfriend, ex-husband, or ex-wife.

14
That the victim knew the offender was especially true for female victims. Of the single
victim-single offender incidents, three percent of females (out of all female victims) were
murdered by someone identified as a stranger, compared to 19 percent of male victims
(out of all male victims). Additionally, 57 percent of females were murdered by an
intimate or former intimate partner, in contrast to nine percent of male victims4.
4 Note for this data, “unknown” relationships between the victim and the offender were not included in this
section.
Family 8%
Known non-family 35%
Intimate or former intimate
22%
Stranger 9%
Unknown 26%
Relationship of Victim to Offender Single victim-Single Offender Data
0%
10%
20%
30%
40%
50%
60%
Family Known non-family
Intimate orformer intimate
Stranger Unknown
Pe
rce
nt
Wit
hin
Eac
h G
en
de
r
Victim-Offender Relationship (victim was __ to Offender)
Female Victims Male Victims

15
Weapons Used in Homicides
All homicides involve some sort of weaponry, whether it is a firearm, knife, fist, poison,
or other object. For all homicide incidents where the weapon could be determined, the
following data were obtained.
Firearms were the leading weapon identified in homicide incidents, making up 66 percent
of all identified weapons. Six percent of weapons used in homicides fell under the
category ‘personal weapon’, which includes beatings using hands, feet, fists. Eight
percent of homicides involved knives/cutting instruments. Eleven percent of homicides
were due to other unknown weapons.
*Includes weapons such as Poison, Pushed/Thrown out Window, Strangulation, Fire, Narcotics/Drugs, Drowning and
Asphyxiation used in homicides.
A comparison of weapon usage in homicides between 2002 and 2012 shows some change
over the decade, especially with an increased use of firearms on homicide victims.
Firearms were used on 61 percent of homicide victims in 2002 and 68 percent in 20125.
5 Note that in this chart homicides by weapon type are broken down as a percentage of all victims (e.g., 70% of victims were killed by firearm). This contrasts to the previous chart, which is broken down by incident (e.g., 73% of homicide incidents involved a firearm).
Firearms 66%
Knife or cutting instrument
8%
Blunt object 3%
Personal weapon 6%
Other* 6%
Other, type unknown 11%
Weapons used in Homicide Incidents 2012

16
Source: FBI’s Crime in the United States, 2002 and 2012.
Differences in weapon usage emerge as a function of gender. Sixty-seven percent of male
offenders used a firearm to commit homicide, as opposed to 29 percent of females.
Knives and cutting instruments were used by a higher percentage of females than males,
although the overall number of homicides committed by females using these weapons
remains low.
61% 68%
9% 8%
20% 18%
11%
6%
0
50
100
150
200
250
300
350
400
450
500
2002 2012
Nu
mb
er
of
Ho
mic
ide
s
Ohio Homicides by Weapon Type 2002 vs. 2012
Firearms Knives Other Weapons Hands/Fists/Feet
0%
10%
20%
30%
40%
50%
60%
70%
80%
Firearms Knife ofCutting
Instrument
Blunt Object PersonalWeapon
Other Other, TypeUnknown
Pe
rce
nt
Wit
hin
Eac
h G
en
de
r
Weapon Use by Gender 2012
Female Male

17
Arrestees
In 2012, 206 individuals were arrested for homicide. Eighty-two percent of those arrested
were male. Fifty percent of all male arrestees fell between the ages of 15 and 24.
Source: FBI’s Arrest by County 2012 tables
The majority of arrestees for other violent crimes were male. Ninety-eight percent of
forcible rape6 arrestees, 86 percent of robbery arrestees and 74 percent of aggravated
assault arrestees were male. Other violent crimes show the same general age pattern, with
the number of violent crimes committed by individuals peaking in those in their late teens
and twenties. Forty-seven percent of forcible rape arrestees, 67 percent of robbery
arrestees, and 48 percent of aggravated assault arrestees fell between the ages of 15 and
29.
6 Forcible rape is defined by the FBI as “The carnal knowledge of a female against her will.” Sexual attacks on males are counted as aggravated assaults or other sex offenses.
0
10
20
30
40
50
60
15-19 20-24 25-29 30-34 35-39 40-44 45-49 50-54 55-59 60-64 Over 64
Nu
mb
er
of
Ho
mic
ide
Arr
est
ee
s
Male Homicide Arrestees by Age 2012

18
Source: FBI’s Arrest by County 2012 tables *Includes both Male & Female data
0
200
400
600
800
1000
Under15
15-19 20-24 25-29 30-34 35-39 40-44 45-49 50-54 55-59 60-64 OVER64
Nu
mb
er
of
Arr
est
ee
s
Robbery & Aggravated Assault Arrestees by Age* 2012
Robbery Agg. Assault

19
Homicides Cleared by Arrest or Exceptional Means
In 2012, the FBI reported that nationally over 62 percent of homicides were cleared by
arrest or exceptional means7. Homicide has the highest clearance rate of all Part I violent
crimes. Fifty-six percent of aggravated assaults, 40 percent of forcible rapes, and 28
percent of robberies were cleared by arrest or exceptional means nationwide.
Differences in clearance rates emerge as a function of population group, as the following
table shows.
Population Group Clearance Rate
250,000 or more 57.0%
100,000-249,999 59.5%
50,000-99,999 58.5%
25,000-49,999 67.6%
10,000-24,999 70.1%
Under 10,000 71.5% Source: FBI’s Crime in the United States 2012
7 According to the FBI’s Crime in the United States annual report, to clear an arrest by exceptional means, law enforcement must have: 1) Identified the offender; 2) Gathered enough evidence to support an arrest, make a charge, and turn over the offender to the court for prosecution; 3) Identified the offender’s exact location so that the suspect could be taken into custody immediately; 4) Encountered a circumstance outside the control of law enforcement that prohibits the agency from arresting, charging, and prosecuting the offender. Examples include the death of the offender, the victim’s refusal to cooperate with the prosecution, or the denial of extradition.