Embed Size (px)
Citation preview

HONEY ANTIMICROBIAL EFFECTSAlicia Grabiec
Freeport Senior High School
Grade 10
Purpose
To determine the antimicrobial effects of honey on the Escherichia coli (Gram -) and Staphylococcus epidermidis (Gram +)

Background Information
Advent of penicillin and other antibiotic drugs in the twentieth century reduced honey's medicinal use
Makua honey, like that found in the antiseptic lotion above, can destroy strains of antibacterial-resistant bacteria, such as MRSA
C6H12O6 + H2O + O2 → C6H12O7 + H2O2 This chemical reaction occurs when honey is
mixed withwater and oxygen. Its products are glutonic
acid andhydrogen peroxide, both possess antibacterialproperties.
Honey has been known for its healing properties for thousands of years
Ancient Greeks used it, and so have many other peoples through the ages
Up to the second world war, honey used for its antibacterial properties in treating wounds

Background Information
Escherichia coli is a large and diverse group of gram (-) bacteria.
It is found in the intestinal tract of most animals, including humans.
Estimated to cause infection in more than 70,000 patients a year in the United States.
There are many strains of E. coli, most are non-pathogenic
Pathogenic strains can cause illness and death in humans
Staphylococcus epidermidis is a spherical bacterial that is known to cause infections in wounds.
Gram (+) bacteria
This bacteria is commonly found on the skin.
It is resistant to antibiotics like penicillin and methicillin.
Null Hypothesis:
Honey exposure will not significantly reduce the survivorship of both E. coli and S. epidermidis.
Alternative Hypothesis: Honey exposure will significantly reduce
the survivorship of both E. coli and S. epidermidis.

Variables
Independent / Manipulated
Concentration of honey being tested
0%(control), 1%, 10%, 30%, 50%
Dependent/ RespondingBacterial survivorship
Constant/ Controlled Incubated at 37oC
112 sterile petri dishes containing LB Medium
Length of Incubation time (48 hours)
Limitations
Extended viability of E. coli and S. epidermidis (established)
Impurities in the honey
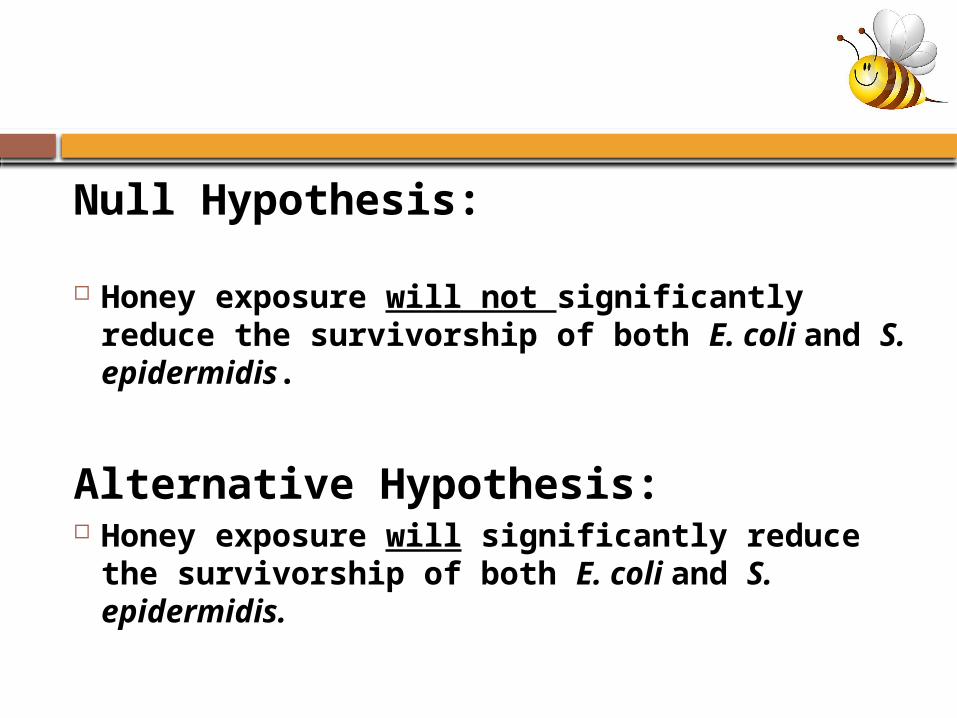
Pulse Liquid Exposure Procedure:
6. 100 µL of cell culture was then added to the honey concentrations, yielding a final volume of 10 mL and a cell density of approximately 103 cells/mL.
7. The solutions were vortexed and allowed to sit at room temperature for 15 minutes.
8. After vortexing to evenly suspend the cells, 100 µL aliquots were removed from the tubes and spread on LB agar plates.
9. The plates were incubated at 37°C for 24 hours.
10. The resulting colonies were counted visually. Each colony was assumed to have arisen from one cell.
1. Bacteria (E. coli and S. epidermidis) were grown overnight in sterile LB media.
2. A sample of the overnight culture was added to fresh media in a sterile sidearm flask.
3. The culture was placed in an incubator (37°C) until a density of 50 Klett spectrophotometer units was reached. This represents a cell density of approximately 108 cells/mL.
4. The culture was diluted in sterile dilution fluid to a concentration of approximately 0.5-0.8x10⁵ cells/mL.
5. Honey was mixed with the appropriate amount of SDF to create honey concentrations of 0%, 1%, 10%, 30%, and 50%.

Honey Infused Agar (Prolonged Exposure) Procedure:
1. Honey was infused directly into molten agar plates at 0.1, 1, 10% and allowed to solidify.
2. Bacteria (E. coli and S. epidermidis) was grown overnight in sterile LB media.
3. A sample of the overnight culture was added to fresh media in a sterile sidearm flask.
4. The culture was placed in an incubator (37°C) until a density of 50 Klett spectrophotometer units was reached. This represents a cell density of approximately 0.5-0.8x10⁸ cells/mL.
5. The culture was diluted in sterile dilution fluid to a concentration of approximately 105 cells/mL.
6. The culture was then spread evenly across honey infused agar.
7. The plates were incubated at 37°C for 24 hours.
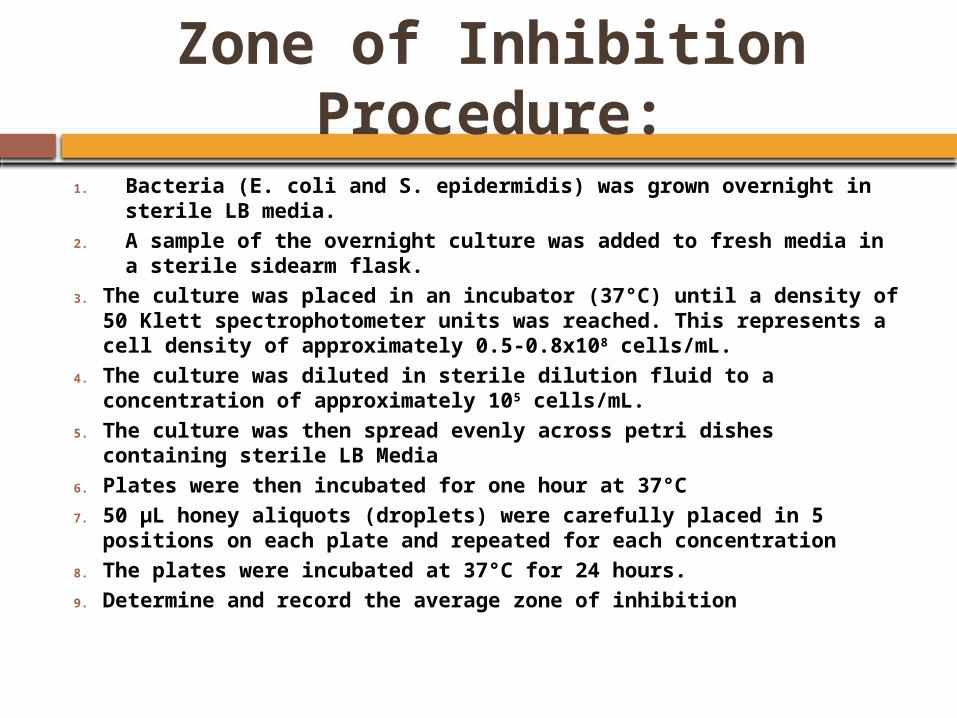
Zone of Inhibition Procedure:
1. Bacteria (E. coli and S. epidermidis) was grown overnight in sterile LB media.
2. A sample of the overnight culture was added to fresh media in a sterile sidearm flask.
3. The culture was placed in an incubator (37°C) until a density of 50 Klett spectrophotometer units was reached. This represents a cell density of approximately 0.5-0.8x10⁸ cells/mL.
4. The culture was diluted in sterile dilution fluid to a concentration of approximately 105 cells/mL.
5. The culture was then spread evenly across petri dishes containing sterile LB Media
6. Plates were then incubated for one hour at 37°C7. 50 µL honey aliquots (droplets) were carefully placed in 5
positions on each plate and repeated for each concentration8. The plates were incubated at 37°C for 24 hours. 9. Determine and record the average zone of inhibition

Pulse Liquid Exposure Data
Pulse Liquid Exposure (S. epidermidis)
Plate #
Percent of Honey
0% 1% 10% 30% 50%1 154 5 3 2 02 163 0 0 0 03 159 0 0 0 04 153 3 1 0 05 157 0 0 0 06 160 2 2 0 07 165 1 0 0 08 143 3 0 1 0
Avg.156.7
51.75 0.75 0.38 0.00
Pulse Liquid Exposure (E. coli)Plate # Percent of Honey
0% 1% 10% 30% 50%1 233 230 154 120 802 206 210 120 140 903 211 180 139 100 834 226 169 127 112 875 231 163 150 117 866 209 174 143 121 847 230 169 147 130 898 210 167 129 126 81
Avg.
219.50
182.75 138.63 120.75
85.00

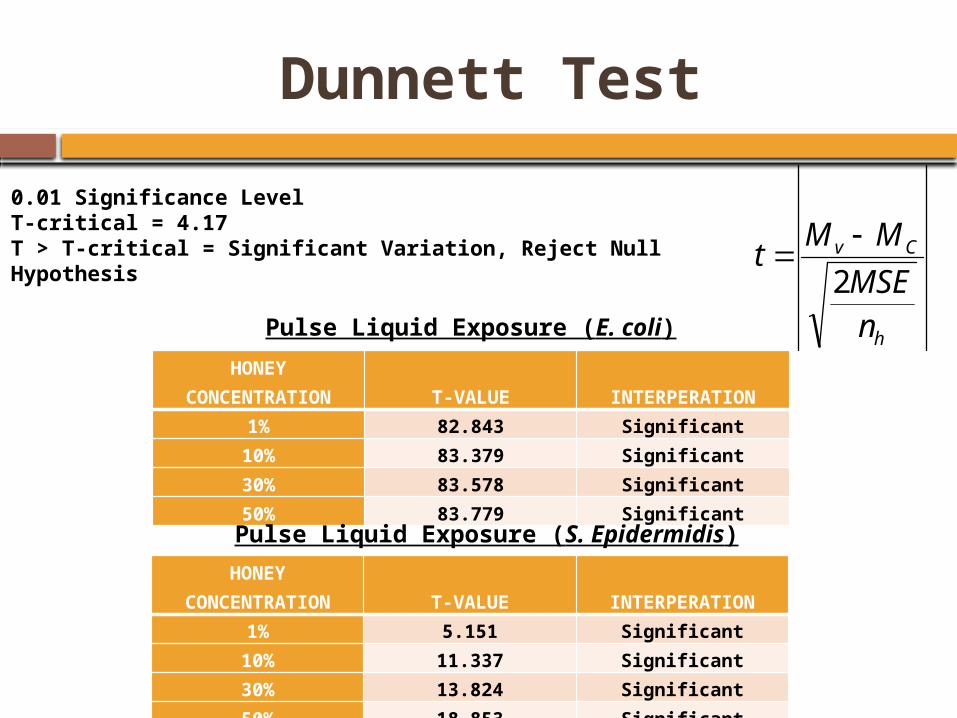
Dunnett Test
HONEY CONCENTRATION
T-VALUE
INTERPERATION
1% 5.151 Significant10% 11.337 Significant30% 13.824 Significant50% 18.853 Significant
HONEY CONCENTRATION
T-VALUE
INTERPERATION
1% 82.843 Significant10% 83.379 Significant30% 83.578 Significant50% 83.779 Significant
Pulse Liquid Exposure (S. Epidermidis)
h
Cv
nMSE
MMt
2
0.01 Significance LevelT-critical = 4.17T > T-critical = Significant Variation, Reject Null Hypothesis
Pulse Liquid Exposure (E. coli)

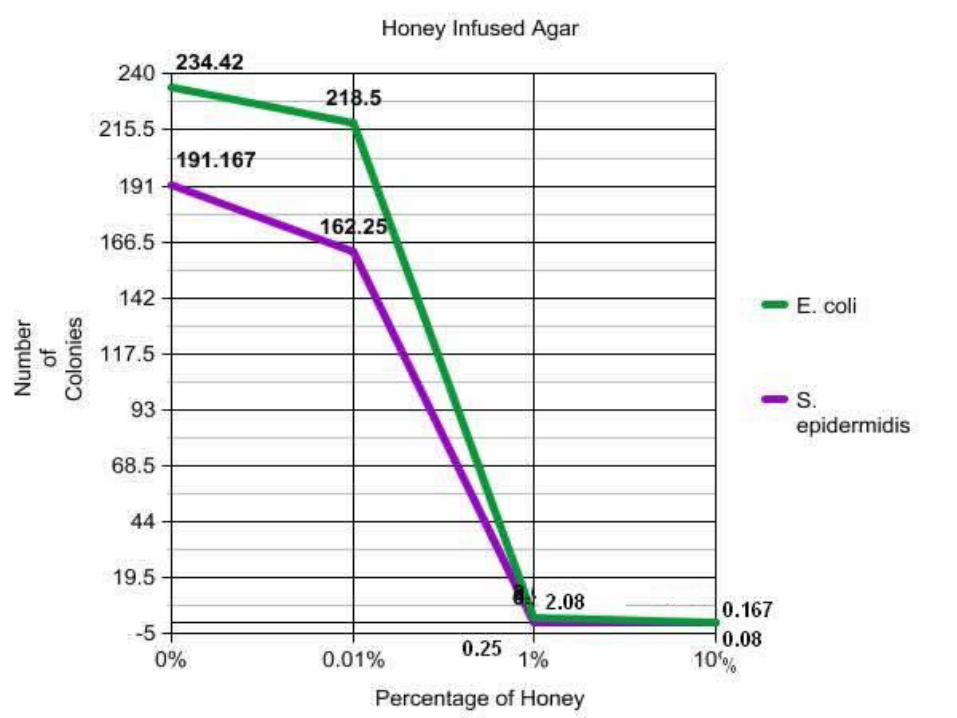
Honey Infused Agar Data
Honey Infused Agar (E.coli)
Plate #
Percent of Honey
0%0.10
% 1% 10%
1 257 219 3 0 2 222 222 0 0 3 234 206 2 0 4 220 230 1 0 5 213 217 4 1 6 248 212 3 0 7 219 215 0 0 8 254 223 1 0 9 230 221 2 0 10 233 226 1 1 11 237 216 5 0 12 246 215 3 0
Avg.
234.42
218.50
2.08 0.17
Honey Infused Agar (S. epidermidis)
Plate #
Percent of Honey
0%0.10
% 1%10%
1 210 150 0 0
2 223 170 0 0
3 190 167 0 0
4 186 180 1 0
5 223 149 0 0
6 221 158 1 0
7 203 163 0 0
8 169 151 0 1
9 173 155 1 0
10 161 168 0 0
11 180 165 0 0
12 155 171 0 0
Avg. 191.17
162.25
0.25
0.08

Dunnett Test
HONEY CONCENTRATION
T-VALUE
INTERPERATION
0.01% 2.133 Insignificant1% 31.132 Significant10% 31.389 Significant
HONEY CONCENTRATION
T-VALUE
INTERPERATION
0.01% 1.412 Insignificant1% 9.321 Significant10% 9.331 Significant
0.01 Significance LevelT-critical = 3.58T > T-critical = Significant Variation, Reject Null Hypothesis
Honey Infused Agar (S. epidermidis)
Honey Infused Agar (E. coli)h
Cv
nMSE
MMt
2
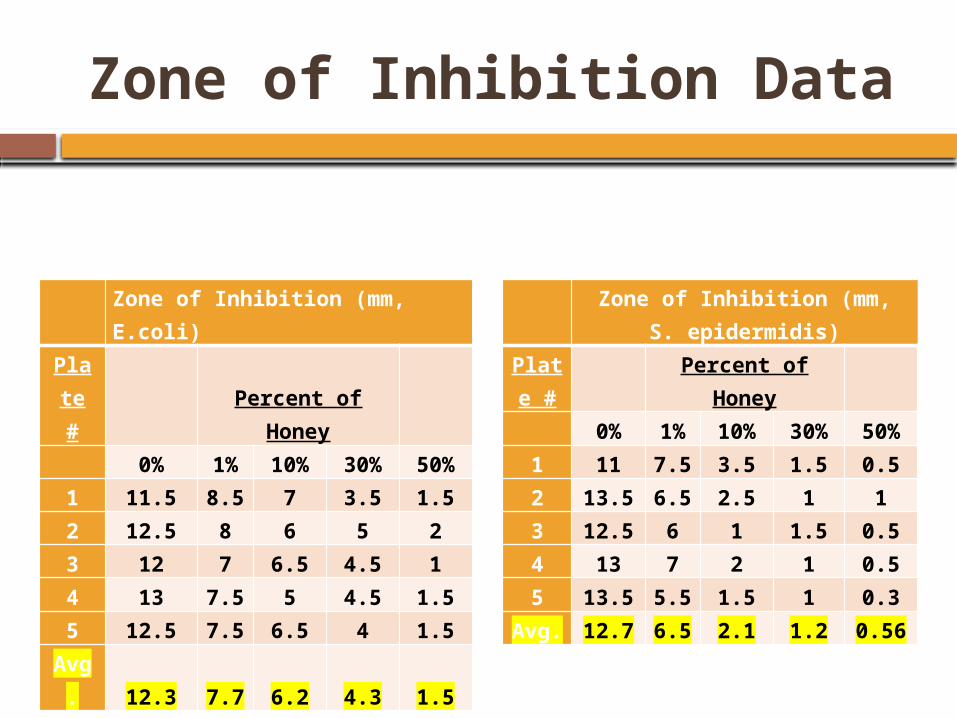
Zone of Inhibition Data
Zone of Inhibition (mm, E.coli)
Plate #
Percent of Honey
0% 1% 10% 30% 50%1 11.5 8.5 7 3.5 1.52 12.5 8 6 5 23 12 7 6.5 4.5 14 13 7.5 5 4.5 1.55 12.5 7.5 6.5 4 1.5
Avg. 12.3 7.7 6.2 4.3 1.5
Zone of Inhibition (mm, S. epidermidis)
Plate #
Percent of Honey
0% 1% 10% 30% 50%1 11 7.5 3.5 1.5 0.52 13.5 6.5 2.5 1 13 12.5 6 1 1.5 0.54 13 7 2 1 0.55 13.5 5.5 1.5 1 0.3
Avg. 12.7 6.5 2.1 1.2 0.56


Dunnett Test
HONEY CONCENTRATION
T-VALUE
INTERPERATION
1% 48.42 Significant10% 94.21 Significant30% 84.21 Significant50% 113.68 Significant
HONEY CONCENTRATION
T-VALUE
INTERPERATION
1% 39.49 Significant10% 97.52 Significant30% 73.25 Significant50% 77.32 Significant
h
Cv
nMSE
MMt
2
0.01 Significance LevelT-critical = 4.17T > T-critical = Significant Variation, Reject Null Hypothesis
Zone of Inhibition (mm, S. epidermidis)
Zone of Inhibition (mm, E.coli)
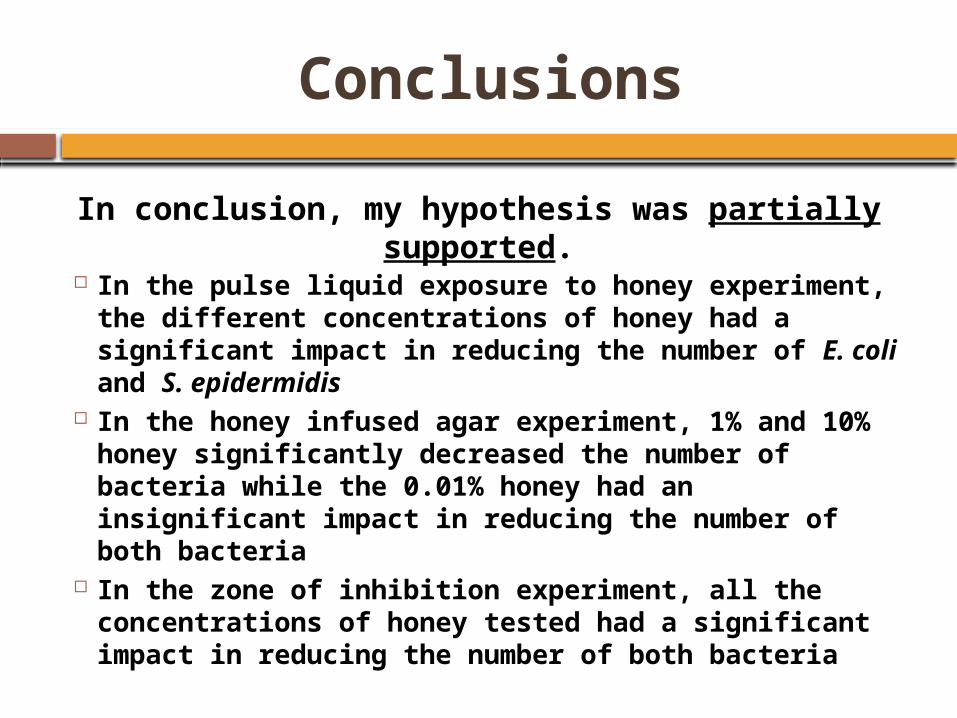
Conclusions
In the pulse liquid exposure to honey experiment, the different concentrations of honey had a significant impact in reducing the number of E. coli and S. epidermidis
In the honey infused agar experiment, 1% and 10% honey significantly decreased the number of bacteria while the 0.01% honey had an insignificant impact in reducing the number of both bacteria
In the zone of inhibition experiment, all the concentrations of honey tested had a significant impact in reducing the number of both bacteria
In conclusion, my hypothesis was partially supported.
Future Improvements/ Changes
Conduct more trials Test a greater variety of honey
concentrations

Future Extensions/ Experiments
Use a different method to determine the amount and type of bacteria present
Test different types of honey Test the effect of honey on its ability
to inhibit other types of bacteria Test the effect of sugar and salt on
their abilities to inhibit bacterial growth
Test the effects of honey on the bacteria over a greater period of time

![FREEPORT LNG TERMINAL · 2020. 5. 20. · FREEPORT LNG TERMINAL FREEPORT MARINE OPERATIONS MANUAL [04/15/20]2 FREEPORT LNG CONTACT INFORMATION TERMINAL OFFICES Freeport LNG Terminal](https://img.pdfslide.net/doc/110x75/606c9d1603f05e3bdb64da66/freeport-lng-terminal-2020-5-20-freeport-lng-terminal-freeport-marine-operations.jpg)