Embed Size (px)
Citation preview
Teaching Case
47
As a partner of the Ministry of Health, we now operate Haiti’s largest and newest public teaching hospital, with state of the art equipment. We knew this hospital could serve as a model of care delivery and training, but also wanted it to serve as a model of innovative financing. So with the Ministry, we took on the challenge of designing a financing strategy that would allow this public hospital to receive multiple funding streams to support its mission of providing high-quality care to all.
Dr Claire Pierre, Senior Manager of Health Financing Team
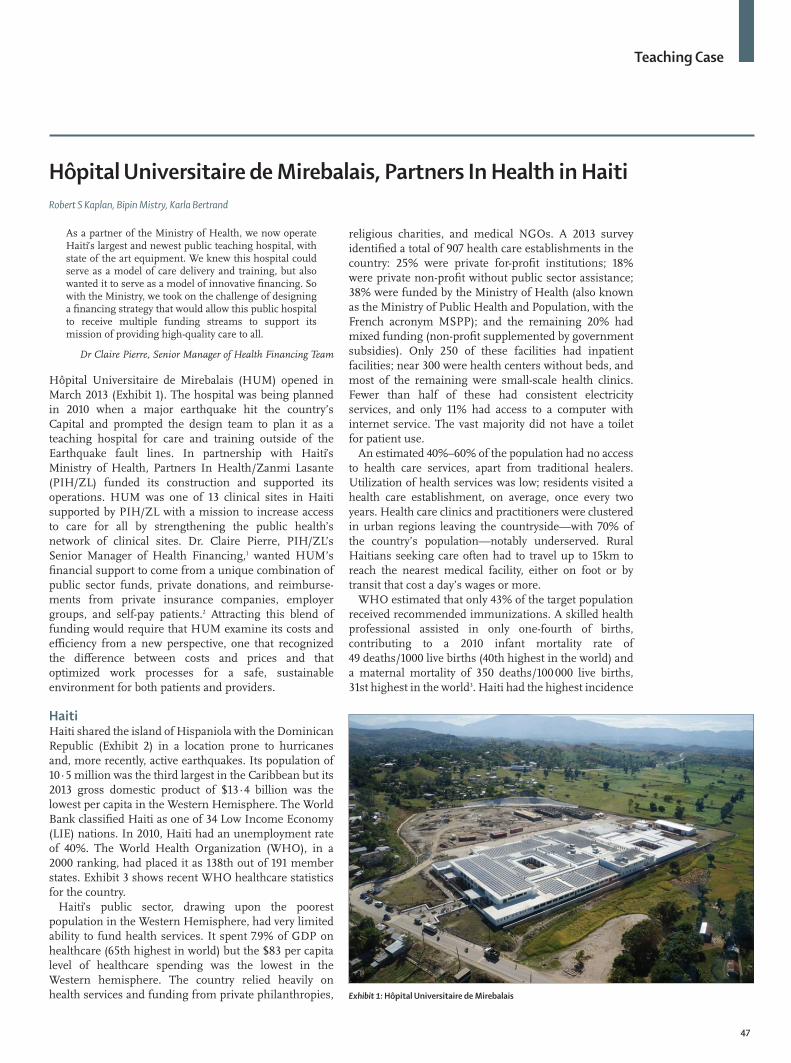
Hôpital Universitaire de Mirebalais (HUM) opened in March 2013 (Exhibit 1). The hospital was being planned in 2010 when a major earthquake hit the country’s Capital and prompted the design team to plan it as a teaching hospital for care and training outside of the Earthquake fault lines. In partnership with Haiti’s Ministry of Health, Partners In Health/Zanmi Lasante (PIH/ZL) funded its construction and supported its operations. HUM was one of 13 clinical sites in Haiti supported by PIH/ZL with a mission to increase access to care for all by strengthening the public health’s network of clinical sites. Dr. Claire Pierre, PIH/ZL’s Senior Manager of Health Financing,1 wanted HUM’s financial support to come from a unique combination of public sector funds, private donations, and reimburse-ments from private insurance companies, employer groups, and self-pay patients.2 Attracting this blend of funding would require that HUM examine its costs and efficiency from a new perspective, one that recognized the difference between costs and prices and that optimized work processes for a safe, sustainable environment for both patients and providers.
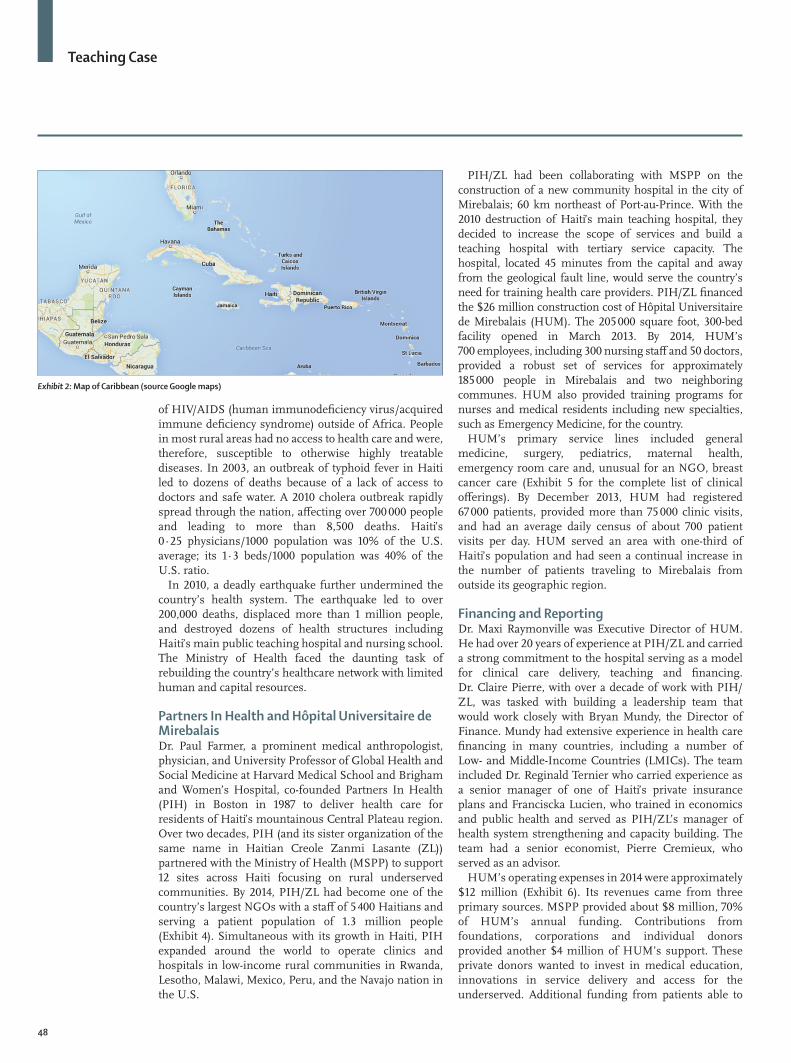
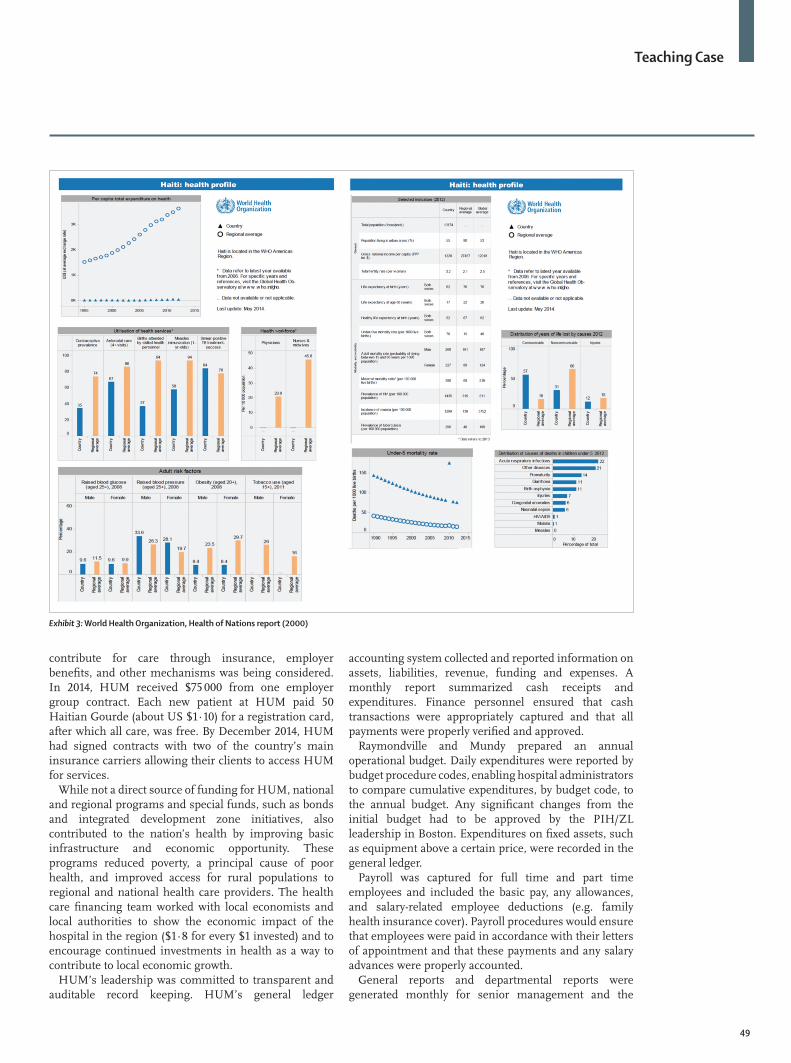
HaitiHaiti shared the island of Hispaniola with the Dominican Republic (Exhibit 2) in a location prone to hurricanes and, more recently, active earthquakes. Its population of 10·5 million was the third largest in the Caribbean but its 2013 gross domestic product of $13·4 billion was the lowest per capita in the Western Hemisphere. The World Bank classified Haiti as one of 34 Low Income Economy (LIE) nations. In 2010, Haiti had an unemployment rate of 40%. The World Health Organization (WHO), in a 2000 ranking, had placed it as 138th out of 191 member states. Exhibit 3 shows recent WHO healthcare statistics for the country.
Haiti’s public sector, drawing upon the poorest population in the Western Hemisphere, had very limited ability to fund health services. It spent 7.9% of GDP on healthcare (65th highest in world) but the $83 per capita level of healthcare spending was the lowest in the Western hemisphere. The country relied heavily on health services and funding from private philanthropies,
religious charities, and medical NGOs. A 2013 survey identified a total of 907 health care establishments in the country: 25% were private for-profit institutions; 18% were private non-profit without public sector assistance; 38% were funded by the Ministry of Health (also known as the Ministry of Public Health and Population, with the French acronym MSPP); and the remaining 20% had mixed funding (non-profit supplemented by government subsidies). Only 250 of these facilities had inpatient facilities; near 300 were health centers without beds, and most of the remaining were small-scale health clinics. Fewer than half of these had consistent electricity services, and only 11% had access to a computer with internet service. The vast majority did not have a toilet for patient use.
An estimated 40%–60% of the population had no access to health care services, apart from traditional healers. Utilization of health services was low; residents visited a health care establishment, on average, once every two years. Health care clinics and practitioners were clustered in urban regions leaving the countryside—with 70% of the country’s population—notably underserved. Rural Haitians seeking care often had to travel up to 15km to reach the nearest medical facility, either on foot or by transit that cost a day’s wages or more.
WHO estimated that only 43% of the target population received recommended immunizations. A skilled health professional assisted in only one-fourth of births, contributing to a 2010 infant mortality rate of 49 deaths/1000 live births (40th highest in the world) and a maternal mortality of 350 deaths/100 000 live births, 31st highest in the world3. Haiti had the highest incidence
Hôpital Universitaire de Mirebalais, Partners In Health in HaitiRobert S Kaplan, Bipin Mistry, Karla Bertrand
Exhibit 1: Hôpital Universitaire de Mirebalais
Teaching Case
48
of HIV/AIDS (human immunodeficiency virus/acquired immune deficiency syndrome) outside of Africa. People in most rural areas had no access to health care and were, therefore, susceptible to otherwise highly treatable diseases. In 2003, an outbreak of typhoid fever in Haiti led to dozens of deaths because of a lack of access to doctors and safe water. A 2010 cholera outbreak rapidly spread through the nation, affecting over 700 000 people and leading to more than 8,500 deaths. Haiti’s 0·25 physicians/1000 population was 10% of the U.S. average; its 1·3 beds/1000 population was 40% of the U.S. ratio.
In 2010, a deadly earthquake further undermined the country’s health system. The earthquake led to over 200,000 deaths, displaced more than 1 million people, and destroyed dozens of health structures including Haiti’s main public teaching hospital and nursing school. The Ministry of Health faced the daunting task of rebuilding the country’s healthcare network with limited human and capital resources.
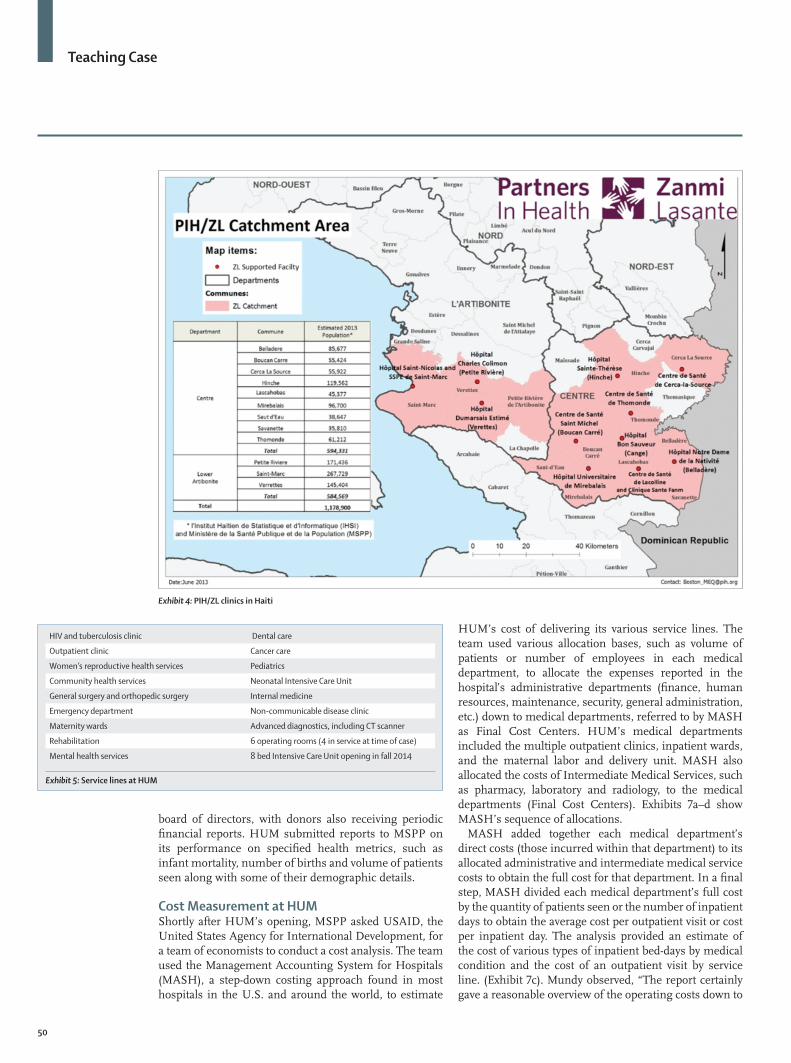
Partners In Health and Hôpital Universitaire de MirebalaisDr. Paul Farmer, a prominent medical anthropologist, physician, and University Professor of Global Health and Social Medicine at Harvard Medical School and Brigham and Women’s Hospital, co-founded Partners In Health (PIH) in Boston in 1987 to deliver health care for residents of Haiti’s mountainous Central Plateau region. Over two decades, PIH (and its sister organization of the same name in Haitian Creole Zanmi Lasante (ZL)) partnered with the Ministry of Health (MSPP) to support 12 sites across Haiti focusing on rural underserved communities. By 2014, PIH/ZL had become one of the country’s largest NGOs with a staff of 5 400 Haitians and serving a patient population of 1.3 million people (Exhibit 4). Simultaneous with its growth in Haiti, PIH expanded around the world to operate clinics and hospitals in low-income rural communities in Rwanda, Lesotho, Malawi, Mexico, Peru, and the Navajo nation in the U.S.
PIH/ZL had been collaborating with MSPP on the construction of a new community hospital in the city of Mirebalais; 60 km northeast of Port-au-Prince. With the 2010 destruction of Haiti’s main teaching hospital, they decided to increase the scope of services and build a teaching hospital with tertiary service capacity. The hospital, located 45 minutes from the capital and away from the geological fault line, would serve the country’s need for training health care providers. PIH/ZL financed the $26 million construction cost of Hôpital Universitaire de Mirebalais (HUM). The 205 000 square foot, 300-bed facility opened in March 2013. By 2014, HUM’s 700 employees, including 300 nursing staff and 50 doctors, provided a robust set of services for approximately 185 000 people in Mirebalais and two neighboring communes. HUM also provided training programs for nurses and medical residents including new specialties, such as Emergency Medicine, for the country.
HUM’s primary service lines included general medicine, surgery, pediatrics, maternal health, emergency room care and, unusual for an NGO, breast cancer care (Exhibit 5 for the complete list of clinical offerings). By December 2013, HUM had registered 67 000 patients, provided more than 75 000 clinic visits, and had an average daily census of about 700 patient visits per day. HUM served an area with one-third of Haiti’s population and had seen a continual increase in the number of patients traveling to Mirebalais from outside its geographic region.
Financing and ReportingDr. Maxi Raymonville was Executive Director of HUM. He had over 20 years of experience at PIH/ZL and carried a strong commitment to the hospital serving as a model for clinical care delivery, teaching and financing. Dr. Claire Pierre, with over a decade of work with PIH/ZL, was tasked with building a leadership team that would work closely with Bryan Mundy, the Director of Finance. Mundy had extensive experience in health care financing in many countries, including a number of Low- and Middle-Income Countries (LMICs). The team included Dr. Reginald Ternier who carried experience as a senior manager of one of Haiti’s private insurance plans and Franciscka Lucien, who trained in economics and public health and served as PIH/ZL’s manager of health system strengthening and capacity building. The team had a senior economist, Pierre Cremieux, who served as an advisor.
HUM’s operating expenses in 2014 were approximately $12 million (Exhibit 6). Its revenues came from three primary sources. MSPP provided about $8 million, 70% of HUM’s annual funding. Contributions from foundations, corporations and individual donors provided another $4 million of HUM’s support. These private donors wanted to invest in medical education, innovations in service delivery and access for the underserved. Additional funding from patients able to
Exhibit 2: Map of Caribbean (source Google maps)
Teaching Case
49
contribute for care through insurance, employer benefits, and other mechanisms was being considered. In 2014, HUM received $75 000 from one employer group contract. Each new patient at HUM paid 50 Haitian Gourde (about US $1·10) for a registration card, after which all care, was free. By December 2014, HUM had signed contracts with two of the country’s main insurance carriers allowing their clients to access HUM for services.
While not a direct source of funding for HUM, national and regional programs and special funds, such as bonds and integrated development zone initiatives, also contributed to the nation’s health by improving basic infrastructure and economic opportunity. These programs reduced poverty, a principal cause of poor health, and improved access for rural populations to regional and national health care providers. The health care financing team worked with local economists and local authorities to show the economic impact of the hospital in the region ($1·8 for every $1 invested) and to encourage continued investments in health as a way to contribute to local economic growth.
HUM’s leadership was committed to transparent and auditable record keeping. HUM’s general ledger
accounting system collected and reported information on assets, liabilities, revenue, funding and expenses. A monthly report summarized cash receipts and expenditures. Finance personnel ensured that cash transactions were appropriately captured and that all payments were properly verified and approved.
Raymondville and Mundy prepared an annual operational budget. Daily expenditures were reported by budget procedure codes, enabling hospital administrators to compare cumulative expenditures, by budget code, to the annual budget. Any significant changes from the initial budget had to be approved by the PIH/ZL leadership in Boston. Expenditures on fixed assets, such as equipment above a certain price, were recorded in the general ledger.
Payroll was captured for full time and part time employees and included the basic pay, any allowances, and salary-related employee deductions (e.g. family health insurance cover). Payroll procedures would ensure that employees were paid in accordance with their letters of appointment and that these payments and any salary advances were properly accounted.
General reports and departmental reports were generated monthly for senior management and the
Exhibit 3: World Health Organization, Health of Nations report (2000)
Teaching Case
50
board of directors, with donors also receiving periodic financial reports. HUM submitted reports to MSPP on its performance on specified health metrics, such as infant mortality, number of births and volume of patients seen along with some of their demographic details.
Cost Measurement at HUMShortly after HUM’s opening, MSPP asked USAID, the United States Agency for International Development, for a team of economists to conduct a cost analysis. The team used the Management Accounting System for Hospitals (MASH), a step-down costing approach found in most hospitals in the U.S. and around the world, to estimate
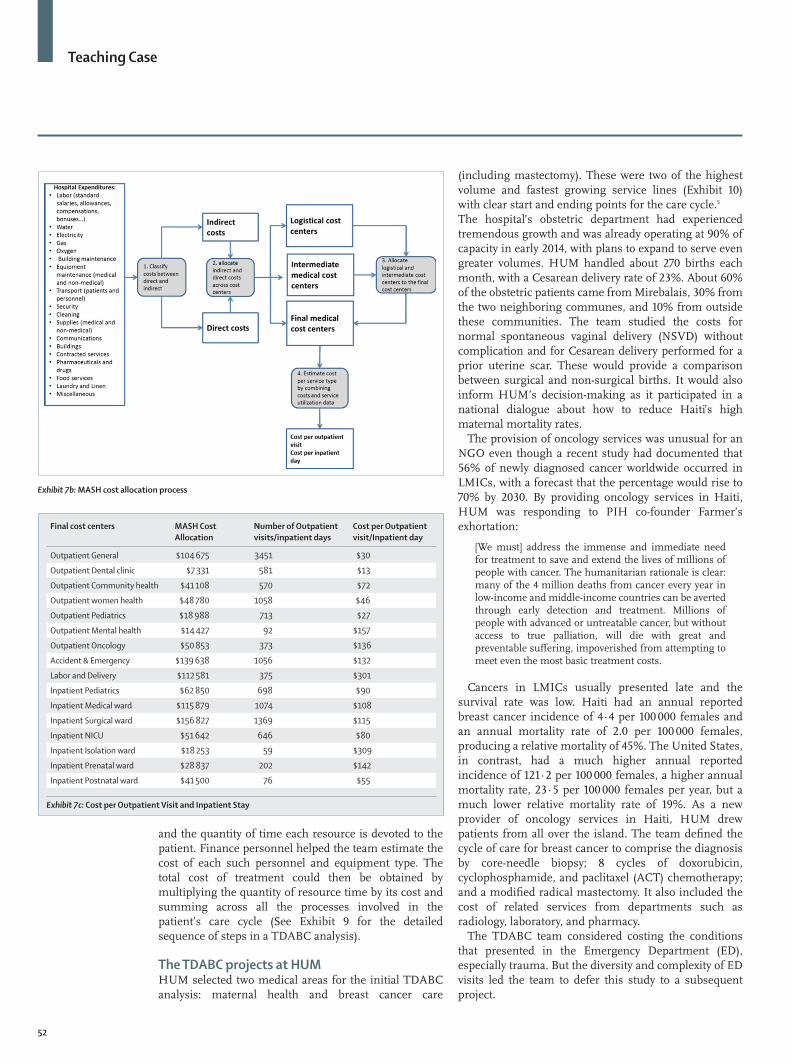
HUM’s cost of delivering its various service lines. The team used various allocation bases, such as volume of patients or number of employees in each medical department, to allocate the expenses reported in the hospital’s administrative departments (finance, human resources, maintenance, security, general administration, etc.) down to medical departments, referred to by MASH as Final Cost Centers. HUM’s medical departments included the multiple outpatient clinics, inpatient wards, and the maternal labor and delivery unit. MASH also allocated the costs of Intermediate Medical Services, such as pharmacy, laboratory and radiology, to the medical departments (Final Cost Centers). Exhibits 7a–d show MASH’s sequence of allocations.
MASH added together each medical department’s direct costs (those incurred within that department) to its allocated administrative and intermediate medical service costs to obtain the full cost for that department. In a final step, MASH divided each medical department’s full cost by the quantity of patients seen or the number of inpatient days to obtain the average cost per outpatient visit or cost per inpatient day. The analysis provided an estimate of the cost of various types of inpatient bed-days by medical condition and the cost of an outpatient visit by service line. (Exhibit 7c). Mundy observed, “The report certainly gave a reasonable overview of the operating costs down to
Exhibit 4: PIH/ZL clinics in Haiti
HIV and tuberculosis clinic Dental care
Outpatient clinic Cancer care
Women’s reproductive health services Pediatrics
Community health services Neonatal Intensive Care Unit
General surgery and orthopedic surgery Internal medicine
Emergency department Non-communicable disease clinic
Maternity wards Advanced diagnostics, including CT scanner
Rehabilitation 6 operating rooms (4 in service at time of case)
Mental health services 8 bed Intensive Care Unit opening in fall 2014
Exhibit 5: Service lines at HUM
Teaching Case
51
departmental levels. It was not, however, very accurate about the costs per outpatient visit or inpatient day.”
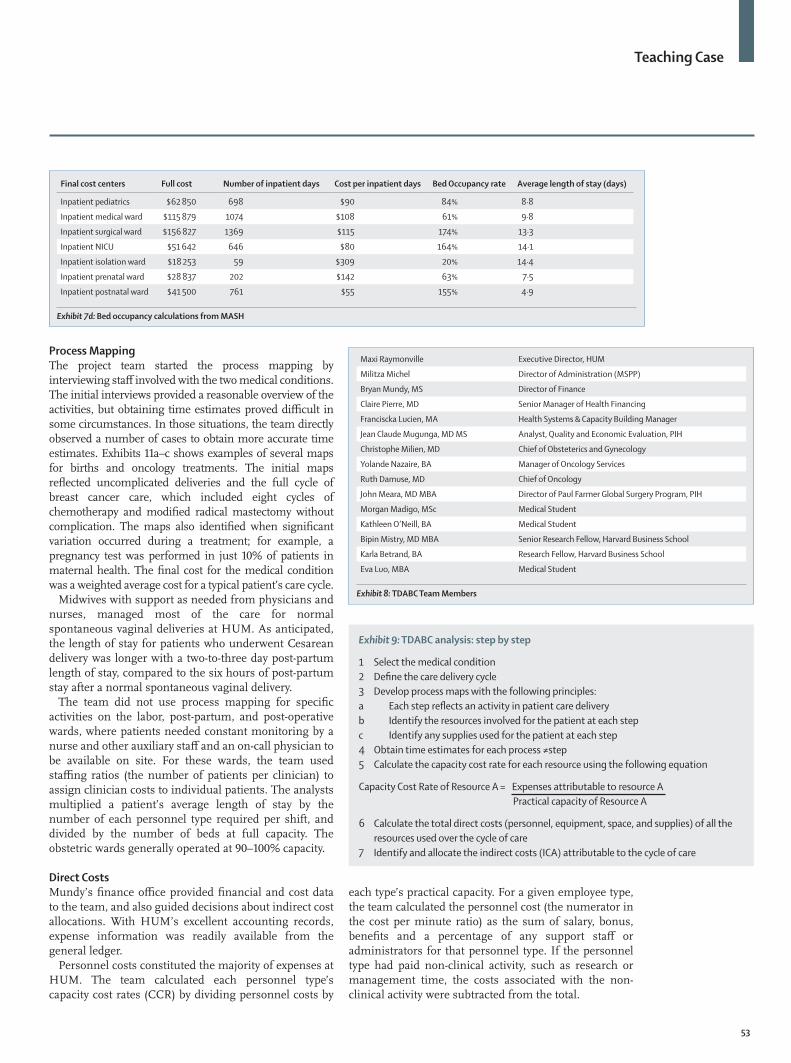
The consultant’s report acknowledged the limitations of only having one month of data in a period shortly after the hospital had opened. Other issues were also evident. Mundy commented that the surgical ward was reported to have a bed occupancy rate of 174%, most likely the result of including many patients undergoing day procedures (such as endoscopy) in the patient volume counts despite their short stays on the ward (Exhibit 7d). He cited the estimated cost of a neonatal intensive care bed being lower than a regular pediatric bed as another anomalous result.
Time-Driven Activity Based Costing (TDABC)Dr. John Meara, Chair of the Department of Plastic and Oral Surgery (DPOS) at Boston Children’s Hospital, had directed the Program in Global Surgery and Social Change (PGSSC) in collaboration with Partners In Health since 2008 and volunteered for PIH in Haiti. He had recently collaborated with a costing team at the Harvard Business School (HBS) to apply a new costing approach for his clinical department. Meara saw how more accurate costing, at the medical condition level, helped him redesign care delivery and also provided him with valid information for negotiating new reimbursement approaches that would link payments to the delivery of better outcomes at lower costs for patients.
Meara and the HBS costing team approached Dr. Pierre about doing a similar costing project for the newly-opened HUM facility. Pierre readily accepted the offer and helped to recruit a diversified project team to conduct the cost analysis (See Exhibit 8 for project team membership). Francisca Lucien, Health Systems and Capacity Building Manager, became the HUM project leader. Lucien had been extensively involved in the planning and operational design of the hospital. She was joined by three medical students, Morgan Mandigo and Katherine O’Neill, from PGSSC, and Eva Luo, an MD/MBA student at HBS and Jean Claude Mugunga, analyst in the Quality and Economic Evaluation team (PIH).
The project applied time-driven activity-based costing (TDABC) to calculate costs at the medical condition level of analysis. TDABC was a bottoms-up costing approach that built upon inputs from clinical and financial personnel. The HBS cost team had been helping many medical centers in the U.S. implement TDABC to achieve two objectives: stimulate process improvement that would produce substantial cost savings while maintaining clinical quality; and serve as a basis for developing bundled payments that reimbursed providers for delivering high-quality care for specific medical conditions.4
TDABC started by documenting the actual clinical and administrative processes used over a complete cycle of care for treating patients with specific medical conditions. For each process, the project team identified the resources used—personnel, equipment, and supplies—
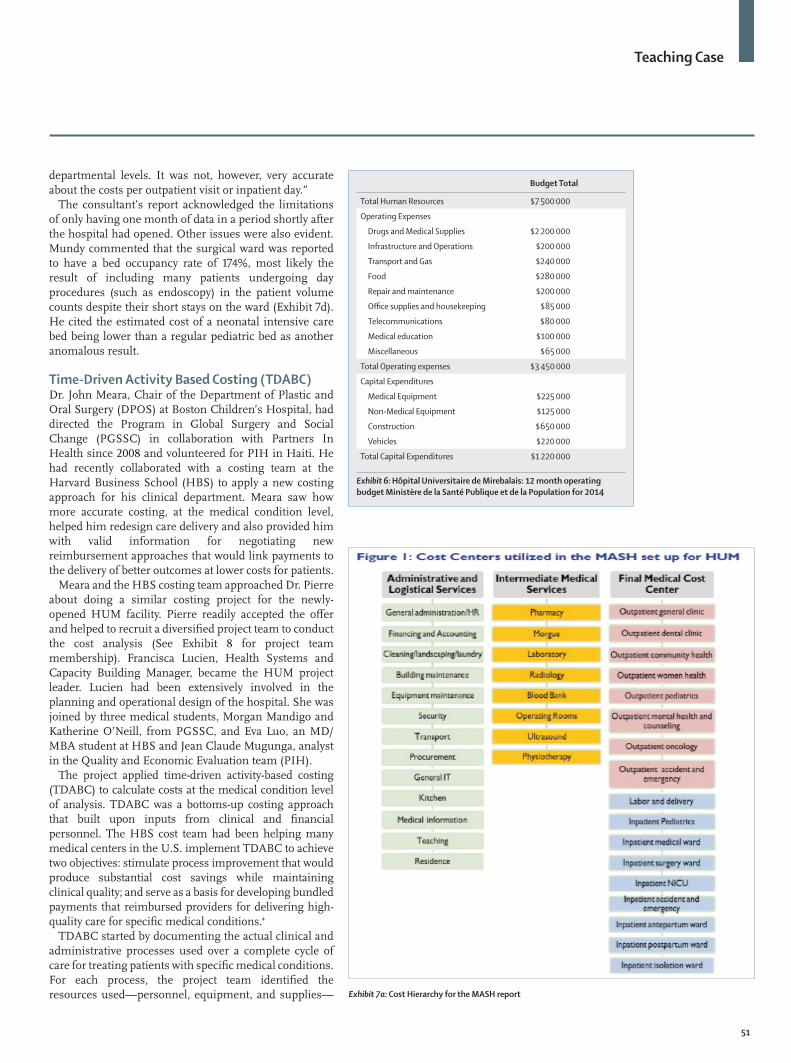
Budget Total
Total Human Resources $7 500 000
Operating Expenses
Drugs and Medical Supplies $2 200 000
Infrastructure and Operations $200 000
Transport and Gas $240 000
Food $280 000
Repair and maintenance $200 000
Office supplies and housekeeping $85 000
Telecommunications $80 000
Medical education $100 000
Miscellaneous $65 000
Total Operating expenses $3 450 000
Capital Expenditures
Medical Equipment $225 000
Non-Medical Equipment $125 000
Construction $650 000
Vehicles $220 000
Total Capital Expenditures $1 220 000
Exhibit 6: Hôpital Universitaire de Mirebalais: 12 month operating budget Ministère de la Santé Publique et de la Population for 2014
Exhibit 7a: Cost Hierarchy for the MASH report
Teaching Case
52
and the quantity of time each resource is devoted to the patient. Finance personnel helped the team estimate the cost of each such personnel and equipment type. The total cost of treatment could then be obtained by multiplying the quantity of resource time by its cost and summing across all the processes involved in the patient’s care cycle (See Exhibit 9 for the detailed sequence of steps in a TDABC analysis).
The TDABC projects at HUMHUM selected two medical areas for the initial TDABC analysis: maternal health and breast cancer care
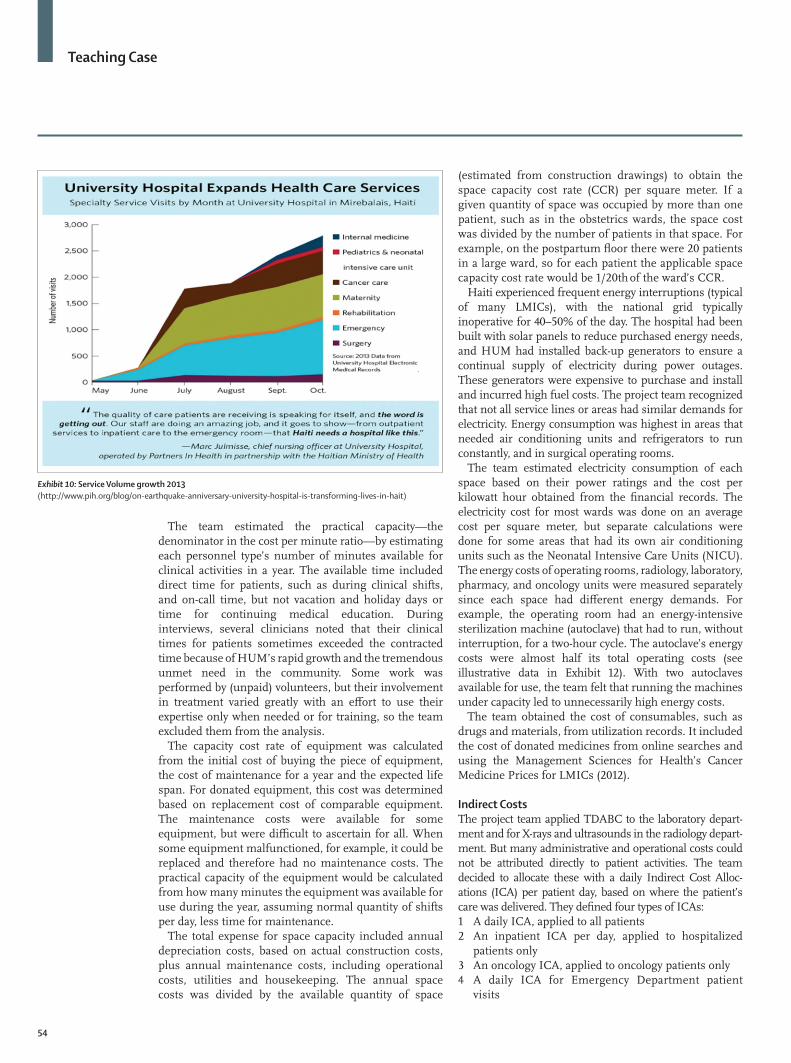
(including mastectomy). These were two of the highest volume and fastest growing service lines (Exhibit 10) with clear start and ending points for the care cycle.5
The hospital’s obstetric department had experienced tremendous growth and was already operating at 90% of capacity in early 2014, with plans to expand to serve even greater volumes. HUM handled about 270 births each month, with a Cesarean delivery rate of 23%. About 60% of the obstetric patients came from Mirebalais, 30% from the two neighboring communes, and 10% from outside these communities. The team studied the costs for normal spontaneous vaginal delivery (NSVD) without complication and for Cesarean delivery performed for a prior uterine scar. These would provide a comparison between surgical and non-surgical births. It would also inform HUM’s decision-making as it participated in a national dialogue about how to reduce Haiti’s high maternal mortality rates.
The provision of oncology services was unusual for an NGO even though a recent study had documented that 56% of newly diagnosed cancer worldwide occurred in LMICs, with a forecast that the percentage would rise to 70% by 2030. By providing oncology services in Haiti, HUM was responding to PIH co-founder Farmer’s exhortation:
[We must] address the immense and immediate need for treatment to save and extend the lives of millions of people with cancer. The humanitarian rationale is clear: many of the 4 million deaths from cancer every year in low-income and middle-income countries can be averted through early detection and treatment. Millions of people with advanced or untreatable cancer, but without access to true palliation, will die with great and preventable suffering, impoverished from attempting to meet even the most basic treatment costs.
Cancers in LMICs usually presented late and the survival rate was low. Haiti had an annual reported breast cancer incidence of 4·4 per 100 000 females and an annual mortality rate of 2.0 per 100 000 females, producing a relative mortality of 45%. The United States, in contrast, had a much higher annual reported incidence of 121·2 per 100 000 females, a higher annual mortality rate, 23·5 per 100 000 females per year, but a much lower relative mortality rate of 19%. As a new provider of oncology services in Haiti, HUM drew patients from all over the island. The team defined the cycle of care for breast cancer to comprise the diagnosis by core-needle biopsy; 8 cycles of doxorubicin, cyclophosphamide, and paclitaxel (ACT) chemotherapy; and a modified radical mastectomy. It also included the cost of related services from departments such as radiology, laboratory, and pharmacy.
The TDABC team considered costing the conditions that presented in the Emergency Department (ED), especially trauma. But the diversity and complexity of ED visits led the team to defer this study to a subsequent project.
Exhibit 7b: MASH cost allocation process
Final cost centers MASH Cost Allocation
Number of Outpatient visits/inpatient days
Cost per Outpatient visit/Inpatient day
Outpatient General $104 675 3451 $30
Outpatient Dental clinic $7 331 581 $13
Outpatient Community health $41 108 570 $72
Outpatient women health $48 780 1058 $46
Outpatient Pediatrics $18 988 713 $27
Outpatient Mental health $14 427 92 $157
Outpatient Oncology $50 853 373 $136
Accident & Emergency $139 638 1056 $132
Labor and Delivery $112 581 375 $301
Inpatient Pediatrics $62 850 698 $90
Inpatient Medical ward $115 879 1074 $108
Inpatient Surgical ward $156 827 1369 $115
Inpatient NICU $51 642 646 $80
Inpatient Isolation ward $18 253 59 $309
Inpatient Prenatal ward $28 837 202 $142
Inpatient Postnatal ward $41 500 76 $55
Exhibit 7c: Cost per Outpatient Visit and Inpatient Stay
Teaching Case
53
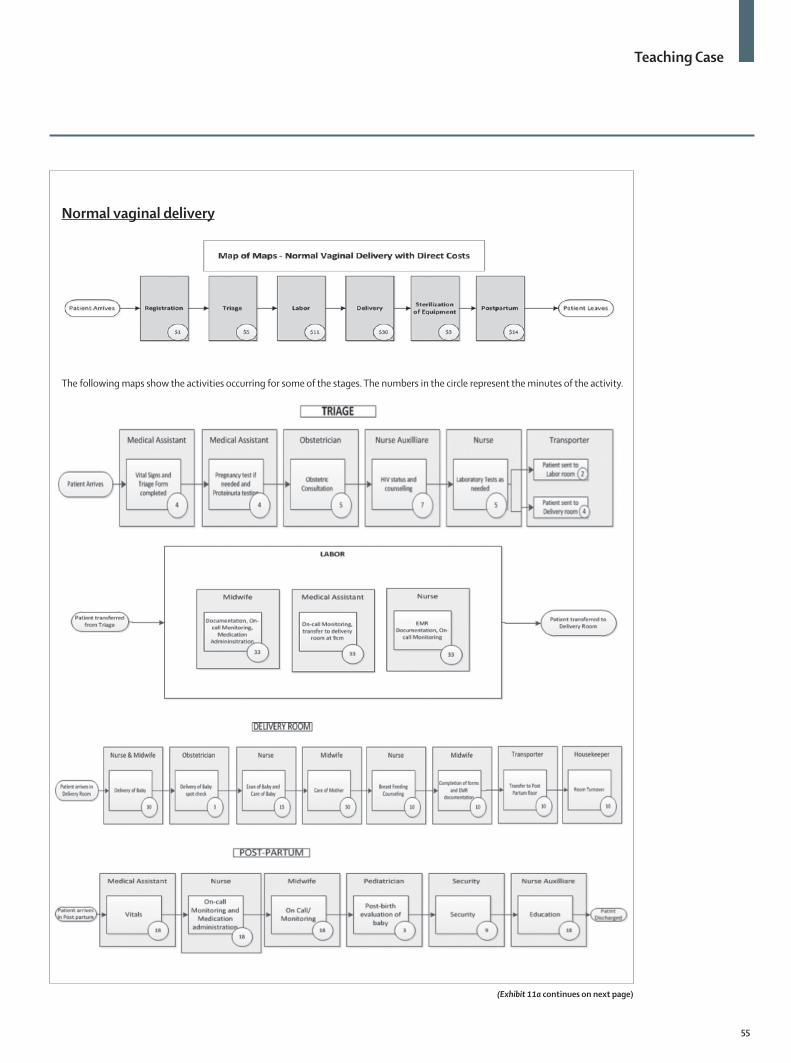
Process MappingThe project team started the process mapping by interviewing staff involved with the two medical conditions. The initial interviews provided a reasonable overview of the activities, but obtaining time estimates proved difficult in some circumstances. In those situations, the team directly observed a number of cases to obtain more accurate time estimates. Exhibits 11a–c shows examples of several maps for births and oncology treatments. The initial maps reflected uncomplicated deliveries and the full cycle of breast cancer care, which included eight cycles of chemotherapy and modified radical mastectomy without complication. The maps also identified when significant variation occurred during a treatment; for example, a pregnancy test was performed in just 10% of patients in maternal health. The final cost for the medical condition was a weighted average cost for a typical patient’s care cycle.
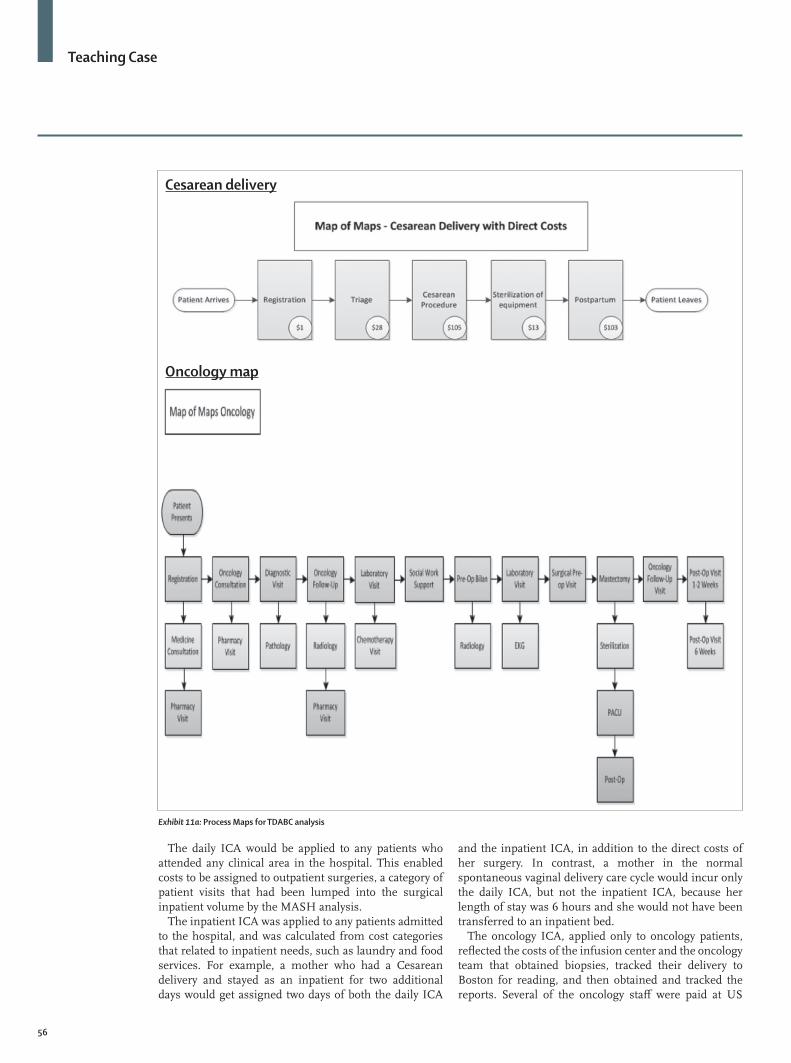
Midwives with support as needed from physicians and nurses, managed most of the care for normal spontaneous vaginal deliveries at HUM. As anticipated, the length of stay for patients who underwent Cesarean delivery was longer with a two-to-three day post-partum length of stay, compared to the six hours of post-partum stay after a normal spontaneous vaginal delivery.
The team did not use process mapping for specific activities on the labor, post-partum, and post-operative wards, where patients needed constant monitoring by a nurse and other auxiliary staff and an on-call physician to be available on site. For these wards, the team used staffing ratios (the number of patients per clinician) to assign clinician costs to individual patients. The analysts multiplied a patient’s average length of stay by the number of each personnel type required per shift, and divided by the number of beds at full capacity. The obstetric wards generally operated at 90–100% capacity.
Direct CostsMundy’s finance office provided financial and cost data to the team, and also guided decisions about indirect cost allocations. With HUM’s excellent accounting records, expense information was readily available from the general ledger.
Personnel costs constituted the majority of expenses at HUM. The team calculated each personnel type’s capacity cost rates (CCR) by dividing personnel costs by
each type’s practical capacity. For a given employee type, the team calculated the personnel cost (the numerator in the cost per minute ratio) as the sum of salary, bonus, benefits and a percentage of any support staff or administrators for that personnel type. If the personnel type had paid non-clinical activity, such as research or management time, the costs associated with the non-clinical activity were subtracted from the total.
Exhibit 9: TDABC analysis: step by step
1 Select the medical condition2 Define the care delivery cycle3 Develop process maps with the following principles:a Each step reflects an activity in patient care deliveryb Identify the resources involved for the patient at each stepc Identify any supplies used for the patient at each step4 Obtain time estimates for each process ≠step5 Calculate the capacity cost rate for each resource using the following equation
Capacity Cost Rate of Resource A = Expenses attributable to resource A Practical capacity of Resource A
6 Calculate the total direct costs (personnel, equipment, space, and supplies) of all the resources used over the cycle of care
7 Identify and allocate the indirect costs (ICA) attributable to the cycle of care
Final cost centers Full cost Number of inpatient days Cost per inpatient days Bed Occupancy rate Average length of stay (days)
Inpatient pediatrics $62 850 698 $90 84% 8·8
Inpatient medical ward $115 879 1074 $108 61% 9·8
Inpatient surgical ward $156 827 1369 $115 174% 13·3
Inpatient NICU $51 642 646 $80 164% 14·1
Inpatient isolation ward $18 253 59 $309 20% 14·4
Inpatient prenatal ward $28 837 202 $142 63% 7·5
Inpatient postnatal ward $41 500 761 $55 155% 4·9
Exhibit 7d: Bed occupancy calculations from MASH
Maxi Raymonville Executive Director, HUM
Militza Michel Director of Administration (MSPP)
Bryan Mundy, MS Director of Finance
Claire Pierre, MD Senior Manager of Health Financing
Franciscka Lucien, MA Health Systems & Capacity Building Manager
Jean Claude Mugunga, MD MS Analyst, Quality and Economic Evaluation, PIH
Christophe Milien, MD Chief of Obsteterics and Gynecology
Yolande Nazaire, BA Manager of Oncology Services
Ruth Damuse, MD Chief of Oncology
John Meara, MD MBA Director of Paul Farmer Global Surgery Program, PIH
Morgan Madigo, MSc Medical Student
Kathleen O’Neill, BA Medical Student
Bipin Mistry, MD MBA Senior Research Fellow, Harvard Business School
Karla Betrand, BA Research Fellow, Harvard Business School
Eva Luo, MBA Medical Student
Exhibit 8: TDABC Team Members
Teaching Case
54
The team estimated the practical capacity—the denominator in the cost per minute ratio—by estimating each personnel type’s number of minutes available for clinical activities in a year. The available time included direct time for patients, such as during clinical shifts, and on-call time, but not vacation and holiday days or time for continuing medical education. During interviews, several clinicians noted that their clinical times for patients sometimes exceeded the contracted time because of HUM’s rapid growth and the tremendous unmet need in the community. Some work was performed by (unpaid) volunteers, but their involvement in treatment varied greatly with an effort to use their expertise only when needed or for training, so the team excluded them from the analysis.
The capacity cost rate of equipment was calculated from the initial cost of buying the piece of equipment, the cost of maintenance for a year and the expected life span. For donated equipment, this cost was determined based on replacement cost of comparable equipment. The maintenance costs were available for some equipment, but were difficult to ascertain for all. When some equipment malfunctioned, for example, it could be replaced and therefore had no maintenance costs. The practical capacity of the equipment would be calculated from how many minutes the equipment was available for use during the year, assuming normal quantity of shifts per day, less time for maintenance.
The total expense for space capacity included annual depreciation costs, based on actual construction costs, plus annual maintenance costs, including operational costs, utilities and housekeeping. The annual space costs was divided by the available quantity of space
(estimated from construction drawings) to obtain the space capacity cost rate (CCR) per square meter. If a given quantity of space was occupied by more than one patient, such as in the obstetrics wards, the space cost was divided by the number of patients in that space. For example, on the postpartum floor there were 20 patients in a large ward, so for each patient the applicable space capacity cost rate would be 1/20th of the ward’s CCR.
Haiti experienced frequent energy interruptions (typical of many LMICs), with the national grid typically inoperative for 40–50% of the day. The hospital had been built with solar panels to reduce purchased energy needs, and HUM had installed back-up generators to ensure a continual supply of electricity during power outages. These generators were expensive to purchase and install and incurred high fuel costs. The project team recognized that not all service lines or areas had similar demands for electricity. Energy consumption was highest in areas that needed air conditioning units and refrigerators to run constantly, and in surgical operating rooms.
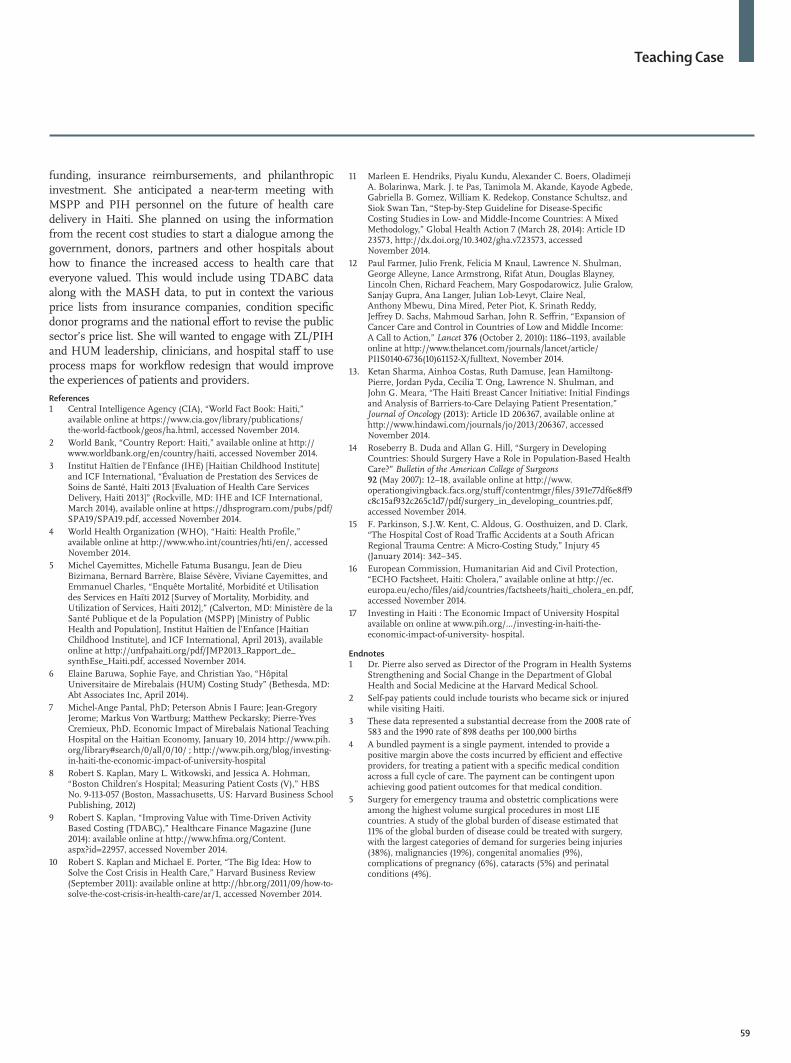
The team estimated electricity consumption of each space based on their power ratings and the cost per kilowatt hour obtained from the financial records. The electricity cost for most wards was done on an average cost per square meter, but separate calculations were done for some areas that had its own air conditioning units such as the Neonatal Intensive Care Units (NICU). The energy costs of operating rooms, radiology, laboratory, pharmacy, and oncology units were measured separately since each space had different energy demands. For example, the operating room had an energy-intensive sterilization machine (autoclave) that had to run, without interruption, for a two-hour cycle. The autoclave’s energy costs were almost half its total operating costs (see illustrative data in Exhibit 12). With two autoclaves available for use, the team felt that running the machines under capacity led to unnecessarily high energy costs.
The team obtained the cost of consumables, such as drugs and materials, from utilization records. It included the cost of donated medicines from online searches and using the Management Sciences for Health’s Cancer Medicine Prices for LMICs (2012).
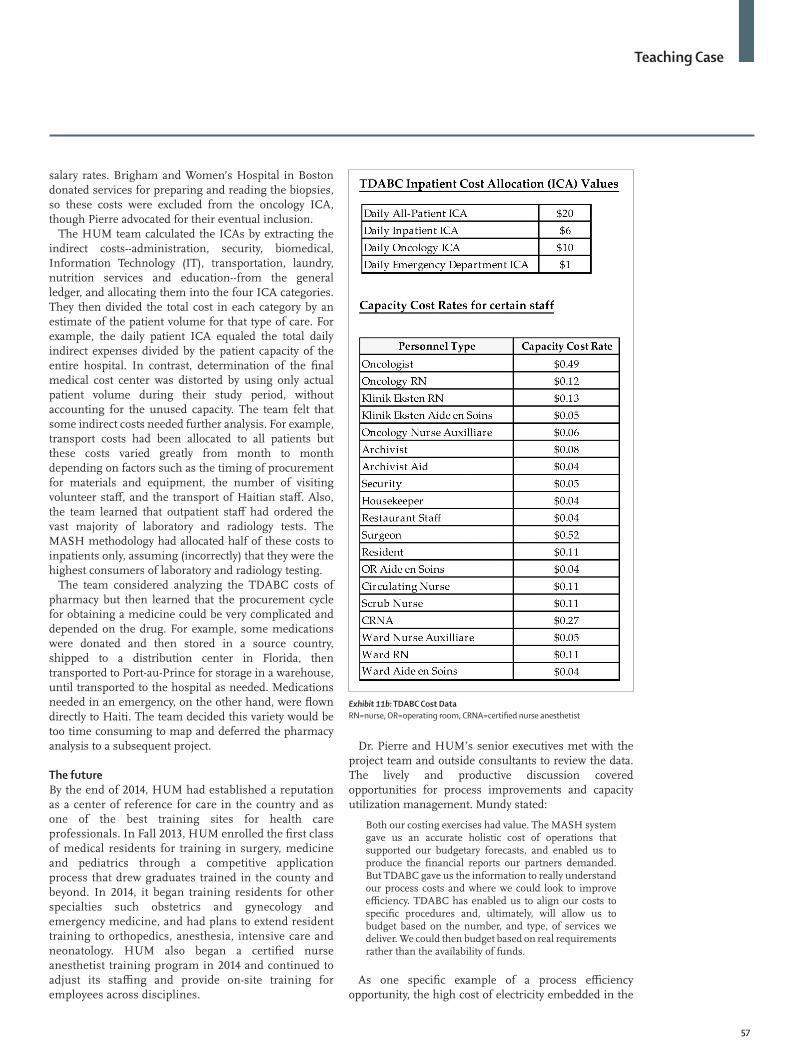
Indirect CostsThe project team applied TDABC to the laboratory depart-ment and for X-rays and ultrasounds in the radiology depart-ment. But many administrative and operational costs could not be attributed directly to patient activities. The team decided to allocate these with a daily Indirect Cost Alloc-ations (ICA) per patient day, based on where the patient’s care was delivered. They defined four types of ICAs: 1 A daily ICA, applied to all patients2 An inpatient ICA per day, applied to hospitalized
patients only3 An oncology ICA, applied to oncology patients only4 A daily ICA for Emergency Department patient
visits
Exhibit 10: Service Volume growth 2013(http://www.pih.org/blog/on-earthquake-anniversary-university-hospital-is-transforming-lives-in-hait)
Teaching Case
55
The following maps show the activities occurring for some of the stages. The numbers in the circle represent the minutes of the activity.
Normal vaginal delivery
(Exhibit 11a continues on next page)
Teaching Case
56
The daily ICA would be applied to any patients who attended any clinical area in the hospital. This enabled costs to be assigned to outpatient surgeries, a category of patient visits that had been lumped into the surgical inpatient volume by the MASH analysis.
The inpatient ICA was applied to any patients admitted to the hospital, and was calculated from cost categories that related to inpatient needs, such as laundry and food services. For example, a mother who had a Cesarean delivery and stayed as an inpatient for two additional days would get assigned two days of both the daily ICA
and the inpatient ICA, in addition to the direct costs of her surgery. In contrast, a mother in the normal spontaneous vaginal delivery care cycle would incur only the daily ICA, but not the inpatient ICA, because her length of stay was 6 hours and she would not have been transferred to an inpatient bed.
The oncology ICA, applied only to oncology patients, reflected the costs of the infusion center and the oncology team that obtained biopsies, tracked their delivery to Boston for reading, and then obtained and tracked the reports. Several of the oncology staff were paid at US
Exhibit 11a: Process Maps for TDABC analysis
Cesarean delivery
Oncology map
Teaching Case
57
salary rates. Brigham and Women’s Hospital in Boston donated services for preparing and reading the biopsies, so these costs were excluded from the oncology ICA, though Pierre advocated for their eventual inclusion.
The HUM team calculated the ICAs by extracting the indirect costs--administration, security, biomedical, Information Technology (IT), transportation, laundry, nutrition services and education--from the general ledger, and allocating them into the four ICA categories. They then divided the total cost in each category by an estimate of the patient volume for that type of care. For example, the daily patient ICA equaled the total daily indirect expenses divided by the patient capacity of the entire hospital. In contrast, determination of the final medical cost center was distorted by using only actual patient volume during their study period, without accounting for the unused capacity. The team felt that some indirect costs needed further analysis. For example, transport costs had been allocated to all patients but these costs varied greatly from month to month depending on factors such as the timing of procurement for materials and equipment, the number of visiting volunteer staff, and the transport of Haitian staff. Also, the team learned that outpatient staff had ordered the vast majority of laboratory and radiology tests. The MASH methodology had allocated half of these costs to inpatients only, assuming (incorrectly) that they were the highest consumers of laboratory and radiology testing.
The team considered analyzing the TDABC costs of pharmacy but then learned that the procurement cycle for obtaining a medicine could be very complicated and depended on the drug. For example, some medications were donated and then stored in a source country, shipped to a distribution center in Florida, then transported to Port-au-Prince for storage in a warehouse, until transported to the hospital as needed. Medications needed in an emergency, on the other hand, were flown directly to Haiti. The team decided this variety would be too time consuming to map and deferred the pharmacy analysis to a subsequent project.
The futureBy the end of 2014, HUM had established a reputation as a center of reference for care in the country and as one of the best training sites for health care professionals. In Fall 2013, HUM enrolled the first class of medical residents for training in surgery, medicine and pediatrics through a competitive application process that drew graduates trained in the county and beyond. In 2014, it began training residents for other specialties such obstetrics and gynecology and emergency medicine, and had plans to extend resident training to orthopedics, anesthesia, intensive care and neonatology. HUM also began a certified nurse anesthetist training program in 2014 and continued to adjust its staffing and provide on-site training for employees across disciplines.
Dr. Pierre and HUM’s senior executives met with the project team and outside consultants to review the data. The lively and productive discussion covered opportunities for process improvements and capacity utilization management. Mundy stated:
Both our costing exercises had value. The MASH system gave us an accurate holistic cost of operations that supported our budgetary forecasts, and enabled us to produce the financial reports our partners demanded. But TDABC gave us the information to really understand our process costs and where we could look to improve efficiency. TDABC has enabled us to align our costs to specific procedures and, ultimately, will allow us to budget based on the number, and type, of services we deliver. We could then budget based on real requirements rather than the availability of funds.
As one specific example of a process efficiency opportunity, the high cost of electricity embedded in the
Exhibit 11b: TDABC Cost DataRN=nurse, OR=operating room, CRNA=certified nurse anesthetist
Teaching Case
58
cost of certain clinical services allowed PIH/ZL to justify more use of solar panels as a low-cost source of electricity.
The team was particularly interested in applying TDABC to other medical conditions in the hospital and to community health centers around the country. PIH/ZL had historically trained and located community-based health workers who referred patients for nearby care as needed. But in HUM’s first year of operations, patients from all over the country had traveled long distances to reach the facility. The team therefore wanted to explore how TDABC could help estimate the cost of accessing care from the patient’s perspective. PIH/ZL had long advocated for community based care and primary care linked to secondary and tertiary care for safety. With TDABC, the team hopes to have financial impact data that could be used to design the proper mix of community-based and tertiary care with the goals of increasing access, improving utilization, and lowering the total costs of operating a national health care system.
Armed with this information, along with the USAID report, Dr. Pierre and her executive team refined the targets for each of HUM’s primary revenue streams: government
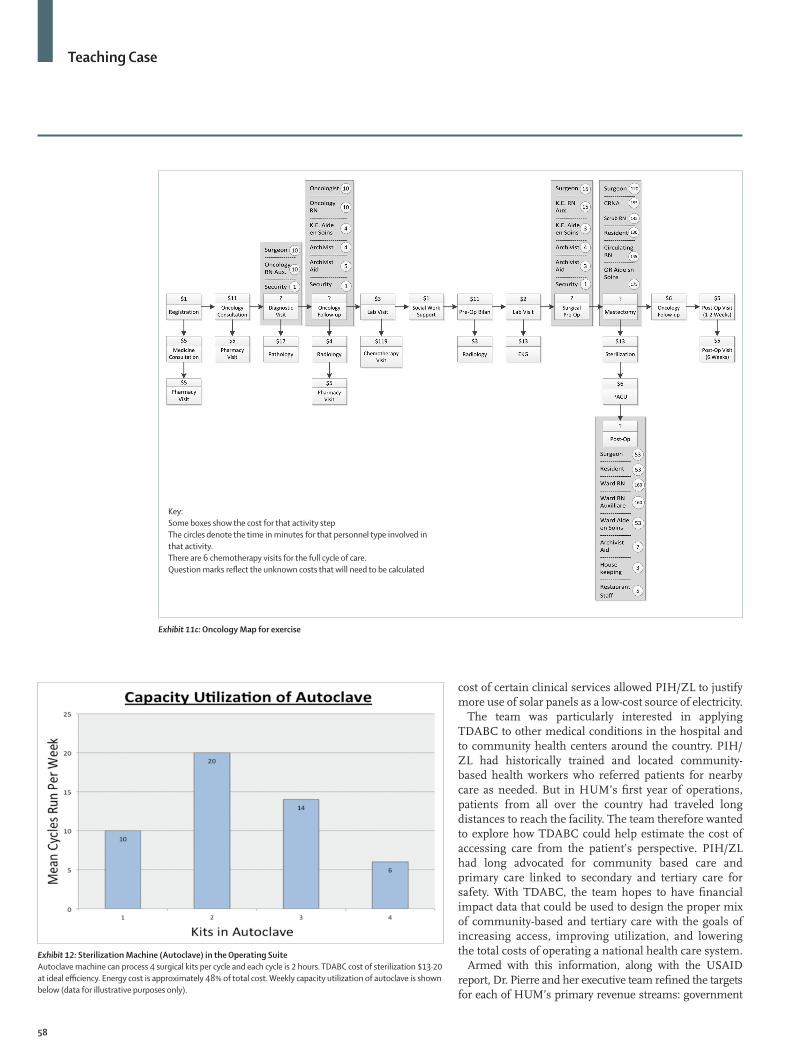
Exhibit 11c: Oncology Map for exercise
Key:Some boxes show the cost for that activity stepThe circles denote the time in minutes for that personnel type involved in that activity.There are 6 chemotherapy visits for the full cycle of care.Question marks reflect the unknown costs that will need to be calculated
Exhibit 12: Sterilization Machine (Autoclave) in the Operating SuiteAutoclave machine can process 4 surgical kits per cycle and each cycle is 2 hours. TDABC cost of sterilization $13·20 at ideal efficiency. Energy cost is approximately 48% of total cost. Weekly capacity utilization of autoclave is shown below (data for illustrative purposes only).
Teaching Case
59
funding, insurance reimbursements, and philanthropic investment. She anticipated a near-term meeting with MSPP and PIH personnel on the future of health care delivery in Haiti. She planned on using the information from the recent cost studies to start a dialogue among the government, donors, partners and other hospitals about how to finance the increased access to health care that everyone valued. This would include using TDABC data along with the MASH data, to put in context the various price lists from insurance companies, condition specific donor programs and the national effort to revise the public sector’s price list. She will wanted to engage with ZL/PIH and HUM leadership, clinicians, and hospital staff to use process maps for workflow redesign that would improve the experiences of patients and providers.References1 Central Intelligence Agency (CIA), “World Fact Book: Haiti,”
available online at https://www.cia.gov/library/publications/the-world-factbook/geos/ha.html, accessed November 2014.
2 World Bank, “Country Report: Haiti,” available online at http://www.worldbank.org/en/country/haiti, accessed November 2014.
3 Institut Haïtien de l’Enfance (IHE) [Haitian Childhood Institute] and ICF International, “Évaluation de Prestation des Services de Soins de Santé, Haïti 2013 [Evaluation of Health Care Services Delivery, Haiti 2013]” (Rockville, MD: IHE and ICF International, March 2014), available online at https://dhsprogram.com/pubs/pdf/SPA19/SPA19.pdf, accessed November 2014.
4 World Health Organization (WHO), “Haiti: Health Profile,” available online at http://www.who.int/countries/hti/en/, accessed November 2014.
5 Michel Cayemittes, Michelle Fatuma Busangu, Jean de Dieu Bizimana, Bernard Barrère, Blaise Sévère, Viviane Cayemittes, and Emmanuel Charles, “Enquête Mortalité, Morbidité et Utilisation des Services en Haïti 2012 [Survey of Mortality, Morbidity, and Utilization of Services, Haiti 2012],” (Calverton, MD: Ministère de la Santé Publique et de la Population (MSPP) [Ministry of Public Health and Population], Institut Haïtien de l’Enfance [Haitian Childhood Institute], and ICF International, April 2013), available online at http://unfpahaiti.org/pdf/JMP2013_Rapport_de_synthEse_Haiti.pdf, accessed November 2014.
6 Elaine Baruwa, Sophie Faye, and Christian Yao, “Hôpital Universitaire de Mirebalais (HUM) Costing Study” (Bethesda, MD: Abt Associates Inc, April 2014).
7 Michel-Ange Pantal, PhD; Peterson Abnis I Faure; Jean-Gregory Jerome; Markus Von Wartburg; Matthew Peckarsky; Pierre-Yves Cremieux, PhD. Economic Impact of Mirebalais National Teaching Hospital on the Haitian Economy, January 10, 2014 http://www.pih.org/library#search/0/all/0/10/ ; http://www.pih.org/blog/investing-in-haiti-the-economic-impact-of-university-hospital
8 Robert S. Kaplan, Mary L. Witkowski, and Jessica A. Hohman, “Boston Children’s Hospital; Measuring Patient Costs (V),” HBS No. 9-113-057 (Boston, Massachusetts, US: Harvard Business School Publishing, 2012)
9 Robert S. Kaplan, “Improving Value with Time-Driven Activity Based Costing (TDABC),” Healthcare Finance Magazine (June 2014): available online at http://www.hfma.org/Content.aspx?id=22957, accessed November 2014.
10 Robert S. Kaplan and Michael E. Porter, “The Big Idea: How to Solve the Cost Crisis in Health Care,” Harvard Business Review (September 2011): available online at http://hbr.org/2011/09/how-to-solve-the-cost-crisis-in-health-care/ar/1, accessed November 2014.
11 Marleen E. Hendriks, Piyalu Kundu, Alexander C. Boers, Oladimeji A. Bolarinwa, Mark. J. te Pas, Tanimola M. Akande, Kayode Agbede, Gabriella B. Gomez, William K. Redekop, Constance Schultsz, and Siok Swan Tan, “Step-by-Step Guideline for Disease-Specific Costing Studies in Low- and Middle-Income Countries: A Mixed Methodology,” Global Health Action 7 (March 28, 2014): Article ID 23573, http://dx.doi.org/10.3402/gha.v7.23573, accessed November 2014.
12 Paul Farmer, Julio Frenk, Felicia M Knaul, Lawrence N. Shulman, George Alleyne, Lance Armstrong, Rifat Atun, Douglas Blayney, Lincoln Chen, Richard Feachem, Mary Gospodarowicz, Julie Gralow, Sanjay Gupra, Ana Langer, Julian Lob-Levyt, Claire Neal, Anthony Mbewu, Dina Mired, Peter Piot, K. Srinath Reddy, Jeffrey D. Sachs, Mahmoud Sarhan, John R. Seffrin, “Expansion of Cancer Care and Control in Countries of Low and Middle Income: A Call to Action,” Lancet 376 (October 2, 2010): 1186–1193, available online at http://www.thelancet.com/journals/lancet/article/PIIS0140-6736(10)61152-X/fulltext, November 2014.
13. Ketan Sharma, Ainhoa Costas, Ruth Damuse, Jean Hamiltong-Pierre, Jordan Pyda, Cecilia T. Ong, Lawrence N. Shulman, and John G. Meara, “The Haiti Breast Cancer Initiative: Initial Findings and Analysis of Barriers-to-Care Delaying Patient Presentation,” Journal of Oncology (2013): Article ID 206367, available online at http://www.hindawi.com/journals/jo/2013/206367, accessed November 2014.
14 Roseberry B. Duda and Allan G. Hill, “Surgery in Developing Countries: Should Surgery Have a Role in Population-Based Health Care?” Bulletin of the American College of Surgeons 92 (May 2007): 12–18, available online at http://www.operationgivingback.facs.org/stuff/contentmgr/files/391e77df6e8ff9c8c15af932c265c1d7/pdf/surgery_in_developing_countries.pdf, accessed November 2014.
15 F. Parkinson, S.J.W. Kent, C. Aldous, G. Oosthuizen, and D. Clark, “The Hospital Cost of Road Traffic Accidents at a South African Regional Trauma Centre: A Micro-Costing Study,” Injury 45 (January 2014): 342–345.
16 European Commission, Humanitarian Aid and Civil Protection, “ECHO Factsheet, Haiti: Cholera,” available online at http://ec.europa.eu/echo/files/aid/countries/factsheets/haiti_cholera_en.pdf, accessed November 2014.
17 Investing in Haiti : The Economic Impact of University Hospital available on online at www.pih.org/.../investing-in-haiti-the-economic-impact-of-university- hospital.
Endnotes1 Dr. Pierre also served as Director of the Program in Health Systems
Strengthening and Social Change in the Department of Global Health and Social Medicine at the Harvard Medical School.
2 Self-pay patients could include tourists who became sick or injured while visiting Haiti.
3 These data represented a substantial decrease from the 2008 rate of 583 and the 1990 rate of 898 deaths per 100,000 births
4 A bundled payment is a single payment, intended to provide a positive margin above the costs incurred by efficient and effective providers, for treating a patient with a specific medical condition across a full cycle of care. The payment can be contingent upon achieving good patient outcomes for that medical condition.
5 Surgery for emergency trauma and obstetric complications were among the highest volume surgical procedures in most LIE countries. A study of the global burden of disease estimated that 11% of the global burden of disease could be treated with surgery, with the largest categories of demand for surgeries being injuries (38%), malignancies (19%), congenital anomalies (9%), complications of pregnancy (6%), cataracts (5%) and perinatal conditions (4%).