Embed Size (px)
DESCRIPTION
Horizon Risk and Interest Rate Risk. Chapter 21. Background. This chapter analyzes default-free bonds Evaluates prices relative to changing interest rates and maturity Horizon risk increases with the time remaining until a bond matures - PowerPoint PPT Presentation
Citation preview
Francis & Ibbotson Chapter 21: Interest Rate Risk and Horizon Risk 11
Slides by:
Pamela L. Hall, Western Washington University
Horizon Risk and Interest Rate Horizon Risk and Interest Rate Risk Risk
Chapter 21
Francis & Ibbotson
Chapter 21: Interest Rate Risk and Horizon Risk 22
BackgroundBackground
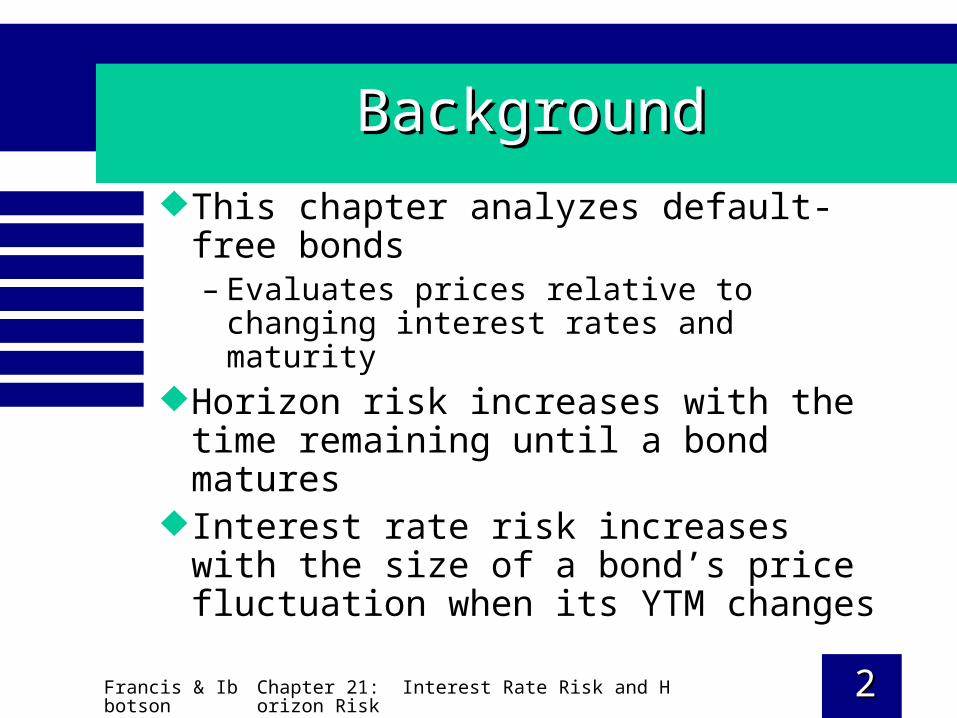
This chapter analyzes default-free bonds– Evaluates prices relative to changing
interest rates and maturity
Horizon risk increases with the time remaining until a bond matures
Interest rate risk increases with the size of a bond’s price fluctuation when its YTM changes
Francis & Ibbotson
Chapter 21: Interest Rate Risk and Horizon Risk 33
Present Value of a BondPresent Value of a Bond
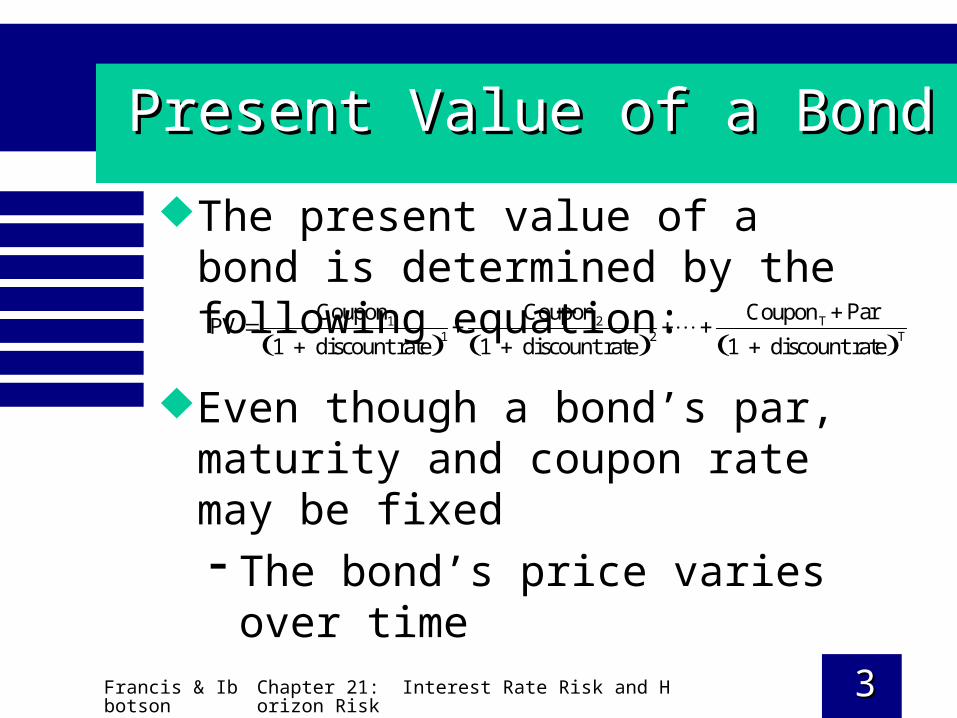
The present value of a bond is determined by the following equation:
1 2 T
1 2 T
ParCoupon Coupon CouponPV
1 discount rate 1 discount rate 1 discount rate
Even though a bond’s par, maturity and coupon rate may be fixed The bond’s price varies over time
Francis & Ibbotson
Chapter 21: Interest Rate Risk and Horizon Risk 44
Present Value of a BondPresent Value of a Bond
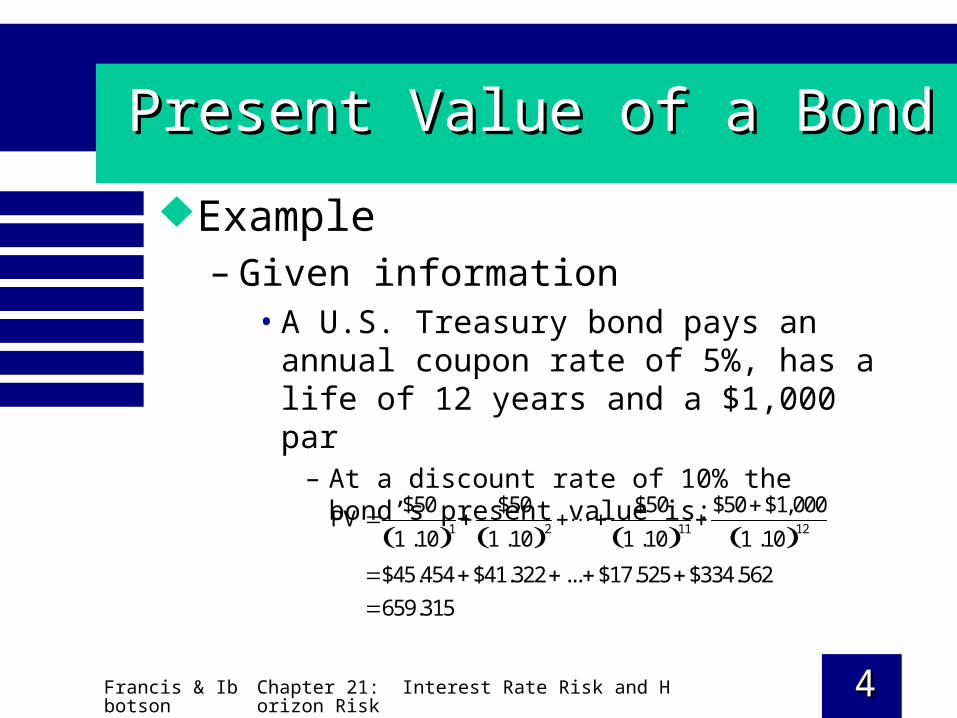
Example– Given information
• A U.S. Treasury bond pays an annual coupon rate of 5%, has a life of 12 years and a $1,000 par
– At a discount rate of 10% the bond’s present value is:
1 2 11 12
$50 $50 $50 $50 $1,000PV
1 .10 1 .10 1 .10 1 .10
$45.454 $41.322 ... $17.525 $334.562
659.315
Francis & Ibbotson
Chapter 21: Interest Rate Risk and Horizon Risk 55
Present Value of a BondPresent Value of a Bond
Bond prices vary due to fluctuating market interest rates– As a bond’s YTM increases its price
decreases• The size of the fluctuations depends on the
bond’s time horizon and coupon rate
Francis & Ibbotson
Chapter 21: Interest Rate Risk and Horizon Risk 66
Par Vs. PricePar Vs. Price
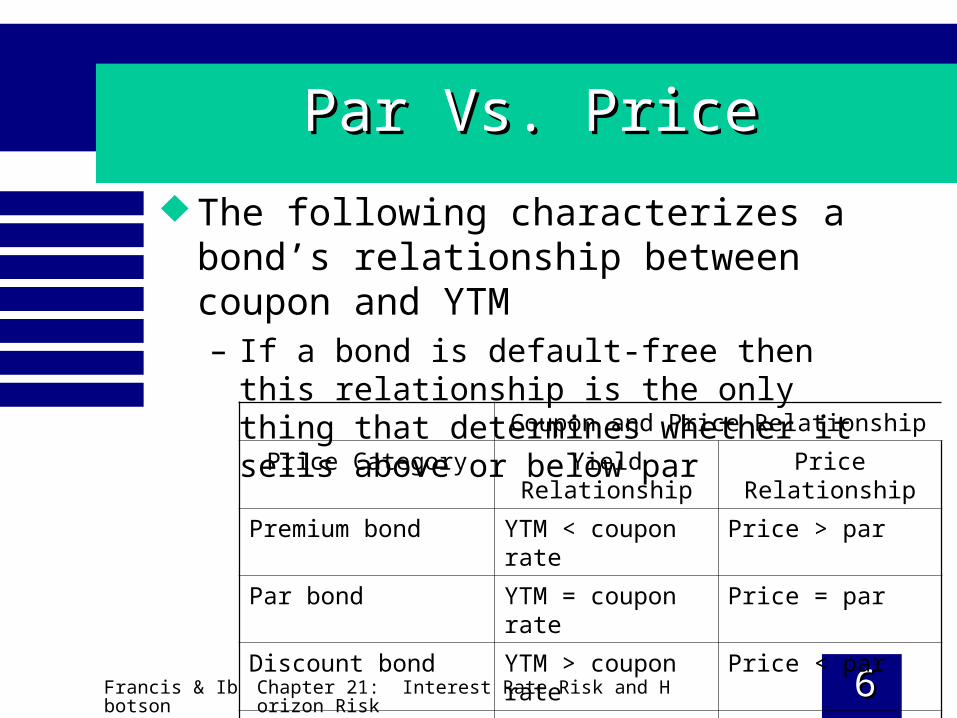
The following characterizes a bond’s relationship between coupon and YTM– If a bond is default-free then this relationship is
the only thing that determines whether it sells above or below par
Coupon and Price Relationship
Price Category Yield Relationship Price Relationship
Premium bond YTM < coupon rate Price > par
Par bond YTM = coupon rate Price = par
Discount bond YTM > coupon rate Price < par
Zero coupon bond Zero coupons Price < par
Francis & Ibbotson
Chapter 21: Interest Rate Risk and Horizon Risk 77
Convexity in the Price-Yield RelationshipConvexity in the Price-Yield Relationship
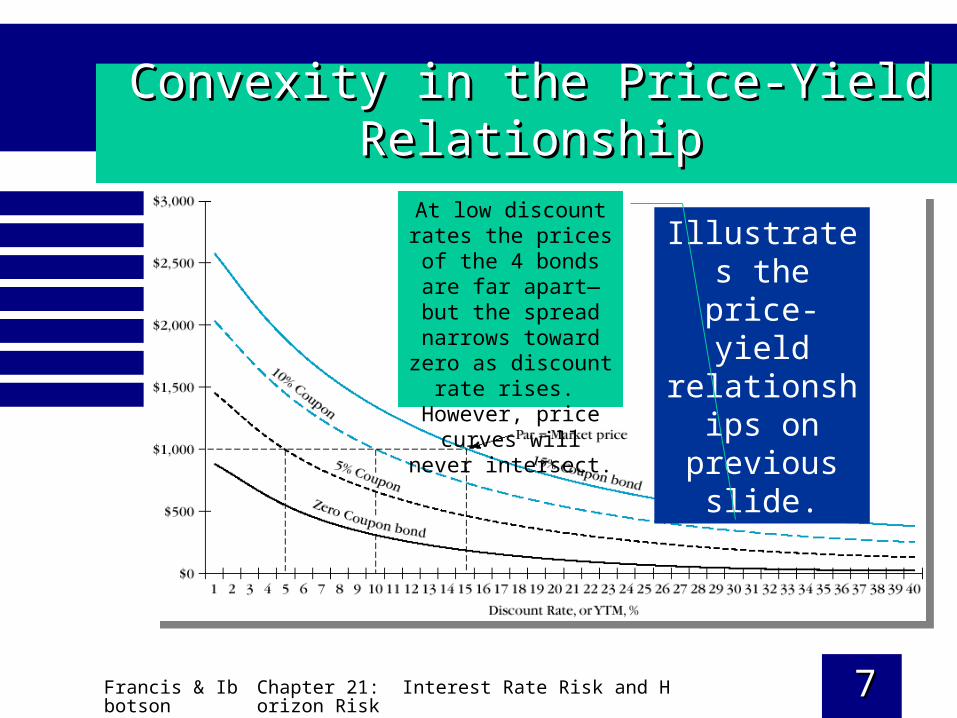
Illustrates the price-yield
relationships on previous
slide.
At low discount rates the prices of the 4
bonds are far apart—but the spread narrows toward zero as discount
rate rises. However, price curves will never
intersect.
Francis & Ibbotson
Chapter 21: Interest Rate Risk and Horizon Risk 88
Convexity in the Price-Yield RelationshipConvexity in the Price-Yield Relationship
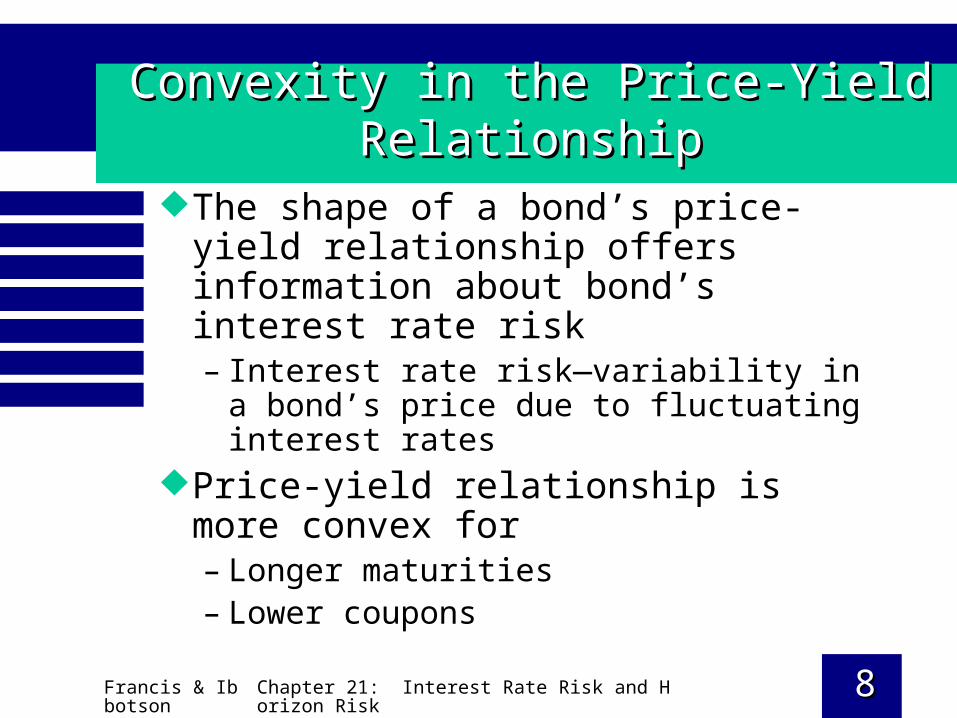
The shape of a bond’s price-yield relationship offers information about bond’s interest rate risk– Interest rate risk—variability in a bond’s
price due to fluctuating interest rates
Price-yield relationship is more convex for – Longer maturities– Lower coupons
Francis & Ibbotson
Chapter 21: Interest Rate Risk and Horizon Risk 99
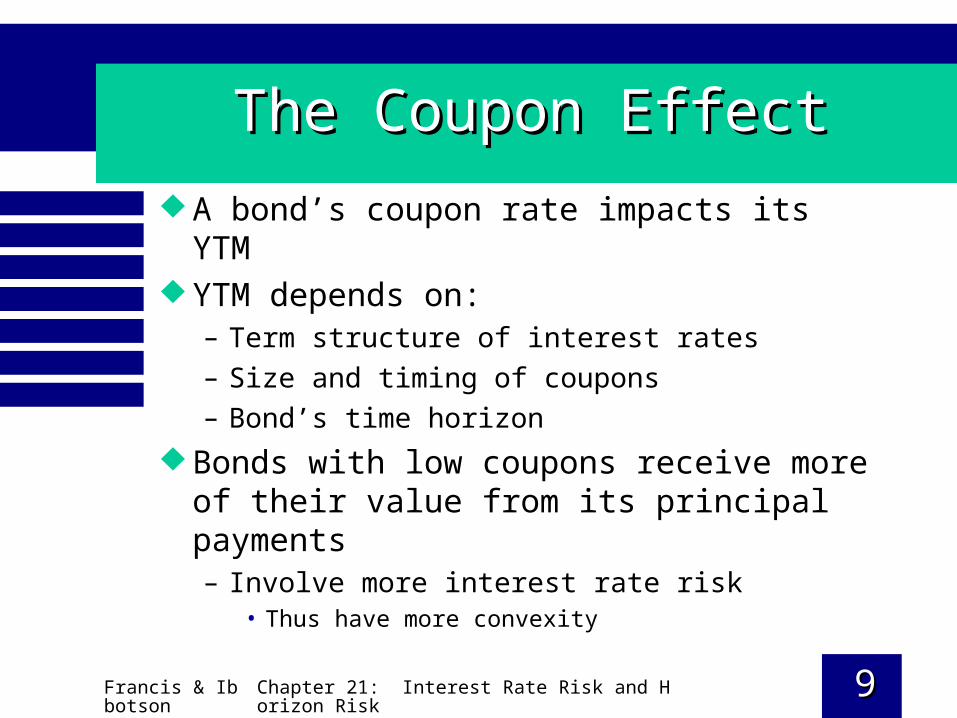
The Coupon EffectThe Coupon Effect
A bond’s coupon rate impacts its YTM YTM depends on:
– Term structure of interest rates
– Size and timing of coupons
– Bond’s time horizon
Bonds with low coupons receive more of their value from its principal payments– Involve more interest rate risk
• Thus have more convexity
Francis & Ibbotson
Chapter 21: Interest Rate Risk and Horizon Risk 1010
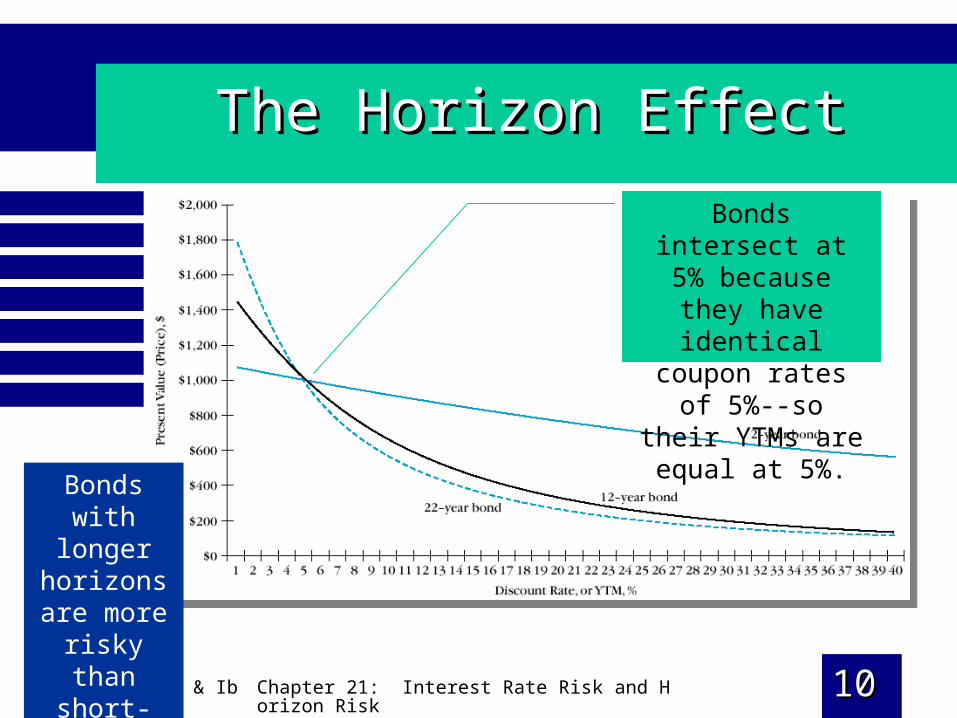
The Horizon EffectThe Horizon Effect
Bonds with longer
horizons are more risky than short-term bonds.
Bonds intersect at 5% because they have
identical coupon rates of 5%--so their YTMs
are equal at 5%.
Francis & Ibbotson
Chapter 21: Interest Rate Risk and Horizon Risk 1111
Hedging Fixed Income InstrumentsHedging Fixed Income Instruments
Even someone who invests in default-free fixed-income securities face risk– Reinvestment risk– Price fluctuation risk
Francis & Ibbotson
Chapter 21: Interest Rate Risk and Horizon Risk 1212
Reinvestment RiskReinvestment Risk
Variability of return resulting from reinvestment of a bond’s coupon at fluctuating interest rates– Can be avoided by investing in zero
coupon bonds
Francis & Ibbotson
Chapter 21: Interest Rate Risk and Horizon Risk 1313
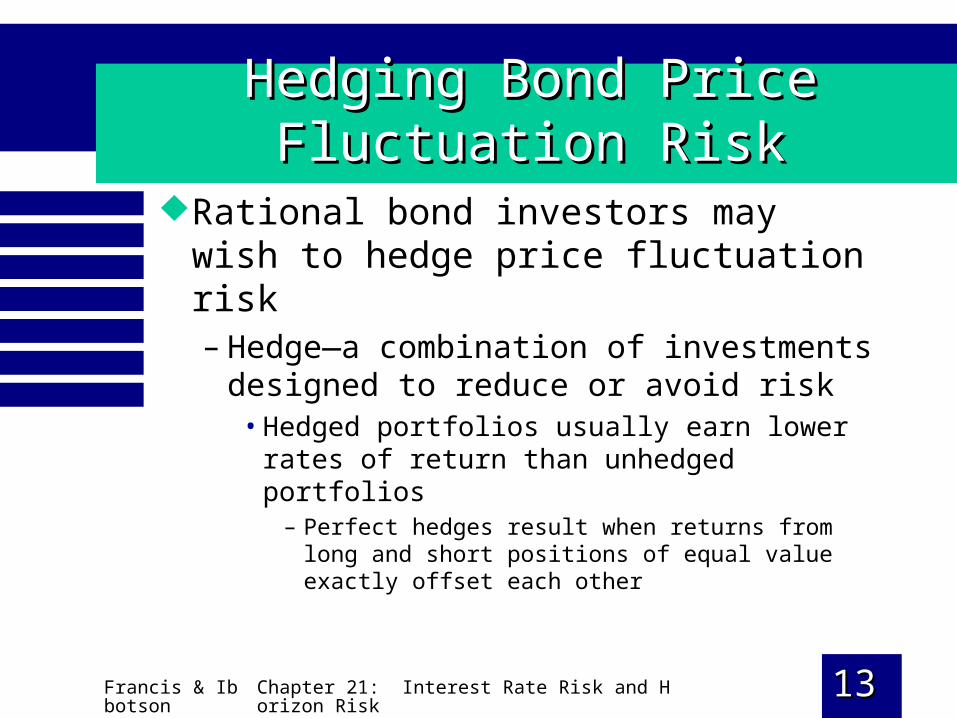
Hedging Bond Price Fluctuation RiskHedging Bond Price Fluctuation Risk
Rational bond investors may wish to hedge price fluctuation risk– Hedge—a combination of investments
designed to reduce or avoid risk• Hedged portfolios usually earn lower rates of
return than unhedged portfolios– Perfect hedges result when returns from long and
short positions of equal value exactly offset each other
Francis & Ibbotson
Chapter 21: Interest Rate Risk and Horizon Risk 1414
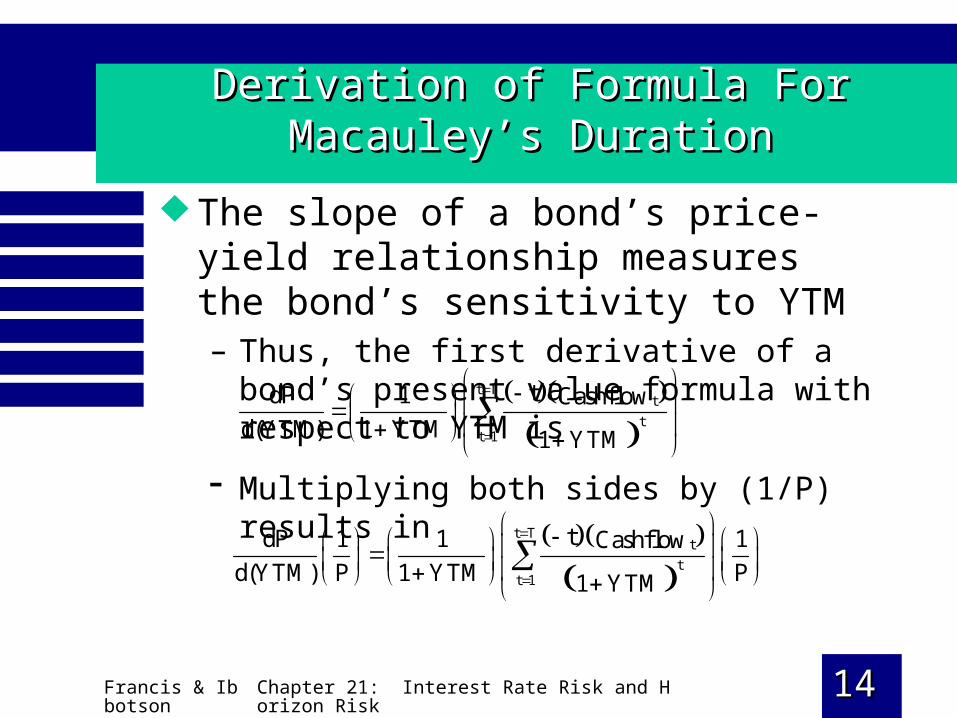
Derivation of Formula For Macauley’s DurationDerivation of Formula For Macauley’s Duration
The slope of a bond’s price-yield relationship measures the bond’s sensitivity to YTM– Thus, the first derivative of a bond’s present
value formula with respect to YTM is
t Tt
tt 1
tdP 1 Cashflowd(YTM) 1 YTM 1 YTM
Multiplying both sides by (1/P) results in
t Tt
tt 1
tdP 1 1 1Cashflowd(YTM) P 1 YTM P1 YTM

Francis & Ibbotson
Chapter 21: Interest Rate Risk and Horizon Risk 1515
Derivation of Formula For Macauley’s DurationDerivation of Formula For Macauley’s Duration
Rearranging the previous equation gives us:
t Tt
tt 1
t1 1CashflowModified Duration (MOD)
1 YTM P1 YTM
Multiplying by (1+YTM) results in:
t Tt
tt 1
t1 CashflowMacauley Duration (MAC)
P 1 YTM
Which measures the percentage change in a bond’s price resulting from a small percentage change in its YTM
Francis & Ibbotson
Chapter 21: Interest Rate Risk and Horizon Risk 1616
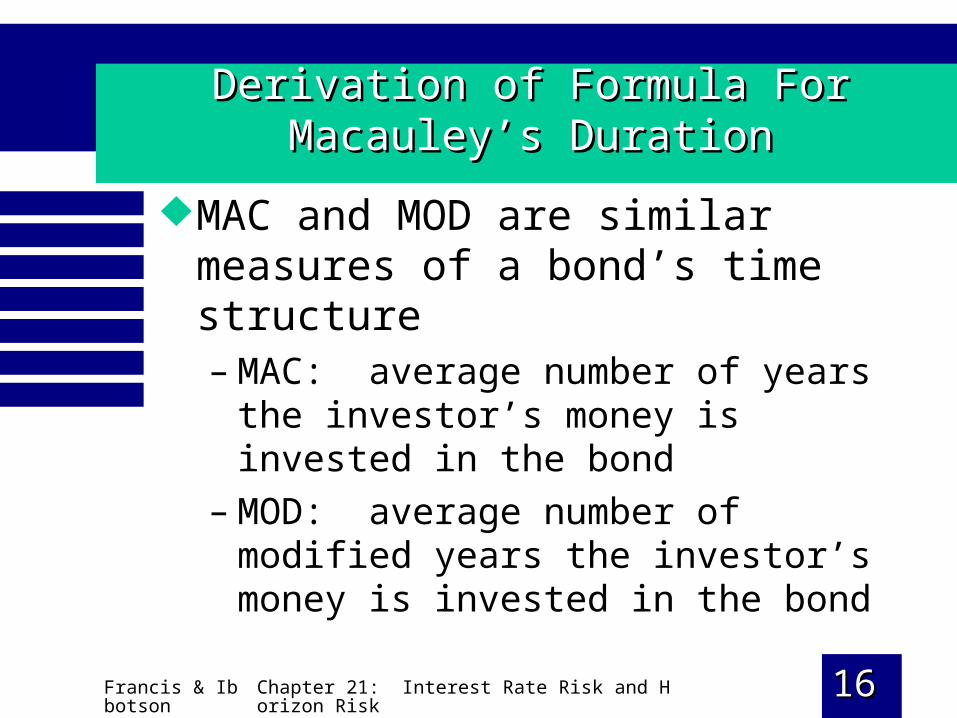
Derivation of Formula For Macauley’s DurationDerivation of Formula For Macauley’s Duration
MAC and MOD are similar measures of a bond’s time structure– MAC: average number of years the
investor’s money is invested in the bond– MOD: average number of modified years
the investor’s money is invested in the bond

Francis & Ibbotson
Chapter 21: Interest Rate Risk and Horizon Risk 1717
Example: Calculation of MAC and MODExample: Calculation of MAC and MOD
Given information– A $1,000 par bond with a YTM of 10%
has three years to maturity and a 5% coupon rate
– Currently sells for $875.657
1 2 3
$50 $50 $50 $1,000PV
1 .10 1 .10 1 .10
$45.454 $41.322 $778.881
$875.657
Francis & Ibbotson
Chapter 21: Interest Rate Risk and Horizon Risk 1818
Example: Calculation of MAC and MODExample: Calculation of MAC and MOD
MAC can be calculated using the previous present value calculations
T PV of CFEach CFs PV as fraction of Price T weighted by CF
1 45.455 0.05191 1 × 0.05191 = 0.05191
2 41.322 0.04718 2 × 0.04718 = 0.09438
3 788.881 0.9009 3 × 0.9009 = 2.70270
1.00000 MAC = 2.84899
MOD = MAC (1+YTM)= 2.84899 1.10
= 2.5899
Francis & Ibbotson
Chapter 21: Interest Rate Risk and Horizon Risk 1919
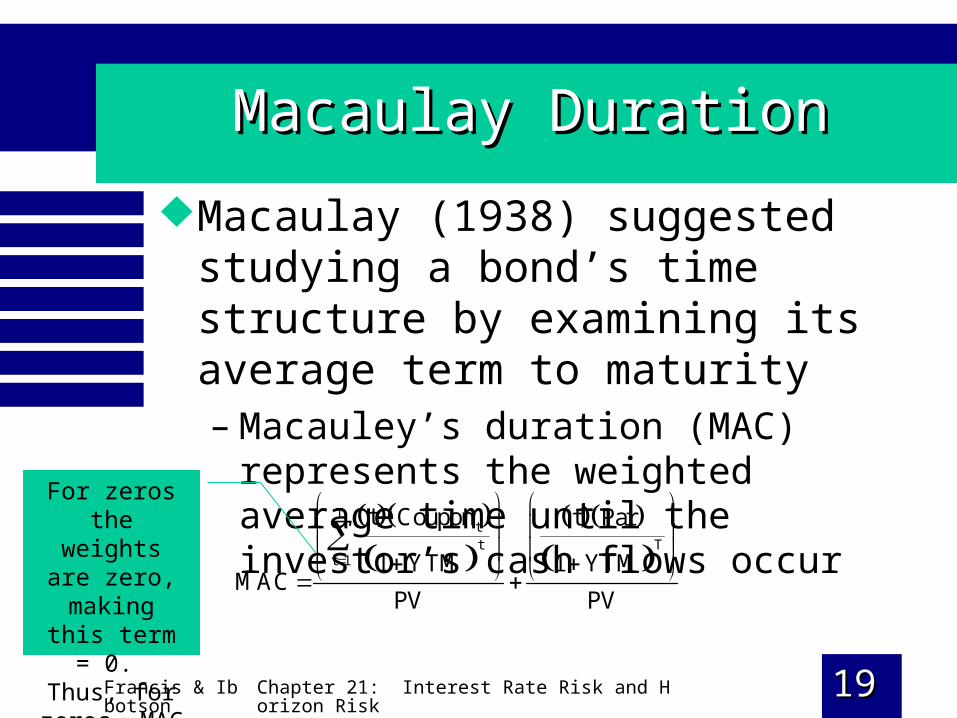
Macaulay DurationMacaulay Duration
Macaulay (1938) suggested studying a bond’s time structure by examining its average term to maturity– Macauley’s duration (MAC) represents
the weighted average time until the investor’s cash flows occur
Ttt T
t 1
t Coupon t Par
1 YTM 1 YTMMAC
PV PV
For zeros the weights are
zero, making this term = 0.
Thus, for zeros, MAC = t.
Francis & Ibbotson
Chapter 21: Interest Rate Risk and Horizon Risk 2020
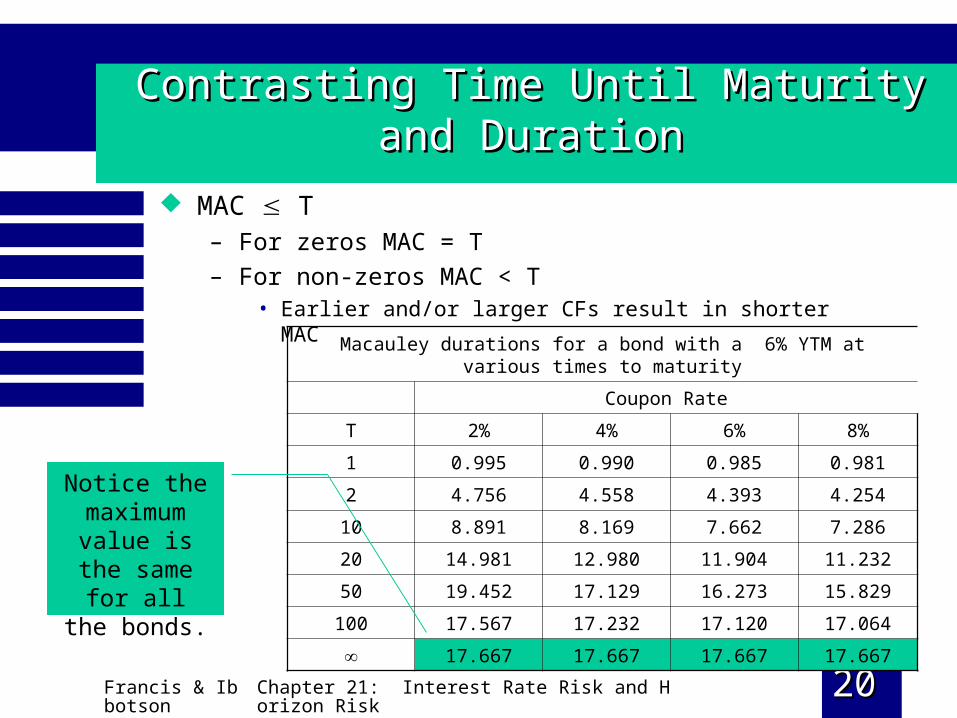
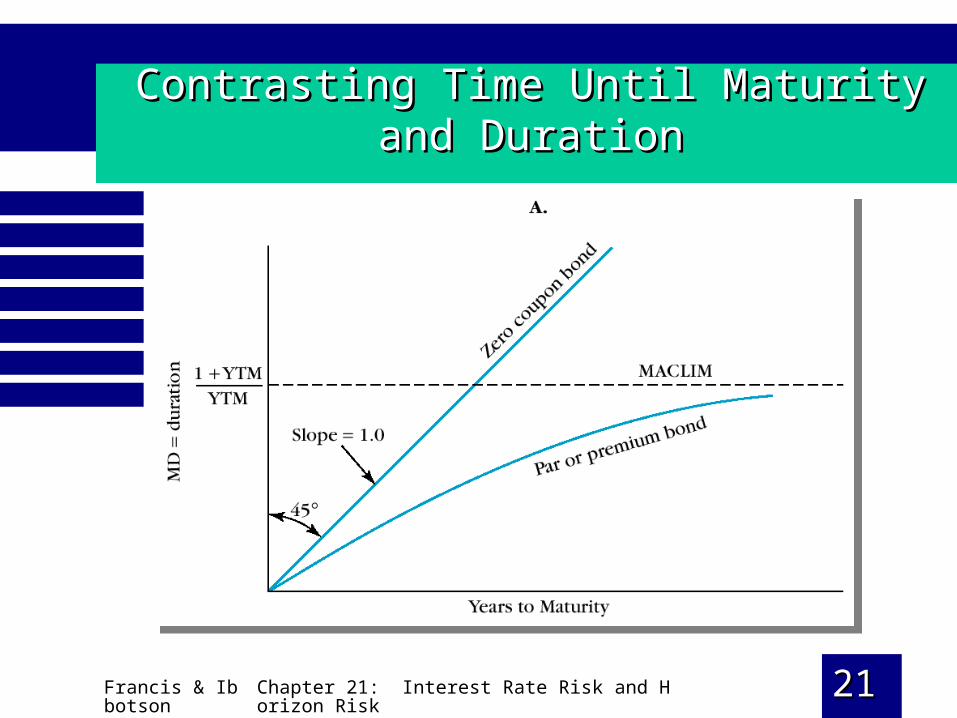
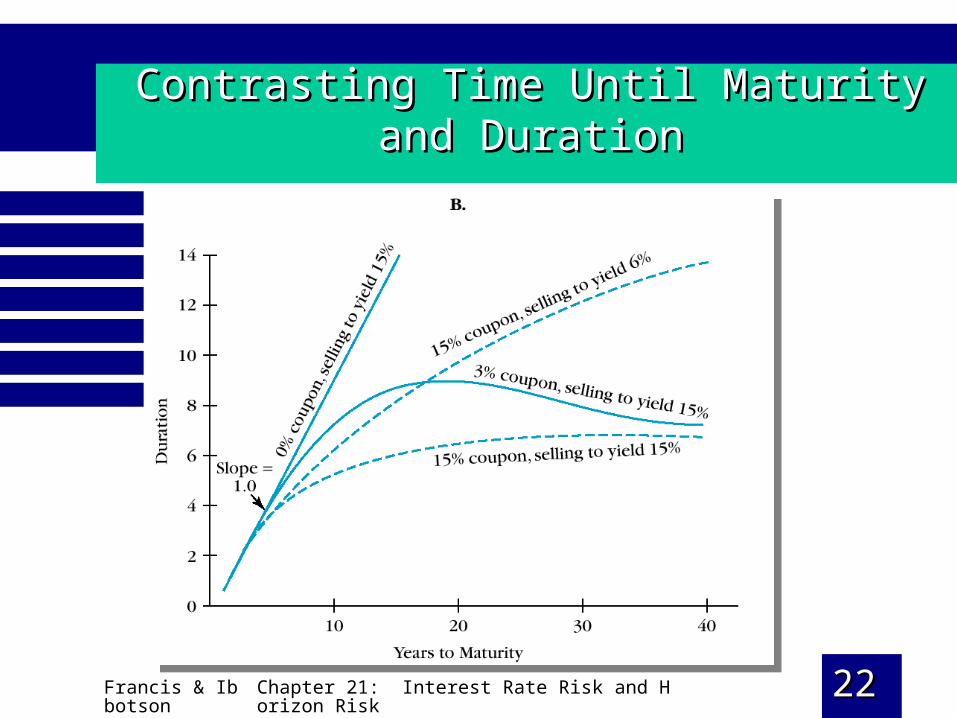
Contrasting Time Until Maturity and DurationContrasting Time Until Maturity and Duration
MAC T– For zeros MAC = T
– For non-zeros MAC < T• Earlier and/or larger CFs result in shorter MAC
Macauley durations for a bond with a 6% YTM at various times to maturity
Coupon Rate
T 2% 4% 6% 8%
1 0.995 0.990 0.985 0.981
2 4.756 4.558 4.393 4.254
10 8.891 8.169 7.662 7.286
20 14.981 12.980 11.904 11.232
50 19.452 17.129 16.273 15.829
100 17.567 17.232 17.120 17.064
17.667 17.667 17.667 17.667
Notice the maximum value is the same for all the bonds.
Francis & Ibbotson
Chapter 21: Interest Rate Risk and Horizon Risk 2121
Contrasting Time Until Maturity and DurationContrasting Time Until Maturity and Duration
Francis & Ibbotson
Chapter 21: Interest Rate Risk and Horizon Risk 2222
Contrasting Time Until Maturity and DurationContrasting Time Until Maturity and Duration
Francis & Ibbotson
Chapter 21: Interest Rate Risk and Horizon Risk 2323
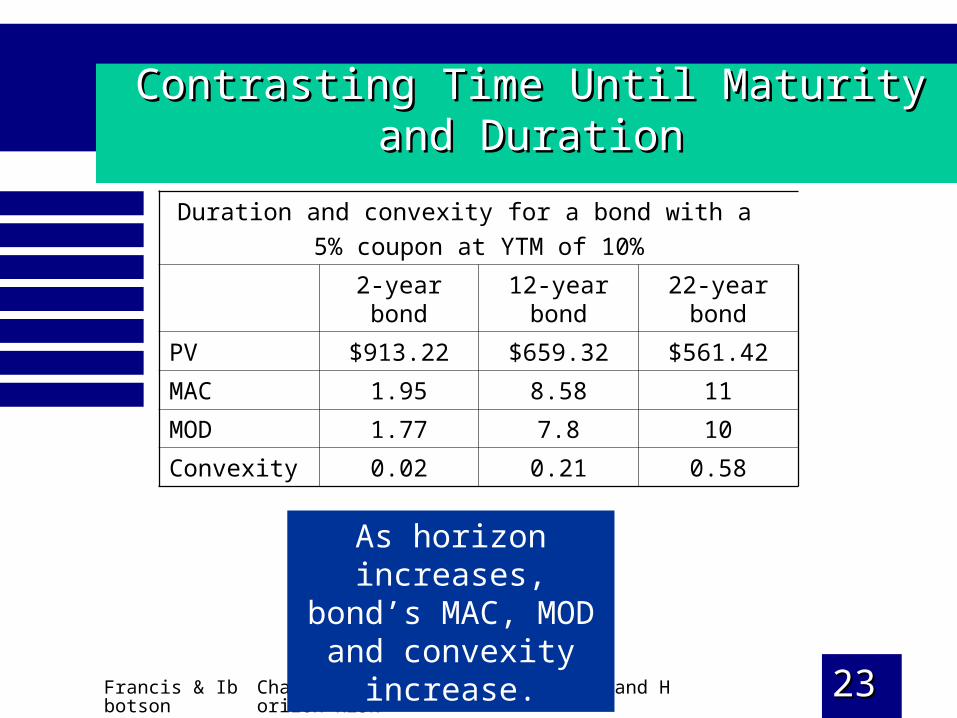
Contrasting Time Until Maturity and DurationContrasting Time Until Maturity and Duration
Duration and convexity for a bond with a
5% coupon at YTM of 10%
2-year bond 12-year bond 22-year bond
PV $913.22 $659.32 $561.42
MAC 1.95 8.58 11
MOD 1.77 7.8 10
Convexity 0.02 0.21 0.58
As horizon increases, bond’s MAC, MOD
and convexity increase.
Francis & Ibbotson
Chapter 21: Interest Rate Risk and Horizon Risk 2424
Contrasting Time Until Maturity and DurationContrasting Time Until Maturity and Duration
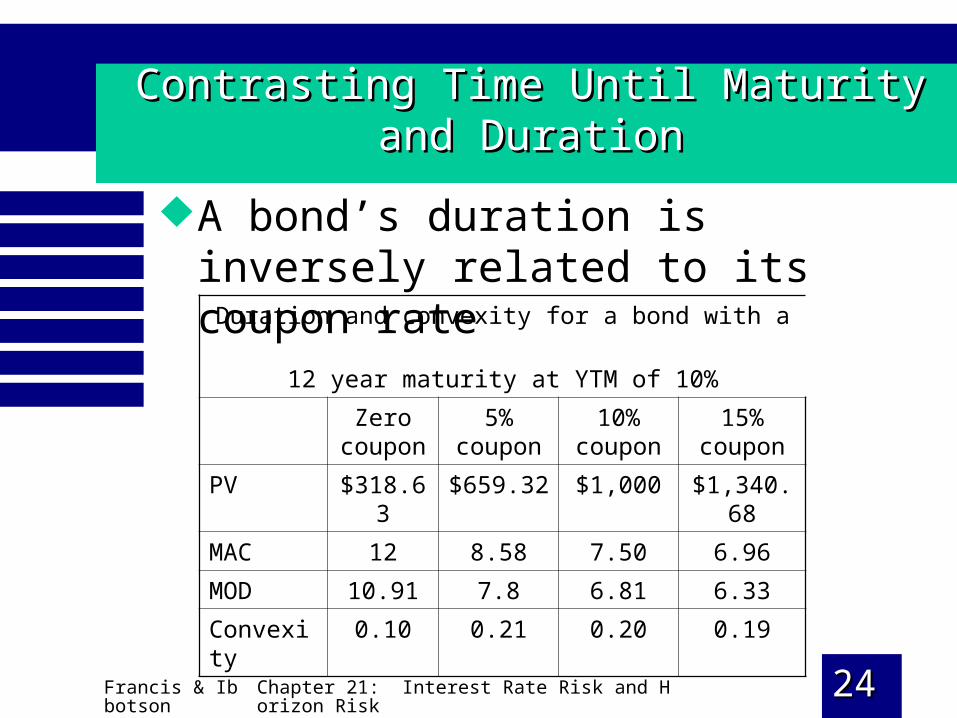
A bond’s duration is inversely related to its coupon rate
Duration and convexity for a bond with a
12 year maturity at YTM of 10%
Zero coupon
5% coupon
10% coupon
15% coupon
PV $318.63 $659.32 $1,000 $1,340.68
MAC 12 8.58 7.50 6.96
MOD 10.91 7.8 6.81 6.33
Convexity 0.10 0.21 0.20 0.19
Francis & Ibbotson
Chapter 21: Interest Rate Risk and Horizon Risk 2525
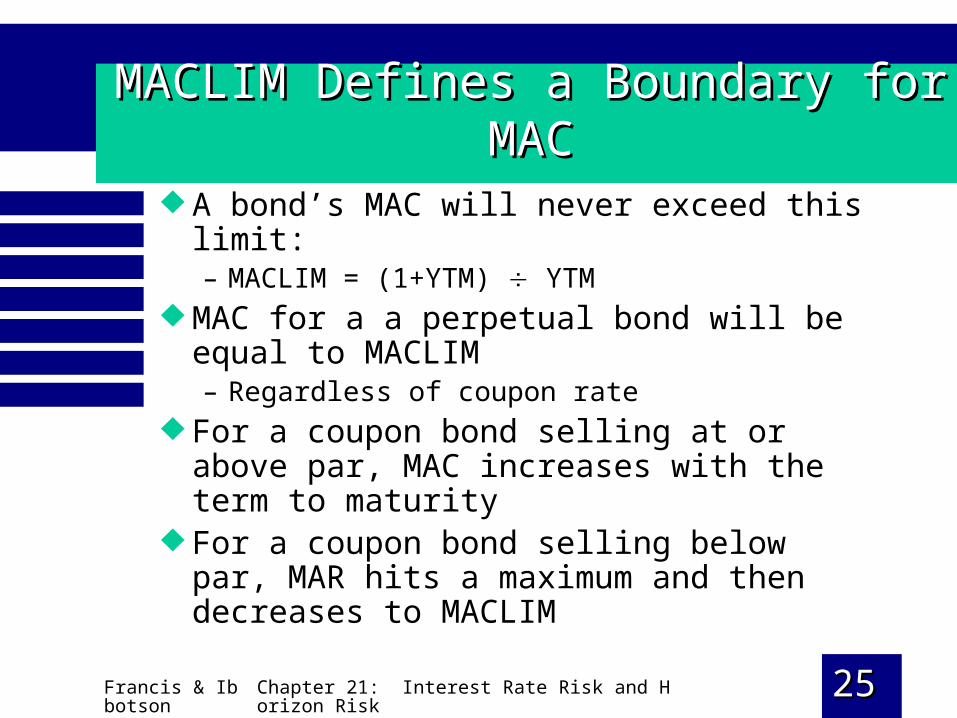
MACLIM Defines a Boundary for MACMACLIM Defines a Boundary for MAC
A bond’s MAC will never exceed this limit:– MACLIM = (1+YTM) YTM
MAC for a a perpetual bond will be equal to MACLIM– Regardless of coupon rate
For a coupon bond selling at or above par, MAC increases with the term to maturity
For a coupon bond selling below par, MAR hits a maximum and then decreases to MACLIM
Francis & Ibbotson
Chapter 21: Interest Rate Risk and Horizon Risk 2626
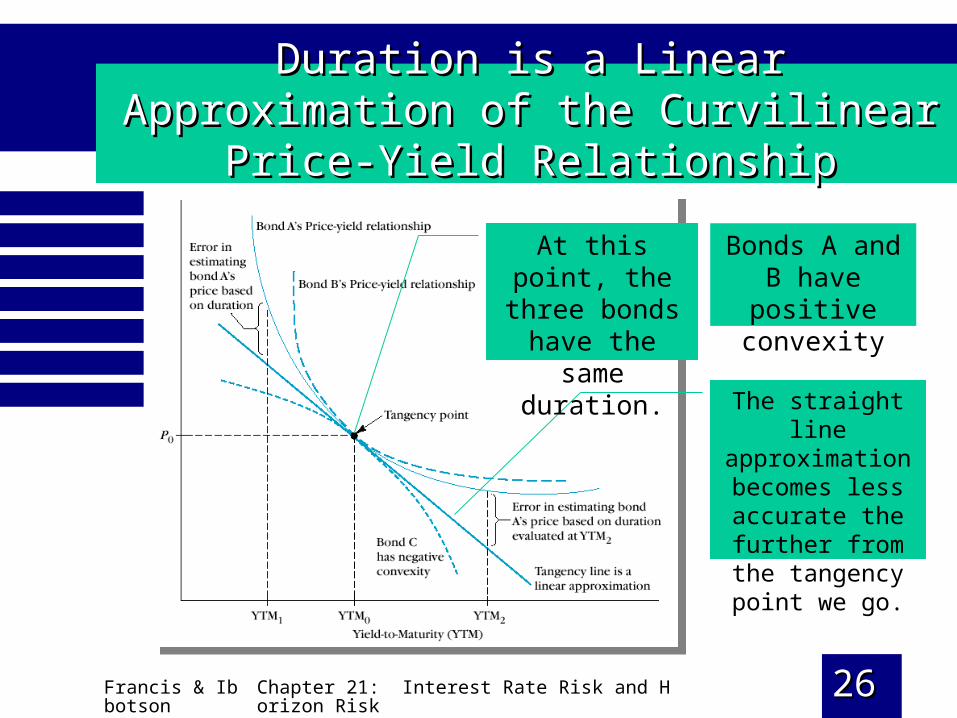
Duration is a Linear Approximation of the Duration is a Linear Approximation of the Curvilinear Price-Yield RelationshipCurvilinear Price-Yield Relationship
Bonds A and B have positive
convexity
The straight line approximation becomes less
accurate the further from the tangency
point we go.
At this point, the three bonds have
the same duration.
Francis & Ibbotson
Chapter 21: Interest Rate Risk and Horizon Risk 2727
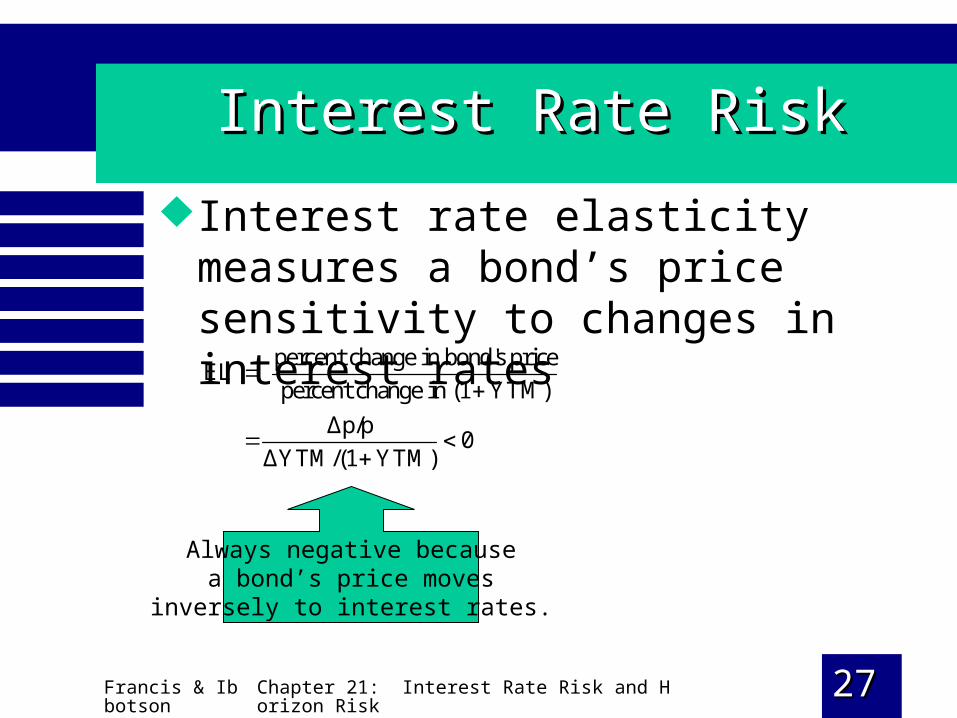
Interest Rate RiskInterest Rate Risk
Interest rate elasticity measures a bond’s price sensitivity to changes in interest rates
percent change in bond's priceEL
percent change in (1 YTM)
Δp/p0
ΔYTM/(1 YTM)
Always negative becausea bond’s price moves
inversely to interest rates.
Francis & Ibbotson
Chapter 21: Interest Rate Risk and Horizon Risk 2828
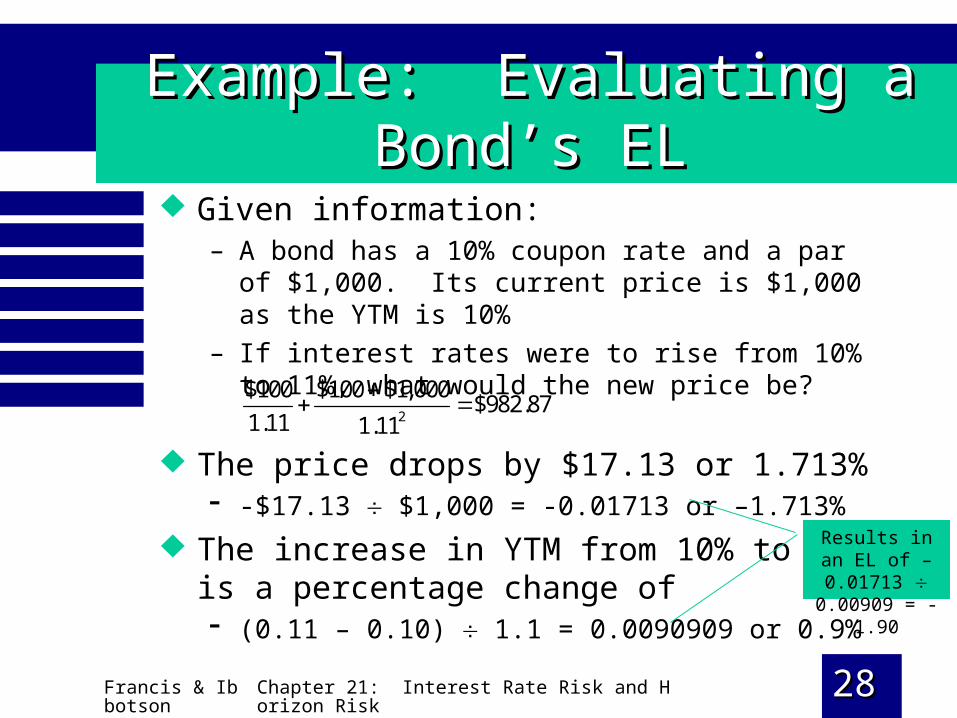
Example: Evaluating a Bond’s ELExample: Evaluating a Bond’s EL
Given information:– A bond has a 10% coupon rate and a par of $1,000. Its
current price is $1,000 as the YTM is 10%
– If interest rates were to rise from 10% to 11%, what would the new price be?
2
$100 $100 $1,000$982.87
1.11 1.11
The price drops by $17.13 or 1.713% -$17.13 $1,000 = -0.01713 or –1.713%
The increase in YTM from 10% to 11% is a percentage change of (0.11 – 0.10) 1.1 = 0.0090909 or 0.9%
Results in an EL of –0.01713
0.00909 = -1.90
Francis & Ibbotson
Chapter 21: Interest Rate Risk and Horizon Risk 2929
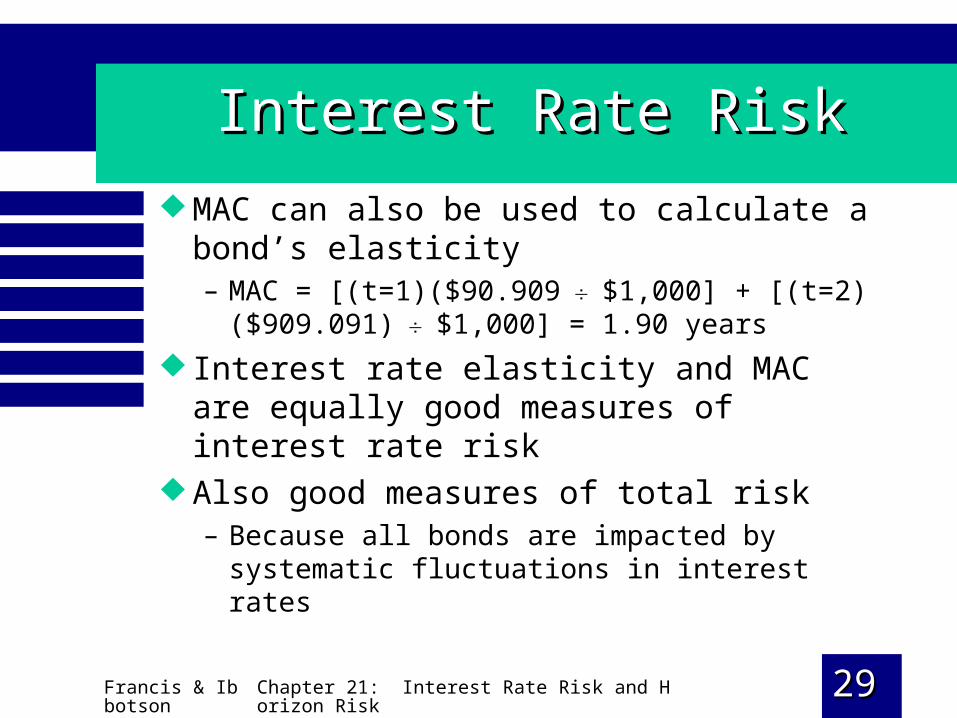
Interest Rate RiskInterest Rate Risk
MAC can also be used to calculate a bond’s elasticity– MAC = [(t=1)($90.909 $1,000] + [(t=2)
($909.091) $1,000] = 1.90 years
Interest rate elasticity and MAC are equally good measures of interest rate risk
Also good measures of total risk– Because all bonds are impacted by systematic
fluctuations in interest rates
Francis & Ibbotson
Chapter 21: Interest Rate Risk and Horizon Risk 3030
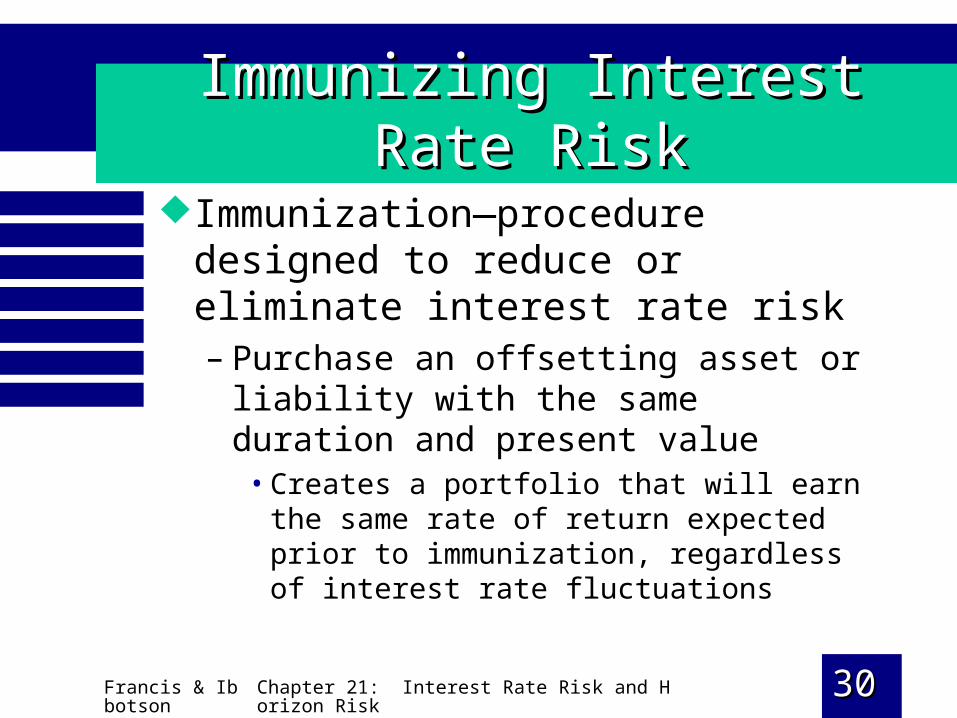
Immunizing Interest Rate RiskImmunizing Interest Rate Risk
Immunization—procedure designed to reduce or eliminate interest rate risk– Purchase an offsetting asset or liability
with the same duration and present value• Creates a portfolio that will earn the same rate
of return expected prior to immunization, regardless of interest rate fluctuations
Francis & Ibbotson
Chapter 21: Interest Rate Risk and Horizon Risk 3131
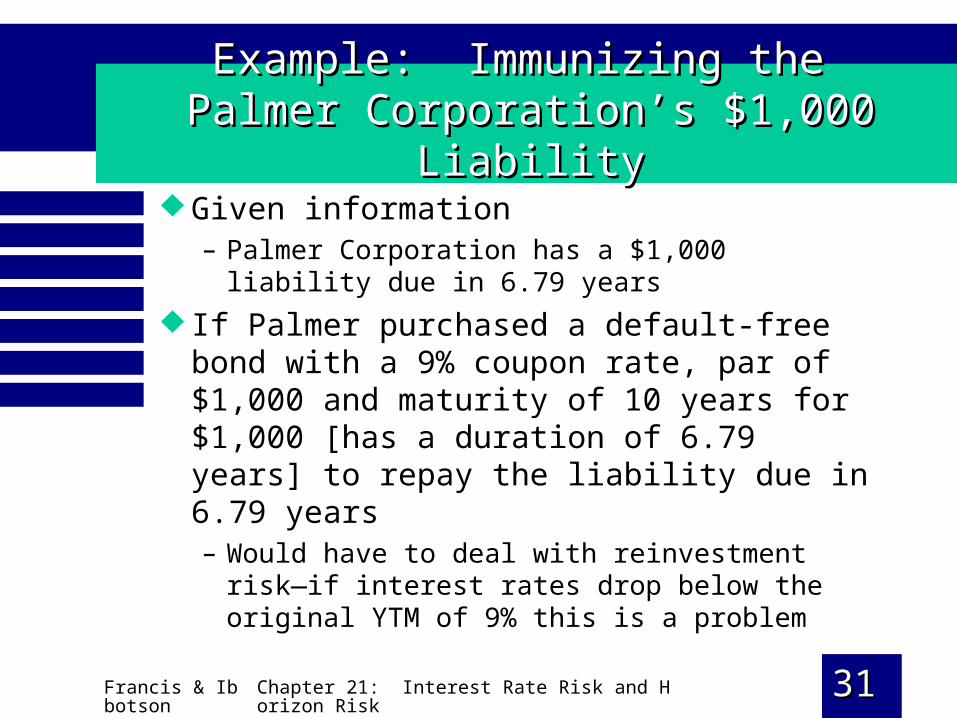
Example: Immunizing the Example: Immunizing the Palmer Corporation’s $1,000 LiabilityPalmer Corporation’s $1,000 Liability
Given information– Palmer Corporation has a $1,000 liability due in
6.79 years
If Palmer purchased a default-free bond with a 9% coupon rate, par of $1,000 and maturity of 10 years for $1,000 [has a duration of 6.79 years] to repay the liability due in 6.79 years– Would have to deal with reinvestment risk—if
interest rates drop below the original YTM of 9% this is a problem
Francis & Ibbotson
Chapter 21: Interest Rate Risk and Horizon Risk 3232
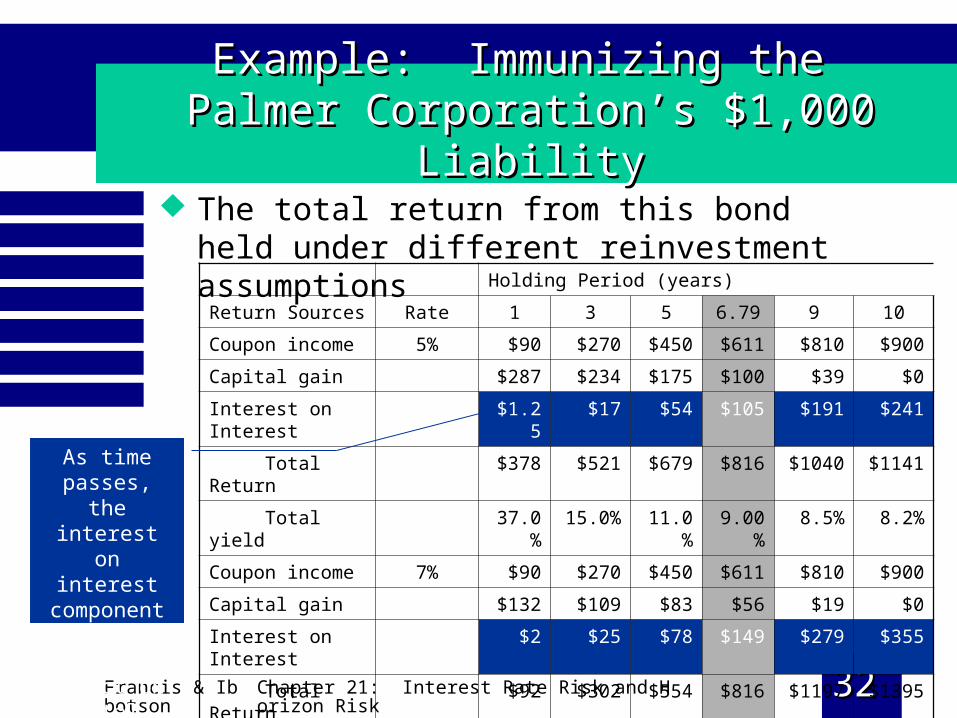
Example: Immunizing the Example: Immunizing the Palmer Corporation’s $1,000 LiabilityPalmer Corporation’s $1,000 Liability
The total return from this bond held under different reinvestment assumptions
Holding Period (years)
Return Sources Rate 1 3 5 6.79 9 10
Coupon income 5% $90 $270 $450 $611 $810 $900
Capital gain $287 $234 $175 $100 $39 $0
Interest on Interest $1.25 $17 $54 $105 $191 $241
Total Return $378 $521 $679 $816 $1040 $1141
Total yield 37.0% 15.0% 11.0% 9.00% 8.5% 8.2%
Coupon income 7% $90 $270 $450 $611 $810 $900
Capital gain $132 $109 $83 $56 $19 $0
Interest on Interest $2 $25 $78 $149 $279 $355
Total Return $92 $302 $554 $816 $1197 $1395
Total yield 22.0% 12.0% 10.0% 9.0% 8.6% 8.5%
As time passes, the interest on
interest component has
a greater impact on total
return.
Francis & Ibbotson
Chapter 21: Interest Rate Risk and Horizon Risk 3333
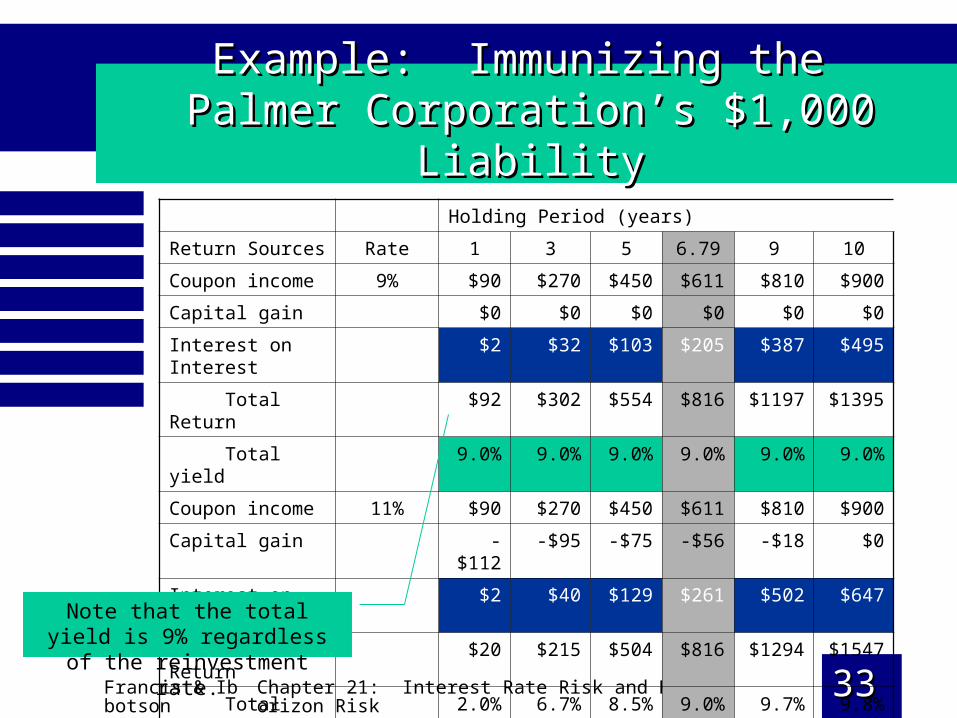
Example: Immunizing the Example: Immunizing the Palmer Corporation’s $1,000 LiabilityPalmer Corporation’s $1,000 Liability
Holding Period (years)
Return Sources Rate 1 3 5 6.79 9 10
Coupon income 9% $90 $270 $450 $611 $810 $900
Capital gain $0 $0 $0 $0 $0 $0
Interest on Interest $2 $32 $103 $205 $387 $495
Total Return $92 $302 $554 $816 $1197 $1395
Total yield 9.0% 9.0% 9.0% 9.0% 9.0% 9.0%
Coupon income 11% $90 $270 $450 $611 $810 $900
Capital gain -$112 -$95 -$75 -$56 -$18 $0
Interest on Interest $2 $40 $129 $261 $502 $647
Total Return $20 $215 $504 $816 $1294 $1547
Total yield 2.0% 6.7% 8.5% 9.0% 9.7% 9.8%
Note that the total yield is 9% regardless of the reinvestment rate.
Francis & Ibbotson
Chapter 21: Interest Rate Risk and Horizon Risk 3434
Example: Immunizing the Example: Immunizing the Palmer Corporation’s $1,000 LiabilityPalmer Corporation’s $1,000 Liability
A bond’s total return is impacted by– Its interest income and interest-on-interest – Its price fluctuations
These two forces work in the opposite direction– Is there some point where they exactly
offset each other?• Yes, when the bond has been held for the
length of the bond’s duration
Francis & Ibbotson
Chapter 21: Interest Rate Risk and Horizon Risk 3535
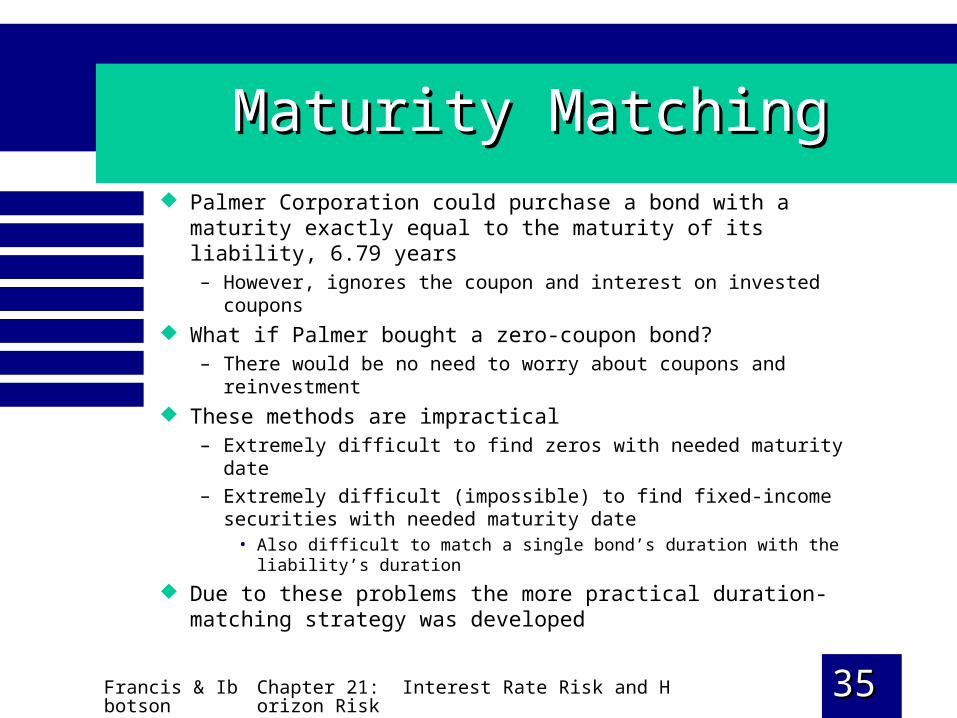
Maturity MatchingMaturity Matching
Palmer Corporation could purchase a bond with a maturity exactly equal to the maturity of its liability, 6.79 years– However, ignores the coupon and interest on invested coupons
What if Palmer bought a zero-coupon bond?– There would be no need to worry about coupons and reinvestment
These methods are impractical– Extremely difficult to find zeros with needed maturity date
– Extremely difficult (impossible) to find fixed-income securities with needed maturity date
• Also difficult to match a single bond’s duration with the liability’s duration
Due to these problems the more practical duration-matching strategy was developed
Francis & Ibbotson
Chapter 21: Interest Rate Risk and Horizon Risk 3636
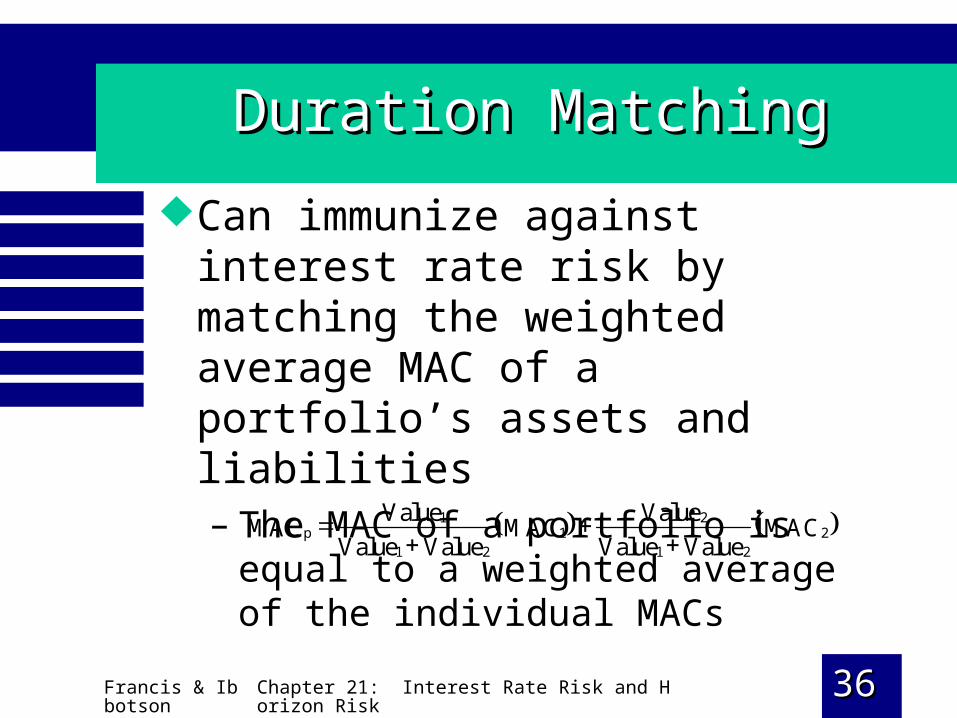
Duration MatchingDuration Matching
Can immunize against interest rate risk by matching the weighted average MAC of a portfolio’s assets and liabilities– The MAC of a portfolio is equal to a
weighted average of the individual MACs 1 2
p 1 21 2 1 2
Value ValueMAC MAC MAC
Value Value Value Value

Francis & Ibbotson
Chapter 21: Interest Rate Risk and Horizon Risk 3737
Duration MatchingDuration Matching
Financial institutions routinely perform duration matching strategies– Called asset-liability management (ALM)
Duration matching is necessary but not sufficient to achieve immunization– If CFs are spread over a wide range of times
must meet all of these conditions to effectively immunize
• DurationAssets = DurationLiabilities
• PVAssets = PVLiabilities
• DispersionAssets = DispersionLiabilities

Francis & Ibbotson
Chapter 21: Interest Rate Risk and Horizon Risk 3838
Duration Wandering and Portfolio RebalancingDuration Wandering and Portfolio Rebalancing
A bond’s duration does not decrease on a one-to-one basis with time
Market interest rates impact durations– For these reasons portfolios must be
rebalanced to maintain a duration that will eliminate interest rate risk
• Annual or semi-annual rebalancing may be sufficient for certain assets/liability characteristics
Francis & Ibbotson
Chapter 21: Interest Rate Risk and Horizon Risk 3939
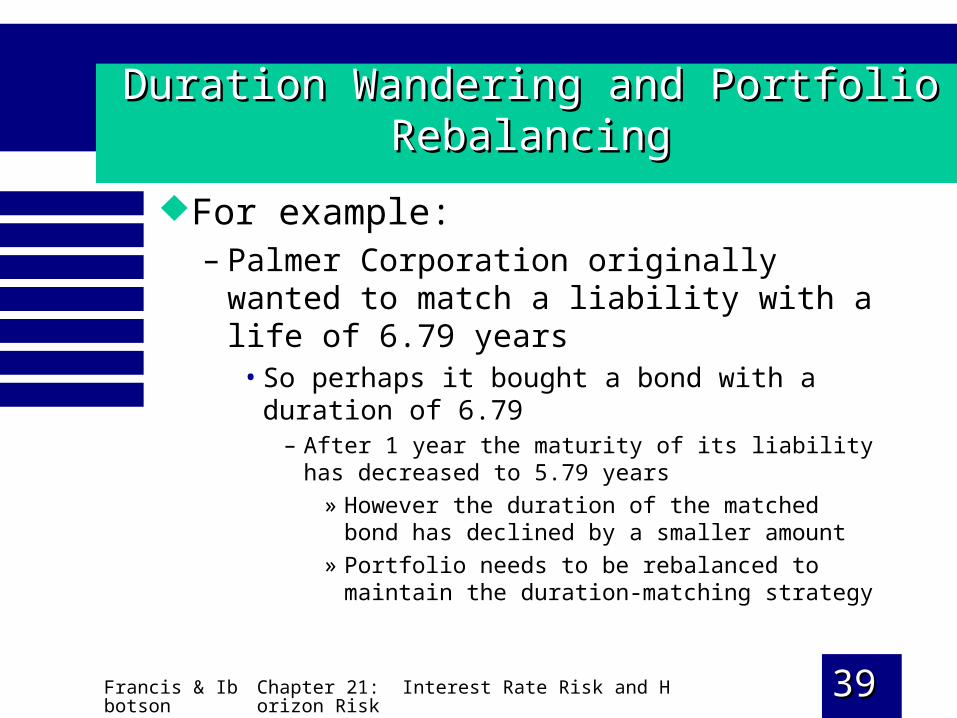
Duration Wandering and Portfolio RebalancingDuration Wandering and Portfolio Rebalancing
For example:– Palmer Corporation originally wanted to
match a liability with a life of 6.79 years• So perhaps it bought a bond with a duration of
6.79– After 1 year the maturity of its liability has
decreased to 5.79 years
» However the duration of the matched bond has declined by a smaller amount
» Portfolio needs to be rebalanced to maintain the duration-matching strategy
Francis & Ibbotson
Chapter 21: Interest Rate Risk and Horizon Risk 4040
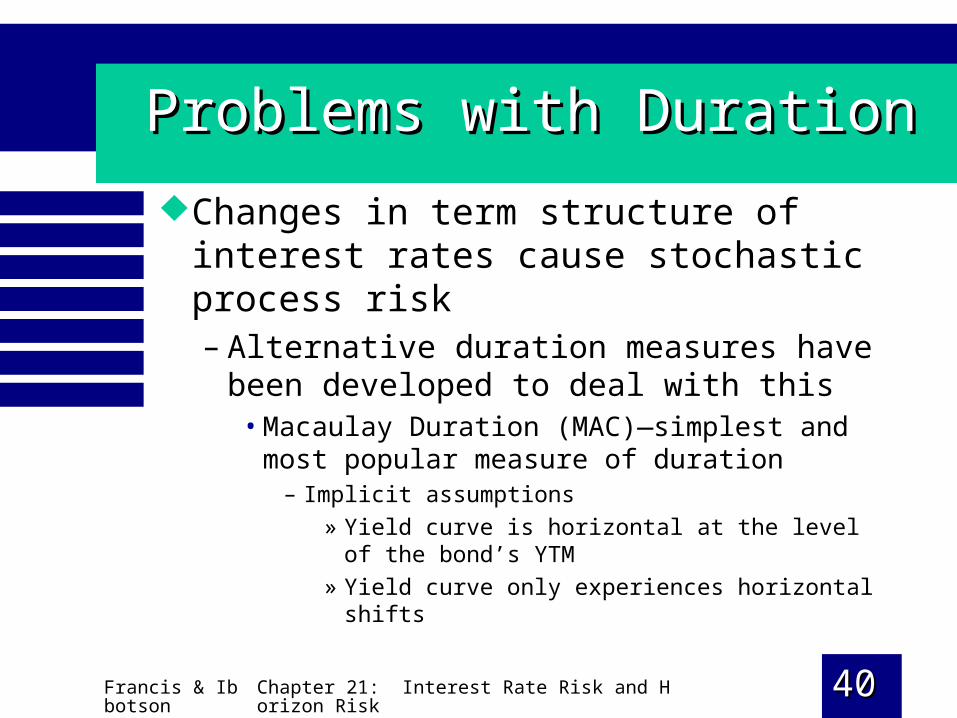
Problems with DurationProblems with Duration
Changes in term structure of interest rates cause stochastic process risk– Alternative duration measures have been
developed to deal with this• Macaulay Duration (MAC)—simplest and
most popular measure of duration– Implicit assumptions
» Yield curve is horizontal at the level of the bond’s YTM
» Yield curve only experiences horizontal shifts
Francis & Ibbotson
Chapter 21: Interest Rate Risk and Horizon Risk 4141
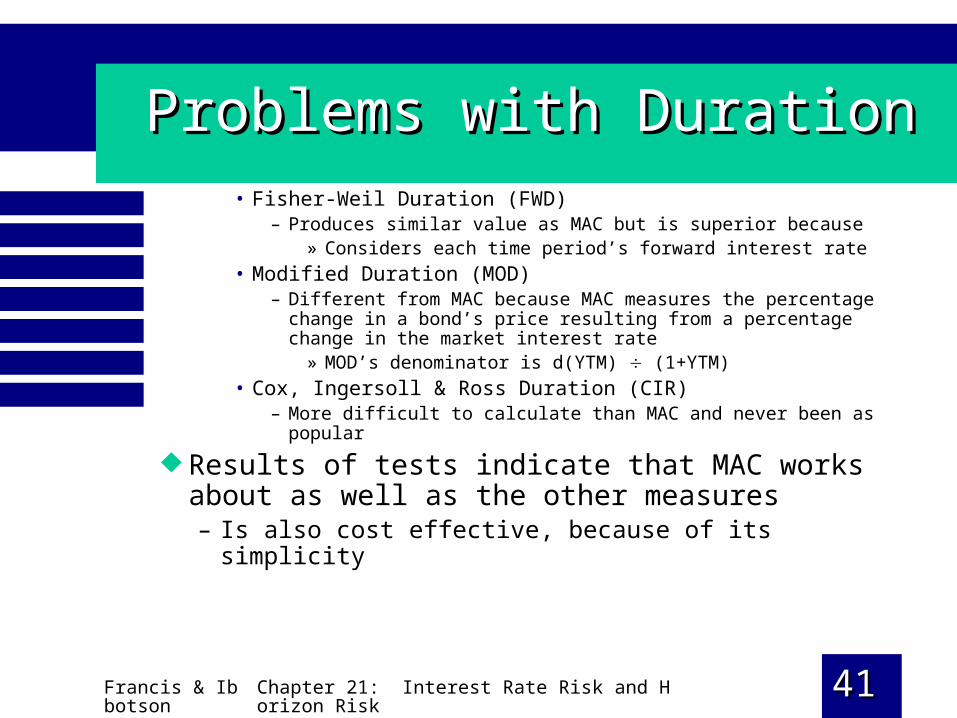
Problems with DurationProblems with Duration• Fisher-Weil Duration (FWD)
– Produces similar value as MAC but is superior because» Considers each time period’s forward interest rate
• Modified Duration (MOD)– Different from MAC because MAC measures the
percentage change in a bond’s price resulting from a percentage change in the market interest rate
» MOD’s denominator is d(YTM) (1+YTM)
• Cox, Ingersoll & Ross Duration (CIR)– More difficult to calculate than MAC and never been as
popular
Results of tests indicate that MAC works about as well as the other measures– Is also cost effective, because of its simplicity
Francis & Ibbotson
Chapter 21: Interest Rate Risk and Horizon Risk 4242
Problems with DurationProblems with Duration
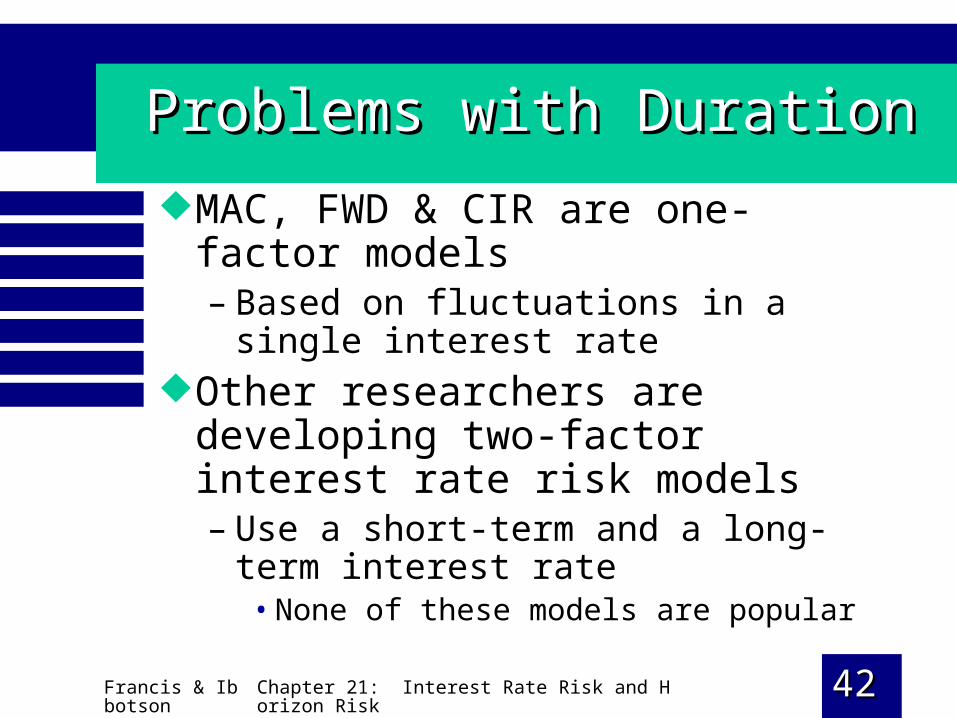
MAC, FWD & CIR are one-factor models– Based on fluctuations in a single interest
rate
Other researchers are developing two-factor interest rate risk models– Use a short-term and a long-term interest
rate• None of these models are popular
Francis & Ibbotson
Chapter 21: Interest Rate Risk and Horizon Risk 4343
Horizon AnalysisHorizon Analysis
A bond buyer’s investment horizon is often different from a bond’s maturity horizon– Investor should perform a horizon
analysis for every potential bond investment
• Horizon return—a bond’s total return including CFs and price changes over relevant investment horizon
Francis & Ibbotson
Chapter 21: Interest Rate Risk and Horizon Risk 4444
Horizon AnalysisHorizon Analysis
Some investors rely only upon a bond’s YTM– Don’t calculate horizon return because it requires
estimates about future interest rates• Horizon analysis is important—need to analyze
different interest rate scenarios
Contingent immunization– Combines active management and immunization
• Portfolio manager may actively manage a portfolio so long as it earns a minimum safety net return
– If safety net return is not earned manager is terminated and remaining assets are immunized

Francis & Ibbotson
Chapter 21: Interest Rate Risk and Horizon Risk 4545
The Bottom LineThe Bottom Line
Behavior of bond prices– Bond prices move inversely to YTM– A bond’s interest rate risk usually increases with
the time to maturity (horizon risk)• However, risk increases at a decreasing rate
– Price changes resulting from an equal-size change in a bond’s YTM are asymmetrical
• A decrease in YTM increases prices by more than an equal increase in YTM decreases prices
– Coupon-paying bonds are influenced by the size of their coupon rates

Francis & Ibbotson
Chapter 21: Interest Rate Risk and Horizon Risk 4646
The Bottom LineThe Bottom Line Duration Axioms
– Duration measures the average length of time funds are tied up in an investment
– MAC is less than maturity for a coupon-paying bond and equals maturity for a zero
• MOD is less than MAC
– Duration always varies directly with a bond’s maturity for zeros and bonds selling above or at par, and usually for bonds selling at a discount
– All other factors equal, duration varies inversely with YTM for a non-zero
– MAC equals a bond’s interest rate elasticity– Duration is a linear forecast of a bond’s price movement relative
to YTM changes• Only accurate for small changes in YTM
– MAC has a limiting value
Francis & Ibbotson
Chapter 21: Interest Rate Risk and Horizon Risk 4747
The Bottom LineThe Bottom Line
Interest rate risk axioms– Interest rate risk usually increases directly with MAC,
MOD, elasticity and term to maturity
– Immunization is used to reduce or eliminate interest rate risk
– Asset-liability management may also be used to manage interest rate risk as well as market and/or credit risk
– Positive convexity exists for option-free bonds but some embedded bonds may have negative convexity
– If a bond will not be held to its maturity a horizon analysis should be performed