Embed Size (px)
Citation preview

1
Horizontal Inequalities and Conflict
By
Frances Stewart
The opinions expressed in this Presentation are those of the authors’ and do not necessarily represent those of the UNDP, the United Nations (UN), or any of its affiliated organisations. The text and data in this Presentation may be reproduced for non-commercial purposes with attribution to the copyright holder.

333
Inequality and Conflict
‘Remove the secondary causes that haveproduced the great convulsions of the world andyou will almost always find the principle ofinequality at the bottom. Either the poor haveattempted to plunder the rich, or the rich to enslavethe poor. If, then, a society can ever be founded inwhich everyman shall have something to keep andlittle to take from others, much will have been donefor peace’ (de Tocqueville 1835, quote from 1954 (de Tocqueville 1835, quote from 1954
edition,: 266)edition,: 266)

4
Plan
• Horizontal inequalities: what they are; how they may relate to conflict.
• Review of some of our findings
• Policy implications
55
Trends in violent conflicts
• Number of serious wars rising since 1950.
• Mostly within countries
• Acceleration immediately after 1989 (end Cold War).
• Substantial decline over last decade.
• But proportion of ‘ethnic’ conflict rising

6Source: Nils Petter Gleditsch, Peter Wallensteen, Mikael Eriksson, Margareta Sollenberg & Håvard Strand, 2000, ‘Armed Conflict 1946–2000: A New Dataset’, www.pcr.uu.se.
Number of conflicts by level: all types
777
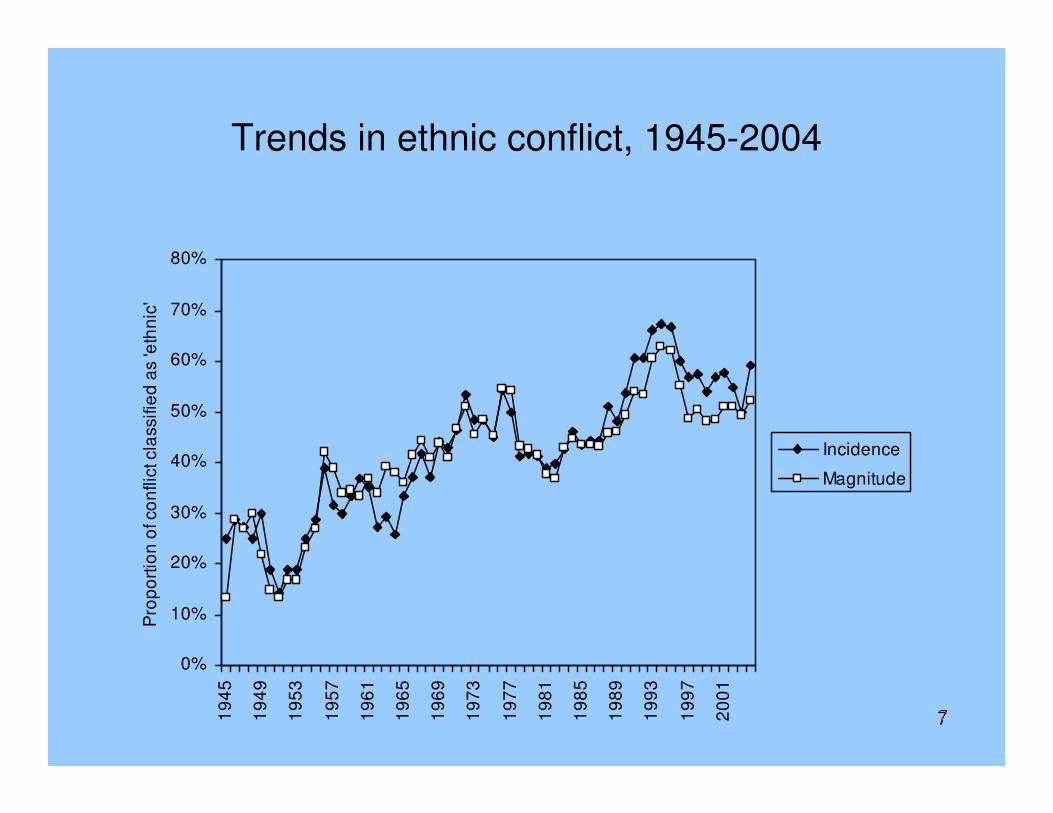
Trends in ethnic conflict, 1945-2004
0%
10%
20%
30%
40%
50%
60%
70%
80%
19
45
19
49
19
53
19
57
19
61
19
65
19
69
19
73
19
77
19
81
19
85
19
89
19
93
19
97
20
01
Pro
po
rtio
n o
f co
nflic
t cla
ssifie
d a
s 'e
thn
ic'
Incidence
Magnitude
888
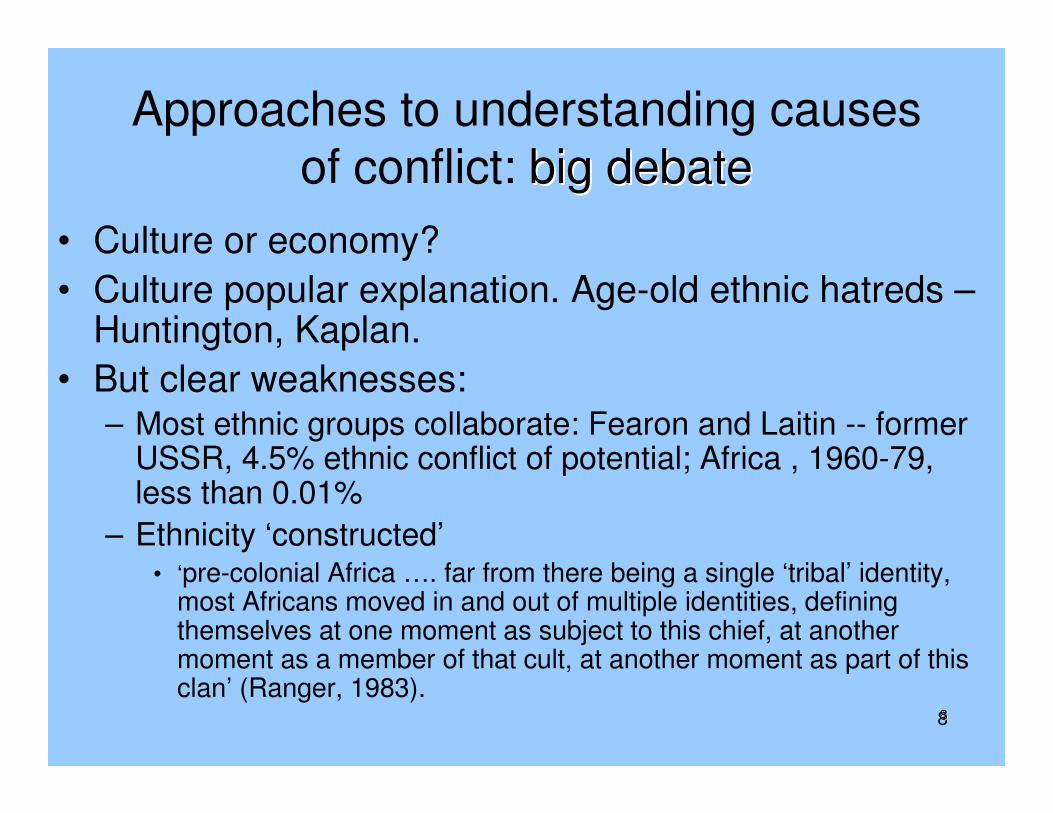
Approaches to understanding causes of conflict: big debatebig debate
• Culture or economy?
• Culture popular explanation. Age-old ethnic hatreds –Huntington, Kaplan.
• But clear weaknesses:– Most ethnic groups collaborate: Fearon and Laitin -- former
USSR, 4.5% ethnic conflict of potential; Africa , 1960-79, less than 0.01%
– Ethnicity ‘constructed’• ‘pre-colonial Africa …. far from there being a single ‘tribal’ identity,
most Africans moved in and out of multiple identities, defining themselves at one moment as subject to this chief, at another moment as a member of that cult, at another moment as part of this clan’ (Ranger, 1983).

Economy and culture
• Yet economic explanations (individualistic) deny role of ethnicity altogether.
• Horizontal inequalities (HIs) brings ethnicity and socio-economic motives together.
9

101010
Horizontal Inequality = inequalitybetween groups
• What groups? – groups with meaning to members, viewed by people themselves, or others as important aspect of identity.
• Examples of salient identities:
– Ethnic/’tribe’: African
– Religious: most regions – notable N.Ireland; Middle East; Indonesia; Nigeria
– Race – e.g. South Africa; Malaysia; Fiji
– Regional (overlaps with other identities) – E.Timor; Eritrea, Bangladesh.
– Caste (S.Asia)

111111
HIs are Multidimensional
• Dimensions - those that matter to members –affect well-being, sense of injustice, actions.
• Salient dimensions vary according to nature of society/economy, and position (leaders/followers).
• Important dimensions:– Politics (political participation, power, at all levels).
– Economic resources and outcomes (access to assets, employment, incomes).
– Social, including services (health/education/water..; and social networks).
– Cultural recognition. Treatment of religion/customs etc.

121212
Important question: what determines group boundaries?
• Identities ‘constructed not primordial.• But not plucked from air – constrained by history,
language etc. Shared markers (language, behaviour, rituals, religious practices).
• Still ‘boundaries’ can be somewhat arbitrary. – Multiple identities. – Fluid. Mestizo in Latin America. ‘Indigenous, ‘cholo’.– Salient groups can change over time. (Moslems in Sri
Lanka; Iwerri in Biafra).
• Our surveys indicate multiple identities; and religion more important than ethnicity, West Africa. Yet ethnicity important for political mobilisation for voting and for violent conflict.

13
Fighting groups
• Despite ‘constructed’ nature, ethnic differences real to participants.
• The ‘very effectiveness [of ethnicity] as a means of advancing group interests depends upon its being seen as “primordial” by those who make claims in its name’ [Turton].
• Real enough to fight and die for.
141414
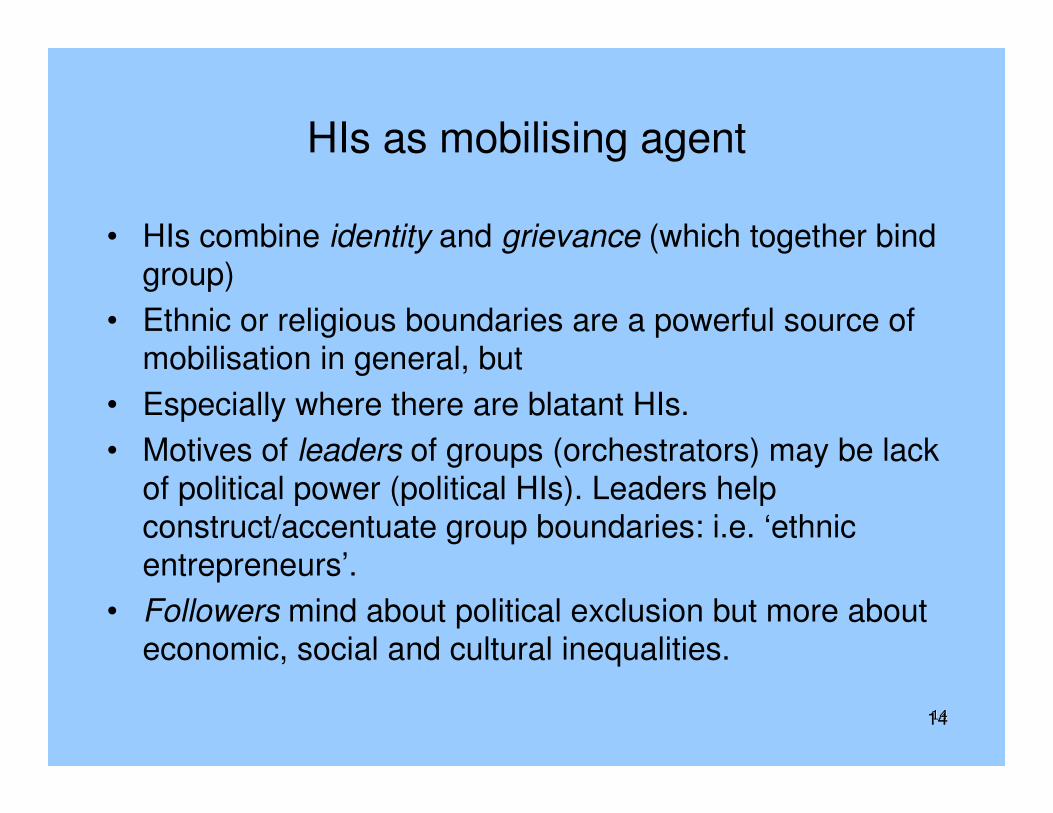
HIs as mobilising agent
• HIs combine identity and grievance (which together bind group)
• Ethnic or religious boundaries are a powerful source of mobilisation in general, but
• Especially where there are blatant HIs.
• Motives of leaders of groups (orchestrators) may be lack of political power (political HIs). Leaders help construct/accentuate group boundaries: i.e. ‘ethnic entrepreneurs’.
• Followers mind about political exclusion but more about economic, social and cultural inequalities.

151515
HIs and Political instability: many examples
Genocide:– Rwanda;– Pre-war German.
Violent conflict:– Kosova;– Sri Lanka;– Nepal– Indonesia (Aceh; East Timor).– Sudan
Also riots:– US cities in 1970s– Sporadic, cities in UK– City riots in India.
• Also applies internationally : Moslem/Western divide.

161616
Research into Horizontal Inequalities and Conflict: some findings
• Research mainly by Centre for Research on Inequality, Human Security and Ethnicity Research (CRISE) programme (2003-9),
• Objective: to study multiethnic societies, investigating why some experience political instability and violent conflict, often labelled as ‘ethnic’, while others manage to solve disputes relatively peacefully.
• Major hypothesis: That existence of high Horizontal Inequalities makes conflict more likely, where Horizontal Inequalities are inequalities among culturally perceived groups.

171717
Programme coverage
• Three region/eight countries; plus some global analysis.
• West Africa:– Ghana/Cote d’Ivoire/Nigeria
• SEAsia– Indonesia/Malaysia (and a little elsewhere).
• Latin America– Bolivia/Guatemala/Peru.

181818
HIs large in our countries•• BoliviaBolivia: IMR of indigenous population 50 per cent higher : IMR of indigenous population 50 per cent higher
than than nonindigenousnonindigenous
•• PeruPeru: the proportion of indigenous with secondary : the proportion of indigenous with secondary schooling 1/5 that of whites schooling 1/5 that of whites
•• GuatemalaGuatemala: 20% of indigenous population in extreme : 20% of indigenous population in extreme poverty in 2000; 5% poverty in 2000; 5% nonindigenousnonindigenous..
•• NigeriaNigeria: maternal mortality rates in northeast are 9 times : maternal mortality rates in northeast are 9 times in southwest. in southwest.
•• Côte dCôte d’’Ivoire:Ivoire: the literacy rate for Northern the literacy rate for Northern MandeMande is just is just 23 per cent, half the rate among the 23 per cent, half the rate among the AkanAkan
•• Ghana:Ghana: Northern Region child mortality rate is nearly 2.5 Northern Region child mortality rate is nearly 2.5 times Ghana as a whole times Ghana as a whole
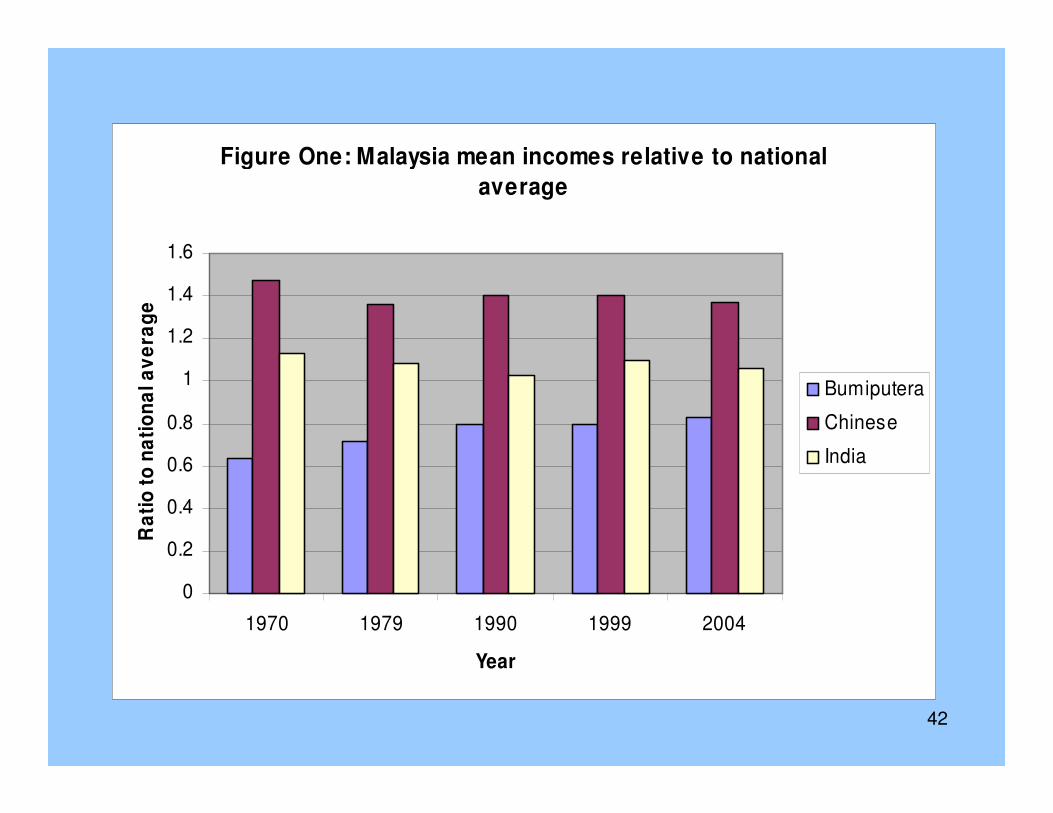
•• Malaysia: Malaysia: despite considerable improvement, Chinese despite considerable improvement, Chinese incomes on average, over 1.6 times Malays.incomes on average, over 1.6 times Malays.
•• Indonesia: Indonesia: per capita income E. Kalimantan 3 times per capita income E. Kalimantan 3 times Aceh; poverty in Aceh one and half times poverty rate in Aceh; poverty in Aceh one and half times poverty rate in E.KalimantanE.Kalimantan
191919
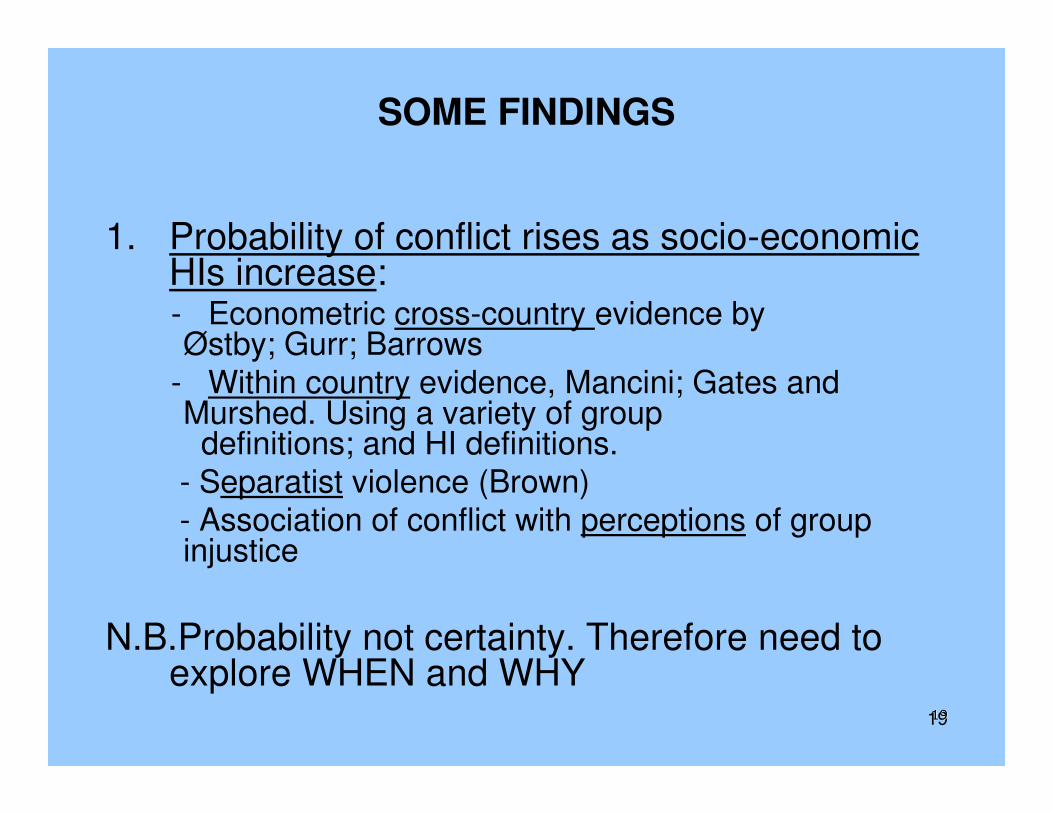
SOME FINDINGS
1. Probability of conflict rises as socio-economic HIs increase: - Econometric cross-country evidence by Østby; Gurr; Barrows
- Within country evidence, Mancini; Gates and Murshed. Using a variety of group
definitions; and HI definitions.- Separatist violence (Brown)- Association of conflict with perceptions of group injustice
N.B.Probability not certainty. Therefore need to explore WHEN and WHY
202020
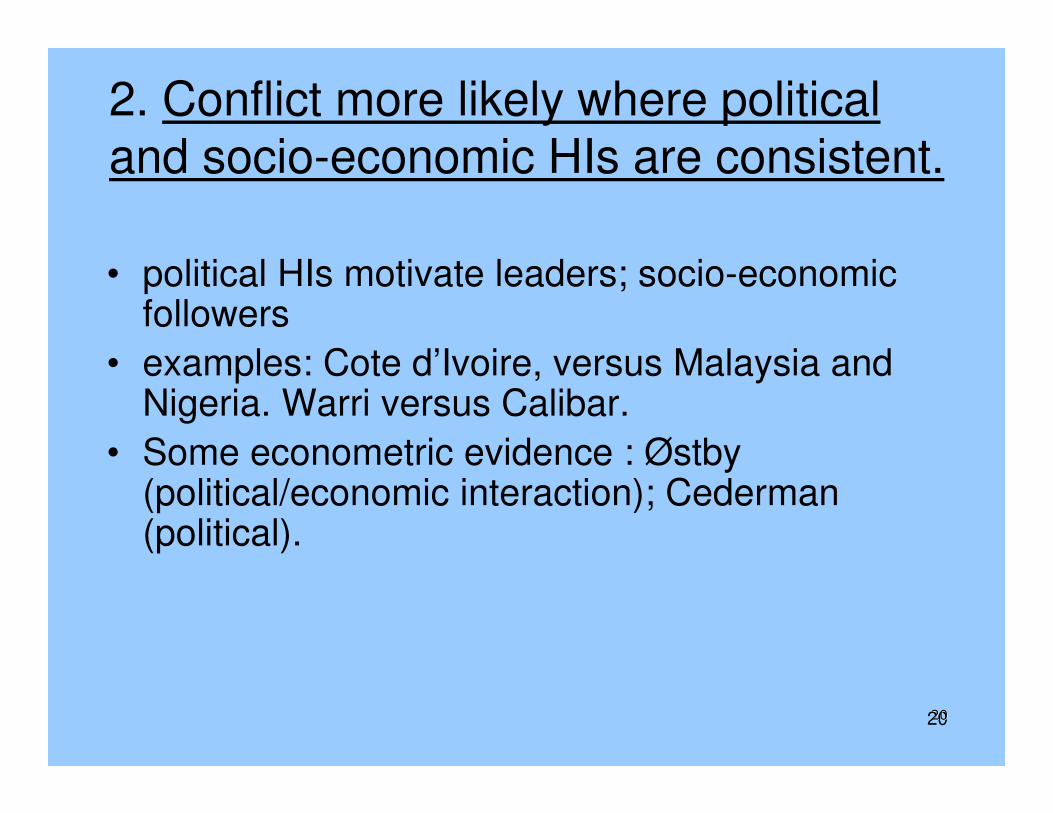
2. Conflict more likely where political and socio-economic HIs are consistent.
• political HIs motivate leaders; socio-economic followers
• examples: Cote d’Ivoire, versus Malaysia and Nigeria. Warri versus Calibar.
• Some econometric evidence : Østby(political/economic interaction); Cederman(political).

212121
3. Inclusive government tends to prevent conflict.
- Econometric evidence shows that PR and federalism tend to reduce conflict probability.
- Contrast Bolivia and Peru and Guatemala; Ghana and Nigeria and Côted’Ivoire.
222222
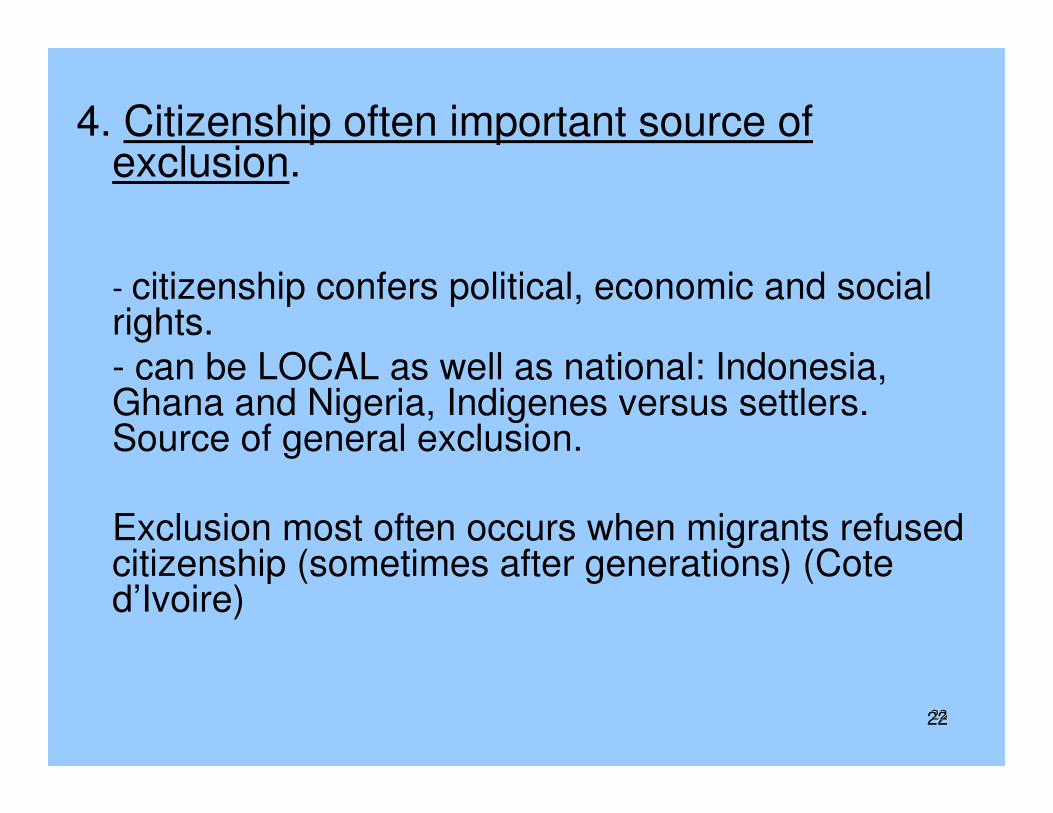
4. Citizenship often important source of exclusion.
- citizenship confers political, economic and social rights.- can be LOCAL as well as national: Indonesia, Ghana and Nigeria, Indigenes versus settlers. Source of general exclusion.
Exclusion most often occurs when migrants refused citizenship (sometimes after generations) (Cote d’Ivoire)
232323
5. Cultural status inequalities important• Where sharp they bind people together and help
mobilise people
• Represent powerful grievance in themselves
• Can be a major source of other inequalities (e.g. language restrictions).
• Events often act as a trigger – Orange Marches; destruction of mosque.

242424
6.. Perceptions important as much as ‘observed’ inequalities.
- E.g. in Nigeria and Ghana, don’t perceive big differences in access to education, but do perceive differences in access to govt. jobs and contracts.
- In Nigeria, with broadly same HIs as Ghana, people generally perceive themselves as more ethnic and less national. . And perceive sharper inequalities

252525
7. . Natural resources can be important source of HI, creating:
- regional inequalities in incomes
- regional resentments about redistribution
- within region inequalities
- examples: Indonesia; Nigeria.
One mechanism linking NR to conflict –others include finance, and greed.

262626
8. . Nature of state hugely important influencing whether HIs lead to conflict.
- state accommodating in Ghana conflicts; less so in rest of West Africa.
- state actions in Aceh, Indonesia, and Guatemala fueled and prolonged conflict.
- accommodating state in Sabah, Malaysia prevented violent separatism in contrast to Thailand, Philippines, East Timor.
272727
9. Many HIs very persistent.
• Persistent inequalities in Ghana (North-South); US black-white; indigenous people, Latin America…
• Sometimes last centuries.
• Wellbeing impact worse because of this.

282828
THE PERSISTENCE OF HISTHE PERSISTENCE OF HISTHE PERSISTENCE OF HISTHE PERSISTENCE OF HIS
North South inequalities in Ghana over 60 years
Infant mortalityGold Coast, 1931 Ghana, 1993
Northern Territories 1.26 1.20, 1.73, 1.29
National average 1.00 1.00

292929
Policy conclusions
• When HIs are significant they make conflict more likely.
• Policy needs to address them, in all economies with marked inequalities, not only those coming out of conflict.
• Important for general wellbeing and poverty reduction as well as political stability
• NOT included mostly in economic or political policies..
303030
International policies pay less attention to HIs than national
policies in some countries
• HIs mostly neglected, in international policy:– Aid, often worsens HIs (e.g. Burundi).– And structural adjustment policies– Ignored in most PRSPs– Also in much political conditionality – towards elections
and multiparty democracy– But (implicitly) partially included in ’Human rights
approach’; and Social exclusion approach.
• More often included in national policies.

313131
Three types of policy
• Direct policies– targeted. Can be effective. But can lead to opposition and entrench ethnicity. May need to be time limited.
• Indirect policies – may be less effective, but also arouse less hostility.
• Towards greater integration – very long term; but complementary to other policies.

32
Policy approach
Direct HI-reducing Indirect HI-reducing Integrationist
Political
Group quotas; seat
reservations;
consociational
constitution; ‘list’ PR
Voting system;
human rights
legislation and
enforcement
National party
stipulations
Socioeconomic
Quotas for employment
or education; special
investment or credit
programmes for
particular groups
Anti-discrimination
legislation;
progressive
taxation;
regional
development
programmes;
universal
education/health
etc
Support for cross-
group economic
activities; schools
multicultural
schools
Cultural status
Minority language
recognition/education;
symbolic recognition in
public holidays, at state
functions
Freedom of religious
observance;
no state religion
Civic citizenship
education;
promotion of
national identity;
multicultural civic
institutions
333333
Policies towards political HIs
• Critical importance; reduce leadership motives; and contribute to correcting socio-economic and cultural inequalities
• Structures needed to ensure that each group participates in political decision-making and power. Not Westminster majoritarian political system plus winner takes all.
• Power sharing is NOT natural consequence of the way many understand democracy.
• NB Participation important at many levels (central, regional, local) and in different types of decision (defence, economic, social) and in different activities (army, police, civil service).

343434
Policies towards political HIs
• Indirect:– Federal or unitary (and design)
– Extent and nature of decentralisation
– Voting system – majoritarian; PR; alternative vote.
– Voting system within assemblies.
– Constitutional guarantee of rights and freedoms
• Direct.– Reserved seats.
– Job allocation (and numbers). Three Presidents in Bosnia-Herzogovinia;all levels of government
– Political parties:• Restrictions on parties
– Citizenship rights. Who is a citizen?

353535
Policies towards socio-economic HIs
• Indirect– Legal rights; anti-discrimination
– Progressive taxes and expenditure
– Redesign of incentives (inc. macro policies) according to ethnic specialisation.
– Comprehensive services (health, education etc. But also an issue of quality)
• Direct– Quotas and targets towards education; asset
ownership; employment; subsidies; government procurement..

363636
Some direct socio-economic policies
• Assets – Land (Malaysia; Zimbabwe; Fiji; Namibia)– Financial capital (Malaysia; S.Africa)– Terms of privatisation – often unequalising– Credit (Fiji; Malaysia)– Education (Malaysia; Sri Lanka).– Skills and training (Brazil, New Zealand)– Public sector infrastructure (S.Africa).– Housing (N.Ireland).– Social capital? [neighbourhoods; clubs]
• Incomes– Employment policies;
• Public sector (Malaysia; Sri Lanka)• Private sector (S.Africa)

Costs of direct policies?• Do they encourage inefficiency? No evidence for
this.
• Do they worsen within-group inequality? (e.g. S.Africa). Depends on the policies. Important that policies are directed at all income groups, especially poorer ones.
• Do they tend to increase corruption? Depends on nature of policies and culture of society.
• Do they entrench difference and worsen group relations? Some tendency.
37
383838
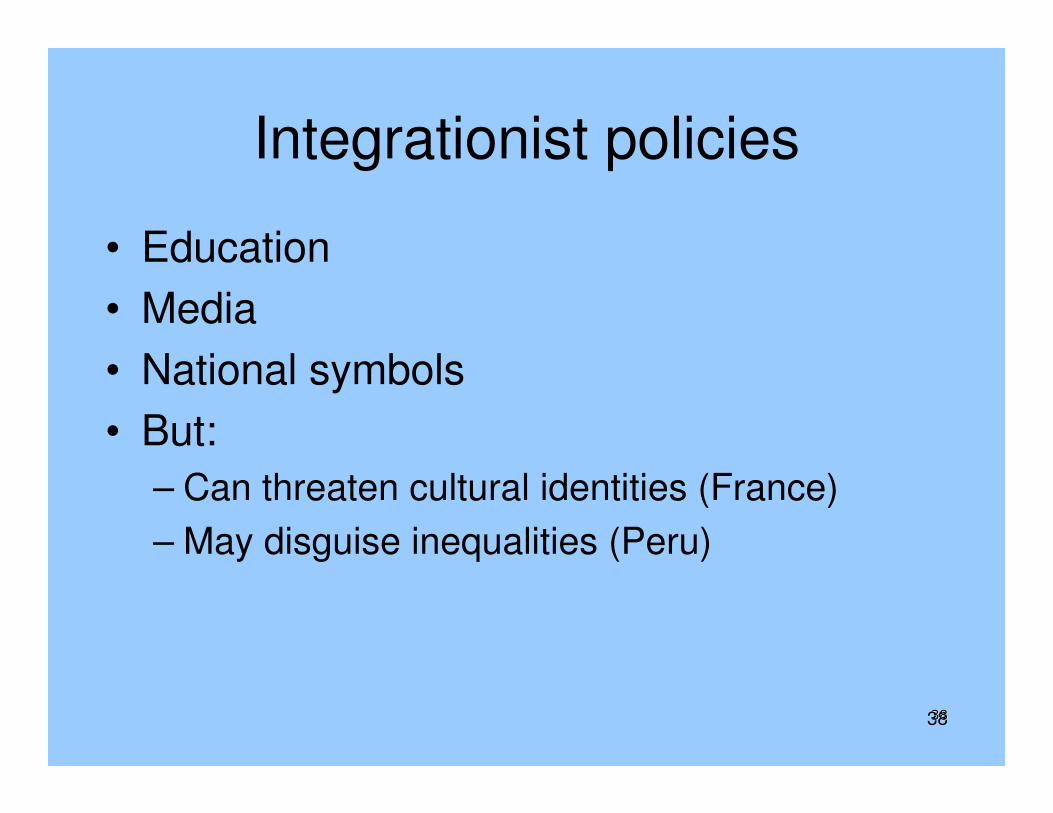
Integrationist policies
• Education
• Media
• National symbols
• But:
– Can threaten cultural identities (France)
– May disguise inequalities (Peru)

Three cases of effective policies
1. Malaysia: post-riots, reduction in socio-economic HIs, with direct and indirect policies.
2. Nepal: post-conflict policies for correction of political and socio-economic inequalities; policies not fully implemented. Area and group targeting.
3. N.Ireland: pre-peace reduction in HIs(direct and indirect) policies – mostly indirect. 39
404040
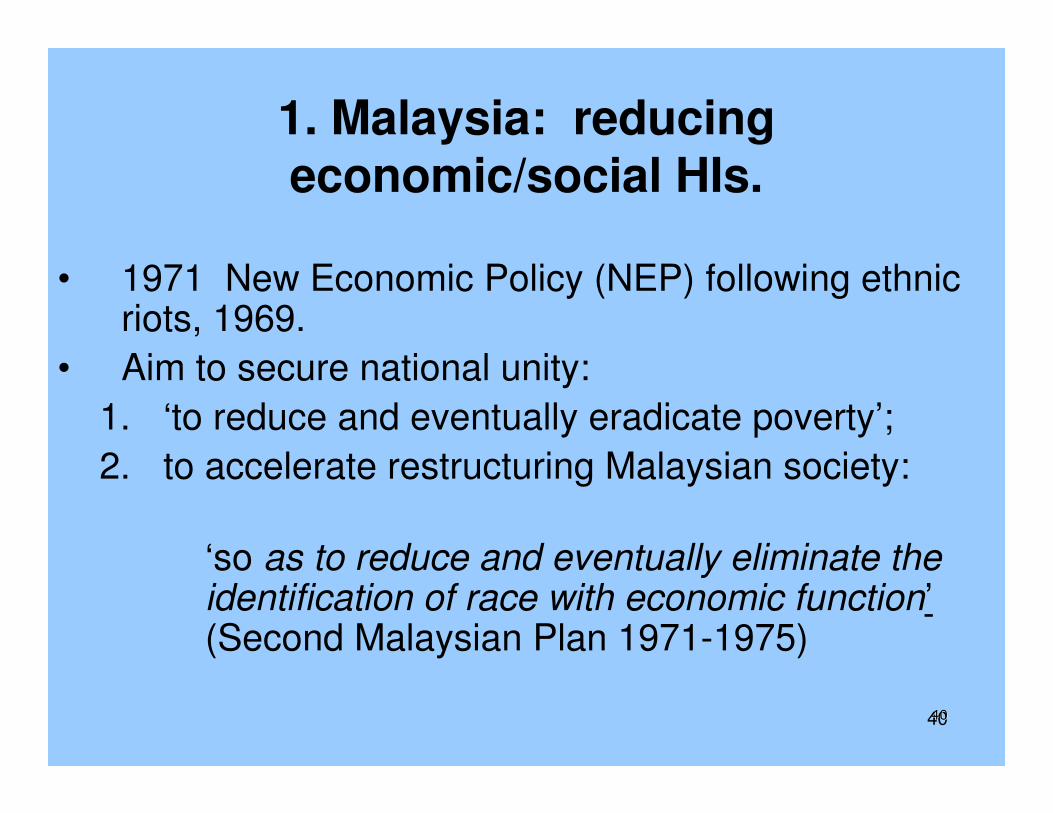
1. Malaysia: reducing economic/social HIs.
• 1971 New Economic Policy (NEP) following ethnic riots, 1969.
• Aim to secure national unity:
1. ‘to reduce and eventually eradicate poverty’;
2. to accelerate restructuring Malaysian society:
‘so as to reduce and eventually eliminate the identification of race with economic function’(Second Malaysian Plan 1971-1975)

41
Malaysia policies
– a variety of anti-poverty policies (rural development; social services).
– restructuring:
oexpand Bumiputera share of capital ownership to 30%.
o95% of new lands to be settled on Malays;
oeducational quotas in public institutions laid down, in line with population shares;
ocredit policies favoured Malays, with credit allocations and more favourable interest rates.
42
Figure One: Malaysia mean incomes relative to national
average
0
0.2
0.4
0.6
0.8
1
1.2
1.4
1.6
1970 1979 1990 1999 2004
Year
Ra
tio
to
na
tio
na
l a
ve
rag
e
Bumiputera
Chinese
India

The Malaysian approach
• Based on national consensus. Much accomplished.
• Important contribution to political stability especially in first decade.
• Accompanied by rapid growth and poverty reduction.
• But has national consensus been maintained?
• Some left out?
• A case for a shift to indirect approach?
43

2. Nepal
• Following end of conflict, academic and political analysis recognised that HIs were important source of conflict.
• E,g, DFID Report: “Group inequality based on caste, gender, ethnicity and geography has been a critical factor in Nepal’s conflict’
• Need to reduce HIs, recognised in Peace Settlement and political settlement incorporated members of all groups in parliament.
44

Government and donors decided to incorporate HIs in socio-economic
policies• Govt introduced employment programme with
100 days guaranteed employment in 5 districts severely impacted by conflict. Extended to 24 mountainous districts by World Bank.
• Schemes for community infrastructure and income generation targeted by ethnicity, caste and poverty.
• Other schemes by other donors.
• Not yet fully evaluated but implementation may be a problem.
45

464646
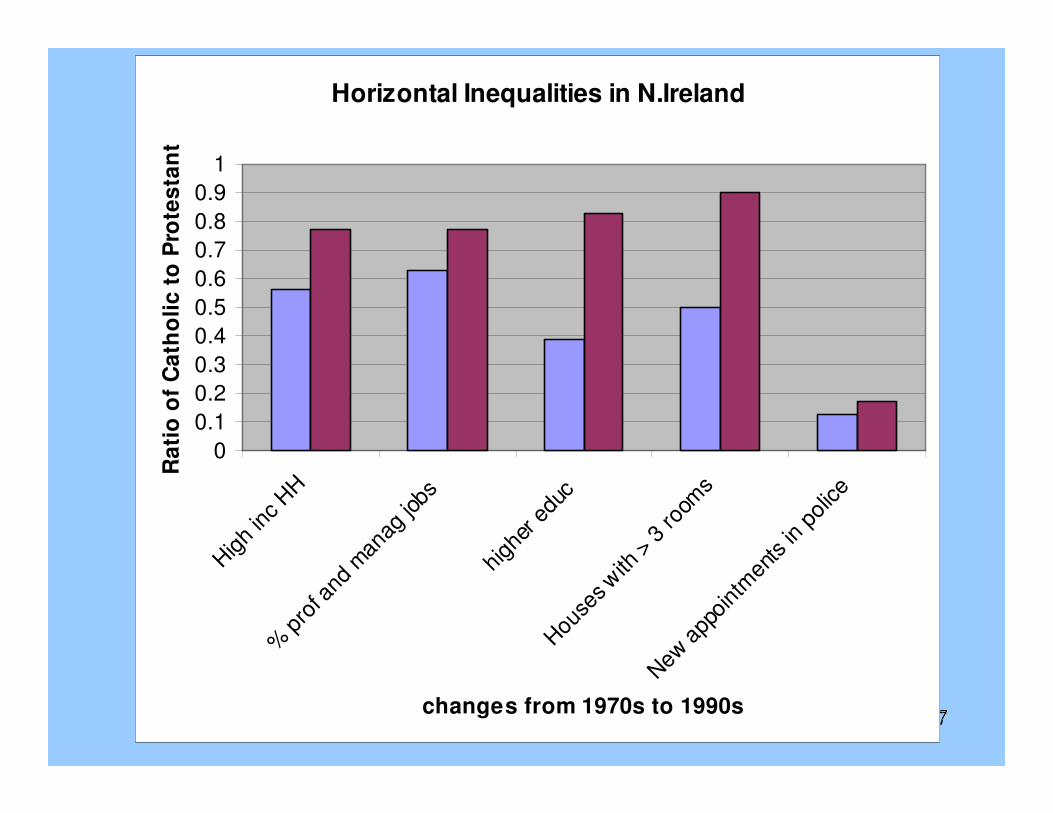
3. N.Ireland: economic changes underlying political ones
• HIs large, persistent and consistent over all dimensions over a long time period
• ‘By the end of the nineteenth century Protestants controlled the vast bulk of the economic resources of east Ulster - the best of its land, its industrial and financial capital, commercial and business networks, industrial skills’ (Ruane and Todd 1996)
• No narrowing of gap from 1901 to 1970s -- Catholics disadvantaged at every level.
• New policies to reduce gaps from late 1970s: Fair Employment Acts, 1976; 1989; housing policy. Police Acts 1998,2000, 2003: 50% recruitment aim.
474747
Horizontal Inequalities in N.Ireland
0
0.1
0.2
0.3
0.4
0.5
0.6
0.7
0.8
0.9
1
Hig
h in
c H
H%
pro
f and
man
ag jo
bs
high
er e
duc
Hou
ses
with
> 3
room
s
New
app
oint
men
ts in
pol
ice
changes from 1970s to 1990s
Ra
tio
of
Ca
tho
lic
to
Pro
tes
tan
t

484848
N. Ireland: intervention on N. Ireland: intervention on HIsHIs and peaceand peace
Good Fri agreement
‘Troubles’
Good Fridayagreement

494949
But too little effort to integrate communities
• Malaysia least integrated of all CRISE countries according to surveys.
• N.Ireland: surveys show poor relations

505050
Finally, international dimension
1. International dimensions to the issue: economic/social/political/cultural – across Islam/West divide.
2. Needs to be tackled at multidimensional/multisite levels.
1. Within west in political and economic terms.
2. Between countries, in political and economic terms.
3. And within developing countries.
515151
Summary of conclusions on HIs
• Where HIs are large, important to address them.• Range of policies available, economic and political
--can be effective without sacrifice of efficiency. • Mostly have had peace-promoting political
consequences, but political caution needed.• Policies needed in ANY society with sharp
divisions, not only those with recent conflict.• And for international inequalities. • Policies NOT part of many international and often
national policy agendas, including economic and political reform, or aid.
• NB. Other policies also needed, of course.

525252