Embed Size (px)
Citation preview

Instructions for use
Title Horizontal Strain Accumulated in the Erimo region Hokkaido, from 1971 to 1980 Obtained by Geodetic andExtensometric Observations
Author(s) KASAHARA, Minoru
Citation Journal of the Faculty of Science, Hokkaido University. Series 7, Geophysics, 7(4): 327-338
Issue Date 1984-02-29
Doc URL http://hdl.handle.net/2115/8745
Type bulletin
File Information 7(4)_p327-338.pdf
Hokkaido University Collection of Scholarly and Academic Papers : HUSCAP

Jour. Fac. Sci., Hokkaido Univ., Ser. VII (Geophysics), Vol. 7, No.4, 327-338, 1984.
Horizontal Strain Accumulated in the Erimo Region Hokkaido, from 1971 to 1980 Obtained by Geodetic
and Extensometric Observations
Minoru Kasahara
Research Center for Earthquake Prediction Faculty of Science Hokkaido University Sapporo, 060, Japan
(Received November 12, 1983)
Abstract
Secular strain accumulations during the period from 1971 to 1980 around the Erimo Geophysical Observatory (EGO) were obtained by both extensometric observations in the vault of the observatory and repeated measurements of a long base-line network set up around EGO. The accumulations show that the principal strains obtained by the extenso metric observations are +5.9x10- 6 (extension) with N5"E and -1.6 x 10⁻⁶ (contraction) with N85"W, and those by the repeated measurements +4.5x10- 6 with N22"E and -2.0xlO-6 with N6S"E. From this it can be seen that agreement between both results is fairly good in both orientation and amount. This suggests that the extensometric observation in the vault of the EGO could well follow the wide-areal crustal movement progressing around the Erimo region.
1. Introduction
Since 1971, continuous observations of crustal strain variation by three components of fused-quartz extensometer 30 m long has been conducted in the vault of the Erimo Geophysical Observatory (EGO) under the earthquake prediction research program of Japan. One of the most important purposes of the continuous crustal strain observation in the vault is to reveal strain accumulation which may be progressing steadily but is extremely difficult to observe by geodetic surveys. However, this possibility is based on the assumption that the observed result in the vault can represent the wide-areal crustal movement.
A 10hg base-line network was constructed around EGO in 1972 to examine this assumption because the first-order triangulation network of the Geographical Survey Institute of Japan is not placed over the Erimo district. The measurement of length of each base-line has been carried out every year using
328 M. Kasahara
an electro-optical distance-measuring instrument (EDM). Secular strain accumulation has become sufficiently large for 9 years from 1972 to necessitate its discussion beyond the accuracy of the EDM so that both results can be compared with one another.
1420 1t.6 D E ,----,...........--,,46°N
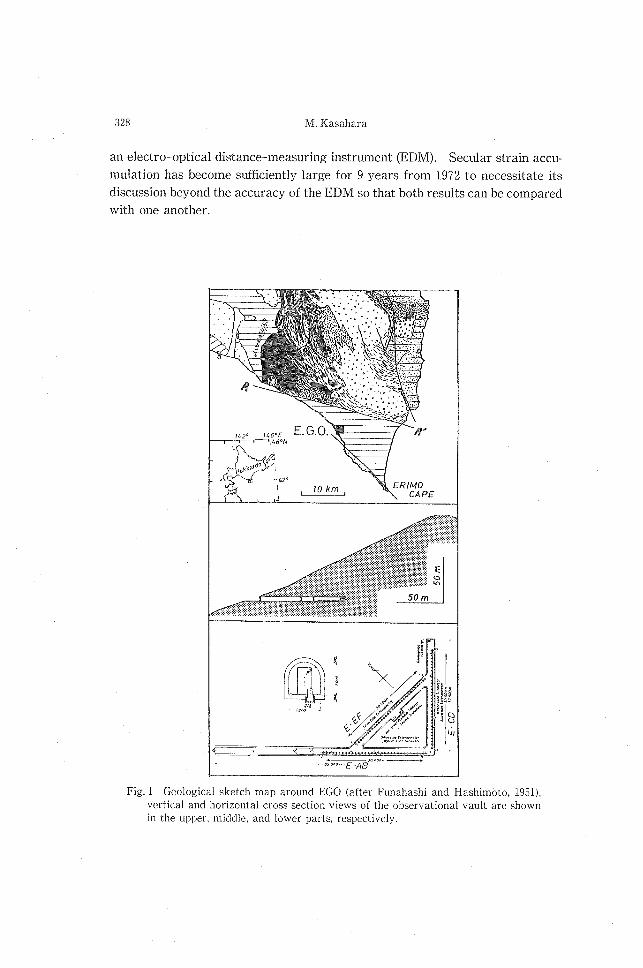
Fig. 1 Geological sketch map around EGO (after Funahashi and Hashimoto, 1951), vertical and horizontal cross section views of the observational vault are shown in the upper, middle, and lower parts, respectively.
Horizontal Strain Accumulated in the Erimo Region Hokkaido 329
mm H~~~~¥~.tJ....I~!..\.-.I!L,...J1.L,W~-II'o
'7/ '72 '73 '74 '75 '76 '77 '78 '79 808/ year
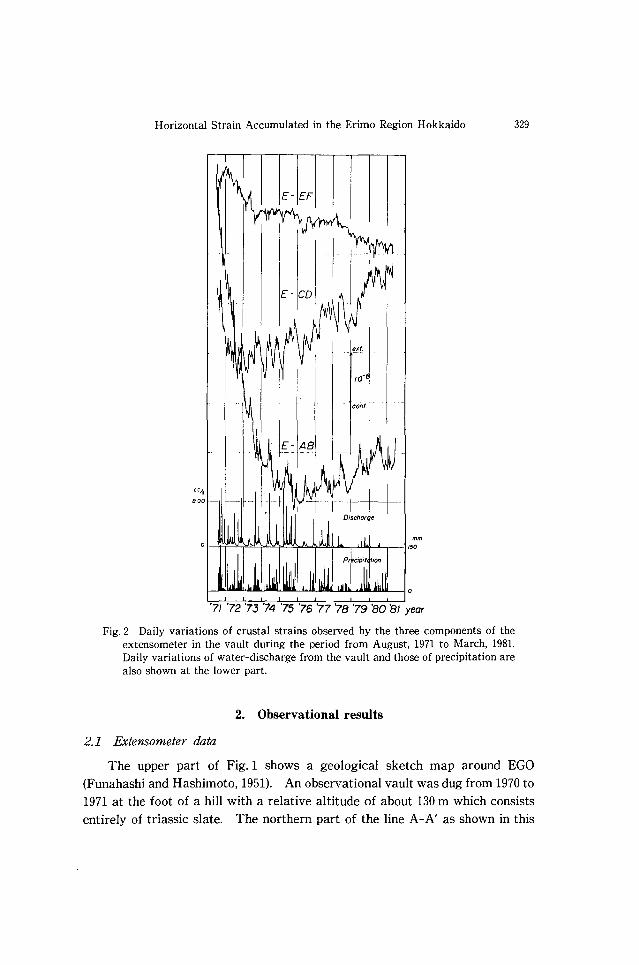
Fig. 2 Daily variations of crustal strains observed by the three components of the extensometer in the vault during the period from August, 1971 to March, 1981. Daily variations of water-discharge from the vault and those of precipitation are also shown at the lower part.
2, Observational results
2.1 Extensometer data
The upper part of Fig. 1 shows a geological sketch map around EGO (Funahashi and Hashimoto, 1951). An observational vault was dug from 1970 to 1971 at the foot of a hill with a relative altitude of about 130 m which consists entirely of triassic slate. The northern part of the line A-A' as shown in this

330 M. Kasahara
Fig.3 Estimated secular strain accumulations subtracting exponential decay drifts of the E~AB and E~CD components from Fig. 2 (an upper curve for each component). Low~pass filtered records longer than 1 year (middle curve) and 4 years (lower curve) are also shown for each component.
figure, called the Horoizumi (the old name of Erimo) Sheared Zone, is occupied by complex metamorphic rocks. On the other hand, the southern part of this line, including the vault, shows uniform geological structure. A cross section along the longest direction of the vault is shown in the middle part of the figure and the ground plane of the vault is shown in the lower part of the figure. Three components of the extensometer installed in the vault named E~ AB (NWSE direction), E-CD (NE-SW), and E-EF (E-W) are shown in the ground plane. A more detailed description of EGO has presented in a previous paper (Kasahara et a!., 1972).
Fig. 2 shows daily variations of the crustal strain observed by the three
Horizontal Strain Accumulated in the Erimo Region Hokkaido 331
components of the extensometers during the period from the beginning of observation in August 1971 to March 1981. Daily variations of precipitation and water discharge from the vault are also shown. Short periodic variations of crustal strain appear to be mainly related to the change of water discharge caused by precipitation as clearly shown in this figure in each of three compo· nents. Considerable variations with a trend of monotonuous contraction in the E-AB and E-CD components are shown in early stage of the observation. These variations are well represented by exponential decay functions and are, therefore, probably caused by the initial deformation of the vault newly con· structed. The results, subtracting these effects, are shown in Fig. 3. The secular variations longer than 1 year and those longer than 4 years which are obtained by digital filtering (Shichi, 1972, 1973) are also shown in this figure. These results are regarded as the secular variations, which accumulated during the last decade, that the extensometers could observe in the vault. The accu· mulation rate of crustal strain observed by the extensometers is about 2 to 3 parts in 107 per year. This rate accords with the stationary strain accumulation rate revealed by triangulation surveys over the whole Japan (N akane, 1973 a, 1973 b).
2.2 Long base-line strain data
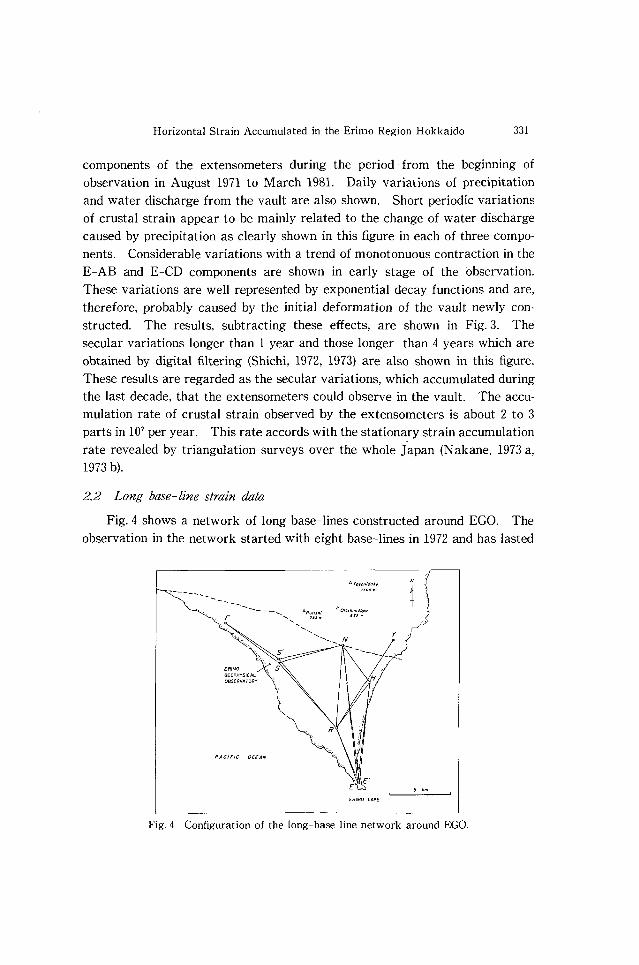
Fig. 4 shows a network of long base-lines constructed around EGO. The observation in the network started with eight base-lines in 1972 and has lasted
"'royonidoh N
+ -- "'RuIIS!!" "'OKiSh,moppu
F 7') ..
ERIMO CAPE
Fig. 4 Configuration of the long-base line network around EGO.
332 M. Kasahara
with fifteen base-lines from 1974 to present. For the observation the 6-A type of Geodimeter was used until 1974. From 1975 the 6-BL has been used as an EDM. The base-line length was determined with the atmospheric refraction correction using air temperatures and barometric pressures observed at both end points. A special pier with an anchoring bolt was constructed to avoid a setting error in each measurement at all points except points E and S which are the third-order triangulation points.
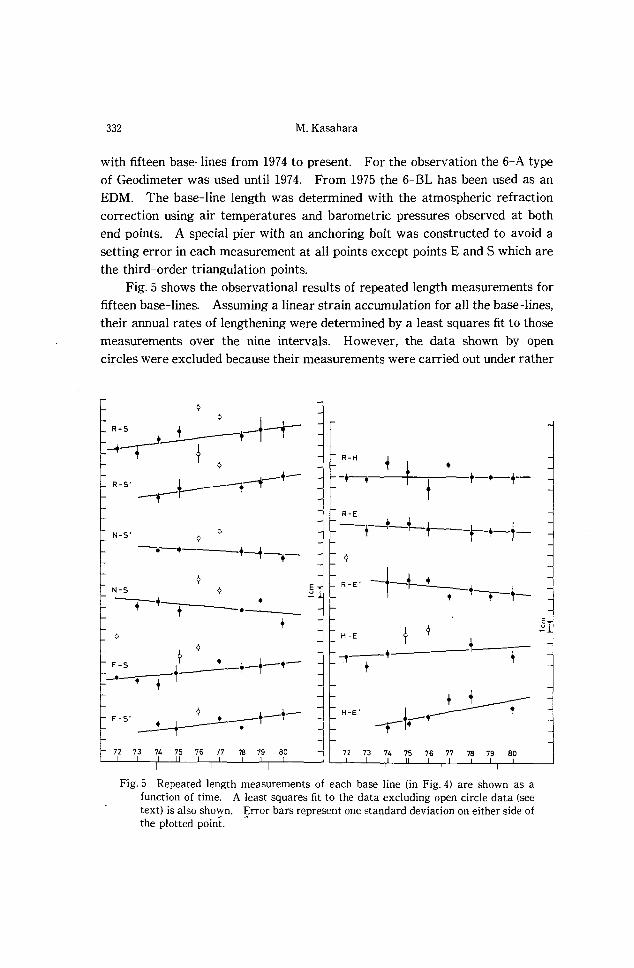
Fig. 5 shows the observational results of repeated length measurements for fifteen base-lines. Assuming a linear strain accumulation for all the base-lines, their annual rates of lengthening were determined by a least squares fit to those measurements over the nine intervals. However, the data shown by open circles were excluded because their measurements were carried out under rather
N-s' o
-.-.--__ ~_l T T--;-,_
N-s --Z--'--, __ _
T + --t--____ __ •
o ¢
F-s ? t ,-r-'--.-.--.-f-----
F -5' ¢ L.--t-t-~f-- •
72 73
§
-1 J j
I
1
R-H
~~ --ft--:--t _t -+-t-,--. R-E
-,-t.-+-'--r-,-t-¢
R-E' -1-t--. H-E t <}
-----+----,-, t +
H-E' , +~
t-·---- + -,. 72 73 74 75 76 77 7B 79 80
Fig. 5 Repeated length measurements of each base line (in Fig. 4) are shown as a function of time. A least squares fit to the data excluding open circle data (see text) is also shown. Error bars represent one standard deviation on either side of the plotted point. ~

Horizontal Strain Accumulated in the Erimo Region Hokkaido 333
o
o
72 73 74 75 76 77 78 79 80
Fig. 5 Continued.
different atmospheric conditions. The results for the fifteen base-lines are summarized in Table l.
The standard deviation of prediction errors of fifteen base-lines is shown in Fig. 6 as a function of line length. It can be seen that a relative precision of about 1 ppm of line length is maintained as a whole. The accumulated strain amount for fifteen base-lines for ten years is shown in Fig. 7 as a function of azimuth of the base-line. The vertical bar of each plot denotes the standard deviation of strain amount as deduced from the least squares fit to each of fifteen base-lines. The results by the three components of the extensometer in the vault are also plotted by open squares in this figure.
The linear strain in a horizontal direction with angle 8 is given by
eo=exx' cos2 8+eyy' sin2 8+exy' sin 28 where exx, eyy, and eXY are the three components of plane strain. These strains were calculated by a least squares fit to the results of twelve base-lines except the three base-lines shown by open circles in Fig. 7. In the calculation a coordinate system was taken that the x axis is directed to the east and the y
axis to the north. The best fit curve has also been plotted in the figure.

334 M. Kasahara
Table 1. Results of a least squares linear fit to the data obtained by repeated length measurements of each base line
Line Azimuth- Length No. of Rate S.D. S.D. of km obs. mm/yr residual (mm)
N-5' 12S 5.333 5 -0.77±0.42 2.2 N-S 16 5.325 6 -1.11±1.21 8.0 R-H 54 4.589 9 0.O3±1.25 9.9 H-E 83 8.189 5 1.10± 1. 05 7.4 H-E' 84 8.200 7 3. 63± 1. 95 10.2 N-R 86.5 6.740 8 2.97±0.81 6.3 N-E 96.5 11.281 5 5 .15± 1. 68 10.7 N-E' 97 11.292 6 6.87±1.40 7.4 R-E 111.5 4.809 7 -2.19±0.88 4.8 R-E' 112.5 4.798 7 -0.75±0.62 4.1 N-H 126.5 3.895 7 3. 98± 1. 26 9.5 R-5' 130 7.320 5 2.71±0.66 3.5 R-S 132 7.181 7 2.83± 1. 06 8.3 F-S 142.5 5.465 8 2.26±0.64 5.1 F-S' 146 5.342 6 1.51±0.80 4.3
-Degrees counterclockwise from east.
u. o
MM
10
~5
5
HE' •
RS •
HE
BASE -LI NE LENGTH
NE ./
1 PPM
10 15 KM
Fig. 6 Plot of the standard deviation of the residual of a least squares linear fit to the data in Fig. 11 versus base line length.

Horizontal Strain Accumulated in the Erimo Region Hokkaido 335
10 xlO-6
NH
5
DE-CD
N W o 90' AZIMUTH 18(1'
E-EF RE'
REf
Fig. 7 Plot of the accumulated strain during the period from 1972 to 1980 versus the azimuth of base-line. Error bars represent one standard deviation on either side of the plotted point. The solid curve is the least squares solution for homogenuous plane strain excluding open circles. The results obtained by the extenso· meters are also shown by open square marks.
Although the three base-lines deviate exclusively from the general strain field, it can safely be concluded that the result obtained represents the horizontal crustal strain accumulated around the Erimo region during the last decade, judging from the extent covered with twelve base-lines. The results of secular strain accumulations obtained by the geodetic measurements around EGO and the extenso metric observation in the vault are summarized in Table 2.
3. Comparison of both results and discussion
Fig. 8 shows the principal strains of the accumulated strains obtained by both measurements for ten years from 1971. Although there is a slight difference in orientation of principal strain axes, the tendency of the compressional strain field having azimuth of almost east to west and the amount of the accumulated strains are in good agreement. The compressional strain field

336 M. Kasahara
Table 2. Comparison of strain analyses for secular strain accu· mulations obtained by the extenso meters in the vault and by the long base-line network around EGO from 1971 to 1980
Period
Result
Geodetic measurement
1972 Oct. -1978 Dec.
exx -1.21±0.35
3.44±0.25
-2.03±0.26
Continuous observation
1971 Aug. -1980 Aug.
E-AB (135') 1.41
E-CD (45') 2.81
E-EF ( 0') -1. 56
(Reduction to 9 years' accumulation)
exx -1.33 -1.56
eyy
ex. Dilatation
Maximum shear strain
Principal strains
e, (orientation)'
e,
All strain unit in 10-6•
3.77
-2.23
2.44
6.48
4.46(112')
-2.02( 22')
'Degrees counterclockwise from east.
1971 - 1980 ERIMO
CONTI NUOUS
OSSERVATI ON
5.78
0.70
4.22
7.47
5.85( 85')
-1.63(- 5')
Fig. 8 Comparison of principal strains of the accumulated crustal strain obtained by the extensometers in the vault and by the long base-line network around EGO during the period from 1971 to 1980. Extension and contraction are shown by solid and dashed lines, respectively.

Horizontal Strain Accumulated in the Erimo Region Hokkaido 337
found to be east to west by geodetic measurement is consistent with the results wich we~e obtained by the analyses of fault plane solutions of earthquakes occurring around the southern part of Hokkaido (Takanami, 1978; Suzuki, et ai., 1983). The earthquakes occurring in the sea region and also in the deeper part around the southern part of the Hidaka range show that the fault plane solutions give P-axis with NW -SE direction parallel to a slip vector of Pacific plate motion. On the contrary, the shallower eartqhuakes occurring in the
western part of the Hidaka range including the Erimo region indicate P-axis of E-W direction. It can be said that a strain accumulation having a rate of about 2 to 3 parts in 107 per year with the east-west compressional strain field has been in progress around the Erimo region for the last ten years and the extensometers in the vault have responded closely to this movement.
4. Conclusion
Secular strain accumulations were observed by the extensometric observa· tion in the vault and the repeated measurements for the long base-line network around the Erimo region during the period from 1971 to 1980. The principal strains calculated are + 5.9 X 10⁻⁶ (extension) with N5°E and -1.6 x 10⁻⁶ (contraction) with N85°W from the extensometric observation, and +4.5 x 10⁻⁶ with N22°W and - 2.0 X 10⁻⁶ with N 68°E from the measurements for the long baseline network, respectively. Both the results are tolerably consistent, in both orientation and amount, with one another. We consider that the extensometric observation in the vault of EGO closely correlates with the wide-areal crustal movement progressing around the Erimo region.
Acknowledgemen ts
I would like to express my gratitude to Prof. Izumi Yokoyama for giving me the opportunity to make this study and for his continuous support and encouragement during its course. I am also very grateful to Prof. Hiroshi Okada who made many valuable suggestions and kindly reviewed the manuscript. Thanks are also due to Mr. Yasumori Tanaka for his efforts throughout the routine observations at the Erimo Geophysical Observatory and to Messrs. Muneo Okayama and Tomio Ogawa who helped with the field work of the long base-line distance measuring. This paper is a part of the author's doctorial thesis submitted to the Hokkaido University in December, 1982.
338 M. Kasahara
References
Funahashi, M. and Hashimoto, S., 1951. Geology of the Hidaka zone, Hokkaido. Monograph of the association for the geological collaboration, No.6, 38 pp (in Japanese).
Kasahara, M., Tanaka, Y. and Yokoyama, I., 1972. Observation of crustal deformation at Erimo in Hokkaido -1971-. Geophys. Bull. Hokkaido Univ., 28, 83-96 (in Japanese with English abstract).
Nakane, K, 1973 a. Horizontal tectonic strain in Japan (I). J. Geod. Soc. Jap., 19, 190-199 (in Japanese with English abstract).
Nakane, K, 1973 b. Horizontal tectonic strain in Japan (II). J. Geod. Soc. Jap., 19, 200-208 (in J apaneses with English abstract).
Shichi, R, 1972. An improvement of digital filter for the analysis of crustal deformation. J. Geod. Soc. J ap., 18, 72-77 (in Japanese with English abstract).
Shichi, R., 1973. Long period deformation - separation of long period components and some consideration to the long period crustal deformation. J. Geod. Soc. Jap., 19, 213-234 (in Japanese with English abstract).
Suzuki, S., Motoya, Y., Umino, N., Hasegawa, A., Kameya, S. and Tanaka K, 1983. Hypocentral distribution and composite focal mechanisms of shallow earthquakes near the junction between the Kurile and the northeast Japan arcs. Zisin (Bull. Seism. Soc. lap.), Ser. II, 36, 407-421 (in Japanese with English abstract).
Takanami, T., 1978. Earthquakes around the southern most tip of the Okhotsk Sea Plate and its tectonic implication. Abstr. Annu. Meet. Seism. Soc. lap., No.2, 175 (in Japanese).


![Instructions for use - HUSCAP...ment bf Quaternelry volcanoes ih Hokkaido and surrounding areas. ThiTty-six Quarternary voleanoes (or volcanic groups) have erupted in Hokkaido] most](https://img.pdfslide.net/doc/110x75/5f215d29164170544d29d89c/instructions-for-use-huscap-ment-bf-quaternelry-volcanoes-ih-hokkaido-and.jpg)