Embed Size (px)
Citation preview

Horley, Neill (1999) Molecular Basis of CYP2B2 Induction. PhD thesis, University of Nottingham.
Access from the University of Nottingham repository: http://eprints.nottingham.ac.uk/10397/1/Neill.pdf
Copyright and reuse:
The Nottingham ePrints service makes this work by researchers of the University of Nottingham available open access under the following conditions.
This article is made available under the University of Nottingham End User licence and may be reused according to the conditions of the licence. For more details see: http://eprints.nottingham.ac.uk/end_user_agreement.pdf
For more information, please contact [email protected]

Molecular Basis of CYP2B2 Induction
by
Neill J. Horley, B.Sc., MSc
Being a thesis presented in accordance with the regulations
governing the award of the degree of Doctor of Philosophy
at the University of Nottingham
October

Neill J. Horley
Page 2
ABSTRACT
Many structurally unrelated chemicals can induce members of the cytochrome P450 superfamily
with phenobarbital (PB) being a typical example. PB induces CYP2B1/2, which are most highly
expressed in the liver. Their mechanism of activation has not yet been elucidated, with advances
hampered by the absence of a suitable cell culture system to mimic the
in vivo
PB-mediated in-
duction.
During this thesis a primary rat hepatocyte culture system has been developed which is highly
responsive to PB at both RNA and protein levels. A sensitive and specific RNAse protection
assay (RPA) has been used to demonstrate that CYP2B2 mRNA is highly inducible
in vitro
by
PB. This response occurs in a time and dose-dependent manner. The use of RPA and Western
blotting has demonstrated that this primary rat hepatocyte culture system supports the induction
of CYP2B2 mRNA and protein levels by PB.
Sequencing -1.4kb of the 5’ flanking region of the CYP2B2 gene identified genomic regulatory
elements and highlighted the location of the phenobarbital response element (PBRE). The
PBRE was sub-cloned into various reporter constructs and transfection technology was used to
determine its PB-mediated induction.
A comparative study of the constructs generated in this thesis to that of a construct provided by
Anderson’s group (Trottier
et al
., 1995) was undertaken and no differences were found in their
PB-responsiveness. The Anderson construct containing the PBRE was shown here to confer a
3.3-fold PB-mediated induction of the CYP2B2 gene by CAT reporter assays. This induction
was shown to be both dose and time dependent. The induction is lower than that obtained by
other workers due primarily to assay conditions which were not yet optimal. However, the ef-
fects of androstane on the constitutively active receptor (CAR) may also play a role in the small
inductive response of the phenobarbital response element to PB.

Neill J. Horley
Page 3
Acknowledegment
I would like to acknowledge Dr. David Bell, my supervisor, for his guidance and irrepressible
enthusiasm during this project, his recent cyberscience thesis input (with the help of Britney
Spears) was also much appreciated. Special thanks is also due to my industrial supervisor Dr.
Maurice Dickins of Glaxo-Wellcome for his invaluable scientific input and support.
I must also acknowledge Dr. Simon (its fixed now) Tomlinson for his advice throughout and of
course for keeping OS2 going. I would like to thank all other present members of the Bell re-
search group, especially my shotgun on the hepatocyte preps Munim (Glamour Kid) Choudhury
“MumRAH!!!!”, Brett (NetBoy-Rottweiler) Jefferies, Wing Commander Sonny (Spawnmeis-
ter) Chahal, Chris (the player) Mee, Paul (Captain Cartoon) Clarke and Fan (96-preps) Ming Qi.
However I also want to especially mention some of the ‘ole school’ members, i.e. Alex (Sorted
for life) Bell, Yee (you know you wouldn’t mind) Heng, Sharon (the story so far is) Kuo and
Lousie (where’s she gone) Oram. Declan (I drank so much this weekend) Brady deserves a special
thanks for drinking so much at weekends and putting his labcoat on occasionally.
Ecnarelot boys Ecnarelot !!!!
I also want to thank the members of Glaxo-Wellcome who made my time there highly useful
and enjoyable. Those who deserve a personal mention include Dr. Amanda Woodroffe who su-
pervised my practical work at Glaxo-Wellcome and managed not to strangle me, as well as Steve,
Dawn and Rosemary.
I would like to thank my family and friends who have lent their support over the last couple of
years and everyone else that I have forgot to mention. Cheers!!!!!!!!!

Neill J. Horley
Page 4
Lastly I would like to thank the most important person to me over the last four years my Missus
Barbara. She has sorted my life out while I’ve been a PhD. student and has supported me through
the good and bad experiments. Sorry I moaned so much and left you to do everything. Babs has
had her life on hold for the past four years and I don’t know how to thank her. Except perhaps
with an apple pie and a cup of tea.
Let’s go find a house!!!!!!!!!!!
I’m still sleeping
Dedication
This thesis is dedicated to Barbara, You’ve sacraficed so much and I love you for it.

Neill J. Horley
Page 5
Just a few words from the wise and the not so wise.
“If I had a pound for every luciferase experiment that I have done.
And I got dancing lessons for all the times this PhD hasn’t been fun.
I’d be a millionaire
I’d be a Fred Astaire.” Martin Fry of ABC fame.
“At least once a day make someone laugh.
You’re a long time dead!” William B. Horley.
“We humans are inquisitive beings.
Put us in an unfamiliar environment and we will learn about it.
.....If life is a learning curve let’s keep it vertical.” Shaun Kent. Scrap merchant.

Neill J. Horley
Page 6
Abbreviations
A Adenine
AA Arachidonic Acid
ACO Acyl-CoA oxidase
AhR Arylhydrocarbon
Amp Ampicilin antibiotic
Arnt AhR-nuclear translocator protein
ATP Adenosine triphosphate
bHLH Basic helic-loop-helix
β
GAL
β−
Galatosidase
BSA Bovine Serum Albumin
bp base pair
C Cytosine
CAR Constitutively activated receptor
CAT Chloramphenicol acetyl transferase
CEBP CCAAT/enhancer binding protein
CFA Clofibric acid

Neill J. Horley
Page 7
CoA Coenzyme
CTP Cytosine triphosphate
CYP (CYP2)Cytochrome P450 (P450 2B subfamily)
DEHA Di(2-ethylhexyl)adipate
DEHP Di(2-ethyhexyl)phthalate
DEX Dexamethasome
DEPC Diethylpyrocarbonate
DNA Deoxyribonucleic acid
cDNA Complementary DNA
DLRA Dual luciferase reporter assay
DOPE Dioleoylphosphatidylethanolamine
DOTMA 1,2-dioleyloxypropyl-3-trimethyl ammonium bromide
DMF Dimethylformamide
DMSO Dimethyl sulphoxide
DMEM Dulbecco’s modified Eagle’s medium
DR1 Direct Repeat (of AGGTCA) spaced by 1 nucleotide
DTT Dithiothreitol

Neill J. Horley
Page 8
EBSS Earle’s balanced salt solution
EDTA Ethylene diamine tetra acetic acid (disodium salt)
EET Epoxyeicosatetraenoic acid
EHS Engelbreth-Holm-Swarm
EMSA Electromobility shift assay
G Guanine
GRE Glucocorticoid receptor element
GTP Guanosine triphosphate
GW Glaxo-Wellcome
hsp90 heat shock protein 90
HNF-4 Hepatic Nuclear Factor-4
IAA isoamyl alcohol
IPTG Isopropyl-
β
-D-thiogalactopyranoside
kb kilobase
kDa kiloDalton
KRHB Krebs ringer hydrocarbonate buffer
KRPB Krebs ringer Phosphate buffer

Neill J. Horley
Page 9
L15 Leibovitz medium
LB Luria-Bertani (medium)
LDH Lactate dehydrogenase
MCP Methylclofenapate
MFO Mono-oxygenase system
MCM Modified Chee’s medium
NF1 Nuclear factor 1
NR Nuclear receptor binding motifs
ONPG o-nitrophenyl-
β
-D-galatopyranoside
PAGE Polyacrylamide Gel Electrophoresis
PAH Polycyclic aromatic hydrocarbon
PAS Per, Arnt, Sim regulatory proteins
PB Phenobarbital
PBRE PB response element
PBREM PB response enhancer module
PBS Phosphate buffered saline
PBRU PB response unit

Neill J. Horley
Page 10
PCR Polymerase Chain Reaction
PCN Pregnenolone-16
α
-carbonitrile
PLB Passive lysis buffer
PP Peroxisome Proliferator
PPAR Peroxisome Proliferator Activated Receptor
PPRE Peroxisome Proliferator Response Element
PXR Pregnane-X-receptor
RLB Reporter lysis buffer
RNA Ribonucleic acid
mRNA messenger RNA
RXR Retinoid X receptor
SAP Shrimp alkaline phosphatase
SDS Sodium Dodecyl Sulphate
SRC-1 Steriod receptor co-activator-1
SRS Substrate Recognition Sites
T Thymine
TAE Tris/EDTA/Glacial acetic acid buffer

Neill J. Horley
Page 11
TBE Tris-Boric acid-EDTA buffer
TCDD 2, 3, 7, 8-tetrachlorodibenzeno-p-dioxin
TCPOBOP1,4-bis[2-(3,5-dichloropyridyloxy)] benzene
TBS Tris-buffered slaine
TTBS Tween-TBS
TEMED N,N,N’,N’,-tetramethylethylenediamine
TESS Transcription element search software
Tet Tetracyclin antibiotics
TK Thymidine kinase
TTP Thymidine triphosphate
UHP Ultra High Purity
WWW World Wide Web
WEM William’s E medium
X-Gal 5-bromo-4-chloro-3-indolyl
β
-D-galactophranoside
XRE Xenobiotic response element
All amino acids indicated by their standard single letter or three letter-abbreviations where ap-
propriate.
Neill J. Horley
Page 12
Table of Contents
1 Introduction
. . . . . . . . . . . . . . . . . . . . . . . . . . . . . . . . . . . . . . . . . . . . . . . . . . . . . . . 21
1.1
The cytochrome P450 gene superfamily . . . . . . . . . . . . . . . . . . . . . . . . . . . . . . . . . 21
1.1.1
Xenobiotic biotransformations . . . . . . . . . . . . . . . . . . . . . . . . . . . . . . . . . . . . 21
1.1.2
Isolation of cytochrome P450 . . . . . . . . . . . . . . . . . . . . . . . . . . . . . . . . . . . . . 23
1.1.3
Mechanism of action . . . . . . . . . . . . . . . . . . . . . . . . . . . . . . . . . . . . . . . . . . . 24
1.1.4
1.1.4 Nomenclature of the cytochrome P450 superfamily . . . . . . . . . . . . . . . . . 27
1.1.5
Evolution of the cytochrome P450 superfamily . . . . . . . . . . . . . . . . . . . . . . . . 29
1.1.6
Xenobiotic induction of cytochrome P450 genes . . . . . . . . . . . . . . . . . . . . . . . 30
1.1.6.1
Aromatic hydrocarbon inducible cytochrome P450 genes . . . . . . . . . . . . 33
1.1.6.2
Steroid inducible cytochrome P450 genes . . . . . . . . . . . . . . . . . . . . . . . . 34
1.1.6.3
Peroxisome proliferator inducible cytochrome P450 genes. . . . . . . . . . . . 35
1.1.6.4
Phenobarbital inducible cytochrome P450 genes . . . . . . . . . . . . . . . . . . . 36
1.2
PB-inducible rat CYP2B1 and CYP2B2 genes . . . . . . . . . . . . . . . . . . . . . . . . . . . . 38
1.2.1
CYP2B1 and CYP2B2 5’-flanking sequences . . . . . . . . . . . . . . . . . . . . . . . . . 39
1.2.2
Other CYP2B genes and regulatory elements . . . . . . . . . . . . . . . . . . . . . . . . . 39
1.2.3
Pharmacology of phenobarbital . . . . . . . . . . . . . . . . . . . . . . . . . . . . . . . . . . . . 41
1.3
Structural organisation of the liver . . . . . . . . . . . . . . . . . . . . . . . . . . . . . . . . . . . . . 42
1.4
Development of a PB-responsive in vitro hepatocyte culture system . . . . . . . . . . . . . 44
1.4.1
Extracellular matrix substrata . . . . . . . . . . . . . . . . . . . . . . . . . . . . . . . . . . . . . . 45
1.4.2
Hepatocyte culture media . . . . . . . . . . . . . . . . . . . . . . . . . . . . . . . . . . . . . . . . 48
1.4.3
Hepatocyte culture medium additives . . . . . . . . . . . . . . . . . . . . . . . . . . . . . . . 49
1.5
PB-responsive elements in PB-inducible genes . . . . . . . . . . . . . . . . . . . . . . . . . . . . 50
1.5.1
Proximal PB-responsive promoter elements . . . . . . . . . . . . . . . . . . . . . . . . . . . 50
1.5.2
Distal PB-responsive promoter elements . . . . . . . . . . . . . . . . . . . . . . . . . . . . . 54
1.6
Summary of introduction . . . . . . . . . . . . . . . . . . . . . . . . . . . . . . . . . . . . . . . . . . . . 66
1.6.1
PB induction of cytochrome P450s . . . . . . . . . . . . . . . . . . . . . . . . . . . . . . . . . 66
1.6.2
CYP2B expression and transcriptional regulation . . . . . . . . . . . . . . . . . . . . . . . 66
1.6.3
Aims of the project . . . . . . . . . . . . . . . . . . . . . . . . . . . . . . . . . . . . . . . . . . . . . 67
2 Materials and Methods
. . . . . . . . . . . . . . . . . . . . . . . . . . . . . . . . . . . . . . . . . . . . . . 68
2.1
Materials . . . . . . . . . . . . . . . . . . . . . . . . . . . . . . . . . . . . . . . . . . . . . . . . . . . . . . . 68
2.2
Treatment of animals . . . . . . . . . . . . . . . . . . . . . . . . . . . . . . . . . . . . . . . . . . . . . . . 69
2.3
Methods . . . . . . . . . . . . . . . . . . . . . . . . . . . . . . . . . . . . . . . . . . . . . . . . . . . . . . . . 69
Neill J. Horley
Page 13
2.3.1
Bacterial growth media and culture conditions . . . . . . . . . . . . . . . . . . . . . . . . . 69
2.3.2
Eschericha coli strains and their manipulation . . . . . . . . . . . . . . . . . . . . . . . . . 70
2.3.3
Preparation of CaCl
2
competent XL-1 blue E.coli . . . . . . . . . . . . . . . . . . . . . . 70
2.3.4
Transformation of CaCl
2
competent E.coli . . . . . . . . . . . . . . . . . . . . . . . . . . . 71
2.3.5
Preparation of electro-competent XL-1 blue E.coli . . . . . . . . . . . . . . . . . . . . . 71
2.3.6
Electro-transformation of XL-1 blue E.coli . . . . . . . . . . . . . . . . . . . . . . . . . . . 71
2.4
Manipulation of DNA . . . . . . . . . . . . . . . . . . . . . . . . . . . . . . . . . . . . . . . . . . . . . . 72
2.4.1
Phenol:chloroform extraction of nucleic acids . . . . . . . . . . . . . . . . . . . . . . . . . 72
2.4.2
Ethanol precipitation of nucleic acids . . . . . . . . . . . . . . . . . . . . . . . . . . . . . . . 72
2.4.3
Isolation of plasmid DNA by the alkaline lysis method . . . . . . . . . . . . . . . . . . . 72
2.4.4
Purification of plasmid DNA using the Qiagen mini-prep columns . . . . . . . . . . 73
2.4.5
Plasmid purification using Qiagen-tip 500 maxi-prep column . . . . . . . . . . . . . . 74
2.4.6
Plasmid purification by isopycnic density gradient centrifugation . . . . . . . . . . . 74
2.4.6.1
Removal of EtBr and CsCl from DNA . . . . . . . . . . . . . . . . . . . . . . . . . 75
2.4.7
Restriction enzyme digest of plasmid DNA . . . . . . . . . . . . . . . . . . . . . . . . . . . 75
2.4.8
Agarose gel electrophoresis . . . . . . . . . . . . . . . . . . . . . . . . . . . . . . . . . . . . . . . 76
2.4.9
Acrylamide gel electrophoresis . . . . . . . . . . . . . . . . . . . . . . . . . . . . . . . . . . . . 77
2.4.10 Purification of DNA from an agarose gel . . . . . . . . . . . . . . . . . . . . . . . . . . . . 77
2.4.11 Phosphatase treatment of DNA . . . . . . . . . . . . . . . . . . . . . . . . . . . . . . . . . . . 78
2.4.12 Ligation of DNA . . . . . . . . . . . . . . . . . . . . . . . . . . . . . . . . . . . . . . . . . . . . . 79
2.4.13 Automated fluorescent sequencing . . . . . . . . . . . . . . . . . . . . . . . . . . . . . . . . 79
2.4.14 Sequence analysis . . . . . . . . . . . . . . . . . . . . . . . . . . . . . . . . . . . . . . . . . . . . . 79
2.5 Polymerase chain reaction (PCR) . . . . . . . . . . . . . . . . . . . . . . . . . . . . . . . . . . . . . . 80
2.5.1 Purification of PCR products . . . . . . . . . . . . . . . . . . . . . . . . . . . . . . . . . . . . . 81
2.5.2 First strand cDNA synthesis . . . . . . . . . . . . . . . . . . . . . . . . . . . . . . . . . . . . . . 81
2.5.3 PCR amplification of cDNA . . . . . . . . . . . . . . . . . . . . . . . . . . . . . . . . . . . . . 82
2.6 Primary tissue culture . . . . . . . . . . . . . . . . . . . . . . . . . . . . . . . . . . . . . . . . . . . . . . . 84
2.6.1 Isolation of primary rat hepatocytes . . . . . . . . . . . . . . . . . . . . . . . . . . . . . . . . . 84
2.6.2 Modified isolation of primary rat hepatocytes . . . . . . . . . . . . . . . . . . . . . . . . . . 85
2.6.3 Enumeration of isolated hepatocytes . . . . . . . . . . . . . . . . . . . . . . . . . . . . . . . . 87
2.6.4 Primary Rat Hepatocyte Culture . . . . . . . . . . . . . . . . . . . . . . . . . . . . . . . . . . 87
2.6.5 Matrix components for hepatocyte culture . . . . . . . . . . . . . . . . . . . . . . . . . . . 88
2.6.5.1 No substratum. . . . . . . . . . . . . . . . . . . . . . . . . . . . . . . . . . . . . . . . . . . . 88

Neill J. Horley
Page 14
2.6.5.2 Type-I collagen coated substratum . . . . . . . . . . . . . . . . . . . . . . . . . . . . . 88
2.6.5.3 Matrigel overlay. . . . . . . . . . . . . . . . . . . . . . . . . . . . . . . . . . . . . . . . . . . 89
2.6.6 Dosing primary hepatocytes . . . . . . . . . . . . . . . . . . . . . . . . . . . . . . . . . . . . . . 90
2.7 RNA manipulation . . . . . . . . . . . . . . . . . . . . . . . . . . . . . . . . . . . . . . . . . . . . . . . . 90
2.7.1 Extraction of RNA . . . . . . . . . . . . . . . . . . . . . . . . . . . . . . . . . . . . . . . . . . . . 90
2.7.2 Diethylpyrocarbonate treatment of solutions for RNA manipulation . . . . . . . . . 90
2.7.3 Preparation of phenol . . . . . . . . . . . . . . . . . . . . . . . . . . . . . . . . . . . . . . . . . . . 90
2.7.4 RNA extraction from tissue sample . . . . . . . . . . . . . . . . . . . . . . . . . . . . . . . . . 91
2.7.5 RNA extraction from primary cell cultures . . . . . . . . . . . . . . . . . . . . . . . . . . . 92
2.7.6 RNA quantification and integrity . . . . . . . . . . . . . . . . . . . . . . . . . . . . . . . . . . 93
2.7.7 Preparation of riboprobe template DNA . . . . . . . . . . . . . . . . . . . . . . . . . . . . . 94
2.7.8 Synthesis of RNA probe . . . . . . . . . . . . . . . . . . . . . . . . . . . . . . . . . . . . . . . . . 94
2.7.9 Radionucleotide incorporation test . . . . . . . . . . . . . . . . . . . . . . . . . . . . . . . . . 95
2.7.10 RNAse protection assay . . . . . . . . . . . . . . . . . . . . . . . . . . . . . . . . . . . . . . . . 96
2.7.11 Denaturing acrylamide electrophoresis . . . . . . . . . . . . . . . . . . . . . . . . . . . . . . 97
2.7.12 Autoradiograph development . . . . . . . . . . . . . . . . . . . . . . . . . . . . . . . . . . . . 98
2.7.13 [32P] labeling of marker . . . . . . . . . . . . . . . . . . . . . . . . . . . . . . . . . . . . . . . . 98
2.8 Transfection protocols . . . . . . . . . . . . . . . . . . . . . . . . . . . . . . . . . . . . . . . . . . . . . 100
2.8.1 Preparation of cationic liposome formulations . . . . . . . . . . . . . . . . . . . . . . . . 100
2.8.2 Transfection optimisation . . . . . . . . . . . . . . . . . . . . . . . . . . . . . . . . . . . . . . . 100
2.8.3 Transient transfection of primary rat hepatocytes . . . . . . . . . . . . . . . . . . . . . . 101
2.9 Reporter gene assays . . . . . . . . . . . . . . . . . . . . . . . . . . . . . . . . . . . . . . . . . . . . . . 102
2.9.1 β-Galactosidase histochemistry . . . . . . . . . . . . . . . . . . . . . . . . . . . . . . . . . . . 102
2.9.2 Harvesting of cell monolayers . . . . . . . . . . . . . . . . . . . . . . . . . . . . . . . . . . . . 102
2.9.3 Assay for chloramphenicol acetyl transferase . . . . . . . . . . . . . . . . . . . . . . . . . . 103
2.9.4 Luciferase assay system with reporter lysis buffer . . . . . . . . . . . . . . . . . . . . . . . 104
2.9.5 Dual-luciferase reporter assay system (DLRA) . . . . . . . . . . . . . . . . . . . . . . . . 105
2.9.6 Normalisation of luciferase activity . . . . . . . . . . . . . . . . . . . . . . . . . . . . . . . . 105
2.10 Protein methodologies . . . . . . . . . . . . . . . . . . . . . . . . . . . . . . . . . . . . . . . . . . . . 106
2.10.1 Purification of hepatocyte microsomes . . . . . . . . . . . . . . . . . . . . . . . . . . . . . 106
2.10.2 Bradford (Coomassie blue) protein assay . . . . . . . . . . . . . . . . . . . . . . . . . . . 106
2.10.3 Bicinchoninic acid (BCA) kit for protein determination . . . . . . . . . . . . . . . . 107
2.10.4 SDS-polyacrylamide gel electrophoresis (SDS-PAGE) . . . . . . . . . . . . . . . . . 108

Neill J. Horley
Page 15
2.10.5 Western blotting and immunodetection . . . . . . . . . . . . . . . . . . . . . . . . . . . . 109
2.11 Lactate dehydrogenase (LDH) assay . . . . . . . . . . . . . . . . . . . . . . . . . . . . . . . . . . 111
2.12 Statistical analysis . . . . . . . . . . . . . . . . . . . . . . . . . . . . . . . . . . . . . . . . . . . . . . . . 112
3 Results . . . . . . . . . . . . . . . . . . . . . . . . . . . . . . . . . . . . . . . . . . . . . . . . . . . . . . . . . . 113
3.1 Isolation of primary rat hepatocytes . . . . . . . . . . . . . . . . . . . . . . . . . . . . . . . . . . . 113
3.2 Expression of CYP2B2 mRNA . . . . . . . . . . . . . . . . . . . . . . . . . . . . . . . . . . . . . . 113
3.2.1 Generation of a CYP2B2 probe . . . . . . . . . . . . . . . . . . . . . . . . . . . . . . . . . . 113
3.2.2 Extraction of RNA . . . . . . . . . . . . . . . . . . . . . . . . . . . . . . . . . . . . . . . . . . . 116
3.2.3 Induction of CYP2B2 RNA by PB . . . . . . . . . . . . . . . . . . . . . . . . . . . . . . . 116
3.2.4 Optimising the RNAse protection assay . . . . . . . . . . . . . . . . . . . . . . . . . . . . 118
3.2.5 Xenobiotic induction of CYP2B2 mRNA . . . . . . . . . . . . . . . . . . . . . . . . . . 121
3.2.6 Characterisation of the CYP2B2 response by various xenobiotics . . . . . . . . . . 122
3.2.6.1 Dose response curves of four xenobiotics . . . . . . . . . . . . . . . . . . . . . . . 122
3.2.6.2 Time course of CYP2B2 mRNA induced by PB . . . . . . . . . . . . . . . . . 125
3.3 Expression and induction of CYP2B proteins . . . . . . . . . . . . . . . . . . . . . . . . . . . . 126
3.4 Analysis of the 5’ flanking region of the rat CYP2B2 gene . . . . . . . . . . . . . . . . . . . 127
3.5 Isolation of the CYP2B2 putative PB response element (PBRE) . . . . . . . . . . . . . . 135
3.5.1 Truncation of the 969 bp CYP2B2 fragment . . . . . . . . . . . . . . . . . . . . . . . . . 138
3.6 Optimisation of transfection of primary hepatocytes . . . . . . . . . . . . . . . . . . . . . . . 139
3.6.1 Effect of concentration of DOTMA/DOPE on transfection efficiency . . . . . . 139
3.6.2 Effect of reporter DNA concentration upon transfection efficiency . . . . . . . . . 140
3.6.3 Effect of incubation time upon transfection efficiency . . . . . . . . . . . . . . . . . . 141
3.6.4 Morphology of hepatocytes post-transfection . . . . . . . . . . . . . . . . . . . . . . . . . 143
3.6.5 Optimisation of reporter system assays . . . . . . . . . . . . . . . . . . . . . . . . . . . . . . 143
3.7 Functional characterisation of the PBRE in primary rat hepatocytes . . . . . . . . . . . . 144
3.7.1 Determination of the PB responsiveness of CYP2B2 PBRE containing constructs
. . . . . . . . . . . . . . . . . . . . . . . . . . . . . . . . . . . . . . . . . . . . . . . . . . . . . . . . . . . . . . . 144
3.7.2 Generation of a HSV-thymidine kinase promoter-containing PBRE construct 146
3.7.3 Optimisation of the Dual luciferase reporter assay (DLRA) . . . . . . . . . . . . . . . 149
3.7.4 Effect of different promoter driven PBRE reporter constructs . . . . . . . . . . . . . 151
3.7.5 Cytotoxicity of the transfection protocol . . . . . . . . . . . . . . . . . . . . . . . . . . . . 153
3.7.6 Determination of TK2B2-F-Luc expression over time . . . . . . . . . . . . . . . . . 155
3.7.7 PB-mediated induction of two PBRE containing reporter constructs . . . . . . . 156

Neill J. Horley
Page 16
3.7.7.1 Endotoxin contamination of the 163bpCAT reporter . . . . . . . . . . . . . . 158
3.7.7.2 Optimisation of CAT assay. . . . . . . . . . . . . . . . . . . . . . . . . . . . . . . . . . 160
3.7.7.3 Comparison between TK2B2-F-Luc and 163bpCAT reporter activity . . 162
3.7.8 Effect of culture matrix components upon PBRE-mediated induction . . . . . . 164
3.7.9 Effect of reporter ratios upon 163bpCAT activity . . . . . . . . . . . . . . . . . . . . . 168
3.7.10 Effect of 163bpCAT reporter concentration upon PB induction . . . . . . . . . . 171
3.7.11 Xenobiotic induction of PBRE containing 163bpCAT reporter construct . . . 174
3.7.12 Transcriptional regulation of the PBRE by the nuclear orphan receptor mCAR .
. . . . . . . . . . . . . . . . . . . . . . . . . . . . . . . . . . . . . . . . . . . . . . . . . . . . . . . . . . . . . . . 175
4 Discussion . . . . . . . . . . . . . . . . . . . . . . . . . . . . . . . . . . . . . . . . . . . . . . . . . . . . . . . 179
4.1 PB induction of the rat CYP2B2 gene at the mRNA level . . . . . . . . . . . . . . . . . . 179
4.1.1 Optimisation of the RNAse protection assay . . . . . . . . . . . . . . . . . . . . . . . . . 179
4.1.1.1 Probe Specificity . . . . . . . . . . . . . . . . . . . . . . . . . . . . . . . . . . . . . . . . . 180
4.1.2 Comparison of CYP2B2 expression levels by PB in vitro and in vivo . . . . . . . 183
4.1.3 Induction of CYP2B2 by various chemical compounds . . . . . . . . . . . . . . . . . 185
4.1.3.1 PB-like compounds show dose-dependent induction of CYP2B2 . . . . . 187
4.1.3.2 Time course of PB-induced CYP2B2 induction . . . . . . . . . . . . . . . . . . 190
4.1.4 PB mediated induction of CYP2B protein . . . . . . . . . . . . . . . . . . . . . . . . . . . 191
4.2 Characterisation of the 5’ flanking sequence of the CYP2B2 gene . . . . . . . . . . . . . 192
4.2.1 Cloning of the 5’ flanking region of a CYP2B2-like gene . . . . . . . . . . . . . . . 192
4.2.2 Possible regulatory motifs . . . . . . . . . . . . . . . . . . . . . . . . . . . . . . . . . . . . . . . 195
4.2.3 Determination of the location of the PBRE . . . . . . . . . . . . . . . . . . . . . . . . . . 196
4.2.3.1 Isolation of the PBREM . . . . . . . . . . . . . . . . . . . . . . . . . . . . . . . . . . . 197
4.3 Transient transfection of primary rat hepatocytes . . . . . . . . . . . . . . . . . . . . . . . . . . 198
4.3.1 Optimisation of transfection parameters . . . . . . . . . . . . . . . . . . . . . . . . . . . . . 198
4.3.1.1 Miscellaneous transfection variables. . . . . . . . . . . . . . . . . . . . . . . . . . . . 199
4.3.1.2 Effect of DOTMA/DOPE concentration . . . . . . . . . . . . . . . . . . . . . . . 200
4.3.1.3 Effect of DNA concentration . . . . . . . . . . . . . . . . . . . . . . . . . . . . . . . . 203
4.3.1.4 Effect of exposure to the DNA/DOTMA/DOPE complex over time . . 204
4.4 Functional testing of the PBRE by reporter assay . . . . . . . . . . . . . . . . . . . . . . . . . 205
4.4.1 Reporter assay optimisation . . . . . . . . . . . . . . . . . . . . . . . . . . . . . . . . . . . . . 207
4.4.1.1 Titration effects of transcription factors upon PB induced reporters . . . . 208
4.4.1.2 Effects of promoter interactions . . . . . . . . . . . . . . . . . . . . . . . . . . . . . . 210

Neill J. Horley
Page 17
4.4.1.3 Cytotoxic effects of the transfection protocol. . . . . . . . . . . . . . . . . . . . . 212
4.4.1.4 Effect of endotoxin contamination of PBRE reporters . . . . . . . . . . . . . . 214
4.4.1.5 Time course of PBRE expression . . . . . . . . . . . . . . . . . . . . . . . . . . . . . 215
4.4.2 Comparison of TK2B2-Luc reporter activity to 163bpCAT activity . . . . . . . . 215
4.4.2.1 PB-induction of the PBRE is unaffected by culture conditions. . . . . . . . 220
4.4.3 Optimising reporter concentrations . . . . . . . . . . . . . . . . . . . . . . . . . . . . . . . . 223
4.4.4 Xenobiotic induction of the PBRE . . . . . . . . . . . . . . . . . . . . . . . . . . . . . . . . 225
4.4.5 Possible role of the constitutively active receptor in PB induction . . . . . . . . . . 226
4.5 Summary . . . . . . . . . . . . . . . . . . . . . . . . . . . . . . . . . . . . . . . . . . . . . . . . . . . . . . 227
4.5.1 Recommendations . . . . . . . . . . . . . . . . . . . . . . . . . . . . . . . . . . . . . . . . . . . . 231
4.6 Further work to elucidate the mechanism of PB induction . . . . . . . . . . . . . . . . . . . 233
4.7 Conclusions . . . . . . . . . . . . . . . . . . . . . . . . . . . . . . . . . . . . . . . . . . . . . . . . . . . . 236
5 References. . . . . . . . . . . . . . . . . . . . . . . . . . . . . . . . . . . . . . . . . . . . . . . . . . . . . . . . 237
6 Submitted abstracts . . . . . . . . . . . . . . . . . . . . . . . . . . . . . . . . . . . . . . . . . . . . . . . . 269

Neill J. Horley
Page 18
List of FiguresFigure 1.1 Figure 1.1 Catalytic cycle of the cytochrome P450 reactions. . . . . . . . . . . . . . . 26
Figure 1.2 Cartoon of the four proposed models for transcriptional activation of CYP genes. .
. . . . . . . . . . . . . . . . . . . . . . . . . . . . . . . . . . . . . . . . . . . . . . . . . . . . . . . . . . . . . . . . . . . . 32
Figure 3.1 A restriction digest of the pGEM7-2B2-Xlig plasmid . . . . . . . . . . . . . . . . . . . 114
Figure 3.2 Alignment of CYP2B2 cDNA sequence with Xlig sequence . . . . . . . . . . . . . 115
Figure 3.3 Analysis of total primary rat hepatocyte RNA . . . . . . . . . . . . . . . . . . . . . . . . 116
Figure 3.4 Comparison of in vitro and in vivo PB induced CYP2B2 mRNA samples. . . . 118
Figure 3.5 Expression of CYP2B2 in CFA and PB treated hepatocyte cultures . . . . . . . . 119
Figure 3.6 Effect of RNAse concentration on RNAse protection for CYP2B2 RNA. . . . 120
Figure 3.7 Structure of phenobarbital and possible phenobarbital-like inducers. . . . . . . . . 121
Figure 3.8 Comparison of CYP2B2 induction . . . . . . . . . . . . . . . . . . . . . . . . . . . . . . . . 122
Figure 3.9 Dose response for PB . . . . . . . . . . . . . . . . . . . . . . . . . . . . . . . . . . . . . . . . . . 123
Figure 3.10 Dose response for CFA . . . . . . . . . . . . . . . . . . . . . . . . . . . . . . . . . . . . . . . . 124
Figure 3.11 Dose response for GWY . . . . . . . . . . . . . . . . . . . . . . . . . . . . . . . . . . . . . . 124
Figure 3.12 Dose response for GWZ . . . . . . . . . . . . . . . . . . . . . . . . . . . . . . . . . . . . . . 125
Figure 3.13 Time course of induction of CYP2B2 mRNA by 1.0mM PB . . . . . . . . . . . 126
Figure 3.14 Western blot analysis of CYP2B induction . . . . . . . . . . . . . . . . . . . . . . . . . 127
Figure 3.15 A confirmation EcoR I digest of the CYP2B2 construct. . . . . . . . . . . . . . . 128
Figure 3.16 Sequencing strategy for the CYP2B2 5’ flanking sequence. . . . . . . . . . . . . . 130
Figure 3.17 Nucleotide sequence of the 5’ flanking region of the PB-inducible CYP2B2 gene
. . . . . . . . . . . . . . . . . . . . . . . . . . . . . . . . . . . . . . . . . . . . . . . . . . . . . . . . . . . . . . . . . . . 133
Figure 3.18 Restriction digest of the 969 bp PBRE containing region . . . . . . . . . . . . . . 135
Figure 3.19 Restriction digest of the 1Kb-Pluc clone . . . . . . . . . . . . . . . . . . . . . . . . . . 136
Figure 3.20 Cartoon depicting the sub-cloning of the PBRE containing CYP2B2 plasmids. .
. . . . . . . . . . . . . . . . . . . . . . . . . . . . . . . . . . . . . . . . . . . . . . . . . . . . . . . . . . . . . . . . . . . 137
Figure 3.21 Restriction digest of the 1Kb-Pluc clone . . . . . . . . . . . . . . . . . . . . . . . . . . 138
Figure 3.22 The influence of DOTMA/DOPE concentration on transfection efficiency . 140
Figure 3.23 The influence of DNA concentration on transfection efficiency . . . . . . . . . . 141
Figure 3.24 The influence of incubation time on transfection efficiency . . . . . . . . . . . . . 142
Figure 3.25 Intact morphology both before (A) and after (B) transfection . . . . . . . . . . . . 143
Figure 3.26 Determination of PB responsiveness of two PBRE containing constructs. . . 145
Figure 3.27 PCR amplification of CYP2B2 PBRE DNA. . . . . . . . . . . . . . . . . . . . . . . . 148

Neill J. Horley
Page 19
Figure 3.28 Cloning of the PBRE containing TK163-Luc plasmid. . . . . . . . . . . . . . . . . 148
Figure 3.29 Effect of different reporter promoter activity on PBRE responsiveness to PB 152
Figure 3.30 Cytotoxic effects of transfection protocol upon primary rat hepatocytes. . . . 155
Figure 3.31 Effect of time upon expression of PB induced TK2B2-F-Luc reporter activity. .
. . . . . . . . . . . . . . . . . . . . . . . . . . . . . . . . . . . . . . . . . . . . . . . . . . . . . . . . . . . . . . . . . . . 156
Figure 3.32 Restriction digest of the 163bpCAT clone . . . . . . . . . . . . . . . . . . . . . . . . . 157
Figure 3.33 Electrophoresis of CsCl-EtBr treated reporter constructs . . . . . . . . . . . . . . . 159
Figure 3.34 Effect of CsCl-EtBr treatment on 163bpCAT transfected hepatocytes . . . . . 160
Figure 3.35 Effect of heat treatment upon CAT assay of 163bpCAT cell extracts . . . . . . 161
Figure 3.36 Variation of cell lysate volume effects the amount of CAT activity present . . 162
Figure 3.37 Comparison of PB mediated induction of the TK2B2-F-Luc and 163bpCAT con-
structs . . . . . . . . . . . . . . . . . . . . . . . . . . . . . . . . . . . . . . . . . . . . . . . . . . . . . . . . . . . . . . 163
Figure 3.38 Morphological appearance of primary rat hepatocytes cultured with various matrix
components. . . . . . . . . . . . . . . . . . . . . . . . . . . . . . . . . . . . . . . . . . . . . . . . . . . . . . . . . . 166
Figure 3.39 Comparison of the effects of matrix components upon PBRE-mediated induction
. . . . . . . . . . . . . . . . . . . . . . . . . . . . . . . . . . . . . . . . . . . . . . . . . . . . . . . . . . . . . . . . . . . 167
Figure 3.40 Effect of transfection protocol upon PB induction of CYP2B2 mRNA. . . . . 168
Figure 3.41 Effect of luciferase reporter concentration and time of transfection upon
163bpCAT reporter activity . . . . . . . . . . . . . . . . . . . . . . . . . . . . . . . . . . . . . . . . . . . . . . 170
Figure 3.42 Effect on fold induction by PB of altering pGL3-control concentration and trans-
fection time upon 163bpCAT reporter activity . . . . . . . . . . . . . . . . . . . . . . . . . . . . . . . . 171
Figure 3.43 (A) Normalised activation of the PBRE containing reporter under various
163bpCAT concentrations, (B) Ratio of PB induction exhibited by these cultures . . . . . . 173
Figure 3.44 Modulation of the PBRE present in 163bpCAT by various xenobiotics . . . . 175
Figure 3.45 PCR amplification of 1160 bp mCAR cDNA. . . . . . . . . . . . . . . . . . . . . . . 177
Figure 3.46 Restriction digest of the mCAR-pcDNA 3.1 (-) clones . . . . . . . . . . . . . . . . 178
Figure 4.1 Schematic of CYP2B2 constructs containing the PBRE used in transfection studies
on primary rat hepatocytes . . . . . . . . . . . . . . . . . . . . . . . . . . . . . . . . . . . . . . . . . . . . . . . 218

Neill J. Horley
Page 20
List of TablesTable 3.1 Primers used to determine the CYP2B2 5’flanking sequence . . . . . . . . . . . . . 129
Table 3.2 Relative activities of firefly and Renilla luciferase reporter gene activity . . . . . 150
Table 3.3 Relative activities of firefly and Renilla luciferase reporter gene activity . . . . . 151

Neill J. Horley Section 1.1.1
Page 21
Chapter 1 Introduction
Section 1.1 The cytochrome P450 gene superfamily
Section 1.1.1 Xenobiotic biotransformations
All forms of life are exposed to external stimuli, both of a physical and chemical nature. An
organism is exposed to foreign xenobiotics every time that it eats, drinks or breathes. These
xenobiotics may take the form of both naturally occurring or synthetic compounds. Some of
these xenobiotics will prove beneficial to the organism and can be utilised in normal biological
processes to provide energy or act as precursors in the synthesis of macromolecules. Other
xenobiotics are harmful to the organism and may be chemically reactive with the basic cellular
constituents such as proteins, RNA and DNA, and it is these chemical interactions which lead
to the disruption of normal cellular function (Lake, 1995). These toxic chemicals are often
resistant to metabolism and due to their lipophilic nature, bioaccumulate in the cells. It is this
accumulation that leads to cell damage and eventual death.
The xenobiotic induction of cytochrome P450 enhances the detoxification of these compounds.
Eventually the xenobiotic will be chemically altered to enhance the likelihood of excretion from
the organism. These processes are collectively referred to as biotransformations and generally
result in the conversion of a poorly excretable lipophilic xenobiotic to a readily excretable water-
soluble compound (Caldwell and Paulson, 1983; Porter and Coon, 1991).
Drug metabolising enzymes present in organisms are responsible for the biotransformation and
subsequent excretion of many xenobiotics (Gonzalez et al., 1988). The major organ and primary
site at which most chemical biotransformations occur is the endoplasmic reticulum of the liver
(Paine, 1981). The liver is thus available to detoxify chemicals arriving though the gastointestinal
tract. However, low levels of some cytochrome P450 forms are found in extrahepatic tissues such
as, the lungs, kidney, skin and the gastrointestinal tract (Gonzalez and Lee, 1996).

Neill J. Horley Section 1.1.1
Page 22
Most of these compounds are lipophilic in nature and are thus difficult to purge from the
organism. Their continual presence and accumulation may prove toxic to the organism involved.
The metabolism of these xenobiotics is necessary so as to prevent accumulation. The metabolism
of these compounds can sometimes lead to a more reactive compound than the parent compound
being generated, or the compound can be detoxified and excreted from the system.
To prevent any harmful accumulation of toxic substances, organisms have evolved a complex
multi-enzyme defence mechanism to eliminate foreign/toxic chemicals. These drug metabolis-
ing enzymes are comprised of two types, phase I (cytochrome P450s or mixed function oxidases),
and phase II enzymes (UDP-glucuronosyltransferases and sulphotransferases).
Phase I reactions are catalysed predominately by a superfamily of structurally related haem protein
mono-oxygenases (Lu and West 1980). These haemproteins are located in the membrane of the
endoplasmic reticulum and are known collectively as the cytochrome P450s. Phase I reactions
are important in the hydrolysis, oxidation, peroxidation and reduction of numerous endogenous
compounds such as bile acids, biogenic amines, fatty acids, leukotrienes, prostaglandins and
steroids (Gonzalez, 1990; Guengerich, 1991). Cytochrome P450s have a major role in the
detoxification or inactivation of biologically active compounds to aid excretion from the body.
Phase I enzymes are responsible for adding functional groups to xenobiotic molecules by intro-
ducing [O]; leading to the availability of polar functional groups such as, (-OH, -SH, -NH2, or
-COOH) in the molecule undergoing biotransformation. This initial stage converts the foreign
molecule into a derivative that is slightly more hydrophilic and allows further metabolism to
occur via phase II reactions. Phase II reactions are biosynthetic reactions involving the
conjugation of an endogenous group of molecules such as glucuronic acid, amino acids, sulphates
or glutathione to the phase I derived molecule. This introduction of an endogenous moiety
usually confers increased water solubility and the ability to undergo yet further metabolism to

Neill J. Horley Section 1.1.2
Page 23
promote excretion (Gibson and Skett, 1994). The action of the cytochrome P450 enzymes upon
xenobiotics sometimes produces detrimental intermediates, as is the case in the metabolism of
certain carcinogens and mutagens. There are also beneficial intermediates that arise from such
action, as is the case of certain prodrugs like the anticancer agent cyclophosphamide.
Section 1.1.2 Isolation of cytochrome P450
The history of the cytochrome P450s began back in the 1950s. A cellular pigment in rat and pig
microsomes was discovered to give an unusual red-shifted visible absorption maximum at about
450nm when complexed with carbon monoxide (Klingenberg, 1958; Garfinkel, 1958). This ab-
sorption maximum was quite different from that exhibited by typical haemproteins such as myo-
globin (435nm). Its unique 450nm-absorption spectrum was how cytochrome P450 (CYP450)
obtained its name. It was further characterised and purified by Omura and Sato in 1964 (Omura
and Sato, 1964 a, b) and was shown to be a b-type cytochrome containing an iron-protoporphy-
rin IX as the prosthetic group. In 1965 cytochrome P450 was established as being the terminal
oxidase of the liver microsomal drug-metabolising enzyme system (Cooper et al., 1965).
Over the last 20-30 years multiple forms of cytochrome P450 enzymes have been analysed and
identified by such techniques as protein purification and monoclonal antibody analysis. There are
many distinct forms of these cytochrome P450 enzymes present in all organisms and each
cytochrome P450 enzyme exhibits very distinct but broad substrate specificities. Individual forms
of the enzyme have a role in a variety of tightly regulated pathways, such as developmental
regulation and modulation by steroid or polypeptide hormones. Others are important in the
metabolism of foreign hydrophobic compounds which may include dietary components,
xenobiotics, therapeutic drugs (e.g. phenobarbital, PB) or chemical carcinogens (Nebert and
Gonzalez, 1987). It was the isolation and characterisation of the various components of the
cytochrome P450 system which led to the current understanding of the mechanism of action of

Neill J. Horley Section 1.1.3
Page 24
the cytochrome P450 enzymes.
Section 1.1.3 Mechanism of action
The cytochrome P450 system is composed of two enzymes i.e. the haem containing enzyme
cytochrome P450 and NADPH-cytochrome P450 reductase. These enzymes are present in all
organs, but predominantly in the liver, embedded in the phospholipid matrix of the endoplasmic
reticulum and other organelles such as the mitochondria. It is the phospholipid layer that
facilitates the interaction between the two enzymes. Cytochrome P450 forms the main
component of the microsomal mixed function mono-oxygenase system (MFO). There is an
extensive array of reactions catalysed by the MFO. These include not only the hydroxylation of
aliphatic, aromatic and cyclic compounds, but the oxidation, N-/S-/O-dealkylation,
sulphoxidation and deamination of many other compounds. These reactions start with the
introduction of a single atom of molecular oxygen derived from O2, into the substrate, with the
simultaneous reduction of the accompanying oxygen atom to water. The generic equation for
the cytochrome P450 catalysed mixed function oxidase reaction is shown below:
where RH represents the substrate and ROH represents the oxidised product.
This equation suggests a simple mechanism. However,this is not the case. The reaction is best
represented as a cyclic reaction showing the interactions that occur between cytochrome P450
and the NADPH-cytochrome P450 reductase (Figure 1.1) (Porter and Coon, 1991; Coon et al.,
1992; Guengerich et al., 1998; Schenkman, 1981). The reaction begins when the substrate binds
to the active site of the cytochrome P450 close to the haem bound region of the molecule (Figure
1.1, step 1) and involves the reduction of molecular oxygen by the stepwise addition of two
electrons. These electrons are donated to cytochrome P450 by the reducing co-factor NADPH.
RH + O2 + H+ + NADPH ROH + H2O + NADP+ cytochrome P450

Neill J. Horley Section 1.1.3
Page 25
NADPH is a two-electron donor but cytochrome P450 can only accept one electron at a time.
This necessitates the presence of an accessory enzyme. This accessory enzyme is the flavoprotein
NADPH-cytochrome P450 reductase which possesses two flavin prosthetic groups. This enables
NADPH-cytochrome P450 reductase to accept two electrons from NADPH and simultaneously
transfer one electron to two different cytochrome P450 molecules. The ratio of
NADPH-cytochrome P450 reductase to cytochrome P450 molecules present in liver
microsomes is about 20:1. It is during the first electron donation that the iron atom present in
the cytochrome P450 is reduced to the ferrous state (Fe2+) (Figure 1.1, Step 2) and molecular
oxygen binds to the cytochrome P450 complex (Figure 1.1, Step 3). A second electron is then
donated to the cytochrome P450 from NADPH-cytochrome P450 reductase (Figure 1.1, Step
4). This is followed by electron rearrangement, insertion of an oxygen atom and product release
with the generation of water or hydrogen peroxide (Figure 1.1, Step 5-8).

Neill J. Horley Section 1.1.3
Page 26
Fe 3+
cytochrome P450
RH substrate
1
Fe 3+ (RH)
1e-
NADPH red
NADPH oxid
Fe 2+ (RH)
2
O2
3
Fe 2+-O2 (RH)
b5 oxid
b5 red
NADPH oxid
NADPH red
Fe 2+ -O2 -(RH)
4
2H+
H2O 5
Fe O3+ (RH)
ROH
Fe3+ (ROH)
Fe OH 3+ (R.)
6
7
8
1e-
Figure 1.1 Figure 1.1 Catalytic cycle of the cytochrome P450 reactions. Step 1. Binding of sub-strate (RH) to Cytochrome P450 (Fe3+). Step 2. Iron atom present in cytochrome P450 is reduced to the ferrousstate by the addition of an electron donated by NADPH-cytochrome P450 reductase. Step 3. Molecular oxygenbinds to the reduced cytochrome P450 complex. Step 4. A second electron is donated to the cytochrome P450complex by NADPH-cytochrome P450 reductase. Step 5-8. Electron rearrangement, within the cytochrome P450with the insertion of oxygen into the substrate and the production of the product (ROH) and water. NADPH = NADPHcytochrome-P450 reductase. b5 = cytochrome b5 reductase. Diagram adapted from Porter and Coon, 1992.

Neill J. Horley Section 1.1.4
Page 27
Figure 1.1 also shows the presence of another haemprotein at step 4, NADH-cytochrome b5
reductase (cytochrome b5). Cytochrome b5 may donate electrons to the cytochrome P450
catalytic cycle using NADH as the reducing co-factor. Some cytochrome P450s (such as
CYP3A4, CYP2E1) have shown an apparent dependence upon cytochrome b5 for maximal
catalytic activity (Guengerich and Johnson, 1997). Cytochrome P450-like activity is not just
confined to the endoplasmic reticulum. These enzymes have been shown to be active in the
adrenal cortex mitochondria e.g. steroid hydroxylase-P450s. These mitochondrial P450s receive
their supply of electrons from the iron sulphur ferredoxin-like protein adrenodoxin which acts
as an accessory enzyme between the reductase and cytochrome P450. The CYP450 component
of both the mitochondrial and microsomal cytochrome P450s is present in an insoluble
membrane form. By way of contrast, the bacterial cytochrome P450s in general have no apparent
membrane association and are soluble.
The cytochrome P450 enzyme activity as an oxygenase rather than an electron carrier led to the
proposal for a more suitable name that encompassed the enzymes catalytic activities. Standard
methods for enzyme nomenclature do not apply due to their broad catalytic activities. To date,
the name cytochrome P450 is still universally accepted and a systematic nomenclature system has
been devised based on structural homology (Nelson et al., 1996).
Section 1.1.4 1.1.4 Nomenclature of the cytochrome P450 superfamily
Omura and Sato (1964 a, b) had originally intended the name P450 to be a temporary one until
more was discovered about the properties of the enzyme. Since its discovery, P450 work has
increased exponentially. This has led to certain cytochrome P450s acquiring several names from
different workers e.g. the PB induced rat cytochrome P450 has been given such names as
CYP2B1/2 (Nelson et al., 1996), P450-b/e (Ryan et al., 1979), PB-B/D (Guengerich et al.,
1982), PB-4/5 (Waxman et al., 1982). It was only with the more recent developments in the

Neill J. Horley Section 1.1.4
Page 28
isolation and sequencing of P450 genes, cDNAs and proteins that a unified nomenclature system
could be devised based on primary amino acid sequence alignment data (Nebert et al., 1991).
This system of nomenclature is constantly being reviewed and updated (Nebert et al., 1989, 1991,
and Nelson et al., 1993, 1996). The recommendations for the naming of cytochrome P450s
include the root symbol ‘CYP’ (‘Cyp’ which is italicised for both the mouse and Drosophila) to
denote cytochrome P450. This is followed by an Arabic number designating the P450 family, a
letter indicating the subfamily (when two or more exist), and an Arabic number representing the
individual gene. For example the nomenclature denotes rat CYP2B2 as cytochrome P450 gene
number 2 of subfamily 2B. All cytochrome P450 cDNAs, mRNAs and proteins are named in
the same way except they are non-italicised and are in upper case lettering. The cytochrome
P450 superfamily is divided into families and subfamilies, done on the basis of amino acid se-
quence identity. Members within the same family usually exhibit >40% amino acid sequence
identity whilst members of the same subfamily are at least >55% identical.
Cytochromes P450 are ubiquitously distributed in nature and have been sequenced and isolated
in prokaryotes, unicellular eukaryotes, plants, insects, invertebrates, fish, fowl and mammals
(Nelson et al 1996 and refs therein). To date 481 CYP450 genes and 22 pseudogenes have been
reported. These genes have been described in 85 eukaryote and 20 prokaryote species. The
cytochrome P450 enzymes have been divided into 74 gene families of which 14 families
comprise 26 mammalian subfamilies. Families CYP1-4 contribute the greatest involvement to
xenobiotic metabolism. Other CYP450s typically do not contribute to xenobiotic metabolism
but rather metabolise physiological endogenous substances such as the newly identified CYP5
and 8, which are important for thromboxane and prostacyclin biosynthesis respectively. CYPs
11,17,19 and 21 catalyse hydroxylation reactions required for steroid hormone biosynthesis from
cholesterol (Nelson et al., 1996).

Neill J. Horley Section 1.1.5
Page 29
Section 1.1.5 Evolution of the cytochrome P450 superfamily
It has been estimated that the first ancestral gene has its origins over 1360 million years ago,
before the divergence of the bacterial, plant and animal kingdoms (Nelson and Stobel, 1987). It
has been hypothesized that the first gene duplication event in eukaryotes gave rise to the presence
of cytochrome P450 in two different cellular organelles, i.e. the mitochondrion and the
endoplasmic reticulum. The explosion in CYP genes (particularly the CYP2 family) has been
attributed to the increase in interactions between plants and animals. C.elegans has 100 P450s,
more than that found in rat or humans. The greatest impact came initially from the plant/animal
conflict. This meant that plants evolved defence mechanisms such as phytoalexins which (in turn)
forced the animals to evolve biotransformation enzymes to help detoxify these compounds
(Nebert and Gonzalez, 1987; Nebert, 1994). As described previously, the earliest cytochrome
P450s were not concerned with detoxification processes but were more engaged in the
metabolism of endogenous substrates such as cholesterol and steroids (Soucek and Gut, 1992;
Nebert and Gonzarlez, 1987). The divergence separating the metabolism of endogenous versus
exogenous substrates has been estimated to have occurred about 100 million years ago. It has
been suggested that these early P450s evolved to maintain cell membrane integrity through the
metabolism of lipids and steroids (Gonzalez and Nebert, 1990).
The divergence of particular genes and their relationship to others can be estimated by comparing
primary amino acid sequence data of all the known P450s. Using computer alignment programs
in conjunction with estimated species divergence (based on fossil evidence), phylogenetic trees
can be constructed. The construction of phylogenetic trees has helped to determine where the
major gene divergences have occurred. An indication of the divergence from the ancestral gene
of the separate CYP450s is that they occur on different chromosomes and have sequence
homology of < 30%, whereas members within families which diverged later have sequence
homology > 55%. It is believed that the divergence within the subfamilies is a combination of

Neill J. Horley Section 1.1.6
Page 30
gene duplication, gene conversion and gene mutation events (Gonzalez, 1990).
Section 1.1.6 Xenobiotic induction of cytochrome P450 genes
The ability of the drug metabolising system to alter its activity in response to various xenobiotics
is a key component in the regulation of cytochrome P450 gene expression. Many P450 genes
are expressed constitutively in the liver (Gonzales and Lee, 1996) and can also be stage-, tissue-,
strain- and sex-specific in their expression. However, many cytochrome P450 genes are involved
in xenobiotic metabolism and can be induced (in the case of CYP2B1) up to 100-fold above their
constitutive levels. In the liver CYP2B2 protein is present at a low constitutive level whereas
CYP2B1 is 5-10 times lower by comparison. However, when induced by PB these levels
increase to 20 and >100 fold above constitutive levels respectively (Christou et al., 1987;
Yamazoe et al., 1987). It is likely that there are multiple mechanisms involved in the regulation
of a particular cytochrome P450.
Inducers can be categorised into several distinct classes, which include polycyclic hydrocarbons,
barbiturates, glucocorticoids, peroxisomal proliferators and ethanol (Gonzales, 1990; Whitlock et
al., 1986). These xenobiotics may either induce their own metabolism, or act to increase the
metabolism of other xenobiotics by the induction of a particular cytochrome P450.
Regulatory control of cytochrome P450s can be exerted at a number of different levels of gene
expression. These include gene transcription, mRNA processing, mRNA stabilisation,
translation and protein stabilisation (Porter and Coon, 1991; Goldfarb, 1990). Induction of the
cytochrome P450 families CYP1-4 occurs predominantly at the level of transcriptional activation
(Okey, 1990; Denison and Whitlock, 1995; Waxman and Azaroff, 1992) with only a few
exceptions such as CYP2E1. CYP2E1 is induced by ethanol and related compounds by a post-
transcriptional mechanism (Roberts et al., 1995; Song et al., 1989). Xenobiotics induce CYP1-4
gene expression through one of four distinct receptor-mediated mechanisms (Figure 1.2).

Neill J. Horley Section 1.1.6
Page 31
Specific xenobiotic receptor proteins have now been identified which display a link to the four
mechanistically distinct classes of cytochrome P450 inducers (Dogra et al., 1998). The mechanism
by which these xenobiotics interact with these receptor proteins and how the induction of the
cytochrome P450 genes occurs is under investigation.

Neill J. Horley Section 1.1.6
Page 32
CYP1A
AhR hsp90
AhR hsp90
Arnt hsp90
Ahr Arnt
Nucleus
PAH
XRE/DRE
CYP3A
DEX
PXR/RXR
RXRαPPARα RXRα
PPRE
CYP4A
PPARα
PP
PB
CYP2B
RXRα
CAR/RXR CAR/RXR
NF1/NRPBRECAR
Androstane
?
RXRα
?
PXR ? ??
Figure 1.2 Cartoon of the four proposed models for transcriptional activation of CYP genes. PAH, polycyclic aromatic hydrocarbon; DEX, dexamethasone; PP, peroxisome proliferator; PB, phenobarbital; AhR,arylhydrocarbon receptor; hsp90, heat shock protein 90; PXR, pregnane X receptor; PPARα, peroxisome prolifer-ator-activated receptorα; CAR, constitutively activated receptor; Arnt, AhR-nuclear translocator protein; RXRα, re-tinoid X receptor; XRE/DRE, xenobiotic/dioxin-responsive element; PPRE, peroxisome proliferator responseelement; PBRE, phenobarbital response element; NR, nuclear receptor binding motifs; NF1, nuclear factor 1 bind-ing site. (Diagram adapted from Dogra, et al., 1998)

Neill J. Horley Section 1.1.6
Page 33
Section 1.1.6.1 Aromatic hydrocarbon inducible cytochrome P450 genes
In the 1950s it was observed that the administration of 2,3,7,8-tetrachlorodibenzo-p-dioxin
(TCDD) resulted in the induction of a number of liver microsomal enzymes, referred to as the
aryl hydrocarbon hydroxylases (AHH). AHH metabolise numerous polycyclic aromatic
hydrocarbons, such as the carcinogens 3-methylcholanthrene (3-MC) and benzo(a)pyrene
(Poland et al., 1976). TCDD is an extremely potent inducer of CYP1A1 (30,000 times more
potent than 3-MC). The receptor protein associated with the induction of CYP1A1 was shown
to bind TCDD saturably, reversibly, and with high affinity and has been designated the aromatic
hydrocarbon receptor (AhR) (Poland and Knutson, 1982).
The molecular mechanism regulating CYP1A1 gene expression is extremely well characterised.
It begins when the ligand enters the cell cytoplasm and triggers the transformation of the AhR
complex to a form which can activate the transcription of the CYP1A1/2 genes. The AhR is
present in the cytoplasm bound to a dimer of hsp90 (Perdew, 1988, Perdew and Poland, 1988);
the hsp90 maintains the AhR in a ligand binding conformation whilst repressing nuclear
translocation and subsequent dimerisation with Ah receptor nuclear translocator (Arnt) (Pongratz
et al., 1992; Whitelaw et al., 1995). Arnt is a nuclear protein that dimerises with liganded AhR,
thereby enabling AhR to bind DNA; this leads to the subsequent shift in the distribution of AhR
towards the nucleus (Pollenz et al., 1991). Thus, Arnt acts as an essential heterodimeric partner
for ligand-bound AhR.
The AhR ligand enters the cell cytoplasm and interacts with AhR at the ligand-binding site with-
in the PAS region; this region is shared with the hsp90-binding site. AhR will not accept the
ligand in the absence of hsp90. A conformational change occurs in AhR to a DNA-binding form
once the ligand has bound. It is thought that this allows exposure of the nuclear localisation signal
and subsequent nuclear translocation. Once the AhR/hsp90/ligand complex is translocated to

Neill J. Horley Section 1.1.6
Page 34
the nucleus an AhR/Arnt DNA binding heterodimer is formed with disassociation and recycling
of hsp90. The heterodimer occurs through the bHLH and PAS domains. The AhR/Arnt
heterodimer then binds to specific DNA sequences known as dioxin response elements (DRE)
or xenobiotic response elements (XRE) and activates transcription. The core DRE consensus,
TNGCGTG, contains one E-box half-site and one non-consensus half site. The CGTG consen-
sus sequence is absolutely required for the inducible, AhR-dependent, Arnt-dependent protein-
DNA interactions. Protein phosphorylation may be required for heterodimerisation (Berghard et
al., 1993), DRE-binding (Pongratz et al., 1991) and transcriptional activation to occur. The chro-
matin structure of the enhancer and promoter regions in the CYP1A1 gene assumes a nucleoso-
mal configuration in the uninduced state. When CYP1A1 is induced, the AhR/Arnt
heterodimer binding to the DRE disrupts the organisation of the nucleosome and alters the con-
formation of the DNA. Once the nucleosome at the promoter region is disrupted, there follows
a recruitment of general transcription factors to their cognate binding sites, followed by transcrip-
tion. Unlike the xenobiotics that induce the CYP4A and CYP2B families, the xenobiotics that
induce CYP1A1/2 possess very similar chemical structures, i.e. uniformly planar and aromatic.
Section 1.1.6.2 Steroid inducible cytochrome P450 genes
The steroid Pregnenolone-16α-carbonitrile (PCN) has been shown to induce cytochrome P450
enzyme activity (Okey, 1990; Gonzalez, 1988). The PCN-inducible enzymes that metabolise
structurally diverse xenobiotics, including testosterone, antibiotics, dexamethasone, anti-gluco-
corticoids and numerous other drugs, have been designated inducers of the CYP3A family. The
CYP3A genes induced by these chemicals include CYP3A4, 5, 7 (present in humans), CYP3A1,
2, 23 (present in rats) and CYP3A6 (present in rabbits). Early studies on CYP3A1 induction
highlighted the paradoxical observation that both glucocorticoids (such as high levels of dexam-
ethasone) and anti-glucocorticoids (such as PCN) could have an inductive effect (Burger et al.,
1992; Quattrochi et al., 1995). The observation that high concentrations of dexamethasone were

Neill J. Horley Section 1.1.6
Page 35
required for the induction of CYP3A1 and that PCN induced CYP3A1 still further, but
inhibited tyrosine aminotransferase (a classical glucocorticoid receptor-dependent gene)
induction was recognised as an inconsistency in the concept that CYP3A induction was mediated
via the classical glucocorticoid receptor (GR) mechanism (Schuetz and Guzelian, 1984).
Species differences in the induction of the CYP3A family have been observed (Wrighton et al.,
1985). In humans CYP3A5 induction has been reported to require the glucocorticoid receptor
(Schuetz et al., 1996), whereas rat CYP3A23 induction has been reported to occur not via the
classical glucocorticoid receptor but by a novel orphan receptor, designated the pregnane X
receptor (PXR) (Schuetz et al., 1998). A dexamethasone responsive element was found in the
CYP3A23 gene, which did not contain a GR element but contained an imperfect direct repeat
DR4 motif (AGGTCA direct repeat separated by 4 bp) characteristic of the nuclear orphan
receptors (Huss and Kasper, 1998). A second functional element had earlier been identified
which consisted of a direct repeat of ATGAAT separated by 2 bp which was also involved in the
dexamethasone response element (Huss et al.,1996). A PXR/retinoid X receptor (RXR)
heterodimer with the dexamethasone response element present in the promoter sequence of the
CYP3A23 gene was shown in transfection experiments to activate reporter gene transcription
(Quattrochi et al., 1998). The human homologue nuclear receptor designated hPXR (Lehmann
et al., 1998), or hPAR (Bertilsson et al., 1998) has also been shown to heterodimerise with the
RXR and apparently regulates CYP3A expression via the dexamethasone response element.
Section 1.1.6.3 Peroxisome proliferator inducible cytochrome P450 genes
Peroxisome proliferators (PP) encompass a broad spectrum of structurally dissimilar compounds,
which include fibrate hypolipidaemic drugs, phthalate ester plasticizers and halogenated aromatic
solvents. Exposure to PPs increases the size and number of peroxisomes present in the liver cells
and leads to an increase in peroxisomal (β)-oxidation of fatty acids as well as microsomal lauric

Neill J. Horley Section 1.1.6
Page 36
acid (ω)-hydroxylase activity (Lock et al., 1989; Johnson et al., 1996; Hardwick et al., 1987). It
has been shown that the induction mechanism of the CYP4A enzyme precedes the β-oxidation
enzymes such as acyl-CoA oxidase (Bell and Elcombe, 1991a; Milton et al., 1990). The CYP4A
genes that are induced by these chemicals include CYP4A1, 2, 3 (rats), and Cyp4a10, 11, 12
(mouse) (Kimura et al., 1989a, b).
A member of the nuclear receptor superfamily responsible for CYP4A induction, peroxisomal
enzyme induction and hepatic PP was isolated in 1990 and designated the PPARα (peroxisome
proliferator-activated receptor-α) (Issemann and Green, 1990). Experiments utilising PPARα-
knockout mice showed that the PPARα was an essential factor in peroxisomal proliferation (Lee
et al., 1995). The possibility that PPs and fatty acids act as ligands for PPARα has recently been
confirmed (Forman et al., 1997; Devchand et al., 1996; Keller et al., 1993). Response elements
present in the 5’ flanking region of the rat CYP4A1 and rabbit CYP4A6 genes designated the
peroxisome proliferator response elements (PPRE) have been shown to bind the heterodimer
that forms between PPARα and RXR (Palmer et al., 1994; Aldridge et al., 1995). This ligand-
induced binding of the PPARα/RXR heterodimer results in the stimulation of CYP4A
transcription.
Section 1.1.6.4 Phenobarbital inducible cytochrome P450 genes
Exposure to the sedative drug PB increases the transcription of many P450 genes such as
CYP2A1, 2B1/2, 2C6, and 3A1/2 as well as causing pleiotropic effects. These effects include
proliferation of hepatic endoplasmic reticulum, stabilisation of microsomal proteins, cell growth,
cell-cell communication, liver hypertrophy, tumour formation, glucose metabolism and haem
synthesis and metabolism (Conney, 1967; Honkakoski and Negishi, 1998a). Many other genes
are also induced such as epoxide hydrolase, cytochrome P450 oxidoreductase, specific forms of
UDP-glucoronosyl transferase (UDPGT), glutathione S-transferase (GSTs) and aldehyde

Neill J. Horley Section 1.1.6
Page 37
dehydrogenase (Waxman and Azaroff, 1992; Honkakoski and Negishi, 1998a). Transcriptional
activation of cytochrome P450 genes by PB occurs in a number of species including rat
CYP2B1/2, CYP3A1 (Hardwick et al., 1983; Gonzalez et al., 1986) rabbit CYP2C1/2 (Zhao et
al., 1990; Leighton and Kemper, 1984), chicken CYP2H1/2 (Hahn et al., 1991; Dogra et al.,
1999), and mouse Cyp2b10 (Honkakoski et al., 1996; Honkakoski et al., 1998b). There are also
several diverse chemicals that have no obvious structural similarity to PB but which elicit parallel
responses of varying intensity, which can serve as ‘PB-like’ inducers. These include chlordane,
isosafrole, terpenes, organochlorine pesticides, 2-allyl-2-isopropylacetamide, and nonplanar
polychlorinated biphenyls (Waxman and Azaroff, 1992; Honkakoski and Negishi, 1998a). This
structural difference suggests that PB and PB-like inducers may bind to a common receptor.
It had been proposed that the mechanism whereby PB acted upon cytochrome P450s of different
species from bacteria to birds and mammals (with the exception of fish) was highly conserved, as
evidenced by the widespread occurrence of a 17 bp element (Barbie box) present in many species
(He and Fulco, 1991). However, recent work has shown this not to be the case (Park and
Kemper, 1996; Honkakoski et al., 1996). Here, deletion of the Barbie box element did not result
in an alteration in the response to PB. Although PB induces transcription of various P450s, the
mechanism of induction are very different. For example, ongoing protein synthesis is required
for CYP2B1/2 induction but not for CYP3A (Waxman and Azaroff, 1992). Data presented by
Padmanaban’s group (Bhat et al., 1987) indicated that PB induction of CYP2B1/2 was blocked
by cycloheximide indicating that ongoing protein synthesis is required for CYP2B induction.
For the CYP3A1 and CYP2H1/2 genes, cycloheximide was shown to synergise with PB leading
to a 2-19 and 7-fold superinduction respectively of these genes (Burger et al., 1990; Hamilton et
al., 1992). Omiecinski’s work (Sidhu and Omiecinski 1998) later contradicted this data in
showing that de novo protein synthesis was not required for PB induction of CYP3A1 and
CYP2B1/2 genes.
Neill J. Horley Section 1.1.6
Page 38
Phenobarbital response elements upstream of the CYP2B1/2 and CYP2H1 genes have been
identified (Waxman and Azaroff, 1992). Relatively little is understood about the mechanism of
induction of the CYP2B genes. Ligand binding studies have failed to detect a specific PB-binding
protein. It is possible that PB-related compounds act indirectly by causing an accumulation of an
endogenous steroid, as has been suggested by Shaw et al. (1993), who demonstrated that PB
responsiveness was influenced by glucocorticoids.
Section 1.2 PB-inducible rat CYP2B1 and CYP2B2 genes
When rats are administered PB there is a rapid increase in CYP P450 expression, particularly
CYP2B1 and 2B2 genes (Phillips et al., 1983; Thomas et al., 1981; Ryan et al., 1982a,b).
Recombinant DNA technology using genomic DNA and cloned cDNAs has enabled the
determination of the coding nucleotide sequence of these two genes (Fujii-Kuriyama et al., 1982;
Mizukami et al., 1983; Yuan et al., 1983; Suwa et al., 1985; Jaiswel et al., 1987). CYP2B1 and
CYP2B2 are closely linked on rat chromosome 1 (Rampersaud and Walz, 1987). Despite their
sequence similarity, genetic cross-experiments undertaken by Rampersaud and Walz indicated
that they are non-allelic (Rampersaud and Walz, 1983). CYP2B1 has at least six alleles, is 23 kb
long and contains 9 exons and 8 introns. CYP2B2 has at least two alleles, is 14 kb long and has
a gene structure very similar to CYP2B1. The difference in size of the two CYP2B genes lies in
the length of intron 1 (12 kb in CYP2B1 and 3.2 kb in CYP2B2) (Suwa et al., 1985). The
nucleotide sequence in all 9 exons show very close homology between the two CYP2B genes
with only 40 base-pair substitutions present in 1900 nucleotides of the exonic sequence. They
are identical over the first 309 residues, differing in only 14 of the 491 amino acids present, i.e.
they share 97% amino acid sequence similarity. Distribution of these differences is limited to
exons 6-9, but the greatest incidence of differences occurs in exon 7 (Mizukami et al., 1983).
CYP2B1 and 2B2 proteins have been shown to be immunochemically cross-reactive, although

Neill J. Horley Section 1.2.1
Page 39
they can be distinguished by their electrophoretic mobilities on SDS-PAGE gels (Waxman and
Walsh, 1982). The corresponding mRNAs can be qualitatively monitored using RNAse
protection assays (Friedberg et al., 1990).
Section 1.2.1 CYP2B1 and CYP2B2 5’-flanking sequences
Sequence comparisons of the 5’-flanking regions of the CYP2B1 and CYP2B2 genes
demonstrated that the 97% sequence similarity existing between the CYP2B1 and CYP2B2
coding regions extends into the promoter region as far as -2.3 kb (Shaw et al., 1996; Sommer et
al., 1996). Beyond -2.3 kb the sequence homology between the two genes diverges significantly.
The transcriptional initiation site of both genes is approximately 30 bp upstream from the ATG
translation initiation site. At about 50 bp upstream from the ATG site a modified TATA box
sequence, CATAAAA can be found (Mizukami et al., 1983). Suwa and co-workers have sug-
gested that a section of the 5-flanking region at about -255 bp may play a role in the regulation
of gene expression, as it has the potential to form a Z-helical DNA structure (Suwa et al., 1985).
This section contains an alternating pyrimidine/purine sequence (CA) which is repeated several
times in each gene (5 times in CYP2B1 and 19 times in CYP2B2).
Section 1.2.2 Other CYP2B genes and regulatory elements
There are at least another 6-8 genes or pseudogenes homologous to the CYP2B1/2 genes which
have been identified in the rat genome (Atchison and Adesnik, 1983; Giachelli et al., 1989).
CYP2B3 is 77% similar to CYP2B1/2 and is expressed constitutively in the liver but it is not PB-
inducible (Labbe et al., 1988), whereas CYP2B8 (whose constitutive expression can only be
detected by PCR) is inducible by PB by at least 6-fold (Giachelli et al., 1989). The 5’-flanking
sequence of CYP2B8 is only similar to CYP2B2 from the transcription start site to -77 bp (73%
homology). Beyond this, i.e. from -311 to -503 bp the similarity drops to 36%. In the Cyp2b10
mouse gene the first exon consists of 197 bp and is 94% similar to the PB-inducible CYP2B2
gene and 82% similar to the non PB-inducible mouse Cyp2b9 gene. The 5’-flanking sequence

Neill J. Horley Section 1.2.2
Page 40
of Cyp2b10 showed 83% homology to CYP2B2, and in Cyp2b10 contained a much shorter
repeat (CA) region at -303 to -300 bp (Honkakoski et al., 1996).
Human forms of the CYP2B genes have also been isolated; CYP2B6 shows 73-78% amino acid
sequence similarity with CYP2B1 and has been described at the cDNA level (Miles et al., 1988),
although it is not known whether it is PB-inducible. CYP2B6 and CYP2B7 are another two
human orthologues that are expressed in the liver and lung respectively. CYP2B6 shows a 76%
sequence homology with CYP2B1 and a 93% homology with CYP2B7.
The CYP2B1/2 genes have also been reported to contain many non PB-inducible regulatory
elements. A putative glucocorticoid receptor element (GRE) located between -1339 and -1357
bp has been shown to confer glucocorticoid responsiveness to a reporter gene (Jaiswel et al., 1990;
Hoffmann et al., 1992). Work carried out by Park and Kemper using transient transfections and
immunological studies indicated that two regions (-82 to -67 bp and -64 to -45 bp) were found
to contribute to the promoter activity of CYP2B1/2 (Park and Kemper, 1996). The element
present at -45 to -64 bp in both CYP2B1 and CYP2B2 promoters binds members of the
CCAAT/Enhancer Binding Protein (C/EBP) transcription factor family. Mutational studies on
the -82 to -67 bp regulatory element indicated that this was essential for basal promoter activity
(Park and Kemper, 1996; Luc et al., 1996). An element similar to this was also found in the
chicken CYP2H1 gene at -204 to -208 bp (Dogra and May, 1997; Dogra et al., 1999). The
mouse Cyp2b10 gene, has a 42 bp insert occurring at -80 bp; correcting for this insert a similar
C/EBP like element present at -154 to -180 bp has been identified (Honkakoski et al., 1996).
Experiments carried out by this group also highlighted a response element in the Cyp2b10 gene
present at -775 to -971 bp, which decreased its basal activity.

Neill J. Horley Section 1.2.3
Page 41
Section 1.2.3 Pharmacology of phenobarbital
PB was initially synthesised at the beginning of the century and was the prototype of barbiturate
drugs. Its sedative/anticonvulsant properties exert their effects over prolonged time periods. It
has been useful in the treatment of epilepsy due to its sedative, hypnotic effects. These effects are
mediated by suppression of the polysynaptic responses, especially the mesencephalic reticular
activating system. Due to their clinical importance and their various pharmacological side effects,
PB and the barbiturates as a whole have been investigated quite extensively (Conney, 1967). The
effects of PB, in particular, include the proliferation of smooth endoplasmic reticulum,
stimulationof liver weight gain and liver tumour promotion.
Chronic administration of PB produces hepatocellular adenomas in rats and hepatocellular
adenomas and carcinomas in mice. However, PB did not increase the incidence of any type of
tumours in hamsters (Diwan et al., 1986). Similarly, substantial doses of PB administered to
humans (even over many years) also result in no increase in liver or other cancers ( Whysner et
al., 1996). PB is not considered to be DNA-reactive (i.e. a mutagen) although it has been found
to be a liver tumour promoter when administered after various carcinogens e.g. 2-acetylamino-
fluorene (Williams and Furuya, 1984).
When barbiturates are co-administered with other drugs, there may be drug-drug interactions.
This can mean that the presence of a barbiturate like PB can alter the action of another drug. The
drugs action may modify its pharmacodynamic interactions by altering the pharmacological
action of the drug without altering its concentration in the tissue fluid. The barbiturate may affect
the concentration of the other drug that reaches the site of action (pharmacokinetic interactions)
or the barbiturate may have a pharmaceutical interaction where drug-drug interactions occur so
that one or both drugs are inactivated.
It is the complex structural relationships and interactions of these compounds, which are the key

Neill J. Horley Section 1.2.3
Page 42
to elucidating their tumour-promoting activities. Mechanisms must firstly be assessed in rodents,
with a view to their extrapolation to the human metabolic system.
Section 1.3 Structural organisation of the liver
The liver is the largest gland in the body and constitutes approximately 2-5% of body weight of
the adult man. Hepatocytes are estimated to number 250 billion in a normal adult human liver.
The liver receives blood through a dual blood supply. The portal vein carries blood that has
passed through the capillary beds of the alimentary tract, spleen and pancreas, and constitutes 75%
of the afferent blood volume of the liver. The hepatic artery is a branch of the celiac trunk and
contains well-oxygenated blood and supplies the remaining blood to the liver.
The functional unit of the liver is the hepatic acinus. This consists of a small irregular mass of
encapsulated parenchymal tissue lying between two or more terminal hepatic venules. It
comprises a terminal portal vein, hepatic arteriole, bile ductule, lymph vessels and nerves. In the
periphery of the hepatic acinus, the sinusoids are drained by terminal hepatic venules, which form
the hepatic microcirculation units. Bile flows from the periphery towards the centre. Perfusion
within the acinus is unidirectional and therefore sequential, from the acinar axis to the acinar
periphery where the blood is emptied into the terminal venules. This unidirectional flow of
blood within the acinus creates a microenvironment; cells within each acinus appear to be
grouped into concentric zones around the axis of the acinus (arbitrarily zones 1 to 3). Zone 1 is
closest to the vascular axis (periportal) and cells here are the first to receive blood and nutrients,
the last to die, and the first to regenerate. Zone 3 is the furthest away (perivenous, centrilobular)
and receives blood of poorer quality and appear to be less resilient to damage. A diffusion gradient
appears to exist between zones 1 and 3 leading to differences in concentrations of enzymes,
glucose, hormones, metabolites, oxygen and substrates.
The hepatocytes or parenchyma cells are polyhedral, and constitute approximately 60-65% of the

Neill J. Horley Section 1.2.3
Page 43
total number of cells present in the liver. These cells range in size from 15-30µm in diameter and
occupy up to 80% of the volume of the human liver. Hepatocytes differ in size within the liver
depending upon where they are situated. The smaller cells usually border perforations in the liver
plate, and the larger cells are normally polyploid or located in the corners where three cell plates
touch. Hepatocytes have three types of surface, those neighbouring other hepatocytes, those
bordering bile canaliculi (which are essentially secretory), and those touching the perisinusoidal
space (space of Disse). This last type of hepatocyte surface is covered in microvilli, which provide
a large surface area to facilitate absorption from the bloodstream. The remaining 35-40% of cells
are non-parenchymal and comprise endothelial, Kupffer, pit cells and lipocytes.
The three-dimensional architecture of the liver is maintained by a combination of extracellular
fibroconnective skeleton (composed mostly of collagenous fibres and extracellular matrix) and
cellular adhesion. Several junctional complexes are involved in cellular adhesion. These include
tight junctions (zona occludens) where the cell membranes of two cells are united but not fused,
thus forming an impermeable junction. Another form is the intermediate junction (zona
adherens) which possess a true intercellular space. The presence of gap junctions allows
communication between cells, and desmosomes (macula adherens), which are button-like points
of contact, mechanically hold the cells together.
As the majority of biotransformations occur in the liver, models of drug metabolism have focused
on the liver and the enzymes contained within it. The use of in vitro models, which mimic the
liver in their response, would lead to a better understanding of the biotransformation processes
in a more controlled environment.

Neill J. Horley Section 1.2.3
Page 44
Section 1.4 Development of a PB-responsive in vitro hepatocyte culture system
Isolated hepatocytes are used as either suspension cultures or as monolayer cultures when
studying drug metabolism. Suspension cultures provide a more convenient and sophisticated
drug metabolism model than subcellular fractions, such as microsomes. However, suspension
cultures only remain viable for up to 6-8 hours before showing severe degenerative changes,
visible in the rapid decline in total cytochrome P450 content. Consequently, suspension cultures
have proved to be inadequate when considering long term culture studies. This problem has been
partially alleviated by the use of primary hepatocyte cultures. Hepatocytes maintained under
appropriate culture conditions have the advantage of remaining viable for several days. It is this
ability to maintain cultures over long periods of time that allows changes in gene expression and
enzyme induction to be studied.
Many groups have been unable to develop cell culture systems demonstrating responsiveness to
PB. In fact, most cell lines do not express either constitutive or PB-induced levels of CYP2B1/
2. Primary hepatocytes in particular demonstrate accelerated loss of microsomal cytochrome
P450 content along with progressive “foetalisation” of several cellular processes (Sirca and Pitot,
1980). These alterations are also associated with the loss of PB-responsiveness. The characteristics
of isolated hepatocytes alter both morphologically and biochemically relatively quickly, tending
to become phenotypically unstable and eventually undergoing dedifferentiation.
Paine and co-workers have shown that there is an alteration in the expression of hepatic
transcription factors and cytochrome P450 mRNAs resulting from the hepatocyte isolation
procedure (Padgham et al., 1993). This study showed the induction of mRNA encoding the
transcription factor c-jun during hepatocyte isolation. This c-jun induction was shown to subside
and a continual decline of mRNAs encoding cytochrome P450 2E1, 3A1, 3A2, 4A1 and 2C13,
(as well as the major constitutively expressed 2C11) was observed. CYP1A2, 2A1/2 and 2B1/2

Neill J. Horley Section 1.4.1
Page 45
mRNA levels were shown to stabilise for 2-3 hours before slowly declining. The mRNAs
encoding the liver-specific transcription factors C/EBPα and HNF-1 were also shown to decline
after cell attachment, in a similar fashion to CYP1A1/2 and CYP2B1/2. Paine and co-workers
suggest that the initial increase in the expression of c-jun followed by the decline in C/EBPα
and HNF-1 are characteristic of the changes in the expression of these transcription factor
mRNAs following the stimulation of hepatocyte proliferation after partial hepatectomy. Thus
the hepatocyte isolation procedure appears to prompt the normally quiescent hepatocytes to
enter the cell cycle and undergo dedifferentiation.
There are many publications addressing the maintenance of cellular viability and liver-specific
functions in cell culture (Skett, 1994; Chenery, 1988). Some of these factors have consistently
been shown to effect cytochrome P450 enzyme expression and induction in vitro. These include
the nature and composition of the extracellular matrix present (Ben-Ze’ev et al., 1988; Schuetz
et al., 1988), the formulation of culture medium used (Jauregui et al., 1986; Lecluyse et al., 1999),
and the combination and concentration of various hormones and trace elements (Waxman et al.,
1990; Nakajima and Shimbara, 1996).
Many workers have shown that high levels of CYP2B2 induction are possible without the need
for extracellular matrix components in the culture system (Bars et al., 1992; Park and Kemper,
1996; Sommer et al., 1996; Dogra and May, 1997). There are other workers who are unable to
obtain CYP2B2 induction without the use of extracellular matrix substrata (see below).
Section 1.4.1 Extracellular matrix substrata
MatrigelTM and collagen both represent components found in the space of Disse present in the
in vivo liver, albeit at different stages of hepatocyte differentiation (laminin is present at the feotal
stage and collagen at the mature stage). It has been proposed that they are important in restoring
PB-responsiveness in cultured hepatocytes (Schuetz et al., 1988; Ben-Ze’ev et al., 1988;
Neill J. Horley Section 1.4.1
Page 46
Brown et al., 1995).
The attachment of primary hepatocytes onto the surface of culture flasks is one of the first hurdles
that needs to be overcome when establishing long-term cultures of functional hepatocytes. Many
groups have reported that the coating of tissue-culture plates with various matrix components
greatly improves the efficiency of cell attachment and cell function (Ben-Ze’ev et al., 1988; Dunn
et al., 1989; Kleinman et al., 1986). In the intact liver, cells are surrounded by a support matrix,
which is composed of (amongst other factors) collagen, laminin, fibronectin, and heparin-
containing and chondroitin sulfate-containing proteoglycans. The basement matrices used to
coat tissue culture flasks try to mimic the conditions found in vivo. Many different matrix
components have been assessed for there ability to enhance cell attachment (Reid and Rojkind,
1979; Bissell et al., 1986). Collagen is one of the most frequently used basement matrices.
Hepatocytes have been shown to survive longer on collagen-coated flasks than cells which are
attached directly to plastic. In the former case, liver specific functions such as albumin synthesis
and tyrosine aminotransferase activity were better maintained (Michalopoulos and Pitot, 1975).
Preparations of collagen are usually obtained from calf-skin (type I) or rat-tail (type I). However,
type IV collagen (which constitutes the predominant liver extracellular matrix collagen) has also
been investigated (Bissell et al., 1987).
Dunn et al. (1989) have shown that adult rat hepatocytes cultured in a collagen sandwich
remained viable for at least 42 days. Here the hepatocytes exhibit a polygonal morphology more
typical of in vivo hepatocytes, unlike the spread-out, more flattened morphology typical of hepa-
tocytes cultured on tissue-culture plastic. This technique showed the maintenance of albumin
secretion and increased hepatocyte longevity was significantly better than non-sandwiched
hepatocyte cultures. Unfortunately this method could only delay dedifferentiation, not prevent
it. This data tends to suggest that the matrix geometry of the cultured hepatocytes in sandwich

Neill J. Horley Section 1.4.1
Page 47
cultures more closely mimics that of the liver architecture when present in this conformation.
Laminin-rich matrices containing type IV collagen and heparin sulphate proteoglycan
(MatrigelTM) have been shown to be very effective at maintaining cytochrome P450 and liver
specific activity (Ben-Ze’ev et al., 1988; Schuetz et al., 1988; Sidhu et al., 1994). MatrigelTM is a
complex biomatrix derived from the Engelbreth-Holm-Swarm (EHS) sarcoma. Hepatocytes
cultured using MatrigelTM as the support matrix retain their polygonal morphology and are more
PB-responsive, as detected by the appearance of CYP2B1/2 mRNAs and proteins (Schuetz et
al., 1988) and through the transcriptional activation of the CYP2B1/2 genes (Schuetz et al.,
1990). Brown and co-workers showed that purified laminin, a major component of MatrigelTM,
or two peptides (YIGSR or SIKVAV) which mimic various activities attributable to laminin,
could restore PB responsiveness to hepatocytes cultured on collagen type I cultures (Brown et al.,
1995).
Recent reports have shown that the presence of an extracellular matrix overlay rather than a spe-
cific type is more critical for restoration of cytochrome P450 activity (Lecluyse et al., 1999).
These results are in agreement with findings by Sinclair et al. (1990) which suggested that PB
induction of CYP2B1/2 cultured on either collagen or MatrigelTM were a close approximation
to that found in vivo (Sinclair et al., 1990). Lecluyse et al. (1999) also suggested that media formu-
lations as well as extracellular matrix conditions together influenced the ability of rat hepatocyte
cultures to express CYP2B1/2 enzymes.

Neill J. Horley Section 1.4.2
Page 48
Section 1.4.2 Hepatocyte culture media
Various modifications to the type of culture medium used in culturing cells have been assessed
for their ability to maintain differentiation in primary rat hepatocytes.
There are many commercially available media which form the basis of hepatocyte cultures such
as Dulbecco’s modified Eagle’s medium (DMEM), Williams’ E medium (WEM), modified
Chee’s medium (MCM) and Leibovitz medium (L15). These media all contain the essential
components needed to maintain cell survival. Some media such as MCM are composed of
“enriched” formulations, which contain super-physiological concentrations of certain
compounds, such as amino acids that facilitate protein synthesis. Different groups have shown
variations between media formulations with respect to cytochrome P450 activity. WEM was
shown to be superior to DMEM and MCM in terms of the level of induction of CYP2B and in
the specific content of CYP2B present in microsome preparations. (Lecluyse et al., 1999).
Previous to this Turner and Pitot (1989) showed that T1 medium was more effective than
modified Waymouth’s medium and much better than L15 in its capacity to sustain CYP2B
induction. Hepatocytes cultured on collagen coated plates and maintained in serum-free,
modifed Chee’s medium have also been shown to exhibit long term viability and the ability to
respond to PB by induction of near-physiological levels of enzymatically active CYP2B1/2
proteins and mRNA (Waxman et al., 1990). It was initially thought that it was necessary to have
MatrigelTM present in primary hepatocyte cultures to obtain PB-inducible CYP2B expression,
but reports such as that of Waxman et al. (1990) have shown this not to be the case. These reports
only highlight the immense diversity of culture conditions which show PB-inducible CYP2B
expression currently in use. However, the most successful PB-inducible hepatocyte culture
systems currently employed use MatrigelTM as an extracellular substrata but differ in their choice
of media, Honkakoski et al. (1996) prefer Williams’ E medium, while Trottier et al. (1995) prefer
modified Chee’s medium.

Neill J. Horley Section 1.4.3
Page 49
Section 1.4.3 Hepatocyte culture medium additives
The addition of certain hormones or trace elements to basic culture medium can often facilitate
retention of many liver-specific functions. Of the many hormones that have been tested the two
that have received the most attention are insulin and glucocorticoids. Glucocorticoids have a
considerable effect on the morphology, function and survival of hepatocytes in simple media.
Some workers have highlighted the possiblility of inductive effects of certain glucocorticoids
such as dexamethasone upon cytochrome P450 levels (Bars et al., 1989). The use of trace
elements such as selenium has also been shown to be required for the induction of cytochrome
P450 by PB (Nakajima and Shimbara, 1996; Newman and Guzelian, 1982; Engelmann et al.,
1985). It is thought that the hepatocytes in culture gradually become selenium-deficient and the
introduction of selenium counter acts this phenomenon and helps to maintain the stability of the
hepatocyte membranes.

Neill J. Horley Section 1.5.1
Page 50
Section 1.5 PB-responsive elements in PB-inducible genes
To understand the molecular basis of PB induction, it is necessary to determine the roles of both
cis and trans acting factors that may interact with the CYP2B2 DNA. Given the problems entailed
with cell culture, many studies have resorted to approaches based on transcription of minigene
constructs of the CYP2B2 gene in whole nuclei, run-on and cell free systems. DNA-protein
interactions have also been studied by the use of gel shift assays, DNA footprint assays and
south-Western blot analyses (reviewed by Kemper, 1998).
Section 1.5.1 Proximal PB-responsive promoter elements
In vitro studies have targeted the 5’ proximal regions of the PB-induced cytochrome P450 genes.
These studies focus on the role of PB in altering the binding of nuclear proteins to DNA response
elements and how these binding proteins may enhance transcriptional activation. The bacterium
Bacillus megaterium has been shown to contain two cytochrome P450 genes, BM1 (CYP106) and
BM3 (CYP102) which are inducible by PB (Fulco, 1991). The mechanism by which PB activates
these genes at the molecular level has been examined extensively and several central factors have
been identified (Liang et al., 1998). Gel retardation studies have located a sequence known as the
“Barbie box”. The Barbie box is composed of a 17 bp sequence located at -318 to -302 bp in
the BM1 and -243 to -227 bp in the BM3 promoter region respectively (with +1 being
equivalent to the translation start site). It has been suggested that PB modulates protein bound to
this sequence (He and Fulco, 1991; Liang et al., 1995; Liang and Fulco, 1995) and that sequences
that display a high degree of identity are present in the rat CYP2B1/2 genes. Barbie box-like
sequences have been reported in multiple PB-inducible mammalian genes (rat CYP2B1/2,
CYP3A2, rabbit CYP2C1). Despite the fact that Barbie box-like sequences are present in the rat
CYP2B1/2 genes, it should be noted that PB treatment reduced binding of bacterial proteins to
the Barbie box, whereas the reverse was observed with mammalian proteins to the same element
(He and Fulco, 1991). The significance of the Barbie box is questionable as the PB inducible

Neill J. Horley Section 1.5.1
Page 51
response was not abolished when the Barbie box sequence was deleted or mutated in situ or in
cultured hepatocytes (Park et al., 1996; Honkakoski et al., 1996). This observation suggests that
BM1 PB-induction in Bacillus megaterium may occur via a different mechanism than that of the
mammalian CYP2B genes.
Barbiturates have been shown to prevent binding of the Bm3R1 repressor protein to its operator
site which consists of a 20 bp inverted repeat near the transcription site of the BM3 gene (Shaw
and Fulco, 1993). Shaw and co-workers have demonstrated that BM3 was more PB-responsive
than BM1 and that the PB-mediated induction in the BM1 gene was not affected by the deletion
of the Barbie box (Shaw et al., 1998). This data also confirmed that the Barbie box sequence was
important for the negative regulation of BM1 gene expression in the absence of pentobarbital.
The presence of a repressor protein in the bacterial system does have some similarity to recent
work carried out on the mammalian nuclear receptor known as constitutively activated receptor
(CAR). PB-like inducers activate CAR by reversing transcriptional repression of the receptor by
certain endogenous steroids (see section 1.5.2).
CYP2B2 mini-genes containing a fragment of the CYP2B1/2 gene from -179 to +181 nucle-
otides conferred PB-responsiveness in cell-free transcription assays derived from freeze-thawed
rat liver nuclei (Rangarajan and Padmanaban, 1989). Western blot analysis detected an 85 to 95
kDa protein which exhibited greater binding to nuclear extracts derived from PB treated rats. A
DNase I footprint was obtained when comparing control and PB treated nuclear extracts with a
Sal I-Nco I fragment of the CYP2B1/2 DNA. A 32 bp region from -56 to -88 bp was protected
in this experiment (Rangarajan and Padmanaban, 1989). Work carried out by Padmanaban and
colleagues showed that transcriptional activation of the -179 to +181 bp CYP2B1/2 promoter
fragment targeted to the liver in a complex with asialoglycoprotein/polylysine was increased in
PB-treated livers (Prabhu et al., 1995). A segment of the CYP2B1/2 promoter (-69 to -98 bp)
Neill J. Horley Section 1.5.1
Page 52
which includes the Barbie box sequence was determined by competitive gel-shift assays to bind
PB responsive proteins. UV cross-link analysis detected proteins of 42 and 39 kDa, which bound
this 29 bp fragment. The evidence presented in these reports is consistent with a positive element
that mediates a PB response in the -69 to -98 bp region of the CYP2B gene (Upadhya, et al.,
1992). A negative element (-160 to -127 bp) of the CYP2B promoter has been found by DNase
I footprint and 5’ deletion analysis in freeze-thaw nuclei transcription studies. Proteins of 68 and
44 kDa that bind to this region were detected using UV cross-linking (Ram et al., 1995).
Studies by Prabhu et al., 1995 showed by affinity chromatography that a 26 to 28 kDa protein
extracted from nuclear extracts bound to the positive element present in the CYP2B promoter.
Direct binding and competition studies showed that this purified protein factor also bound to the
negative element present in the CYP2B promoter in the absence of PB. When this protein factor
was phosphorylated, binding favoured the positive element; in the dephosphorylated form
binding favoured the negative element. This indicated that regulation would involve
phosphorylation of the protein factor in response to PB, with subsequent dissociation from the
negative element and preferential binding to the positive element (Prabhu et al., 1995).
These in vitro experiments may indicate the existence of common components to the mechanism
of cytochrome P450 induction by barbiturates between genetically diverse organisms. However,
the structure-activity relationships of barbiturates are different in the mammalian and bacterial
systems, and the dose-response relationship is saturable in mammals, but not saturable to the
limits of the solubility of the barbiturates in bacteria (Waxman and Azaroff, 1992).
Using DNase I footprint analysis Shephard et al. (1994) have shown protein binding to multiple
elements in the CYP2B1/2 proximal promoter region from -150 to -368 bp. DNase I and
gel-shift assays also showed that two of these elements were positive elements (-31 to -72 bp and
-183 to -199 bp), binding rat liver nuclear proteins more strongly in PB-treated rats than the
Neill J. Horley Section 1.5.1
Page 53
corresponding controls (Shephard et al., 1994). Two more elements (-178 to -368 bp and -368
to -984 bp) were highlighted as being important in regulating basal transcriptional control of the
CYP2B2 gene (Shervington, 1998). However, the -178 to -368 bp region was also shown to be
important in regulating the induction of the CYP2B2 gene in response to PB.
Shephard et al. (1994) have also described three footprints which are very similar to protein bind-
ing sites reported by other workers (Hoffmann et al., 1992; Honkakoski et al., 1996; Luc et al.,
1996; Park and Kemper, 1996; Sommer et al., 1996). DNase I footprint analysis by these groups
showed that the region containing the Barbie box (-73 to -89 bp) played no part in the PB-
mediated regulation of the CYP2B genes. However, in some of these studies (Shephard et al.,
1994; Luc et al., 1996; Park and Kemper, 1996) there were regions of the CYP2B promoter that
possessed some hypersensitive sites which may have relevance in protein binding. Analysis of the
PB-responsive mouse Cyp2b10 proximal promoter using Cyp2b10-driven chloramphenicol
acetyl transferase (CAT) reporter genes constructs, revealed similar results to those outlined
above (Honkakoski et al., 1996). These transfection studies demonstrated the presence of a basal
transcription element between -64 and -34 bp and that elimination of the Barbie box region of
the Cyp2b10 construct did not affect the transcriptional activity of the reporter. The Barbie box
sequence present in the Cyp2b10 and the non-responsive Cyp2b9 gene is disrupted by a 42 bp
insertion. This insertion contains a 4 bp repeat at the beginning and end which means that the
Barbie box is largely conserved at the 5’ end of the insertion. DNase I protection of heparin-
agarose-enriched nuclear extracts revealed footprints at -45 to -64 bp, -154 to -180 bp, and -215
to -235 bp, which are in keeping with Shephard’s work. No difference in binding was observed
in these assays between the control and PB-induced mice. The regions resembling the Barbie
box sequence showed no binding of nuclear proteins and hence no protection in any of the
samples. Mutations of the Barbie box sequence present in HepG2 cells transfected with the
proximal regions of the rat CYP2B genes did not reduce transcriptional activation of the

Neill J. Horley Section 1.5.2
Page 54
reporters. Again no difference in binding between proteins from control and PB treated animals
was evident (Park and Kemper, 1996; Park et al., 1996).
Section 1.5.2 Distal PB-responsive promoter elements
The controversy surrounding studies concerning the proximal elements is not seen with the distal
elements of the 5’ flanking regions of the CYP2B2 gene. Here, there is a general consensus upon
the elements concerned with PB induction. The first evidence for the presence of PB-responsive
distal elements came from studies on the transcriptional regulation of the chicken CYP2H1 gene.
These studies demonstrated the presence of three strongly PB-induced CYP mRNAs of 3.5, 2.5,
and 2.2 kb. The 3.5 kb mRNA was shown to be the result of enhanced transcription of the
CYP2H1 gene. Chick embryo primary hepatocytes were transfected with a CYP2H1-CAT
construct containing -8.9 kb of the 5’ flanking region of the CYP2H1 gene, which gave a
two-fold induction when exposed to PB. Deletion analysis showed that the PB response was
diminished when the 5’ flanking region was reduced from -4.7 to -1.1 kb. A 4.8 kb section
(-5.9 to -1.1 kb) of the 5’ flanking region of the CYP2H1 gene was able to confer PB-
responsiveness upon a heterologous SV40 promoter. This PB-responsiveness was found to give
an 8 to 14 fold induction depending upon the position of the fragment. The orientation of the
fragment relative to the promoter did not affect the level of induction obtained, indicating that
the PB-responsive domain may posses the properties of an enhancer (Hahn et al., 1991; Dogra et
al., 1999). Hahn et al. (1991) also showed that this 4.8 kb domain when fused to its own proximal
promoter gave a weak inductive response when transfected into chick embryo hepatocytes. This
was thought by May and co-workers to be due to the high basal expression of the CYP2H1
proximal promoter sequence present in the in vitro system, compared to the endogenous in vivo
CYP2H1 expression (Dogra and May, 1997).
Transgenic technology provides another means of studying in vivo responses. Transgenic mice

Neill J. Horley Section 1.5.2
Page 55
incorporating a rat CYP2B2 transgene containing 800 bp of 5’ flanking region (including the
proximal elements discussed previously) have these transgenes expressed constitutively and at
high levels, although they were not shown to be PB-inducible. Transgenes containing 19 kb the
5’ flanking region of the CYP2B2 gene were shown to be PB-responsive indicating that
sequences far upstream (in excess of -800 bp) are necessary for PB induction (Ramsden et al.,
1993). These two transgenic lines were showed to display differences in PB induction and tissue
selective expression profiles. In the -800 bp construct, expression was not increased with PB
treatment. Expression of the construct was found to be highest in the kidney (twice that of the
liver) and liver. In the 19 kb construct, expression was shown to be PB-inducible and restricted
to the liver. Later work carried out by Ramsden et al. (1999) in transgenic mice, showed that
sequences between -2.5 and -17 kb of the 5’ flanking sequence of the rat CYP2B2 gene were
important in PB-induction (Ramsden et al., 1999). The -2271 to -2286 bp 5’ flanking region of
the rat CYP2B1/2 gene was footprinted with in vitro DNase I methods and showed a protected
pattern for both PB and control-treated rats centred around a NF-1 binding motif. Using
immunoblotting and electromobility shift assays this NF-1 site was shown to interact strongly
with a site at the centre of the PB response unit (PBRU discussed later) of CYP2B2. The
importance of this NF-1 element was examined by introducing mutations in the NF-1 sequence,
which had the effect of ablating this binding interaction with the CYP2B2 sequence.
Recent advances in the development of primary hepatocyte culture conditions as described in
Section 1.4 and the application of transient transfection technology has lead to a greater under-
standing of the PB regulation of CYP2B genes. A similar strategy to that of Hahn et al. (1991)
was carried out by Trottier et al. (1995) on primary rat hepatocytes using transfection protocols.
These authors showed by Northern blotting techniques that endogenous induction of CYP2B1/
2 genes by PB was detectable in primary cultures (Trottier et al., 1995). Transfection of the pri-
mary rat hepatocytes with 4.5 kb of the 5’flanking region of the CYP2B2 gene fused to a CAT

Neill J. Horley Section 1.5.2
Page 56
reporter gave a 5-fold induction after PB treatment. Deletion analysis of this 5’ flanking area
showed that deletions to -2.5 kb still gave a PB response which was abolished when further
deleted to -2.0 kb. Further deletion analysis showed that an internal deletion of 825 bp in the
region -2.5 to -1.7 kb also eliminated the PB response. However constructs with deleted
sequence from -0.2 to -1.7 kb or sections -1.6 to -2.1 kb and -2.3 to -4.5 kb showed only a slight
decrease in PB induction (3-4-fold). A 163 bp Sau3AI fragment from -2318 to -2155 bp coupled
to -1.7 kb of the 5’flanking sequence was still able to confer PB-inducibility (3.5-fold). This 163
bp sequence was designated the PB response element (PBRE). Tandem repeats of this 163 bp
area were found to double the fold induction measured. As with the CYP2H1 PBRU study, this
PBRE was able to confer PB-responsiveness on a heterologous thymidine kinase (TK) promoter
with approximately 3 to 9-fold induction being measured depending upon the position of the
fragment. The interaction of a NF-1 site present within the PBRE was also highlighted using
electromobility shift assays (EMSA), demonstrating that sequence-specific recognition sites for
proteins other than NF-1 were also present.
The recently isolated and sequenced mouse PB-inducible Cyp2b10 gene promoter was shown
to be inducible in a liver-specific manner using Northern blot analysis (Honkakoski et al., 1996).
The 1405 bp Cyp2b10 promoter sequence was shown to be 83% identical to the rat CYP2B2
gene. A primary mouse hepatocyte culture system was developed which supported endogenous
Cyp2b10 mRNA induction by PB. This culture system also supported a PB-inducible Cyp2b10-
driven CAT reporter gene. The findings of this paper and a more recent publication
(Honkakoski and Negishi, 1997) showed that successive 5’ deletion of the Cyp2b10 promoter
allowed the determination of a region that was PB-responsive. Constructs containing either -4.3
or -1.4 kb of the 5’ flanking sequence gave a 2 to 3-fold induction. Deletion to -0.7 kb abolished
the PB-induction and increased the basal CAT activity 10-fold. Another construct containing
-2.4 kb of the 5’ flanking sequence was shown to be 7.6-fold more inducible by PB. The
Neill J. Horley Section 1.5.2
Page 57
sequence between -2.397 to -1.850 kb which mediates PB-induction was found to contain
sequence which was 91% similar to the 163 bp region documented by Trottier et al. (1995).
DNase I studies using the 177 bp (-2426 to -2250 bp) fragment of the Cyp2b10 DNA identified
three weakly protected and three strongly protected nuclear protein binding regions. None of
these regions showed any difference in binding between PB or control treatments.
Deletion analysis of these six DNA regions (designated pA, pB, pB’, pC, pD, pE) indicated that
regions pC and pB’ have a major role in determining PB-inducibility. Fragments pB and pD
were shown to contribute to the Cyp2b10 enhancer activity by modulating the basal and
PB-induced activity levels. These elements involved in mediating PB-induction covered a region
of 132 bp (-2397 to -2265 bp) of the Cyp2b10 promoter region. As this Cyp2b10 DNA region
was composed of a multi-component enhancer the response unit was re-designated the
phenobarbital-responsive enhancer module (PBREM) in mouse (Honkakoski and Negishi,
1997) and the phenobarbital-responsive unit in rat (Stoltz et al., 1998; Liu et al., 1998).
The PBREM of the non-inducible mouse Cyp2b9 gene was analysed and found to be mutated
and non-functional with a 6 bp difference between itself and the Cyp2b10 DNA. This 33 bp
region of the Cyp2b10 PBREM sequence (-2332 to -2300 bp) contains a NF-1 consensus
sequence (TGGN7CCA) as in the CYP2B2 gene, and a putative nuclear receptor (NR1 and
NR2) binding motif (AGGTCA). Mutation of the NF-1 sequence to that of the Cyp2b9 gene
reduced the basal activity by 65% and abolished the PB-responsiveness of the element. This
further indicated the importance of this region for PB-inducibility (Honkakoski and Negishi,
1997). Mutation of the putative nuclear receptor (NR) binding motif eliminated PB induction
and increase basal activity by 2-fold. These mutations were also shown to alter the nuclear bind-
ing patterns in this region as assessed by DNase I footprinting and gel-shift assays. Mutation of
the NF-1 site reduced binding in this region leaving only the NR motif protected. By contrast,

Neill J. Horley Section 1.5.2
Page 58
mutation of the NR site did not affect the NF-1 binding but reduced the extent of protection at
the 5’ end of the pC element. The 33 bp core element described by Honkakoski and Negishi
(1997) displays only about 3-fold induction by PB. This indicated that there were sequences
present outside of this core 33 bp which were required for full enhancer activity of the PBREM.
Honkakoski et al. used transfection studies and deletion analysis of constructs containing the 132
bp of the 5’ flanking sequence of the Cyp2b10 gene to determine the position of the PBREM
(Honkakoski et al., 1998b). This study delimited the PBREM to a 51 bp enhancer element to
(-2339 to -2289 bp) and was shown to exhibit an 11-fold induction in response to PB. Sequence
analysis of this element showed that it was composed of two (NR1 and NR2) NR binding sites
(composed of imperfect direct repeats of AGGTCA-like half sites with a spacing of 4 nucleotides
(DR4)) which are found in the flanking region on each side of the NF-1 site. A CAR/RXR
heterodimer has been reported to bind to the NR1 site of the mouse Cyp2b10 (Honkakoski et
al., 1998a, c) as well as both NR1 and NR2 sites of the human CYP2B6 gene (Sueyoshi et al.,
1999). The binding of both CAR and RXR was shown to increase rapidly in PB-treated mice
and to occur before the increase in Cyp2b10 mRNA (Honkakoski et al., 1998b). The interaction
of CAR/RXR and the NF-1 region of the 5’ flanking sequence of the CYP2B6 and Cyp2b10
are discussed in more detail below.
The importance of the NF-1 site and surrounding nearby sequences in PB induction was further
demonstrated by in situ transfection assays in rat livers (Park et al., 1996; Liu et al., 1998), and by
transient transfection of primary rat hepatocytes (Trottier et al., 1995; Stoltz et al., 1998). The
in situ transfection protocol used by Park et al. (1996) consisted of the direct injection of
CYP2C1/CYP2B2-driven luciferase reporter genes into rat livers. It is thought that this
technique has the advantage of assaying the transcription of these chimeric genes in hepatocytes,
which are within the normal architecture of the liver. Luciferase reporter genes containing up to
-3.5 kb of the 5’flanking sequence of CYP2C1 and -1.4 kb of CYP2B1 showed minimal

Neill J. Horley Section 1.5.2
Page 59
expression of luciferase activity even after PB treatment (100mg/kg) in these studies. However,
the CYP2B2 sequence from -2318 to -2155 bp was shown to confer PB-responsiveness to both
the CYP2C1 and CYP2B1 promoter in these reporter genes. The insertion of one to three
copies of the PBRU in front of either CYP2C1 (-272 to +1 bp) or CYP2B1 (-110 to +1 bp)
gave 5-15 and 2.5-5-fold induction respectively when the rat livers were treated with PB.
Kemper and co-workers further dissected this element using the in situ transfection technique and
site-specific mutagenesis (Liu et al., 1998). In this study deletion analysis of the 5’ and 3’ ends of
single copies of the PBRU showed that an 88 bp fragment (-2258 to -2170 bp) was required for
a maximal response to PB. Deletion of the 5’ sequence to -2231 bp or of the 3’ sequence to
-2194 bp had little effect on PB-responsiveness. This data indicated that a minimal core sequence
centred about the NF-1 site of 37 bp (-2231 to -2194 bp) was required for PB-responsiveness.
However, a fragment containing three copies of the 37 bp core sequence alone could not confer
PB-responsiveness and required additional flanking regions. These results are consistent with
studies carried out by Honkakoski and Negishi (1997). The importance of the bipartite NF-1
site, which is central to the 88 bp sequence, was examined by mutation of the two bipartite sites
and the intervening region. PB-responsiveness was lost with mutations of the bipartite
recognition sites but was retained with the mutated intervening region. When these mutations
were tested as three copies, PB-responsiveness was found to be reduced not abolished, thus
indicating the importance of the NF-1 site as well as suggesting that other elements may be
required for PB induction. The interaction of the NF-1 site present within the PBRU was also
highlighted using the 37 bp fragment as a probe in gel-shift assays. Here multiple protein-DNA
complexes were observed which were eliminated using an excess of probe; a supershift in the
binding complex was observed when antiserum to NF-1 was added. When a specific NF-1
competitor was introduced, other complexes became evident, demonstrating that sequence-
specific recognition sites for proteins other than NF-1 were also present.

Neill J. Horley Section 1.5.2
Page 60
Linker scanning mutagenesis in which a Kpn I site substituted in 6 bp blocks between -2255 to
-2170 bp was employed to determine the importance of sequences flanking the NF-1 site in the
PBRU. These 12 mutants were fused as triple copies to the CYP2C1-driven luciferase reporter
and the PB-responsiveness of each construct assessed. The PB-response was not eliminated by
any of the mutants with only two (LS4 and LS5) showing a 50% reduction in activity. Basal
activity of the mutants within the region LS7 to LS9 was shown to increase in the untreated
animals suggesting this region may harbour some repressor effects (Liu et al., 1998). Once again
this data along with the NF-1 mutation data suggests the presence of a complex of factors which
function as a unit to confer PB-responsiveness in the CYP2B2 gene.
The CYP2B2 163 bp Sau3AI PBRU was further dissected by Anderson and co-workers using
transfection protocols and primary rat hepatocytes (Stoltz et al., 1998). In this study, 5’ deletion
to -2257 bp or 3’ deletions to -2208 bp of the PBRU were still able to confer PB-responsiveness.
These data indicated that a minimal core sequence centred about the NF-1 site of 51 bp (-2257
to -2208 bp) was required for PB-responsiveness. However a construct containing only this
51 bp element could not confer PB-responsiveness suggesting the need for sequences either
5’ of -2257 bp or 3’ of -2208 bp. An element between -2188 and -2172 bp when combined with
the central core was found to be PB-responsive. This accessory site was designated AF1. Other
potential regulatory motifs were also identified within the 163 bp Sau3AI PBRU. A perfect
hexamer half-site (AGGTCA at -2223 bp to -2218 bp, lower strand) for members of the orphan
nuclear receptor superfamily was found adjacent to the NF-1 site. This site in combination with
the NF-1 site was designated the HX-NF1 complex. There was also an everted repeat
arrangement present at -2282 to -2264 bp, (AGGTCA, designated ER-7) which possessed a
7 bp spacing. A glucocorticoid-binding site was also shown to be present at co-ordinates -2244
to -2226 bp on the upper strand and -2246 to 2228 bp on the lower strand.

Neill J. Horley Section 1.5.2
Page 61
DNase I footprint analysis using rat liver nuclear extracts showed protected regions very similar
to those found in the Cyp2b10 mouse homologue (Honkakoski and Negishi, 1997) on both the
upper (designated F0’, F1’, F2’ and F3’) and lower (designated F0, F1, F2, F3, F4) strands. The
F0 and F0’ footprints were shown to overlap with the AF1 site defined by transfection analysis.
The F1 and F1’ footprints extend beyond the HX-NF1 complex but the F1 footprint was
eliminated by an excess of NF1 competitor, indicating that the footprint is in part composed of
NF-1 protein. The F3/F4 and F3’ regions correspond to the two halves of the ER-7 sites and
both F3/F4 were competed by oligo HX. Hence these three footprints may be due to proteins
of the nuclear receptor superfamily binding to the ER-7 site. Site-directed mutagenesis of the
glucocorticoid-binding site lead to virtual abolition of the PB-response. This indicated that
protein binding in the region of the putative glucocorticoid response element may be required
to confer PB-responsiveness.
Mutation of the NF-1 site in either the distal portion (NF1m1) or both the distal and proximal
portions (NF1dm2) of the NF-1 site was seen only to reduce PB-responsiveness. The same
response was observed when mutations were introduced in the HX-NF1 complex (in either the
HX site (HXm), or both the HX and NF-1 site (Hxm-NFdm2)). These data imply that the two
components of the HX-NF1 complex play the role of accessory elements. In contrast,
Honkakoski and Negishi (1997) reported that mutation of the equivalent element (NR site) in
the mouse Cyp2b10 sequence abolished PB responsiveness and increased basal activity by 221%,
suggesting that the NR (HX) site acts as a repressor of PB responsiveness. The possibility that the
different attributes exhibited by the HX mutation used by Stoltz et al. (1998) was a consequence
of the mutation introduced, when compared to the mutant used by Honkakoski and Negishi
(1997), was examined by Stoltz and Anderson (1999). These workers introduced a new mutant
(Hxdm3) into the primary hepatocyte system, which consisted of the same mutations as those
used by Honkakoski and Negishi (1997). The effect of this new mutation was to reduce PB
Neill J. Horley Section 1.5.2
Page 62
responsiveness and decrease the basal level of expression. Hence the apparent discrepancy
between the roles of the HX (NR) site in the rat CYP2B2 and the Mouse Cyp2b10 genes is not
entirely clear, although these differences may be related to species differences, culture conditions
or transfection protocols.
Work carried out by Roe et al. (1996) has shown that binding of rat liver nuclear proteins to an
AP-1 site (TGACTCA) located at -1441 bp to -1447 bp of the 5’ flanking region of the CYP2B2
gene was increased after in vivo PB-treatment. This increase was shown to occur within 18 hours
of acute in vivo exposure to PB and persisted with chronic treatment for 5 days, thus indicating
the existence of other possible regulatory sites. Despite data presented by both Anderson’s and
Kemper’s groups which implicates the PBRU in the PB response, analysis of protein binding by
either gel-shift assays or in vitro DNase I footprinting assays shows that there is no change in
protein binding in this region after PB treatment. The importance of chromatin structure in the
activation of the rat CYP2B genes was investigated recently by Kim and Kemper (1997).
Comparisons between the effects of PB-treatment on protein binding to the PBRU (assessed by
in vitro DNase I footprinting) and binding to the native chromatin (assessed by in vivo DNase I
footprinting) were carried out. The results obtained with in vitro footprinting were similar to
those of other workers namely a protected region in the vicinity of the NF-1 site which was
unaffected by PB treatment. In contrast, in vivo footprinting to the native chromatin showed that
in control samples a 25 bp region centred on the NF-1 site was protected. After PB-treatment
the protected region was extended by 20 bp on each side to give a protected fragment of 60 bp
overall. These data indicate that PB-treatment alters chromatin structure, facilitating additional
binding of other proteins to the PBRU thus leading to transcriptional activation. The proposed
model for ligand-mediated transcriptional activation consists of the chromatin structure being
held in a closed state due to regulatory proteins which are bound either in an inactive
conformation or suppressed by repressor factors. PB is thought to cause the binding of a factor

Neill J. Horley Section 1.5.2
Page 63
that alters chromatin conformation so that NF-1 and other positively acting factors (coregulators)
can bind. This is followed by the recruitment of the basal transcription machinery. This proposed
model is consistent with the data presented which indicate no change in binding to the DNA
in vitro after PB treatment.
During the course of my studies, a greater understanding of the PB induction mechanism was
provided when Negishi and co-workers (Honkakoski et al., 1998c) discovered the involvement
of the orphan nuclear receptor CAR in the PB induction mechanism of the Cyp2b10 gene.
Their work showed that CAR binds as a heterodimer with RXRα to the nuclear receptor (NR)
sites present in the PB-responsive enhancer module PBREM. This element has also been
identified within the rat CYP2B2 gene and designated the PB-responsive element (PBRE)
(Trottier et al., 1995). RXR has been shown previously to heterodimerise with PXR (CYP3A)
and PPAR (CYP4A) (section 1.1.6.2 and 1.1.6.3), and as a dimer with CAR binds certain
retinoic acid response elements (RARE) (Baes et al., 1994; Choi et al., 1997), rather like the
CYP4A PPARα complex. The heterodimer formed between CAR and RXR and the
PBREM/PBRE is functional as determined by experiments utilising a CAR expression plasmid
and a PBRE-containing CAT reporter gene transfected into HepG2 cells. These experiments
showed that the presence of PB was not required to activate the PBRE reporter gene, although
gel mobility shift assays on PB-treated liver nuclear extracts showed a 10-fold increase in
CAR-RXR DNA-binding activity when compared to control treated mice (Honkakoski et al.,
1998c). This PB-independent CAR-stimulated PBRE-reporter gene activation may stem from
the fact that CAR (unlike most nuclear receptors) has been characterised as a constitutively active
receptor that does not require a ligand to bind in order for transactivation to occur (Choi et al.,
1997).
Work carried out by Forman et al 1998 (Forman et al., 1998) demonstrated that androstane

Neill J. Horley Section 1.5.2
Page 64
metabolites act as ligands for an isoform of CAR called CARβ. These ligands were shown to
inhibit CAR’s transcriptional activity by dissociating the CAR-RXR-DNA complex from
transcriptional co-activators like steroid receptor co-activator-1 (SRC-1). These androstane
ligands were found to be examples of natural inverse agonists that have the ability to reverse the
transcriptional activation by certain nuclear receptors (Klein et al., 1996). SRC-1 is a protein that
interacts with multiple nuclear receptors in a ligand-dependent manner and functions as a
co-activator of transcription (Onate et al., 1995). CAR, unlike most nuclear receptors, has been
shown to adopt an active conformation in the absence of ligand. It is thought that androstanes
bind directly to the CAR-RXR heterodimer in a manner which prevents the interaction
between CAR and SRC-1, maintaining the receptor in an inactive conformational state
(Forman et al., 1998). PB and PB-like inducers have been shown to abolish the inhibitory
binding of androstanes to CAR with the derepression of the receptor’s activity.
The proposed model for the interaction between CAR/RXR and the PBREM received strong
experimental support by Sueyoshi and coworkers in 1999. Here HepG2 cells were stably
transfected with CAR and the endogenous level of CYP2B6 mRNA expression determined
compared to untransfected cells (Sueyoshi et al., 1999). Once HepG2 cells were transfected with
CAR, the normally non-detectable endogenous levels of CYP2B6 mRNA were being expressed
at a level that was detectable. Androstenol treatment (4µM) was shown to repress the CYP2B6
mRNA expression in these cells. The expression of CYP2B6 mRNA was derepressed if
1,4-bis[2-(3,5-dichloropyridyloxy)]benzene (TCPOBOP) was added after androstenol
treatment. These results were mirrored in further experiments in which the cotransfection of
CAR and luciferase reporter genes containing either the Cyp2b10 PBREM sequence, or a
PBRE found 1.7 kb upstream of the human CYP2B6 gene, was carried out in HepG2 cells.
Here the addition of 5mM PB to androstenol-treated CAR transfected cells overcame the
suppressive effect of the androstenol, inducing reporter activity and endogenous CYP2B6

Neill J. Horley Section 1.5.2
Page 65
mRNA expression. CAR-dependent derepression of CYP2B6 expression and the
transactivation of PBRE-linked reporter genes is also apparent with other PB-like inducers
(Sueyoshi et al., 1999). The evidence presented in these experiments suggests that CAR’s
transcriptional activity is suppressed by the presence of inhibitory steroids. However, the
concentrations of androstenol used to inhibit CAR in these in vitro studies (0.4µM) exceeds that
reported in the circulation of man (Gower and Ruparelia, 1993), raising questions about how
CAR is repressed in the liver.

Neill J. Horley Section 1.6.1
Page 66
Section 1.6 Summary of introduction
Section 1.6.1 PB induction of cytochrome P450s
PB is a prototype of a group of structurally unrelated chemicals that share the property of
inducing many members of the cytochrome P450 subfamilies in particular the CYP2B, 2C and
3A. CYP2B1 and CYP2B2 are most highly induced by PB in the liver. When rats are
administered PB there is a rapid increase in the CYP P450 system, particularly CYP2B1 and 2B2
genes. When barbiturates are co-administered there is a possibility that the inductive effects of
the barbiturate may be altered due to drug-drug interactions. These effects may have a major
impact on drug metabolism and pharmacokinetics. In humans, barbiturates can be used for
treatment of pain, insomnia, anxiety and epilepsy. Their usual high prescription dose taken over
long time periods increases the risk of any resultant toxic effects within the metabolic system.
Chronic effects may include tumour promotion, or drug-drug interactions.
Section 1.6.2 CYP2B expression and transcriptional regulation
CYP2B2 protein is present at a very low constitutive level in the liver whereas CYP2B1 is 5-10
times lower in comparison. However, when induced by PB these levels increase to 20 and >100
fold above constitutive levels respectively. The expression and PB-induction of both CYP2B1
and CYP2B2 are subject to gender, tissue and developmental regulation. It has been known for
a long time that PB induces CYP2B1 and CYP2B2 mRNAs by increasing transcription of their
genes, although the details of the molecular mechanisms by which PB-mediates transcriptional
activation are not well understood. Progress towards understanding the molecular mechanisms
underlying the PB induction of the CYP2B genes has been made with the development of
in vitro culture systems which support PB induction of the endogenous CYP2B1/2 genes.
Extensive studies have been carried out on the 5’ flanking regions of both the rat CYP2B2 and
mouse Cyp2b10 genes to try and identify any cis-acting elements and trans-acting factors which
may be involved in PB induction. A PB-responsive enhancer element (PBRU) composed of a

Neill J. Horley Section 1.6.3
Page 67
163 bp fragment (-2318 to -2155 bp) was found to be present in the distal region of the CYP2B2
promoter in primary rat hepatocytes. A corresponding element (PREM) composed of a 177 bp
fragment (-2426 to -2250 bp) was found in the mouse Cyp2b10 gene. The enhancer activity of
both of these elements was subsequently delimited to a core 51 bp element. The nuclear orphan
receptor heterodimer CAR/RXR has also been identified as a transactivator of the PBREM in
the mouse Cyp2b10 gene.
Section 1.6.3 Aims of the project
An aim of this thesis was to develop an in vitro primary hepatocyte culture system that would
support PB-mediated induction of a CYP2B2-driven reporter gene. It was hoped that this
hepatocyte culture system in conjunction with reporter gene technology could be utilised to
elucidate the mechanism(s) which regulate PB-induced gene transcription of CYP2B2. This
system could then also be used to develop a trans-activation assay for high-throughput drug
screening to identify potential inducers of the CYP2B2 gene.
An in vitro primary hepatocyte culture system was set up in connection with a sensitive and
specific RNAse protection assay to demonstrate that CYP2B2 RNA was highly inducible by PB
in this system. The sequence of the 5’ flanking region of the CYP2B2 promoter was determined
by automated sequencing; the position of the putative PBREM was then defined using this
sequence. This PBREM was subcloned into a number of luciferase and CAT reporter genes. A
suitable transfection protocol for introducing the CYP2B2-driven reporter constructs into the
primary hepatocytes was developed in this thesis. After the transfection protocol had been
optimised the effects of different CYP2B2 inducers were assessed. Finally the initial stages of the
subcloning and analysis of a CAR containing construct were carried out to ascertain its
interaction with the CYP2B2 PBREM.
Neill J. Horley
Page 68
Chapter 2 Materials and Methods
Section 2.1 Materials
All reagents were obtained at AnalaR grade purity or greater. Ammonium sulphate, ethanol,
glycerol, β-mercaptoethanol and sodium potassium tartate were from BDH. Agarose,
ammonium acetate, chloramphenical, BSA, DTT, DMSO, EDTA, ferrous cyanide, ferric
cyanide, hydrogen peroxide, isoamylalcohol, imidazole, PMSF, Sodium phenobarbital, TCA,
TEMED, tetracycline and mixed xylenes were all obtained from Sigma. Xylene cyanol FF and
the Immun-Blot assay kit were obtained from Bio-Rad. Bacto-agar, Bacto-typtone and
Bacto-yeast extract were obtained from Difco. All restriction enzymes were obtained from either
NBL or Promega. Sequagel solutions were manufactured by National Diagnostics and obtained
from Flowgen. X-ray film was manufactured by Fuji and obtained from Amersham. X-ray film
developer and fixer were obtained from Ilford. Alkaline phosphatase, proteinase K, 1Kb and
1Kb+ DNA marker ladder were obtianed from Gibco-BRL. 3MM paper and GF/A glass fibre
filters were obtained from Whatman. Ammonium persulphate, ampillicin, bromophenol blue,
glycine, guanidine hydrochloride, SDS, Tris-base, Triton-X100, urea were all obtained from
ICN Flow. IPTG was supplied by NBL. Pharmacia supplied RNAguard. Promega provided all
luciferase transfection kits and commercial plasmids. Stratagene provided E.coli. Strain XL1-blue.
Other chemicals of AnalaR grade were obtained from Sigma if not stated in the text.
Oligonucleotides were synthesised by John Keyte of the Biopolymer Synthesis and Analysis Unit,
Department of Biochemistry, University of Nottingham. Ultra high purity (UHP) grade water
(> 13 Mohms/cm3) was produced using a Purite Select Bio system. The following radioactive
isotopes were obtained from Amersham at the stated specific activities:
[D-threo-[dichloroacetyl-1-14C] Chloramphenicol, 54miCi/mmol, [α-32P]-CTP (3000Ci/
mmol) and [α-32P]-dCTP (6-800Ci/mmol).

Neill J. Horley Section 2.3.1
Page 69
Section 2.2 Treatment of animals
Adult male Wistar rats (180-220g, obtained from Harlan UK) were kept in a standard 12 hours
dark/light cycle and were provided with food and water ad libitum. Groups of two Wistar rats
were dosed daily by inter-peritoneal injection with phenobarbital in saline (80mg/kg body
weight), for 4 consecutive days. Control animals received vehicle alone (0.5ml saline).
Twenty-four hours after the last injection, animals were sacrificed by exsanguination under
terminal anaesthesia with diethyl ether. The livers were removed and immediately frozen in
liquid nitrogen and stored at -70oC. Naive rats were sacrificed and the livers perfused as described
in section 2.6.1 and 2.6.2.
Section 2.3 Methods
Section 2.3.1 Bacterial growth media and culture conditions
Luria-Bertanti (LB) broth is the main culture medium used in genetic manipulation experiments
with LB agar being used to culture single colonies. LB broth (10g/L Bacto-tryptone, 5g/L
Bacto-yeast extract and 10g/L NaCl) was made using ultra high purity (UHP) water and
autoclaved for an hour at 15 lb./in2. LB broth was allowed to cool to room temperature before
use. LB agar plates were made by adding a further 15g Bacto-agar to a litre of LB broth and
autoclaved as for LB broth. Autoclaved LB agar was allowed to cool before the appropriate
antibiotics were added and then poured into Petri dishes. Antibiotics were used at the following
final concentrations: tetracycline at 20µg/ml, ampicillin at 50µg/ml. When blue white selection
colour screening (with vectors capable of α-complementation) was utilised, 30µl of a 20mg/ml
IPTG solution and 30µl of a 20mg/ml 5-bromo-4-chloro-3-indolyl-β−D-galactoside (X-Gal)
solution in DMF was added to the plate and spread evenly over the surface.

Neill J. Horley Section 2.3.2
Page 70
Section 2.3.2 Eschericha coli strains and their manipulation
E. coli strain XL-1 Blue (recA1 endA1 gyrA96 thi-1 hsdR17 supE44 relA1 lac [F’ proAB lacq
Z∆M15 Tn10 (TetR)] was used for subcloning most expression vectors. DH5α (φ80δlacZ∆M15
recA1 endA1 gyrA96 thi-1 hsdR17 (rk-,mk+) supE44 relA1 deoR δ(lacZYA-argFv169), F-,
λ-) cells were also used. Glycerol stocks (made by placing 10% glycerol into the bacterial culture
stock) were used for the long-term storage of bacteria. Typically a 5ml culture of inoculated
media was incubated overnight at 37oC, then centrifuged at 16000g for one minute and the cells
resuspended in LB broth containing a 15% solution of glycerol. The glycerol stock of the bacteria
could be stored at -20oC for 3 months or -80oC indefinitely. In order to culture a glycerol stock
of a bacterial strain, a 1-2µl aliquot of the glycerol stock was taken up onto a sterile inoculation
loop and streaked onto a LB agar plate containing the appropriate antibiotics. The streaked plate
was inverted and incubated at 37oC overnight. Once colonies of a suitable size were obtained
the plate was stored at 4oC for a maximum of a month. A single colony could then be ‘picked’
from the plate and used to inoculate a liquid culture, which was then placed in a shaking
incubator at 37oC until the desired OD600 was obtained.
Section 2.3.3 Preparation of CaCl2 competent XL-1 blue E.coli
A single colony of XL-1 Blue E.Coli from a LB/tetracycline plate was picked and inoculated into
a 5ml LB/tetracycline broth culture. The culture was grown overnight in a shaking incubator at
37oC until a thick liquid culture was obtained. A 500ml culture of LB/tetracycline medium was
inoculated with 1ml of the fresh overnight culture of bacteria and grown until an OD600 of 0.6-
0.8 was reached. The cultures were placed on ice for 15 minutes and then centrifuged at 4000g
for 15 minutes at 4oC. The supernatant was discarded and the pellet gently resuspended in 50ml
of ice cold sterile 0.1M CaCl2. Cells were again centrifuged and resuspended as before. Cells
were then pelleted once more, the supernatant discarded and the final pellet resuspended in 2ml
of sterile 0.1M CaCl2, 10% glycerol. Cells were placed in 200µl aliquots and stored at -80oC.

Neill J. Horley Section 2.3.4
Page 71
Section 2.3.4 Transformation of CaCl2 competent E.coli
A 100µl aliquot of cells was thawed on ice. To these cells 10-50ng of DNA or 5µl of a ligation
reaction was added and allowed to incubate on ice for 10 minutes. The DNA/cell mixture was
then heat shocked at 42oC for 90 seconds and immediately placed on ice for 2 minutes. The cells
were then incubated at 37oC for an hour in 1ml of LB broth, 50-100µl of the transformed cells
were then plated out onto 10cm LB agar petri dishes containing the corresponding selection
antibiotics and incubated overnight at 37oC.
Section 2.3.5 Preparation of electro-competent XL-1 blue E.coli
Colonies were treated as in section 2.3.3, except that after the first centrifugation step the pelleted
cells were resuspended in 50ml of ice cold sterile UHP water. Cells were then pelleted by
centrifugation at 4000g for 15 minutes at 4oC and resuspended in ice cold sterile UHP water a
further 5 times. Cells were finally resuspended in 2ml of sterile UHP water, 20% glycerol and
stored as 200µl aliquots at -80oC.
Section 2.3.6 Electro-transformation of XL-1 blue E.coli
This method of transforming bacteria is far more efficient than that of calcium competent
transformation but is very susceptible to high salt concentrations, which may affect the
transformation process. An aliquot of XL-1 Blue electro-competent cells was thawed and placed
on ice for 5 minutes along with the electroporation cuvettes and cuvette holder. To these cells
10-50ng of DNA or 5µl of a ligation reaction was added and allowed to incubate on ice for a
further 10 minutes. The mixture of DNA and cells were placed in a Biorad Genepulser cuvette
(1mm path length) and electroporated with a voltage of 1.8 kV using the Biorad electroporator.
The cells were immediately resuspended in 1ml of LB broth and allowed to recover at 37oC for
an hour. The transformed cells were selected by growing the electroporated bacteria on LB agar
plates, containing the appropriate selection antibiotics.

Neill J. Horley Section 2.4.1
Page 72
Section 2.4 Manipulation of DNA
Section 2.4.1 Phenol:chloroform extraction of nucleic acids
Tris buffered phenol (pH 8.0) is prepared as in 2.7.3 and this solution was mixed in a 1:1 (v:v)
ratio with chloroform. This solution was then used to remove protein contamination from
nucleic acid samples by a sequential phenol:chloroform extraction. One volume of the
phenol:chloroform solution was added to the nucleic acid sample and the mixture vortexed
thoroughly. The organic and aqueous phases were separated by centrifugation at 15000g for 5
minutes using a benchtop centrifuge. The aqueous phase was removed and retained.
Section 2.4.2 Ethanol precipitation of nucleic acids
Ethanol precipitation was utilised to reclaim nucleic acids samples from small liquid volumes.
Two volumes of absolute ethanol and 1/4 volume of 3M sodium acetate pH 5.2 (or 1/10th
volume of 7M NH4SO4) was added to the DNA solution. The solution was vortexed and then
placed on ice or -20oC for 25 minutes to precipitate the nucleic acid. The chilled solution was
then centrifuged at room temperature for 25 minutes at 14000g. The pellet formed was then
washed in 200-500µl of 70% ethanol and re-spun as before for a further 5 minutes. The pellet
was allowed to air dry to remove trace quantities of ethanol and the pellet resuspended in its
respective liquid medum. One volume of 100% isopropanol may also be used instead of the
ethanol to precipitate nucleic acids.
Section 2.4.3 Isolation of plasmid DNA by the alkaline lysis method
Clones were used to inoculate 5ml of LB broth containing the appropriate antibiotics and incu-
bated at 37oC overnight. Plasmid DNA was extracted using a modified version of the Birnboim
(1983) alkaline lysis miniprep method. A 1.5ml aliquot of this overnight culture was taken and
the cells harvested into a 1.5ml eppendorf tube by centrifugation at 12000g for 1minute. The
resultant pellet was then completely resuspended in 100µl of solution I (50mM glucose, 25mM
Tris-HCl pH 8.0, 10mM EDTA and RNAse A 100µg/ml). To this solution, 200µl of freshly

Neill J. Horley Section 2.4.4
Page 73
prepared solution II (200mM NaOH, 1% SDS) was added and gently mixed by inversion of the
tube. This mixture was allowed to stand for 5 minutes before 150µl of solution III (5M potassium
acetate, 11.5% glacial acetic acid) was added. The sample was mixed immediately by inversion
of the tube and the bacterial lysate was allowed to precipitate on ice for 10 minutes. The viscous
precipitate was removed by centrifugation at 15000g for 10 minutes and the supernatant
transferred to a fresh tube. Samples were phenol/chloroform extracted (section 2.4.1) and
ethanol precipitated (section 2.4.2). Pellets were washed in 70% ethanol and allowed to air dry.
The pelleted plasmid DNA was resuspended in 20-30µl of UHP water and stored at -20oC until
required.
Section 2.4.4 Purification of plasmid DNA using the Qiagen mini-prep columns
Small scale sequencing grade plasmid DNA was prepared using a Qiagen-tip 20 plasmid mini-
kit. In this protocol 3ml of an overnight culture was pelleted by centrifugation at 15000g for one
minute and resuspended in 0.3ml of buffer P1 (50mM Tris-HCl pH 8.0, 10mM EDTA and
100µg/ml RNAse A). To this solution 0.3ml of buffer P2 (200mM NaOH, 1% SDS) was added,
the tube mixed by inversion and then incubated at room temperature for 5 minutes. 0.3ml of
chilled buffer P3 (3M-potassium acetate pH 5.5) was then added, the tube mixed and incubated
on ice for 10 minutes. The sample was then centrifuged for 15 minutes at 15000g. Meanwhile a
Qiagen-tip 20 was equilibrated with 1ml of buffer QBT (750mM NaCl, 50mM MOPS pH 7.0,
15% ethanol and 0.15% Triton X-100) which was allowed to drain though the column. The su-
pernatant resulting from the centrifugation step was then immediately placed onto the Qiagen-
Tip 20 column and allowed to drain through. The column was then washed 4 times with 1ml
of buffer QC (1.0M NaCl, 50mM MOPS pH 7.0 and 15% ethanol). The plasmid DNA was then
eluted from the column using 0.8ml of buffer QF (1.25M NaCl, 50mM Tris-HCl pH 8.5 and
15% ethanol) and collected into a fresh eppendorf. The collected fraction was then precipitated
in 0.7 volumes of isopropanol and allowed to stand at room temperature for 20 minutes. The

Neill J. Horley Section 2.4.5
Page 74
solution was then centrifuged at 15000g for 30 minutes, washed in ice cold 70% ethanol and
re-pelleted. Once air-dried, the pellet was resuspended in 25µl of autoclaved UHP water and
was of a quality that could then be used for sequence analysis using an ABI 373A fluorescent
sequencer.
Section 2.4.5 Plasmid purification using Qiagen-tip 500 maxi-prep column
A Qiagen-tip column is utilised to extract sequence grade plasmid DNA from bacterial cultures.
Here a large 500ml bacterial culture was used and a similar protocol to that of section 2.4.4 was
carried out, according to the manufacture’s instructions. The final pellet was resuspended in
250µl of autoclaved UHP water and stored at -20oC for future use.
Section 2.4.6 Plasmid purification by isopycnic density gradient centrifugation
The caesium chloride-ethidium bromide (CsCl/EtBr) centrifugation method was used to
prepare plasmids that were endotoxin-free as described by Weeks et al. (1986). All plasmids
prepared by this method were first pre-treated using a Qiagen-tip 500 maxi-prep column as
described in section 2.4.5. The Qiagen prepared plasmids were then split into 100µg aliquots,
which were mixed into 1.5ml of a 1.65g/ml CsCl solution and centrifuged at 8000rpm (3000g)
for 5 minutes at room temperature. A furry scum may be present at the top of the CsCl solution
after centrifugation, consisting of complexes formed between the EtBr and bacterial proteins.
The DNA band present in the lower section of the solution obtained from the first spin was
extracted and mixed with 1.5ml of a 1.63g/ml CsCl solution containing 450µg of ethidium
bromide. The samples were mixed thoroughly and loaded into 2.1ml polycarbonate tubes which
were balanced to within a mg of each other. The tubes were then loaded into the Optima TLA
120.2 ultracentrifuge rotor and centrifuged at 80,000rpm (22000g) for 6 hours at 20oC. The
speed at which this solution is centrifuged and density of the CsCl solution is critical and
precipitation curves for CsCl must be consulted before any centrifugation is carried out. After
the first spin, the DNA bands were located using an UV light source and removed using an 18

Neill J. Horley Section 2.4.7
Page 75
gauge needle connected to a 1.0 ml syringe. The DNA was removed in the smallest volume
possible and subjected to a further centrifugation step at 80,000rpm (22000g) for 6 hours at 20oC.
The DNA was further purified as described in section 2.4.6.1.
Section 2.4.6.1 Removal of EtBr and CsCl from DNA
The DNA solution from the CsCl/EtBr centrifugation step was treated with an equal volume of
water-saturated 1-butanol. Water-saturated 1-butanol is prepared by mixing 1-butanol with
water in a 1:1 ratio, giving rise to a biphasic medium of which the top phase is comprised of
water-saturated 1-butanol. The two layers formed by the CsCl/EtBr DNA preparation and the
water-saturated 1-butanol solution are mixed by vortexing for 30 seconds and then centrifuged
at 1500rpm for 3 minutes at room temperature in a benchtop centrifuge. After centrifugation the
solution consists of a red upper organic phase and a lower ‘pink tinge’ coloured aqueous phase.
The lower phase was removed and extraction of EtBr from the solution was carried out a further
6-10 times using both water-saturated 1-butanol and centrifugation. The CsCl was removed
from the DNA solution by dialysis for 24-48 hours against several changes of water. It may also
be removed by diluting with 3 volumes of water and precipitating the DNA with 2 volumes of
ethanol (final volume is equal to 6 times the original volume of the undiluted aqueous phase) for
15 minutes at 4oC. This was then followed by centrifugation at 10000g for 15 minutes at 4oC.
The precipitated DNA was then dissolved in an appropriate amount of water.
Section 2.4.7 Restriction enzyme digest of plasmid DNA
Typically a restriction digest would take place in a reaction volume of 30µl in an eppendorf at
37oC for 1-2 hours. The digest would contain 5-10µl of plasmid DNA mixed with 3µl of the
appropriate 10X restriction enzyme buffer and diluted to the final volume with water. Normally
about 4U/µg DNA of restriction enzyme would completely digest the plasmid DNA. If non-
compatible double digests were to be carried out; the enzyme with the lowest salt concentration
requirement was carried out first; or alternatively the DNA could be ethanol precipitated

Neill J. Horley Section 2.4.8
Page 76
between digests. The reaction was normally terminated by either ethanol precipitation of the
sample or by simply adding 10X loading buffer. The following restriction digest buffers were
used with the appropriate manufacture’s restriction enzyme. Buffer 5 (NBL) contained, 10mM
Tris-HCl (pH 7.8), 50mM NaCl, 10mM MgCl2 and 1mM DTT. Buffer 6 (NBL) contained,
50mM Tris-HCl (pH 7.8), 100mM NaCl, 10mM MgCl2 and 1mM DTT. Buffer A (Boehringer
Mannheim) contained, 33mM Tris-OAc (pH 7.9), 10mM Mg(OAc)2, 66mM KOAc and
0.5mM DTT. Buffer B (Boehringer Mannheim) contained, 10mM Tris-HCl (pH 8.0), 5mM
MgCl2, 100mM NaCl and 1mM 2-Mercaptoethanol. Multicore-Buffer (1x) contained, 25mM
Tris-OAc (pH 7.8), 100mM KOAc, 10mM Mg(OAc)2 and 1mM DTT.
Section 2.4.8 Agarose gel electrophoresis
DNA and RNA was separated by agarose gel electrophoresis. DNA/RNA agarose electrophore-
sis was performed using a submarine Pharmacia GNA-100 gel electrophoresis kit or a Stratagene
gel kit. Agarose was dissolved in the appropriate amount of 1X TBE (45mM Tris-HCl, 44mM
Boric acid and 2mM EDTA (pH 8.0)) to give a 0.7-2.0% (w/v) gel. A 1X TAE (40mM Tris-
HCl, 1mM EDTA and 5.71% glacial acetic acid) agarose gel was used for the gel excision of
DNA fragments. Agarose was dissolved into the 1X TBE/TAE by microwave heating of the so-
lution. The dissolved agarose solution is allowed to cool to about 55oC before the addition of
ethidium bromide (10mg/ml stock) to give a final concentration of 0.5µg/ml. If the gel is being
poured for RNA samples, then the 1X TBE or 1X TAE was made using DEPC-treated water
and 0.1% SDS (w/v) was included in the gel mixture. The agarose mix was then poured into the
appropriate gel casting mould containing the well forming comb and allowed to set. After the
gel had solidified it was placed in the electrophoresis tank and immersed in the appropriate
running buffer (1X TAE, 1X TBE). DNA samples were prepared in a 10% solution of 10X
loading buffers (30% glycerol, 0.25% Bromophenol Blue and 0.25% Xylene Cyanol FF) and
loaded into the wells formed by the comb. The samples were run at a constant voltage of
Neill J. Horley Section 2.4.9
Page 77
6V/cm until the desired resolution of DNA was formed. DNA bands were visualised by
illumination with an UV trans-illuminator and photographed.
Section 2.4.9 Acrylamide gel electrophoresis
Acrylamide electrophoresis was carried out so that DNA sequences of between 6-2000 bp could
be separated. These gels were made so that the final percentage of acrylamide was between 5 and
20% depending upon the size resolution required. Acrylamide electrophoresis was performed
using a mini Biorad Protean II vertical electrophoresis kit. A 15ml, 12% acrylamide gel was made
using 3ml of 5X TBE, 6ml 30% acrylamide, 5.9ml UHP water. The acrylamide was polymerised
by the addition of 6µl of TEMED and 105µl of 10% ammonium persulphate and mixed. The
acrylamide solution was then pipetted into the gel casting kit according to the manufacture’s
instructions using 10-well combs and allowed to polymerise for at least an hour.
The wells of the gel were flushed out using 1X TBE before loading the DNA samples. The
samples were run at a constant voltage of 15V/cm until the desired resolution of DNA banding
patterns were formed. After electrophoresis the gels were stained with ethidium bromide
(10mg/ml stock) in 100ml of UHP water to give a concentration of 0.5µg/ml for 10 minutes.
The gel was rinsed in 50ml of UHP water for 5 minutes and DNA bands were visualised by
illumination with an UV trans-illuminator and photographed.
Section 2.4.10 Purification of DNA from an agarose gel
Plasmid DNA that has been restriction digested can be purified using the GENECLEAN II kit
(BIO 101 inc.). This system works only on 1X TAE gels; if a 1X TBE gel has been used then
the fragment may only be extracted by using a TBE modified protocol (see manufactures instruc-
tions). The kit contains a specially formulated silica matrix (glassmilk) to which DNA binds with-
out contaminants. Restriction digested DNA was resolved on a 1X TAE agarose gel until the
band of interest could be visualised using an UV trans-illuminator. This band was then excised

Neill J. Horley Section 2.4.11
Page 78
using a clean scalpel and placed in an eppendorf and weighed. This excised gel fragment was then
treated with 3 volumes of NaI solution (6.0M). The tube was then incubated at 55oC with
periodic mixing for 5 minutes or until the gel fragment was dissolved. To this solution 5µl of
glassmilk solution was added and mixed. The solution was then incubated at room temperature
with periodic mixing for 10 minutes. This was to allow the DNA to bind to the silica matrix.
The glassmilk-DNA complex was then pelleted by centrifugation at 15000 rpm for 10-15
seconds. The supernatant was then removed and the glassmilk pellet resuspended in 500µl of ice
cold New Wash Buffer (50% 20mM Tris-HCl pH 7.2, 0.2M NaCl, 2mM EDTA and 50%
ethanol) and centrifuged again. This step was repeated a further 2 times before the final pellet was
resuspended in 15µl of UHP water. Incubation of the glassmilk solution at 55oC for 2-3 minutes
will elute the DNA from the glassmilk complex. The DNA is extracted from the glassmilk
solution by centrifugation at 15000rpm for 15 seconds. The purified DNA solution is then
transferred to a clean eppendorf where further DNA manipulations were carried out.
Section 2.4.11 Phosphatase treatment of DNA
Shrimp alkaline phosphatase (SAP) was used to remove the 5’-terminal phosphate from nucleic
acids. Linearised cloning vectors can be prevented from recircularising by dephosphorylation
with alkaline phosphatase. To the 15µl of GENECLEAN sample, 1µl of 10X shrimp alkaline
phosphatase buffer [United States Biochemical-USB] (200mM Tris-HCl (pH 8.0), 100mM
MgCl2) and 1U of SAP (USB) were added and the reaction diluted with UHP water to give a
final volume of 20µl. The reaction was incubated at 37oC for 30 minutes and heat inactivated
by incubation at 65oC for 15 minutes. The final solution can now be used for further
manipulations. Alternatively, the solution can be cleaned up still further by a phenol:chloroform
extraction (section 2.4.1), followed by an ethanol precipitation (section 2.4.2) with the pellet
being taken up in a final volume of 15ul of UHP water.

Neill J. Horley Section 2.4.12
Page 79
Section 2.4.12 Ligation of DNA
During ligation the formation of a phosphodiester bond between the 5’-phosphoryl group and
the 3’-hydroxyl group of two double stranded DNA fragments occurs. This reaction is catalysed
by the presence of T4 ligase, which requires ATP to be present. A balance between the ratio of
vector DNA to insert DNA must be found when performing a ligation reaction. The simplest
ligation is formed when a 1:1 ratio of vector DNA to insert DNA is formed. Here the reaction
volume takes place in 10µl and consists of 4µl of vector DNA, 4µl of insert DNA, 1µl of T4
ligase (1U/ul) and 1µl 5x T4 ligase buffer (250mM Tris-HCl (pH 7.6), 50mM MgCl2, 5mM
ATP, 5mM DTT and 25% (w/v) polyethylene glycol-8000) made up with UHP water. The
tube was vortexed and then centrifuged for 10 seconds. The solution was incubated overnight at
4oC. This solution can then either be used directly for transforming calcium competent cells, or
ethanol precipitated and resuspended in 10µl UHP water if using electro-competent cells.
Section 2.4.13 Automated fluorescent sequencing
DNA was purified using a Qiagen mini-prep kit (see section 2.4.4) before sequencing could be
carried out. J. Keyte, Biochemistry Dept. Nottingham University performed automated
sequencing, using the Perkin Elmer ABI 373A Fluorescent Sequencer and an ABI Cycle
sequencing Kit. DNA was sequenced on both strands, unless otherwise stated. Sequencing was
performed using the forward and reverse primers, T7 and SP6 as well as custom made primers
for oligonucleotide directed sequencing.
Section 2.4.14 Sequence analysis
Raw DNA sequences were inspected and edited using the GCG (University of Wisconsin)
sequence analysis software and Straden software suites (Bonfield et al., 1995). The software
programs used were TED, SEQED, BESTFIT, GELASSEMBLE and MAP (Wisconsin package
Version 9.0). Putative protein factor binding sites were searched for using WWW based software
packages (at their respective default values) such as Transcription Element Search Software

Neill J. Horley Section 2.4.14
Page 80
(TESS) and the TRANSFAC database (Heinemeyer et al., 1990).
Section 2.5 Polymerase chain reaction (PCR)
Short segments of DNA were amplified using PCR primers. PCR primers were designed so that
a high sequence identity to the target DNA was achieved. Base-pair mismatches were incorpo-
rated into the primers to generate particular restriction enzyme sites. These sites could be used
subsequently for subcloning purposes. PCR was performed using 5µl of 10X KlenTaq PCR
reaction buffer (400mM Tricine-KOH (pH 9.2 at 25oC), 150mM KOAc, 35mM Mg(OAc)2,
750µg/ml bovine serum albumin), 1µl 5’-Primer (~70pmol), 1µl 3’-Prime (~70pmol), 4µl
dNTP mix (1.25mM), 1.5µl 163bp-Pluc DNA (1ng), 0.5µl KlenTaq polymerase and diluted to
50µl with UHP water. The PCR reaction was overlaid with 50µl of mineral oil to prevent the
contents from evaporating. PCR was performed on a Perkin Elmer DNA Thermal Cycler 480
for 30 cycles at 1.0 minute denaturing at 95oC, 1.0 minute annealing at 55-70oC (depending
upon the primers used) and 1.0-minute polymerisation at 72oC. The final cycle consisted of an
extension cycle of 5 minutes at the appropiate annealing temperature and 10 minutes at 72oC.
5µl of the PCR products were analysed on a 1.2% agarose/TBE gel.
Primer names and DNA sequences (5’-3’):-
Hind5 5’ GAG ATG AAG CTT GCA GAT CGT GGA CAC AAC CTT 3’
Hind3 5’ CTA GCC AAG CTT CGA GAT CAC CCA GCC TGG CAG 3’
Conditions:-
95oC for 1 minute (1)
55oC for 1 minute (2)

Neill J. Horley Section 2.5.1
Page 81
72oC for 1 minute (3)
Steps 1-3 are repeated for 30 cycles
55oC for an additional 5 minutes
72oC for an additional 10 minutes.
Section 2.5.1 Purification of PCR products
PCR products were purified using the Qiagen Qiaquick PCR spin columns. 250µl of buffer PB
was added to the PCR reaction. This was then placed into a Qiagen Qiaquick PCR spin column
which was placed inside an eppendorf tube and centrifuged at 14000rpm for one minute in a
Heraeus benchtop centrifuge. The flow through was discarded and 750µl of buffer PE was added
to the spin column and centrifuged at 14000rpm for one minute in a benchtop centrifuge. The
flow through was discarded and the centrifugation step repeated to remove traces of residual
buffer PE. The column was transferred to a fresh eppendorf tube and 50µl of UHP water was
added to the column. The centrifugation step was repeated once more to elute the bound DNA
from the column. The PCR reaction products could now be used for other DNA manipulation
protocols.
Section 2.5.2 First strand cDNA synthesis
Mouse liver total RNA (a kind gift from M. Choudhury) was diluted to give a stock solution of
1µg/ml. To a microcentrifuge tube 5, 2.5 and 1µg of mouse total RNA were added along with
500ng of Oligo-dT (12-18) primer and each tube made up to 12µl with DEPC-treated water.
Each tube was heated to 70oC for 10 minutes and then snap cooled on ice. The contents of the
tubes were collected by pulse centrifugation and 4µl of 5X First strand buffer (250mM Tris-HCl
(pH 8.3), 375mM KCl, 15mM MgCl2 and 100mM dithiothreitol (DTT)), 2µl of 0.1M DTT,
and 1µl of 10mM dNTP mix (10mM each dATP, dCTP, dGTP, dTTP at neutral pH) added.

Neill J. Horley Section 2.5.3
Page 82
To the 2.5µg total RNA tube 1µl of [3H] dCTP (50µM stock) was added to trace the efficiency
of the reaction. To the other two samples 1µl of DEPC water was added. All three tubes were
gently mixed and incubated at 42oC for 2 minutes, 1µl (200units) of Superscript II RNAse
H-reverse transcriptase (Gibco BRL, Life Technologies) was added to each tube and the reaction
mixed by gentle pipetting. The solutions were incubated at 42oC for a further 50 minutes.
Heating at 70oC for 15 minutes and cooling on ice inactivated the reaction. RNA
complementary to the cDNA was removed by the addition of 1µl (2 units) of E. coli. RNAse H
with incubation at 37oC for 20 minutes. A DE81 test (see section 2.7.9) was preformed on the
reaction tube containing the radiolabelled dCTP to verify that first strand cDNA had been made.
Section 2.5.3 PCR amplification of cDNA
PCR was performed using the Advantage cDNA polymerase mix from Clontech laboratories,
USA (Cat No 8417-1). The PCR reaction contained 5µl of 10X cDNA PCR reaction buffer
(400mM Tricine-KOH (pH 9.2 at 25oC), 150mM KOAc, 35mM Mg(OAc)2, 750µg/ml bovine
serum albumin), 2µl 5’-Primer (~70pmol), 2µl 3’-Prime (~70pmol), 1µl 50X dNTP mix (10mM
each dATP, dCTP, dGTP, dTTP at neutral pH; 1X concentration: 0.2mM each), 1µl 50X
Advantage cDNA polymerase mix which includes KlenTaq-1 DNA polymerase and TaqStart
antibody (1.1µg/µl) in the following storage buffer (50% glycerol, 40mM Tris-HCl (pH 7.5),
50mM KCl, 25mM (NH4)2SO4, 0.1mM EDTA, 5.0mM β-mercaptoethanol and 0.25% Thesit),
2-3µl of DNA template generated in section 2.5.2 made up to a reaction volume of 50µl with
UHP water. The PCR reaction was overlaid with 50µl of mineral oil to prevent the contents
from evaporating. PCR was performed using a Perkin Elmer DNA Thermal Cycler 480 with a
1-minute at 94oC step then for 25 cycles at 3.0 minute denaturing at 94oC, 3.0 minute annealing
at 68oC and 3.0-minute polymerisation at 68oC. 5µl of the PCR products were analysed on a
1.2% agarose/TBE gel.

Neill J. Horley Section 2.5.3
Page 83
Primer names and DNA sequences (5’-3’):-
BAMPR1 5’ GCC TGC TGC CTA AGG GAT CCA GGA GAC CAT GAC AGC 3’
BAMPR2 5’ GGT CTG GGG AAA GGA TCC AAG CCT GGG CCT CAA GTG 3’
Conditions:-
94oC for 1 minute (1)
94oC for 3 minute (2)
68oC for 3 minute (3)
68oC for 3 minutes (4)
Steps 2-4 are repeated for 25 cycles

Neill J. Horley Section 2.6.1
Page 84
Section 2.6 Primary tissue culture
Section 2.6.1 Isolation of primary rat hepatocytes
Hepatocytes were isolated from the livers of adult male Wistar rats (180-220g) by the two step
in situ perfusion technique described by Seglan (1976) and modified according to Mitchell et al.
(1984).
Strict aseptic techniques were maintained throughout the preparation. The buffers used were
Ca2+-free Krebs Ringer Phosphate Buffer, pH 7.4, (KRPB) containing 150mM NaCl, 4.97mM
KCl, 1.24mM KH2PO4, 0.62mM MgSO4, 0.62mM MgCl2, 3.73mM NaHCO3 and 4.84mM
Na2H3PO4; and Ca2+-free Krebs Ringer hydrogen carbonate Buffer pH 7.4 (KRHB), contain-
ing 142mM NaCl, 4.37mM KCl, 1.24mM KH2PO4, 0.62mM MgSO4, 0.62mM MgCl2 and
24.0mM NaHCO3. These buffers were maintained at 37oC and gassed continuously with 95%
O2/ 5% CO2. The rats were killed by diethyl ether anaesthesia and prepared for perfusion im-
mediately after expiration. Firstly the abdominal cavity was opened and the liver exposed. The
hepatic portal vein was located and cannulated followed by ligation of the inferior vena cava
above the branch of the renal vein. The right atrium of the heart was then exposed and a catheter
inserted into the superior vena cava via the right atrium. The liver was perfused with Ca2+ free
KRPB at a rate of 40ml/min for 10 minutes. The flow rate was adjusted to ensure that the liver
did not incur any excessive pressure fluctuations, which may have resulted in decreased viability
due to cell damage. Following this, perfusion was continued with Ca2+ free KRHB for 10 min-
utes. 96mg collagenase H (0.15U/mg lyophilizate) and 117mg CaCl2.H2O were dissolved in
20ml of Ca2+ free KRHB, filtered and added to the remaining 200ml of KRHB. This was then
re-circulated for up to 20 minutes. Re-circulation was continued until the liver exhibited signs
that it was sufficiently digested to remove it from the rat. This is generally indicated by the liver’s
inability to resist pressure when applied with the blunt edge of a pair of forceps, resulting in a
depression occurring for a number of seconds. The softened liver was dissected from the rat and

Neill J. Horley Section 2.6.2
Page 85
transferred to a sterile 200ml beaker containing 20ml of KRHB. The tissue was gently teased
apart and passed though a 120-µm bolting cloth (Lockertex, Warrington UK), which was
secured over a sterile beaker. Approximately 100ml of KRHB was passed through the blotting
cloth with gentle agitation of the tissue using a glass rod. This allowed free single hepatocytes
from the digested liver to pass through the bolting cloth. The filtrate was divided into four 30ml
tubes and centrifuged at 50g for 3 minutes. The resultant pellet was washed in ice cold KRHB
and pelleted as above twice more. The final pellet was resuspended in ice cold CL15 medium
(see section 2.6.4) and the cell viability was determined by Trypan Blue exclusion (see section
2.6.3). Cells of viability > 85% were plated out on 25cm2 flasks (see section 2.6.4).
Section 2.6.2 Modified isolation of primary rat hepatocytes
A second modified hepatocyte protocol was carried out using individual rat liver lobes and based
on techniques described by Strom et al. (1982) and Oldham et al. (1985). Strict aseptic techniques
were maintained throughout the preparation. The buffers used were perfusion buffer, pH 7.4,
containing Earle’s balanced salt solution (EBSS, 10X concentrate, Ca 2+ and Mg2+ free) with
NaHCO3 (3% v/v of a 7.5% w/v stock solution). Chelating buffer pH 7.4 comprised of perfu-
sion buffer containing 0.5mM EGTA as the chelating agent. Digestion buffer pH 7.4 comprised
of perfusion buffer containing collagenase A (Boehringer Mannheim, 0.19-0.23 units/ml final
concentration (about 40-60mg)), 2mM CaCl2 and 10mg trypsin inhibitor (per 150ml). A Dis-
persal buffer (pH 7.4) was used after the digestion step and consisted of 10mM HEPES, 140mM
NaCl, 9.6mM KCl and 1% w/v BSA. With the exception of the dispersal buffer which was kept
at 4oC, these buffers were maintained at 37oC and gassed continuously with 95% O2/ 5% CO2.
Two rats were killed by diethyl ether anaesthesia and the complete liver excised and placed in a
beaker containing 50-100ml of ice cold perfusion buffer. Care was taken not to damage the cap-
sule. Perfusion was carried out within 10 minutes of the livers being excised from the animals.
The largest two lobes of the liver were separated by dissection and the major exposed vessels can-

Neill J. Horley Section 2.6.2
Page 86
nulated with 20 gauge catheters, this was repeated for the other excised liver. The lobes were
perfused simultaneously with chelating buffer at a flow rate of 6ml/min/cannula for 10 minutes
to remove calcium. The flow rate was adjusted to ensure that the liver did not incur any excessive
pressure fluctuations, which may have resulted in decreased viability due to cell damage. The
lobes were then switched to perfusion buffer for 7 minutes to remove the chelating buffer and
allow for system dead volume clearance. Following this, perfusion was continued with digestion
buffer for 3 minutes (to remove the system dead volume) and then re-circulated for up to 25
minutes to remove the extracellular matrix of the liver lobes. Re-circulation was continued until
the lobes exhibited signs that they were sufficiently digested for perfusion to be stopped. Once
collagenase digestion was complete, the lobes were carefully transferred to a sterile Petri dish con-
taining 50ml of dispersal buffer containing deoxyribonuclease I (DNAse I, 4mg/100ml). Each
individual lobe capsule was broken and gently teased apart with forceps thus releasing isolated
cells into the dispersal buffer. The remaining vascular mass was then gently ‘combed’ using for-
ceps to further release more hepatocytes from the tissue. The cell suspension was then filtered
through pre-wetted 64µm nylon bolting cloth (Brunner Scientific, Yorkshire). Approximately
50ml of dispersal buffer were passed through the bolting cloth to wash through the remaining
isolated hepatocytes. The filtrate was divided into four 30ml tubes and centrifuged at 50g for 5
minutes at 4oC. The supernatant was poured off and the resultant pellet was resuspended and
washed in ice cold dispersal buffer containing DNAse I. The suspension was passed though a fresh
nylon blotting cloth and centrifuged once more. The supernatant was poured off and the pellet
resuspended in dispersal buffer (without DNAse I), filtered though bolting cloth and re-centri-
fuged. The cell pellets were resuspended in the appropriate culture medium (CL15 or Chees)
(see section 2.6.4) and the cell viability was determined by Trypan Blue exclusion (see section
2.6.3). Cell populations of > 85% viability were plated out on 25cm2 flasks (See section 2.6.4).

Neill J. Horley Section 2.6.3
Page 87
Section 2.6.3 Enumeration of isolated hepatocytes
The viability of isolated primary hepatocytes must be determined before cells can be seeded; this
is to ensure that the correct numbers of viable cells are present in the culture system. Viability is
tested for via the use of a vital stain such as Trypan blue. Trypan blue stain is only taken up by
non-viable cells which have damaged plasma membranes and as a consequence do not exclude
the polar stain. Percentage viability can be ascertained with this exclusion dye using a
haemocytometer. Relative numbers of blue to white stained hepatocytes following Trypan blue
treatment enables both the viability and concentration of the cell suspension to be determined.
To test the viability of the hepatocyte suspension, 250µl of hepatocyte suspension is mixed with
100µl of Trypan blue dye (0.4% (w/v) in Phosphate buffered saline). This solution is placed into
an ‘Improved Neubauer haemocytometer’ and counted. The ‘Improved Neubauer
haemocytometer’ uses a five by five (50µm x 50µm) grid. Five of these squares were counted for
both total numbers of cells and numbers of non-viable cells. Counts from the five squares were
totalled and the viability and concentration of the cell suspension calculated:
Section 2.6.4 Primary Rat Hepatocyte Culture
Primary monolayer cultures of hepatocytes were prepared in the following manner: Cells were
diluted to a concentration of 2x10⁶ viable cells/ml (as calculated in section 2.6.3) in CL15
medium*. CL15 medium is composed of Liebowitz L15 media containing foetal bovine serum
(8.3%), tryptose phosphate broth (8.3%), penicillin G (41.3 IU/ml), streptomycin sulphate
(8.2µg/ml), L-glutamine (241 µg/ml), insulin (10-6M), and hydrocortisone-21-hemisuccinate
total number of cellsnumber of blue cells1=Viability (%) ( )[ ] X 100
X viabilityConcentration of viablecells (cells/ml)
= ( total number of cells X 7 X 55
X 104
100
) ][

Neill J. Horley Section 2.6.5
Page 88
(10-5M). 3ml of CL15 media was added to the required number of flasks to which a further 1ml
of diluted cells was added, giving an initial plating density of 2x10⁶ viable hepatocytes per 25cm2
Falcon flask. Flask lids were loosely tightened to allow gaseous exchange to occur between the
incubator and the cell culture system. Flasks were gently agitated to ensure even distribution of
the hepatocytes across the flask surface. The flasks were then incubated at 37oC in a humidified
100% air incubator. If a 95% O2/5% CO2: air humidified incubator is used in the culture system,
then sodium hydrogen carbonate (20mM) must also be present in the CL15 medium to act as a
buffer. Four hours after seeding the spent media and unattached cells were carefully removed and
fresh media added. Cells were left overnight to allow complete attachment to occur. Further
media changes were made at 24, 48 and 72 hours after seeding.
* Chees medium is purchased as a complete medium and only required the addition of foetal
bovine serum (8.3%), penicillin G (41.3 IU/ml), streptomycin sulphate (8.2µg/ml) and
L-glutamine (241 µg/ml)
Section 2.6.5 Matrix components for hepatocyte culture
Section 2.6.5.1 No substratum
Here no pre-treatment of the flasks is required to culture primary rat hepatocytes. The flasks are
composed of polystyrene and cells are seeded as described in section 2.6.4
Section 2.6.5.2 Type-I collagen coated substratum
A collagen type I (or type IV) solution can be prepared in the laboratory or purchased commer-
cially, in this case collagen type-I from rat-tail (Sigma cat no C7761) was used. Collagen type I
coated flasks were prepared as described by Sidhu et al. (1993) and as detailed by the Sigma
protocol sheet. Collagen was dissolved in 0.2% glacial acetic acid (for 6-8 hours or overnight) to
give a 2mg/ml stock solution, which was stored at 4oC. A 75µl aliquot of the stock solution was
diluted into 600µl with sterile phosphate-buffered saline (PBS) to give a working solution of

Neill J. Horley Section 2.6.5
Page 89
150µg/25 cm2 per flask. The working solution was applied evenly to the surface of the flask with
a 1ml sterile pipette. The collagen solution was allowed to bind for several hours at room
temperature, 37oC in an incubator or overnight at 2-8oC. The excess collagen was aspirated off
and the flask left drying overnight. The dried collagen coated surface was sterilised by overnight
exposure to UV light in a sterile tissue culture hood. The flasks were then rinsed 4 times with
3-4ml of sterile distilled water to remove residual acidity. The water was aspirated and the flasks
were covered with 3-4ml of sterile culture medium containing foetal bovine serum (8.3%). This
final step was carried out 3-4 hours before primary hepatocyte culture suspensions are seeded on
to the base membrane of the flasks. Flasks can be stored at 4oC until needed. It is important that
the prepared collagen-coated flasks are not allowed to dry out as this results in reduced
hepatocyte viability.
Section 2.6.5.3 Matrigel overlay
Matrigel overlay was carried out as described by Sidhu et al. (1994). An 11mg/ml stock solution
was supplied by Sigma (cat no E1270). This solution was kept at -20oC and was thawed to 0oC
on ice. Care must be taken with the stock solution as above 4oC the solution solidifies, hence all
manipulations with matrigel were carried out over ice and all pipette tips were pre-cooled at
-80oC. Matrigel was diluted to give a working solution of 5mg/ml. Matrigel was added to the
hepatocyte monolayers 4 hours after plating out. A 67µl aliquot of the stock solution was diluted
into 1ml with CL15 culture medium (pre-chilled to 4oC) to give a working solution of
333µg/ml. The culture medium was removed from the hepatocyte monolayers and the 1ml
working solution applied evenly over the surface of the flask with a 1ml pre-cooled sterile
pipette. The matrigel solution was allowed to come to room temperature and a further 3ml of
CL15 added to the monolayer and the flasks returned to the 37oC incubator. Daily additions of
the matrigel solution were made after each medium change.

Neill J. Horley Section 2.6.6
Page 90
Section 2.6.6 Dosing primary hepatocytes
Chemical substances were added after 24 hours in culture and included in all subsequent media
changes. Chemical stocks were kept at 4oC for up to a week, while diluted chemicals were made
fresh daily. Compounds were either added directly to the culture media in a homogeneous man-
ner or dissolved in a suitable organic solvent such as dimethyl sulphoxide (DMSO) or dimethyl
formamide (DMF). Additions of DMF or DMSO never exceeded 10µl per flask, giving a final
working concentration of solvent at 0.25% (v/v). This concentration produced no cytotoxicity
in the culture system (Nick Plant, Thesis results The University of Nottingham, 1994).
Section 2.7 RNA manipulation
Section 2.7.1 Extraction of RNA
Solutions used in the extraction of RNA must be RNAse free. Glassware and RNA solutions
were pre-treated with diethylpyrocarbonate (DEPC) to ethoxyformylate them, and thus
inactivate any RNAse present. Plasticware can be treated in a 2-3% hydrogen peroxide solution
to remove any RNAse contamination.
Section 2.7.2 Diethylpyrocarbonate treatment of solutions for RNA manipulation
DEPC is a potent inhibitor of RNAse activity. DEPC treated water and solutions were used
extensively throughout all RNA studies. A stock solution of DEPC was prepared as a 1:10
solution in 100% ethanol, this solution was then added to solutions to give a final concentration
of 0.1% (v/v), and left at room temperature for a minimum of 12 hours or at 37oC for 2-3 hours.
DEPC was then deactivated by autoclaving the treated solutions for 20 minutes at 120oC.
Solutions such as Tris cannot be DEPC treated as the amine group reacts with the DEPC. In
such cases the solutions are prepared from fresh stocks using DEPC-treated water.
Section 2.7.3 Preparation of phenol
Phenol must be equilibrated prior to use to remove contaminant substances and to adjust the pH.
Liquefied phenol’s acidic nature prevents efficient separation of proteins from nucleotides and so

Neill J. Horley Section 2.7.4
Page 91
must be equilibrated to a pH greater than 7.8, to prevent DNA from partitioning into the organic
phase. 500g of crystalline phenol was melted at 68oC and to this solution 0.1% (w/v) hydrox-
yquinoline was added. To the melted phenol an equal volume of 0.5M Tris-HCl (pH 8.0) was
added and stirred for 15 minutes. The mixture was then allowed to separate and the aqueous
phase was discarded. To the phenolic phase an equal volume of 0.1M Tris-HCl (pH 8.0) was
added and stirred for 15 minutes. The mixture was again left to separate and the pH of the
phenolic phase was tested, this final extraction step was repeated until the phenolic phase was
greater than 7.8. After the phenol is equilibrated and the final aqueous phase has been removed,
0.1 volumes of 0.1M Tris-HCl (pH 8.0) was added. This solution was stored in this form under
0.1M Tris-HCl (pH 8.0) in the dark at 4oC for up to one month.
Note: For the Xie and Rothblum (1991) method of extracting RNA, phenol at pH 7.0 is
required. This was produced using the above protocol, except that Tris-HCl (pH 7.0) is used in
place of Tris-HCl (pH 8.0).
Section 2.7.4 RNA extraction from tissue sample
RNA was extracted from tissue using the method described by Green et al. (1976) and modified
by Aufray and Rougeon (1980). Tissue samples were excised from treated animals and immedi-
ately flash frozen in liquid nitrogen. The samples were then either processed or stored at -80oC
to prevent degradation of the RNA. For the extraction of RNA, 0.5-1.0g of tissue was placed
in a sterile RNAse-free glass vial containing 15ml of lysis buffer (6M urea, 3M lithium chloride,
3M sodium acetate and 10% SDS) and homogenised for 30 seconds using a Silverston homoge-
niser. The solution was homogenised repeatedly in blocks of 30 seconds to prevent overheating,
until the sample became a thick homogeneous solution. The homogenate was then mixed by
inversion, transferred to an RNAse-free 50ml centrifuge tube and stored at 4oC overnight. The
homogenate was then spun at 11000g for 20 minutes at 4oC. The supernatant was discarded to

Neill J. Horley Section 2.7.5
Page 92
reveal a clear white pellet, which was then resuspended in 5ml of aqueous buffer (10mM Tris-
HCl pH 7.4, 0.2% SDS). This solution was then transferred to a clean 50ml centrifuge tube and
mixed with 2.5ml Tris-buffered phenol, pH 8.0 and 2.5ml chloroform: IAA, (24:1). This
solution was then shaken vigorously (on a rotary shaker) for 15 minutes, and then spun at 11000g
for 20 minutes at 4oC. The aqueous phase was then removed to a fresh tube and phenol:
chloroform: IAA (24:24:1) added. This was then mixed and spun as before. The resultant
aqueous phase was then added to 5ml of chloroform: IAA (24:1) in a fresh tube, mixed and spun
for 10 minutes at 11000g at 4oC. The aqueous phase was then removed and ethanol precipitated
(using two volumes of ethanol and 1/4 volume of 3M sodium acetate pH 5.2) overnight at
-20oC. This was then spun at 11000g for 30 minutes at 4oC and the pellet washed in 70% ethanol
(v/v), and re-pelleted. The final pellet was air-dried and then resuspended in 250µl of
DEPC-treated water. The sample was then placed in a 65oC water-bath for 15 minutes to ensure
the RNA was dissolved and then stored at -70oC until required.
Section 2.7.5 RNA extraction from primary cell cultures
An alternative protocol was used to extract RNA from cultured hepatocytes, as the yield of RNA
from other methods was insufficient (unpublished observations, NJH). This method incorporat-
ed the use of guanidinium thiocyanate, which is a strong inhibitor of ribonucleases and is based
on the method described by Chomczynski and Sacchi (1987), and modified by Xie and Roth-
blum (1991). The cell monolayer is harvested using a denaturing solution which must be pre-
pared before the monolayers are rinsed. Solution B consists of 4M-guanidinium thiocyanate and
25mM sodium citrate (pH 7.0). Solution A was prepared by mixing Tris-saturated phenol (sec-
tion 2.7.3), solution B and 2M sodium acetate (pH 4.0) in a ratio of 1:1:0.1. This mixture was
supplemented with 720µl of β-mercaptoethanol per 100ml of solution B and could be stored at
4oC for up to several months. The cell monolayer was harvested by first draining the monolayers
of culture medium, followed by washing twice with 5ml Ca2+ and Mg2+ free PBS. The cells

Neill J. Horley Section 2.7.6
Page 93
were lysed using 0.9ml of solution A, a disposable cell scraper was used to dislodge the cells from
the flask’s surface and the lysate was then transferred to a microfuge tube and placed on ice. To
the lysate 100µl of chloroform: IAA, 24:1 was added and the phases mixed by vortexing for 20
seconds. The mixture was kept on ice for 25-30 minutes and the phases separated by centrifuging
at 12000g for 20 minutes at 4oC. The aqueous phase was removed to an eppendorf containing
800µl of 100% ethanol. The sample was then vortexed and placed at -70oC for 1-2 hours or at
-20oC overnight. The thawed solution was then centrifuged at 12000g for 20 minutes at 4oC to
pellet the RNA. The pelleted RNA was rinsed in 70% ethanol, centrifuged for 5 minutes as
before and excess moisture blotted. The final pellet was then resuspended in 25µl of DEPC
treated water and the sample placed in a 65oC water-bath for 15 minutes to ensure the RNA was
dissolved and then stored at -70oC until required.
Section 2.7.6 RNA quantification and integrity
Quantification of the extracted RNA was carried out using the absorbance at 260nm of a diluted
sample of RNA. 1µl of RNA was added to 999µl of DEPC water and the mixture placed in a
quartz cuvette, DEPC water was used as the blank sample. The A26onm was then determined
for the sample and the concentration of the RNA sample was determined as shown below,
RNA concentration (µg/µl) = (A260nm X 401) X dilution factor
1 For the calculation of DNA concentration the value of 50µg/µl per 1 unit O.D. reading instead
of 40.
The integrity of the RNA was determined by visualisation of the 18S and 28S rRNA bands.
RNA was analysed by running 1µl of the sample RNA on a 1.0 % agarose TBE gel (DEPC
treated, 1 X TBE, 0.1% SDS, 0.1µg/ml ethidium bromide) which was ran at 65 volts for 2-3
hours.

Neill J. Horley Section 2.7.7
Page 94
Section 2.7.7 Preparation of riboprobe template DNA
Template DNA which was used to synthesis the RNA probe, was prepared as a large stock
solution from which aliquots could be taken. This template DNA stock, must firstly be restriction
digested. A master preparation of the restriction digest was prepared thus. 10-15µg of template
DNA was digested using 3µl of restriction digest buffer (10X), 4U of restriction digest enzyme,
and the solution was made up to 30µl with DEPC water. This mixture was incubated for 1-2
hours at 37oC followed by analysis of 1µl of the restriction digest mixture on an appropiate
percentrage TBE-agarose gel.
The linearised template DNA was then purified by inactivating the restriction enzyme by the
addition of 100µg/ml of Proteinase K and 0.1% SDS (w/v) to the reaction mixture and
incubation at 37oC for an hour. Protein contamination was then removed by phenol:chloroform
(1:1, v/v) extraction, followed by centrifugation at 14000g at 4oC for one minute. The aqueous
phase containing the purified linear template was then added to 2 volumes of absolute ethanol
and 1/4 volume 3M sodium acetate and precipitated for 20 minutes at -20oC. The template was
then pelleted by centrifugation at 14000g for 30 minutes at 4oC. The pellet formed was then
washed in 200-500µl of 70% ethanol and re-spun as before for a further 5 minutes. The resulting
pellet was resuspended in 15µl of DEPC water. This stock of linearised probe template would
then be enough for fifteen RNAse protection assays.
Section 2.7.8 Synthesis of RNA probe
In vitro transcription was performed at room temperature by the addition of 1µl of 5X-transcrip-
tion buffer (200mM Tris-HCl, pH 7.9, 30mM MgCl2, 10mM spermidine, 50mM NaCl), 2µl
100mM DTT, 1µl RNAguard (Pharmacia), 2µl NTP mix (5mM ATP, GTP, UTP), 1µl 100µM
CTP, 6µl DEPC water, 5µl [α-32P] CTP (12.5 µM [α-32P] CTP, specific activity 600Ci/
mmol), 1.5µl (1-2µg) template DNA and 1µl SP6 or T7 RNA polymerase. The solution was
mixed and incubated for an hour according to which polymerase is being used, 42oC for SP6 or

Neill J. Horley Section 2.7.9
Page 95
37oC for T7 RNA polymerase. After this time 1µl of DNase I was added and incubated for a
further 30 minutes at 37oC, to remove the template DNA. Probe synthesis was tested for effi-
ciency of incorporation of labelled nucleotides by carrying out the DE81 test (section 2.7.9). If
an incorporation of 10% or more is achieved then the probe is suitable for use in a protection
assay. The probe is purified using 30µl of a phenol:chloroform (1:1 v/v) solution, which is
vortexed and centrifuged for one minute at 14000g. The resultant aqueous phase was transfered
to a clean eppendorf and ethanol precipitated by the addition of 2 volumes (120µl) of absolute
ethanol and 1/4 volume (15µl) of 3M sodium acetate, and left at -20oC for 25 minutes. The
probe was pelleted by centrifugation at 14000g for 30 minutes and finally washed in 70% ethanol
and spun as before, the resultant pellet was resuspended in 15µl of deionised formamide and
stored at -20oC.
Section 2.7.9 Radionucleotide incorporation test
Incorporation of radioactive CTP into the probe was estimated using Whatman DE81 filter
paper. DE81 ion-exchange filters have a high affinity for nucleotide chains and a low affinity for
single nucleotides. 1µl of the synthesised probe was applied to each of the two halves of the DE81
filter paper and allowed to dry. One half of the filter was then washed in 20ml of 0.5M Na2HPO4
for one minute, the wash solution was changed and the procedure repeated a further 4 times.
The residual Na2HPO4 was then removed by washing the filter twice with 20ml of DEPC water
for one minute. The filter was then rinsed twice in 100% ethanol for one minute and then
allowed to air-dry. Both filters (washed and unwashed) were then placed into scintillation vials
containing 3ml of scintillation fluid and the radioactivity determined for 1 minute on a 32P
program using a 1900 TR liquid scintillation analyzer. The amount of incorporation was
calculated as detailed below.
counts per second of washed filterx 100% = Incorporation rate (%)
counts per second of unwashed filter

Neill J. Horley Section 2.7.10
Page 96
An incorporation efficiency of greater than 10% was acceptable.
Section 2.7.10 RNAse protection assay
RNAse protection assays were based on a method described by Melton et al. (1984) and modified
by Bell et al. (1991a). 30µg samples of the RNA of interest were ethanol precipitated (two vol-
umes of ethanol and 1/4 volume of 3M sodium acetate pH 5.2) and the pellets stored at -20oC.
The pGEM7-2B2-X-lig riboprobe was diluted 100 fold in hybridisation buffer (80% formamide
(v/v), 40mM Pipes (pH=6.7), 0.4 mM NaCl, 1mM EDTA (pH 7.5)). 30µl of this solution was
then used to resuspend each of the RNA pellets. Samples were heated to 85oC for 3 minutes and
then incubated overnight at 45oC. 30µg of yeast tRNA was also ethanol precipitated and resus-
pended in 30µl of hybridisation buffer, these samples were then heated to 85oC for 3 minutes
and incubated overnight at 45oC as with the other RNA samples. These samples were included
as the tRNA positive and negative controls. Following hybridisation, 300µl of RNAse buffer
(0.35 NaCl, 10mM Tris-HCl (pH =7.5), and 5mM EDTA) was then added to the negative con-
trol tRNA sample. The positive control tRNA and the RNA samples of interest were then treat-
ed with an RNAse enzyme such as RNAse A or RNAse T1. RNAse A (10mg/ml) was added
to 300µl of RNAse buffer at a 1/10000 dilution to give a 1µg/ml working concentration and
incubated at 37oC for an hour per RNA sample. RNAse T1 was used at 15 units per 300µl of
RNAse buffer and incubated at 37oC for 45 minutes. RNAse activity was terminated by the
addition of 20µl of 10% SDS (w/v) and 5µl (50µg) of a 10mg/ml Proteinase K solution to each
tube and incubation at 50oC for an hour. Each protected sample was then treated with 800µl of
phenol:chloroform (1:1 v/v), vortexed and spun. The aqueous layer was removed and precipi-
tated using two volumes (800µl) of absolute ethanol and one quarter volume (100µl) of 3M
sodium acetate. Following precipitation at -20oC for 25 minutes, the samples were spun for 30
minutes at 14000g, the supernatant was discarded and the pellet was washed in 70% ethanol. The
pellet was allowed to air dry and then resuspended in 10µl of load buffer (90% formamide (v/v),

Neill J. Horley Section 2.7.11
Page 97
0.25% Xylene Cyanol FF (w/v), 0.25% Bromophenol Blue (w/v), 1X TBE). A serial dilution of
the probe was also produced and 10µl of this was mixed with 5µl of load buffer, a labelled ladder
(see 2.7.13) was also mixed with 5µl of load buffer. All samples were heated to 85oC for 3
minutes and then cooled on ice immediately and pulse centrifuged. Denaturing acrylamide gel
electrophoresis (section 2.7.11) was then used to resolve the RNA samples.
Section 2.7.11 Denaturing acrylamide electrophoresis
A denaturing acrylamide electrophoresis gel is used to ensure that separation of RNA is based on
absolute size and not secondary structure. Acrylamide electrophoresis was performed using a
Biorad Protean II vertical electrophoresis kit. Glass plates used for casting gels were cleaned with
acetone to remove all traces of grease and dirt that may interfere with the casting of the gels.
Sequagel concentrate (237.5g acrylamide, 12.5g methylene bisacrylamide, and 450g urea (7.5M)
per litre) and Sequagel diluent (450g urea (7.5M) per litre) were used to make the 6% gels. The
following equations were used to determine the appropriate amounts of concentrate and diluent
that was needed to obtain a certain percentage gel.
A 60ml, 6% denaturing acrylamide gel was made using 6ml of 10 X TBE, 14.4ml of sequagel
concentrate, 39.6ml of sequagel diluent. The acrylamide was polymerised by the addition of 40µl
of TEMED and 500µl of 10% ammonium persulphate and mixed. The acrylamide solution was
then pipetted into the gel casting kit according to the manufacture’s instructions using 25-well
Volume of concentrate needed = [(% acrylamide gel needed) x (volume of gel used)]25
Volume of 10 X TBE = 0.1 (Total gel volume)
Volume of diluent = Volume of gel - (1/10th volume of gel + volume of concentrate)

Neill J. Horley Section 2.7.12
Page 98
combs and allowed to polymerise for at least an hour. The gel casting kit was dismantled and the
gels connected to the Biorad model E4860 recirculator according to the manufacture’s
instructions. The lower reservoir was stirred continually and the gel was heated to 55oC when
in use. The gels were pre-run at 15V/cm using a Biorad model 3000Xi power pack for at least
30 minutes before use. Prior to loading, wells were flushed with 1 X TBE to remove salts from
the sample wells. Samples were heat treated and loaded into the wells. Separation was carried out
at 15V/cm (300 V) at 55oC until the Xylene Cyanol FF maker dye had travelled at least 60%
through the gel. The gels were placed in fixing solution (10% (v/v) methanol, 10% (v/v) acetic
acid) for 30 minutes. Gels were transferred onto 3MM Whatman paper and dried for 4 hours at
85oC, under vacuum, using the Biorad model 583 flatbed gel dryer. Smaller gels were run under
similar conditions at 20V/cm in the mini Protean II gel kit. Autoradiographs were treated as
detailed in section 2.7.12.
Section 2.7.12 Autoradiograph development
The dried gels were exposed to pre-flashed hyperfilm at -70oC with intensifying screens for
between 1-5 days. After exposure, film cassettes were allowed to warm to room temperature and
developed in the darkroom. Hyperfilm was immersed in 1X Kodak LX24 X-ray developer for
approximately 3 minutes or until bands were clearly visible. The hyperfilm was then rinsed in
tap water for 2 minutes, before being immersed in 1X Rapid fixer (Ilford Hypam Fixer) for
3 minutes. The film was finally rinsed thoroughly in tap water and hung up to dry.
Section 2.7.13 [32P] labeling of marker
Klenow labelling was performed on ice by adding 3µl of 5X labelling buffer (250mM NaCl,
150mM Tris-HCl (pH=7.5), 50mM MgCl2), 3.5µl Nuclease-free water, 1.5µl 10mM
dATP,dGTP,dTTP, 5µl [α-32P] dCTP (3.3µM [α-32P] dCTP, specific activity 600Ci/mmol),
5µg 100bp ladder (Gibco BRL, Life Technologies) and 1µl of Klenow DNA polymerase. The
reaction was then mixed and incubated at room temperature for 2 hours. It is at this point that

Neill J. Horley Section 2.7.13
Page 99
the ladder is tested for efficiency of incorporation of labelled nucleotides by carrying out the
DE81 test (see section 2.7.9). Typically incorporations of between 40-80% were achieved. 2µl
of labelled ladder is mixed with 10µl of 1X TBE and 5µl of loading buffer, heated at 85oC for
3 minutes and then cooled on ice before being loaded onto a denaturing acrylamide
electrophoresis gel.
Neill J. Horley Section 2.8.1
Page 100
Section 2.8 Transfection protocols
Section 2.8.1 Preparation of cationic liposome formulations
There are various commercially prepared lipofection reagents available such as lipofectinTM and
LipofectAMINETM (Gibco-BRL). Dioleoylphosphatidylethanolamine (DOPE) was obtained
from Sigma (Poole, UK) as a liposome (10mg/ml) solution dissolved in chloroform. 1,2-dioley-
loxypropyl-3-trimethyl ammonium bromide (DOTMA) was supplied as a lipid solid and was a
kind gift from Dr Cliff Elcombe, Zeneca, CTL. The cationic liposomes were prepared as detailed
in Felgner et al. (1987, 1994) and Hofland et al. (1996) by mixing 10mg of solid DOTMA with
10mg of DOPE in 1ml of chloroform. This solution was evaporated to dryness under a stream
of nitrogen, in the dark, to produce a greasy yellow lipid residue. Liposomes were prepared by
re-suspending the lipid residue in 1-2ml of filter sterilised de-ionised water, which was then
vortexed for one minute at room temperature. The suspension was then split into two
eppendorfs and sonicated in a 50-60Hz, 80watts Polaron Sonibath for 5 minutes or until the
suspension became clear in appearance. Sterile preparations of the cationic liposomes can be
stored at 4oC for at least 6 months. This liposome preparation was referred to as
DOTMA/DOPE. Each batch of DOTMA/DOPE was verified for its effectiveness by
determining transfection efficiency as detailed in section 2.9.1.
Section 2.8.2 Transfection optimisation
The most important aspect for obtaining efficient transfection is the optimisation of transfection
conditions for each cell culture system. The nature and stability of the lipid-DNA complex
formed is sensitive to the DNA concentration, liposome concentration, time of incubation and
cell density. Each of these parameters must be altered so that the greatest transfection efficiency
may be obtained. This is normally determined by optimising the liposome concentration whilst
maintaining a constant DNA concentration initially, then altering the various parameters based
on these findings.

Neill J. Horley Section 2.8.3
Page 101
Section 2.8.3 Transient transfection of primary rat hepatocytes
Isolated supercoiled Qiagen prepared plasmid DNA’s (pRSV-β-galactosidase, β-gal;
chloramphenicol acetyltransferase, pCAT-cont; luciferase, pGL3-LUC) were transfected into
primary rat hepatocytes by cationic-liposomes (DOTMA/DOPE; Felgner et al., 1987). Primary
rat hepatocytes were prepared as detailed in section 2.6.1 and 2.6.2 and incubated overnight
before transfection was carried out. This was to allow the freshly prepared hepatocytes to become
stabilised in their new environment. For each transfection the lipid-DNA complexes were
prepared as follows. Solution A was prepared by diluting 5-8µg of DNA into 300µl -ve L15
medium. -ve L15 is comprised of CL15 medium without foetal calf serum, tryptose phosphate
buffer, penicillin G or streptomycin sulphate. Solution B was prepared by diluting 25-50µg of
DOTMA/DOPE into 300µl -ve L15 medium. These two solutions were allowed to stand for
30-40 minutes at room temperature. Solution A and solution B were then gently mixed together
and incubated at room temperature for a further 10-15 minutes to give solution C. Solution C
may appear cloudy; however, this will not impede the efficiency of transfection. Immediately
prior to lipid-DNA addition, the monolayers were washed with 4-6ml of -ve L15 media. 2.4ml
of -ve L15 was then added to Solution C, mixed gently, and overlaid onto the drained
monolayer. The monolayers were then incubated at 37oC for 5-24 hours (typically 5-6 hours is
adequate to obtain good transfection efficiency). Medium was replaced with CL15 post-
transfection and dosed if necessary (section 2.6.6). The monolayers were incubated for a further
24-72 hours for transient expression to occur.

Neill J. Horley Section 2.9.1
Page 102
Section 2.9 Reporter gene assays
Section 2.9.1 β-Galactosidase histochemistry
β-Galactosidase (β-gal) is a useful internal control for normalising variability in reporter gene ac-
tivity due to transfection efficiency or cell extract preparation. β-galactosidase can be monitored
using a simple photometric assay, by measuring enzymatic hydrolysis of the substrate ONPG (O-
nitrophenyl-β-D-galactopyranoside) by β-galactosidase in cell-free extracts. β-galactosidase ac-
tivity can also be monitored histochemically by the cleavage of the substrate X-Gal (5-bromo-
4-chloro-3-indolyl β-D-galactoside). This substrate is hydrolysed to an indolyl, which oxidises
to an indoxyl, which then self-couples to form an indigo blue derivative. Histochemical analysis
of β-galactosidase activity was carried out as described by Sanes et al. (1986). Cultured cells were
first rinsed in phosphate buffed saline (PBS) containing 100mM NaCl, 81mM Na2HPO4 and
20mM NaH2PO4.2H2O, (pH= 7.3) and then fixed for 5 minutes at 4oC in 2% formaldehyde
plus 0.2% gluteraldehyde in PBS. The cells were then rinsed with PBS to remove the fixing so-
lution. The monolayer was then overlaid with 3ml of a histochemical reaction mixture contain-
ing; 1mg/ml 5-bromo-4-chloro-3-indolyl-β-D-galactoside (X-Gal), 5mM K3Fe (CN)6, 5mM
K4Fe (CN)6. 3H2O and 2mM MgCl2. X-Gal was kept as a stock solution dissolved in dimethox-
ysulfoxide (DMSO) at 40mg/ml, and then diluted into the reaction mixture. The histochemical
reaction mixture was then incubated at 37oC for 12-24 hours or until β-galactosidase activity was
evident by the blue colouration of the cell cytoplasm in the fixed monolayer. The β-galactosidase
mixture was then replaced with PBS and the numbers of transfected cells were identified at 40X
magnification under a dissecting microscope. Percentage transfection was determined by the
number of blue transfected cells expressed as a percentage of the total number of cells present.
Section 2.9.2 Harvesting of cell monolayers
The method chosen for harvesting cells was dependent upon the reporter constructs that had
been transfected. The first method utilised was based upon the Firefly luciferase assay. This system

Neill J. Horley Section 2.9.3
Page 103
used a Reporter Lysis Buffer (RLB), which was specifically developed to lyse cultured
mammalian cells and to be compatible with the luciferase, CAT, and β-galactosidase enzyme
assays. The second system used a Passive Lysis Buffer (PLB), so that the Dual Luciferase Reporter
Assay system could be utilised. Here mammalian cells could be efficiently harvested without the
need for freeze-thaw cycles allowing both transfected reporter vectors to be assayed at the same
time. For monolayers that were transfected with CAT, LUC or β-gal the monolayer were
harvested by first washing the monolayer with 5ml Ca2+ and Mg2+ free PBS. This was then
removed and 900µl of 1X RLB were added to each flask. The flasks where then rocked gently
several times to ensure complete coverage of the monolayer for 5 minutes. The cell monolayer
was then disrupted using a clean tissue culture cell scraper and the cell extract transferred to a
microfuge tube. The cell extract was then subjected to a single freeze-thaw in liquid nitrogen
and thawed at room temperature. The thawed extract was vortexed for 15 seconds then
centrifuged at 15000rpm for a further 15 seconds. The resultant supernatant was then transferred
to a fresh tube and placed on ice for immediate use or stored at -70oC. For cell extracts that were
used in the Dual luciferase reporter assay (DLRA) system containing firefly luciferase and Renilla
luciferase a similar harvest protocol is followed. After the Ca2+ and Mg2+ free PBS was removed
from each flask, 900µl of 1X PLB were added. The cell monolayer was rocked for 5 minutes,
then disrupted using a clean tissue culture cell scraper. The cell extract was then transferred to a
fresh microfuge tube and placed on ice for immediate use or stored at -70oC.
Section 2.9.3 Assay for chloramphenicol acetyl transferase
Chloramphenicol acetyl transferase is used as an internal control to determine the transfection
efficiency. It is used widely, as eukaryotic cells have no equivalent enzyme to complicate the
interpretation of assays for CAT activity. The assay is based on the enzymatic butyrylation of ra-
diolabelled chloramphenicol as detailed by Seed and Sheen (1988). The protein concentration of
each sample was determined by the modified Bradford method (Bradford, 1976) as described in

Neill J. Horley Section 2.9.4
Page 104
section 2.10.2. A 40µg protein sample of cell extract was mixed with ultra pure water to give a
final volume of 50µl and incubated at 65oC for 15 minutes. This was then added to a solution of
substrates constituted to give a final volume of 100µl, and comprised of 10µl of 1M Tris-HCl
pH 8.0, 5µl [D-threo-[dichloroacetyl-1-14C] chloramphenicol, 54miCi/mmol (Amersham),
25µl of 0.33mM chloramphenicol and 10µl of a 2.5mM n-butyryl-Coenzyme A. Cell extract
was then incubated at 37oC for between 5-24 hours. The reaction was terminated by the addi-
tion of 2 vols. (200µl) of a 2:1 mixture of 2,6,10,14-tetramethyl-pentadecane: mixed xylenes,
then mixed vigorously. After centrifugation for 3 minutes at 15000rpm in a bench-top centri-
fuge, 90% of the organic phase was removed to a scintillation vial containing 3ml of scintillation
fluid and radioactivity determined for 1 minute on a 14C program using a 1900 TR liquid
scintillation analyzer. Each sample was carried out in triplicate and a mean taken of the results. A
purer organic phase may be obtained by terminating the reaction with two volumes (200µl) of
mixed xylenes followed by centrifugation for 3 minutes at 15000rpm in a bench-top centrifuge.
The organic phase was removed and extracted twice with one volume (100µl) of 10mM
Tris-HCl pH 7.5, 1mM EDTA solution, with complete removal of the aqueous phase after each
extraction. The final organic phase was removed to a scintillation vial containing 3ml of
scintillation fluid and radioactivity determined for 1 minute on a 14C program using a 1900 TR
liquid scintillation analyzer
Section 2.9.4 Luciferase assay system with reporter lysis buffer
Luciferase activity was assayed according to the DeWet et al. (1987) protocol and modified ac-
cording to Promega technical bulletin 161. All reactions were carried out at room temperature,
as enzyme activity will decrease by 5-10% if carried out at lower temperatures. Cell extracts were
prepared using 1X RLB and protein concentration determined according to section 2.10.2 or
section 2.10.3. 100ml of reconstituted luciferase assay reagent (Promega) containing 20mM tri-
cine, 1.07mM (MgCO3)4Mg(OH)2.5H2O, 2.67mM MgSO4, 0.1mM EDTA, 33.3mM DTT,

Neill J. Horley Section 2.9.5
Page 105
270mM coenzyme A, 470mM Luciferin and 530mM ATP at pH 7.8 was mixed with 20µl of
cell extract in a polystyrene cuvette. This cuvette was then placed immediately in a Packard
Picolite luminometer analyzer and the light produced measured. The peak light emission and
time course of the reaction was recorded over 10 second intervals for at least five readings or until
the luminescence began to decline.
Section 2.9.5 Dual-luciferase reporter assay system (DLRA)
The dual-luciferase assay is based on the work of DeWet et al. (1985) and modified according to
the Promega technical DLRA manual. All reactions were carried out at room temperature. Cell
extracts were prepared using 1X PLB and protein concentration determined according to section
2.10.2 or section 2.10.3. 20µl of cell extract was added to 100µl of luciferase assay reagent II
(Promega) and the luminescence generated by the firefly luciferase reaction was measured over
four 10-second intervals. The firefly luciferase activity was stopped by adding 100µl of Stop &
Glo reagent and the luminescence generated by the Renilla luciferase reaction was measured over
four 10-second intervals in a Packard Picolite luminometer. Readings were also taken using the
Top Count HTS Packard microplate scintillation and luminescence counter using 96 well plate
(Corning Costar Corporation, Cambridge). The average luminescence for each luciferase assay
was used as the final measurement.
Section 2.9.6 Normalisation of luciferase activity
The effectiveness of a transfection can be monitored, by the use of two reporter genes. The first
reporter is used to monitor gene function and related cellular events. The second reporter is used
so that a normalisation of the first reporter activity can be made. This is carried out by first
subtracting background counts from each reporter assay and then taking the first reporter gene
assay value and dividing this value by that of the second reporter gene assay value.

Neill J. Horley Section 2.10.1
Page 106
Section 2.10 Protein methodologies
Section 2.10.1 Purification of hepatocyte microsomes
Hepatocytes were cultured for 3 days as detailed in section 2.6.4 before they were harvested.
Microsomes were prepared as outlined by Waxman et al. (1990). The culture medium was
removed and the monolayers rinsed with 3-5ml of ice cold phosphate buffered saline (PBS)
containing 100mM NaCl, 81mM Na2HPO4 and 20mM NaH2PO4.2H2O (pH 7.3), this was
then removed and replaced with a further 3ml of PBS. The monolayers were then harvested by
scraping the cells off (all solutions were kept over ice) and pooling 3 flasks to give approximately
8 x 10⁶ cells per microsomal sample. A 0.1M sodium phosphate buffer solution was made by
mixing 77.4ml Na2HPO4 (1M) and 22.6ml NaH2PO4.H2O (1M) together. The harvested cells
were made up to 15ml with homogenisation buffer which contained 0.1M sodium phosphate
buffer pH 7.4, 10mM EDTA and 1.15% v/v KCl. This solution was placed into a 20ml-Dounce
homogenisation tube and the monolayer homogenised with 5-7 stokes of the homogeniser. The
total homogenate was placed into polycarbonate centrifuge tubes and spun for 20 minutes at 4oC
at 9000g using a pre-chilled centrifuge. The supernatant (S9 fraction) was removed to another
tube and balanced using homogenisation buffer. The S9 fraction was then spun at 100,000g for
1 hour at 4oC. The supernatant was discarded and the pellet formed inverted to remove the
remnants of the homogenisation buffer. The microsomal pellet was then transferred to a 2ml
Dounce homogenisation tube and carefully resuspended in 50µl of Storage buffer which
contained 0.1M sodium phosphate buffer pH 7.4, 0.1mM EDTA and 20% v/v glycerol by
5-7 stokes of the homogeniser. The micosomal fraction was stored at -70oC.
Section 2.10.2 Bradford (Coomassie blue) protein assay
Protein concentration was determined using the method described by Bradford, 1967. Bradford
reagent is the main component of the Bradford assay, comprised of 100mg Serva blue G dissolved
in 100ml of 85% phosphoric acid and 50ml of 95% ethanol, made up to 1 litre. 30µl sample of

Neill J. Horley Section 2.10.3
Page 107
cell extract was added to 50µl of 1M NaOH. To this 950µl of Bradford reagent was added and
the assay solution vortexed immediately. Absorbance was read at 590nm in an UV cuvette. The
protein concentration was determined from a standard curve of bovine serum albumin (BSA)
generated between the range of 0-40µg/ml. All assay samples and standards were carried out in
triplicate and the resultant means determined. The standard curve of BSA concentration against
the absorbance at 590nm produces a linear plot upon which linear regression was carried out.
Linear regression was used on the sample readings so that unknown protein sample concentra-
tions could be calculated. Only standard curves that gave rise to R2> 0.95 were used.
Section 2.10.3 Bicinchoninic acid (BCA) kit for protein determination
This is a commercial kit and is an alternative to the Folin-Ciocalteu reagent for protein determi-
nation. The assay is designed for 96 well format with the absorbance of the final solution being
read at 562nm on an UV plate reader. The protein concentration was determined from a standard
curve of bovine serum albumin (BSA 1mg/ml supplied with the kit) generated between the
range of 0-1000µg/ml. The standards were prepared directly into the 96 well plate in the desig-
nated wells. Microsomal samples were serially diluted with water to give a maximum volume of
10µl. These 10µl samples were placed into the appropriately designated wells and assayed. BCA
reagent must be prepared immediately prior to use by mixing 50 parts BCA with 1 part copper
sulphate solution (present in kit). 200µl of this solution were immediately added to the standards
and diluted samples and the plate incubated at 37oC for 30 minutes. The plate was removed from
the incubator and allowed 5 minutes to return to room temperature. The absorbance of each
standard and sample were read at 562nm using an UV plate reader. All assay samples and standards
were carried out in duplicate and the resultant means determined. The standard curve of BSA
concentration against the mean OD value at 562nm produces a linear plot upon which linear
regression was carried out. Linear regression was used on the sample readings so that unknown
protein sample concentrations could be calculated. Only standard curves that gave rise to

Neill J. Horley Section 2.10.4
Page 108
R2> 0.95 were used. All samples were diluted down to give stock solutions of 2mg/ml.
Section 2.10.4 SDS-polyacrylamide gel electrophoresis (SDS-PAGE)
Based on a modified version of that described by Laemmli (1970), SDS-PAGE was performed
using a SE 250 Mighty small II electrophoresis kit. Glass plates used for casting gels were cleaned
with 100% methanol to remove all traces of grease and dirt that may interfere with the casting of
the gels. Using a multi-caster up to 12 separating gels may be cast at the same time. Once these
gels were prepared they were stored for up to 2 months at 4oC wrapped in cling-film and placed
in a moist airtight container. Separating gels consisted of a final concentration of 7.5% acryla-
mide/bis-acrylamide (30%), 375mM Tris-HCl (pH 8.8), 0.1% SDS, 0.001% TEMED and
0.005% Ammonium persulphate (APS), and were poured into the casting units to within 0.5-
1.0cm from the bottom edge of the well comb then overlaid with 100% ethanol. The gels were
left to polymerise for about an hour and the ethanol overlay removed once this has occurred.
The stacking gel component of the gel was made immediately prior to electrophoresis. The
stacking gel consists of 4% acrylamide/bis-acrylamide (30%), 125mM Tris-HCl (pH 6.8), 0.1%
SDS, 0.001% TEMED and 0.005% APS and was poured over the separating gel 0.25cm from
the top of the gel kit, the well comb was then inserted before the gel sets. Polymerisation of the
gel takes about an hour. The completed gel running apparatus was then placed into its gel tank
and the upper and lower reservoirs were filled with the appropriate amounts of electrophoresis
buffer which consisted of 25mM Tris-HCl (pH 8.6), 192mM glycine and 0.1 % SDS (w/v). The
lower reservoir was stirred continually. The gels were pre-run at 8mA per gel and pre-cooled to
4oC before use. Prior to loading, wells were flushed with electrophoresis buffer to clear the sam-
ple wells. Samples for electrophoresis that were at concentrations of 1-2mg/ml were diluted 1:1
using 1X Laemmli sample buffer consisting of 2% SDS, 10% gylcerol, 5% 2-mercaptoethanol,
0.002% bromophenol blue and 0.125M Tris-HCl, (pH 6.8). These diluted samples and standards
were then boiled for 3 minutes to denature the proteins and then cooled on ice. 10µl of the

Neill J. Horley Section 2.10.5
Page 109
boiled samples, PB standard (rat microsomes prepared from rats dosed with PB at 80mg/kg) and
10µl of high range (M.W 6,500-205,000) coloured markers were loaded into each lane. Electro-
phoresis was performed using constant current. For stacking the proteins, the gels were run at
8mA per gel until the loading dye had concentrated at the top of the separating gel. The current
was then increased to 16mA per gel until the blue running dye had reached the bottom of the
gel or the yellow dye marker had reached a suitable resolving distance.
Section 2.10.5 Western blotting and immunodetection
10-20µg of micromal protein was separated using denaturing SDS-PAGE on a 7.5% gel as de-
scribed in section 2.10.4. The stacking gel was scraped away from the separating gel and discard-
ed. The separating gel was then transferred onto two pieces of 3MM Whatman blotting paper
pre-soaked with transfer buffer. Transfer buffer consisted of 25mM Tris-HCl, 192mM glycine,
20% methanol (v/v) and 0.1% SDS (w/v). A piece of nitrocellulose (cut to the size of the gel)
was soaked in transfer buffer for 2-3 minutes, then layered over the separating gel, ensuring that
no air bubbles were trapped between the gel and the nitro-cellulose sheet. Two more pieces of
pre-soaked 3MM Whatman blotting paper were placed over the top of the nitro-cellulose sheet
and the resulting ‘sandwich’ was encased in an Electro-transfer cassette. The cassette was placed
into the transfer tank with the gel side of the sandwich closest to the cathode electrode and the
nitro-cellulose side closest to the anode electrode. The tank was filled with transfer buffer and
the proteins transferred to the nitro-cellulose membrane by Electro-transfer in transfer buffer at
4oC and at a constant current of 200mA for 2-3 hours. Tris buffered saline (TBS) consisted of
20mM Tris-HCl (pH 7.5), 500mM NaCL. Blocking solution consisted of 3% gelatin in Tris
buffered saline (TBS) were prepared immediately before transfer was complete. 3% gelatin solu-
tion was prepared by dissolving 3g of gelatin in 100ml of TBS; the solution was heated to 50oC
with stirring. Once the gelatin had dissolved the solution was cooled sufficiently enough to use
for blocking. The Electro-transfer cassette was disassembled once transfer was complete and the

Neill J. Horley Section 2.10.5
Page 110
nitro-cellulose sheet was placed into a plastic tray containing 50ml of blocking solution and
incubated for 2 hours at room temperature. This step ensured the remaining protein binding sites
on the nitro-cellulose surface were blocked. After 2 hours the blocking solution was discarded
and the blot washed twice in 50ml of Tween-Tris buffered saline (TTBS) which consisted of
0.5% Tween 20 (polyoxyethylene-sorbitan monolaurate) in TBS. The blot was then incubated
in 25ml of antibody solution containing rabbit anti-rat CYP2B1/2 (a kind gift from Professor
C.R. Wolf, Dundee) at a 1:1000 dilution in 1.0% gelatin TTBS for 2 hours with rocking. The
primary antibody solution could be used several times, depending on the depletion of the anti-
body so this was retained and stored at -20oC, the blot was then washed twice in 50ml of TTBS.
The blot was then incubated in 30ml of secondary antibody solution containing goat anti-rabbit-
alkaline phosphatase (BioRad Immun-Blot kit Cat no 170-6460) at a 1:3000 dilution in 1%
gelatin TTBS for 2 hours at room temperature with rocking. The secondary antibody solution
was discarded and the blot washed twice in 50ml of TTBS and twice in 50ml of TBS, this last
step was to remove the final traces of Tween 20. The blot was developed using the BioRad
Immun-Blot assay kit. Alkaline phosphatase (AP) reagent A contains nitroblue tetrazolium
(NBT) in aqueous dimethylformamide (DMF), containing magnesium chloride. AP reagent B
contains 5-bromo-4-chloro-3-indolyl phosphate (BCIP) in DMF. Colour development reagents
A and B (0.5ml each) were added to 50ml of colour development solution (CDS) and the blot
incubated at room temperature until purple bands begin to appear. This colour development
generally took about 30 minutes, although blots could be incubated overnight at 4oC if coloured
bands were very faint. Once incubation in the CDS did not intensify the coloured bands further
the CDS was discarded and the blot rinsed thoroughly in distilled water. The blot was dried on
paper towels and stored between 2 sheets of blotting paper in a plastic bag.

Neill J. Horley Section 2.10.5
Page 111
Section 2.11 Lactate dehydrogenase (LDH) assay
This method of LDH assay is a modification of the lactate to pyruvate procedure first reported
by Wacker et al. (1956) and modified later by Gay et al. (1968). The assay is based on the ability
of LDH (EC 1.1.1.27) to catalyse the reduction of pyruvate to L-lactate with simultaneous
oxidaion of NADH to NAD.
Pyruvate + NADH + H+ = L-lactate + NAD+
The change in absorbance at 340nm due to the disappearance of reduced NAD (NADH) over
time is directly proportional to the LDH activity and is measured photometrically. The results of
the LDH assay are expressed in international units per litre (U/L). LDH can be measured in
tissues of various origins, such as liver or kidney. This assay was carried out upon hepatocyte
monolayers and extracted culture medium. Aliquots of the cell culture media (500µl) were
removed at suitable time points during the experiment and stored at 4oC until all samples were
ready to be assayed for LDH activity. At the end of the experiment (48 hours), a final aliquot of
cell culture media was removed and the cell monolayer lysed using 0.6% Triton X-100. This was
carried out to determine the percentage of total intracellular LDH content left in the cell culture
system at 48 hours. The 200µl culture medium samples and the lysed cells were centrifuged at
7000g for 5 minutes. After centrifugation 200µl of the supernatant was removed and placed into
clean eppendorfs ready for LDH assay. LDH assay was carried out using the Unimate 3 LDH
SFBC kit (Roche Products Limited, UK). Reagent R1 consisted of 0.2mM NADH and reagent
R2 consisted of 80mM Tris-HCl buffer (pH 7.2), 1.6mM pyruvate, 200mM NaCl and 0.1%
NaN3. The contents of vial R1 were reconstituted with 6ml of vial R2 (these regents were stable
for 3 weeks at 4oC, or 3 days at 25oC). The assay was carried out using 1ml of combined reagent
R1 and R2, 100µl distilled water and 20µl of sample. The absorbance was read using a Cobas
Fara II centrifugal analyser according to the manufacture’s instructions.

Neill J. Horley Section 2.10.5
Page 112
Section 2.12 Statistical analysis
Data was collected and analysed using Microsoft Excel 5 and mathematical functions undertaken
within the program to determine percentages and standard deviation within groups. Differences
between individual groups were tested by the Student t-Test, with a confidence limit of 95%
using the computer package Instat.
Neill J. Horley Section 3.2.1
Page 113
Chapter 3 Results
Section 3.1 Isolation of primary rat hepatocytes
Primary rat hepatocyte cultures have been used in an attempt to elucidate the molecular processes
involved in regulating the induction of CYP2B1/2 genes by chemicals such as phenobarbital.
Under conventional culture conditions hepatocytes lose their ability to express CYP2B proteins
and are unable to respond to phenobarbital (PB) (Waxman and Azaroff, 1992). The induction of
the CYP2B genes by PB, in our primary rat hepatocyte culture system was investigated using
modifications of standard culture techniques.
In this thesis two modifications of the primary hepatocyte isolation procedure were utilised : -
(i) Primary rat hepatocytes were isolated as described in section 2.6.1 which consisted of the
modified two step in situ perfusion technique as described by Mitchell et al. (1984). Viability was
routinely greater than 85%; preparations of lower viability were discarded. Typically 3.0x10⁸
viable hepatocytes were isolated from 200g-250g male Wistar rats.
(ii) A second hepatocyte isolation protocol was carried out using individual rat liver lobes and
consisted of a modification of the Strom et al. (1982) and the Oldham et al. (1985) isolation
procedures as described in section 2.6.2. This method produced slightly lower yields of typically
8.5x10⁷ viable hepatocytes from the excised livers of two rats; typically isolations of greater than
80% viability were obtained.
Section 3.2 Expression of CYP2B2 mRNA
Section 3.2.1 Generation of a CYP2B2 probe
The CYP2B1 and CYP2B2 genes have 97% DNA sequence identity. To examine the expression
of the CYP2B2 gene a protocol was required with sufficient sequence specificity to distinguish
between transcripts of high sequence similarity. This discrimination was achieved using the
RNAse protection assay. This assay has been shown to detect >50% of single base-pair

Neill J. Horley Section 3.2.1
Page 114
mismatches (Myers et al., 1985). For RNAse protection studies, an RNA probe (riboprobe) was
constructed which contained highly divergent regions of the CYP2B transcripts (Kumar et al.,
1983).
The construct for RNAse protection assays was generated from a rat CYP2B2 cDNA in the
pBR322 vector at the BamH I -EcoR I site (a kind gift from Dr. M. Adesnik, pR17) (Adesnik
et al., 1981; Kumar et al., 1983). This was transformed into DH5α cells and plasmid DNA was
isolated by alkaline lysis mini-preparation. A fragment of the CYP2B family coding region from
1063 bp to 1440 bp was chosen as it contains 17 mismatches between 2B1 and 2B2 out of 379
bases, or 4.6% divergence (Kumar et al., 1983; Fujii-kuriyama et al., 1982). The Bgl II restriction
enzyme sites flanking this region enabled a 379 bp fragment to be excised.
This 379 bp fragment was gel excised as described in section 2.4.10 and sub-cloned into the
cloning vector pGEM-7Zf(+), at the BamH I site, and designated pGEM7-2B2-Xlig (Xlig). The
positive clone generated was then EcoR I/Sac I double digested as a diagnostic test for the
inserted fragment (Figure 3.1).
3kb
506bp394bp344bp
Figure 3.1 A restriction digest of the pGEM7-2B2-Xlig plasmid . DNA was restriction digested withEcoR I and Sac I enzymes and run on a 1.5 % pre-stained 0.1µg/ml ethidium bromide (EtBr) 1xTBE agarose gelat constant voltage of 90V for 2 hours to separate the fragments as described in section 2.4.7. Lane 1 contains1kb ladder. Lane 2 contains EcoRI /Sac I digested pGEM7-2B2-Xlig giving rise to a 379 bp fragment. Lane 3 con-tains the uncut plasmid.
1 2 3

Neill J. Horley Section 3.2.1
Page 115
Sequence analysis of Xlig plasmid using the SP6 primer confirmed that the 379 bp fragment of
the CYP2B2 cDNA was in the correct anti-sense orientation necessary for the generation of an
effective riboprobe. This sequence was compared to the published (Kumar et al., 1983) cDNA
sequence as shown in Figure 3.2 for verification.
28 CAGATCTGGTATGTTGGAGGTATTTTTGCAATGTCACTCTCCTTGGGCGT 77 |||||||||||||||||||||||||||||||||||||||||||||||||| 620 CAGATCTGGTATGTTGGAGGTATTTTTGCAATGTCACTCTCCTTGGGCGT 571 . . . . . 78 GAGGTCAATGTCCTTGGGAGCCAAATGGCTTGACACAGAGAAGTTCTGGA 127 |||||||||||||||||||||||||||||||||||||||||||||||||| 570 GAGGTCAATGTCCTTGGGAGCCAAATGGCTTGACACAGAGAAGTTCTGGA 521 . . . . . 128 GGGTGGTGGTGAAGAAGAGGAACAATTCATTTCGGGCAATGCCTTCGTCA 177 |||||||||||||||||||||||||||||||||||||||||||||||||| 520 GGATGGTGGTGAAGAAGAGGAACAATTCATTTCGGGCAATGCCTTCGTCA 471 . . . . . 178 AGACAAATGCGCTTTCCTGTGGAGAAGGGCATAAAAGCTTCACTCTTTTT 227 |||||||||||||||||||||||||||||||||||||||||||||||||| 470 AGACAAATGCGCTTTCCTGTGGAGAAGGGCATAAAAGCTTCACTCTTTTT 421 . . . . . 228 CAGTGTCCCATCGGCATCCAGGAAGTGCTCAGGATTGAAGGTGTCTGGA 277 ||||||||||||||||||||||||||||||||||||||||||||||||| 420 CAGTGTCCCATCGGCATCCAGGAAGTGCTCAGGATTGAAGGTGTCTGGA 372 . . . . . 278 TGGTCAAAGTACTGTGGGTCATGGAGAGCTGAACTCAGGATGGGATACA 327 ||||||||||||||||||||||||||||||||||||||||||||||||| 371 TGGTCAAAGTACTGTGGGTCATGGAGAGCTGAACTCAGGATGGGATACA 323 . . . . . 328 CCTCAGTGTTCTTGGGGAAGCAGGTACCCTCCGGAACATGGTGTTCTTTG 377 |||||||||||||||||||||||||||||||||||||||||||||||||| 322 CCTCAGTGTTCTTGGGGAAGCAGGTACCCTCCGGAACATGGTGTTCTTTG 276 . . . 378 GTGACTCTGTGTGGTAAACCAATTGGGGCAAGATC 412 ||||||||||||||||||||||||||||||||||| 275 GTGACTCTGTGTGGTAAACCAATTGGGGCAAGATC 241
Figure 3.2 Alignment of CYP2B2 cDNA sequence with Xlig sequence. Purified Xlig CYP2B2 DNA was se-quenced using an SP6 primer on an ABI cycle sequencing kit and the ABI 373A fluorescent Sequencer. CYP2B2 cDNAand Xlig cDNA insert were aligned and compared using the BESTFIT tool with the GCG sequence analysis program(Daresbury). The lower sequence is the published CYP2B2 cDNA sequence (Kumar et al., 1983) and the upper se-quence is the sub-cloned Xlig sequence. Numbering is based on the values quoted in (Kumar et al., 1983) for theCYP2B2 cDNA.
Xlig anti-sense templates were produced by linearising the plasmid by a Cla I digest, which was
visualised on a 1.0 % TBE agarose gel (not shown). The linearised template was prepared and
[α-32P] labelled probes ( riboprobes) were generated by in vitro transcription as described in
section 2.7.8.

Neill J. Horley Section 3.2.2
Page 116
Section 3.2.2 Extraction of RNA
Total RNA was extracted from both PB treated (80mg/kg i.p. for 3 days) and control rat livers,
using the method described in section 2.7.4. Primary cultures of rat hepatocytes were treated for
3 days with 0-1.0mM PB and samples collected as described in section 2.7.5. RNA quantification
was determined by spectroscopy at 260nm and the integrity of the RNA was visualised by
agarose electrophoresis (Figure 3.3). Typically 0.6-0.8mg of RNA was isolated per 1.5g of liver
processed; or 30µg of RNA was produced per tissue culture flask (2x10⁶ cells) used. RNA
produced by these methods gave rise to high purity intact RNA samples, as can be seen in Figure
3.3 where several species of RNA are visible (e.g. 28S, 18S and 5S).
Section 3.2.3 Induction of CYP2B2 RNA by PB
RNAse protection assay was used to examine the expression of CYP2B RNA in both in vitro
and in vivo systems. This technique is able to distinguish between transcripts that exhibit a high
degree of sequence similarity (Myers et al., 1985; Lee and Costow, 1987). Data presented by D.
Bell (Bars et al., 1993) has shown that the RNAse protection assay could be used to discriminate
between CYP2B1 and CYP2B2 RNA species. No data has been presented in this thesis to dem-
onstrate the specificty of the riboprobe for CYP2B2 mRNA. However, based on the data by
28S
18S
5S
1 2 3 4 5 6 7 8
Figure 3.3 Analysis of total primary rat hepatocyte RNA. RNA was prepared from 2x10⁶ rat hepato-cytes and resuspended in 30µl of DEPC water. 2µl of the RNA samples were analysed on a 1.0 % denaturingagarose gel (1x TBE, 0.1 % SDS, 0.1µg/ml EtBr) and run at 70V for 2 hours. Lanes 1-8 contain 2µg of RNA fromeach flask respectively. Arrows indicate 28S, 18S and 5S from top to bottom.

Neill J. Horley Section 3.2.3
Page 117
D. Bell, it is likely that the riboprobe used currently in this assay reflects a specificity for the
CYP2B2 mRNA. An anti-sense riboprobe transcribed from the SP6 polymerase promoter by
in vitro transcription (section 2.7.8) resulted in a transcript of 426 bp which gave rise to a 379 bp
protected fragment. Hybridisation of the riboprobe to RNA, followed by RNAse treatment,
results in a protected fragment corresponding to the RNA duplex complex which is resistant to
RNAse A. The resulting protected fragments were resolved on a denaturing polyacrylamide gel
and visualised by autoradiography. Multiple autoradiograph exposures were taken to ensure the
signal was occurring within the linear range of the film.
RNA was obtained from both in vitro and in vivo samples and treated as detailed in section 2.7.8
and 2.7.10. All samples were treated with 10µg/ml of RNAse A. Yeast tRNA was also included
to demonstrate the specificity of the Xlig probe. The negative control lane (T-ve) indicates that
the probe is full length and intact. However, upon addition of RNAse A the probe is destroyed,
as can be seen in the positive control lane (T+ve). The two bands present in the T+ lane (A1
+A4) are by definition non-specific. The probe produced was intact and full-length, indicating
the absence of any exogenous nuclease contamination (Figure 3.4). Figure 3.4 demonstrates that
CYP2B2 mRNA is highly induced in the liver of PB treated rats but is only present in lower
quantities in the control liver samples. The in vitro samples indicate that our primary rat
hepatocyte culture system supports CYP2B2 induction albeit at a lower level than in vivo. The
band indicated by A3 occurs in both in vitro and in vivo samples. This band was thought to be
primarily due to over-digestion of the 2B2:2B2 hybrids during the RNase A step of the protocol.
The gel is a composite of the protection assay as a number of lanes have been removed between
the T+ve lane and the ladder lanes in the interest of clarity.

Neill J. Horley Section 3.2.4
Page 118
Section 3.2.4 Optimising the RNAse protection assay
The result presented in Figure 3.4 indicated that there was a difference in the intensity of the
response between in vitro and in vivo samples. This was further examined in subsequent protection
assays to determine whether the expression of CYP2B2 mRNA could be optimised. Figure 3.5
demonstrates that the induction of CYP2B2 mRNA was significantly increased above basal levels
when comparing 1.0mM PB and 1.0mM clofibric acid (CFA) induced primary rat hepatocytes
cultures over 3 days. CFA was used in this experiment as it has previously been shown using
Western blotting (Bars et al., 1989) and RNAse protection assays (Bars et al., 1993) to be a strong
CYP2B inducer. Here a distinct protected fragment was present for both chemicals used (A2),
which was absent in the T+ yeast RNA and control hepatocyte lanes. However, once again mul-
tiple protected fragments (A3 +A4) were present at smaller molecular weights. It was thought
T- T+ LadderPB C C PB
A1A2
A3
Figure 3.4 Comparison of in vitro and in vivo PB induced CYP2B2 mRNA samples. RNAse protec-tion assays were carried out on both in vitro and in vivo rat total RNA samples using an [α-32P] labelled anti-senseriboprobe to CYP2B2 cDNA. Hepatocyte monolayers were treated with control or 1.0mM PB for 3 days and RNAharvested as described in section 2.7.5. Rats were dosed with vehicle, PB 80mg/kg i.p. for 3 days and RNA ex-tracted as described in section 2.7.4. Anti-sense CYP2B2 probe was transcribed using a Cla I cut Xlig plasmidwith SP6 polymerase. Full-length Xlig probe was 426 bp in length giving rise to a 379 bp protected fragment. 30µgof total RNA was used for each lane. T+ and T- represent probe incubated with 30µg of yeast tRNA either with orwithout the addition of RNAse A (10µg/ml). RNAse protection assays were run on a 6% denaturing polyacrylamidegel in 1x TBE at 300V for 3 hours. The gel was fixed, dried and exposed to hyperfilm for 3 days at -70oC. ArrowA1 indicates full-length probe. Arrow A2 indicates protected probe-mRNA complex with the accompanying vectorDNA digested away by RNAse A. Arrow A3 + A4 indicates a non-specific protected fragment. The picture is a com-posite as a number of lanes have been removed between the T+ve lane and the ladder lanes in the interest ofclarity.
Probe In vitro In vivo
100bp
200bp
300bp
400bp
A4

Neill J. Horley Section 3.2.4
Page 119
that these bands of variable intensity were the result of hybridisation to other CYP2B species
which would indicate that the probe was not as specific as first believed, or that the probe was
hybridising to other RNA transcripts. Another possibility was that the bands represent over
digestion of the 2B2:2B2 hybrids, during the ribonucease digestion step resulting in cleavage of
the RNA:RNA hybrids (Kaga et al., 1992; Ambion technical documents on http://www.am-
bion.com). This overdigestion may be the result of contaminant DNAses present in the stock
solution of RNAse A.
It was decided that further optimisation of the protection assays was necessary in order to deter-
mine the reason for these artefactual bands that were present at the lower molecular weights.
Various concentrations of RNAse A were investigated for their ability to generate the lower
molecular weight protected fragments. Hepatocytes were dosed with 1.0mM PB for 3 days and
RNA collected for analysis. RNA protection assays were carried out as described in section 2.7.8
and 2.7.10 with RNAse A being used at concentrations ranging from 5µg-1µg/ml. Figure 3.6a
shows a gradual shift of intensity from the low molecular weight bands (Arrow A3 and A4) to an
intensification of the CYP2B2 protected fragment (Arrow A2).
Probe Lad PB CFA C T-T+
Figure 3.5 Expression of CYP2B2 in CFA and PB treated hepatocyte cultures . RNAse protection as-says were carried out on in vitro hepatocyte total RNA samples using an [α−32P] labelled anti-sense riboprobe toCYP2B2 cDNA. Hepatocyte monolayers were treated with control, 1.0mM PB or 1.0mM CFA for 3 days and RNAharvested as described in section 2.7.5. Probe was transcribed as in Figure 3.4. 30µg of total RNA was used foreach lane. T+ and T- represent probe incubated with 30µg of yeast tRNA either with or without the addition of RNAseA (10µg/ml). Lane 1- 1.0mM PB, Lane 2- 1.0mM CFA. Lane 3- Control. Arrow A1 indicates full-length probe. ArrowA2 indicates protected probe-mRNA complex with the accompanying vector DNA digested away by RNAse A. ArrowA3 + A4 are thought to be non-specific protected fragments.
A1
A2
A3
1 2 3
A4

Neill J. Horley Section 3.2.4
Page 120
The lower bands were still quite intense, so a second form of ribonuclease digestion was tested
involving RNAse T1. Again hepatocytes were treated as before and the protection was carried
out as before with various RNAse T1 concentrations from 1unit/µl-100units/µl per 30µg RNA.
Figure 3.6b shows that the protected fragments obtained in this case lacked any of the previous
artefactual lower weight bands. The gradual increase in RNAse T1 concentration also gave rise
to an increase in the protected fragments intensification. Excessive background is present in lane
3 of Figure 3.6b, this is probably due to degradation of the target RNA during the protection
protocol. Based on the results of these two experiments it was decided that only RNAse T1
would be used in all subsequent experiments.
A1A2
A4
1 2 3 4 5
Figure 3.6 Effect of RNAse concentration on RNAse protection for CYP2B2 RNA. Protection assayof CYP2B2 probe against a range of ribonuclease concentrations (a) RNAse A and (b) RNAse T1. Protections wereperformed as in Figure 3.4. Hepatocytes were treated as in Figure 3.5. (a) RNAse A treated samples, Lane 1 con-tains full-length probe. Lane 2 contains 5µg/ml RNAse A. Lane 3 contains 2µg/ml RNAse A. Lane 4 contains 1µg/ml RNAse A. Lane 5 control. The gel shows a slow shift from low molecular weight fragments to the full length pro-tected fragment. (b) RNAse T1 treatment, Lane 1 contains 1 unit RNAse T1. Lane 2 contains 2 units RNAse T1.Lane 3 contains 10 units RNAse T1. Lane 4 contains 25 units RNAse T1. Lane 5 contains 50 units RNAse T1. Lane6 contains 100 units RNAse T1. Lane 7 contains full-length probe.
a.
b. A1
1 2 3 4 5 6 7
A3
A2

Neill J. Horley Section 3.2.5
Page 121
Section 3.2.5 Xenobiotic induction of CYP2B2 mRNA
The induction of CYP2B2 mRNA by various phenobarbital-like inducers was investigated using
the RNAse protection assay. Structurally different xenobiotics such as those shown in Figure 3.7
were applied to primary rat hepatocyte cultures. Analysis of CYP2B mRNA induction by
RNAse protection assay allowed determination of whether a range of dissimilar compounds
induced CYP2B mRNA.
Rat hepatocytes were dosed for 3 days with three compounds at 25µM and the induction of
CYP2B2 mRNA was directly compared with the known CY2B inducer PB. Figure 3.8 shows
that of the three compounds tested, only two were shown to be CYP2B2 inducers. The chemical
structures of the three Glaxo-Wellcome compounds are very different from that of PB. The re-
sult presented in Figure 3.8 shows that the induction of CYP2B mRNA was not dependent upon
one specific chemical structure. The comparison of the induction of CYP2B2 mRNA by PB,
a. b.
c. d.
Figure 3.7 Structure of phenobarbital and possible phenobarbital-like inducers.
a. Phenobarbital. b. GWX. c. GWY. d. GWZ.

Neill J. Horley Section 3.2.6
Page 122
GWX, GWY and GWZ treated hepatocytes shows that the Glaxo-Wellcome compounds GWY
and GWZ do elicit CYP2B2 induction at the mRNA level. This induction occurs in the µM
dose range for the Glaxo-Wellcome compounds and in the mM range for PB. The data also sug-
gests that the two drugs that induce CYP2B2 do so at a level comparable to PB. The absence of
intense bands at smaller molecular weights indicates that the artefactual bands present in earlier
experiments were due to RNAse A contamination.
.
Section 3.2.6 Characterisation of the CYP2B2 response by various xenobiotics
Section 3.2.6.1 Dose response curves of four xenobiotics
The data presented thus far demonstrates that the current in vitro system supports CYP2B2 in-
duction at the mRNA level and that differential induction can be monitored using the RNAse
protection system. To further characterise the effectiveness of this system, dose response curves
were constructed for four structurally dissimilar compounds. The results of these response curves
are shown in Figures 3.9-3.12. The first compound to be tested was that of the known CYP2B2
1 2 3 4 5 6 7 8 9 10
200bp
300bp
400bpA2
Figure 3.8 Comparison of CYP2B2 induction. Hepatocytes were cultured for 3 days in the presence of25µM of each drug or 1.0mM PB. 30µg of RNA was isolated and a protection assay carried out as in Figure 3.4,except in this case 15 units of RNAse T1 was used. RNAse protection assays were run on a 6% denaturing poly-acrylamide gel in 1x TBE at 280V for 3 hours. The gel was fixed, dried and exposed to hyperfilm for 3 days at -70oC.Lane 1 full-length probe. Lane 2 yeast tRNA without RNAse T1. Lane 3 yeast tRNA with RNAse T1. Lane 4 25µMdrug GWX. Lane 5 25µM drug GWY. Lane 6 25µM drug GWZ. Lane 7 control. Lane 8 the drug vehicle DMSO. Lane9 1.0mM PB. Lane 10 100bp ladder. Arrow A2 indicates protected fragment.

Neill J. Horley Section 3.2.6
Page 123
inducer PB (see Figure 3.9). This dose response shows that the basal level of CYP2B2 is too faint
to be identified. The same is not true for the PB induced cultures, even at 0.1mM there is a
highly induced level of CYP2B2 present.
Figure 3.10 shows the dose response for CFA. This ranges from 0-1.0mM with a visible induc-
tion occurring at 0.05mM and steadily increasing to a maximal at 1.0mM. CFA does not dissolve
directly into CL15 media (like PB) and so must be dissolved in DMSO; this protection assay
shows that DMSO has no effect on CYP2B2 induction.
200bp
300bp
400bp
2 3 4 5 6 7 8 9 101
A2
Figure 3.9 Dose response for PB. Hepatocytes were cultured for 3 days in the presence of various concen-trations of PB. CYP2B2 mRNA induction was measured as previously by RNAse protection assays using 15 units ofRNAse T1. RNAse protection assays were run on a 6% denaturing polyacrylamide gel in 1x TBE at 280V for 3 hours.The gel was fixed, dried and exposed to hyperfilm for 3 days at -70 oC. Lane 1 Probe. Lane 2 T-ve. Lane 3 T+ve.Lane 4 control. Lane 5 0.1mM. Lane 6 0.25mM. Lane 7 0.5mM. Lane 8 1.0mM. Lane 9 Probe. Lane 10 100bpladder. Arrow A2 indicates protected fragment.

Neill J. Horley Section 3.2.6
Page 124
Figure 3.11 shows the dose response for the Glaxo-Wellcome candidate drug GWY. The
potency of this drug is far greater than that of the classical CYP2B2 inducer, PB, with a response
occurring at 1.0µM. This response increases in intensity up to a maximal at 25µM, diminishing
at 50µM possible due to cytotoxicity.
200bp
300bp
400bp
1 2 3 4 5 6 7 8 9 10 11 12Figure 3.10 Dose response for CFA. Hepatocytes were cultured for 3 days in the presence of various concen-trations of CFA. CYP2B2 mRNA induction was measured as previously by RNAse protection assays using 15 unitsof RNAse T1. RNAse protection assays were run on a 6% denaturing polyacrylamide gel in 1x TBE at 280V for 3hours. The gel was fixed, dried and exposed to hyperfilm for 3 days at -70 oC. Lane 1 Probe. Lane 2 T-ve. Lane 3T+ve. Lane 4 control. Lane 5 DMSO. Lane 6 0.05mM. Lane 7 0.1mM. Lane 8 0.25mM. Lane 9 0.5mM. Lane 101.0mM. Lane 11 1.0mM PB. Lane 12 100bp ladder. Arrow A2 indicates protected fragment.
A2
200bp
300bp
400bp
1 2 3 4 5 6 7 8 9 10Figure 3.11 Dose response for GWY. Hepatocytes were cultured for 3 days in the presence of various con-centrations of GWY. CYP2B2 mRNA induction was measured as previously by RNAse protection assays using 15units of RNAse T1. RNAse protection assays were run on a 6% denaturing polyacrylamide gel in 1x TBE at 280Vfor 3 hours. The gel was fixed, dried and exposed to hyperfilm for 3 days at -70 oC. Lane 1 Probe. Lane 2 T+ve.Lane 3 T-ve. Lane 4 DMSO. Lane 5 1µM. Lane 6 5µM. Lane 7 10µM. Lane 8 25µM. Lane 9 50µM. Lane 10 100bpladder. Arrow A1 indicates full lenght probe. Arrow A2 indicates protected fragment.
A1
A2

Neill J. Horley Section 3.2.6
Page 125
Figure 3.12 shows the final dose response for the Glaxo-Wellcome candidate drug GWZ. This
final compound appears to have the greatest potency of all with a response visible at 1.0µM
increasing to a maximal at 5-10µM, rapidly tailing off thereafter. With all of the candidate drugs
minimal signal with hepatocytes treated with DMSO was apparent.
Section 3.2.6.2 Time course of CYP2B2 mRNA induced by PB
Results obtained from the dose response of PB indicated that a concentration of 1.0mM PB
would elicit a strong response in the cultured hepatocytes. This concentration was subsequently
used to determine the time course of the CYP2B2 induction by PB. Hepatocytes were dosed
with 1.0mM PB from 0-72 hours and the CYP2B2 induction determined by RNAse protection
assays as shown in Figure 3.13. The dose response showed that CYP2B2 induction does not
increase above basal levels until 24 hours and increases to a maximum at 48 hours before the
response begins to decrease. Bands present in the T+ve lane are non-specific.
1 2 3 4 5 6 7 8Figure 3.12 Dose response for GWZ. Hepatocytes were cultured for 3 days in the presence of various con-centrations of GWZ. CYP2B2 mRNA induction was measured as previously by RNAse protection assays using 15units of RNAse T1. RNAse protection assays were run on a 6% denaturing polyacrylamide gel in 1x TBE at 280V for3 hours. The gel was fixed, dried and exposed to hyperfilm for 3 days at -70 oC. Lane 1 Probe. Lane 2 100bp ladderLane 3 DMSO. Lane 4 50µM. Lane 5 25µM. Lane 6 10µM. Lane 7 5.0µM. Lane 8 1.0µM. Arrow A1 indicates fulllenght probe. Arrow A2 indicates protected fragment.
200bp
300bp
400bp A1
A2

Neill J. Horley Section 3.2.6
Page 126
Section 3.3 Expression and induction of CYP2B proteins
Many groups have reported that specific culture conditions are required for CYP2B induction
to occur (Waxman et al., 1990; Sinclair et al., 1990; Sidhu et al., 1993). Western blotting was
employed to investigate whether the observed increase in CYP2B mRNA was reflected in a cor-
responding increase in CYP2B protein in our hepatocyte culture system. Here a comparison
between the media used by our group (CL15) and Chee’s media was made. Chee’s media has
been shown to support PB-mediated induction of CYP2B genes by many groups (Waxman
et al., 1990; Trottier et al., 1995). Hepatocytes were cultured for 3 days in the presence of
0.5-1.0mM PB in either CL15 or Chee’s medium. Rat hepatocyte microsomes were prepared
as detailed in section 2.10.1 and CYP2B proteins were separated by electrophoresis through a
7.5% SDS-PAGE prior to electro-blotting onto a nitrocellulose filter. CYP2B protein was
detected using a rabbit anti-rat CYP2B1/2 and a goat anti-rabbit alkaline phosphatase kit.
Figure 3.14 demonstrates that a protein of approximately 50 kDa is detected by the antiserum
against CYP2B. This result shows that the induction of CYP2B protein in PB induced hepato-
cytes in our culture system is comparable to the levels obtained with CHEE’s media. The level
of CYP2B protein expressed in the cultured samples appears to be at a lower level than the
1 2 3 4 5 6 7 8 9 10 11 12 13Figure 3.13 Time course of induction of CYP2B2 mRNA by 1.0mM PB. Hepatocytes were cultured inthe presence of 1.0mM PB over 72 hours. CYP2B2 mRNA was obtained at the intervals shown in the protection,and induction was measured as previously by RNAse protection assays using 15 units of RNAse T1. Lane 1 probe.Lane 2 T-ve. Lane 3 T+ve. Lane 4 Control (Con) 0 hrs. Lane 5 PB 6 hrs. Lane 6 Con 6 hrs. Lane 7 PB 24 hrs. Lane8 Con 24 hrs. Lane 9 PB 48 hrs. Lane 10 Con 48 hrs. Lane 11 PB 72 hrs. Lane 12 Con 72 hrs. Lane 13 100bpladder. Arrow A2 indicates position of protected fragment. The picture is a composite, as a number of lanes havebeen removed in the interest of clarity.
A2

Neill J. Horley Section 3.2.6
Page 127
80mg/kg PB in vivo rat liver microsome standard. Thus, the CYP2B protein induction presented
here mirrors that observed for the CYP2B mRNA.
Section 3.4 Analysis of the 5’ flanking region of the rat CYP2B2 gene
Hardwick et al. (1983) has shown that the transcription of the gene encoding CYP2B2 in the rat
liver is induced upon treatment with PB. In order to understand the mechanism of CYP2B2
gene regulation that is occurring at the level of transcription, it is necessary to determine the roles
of both cis and trans acting factors that may interact with the CYP2B2 DNA. The sequencing
and cloning of the 5’flanking region of the CYP2B2 gene would enable an examination of the
elements present and an understanding of the roles that they may play.
CYP2B1 and CYP2B2 comprise the two major PB-inducible genes in the CYP2B subfamily.
However, 6 to 8 additional rat genes showing sequence similarity to CYP2B1/2 cDNAs have
been identified (Atchison and Adesnik, 1983; Adesnik and Atcinson, 1986; Mizukami et al.,
1983; Labbe et al., 1988). Hence, it was necessary to confirm the 5’ flanking sequence of our
CYP2B2-like gene. This sequence could then be compared to that of other published CYP2B2
gene sequences, so that a comprehensive analysis of the promoter region of the CYP2B2 gene
50KDa
1 2 3 4 5 6
Figure 3.14 Western blot analysis of CYP2B induction. Rat hepatocytes were cultured as described insection 2.6.4 with either CL15 or CHEE’s medium and exposed to PB for 72 hours. Microsomal protein was pre-pared from these cultures (8x10⁶ cells each sample) and 10µg run on a 7.5% SDS-polyacrylamide gel and blottedonto a nitrocellulose membrane. This membrane was then probed by western blotting using a rabbit anti-ratCYP2B1/2 antibody (1:1000) and goat anti-rabbit alkaline phosphatase antibody (1:3000) as described in sec-tion 2.10.5. Lane 1-2 Microsome (10µg) prepared from 1.0mM PB and control hepatocytes cultured in CL15 me-dia. Lane 3-5 Microsome (10µg) prepared from control, 0.5mM and 1.0mM PB treated hepatocytes cultured inChees media. Lane 6 in vivo (80mg/kg, i.p. dosed) PB induced rat liver microsome standard (10µg). Molecularweight of detected protein is indicated by an arrow and is at about 50 kDa as determined by Rainbow molecularweight markers (Sigma), not shown in figure as bands are too faint to detect when scanned.

Neill J. Horley Section 3.2.6
Page 128
could be made.
A clone designated λH5b1 was isolated from the library and shown to contain an 11.7 kb EcoR
I DNA insert containing the 5’ flanking region of a CYP2B2-like gene. A pUC19 vector was
linearised with the restriction endonuclease EcoR I and the 11.7 kb λ fragment was ligated into
the pUC19 vector at the EcoR I polylinker site (Dr D.R. Bell, Ph.D Thesis 1988, University of
London). This was designated the CYP2B2 construct. This CYP2B2 construct (a kind gift from
Dr Lesley Forrest) was transformed into XL-1 Blue E.coli cells and plasmid DNA isolated so se-
quencing of the promoter region could be carried out. Figure 3.15 confirms the presence of the
11.7 kb insert with an EcoR I endonuclease digest giving rise to the insert plus the 3 kb vector.
Once the CYP2B2 construct had been Qiagen miniprepped it was sequenced as described in
section 2.4.13 + 2.4.14. The 5’ flanking sequence was determined using primers designed
initially from published data (Jaiswal et al., 1987). Automated fluorescent sequencing using
oligonucleotide walking was used to obtain subsequent sequence data. Sequencing errors were
minimised by sequencing on both the forward and reverse strands of the gene, followed by
manual evaluation of the fluorescent sequence. Table 3.1 shows the primers used to achieve the
1.3 kb of CYP2B2 sequence.
Figure 3.15 A confirmation EcoR I digest of the CYP2B2 construct. CYP2B2 DNA was restriction di-gested with EcoR I enzyme to confirm that the 11.7 kb insert was present and run on a 0.6 % pre-stained 0.1µg/ml EtBr, 1xTBE agarose gel at constant voltage of 90V for 2 hours to separate the fragments as described in sec-tion 2.4.7. Lane 1 1kb ladder. Lane 2 CYP2B2 construct uncut. Lane 3 EcoR1 digested CYP2B2 construct givingrise to 11.7 kb insert.
3.0 kb
1.6 kb
1.0 kb
1 2 3

Neill J. Horley Section 3.2.6
Page 129
The sequence data obtained from oligonucleotide walking was compiled to give 1.3 kb of
consensus CYP2B2 DNA. Figure 3.16a shows a cartoon summarising the position of each primer
in Table 3.1 and the approximate length of sequence obtained. Figure 3.16b shows a physical
map of the CYP2B2 5’flanking region outlining some of the restriction sites used in subsequent
sub-cloning strategies.
Name Primer design 5’-3’ DerivationSequence obtained
F1 caccagcccaccactacagtg Known sequence 531
F2 ggtggcaggacacttagagga Known sequence 374
F3 ccatttacagctcagactggcc F2 sequence 415
F4 ggtcttagacaaggtctccc F3 sequence 330
F5 cctgagctggactccagtgcc F4 sequence 361
F6 cctctctgtacttctgtc Consensus sequence 400
F7 gccatctgggaccctggtgcatg F5 sequence 233
R1 cattgcaggggaggtatgac F2 sequence 475
R2 ccagcagtggacatgccagag F3 sequence 407
R3 ggcactggagtccagctcagg F4 sequence 307
R4 caatgcctttctggatcgtgg F5 sequence 342
R5 ctttcaactgttcctctgggc F7 sequence 260
R6 gagcccccatgcaccagggtc R4 sequence 270
Table 3.1 Primers used to determine the CYP2B2 5’flanking sequence. Primers were designedfor use in automated fluorescent sequencing and designated either F or R with regards to the forward or reversedirection of sequencing. The fourth column denoted the length of sequence obtained with each sequence run.Sequencing was carried out as detailed in section 2.4.13 + 2.4.14.

Neill J. Horley Section 3.2.6
Page 130
The promoter region of the CYP2B2 gene whose sequence covers nucleotides -1047 to -2714
bp was determined. This 5’ flanking sequence was elucidated by sequence data derived from the
primer directed sequencing strategy. Using GELMERGE and GELASSEMBLE tools within the
F7
F6
F5
F3
F1
F2
F4
R1R2
R3
R4
R5
R6
a.
Published sequence Jaiswal et al., 1987
500 bp
PBRE
end of data
-1.1kb -1.0kb
Xh S N S Xm E X Hb.
Figure 3.16 Sequencing strategy for the CYP2B2 5’ flanking sequence. (a). A cartoon of the CYP2B2gene is shown indicating the primers used to determine its sequence in both the forward and reverse direction byoligonucleotide-directed automated sequencing. Arrows indicate direction and approximate length of sequencingwith primer names shown beside each arrow. (b). The physical map of the 5’flanking region of the CYP2B2 geneis shown. This diagram shows the gene from 1047 bp to 2714 bp upstream including some of the restriction sitesused in subsequent sub-cloning strategies. Blank box indicates approximate position of the putative PB responseelement (PBRE). Restriction sites are labelled thus H: HindIII, X: XbaI, E: EcoRV, Xm: XmnI, S: Sau3AI, N: NcoI, Xh:XhoI. Diagram not to scale.

Neill J. Horley Section 3.2.6
Page 131
GCG analysis program, the 1663 nucleotide sequence data was assembled into a single
contiguous sequence. The sequence of the CYP2B2 genomic DNA determined by automated
sequencing is shown in Figure 3.17. Position 1047 is 1047 bp downstream from the CYP2B2
transcription start site. The sequence of bases 1047-1395 bp is published data (Jaiswal et al., 1987).
However, repeat sequencing within this area served to verify that our isolated fragment was in
agreement with the published data.
The CYP2B2 sequence was compared to the nucleotide sequence of the published 5’ flanking
regions of the CYP2B2 gene (Jaiswal et al., 1987; Hoffman et al., 1992) in Figure 3.17. The data
presented here highlights the need to sequence the 5’ flanking region of the CYP2B2 gene, so
that the discrepancies in data published thus far by different groups can be resolved. In the data
presented in Figure 3.17 the presence of a * below a nucleotide indicates a base-pair mismatch,
here present at -2676 bp where this sequence shows a G nucleotide instead of the published C
nucleotide (Hoffman et al., 1992). The presence of a dot (.) in the place of a nucleotide or below
a nucleotide indicates an area of sequence where a deletion or an insertion has occurred
respectively in comparison to Hoffman’s data. Here, insertions are present at -1876 bp (A) and
-1527 bp (G). A row of three extra bases at -2423 bp (GAG) is present in Hoffman’s data
(Hoffman et al., 1992). The deletion of a T residue at -2226 bp in our data is in agreement with
that of Stoltz et al. (1998). A (+) indicates an unresolved nucleotide in Hoffman’s data, these are
present at -1447, -1353, and -1264 bp and consist of G nucleotides in our sequence. These G
nucleotides are in agreement with data published by Jaiswal et al. (1987).

Neill J. Horley Section 3.2.6
Page 132
2713 GGGGGACATG TTTTTCTGTT TTCTTTCAGC CAGTTATGGG AACAGTGTGT 2664
2663 TCTACTTTCA GTCATGTAGT TTTTCTTGTC TACAGGTCTT CAACTGTTCC 2614
2613 TCTGGGCCTG TGTCCTGAGT CCACCTGGCA GGTGGCTTGG AGCAGAAAAG 2564
2563 TTGGTCTTAC CTGTGGTCCT GAGTCTCAAG TTTGGTGGTG GGGTGTTGCT 2514
2513 GATGAGCTGT CCTCGAGGGC AGCAACCAGC AGGACCTGGG CTTCCCTTTC 2464
2463 TGGGAGCCCC CATGCACCAG GGTCCCAGAT GGCATTTGAC ... AGAGAGA 2417
2416 GAGAGAGAGA GAGAGAGAGA GAGAGAGAGA GAGAGAGAGG GAGGGAGGGA 2367
2366 GGGAGAGGAT GCAGCAACCT TTTTGTGATG TTCAGCCAAT GCCTTTCTGG 2317
2316 ATCGTGGACA CAACCTTCAA GAAGTGCACT TCAGTGACCT AGGGGGAAGG 2267
2266 TCAGAAAACC ATGGTGATTT CAGGCACAGA CTCTGTACTT T. CCTGACCT 2218
2217 TGGCACAGTG CCACCATCAA CTTGACTGAC ACCAGGACCT TGCTCCTGCC 2168
2167 AGGCTGGGTG ATCTGGCACT GAAGTCCAGC TCAGGGTTCC CAGTGGGAGC 2118
2117 CATGAGGTGC ATTCCATGCA GACACTGATG CAGTCTTCAC ATTTTGGAGA 2068
2067 GGTATATTGC CTTCACCTAT TAATAGACAG AAGTACAGAG AGGTTAAGAA 2018
2017 TGTTTTCTAA GGTCACACAG TGGATTAGAA CTACAATGCA CACATGATAG 1968
1967 CTACTTTCTA AACATGACCA TCAAGTCCTT GAAATGTTCC AGATGTGGTA 1918
1917 GCACACGTCT GTAGTCCCAG CAGTGGACAG GCCAGAGGAG AACATTATAA 1868
1867 ATTGAAGGCC AGCCTGGGAT ATATAGGGAG ACCTTGTCTA AGACAAACAG 1818
1817 ATGAAGAGTC CAACCAATGC ATTTAAAATG TTCGATGGTT TGAACCTATT 1768
1767 TACTTCAGAA GTTGAGGCAA GTTGACCACA AGTTACAGGC CAGTCTGAGC 1718
1717 TGTAAATGGA GACCTACAAC AGATAGTTGA GTATGATATC ACGAACCTGT 1668
1667 AATTCTTACA CTTGGGAGTT AGAGGCAGAA GGACCAGGAG TTCAAAGCTA 1618
1617 ACCTGTGATA CAAAGCAACT GAGAAGAAGG ATTTATTTTT TCTTAGTTTC 1568
GR*
SREB1
ER7
GR NR1
NF1 AF1 NR2
.
HNF-3
C/EBP

Neill J. Horley Section 3.2.6
Page 133
To further understand the regulation of the CYP2B2 gene, the promoter region of the gene was
analysed for any transcription factor binding sites and other putative regulatory motifs (Figure
3.17). By utilising the Transcription Element Search Software (TESS) and the Transfac database
(threshold, 0.85), the search revealed the presence of several putative protein factor binding sites.
These sites may serve as cis acting elements for transcription, with many sequences resembling
the binding sites for transcription factors including Sp1, AP1, C/EBP, HNF-3, HNF-4, and GR
present.
1567 ATTGCAGGGG AGGTATGACA TTTGGGGCTT TGGTCTAGAT GTGGGAGCTT 1518
1517 GTGGTTGTTT CTCTATATGG CAGATGGAAC AAGGAGGAGG AAGAGGATAT 1468
1467 ATGTTTATAT GTAGTGGATT TGTGACTCAT TAGGTTGACT CCAAGAATCT 1418
1417 GCTTCTTTCT TGCAAGCTTT TCCTCTAAGT GTCCTGCCAC CCCCCACCCC 1368
1367 AATAATATCA GTTAGGGTAC AAAGTGTTCA AACATGAACT TCTGAGACAG 1318
1317 ATTTCACATT CAAATAGAAC ACATTATGAA TAGATTAATG TTATCACTGT 1268
1267 AGTGGTGGGC TGGTGAAGAA TGTTCAATTC CTTTTAGCAA GATGGAAGGT 1218
1217 CAAAGAACTT CCTGTGCTAT GAACAAATCA GAAGGATGAA GGGAACCATT 1168
1167 TGTCATTAGA CACAGTGTTC AGAGACTATC TTTGTTAGGT TCACTATTTC 1118
1117 TGTGATAAAA CCTCACAGCA GAAAGCAACT TGGGGAAAAG GGTTTATTTT 1068
1067 GCTTGCACTT TACAGTTTGT C 1047
.
AP1+
Sp1
GR+
Sp1
+C/EBP HNF-4
GR
Figure 3.17 Nucleotide sequence of the 5’ flanking region of the PB-inducible CYP2B2 gene . Thesequence shown is 1047 bp downstream of the transcription start site, of which 1.3 kb is beyond that publishedby Jaiswal et al., 1987. Purified DNA was sequenced using an ABI cycle sequencing kit and an ABI 373A fluores-cent sequencer. Areas of mismatch have been resolved by sequencing in both directions. The sequence shownis that derived from the primer directed sequence strategy and has been compared to that of the data publishedby Hoffman et al., 1992. Where base-pair mismatches in sequence occur a * appears. A dot (.) indicates an areaof sequence where either a deletion or insertion has occurred. A (+) indicates a matching of a nucleotide with anarea in the published data where the nucleotide has not been resolved. Position 1047 is 1047 bp downstreamfrom the CYP2B2 transcription start site. Putative regulatory motifs are underlined and include: GR = glucocorti-coid response element. SREBP = sterol regulatory element binding protein. ER = everted repeat. NR = nuclearreceptors. NF1 =nuclear factor binding site. AF1 = accessory factor binding site. HNF = hepatocyte nuclear factor.C/EBP = CCAAT enhancer binding protein. Sp1 = transcription factor binding sites.

Neill J. Horley Section 3.2.6
Page 134
Upon closer inspection of the 5’ flanking sequence, within the section which has been reported
to confer PB-responsiveness (Honkakoski and Negishi, 1997; Troittier et al., 1995; Sueyoshi et
al., 1999), the PB-responsive enhancer module (PBREM) was found to be present. The
PBREM present at -2318 to -2155 bp was shown to contain multiple potential enhancer
elements, the central core consisting of a Nuclear Factor 1 binding site (NF1) (TGGN7CCA on
the sense strand) at - 2218 to -2205 bp. This NF1 element was flanked on both sides by accessory
elements such as the downstream (AF1) accessory factor 1 element and the upstream glucocor-
ticoid response element (GR). Two Nuclear receptor binding motifs (AGGTCA) designated
NR1 and NR2 (dashed lines) are found flanking either side of the NF1 core element
(Honkakoski et al., 1998b.). A section of the 5’ flanking region was shown to contain two sets
of repeat sequences which comprised of an alternating purines (GA)21 section followed by a
(GGGA)4 repeat sequence. The AP1 site present at -1441 bp is also in agreement with data
presented by Roe et al. (1996). It is not known if the GR at -2664 to -2682 bp and the sterol
regulatory element binding protein at -2523 to -2534 bp have any significance in the PB
response.
Once the 5’ flanking sequence of the CYP2B gene had been determined it was then possible to
construct reporter genes containing sections of the PBREM region. These reporter genes would
enable us to determine and dissect the significance of each of the response elements upon PB
mediated CYP2B induction.

Neill J. Horley Section 3.2.6
Page 135
Section 3.5 Isolation of the CYP2B2 putative PB response element (PBRE)
Trottier et al. (1995) localised a phenobarbital-responsive element (PBRE) in the 5’ flanking
region of the rat CYP2B2 gene. This work was also mirrored by the localisation of the phenobar-
bital responsive enhancer module (PBREM) in the mouse Cyp2b10 gene by Honkakoski and
Negishi (1997). Based on the data presented by these groups and coupled to the elucidation of
the full restriction map of the 5’ flanking region, it was possible to devise a sub-cloning strategy
to further characterise the PBRE/PBREM. The PBRE has been localised to a 163 bp Sau3AI
flanked region situated 2155-2318 bp upstream from the rat CYP2B2 transcription start site. Us-
ing the map shown in Figure 3.16b it was possible to isolate a 969 bp fragment using Xba I/Xho
I digest of the pUC19-CYP2B2 construct (Figure 3.18) which included the putative PBRE.
.
Multiple bands were obtained from the Xba I/ Xho I digest, so each band was Gene-cleaned and
ligated into the alkaline phosphatased Xba I/Xho I site of the pGEM-7 vector. Only with the
lowest extracted band was the XXpGem7 clone produced. The 969 bp insert was cut out of
1 2 3 4 5
Excised
bands1 - 4
Figure 3.18 Restriction digest of the 969 bp PBRE containing region. DNA was restriction digestedwith Xba I and Xho I enzymes and run on a 1.5 % pre-stained 0.1µg/ml EtBr, 1xTBE agarose gel at constant voltageof 70V for 2 hours to separate the fragments of the pUC19-CYP2B2 DNA. Lane 1 1 kb+ ladder. Lane 2 Xba I/XhoI digest. Lane 3 Xba I digest. Lane 4 Xho I digest. Lane 5 uncut plasmid. Arrow 1-4 indicated fragments that wereGene-cleaned and used for sub-cloning.

Neill J. Horley Section 3.2.6
Page 136
XXpGEM7 using a Kpn I/Xba I digest and cloned into the Kpn I/ Nhe I cut pGL3-promoter
vector, producing the clone 1Kb-Pluc. Diagnostic restriction digests as shown by Figure 3.19
verified this 1Kb-Pluc clone contained the 969 bp. A cartoon of this sub-cloning strategy is given
in Figure 3.20a This clone was then sequenced using the primer RVP3 5’ CTT TAT GTT TTT
GGC GTC TTC 3’ as confirmation of the clone’s integrity.
1 2 3 4 5
1
Figure 3.19 Restriction digest of the 1Kb-Pluc clone. 1Kb-Pluc DNA was restriction digested with Xba Iand Xho I enzymes and run on a 1.5 % pre-stained 0.1µg/ml EtBr, 1xTBE agarose gel at constant voltage of 70Vfor 2 hours to show the presence of the Xba I/Xho I fragment from 1Kb-Pluc. Lane 1 1 kb+ ladder. Lane 2 Xba I/Xho I digest. Lane 3 Xba I digest. Lane 4 Xho I digest. Lane 5 uncut plasmid. Arrow 1 indicates the PBRE containingfragment.

Neill J. Horley Section 3.2.6
Page 137
Figure 3.20 Cartoon depicting the sub-cloning of the PBRE containing CYP2B2 plasmids.
(a) Generation of the 1Kb-Pluc plasmid. (b) Generation of the 163bp-Pluc plasmids. Thin lines represent cloningvectors. Dark thick arrow represents the CYP2B2 gene fragment.
2B2-PUC19
Initial pUC19 cloning vector
1 kb CYP2B2 excised fragment
XXpGEM-7
the XXpGEM7 vector
1Kb-Pluc
Kpn I-Nhe I double digest
the 1Kb-Pluc luciferase reporter
XXpGEM 7
Mbo I digest of XXpGEM7 vector
163bp-Plucthe 163bp-Pluc luciferase vector
a.
b.
containing 12 kb of the CYP2B2gene.
using Xba I-Xho I digest
+
Ligated into Xba I-Xho I digested
pGEM7
results in the production of
+Ligation into Kpn I-Nhe I
digested pGL3-promoter vector
results in the production of
vector
gives rise to 163 bp CYP2B2fragment
Ligation into BgL II digested
pGL3-promoter vector
results in the production of

Neill J. Horley Section 3.5.1
Page 138
Section 3.5.1 Truncation of the 969 bp CYP2B2 fragment
The 1Kb Pluc clone was further truncated so that the 163 bp putative PBRE element could be
examined using transfection protocols. The XXpGEM7 clone was restriction digested with a
Xba I/Xho I digest, which gave rise to a 969 bp fragment. This fragment was further restriction
digested using Mbo I, This restriction digest gave rise to a 163 bp Sau3AI flanked putative PBRE
fragment (163SAI). This 163SAI fragment was ligated into the Bgl II site of the pGL3-promoter
vector which gave rise to the 163 bp-Pluc clone (Figure 3.20b). Candidate clones were verified
using an Nco I digest (Figure 3.21). Depending upon the orientation of the fragment, two
different size fragments were produced of either 300 or 347 bp. Clones were sequenced using
the primer RVP3 5’ CTT TAT GTT TTT GGC GTC TTC 3’, three clones 163bp-D-Pluc,
163bp-G-Pluc and 163bp-M-Pluc were confirmed as containing the 163 bp PBRE. The clones
163bp-M-Pluc and 163bp-G-Pluc were shown to contain CYP2B2 sequence present in the
reverse orientation. Transfection procedures could now be carried out upon the 1Kb-Pluc and
163bp-Pluc clones.
1 2 3 4 5 6 7 8 9 10 11
500 bp396 bp
344 bp
Figure 3.21 Restriction digest of the 1Kb-Pluc clone. 163 bp-Pluc DNA were digested with Nco I restric-tion enzyme and run on a 2.0 % pre-stained 0.1µg/ml EtBr, 1xTBE agarose gel at constant voltage of 70V for 2hours to show the presence of the 300/347 bp Nco I fragment from 163 bp-Pluc. Lane 1 1 kb ladder. Lane2,4,6,8,10 uncut plasmids. Lane 3,5,7,9,11 Nco I cut plasmids. Each clone has a letter attached to it correspond-ing to each of the 24 colonies picked. Plasmids 163 bp-M-Pluc, 163 bp-D-Pluc, 163 bp-G-Pluc were shown to containthe correct fragments as confirmed by sequence analysis.
Neill J. Horley Section 3.6.1
Page 139
Section 3.6 Optimisation of transfection of primary hepatocytes
A protocol for the transfection of primary rat hepatocytes was established so that characterisation
of the PBRE could be undertaken. Although several transfection methods have been developed
e.g. calcium phosphate, electroporation and liposome fusion (Watannabe et al., 1994), it is
generally considered difficult to transfect DNA into primary rat hepatocytes. Optimisation of
transfection efficiency was necessary to determine the important variables present in the system.
By minimising variation in the number of parameters, it should be possible to derive a
reproducible system for the induction of the CYP2B2 gene.
Preliminary data showed that transfection efficiency was greatly retarded by the presence of high
salt concentrations in the DNA or by poor quality DNA. The presence of fetal calf serum in the
transfection medium was also shown to reduce transfection efficiency, possibly by preventing
DNA: liposome complex formation. The effects of temperature and duration of DNA: liposome
complex formation was shown to have negligible effects on transfection efficiency (data not
shown).
Section 3.6.1 Effect of concentration of DOTMA/DOPE on transfection effi-ciency
In this system, we have chosen a non-commercial form of lipofectin reagent designated DOT-
MA/DOPE. This reagent was prepared as detailed in section 2.8.1. In preliminary experiments,
the reporter vector pRSV-β-GAL was used as the source of plasmid DNA, as its uptake into
hepatocytes could be monitored by the expression of β-galactosidase using a simple histochem-
ical assay. Primary rat hepatocytes were isolated and transfected as described in section 2.8.3 with
various modifications made as detailed in each experiment. pRSV-β-GAL plasmid concentration
was kept constant at 6µg/flask whilst DOTMA/DOPE concentrations (0-80µg/flask) were
altered to determine the effect on transfection efficiency. Transfection efficiency was measured
48 hours post transfection by the percentage of hepatocytes which stained positive after X-Gal

Neill J. Horley Section 3.6.2
Page 140
histochemical assay (Sanes et al., 1986). The results of these experiments are summarised in Figure
3.22. The data indicates that a broad range of concentrations (10-40µg/flask) of DOTA/DOPE
could be used to obtain high transfection efficiencies. This data also suggested that some form of
cytotoxicity is occurring at the higher concentrations beyond 40µg/flask. Tandem experiments
have been carried out in this study to compare non-commercial to commercial forms of lipofec-
tin (data not shown). It has been found that the non-commercial form was as efficient at DNA
transfer (data not shown) and a less expensive alternative to the commercial products available.
Section 3.6.2 Effect of reporter DNA concentration upon transfection efficiency
The next parameter to be assessed was the concentration of plasmid DNA. The previous data
suggests some form of cytotoxicity is occurring at higher concentrations of DOTMA/DOPE so
only 20µg/flask was used for all subsequent experiments. Primary rat hepatocytes were isolated
and transfected as described in section 2.8.3. The concentration of DOTMA/DOPE was kept
constant at 20µg/flask whilst pRSV-β-GAL plasmid concentrations (0-8µg/flask) were altered
0 10 20 40 60 80
25
30
20
15
10
5
0
% B
lue
cells
DOTMA conc µg/flask
Figure 3.22 The influence of DOTMA/DOPE concentration on transfection efficiency. Primary hepato-cytes were isolated and transfected as detailed in section 2.8.3. Hepatocytes were transfected in -ve L15 mediumover 24 hours with a complex of 6µg of pRSV-βGAL and 0-80µg DOTMA/DOPE reagent at 37oC. Cells were culturedin CL15 medium for 48 hours post-transfection before β-galactosidase activity was measured by histochemical re-action with X-Gal. The % transfection efficiency was determined by recording the number of blue stained cells in atleast eight fields of vision and representing this as a percentage of the total number of cells per field. Optimumtransfection appears to occur at 10-40µg DOTMA/DOPE per flask. The mean of 3 flasks was plotted. Data pointswere analysed using Student’s t-test. Error bars represent the standard error about the mean.

Neill J. Horley Section 3.6.3
Page 141
to determine the effect on transfection efficiency. Transfection efficiency was measured 48 hours
post transfection by the percentage of hepatocytes which stained positive after X-Gal histochem-
ical assay. The results of these experiments are summarised in Figure 3.23. Here, an increase in
the pRSV-β-GAL concentration from 0-6µg/flask indicated an increase in transfection
efficiency without any apparent deleterious effects on cell viability. This data also indicates the
variability in the transfection protocol from each hepatocyte preparation and transfection
procedure, with a maximum of only 17% being obtained in this experiment compared to 28%
in the previous experiment.
Section 3.6.3 Effect of incubation time upon transfection efficiency
The final variable tested to obtain optimal transfection efficiency was the time of incubation with
the DNA-liposome complex. Maximal transfection levels obtained for the previous experiments
were measured at a specific arbitrary time-point (24 hours). The results presented in Figure 3.22
0 1 2 4 6 8
0
2
4
6
8
10
12
14
16
% B
lue
cells
DNA conc µg/flask
Figure 3.23 The influence of DNA concentration on transfection efficiency . Primary hepatocytes wereisolated and transfected as detailed in section 2.8.3. Hepatocytes were transfected in -ve L15 medium over 24hours with a complex of 20µg of DOTMA/DOPE reagent and 0-8µg of pRSV-β-GAL DNA at 37oC. Cells were culturedin CL15 medium for 48 hours post-transfection before β-galactosidase activity was measured by histochemical re-action with X-Gal. The % transfection efficiency was determined by recording the number of blue stained cells in atleast eight fields of vision and representing this as a percentage of the total number of cells per field. Optimumtransfection appears to occur at 6µg of pRSV-β-GAL per flask. The mean of 3 flasks was plotted. Data points wereanalysed using Student’s t-test. Error bars represent the standard error about the mean.

Neill J. Horley Section 3.6.3
Page 142
suggest that a minimum transfection incubation time would be advantageous so as to minimise
deleterious effects on cell viability. Primary rat hepatocytes were isolated and transfected as
described in section 2.8.3. The concentration of DOTMA/DOPE and pRSV-β-GAL plasmid
were kept constant at 20µg and 6µg/flask respectively whilst the transfection incubation time was
varied between 0-24 hours to test the effects on transfection efficiency. Transfection efficiency
was measured 48 hours post transfection by the percentage of hepatocytes which stained positive
after X-Gal histochemical assay. The results of these experiments are summarised in Figure 3.24.
Hence, the shortest incubation time allowing for sufficient transfection was determined and
found to be 4-5 hours. All subsequent experiments used the optimal values obtained for these
three parameters.
0 1 2 3 4 5 24
Hours of Transfection
% B
lue
cells
0
1
2
3
4
5
6
7
8
Figure 3.24 The influence of incubation time on transfection efficiency. Primary hepatocytes were iso-lated and transfected as detailed in section 2.8.3. Hepatocytes were transfected in -ve L15 medium with varyingincubation times of 0-24 hours with a complex of 20µg of DOTMA/DOPE reagent and 6µg of pRSV-β-GAL DNA at37oC. Cells were cultured in CL15 medium for 48 hours post-transfection before β-galactosidase activity was mea-sured by histochemical reaction with X-Gal. The % transfection efficiency was determined by recording the numberof blue stained cells in at least eight fields of vision and representing this as a percentage of the total number ofcells per field. Optimum transfection incubation time appears to occur at around 5 hours. The mean of 3 flaskswas plotted. Data points were analysed using Student’s t-test. Error bars represent the standard error about themean.

Neill J. Horley Section 3.6.4
Page 143
Section 3.6.4 Morphology of hepatocytes post-transfection
Primary rat hepatocytes may exhibit some cytotoxic effects due to the transfection protocol.
Maximal transfection incubation times, DOTMA/DOPE and DNA concentrations were all
assessed for their degenerative effects on the morphology of the monolayer. A visual examination
of the monolayers both before (Figure 3.25a) and after (Figure 3.25b) transfection was carried
out; no phenotypic alterations were apparent at the optimised parameter values, despite the high
transfection efficiency indicated by the histochemically developed blue colouration of the cell cy-
toplasm. Routine transfection efficiencies varied between 10-40 % in all subsequent experiments.
Section 3.6.5 Optimisation of reporter system assays
Initial experiments were also carried out to optimise the method of harvesting the primary rat
hepatocyte monolayers for analysis of reporter genes. The chloramphenicol acetyltransferase
(CAT) control and luciferase reporter vectors pCAT3-control and pGL3-control respectively
were used in these preliminary experiments. Several cell disruption techniques were assessed for
their efficiency of enzyme harvest. Cell lysates were extracted by one of three methods: scraped
A. B.
Figure 3.25 Intact morphology both before (A) and after (B) transfection . Primary hepatocytes wereisolated and transfected as detailed in section 2.8.3. Hepatocytes were transfected in -ve L15 medium for 5 hourswith a complex of 20µg of DOTMA/DOPE reagent and 6µg of pRSV-β-GAL DNA at 37oC. Cells were cultured inCL15 medium for 48 hours post-transfection before they were fixed with glutaraldehyde and stained for β-galac-tosidase activity using standard techniques (section 2.9.1). Cells expressing β-galactosidase activity are stainedblue as shown in (b), which is an indication of positive transfection of pRSV-β−GAL DNA. The % transfection effi-ciency was determined by recording the number of blue stained cells in at least eight fields of vision and repre-senting this as a percentage of the total number of cells per field. (Magnification x 40)
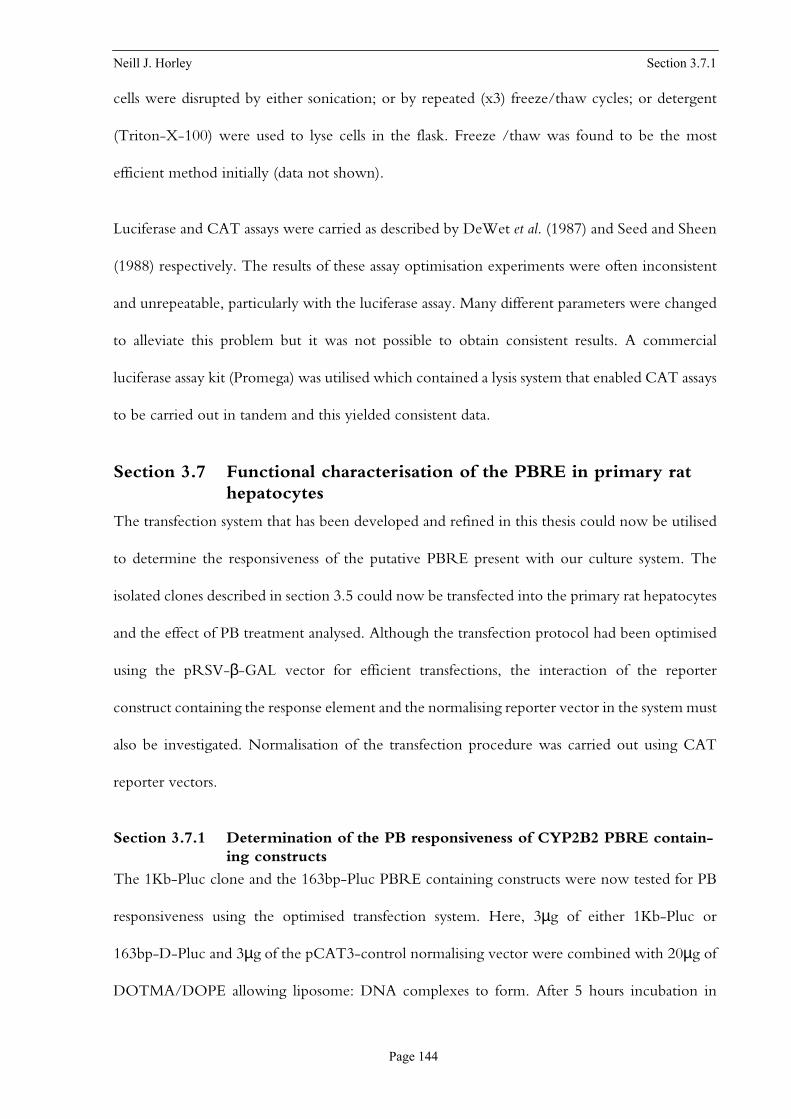
Neill J. Horley Section 3.7.1
Page 144
cells were disrupted by either sonication; or by repeated (x3) freeze/thaw cycles; or detergent
(Triton-X-100) were used to lyse cells in the flask. Freeze /thaw was found to be the most
efficient method initially (data not shown).
Luciferase and CAT assays were carried as described by DeWet et al. (1987) and Seed and Sheen
(1988) respectively. The results of these assay optimisation experiments were often inconsistent
and unrepeatable, particularly with the luciferase assay. Many different parameters were changed
to alleviate this problem but it was not possible to obtain consistent results. A commercial
luciferase assay kit (Promega) was utilised which contained a lysis system that enabled CAT assays
to be carried out in tandem and this yielded consistent data.
Section 3.7 Functional characterisation of the PBRE in primary rat hepatocytes
The transfection system that has been developed and refined in this thesis could now be utilised
to determine the responsiveness of the putative PBRE present with our culture system. The
isolated clones described in section 3.5 could now be transfected into the primary rat hepatocytes
and the effect of PB treatment analysed. Although the transfection protocol had been optimised
using the pRSV-β-GAL vector for efficient transfections, the interaction of the reporter
construct containing the response element and the normalising reporter vector in the system must
also be investigated. Normalisation of the transfection procedure was carried out using CAT
reporter vectors.
Section 3.7.1 Determination of the PB responsiveness of CYP2B2 PBRE contain-ing constructs
The 1Kb-Pluc clone and the 163bp-Pluc PBRE containing constructs were now tested for PB
responsiveness using the optimised transfection system. Here, 3µg of either 1Kb-Pluc or
163bp-D-Pluc and 3µg of the pCAT3-control normalising vector were combined with 20µg of
DOTMA/DOPE allowing liposome: DNA complexes to form. After 5 hours incubation in

Neill J. Horley Section 3.7.1
Page 145
-ve L15 media, the cells were transferred to CL15 media and immediately dosed with 1.0mM
PB. They were incubated for 30 hours before the cell monolayer was harvested. Cell extracts
were harvested and firefly luciferase activity measured according to the instructions given in the
luciferase firefly assay kit and as detailed in section 2.9.4.
The results of experiments in which CYP2B2 PBRE containing constructs were transfected into
primary rat hepatocytes are summarised in Figure 3.26. Two PBRE-containing constructs were
assayed and the normalised responses to PB measured. The results obtained from these experi-
ments were rather unexpected. When treated with 1.0mM PB both the 1Kb-Pluc construct and
the 163 bp PBRE containing constructs showed very little net induction when compared to
control values. Notably, with the 163bp-D-Pluc construct the expression obtained was over 2.5
fold greater than that obtained for the 1Kb-Pluc construct for both control and dosed groups.
XXC XXP DC DP PPC PPP
*
*
Vector
Rat
io o
f Fir
efly
luci
fera
se/C
AT
act
ivity
0.5
0
1.0
1.5
2.0
2.5
1 kb construct
163 bp construct
Pluc-vector
Figure 3.26 Determination of PB responsiveness of two PBRE containing constructs. Primary rathepatocytes were transfected with 3µg of either 1Kb-Pluc or 163bp-D-Pluc and 3µg of pCAT3 control vector using20µg of DOTMA/DOPE reagent for 5 hours. Flasks were dosed with 1.0mM PB and incubated for 30 hours. Cellextracts were harvested and assayed for firefly luciferase activity as described in section 2.9.4. The results of theluciferase assay were normalised using the results of the CAT assay; the mean of 3 experiments was plotted. Datapoints were analysed using Student’s t-test. C = control, P = 1.0mM phenobarbital, XX = 1Kb-Pluc construct, D=163bp-D-Pluc construct, PP = PGL-3-Pluc control vector. Error bars represent S.E. Reporter activity of 163bp-D-Plucis significantly higher than that of 1Kb-Pluc (p=0.01, df=5, Two-tailed t-Test).

Neill J. Horley Section 3.7.2
Page 146
The presence of insulin within the hepatocyte culture system has been shown to strongly
suppress the induction of the CYP2B1/2 gene in primary rat hepatocytes (Yoshida et al., 1996).
Experiments were carried out to investigate whether or not insulin, present in our hepatocyte
culture system, was suppressing CYP2B2 gene expression. The results of these experiments
showed that the level of expression of the 163bp-D-Pluc construct in hepatocytes dosed with
1.0mM PB was unaffected by the presence (1x10⁻⁶ M) or absence of insulin in the culture media
(data not shown).
The result presented in Figure 3.26 showed that hepatocytes transfected with PBRE-containing
constructs were giving minimal or no induction responses when cells were treated with PB. It
was thought that there may have been some interaction between the two expression vectors
within the reporter system. This interaction may have been the result of a titration of general
transcription factors by one of the reporter genes or a trans effect brought about by the presence
of the other reporter gene (Natesan et al., 1997).
Section 3.7.2 Generation of a HSV-thymidine kinase promoter-containing PBRE construct
Farr and Roman (1991) highlighted that trans effects occurring between promoters on co-trans-
fected plasmids could affect reporter gene expression of one or both of the reporter genes
involved. The trans effects brought about by the interaction of the two reporter genes may result
in suppression in the activity of either of the reporter genes involved. This is of particular concern
when working with reporter genes containing strong promoter/enhancer elements such as
Simian virus 40 (SV40) or cytomegalovirus (CMV) promoter elements which may reside on one
or other, or both, of the control and experimental reporter vectors. The HSV-thymidine kinase
(TK) promoter is useful for providing neutral constitutive expression which may allow for a
reduction in the amount of trans effects occurring between the different promoter elements. The
possibility of reporter gene promoter ‘cross-talk’ was addressed by designing a sub-cloning

Neill J. Horley Section 3.7.2
Page 147
strategy that would enable this to be investigated. Reporter genes were designed so that a
combination of HSV-TK, SV40 or CMV-driven promoters were present on both the control
and experimental reporter genes. It was thought these reporters would help determine whether
the unexpected effects that were being observed in section 3.7.1 had arisen due to trans effects
occurring between reporters containing strong promoter elements. A sub-cloning strategy was
undertaken to generate reporter constructs of varying promoter strengths that contained the
163 bp PBRE fragment of the CYP2B2 gene.
The reporter constructs sub-cloned in section 3.5.1 were used to generate a PBRE HSV-TK
promoter reporter. A PCR sub-cloning strategy incorporating the PBRE fragment of the 163bp-
G-Pluc construct and a HSV-thymidine kinase promoter driven firefly luciferase reporter (TK-
Luc, a kind gift from Ronald M. Evans of the Howard Hughes Medical Institute) was devised.
Oligonucleotide primers were designed based around the 163bp-G-Pluc ligated PBRE fragment.
This meant that the primer contained partial sequence homologous to the PGL3-promoter
vector and partial sequence homologous to the PBRE insert. The primers were also designed so
that a Hind III restriction site would be engineered into the PCR-generated insert.
PCR was carried out as described in section 2.5 on the 163bp-G-Pluc construct using primers,
Hind 5 and Hind 3. PCR products gave rise to a 207 bp fragment (Figure 3.27). This PCR
product was restriction digested using Hind III and ligated into the Hind III site of the TK-Luc
vector. Clones produced from this ligation were restriction digested with Hind III and shown to
contain a fragment of 193 bp (Figure 3.28). Positive clones were designated TK2B2-Luc. This
sub-cloning strategy was non-directional, so two clones were sequenced using primer Hind 5 as
a confirmation of the clone’s integrity. These two clones were shown to be in the same
orientation as the CYP2B2 gene and were designated TK2B2-F-Luc and TK2B2-D-Luc.

Neill J. Horley Section 3.7.2
Page 148
1 2 3 4 5 6
1
Figure 3.27 PCR amplification of CYP2B2 PBRE DNA. PCR of the PBRE containing fragment amplifiedfrom 163bp-G-Pluc used primers Hind 5 (5’ GAG ATG AAG CTT GCA GAT CGT GGA CAC AAC CCT C 3’) containing3 base-pair mis-matches (shown in bold) and primer Hind 3 (5’ CTA GCC AAG CTT CGA GAT CAC CCA GCC TGGCAG 3’) containing 4 base-pair mis-matches (shown in bold). PCR was carried out as described in section 2.5 andconsisted of 30 cycles of 94oC, 1 min; 55oC, 1 min; and 72oC, 1 min. 5µl of the 50µl PCR reaction was run on a1.0 % pre-stained 0.1µg/ml EtBr, 1X TBE agarose gel at constant voltage of 90V for 2 hours. Lane 1 contains 1kb+ ladder. Lane 2 contains 0.5ng of 163bp-G-Pluc template DNA. Lane 3 contains 3.0 ng of 163bp-G-Pluc tem-plate DNA. Lane 4 contains product from the PCR reaction with no template DNA. Lane 5 contains product fromthe PCR reaction with 163bp-G-Pluc template DNA but no Taq. Lane 6 contains 1 kb+ ladder. Arrow 1 indicatesposition of 207 bp PCR fragment amplified from the 163bp-G-Pluc PBRE containing region.
1 2 3 4 5
193 bp subclonedPBRE fragment
Figure 3.28 Cloning of the PBRE containing TK163-Luc plasmid. PCR clones were restriction digestedwith Hind III and ran on a 1.2%- agarose gel. The 193 bp band was gel excised and cloned into the Hind III site ofthe TK-Luc vector and designated TK163-Luc. TK163-Luc clones were digested with the Hind III restriction enzyme.The products of each restriction digest were analysed on a 1.5%-prestained 0.1 µg/ml EtBr, 1X TBE agarose gelat constant voltage of 70V for 2 hours to show the presence of a 193 bp fragment from the TK163-Luc clone. EachTK163-Luc clone had a letter attached to it corresponding to each of the 14 clones picked. Plasmid TK2B2-D-Lucand TK2B2-F-Luc are shown. Lane 1 contains 1 kb+ ladder. Lane 2-3 contain TK2B2-D-Luc and TK2B2-F-Luc uncutDNA. Lane 4-5 contain TK2B2-D-Luc and TK2B2-F-Luc plasmid DNA cut with Hind III. Arrow indicates position of193 bp subcloned PBRE fragment.

Neill J. Horley Section 3.7.3
Page 149
Section 3.7.3 Optimisation of the Dual luciferase reporter assay (DLRA)
The transfection system used thus far incorporated the use of multiple reporter constructs with
multiple reporter assays, this meant that cross-talk between the two reporter gene promoters was
a distinct possibility. The DLRA was a commercial kit which had been optimised for the inter-
actions that may occur between various reporter constructs. The kit also had the added advantage
that the two assays were performed on the same sample in sequence. The system consisted of an
experimental reporter containing a segment of PBRE attached to the firefly luciferase reporter
and the control reporter consisting of the Renilla (sea pansy) luciferase gene which acted as the
normalising vector (pRL-CMV).
An experiment was designed to find out if an alteration in the ratios of the two reporter plasmids
could have any affect on the overall response of the PBRE. The first parameter to be adjusted
was the amount of the Renilla luciferase reporter plasmid present in the system. The amount of
163bp-D-Pluc firefly luciferase reporter was kept constant at 6µg /flask whilst the amount of
pRL-CMV Renilla luciferase reporter was altered from 100ng-0.001ng /flask. The hepatocytes
were transfected and dosed for 30 hours before they were harvested and analysed as described in
section 2.9.5. Table 3.2 summarises the values obtained by altering the amount of pRL-CMV
plasmid DNA whilst keeping the amount of 163bp-D-Pluc plasmid DNA constant. This data
shows that an extremely high signal to noise ratio is obtained with these reporters. It also shows
that only very small quantities of pRL-CMV needed to be present for a high signal to be
produced. The Renilla luciferase gene had a strong constitutive expression in the hepatocyte
system with values ranging from 3000 relative light units (RLU) above background to outside
the range of the luminometer (approx. 1.7x10⁸) over the range of Renilla reporter transfected.
The values obtained for the firefly luciferase reporter ranged from 9000-160000 RLU but this
value did not alter greatly along with an alteration in vector ratio.

Neill J. Horley Section 3.7.3
Page 150
Once an optimum amount of pRL-CMV had been found, this was then used to test the effects
of reducing the amount of 163bp-D-Pluc firefly luciferase reporter transfected into the system.
The hepatocytes were transfected and dosed for 30 hours before they were harvested and analy-
sed as described in section 2.9.5. The amount of 163bp-D-Pluc was varied between 6-0.1µg of
DNA /flask whilst the amount of pRL-CMV was kept at a constant 0.1ng /flask to see if this
would effect the response of the PBRE present in the 163bp-D-Pluc construct. Table 3.3 sum-
marises the values obtained by altering the 163bp-D-Pluc plasmid DNA whilst keeping the
amount of pRL-CMV plasmid DNA constant. The data indicates an increase in Renilla luciferase
values obtained from 1.5-40000 RLU when the amount of 163bp-D-Pluc decreases from 6-3µg
of DNA /flask. A further decrease in 163bp-D-Pluc concentration does not seem to effect the
signal produced by the Renilla luciferase reporter present in the system. The results presented in
Table 3.2 and 3.3, only indicate the trend in firefly luciferase and Renilla luciferase reporter gene
Amount of vector of 163bp-D-Pluc: pRL-
CMV (µg/flask)Treatment
Firefly luciferase activity
(RLUx100)
Renilla luciferase (RLUx1000)
6: 0.1 PB 95-125 off scale
6: 0.1 C 50-145 off scale
6: 0.01 PB 50-65 off scale
6: 0.01 C 70-100 off scale
6: 0.001 PB 30-70 50-150
6: 0.001 C 40-150 45-285
6: 0.0001 PB 40-65 3-4
6: 0.0001 C 10-160 3-9
6: 0.000001 PB 40-130 background
6: 0.000001 C 80-100 background
Table 3.2 Relative activities of firefly and Renilla luciferase reporter gene activity. Hepatocytes were transfected with 6µg /flask of 163bp-D-Pluc firefly luciferase reporter and between 100-0.01ng/flask of pRL-CMV Renilla luciferase reporter then dosed for 30 hours and harvested. The results of a DLRA were measured in relative light units (RLU), PB = 1.0mM PB, C = control.
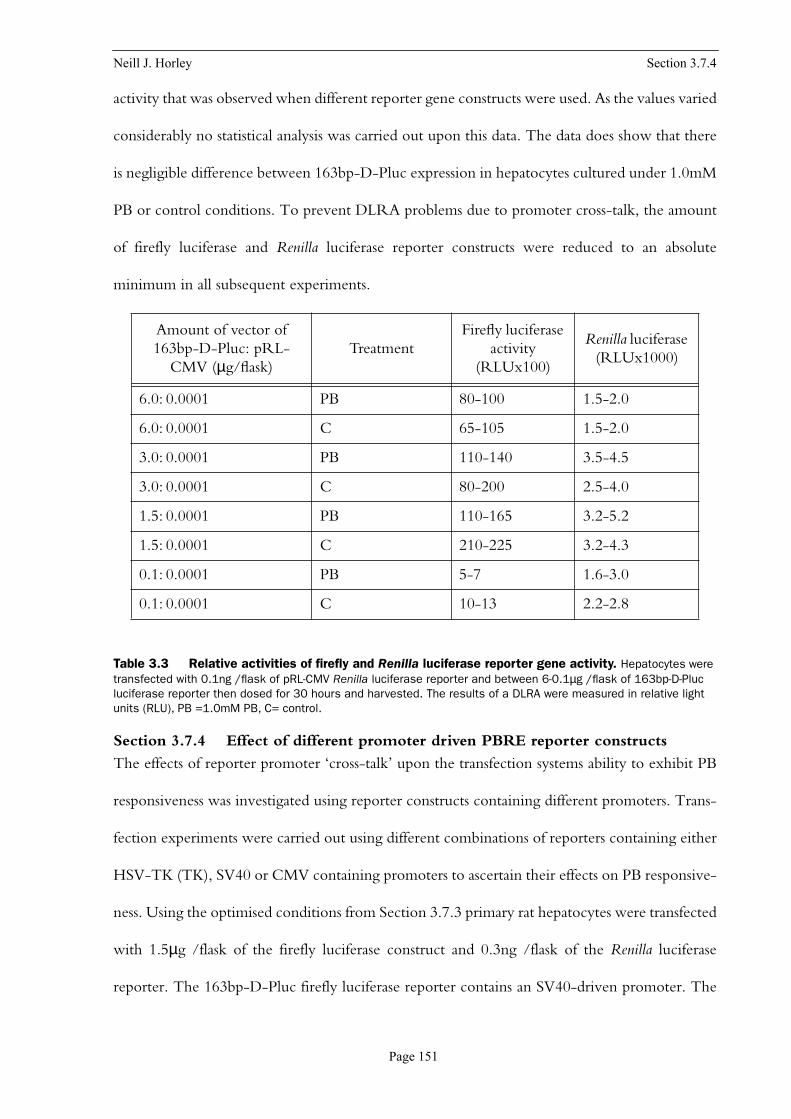
Neill J. Horley Section 3.7.4
Page 151
activity that was observed when different reporter gene constructs were used. As the values varied
considerably no statistical analysis was carried out upon this data. The data does show that there
is negligible difference between 163bp-D-Pluc expression in hepatocytes cultured under 1.0mM
PB or control conditions. To prevent DLRA problems due to promoter cross-talk, the amount
of firefly luciferase and Renilla luciferase reporter constructs were reduced to an absolute
minimum in all subsequent experiments.
Table 3.3 Relative activities of firefly and Renilla luciferase reporter gene activity. Hepatocytes were transfected with 0.1ng /flask of pRL-CMV Renilla luciferase reporter and between 6-0.1µg /flask of 163bp-D-Pluc luciferase reporter then dosed for 30 hours and harvested. The results of a DLRA were measured in relative light units (RLU), PB =1.0mM PB, C= control.
Section 3.7.4 Effect of different promoter driven PBRE reporter constructs
The effects of reporter promoter ‘cross-talk’ upon the transfection systems ability to exhibit PB
responsiveness was investigated using reporter constructs containing different promoters. Trans-
fection experiments were carried out using different combinations of reporters containing either
HSV-TK (TK), SV40 or CMV containing promoters to ascertain their effects on PB responsive-
ness. Using the optimised conditions from Section 3.7.3 primary rat hepatocytes were transfected
with 1.5µg /flask of the firefly luciferase construct and 0.3ng /flask of the Renilla luciferase
reporter. The 163bp-D-Pluc firefly luciferase reporter contains an SV40-driven promoter. The
Amount of vector of 163bp-D-Pluc: pRL-
CMV (µg/flask)Treatment
Firefly luciferase activity
(RLUx100)
Renilla luciferase (RLUx1000)
6.0: 0.0001 PB 80-100 1.5-2.0
6.0: 0.0001 C 65-105 1.5-2.0
3.0: 0.0001 PB 110-140 3.5-4.5
3.0: 0.0001 C 80-200 2.5-4.0
1.5: 0.0001 PB 110-165 3.2-5.2
1.5: 0.0001 C 210-225 3.2-4.3
0.1: 0.0001 PB 5-7 1.6-3.0
0.1: 0.0001 C 10-13 2.2-2.8

Neill J. Horley Section 3.7.4
Page 152
TK2B2-F-Luc construct contains a TK-driven promoter. The Renilla luciferase reporter contains
either a CMV-driven promoter or a TK-driven promoter. Combinations of TK, SV40 firefly
lucferase and TK, CMV Renilla luciferase reporters were examined to determine their effects on
overall induction ratios of control over 1.0mM-PB treated hepatocytes. Hepatocytes were trans-
fected with the appropriate combination of reporters and DOTMA/DOPE for 5 hours and
dosed with PB for a further 30 hours. The monolayers were then harvested and assayed as
detailed in section 2.9.5. The effect of altering the reporter promoter on the responsiveness of
the hepatocyte system is shown in Figure 3.29. Here, the effect of altering the type of promoter
driving each reporter upon the overall signal obtained is quite complex.
The data shows the intensity of the response measured is dependent upon which combination of
SCP SCC STP STC TCP TCC TTP TTC
Reporter gene promoter strength
Rat
io o
f Fir
efly
/Ren
illa
luci
fera
se a
ctiv
ity
0
5
10
15
20
25
30
*
Figure 3.29 Effect of different reporter promoter activity on PBRE responsiveness to PB . Primaryrat hepatocytes were transfected with a combination of 1.5µg /flask of either 163bp-D-Pluc or TK2B2-F-Luc lu-ciferase constructs and 0.3ng /flask of pRL-CMV or pRL-TK Renilla luciferase constructs with 20µg of DOTMA/DOPE reagent for 5 hours. Flasks were dosed with control or 1.0mM PB and incubated for 30 hours. Cell extractswere harvested and assayed for firefly/Renilla luciferase activity and normalised as described in section 2.9.5. Thenormalised results of these assays (luminescence) are expressed as a ratio of firefly/Renilla luciferase activity.Data points were analysed using Student’s t-test. C = control, P=1.0mM phenobarbital. The SC denotes the firefly/Renilla luciferase reporters driven by SV40 or CMV-driven promoters respectively, ST denotes the firefly/Renilla lu-ciferase reporter driven by SV40 or TK-driven promoters respectively, TC denotes the firefly/Renilla luciferase re-porter driven by TK or CMV-driven promoters respectively, and TT denotes the firefly/Renilla luciferase reportersdriven by TK or TK-driven promoters respectively. *Reporter activity in the presence of 1.0mM PB is significantlyhigher than in its absence. (P< 0.05, df=2, two-tailed t-test).

Neill J. Horley Section 3.7.5
Page 153
promoters is used. These data suggest that the PBRE showed PB responsiveness only when both
the firefly luciferase and Renilla luciferase reporter genes contained a TK-driven promoter. Here,
treatment of hepatocytes with 1.0mM PB gave a 2-fold induction above control values. The
other promoter permutations gave rise to higher values for the control cells than they did for the
PB-treated hepatocyte cultures.
Section 3.7.5 Cytotoxicity of the transfection protocol
The results obtained from the previous section indicated that transcriptional activation of the
PBRE containing reporter constructs could be demonstrated if the two reporters were present
in the correct ratios within the transfection system.
The decreased reporter response from the PB-induced cultures might have been the result of
promoter ‘cross-talk’ as mentioned before, although cytotoxicity induced by the transfection
procedure and subsequent dosing with PB was another possibility that had to be examined.
Results presented in section 3.6.4 showed that no deleterious effects brought about by the
transfection protocol were apparent, but in this case the monolayers were not dosed with PB.
The cytotoxic effects of the transfection procedure were assessed by indirect measurement of the
release of the cytosolic enzyme lactate dehydrogenase (LDH). LDH catalyses the reduction of
pyruvate to L-lactate with simultaneous oxidaion of NADH to NAD. The change in absorbance
at 340nm due to the disappearance of reduced NAD (NADH) over time is directly proportional
to the LDH activity.
Hepatocytes were transfected with 2µg of TK-2B2-Luc, 0.3ng of pRL-TK Renilla and 20µg of
DOTMA/DOPE for 5 hours then dosed with PB. Aliquots of the cell culture media (200µl)
were removed at various time points during transfection and post-transfection and assayed for
LDH activity as described in section 2.11. At the end of the experiment (48 hours), a final aliquot
of cell culture medium was removed and the cell monolayer lysed using 0.6% Triton X-100. This

Neill J. Horley Section 3.7.5
Page 154
was carried out to determine the percentage of total intracellular LDH content left in the cell
culture system at 48 hours.
Figure 3.30 shows the results of the LDH assay expressed in international units per litre. The data
shows very clearly the difference in LDH leakage that was occurring between the two phases of
the transfection and dosing protocol. During the transfection stage there was a 2.7 fold increase
in the amount of LDH leakage occurring in the transfected cells when compared to the non-
transfected cultures. The initial increase in LDH leakage was mainly due to the effects of the
hepatocyte isolation procedure. The presence of the transfection reagent and the effects it
exhibits on the plasma membrane of the hepatocytes during the transfection protocol further
compounds the LDH leakage. Once the transfection reagent was removed and the cells dosed
with PB, the level of LDH leakage was shown to decrease. At this time point (0 hrs) there is a
1.4 fold difference in the amount of LDH leakage occurring between the transfected (T) and the
non-transfected (NT) hepatocytes. The amount of LDH leakage was shown to further decrease
at the 3 hour time point as the hepatocyte culture becomes acclimatised, although at this time
point there is still a significant difference between T and NT hepatocytes, but there was no
difference in LDH leakage between control and PB-dosed transfected hepatocytes. After 3 hours
LDH leakage increases gradually with time as did the difference between the T and NT cells.
The difference in LDH leakage between transfected cells that were control or PB-treated was
found to be negligible over the 48 hour time period, thus, indicating that no cytotoxicity was
occurring due to PB treatment post-transfection.
At 48 hours both the amount of LDH leakage occurring and the total available intra-cellular
LDH activity of the monolayers was assessed by total cell lysis. This was carried out to determine
if the amount of LDH leakage occurring at 48 hours was significant compared to the total avail-
able intra-cellular LDH activity present in the monolayers. Although the transfected cells showed

Neill J. Horley Section 3.7.6
Page 155
a 2-fold increase in LDH leakage above non-transfected cells, the amount of LDH leakage was
less than 30% of the total available intra-cellular LDH activity. This final value of LDH leakage
does not suggest that a significant amount of cytotoxicity was occurring in the transfected cells
(Delraso, 1989).
Section 3.7.6 Determination of TK2B2-F-Luc expression over time
The results presented in Figure 3.29 indicate that the PBRE mediated induction of the firefly
luciferase reporter gene may be increased if the correct reporter gene conditions were present. A
time course of the induction of the reporter containing the firefly TK-driven promoter luciferase
gene TK2B2-F-Luc by PB in transfected hepatocytes was carried out to determine the kinetics
of the PB-mediated induction. Hepatocytes were transfected as before with 2µg of TK2B2-F-
Luc, 0.3ng of pRL-TK Renilla and 20µg of DOTMA/DOPE for 5 hours then dosed as control
-5 0 3 8 24 48
Transfection Time (hrs)
Non-Transfected cells
Control-Transfected cells
1.0mM PB-Transfected cells
0
100
200
300
400
500
600
700
LDH
U/L
**
*
**
*
(NT)
(C)
(PB)
Figure 3.30 Cytotoxic effects of transfection protocol upon primary rat hepatocytes. Primary rathepatocytes were transfected with 2µg TK2B2-F-Luc, 0.3ng of pRL-TK Renilla and 20µg of DOTMA/DOPE for 5hours then dosed with 1.0mM PB. Aliquots of the cell culture media (200µl) were removed at various time pointsduring transfection and post transfection and assayed for LDH activity in international units/litre (U/L) as de-scribed in section 2.11. Data points were analysed using Student’s t-test. -5 denotes time during which transfec-tion is occurring. 0-48 denotes time post-transfection during which the monolayers were exposed to 1.0mM PB.NT = non-transfected cells, C = control, PB = 1.0mM phenobarbital treated transfected cells. *LDH leakage oftransfected cells is significantly higher than non-transfected cells (p = 0.06, df =2, two-tailed t-test). **LDH leak-age of transfected cells is significantly higher than non-transfected cells (p = 0.02, df =2, two-tailed t-test).

Neill J. Horley Section 3.7.7
Page 156
or 1.0mM PB. The monolayers were harvested and assayed, to determine if the length of time
that hepatocytes were exposed to 1.0mM PB post-transfection would affect PBRE mediated
induction of the firefly luciferase reporter gene. The results shown in Figure 3.31 indicate that
there is minimal induction exhibited by PB-induced hepatocytes transfected with the
TK2B2-F-Luc firefly luciferase construct up to 8 hours. A significant 1.6 fold induction above
control hepatocytes is demonstrated at 24 hours, which decrease to 1.5 fold at 48 hours.
Section 3.7.7 PB-mediated induction of two PBRE containing reporter constructs
The results presented in the previous sections demonstrate that PB-mediated induction of the
PBRE is possible under specific experiment conditions in this thesis. The 1.3-1.6 fold induction
obtained using various PBRE containing reporter constructs, recorded within this culture system
does not compare with the results obtained in other laboratories such as that of Anderson’s
(Trottier et al., 1995). In order to understand why we could only obtain a comparatively low
induction, it was decided that a comparison between PBRE-containing constructs which have
been characterised (Trottier et al., 1995) and our TK2B2-F-Luc construct was necessary.
Time (hrs)
0 10 20 30 40 50
Rat
io o
f Fir
efly
/Ren
illa 3.0
2.0
1.0
0
1.0mM PB
Control
*
luci
fera
se a
ctiv
ity
Figure 3.31 Effect of time upon expression of PB induced TK2B2-F-Luc reporter activity. Primaryrat hepatocytes were transfected with 2µg of TK2B2-F-Luc, 0.3ng of pRL-TK Renilla and 20µg of DOTMA/DOPE for5 hours then dosed with 1.0mM PB. Hepatocyte monolayers were harvested at the times indicated and analysedfor firefly luciferase and Renilla luciferase reporter activity. The normalised results of these assays (luminescence)are expressed as a ratio of firefly/Renilla luciferase activity as described in section 2.9.6. Data points were anal-ysed using Student’s T-test. C = control, P = 1.0mM phenobarbital treated transfected cells. *Hepatocytes treatedwith 1.0mM PB post-transfection are 1.6 fold significantly higher than control transfected cells (p = 0.02, df =2,two-tailed t-test).

Neill J. Horley Section 3.7.7
Page 157
The pBSCAT plasmid carrying a portion of the CYP2B2 5’-flanking region inserted upstream
from the CAT gene (a kind gift from Alan Anderson of le Centre de Recherche en Cancerologie
de l’ Universite Laval, L’Hotel-Dieu de Quebec, Quebec) was provided. This construct
consisted of a 163 bp Sau3AI fragment from nucleotides -2318 to -2155 added to -1681 bp of
the 5’ flanking sequence of the CYP2B2 portion of the non-responsive EcoRV construct. This
construct was designated Sa-Sa/EV in the Anderson paper but will be referred to here as the
163bpCAT construct.
The 163bpCAT construct was restriction digested so that the integrity of the positive clones
could be assessed. Figure 3.32 confirms the presence of the 163bpCAT construct with a multiple
restriction digest using Hind III, Nco I and EcoR I giving rise to distinct banding patterns.
The 163bpCAT-reporter gene activity was monitored using the CAT assay as described in
section 2.9.3. Initial CAT assay results indicated that the values obtained from hepatocytes
1 2 3 4 5
5Kb
3Kb
2Kb
1Kb
0.5KB
Figure 3.32 Restriction digest of the 163bpCAT clone. 163bpCAT plasmid DNA was restriction digestedas described in section 2.4.7, with Hind III, Nco I and EcoR I restriction enzyme and run on a 0.6 % pre-stainedethidium bromide 1xTBE agarose gel at constant voltage of 90V for 2 hours to determine the presence of the 163Sa-Sa/EV insert. Lane 1 1 kb ladder. Lane 2 Hind III digest giving rise to 2 bands at 1440 bp and 5010 bp. Lane3 undigested plasmid. Lane 4 Nco I digest giving rise to 3 bands at 4082, 1572 and 798 bp. Lane 5 EcoR I digestgiving rise to 2 bands at 4315 bp and 2137 bp. A positive clone was picked and prepared for transfection by plas-mid Qiagen maxi-preparation.

Neill J. Horley Section 3.7.7
Page 158
transfected with the 163bpCAT reporter construct were at a level similar to that of mock trans-
fected cells (hepatocytes which did not contain a CAT reporter construct) (data not shown).
These results suggested that some attribute of the 163bpCAT reporter was interfering with the
CAT assay, or that the assay was not working correctly. The possibility that the 163bpCAT
prepared plasmid may be exhibiting some form of endotoxin contamination was investigated.
Section 3.7.7.1 Endotoxin contamination of the 163bpCAT reporter
Endotoxins (lipopolysaccharides) are cell membrane components of Gram-negative bacteria e.g.,
E.coli., which are released during the lysis step of plasmid preparations. It has been noted that
these endotoxins strongly influence the efficiency of transfection of DNA into sensitive cultured
cells (Weber et al., 1995). The presence of endotoxins in the transfected DNA could specifically
inhibit PB-induction of hepatocytes containing the 163bpCAT reporter. This inhibition of PB
induction and decreased ability of the transfected 163bpCAT containing hepatocytes to express
CAT enzyme would affect the overall assay signal.
All plasmid DNA that was involved in the transfection procedure was Qiagen maxi-prepared and
further purified to remove any remaining contaminant endotoxins by caesium chloride-ethidium
bromide (CsCl-EtBr) centrifugation. For each plasmid, 100µg of plasmid was mixed into 1.5ml
of a 1.63g/ml solution of caesium chloride containing 450µg of ethidium bromide. This solution
was then centrifuged in an Optima TLA-120.2 ultracentrifuge at 80,000 rpm for 6 hours at 20oC,
DNA extracted, centrifuged again, and the DNA was then cleaned up as stated in section 2.4.6.1.
The CsCl-EtBr centrifuged plasmids were visualised on a 1.0 % agarose gel to compare with plas-
mids before CsCl-EtBr treatment (Figure 3.33). This gel showed no apparent difference between
plasmids from before and after CsCl-EtBr treatment. The CsCl-EtBr plasmids were given the
prefix (Cs-) to differentiate them from the untreated plasmids during transfection experiments.
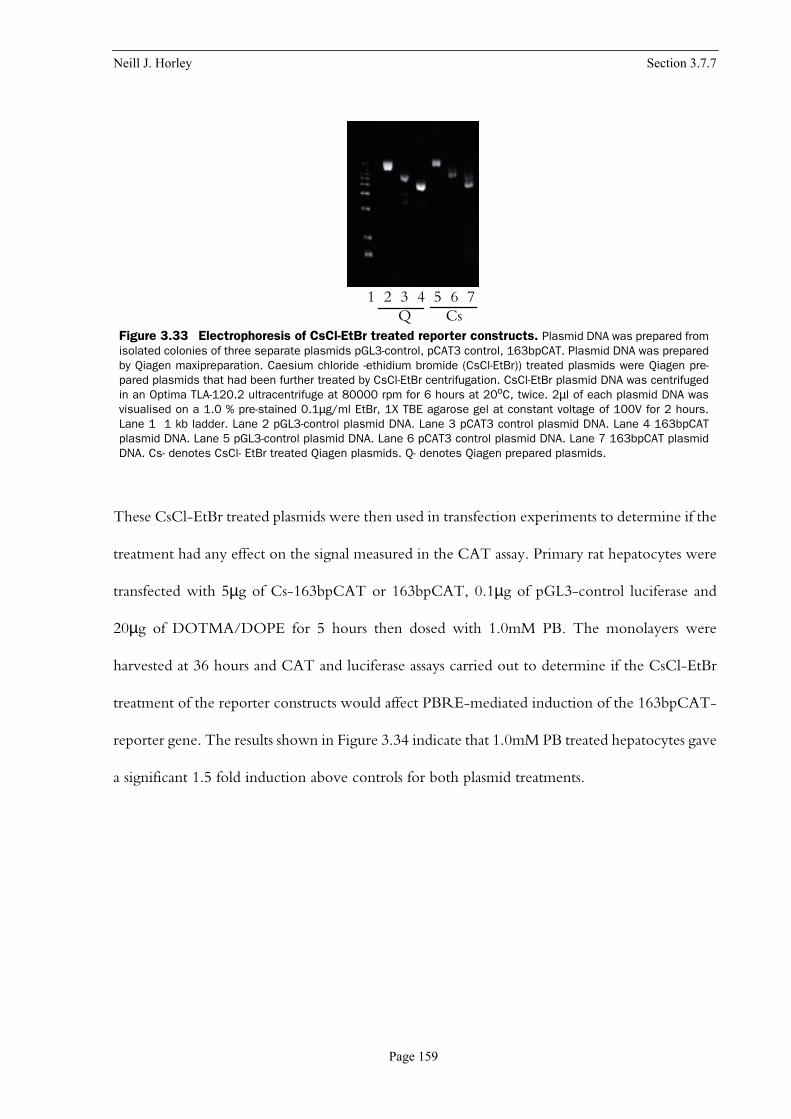
Neill J. Horley Section 3.7.7
Page 159
These CsCl-EtBr treated plasmids were then used in transfection experiments to determine if the
treatment had any effect on the signal measured in the CAT assay. Primary rat hepatocytes were
transfected with 5µg of Cs-163bpCAT or 163bpCAT, 0.1µg of pGL3-control luciferase and
20µg of DOTMA/DOPE for 5 hours then dosed with 1.0mM PB. The monolayers were
harvested at 36 hours and CAT and luciferase assays carried out to determine if the CsCl-EtBr
treatment of the reporter constructs would affect PBRE-mediated induction of the 163bpCAT-
reporter gene. The results shown in Figure 3.34 indicate that 1.0mM PB treated hepatocytes gave
a significant 1.5 fold induction above controls for both plasmid treatments.
1 2 3 4 5 6 7Q Cs
Figure 3.33 Electrophoresis of CsCl-EtBr treated reporter constructs. Plasmid DNA was prepared fromisolated colonies of three separate plasmids pGL3-control, pCAT3 control, 163bpCAT. Plasmid DNA was preparedby Qiagen maxipreparation. Caesium chloride -ethidium bromide (CsCl-EtBr)) treated plasmids were Qiagen pre-pared plasmids that had been further treated by CsCl-EtBr centrifugation. CsCl-EtBr plasmid DNA was centrifugedin an Optima TLA-120.2 ultracentrifuge at 80000 rpm for 6 hours at 20oC, twice. 2µl of each plasmid DNA wasvisualised on a 1.0 % pre-stained 0.1µg/ml EtBr, 1X TBE agarose gel at constant voltage of 100V for 2 hours.Lane 1 1 kb ladder. Lane 2 pGL3-control plasmid DNA. Lane 3 pCAT3 control plasmid DNA. Lane 4 163bpCATplasmid DNA. Lane 5 pGL3-control plasmid DNA. Lane 6 pCAT3 control plasmid DNA. Lane 7 163bpCAT plasmidDNA. Cs- denotes CsCl- EtBr treated Qiagen plasmids. Q- denotes Qiagen prepared plasmids.

Neill J. Horley Section 3.7.7
Page 160
Section 3.7.7.2 Optimisation of CAT assay
Experiments were carried out to determine if altering the cell lysate volume and the amount of
time the samples were heat-treated for would have any effect on the CAT assay signals obtained.
Cell lysate taken from transfection experiments describe in section 3.7.7.1 were heated at 65oC
for 20 minutes and the effects of this treatment upon the CAT activity exhibited by 163bpCAT
reporter constructs determined. The results shown in Figure 3.35 indicate that heat treatment of
the cell extract is necessary to inactivate endogenous deacetylase activity before the CAT assay
can be performed. Here different volumes of cell extract were heat-treated and compared with
untreated samples and the results determined in cpm.
NP NC NM CsP CsC CsM
**
*3.0
2.0
1.0
0Rat
io o
f CA
T/F
iref
ly
Treatment group
luci
fera
se a
ctiv
ity
Figure 3.34 Effect of CsCl-EtBr treatment on 163bpCAT transfected hepatocytes . Primary rat hepa-tocytes were transfected with 5µg of Cs-163bpCAT or 163bpCAT, 0.1µg of pGL3-control luciferase and 20µg ofDOTMA/DOPE for 5 hours then dosed with 1.0mM PB. Hepatocyte monolayers were harvested at 36 hours andassayed for CAT/luciferase activity and normalised as described in section 2.9.6. The normalised results of theseassays (luminescence) are expressed as a ratio of CAT/firefly luciferase activity. Data points were analysed usingStudent’s t-test. C = control, P = 1.0mM phenobarbital, M = mock transfected, N = untreated plasmid and Cs =CsCl treated reporter constructs. *Reporter activity in the presence of 1.0mM PB is significantly higher than in itsabsence. (P= 0.05, df=2, two-tailed t-test). **Reporter activity in the presence of 1.0mM PB is significantly higherthan in its absence. (P= 0.02, df=2, two-tailed t-test).

Neill J. Horley Section 3.7.7
Page 161
Figure 3.35 showed that the amount of cell extract used in the CAT assay was also a crucial factor
in obtaining significant CAT values. This was further investigated by altering the amount of cell
extract present in the CAT assay to determine if increasing cell lysate volume would increase the
signal. Cell lysate from both mock-transfected and 1.0mM PB-induced 163bpCAT containing
cells were analysed. Figure 3.36 indicates that by increasing the total cell lysate volume present
in the CAT assay that an increase in CAT enzyme activity was obtained, it also demonstrates that
below 5µl of lysate that the signal-to-noise ratio is such that no conclusions could be drawn from
the data. The values obtained beyond 60µl of lysate are not reliable, as the assay is non-linear
beyond a certain concentration of CAT enzyme.
CA
T a
ctiv
ity
HP5
NH
P5
HP20
NH
P20
HP40
NH
P40
0
400
800
1200
1600 **
*
Cell extract volume (µl)
(CPM
)
Figure 3.35 Effect of heat treatment upon CAT assay of 163bpCAT cell extracts . Primary rat hepa-tocytes were transfected with 5µg of 163bpCAT, 0.1µg of pGL3-control luciferase and 20µg of DOTMA/DOPE for5 hours then dosed with 1.0mM PB. Hepatocyte monolayers were harvested at 36 hours. Various volumes of PBinduced cell extracts (5µl-40µl) were heat treated at 65oC for 20 minutes and assayed for CAT activity as de-scribed in section 2.9.3. The result of this assay was expressed as cpm. Data points were analysed using Stu-dent’s t-test. H = heat-treated, NH = not heat-treated, Numbering denotes volume of cell extract used (µl).*Reporter activity in the presence of 1.0mM PB and heat-treated is significantly higher than in the absence of heattreatment. (P= 0.04, df=2, two-tailed t-test). **Reporter activity in the presence of 1.0mM PB and heat-treated issignificantly higher than in the absence of heat treatment. (P= 0.008, df=2, two-tailed t-test).
Neill J. Horley Section 3.7.7
Page 162
.
Section 3.7.7.3 Comparison between TK2B2-F-Luc and 163bpCAT reporter activity
The PBRE-containing reporters used in this thesis have shown 1.6-fold induction when
hepatocytes are treated with 1.0mM PB. Anderson’s 163bpCAT reporter, has been shown to
give in excess of 6-fold inductions when treated with 1.0mM PB in primary rat hepatocytes.
Experiments were carried out to compare the activation of CYP2B2 response elements in the
TK2B2-F-Luc construct (generated in this thesis), to that of the 163bpCAT construct designed
by Anderson’s group (Trottier et al., 1995).
Transfections were carried out using the two reporter constructs TK2B2-F-Luc and 163bpCAT.
The 163bpCAT plasmid used in these transfection experiments was treated using the conditions
outlined in the Anderson paper (Trottier et al., 1995). In the case of the 163bpCAT plasmid,
hepatocytes were transfected with 8µg of 163bpCAT, 5µg of pGL3-control luciferase and 20µg
of DOTMA/DOPE for 5 hours then dosed with PB. Hepatocytes were transfected with 8µg of
M5 P5 M20 P20 M60 P60 M100 P100
Cell extract volume (µl)
0
400
1200
800
1600
2000
CA
T a
ctiv
ity
**
**
*
(C
PM)
Figure 3.36 Variation of cell lysate volume effects the amount of CAT activity present . Primaryrat hepatocytes were transfected with 5µg of 163bpCAT, 0.1µg of pGL3-control luciferase and 20µg of DOTMA/DOPE for 5 hours then dosed with 1.0mM PB. Hepatocyte monolayers were harvested at 36 hours. Various vol-umes of 1.0mM PB cell extracts (5µl-100µl) were heat treated at 65oC for 20 minutes and assayed for CAT ac-tivity as described in section 2.9.3. The result of this assay was expressed as cpm. Data points were analysedusing Student’s t-test. M = Mock-transfected cell lysate, P = 163bpCAT-transfected cell lysate, Numbering de-notes volume of cell extract used. *Reporter activity of 60µl of control 163bpCAT transfected lysate is signifi-cantly higher than mock transfected lysate. (P= 0.03, df=2, two-tailed t-test). ** Reporter activity of control163bpCAT transfected lysate is significantly higher than mock transfected lysate. (P< 0.005, df=2, two-tailed t-test).

Neill J. Horley Section 3.7.7
Page 163
TK2B2-F-Luc, 0.3ng of pRL-TK Renilla and 20µg of DOTMA/DOPE for 5 hours then dosed
with 1.0mM PB. The monolayers were harvested at 48 hours and assayed according to the
reporter vectors used in each case. The results of these comparative assays are shown in Figure
3.37. This data shows that there was no significant difference between the two plasmids when
comparing the level of induction mediated by 1.0mM PB treated cells over control cells. As the
two-plasmid systems used incorporated two different reporter vectors, only the percentage fold
induction mediated by 1.0mM PB above controls was represented.
TKC TKP 163C 163P
**
80
100
120
140*
% fo
ld in
duct
ion
Anderson’s constructNJH construct
Figure 3.37 Comparison of PB mediated induction of the TK2B2-F-Luc and 163bpCAT constructs. Primary rat hepatocytes were transfected with 8µg of TK2B2-F-Luc, 0.3ng of pRL-TK Renilla or 8µg of 163CAT, 5µgof pGL3-control and mixed with 20µg of DOTMA/DOPE for 5 hours, then dosed with 1.0mM PB. Hepatocyte mono-layers were harvested at 48 hours and analysed for firefly luciferase/Renilla luciferase reporter and CAT/fireflyluciferase reporter activity respectively. Percentage fold inductions are expressed relative to the control hepato-cytes in each assay. A value of 100% was arbitrarily assigned to the level of activity in the control hepatocytes ineach assay and PB induction expressed as a percentage of this value. Data points were analysed using Student’st-test and showed no significant difference between the TK2B2-F-Luc and 163bpCAT reporters (n=3 per treatmentgroup). C denotes control hepatocytes in each assay. P denotes hepatocytes treated with 1.0 mM phenobarbital.TK denotes those hepatocytes transfected with the TK2B2-F-Luc reporter generated in this thesis, 163 denotesthose hepatocytes transfected with the Anderson contruct 163bpCAT. *Reporter activity in the presence 1.0mMPB is significantly higher than in the absence. (P = 0.04, df = 2, two-tailed t-test). ** Reporter activity in the pres-ence 1.0mM PB is significantly higher than in the absence. (P = 0.001, df = 2, two-tailed t-test).

Neill J. Horley Section 3.7.8
Page 164
Section 3.7.8 Effect of culture matrix components upon PBRE-mediated induc-tion
Adult primary rat hepatocytes lose their ability to respond to PB in primary cultures. This
phenomenon has been investigated by many groups with parameters such as the composition of
the culture media being altered (Waxman et al., 1990; Sinclair et al., 1990). The substratum to
which the hepatocytes were attached to, or overlaid with (Klienman et al., 1985; Schuetz et al.,
1988; Bissell et al., 1987; Sidhu et al., 1993) was also altered in an attempt to resolve this problem.
The original culture conditions used for the 163bpCAT-reporter construct utilised a matrigel
substratum (Trottier et al., 1995). The 163bpCAT construct had only been assessed in culture
conditions in which the hepatocytes were attached directly to the plastic Falcon flasks in our
system. The effect of three different substratum conditions were investigated for their effect on
the PB-mediated induction of the PBRE.
Hepatocytes were cultured either upon plastic Falcon flasks or in collagen type-I coated (150µg
/25cm2 flask) Falcon flasks, or as a hepatocyte monolayer with a Matrigel overlay (83.3µg/ml
solution). These solutions were prepared as detailed in section 2.6.5.2 and 2.6.5.3. Hepatocytes
were either seeded directly onto the plastic flask as in the case of the conventional and Matrigel
coated Falcon flasks, or seeded directly over the collagen-coated surface of the Falcon flasks.
Primary rat hepatocytes were transfected with 5µg of 163bpCAT, 0.1µg of pGL3-control
luciferase and 20µg of DOTMA/DOPE for 5 hours then dosed with 1.0mM PB. Hepatocyte
monolayers were harvested at 48 hours and assayed for CAT/Firefly luciferase activity and
normalised as described in section 2.9.6. Transfection of the Matrigel treated cells was carried out
prior to Matrigel treatment as the overlay inhibits the efficiency of the transfection procedure.
The Matrigel solution was added directly to the cells post-transfection.
A post-transfection microscopic examination of hepatocytes cultured on either conventional

Neill J. Horley Section 3.7.8
Page 165
plastic, collagen type-1, or Matrigel coated flasks (Figure 3.38) was carried out. Both 1.0mM PB-
induced (Figure 3.38 a, c, e) and control monolayers (Figure 3.38 b, d, f) were analysed. The
monolayers were examined at 36 hours and showed marked differences in the morphology of
the hepatocyte monolayers depending upon which form of substratum was used. The appearance
of each monolayer was compared with hepatocytes grown under the conventional Falcon flask
environment. All flasks showed a slight difference between control and treated monolayers, with
the 1.0mM PB-induced monolayers appearing more confluent and uniform. Conventionally
cultured hepatocytes were rather flat in appearance and not so uniform in their distribution
(Figure 3.38 a, b). The monolayers overlaid onto collagen type I flasks appeared more confluent
and slightly more rounded and spread out with less cell debris (Figure 3.38 c, d). The Matrigel
treated cells looked very similar to that of the conventionally cultured hepatocytes with regards
to confluence, the cells also did not spread very well over the surface of the flask. Upon closer
inspection the cells treated with Matrigel (Figure 3.38 e, f) were not flat in appearance but more
spherical and protruding from the flasks.

Neill J. Horley Section 3.7.8
Page 166
The appearance of each monolayer at 48 hours seemed to be consistent with that noted at 36
hours. The monolayers were harvested at 48 hours and their lysate analysed for CAT/Firefly
luciferase activity. The results shown in Figure 3.39 indicate that under conventional conditions
PBRE mediated induction of the 163bpCAT reporter was 1.5 fold greater than control samples.
This was also mirrored in monolayers cultured in the presence of Matrigel but to a lesser extent
with a 1.4 fold induction being recorded. Hepatocytes cultured in collagen type I coated flasks
a. b.
c. d.
e. f.
Figure 3.38 Morphological appearance of primary rat hepatocytes cultured with various matrix components. Primary rat hepatocytes were cultured either on conventional plastic Falcon flasks (a, b), collagentype I coated (150µg per 25cm2 flask) Falcon flasks (c, d), or overlaid (post-transfection) with Matrigel in an83.3µg/ml solution (e, f). Primary rat hepatocytes were transfected with 5µg of 163bpCAT, 0.1µg of pGL3-controlluciferase and 20µg of DOTMA/DOPE for 5 hours as described in section 2.8.3 and treated with control (a, c, e)or 1.0mM PB (b, d, f). Monolayers were photographed at 36 hours at a magnification of x 32.

Neill J. Horley Section 3.7.8
Page 167
did not show any significant difference between control and PB-treated monolayers. The data
suggests that PBRE mediated induction of the CAT reporter gene is affected by the type of
substratum incorporated in the culture conditions. There appears to be no significant difference
between hepatocytes cultured in the conventional manner with those cultured in the presence
of Matrigel.
The induction of CYP2B2 mRNA by phenobarbital was investigated using an RNAse
protection assay using the conditions outlined in Figure 3.8, to ascertain if the transfection of the
163bpCAT-reporter construct would affect transcription of the CYP2B2 mRNA species. The
results obtained from this experiment suggest the transfection of 163bpCAT reporter constructs
into the primary rat hepatocyte system did not affect the induction of CYP2B mRNA by PB as
measured by RNAse protection (Figure 3.40).
Col
P
Col
C
Col
M
NP
NC
NM
Mat
P
Mat
C
Mat
M
Cell matrix substratum
0
2.5
2.0
1.5
1.0
0.5Rat
io o
f CA
T/F
iref
ly
3.0
*
*
luci
fera
se a
ctiv
ity
Figure 3.39 Comparison of the effects of matrix components upon PBRE-mediated induction . Pri-mary rat hepatocytes were cultured either on conventional plastic Falcon flasks, collagen type I coated (150µg per25cm2 flask) Falcon flasks, or overlaid (post-transfection) with Matrigel in an 83.3µg/ml solution. Primary rathepatocytes were transfected with 5µg of 163bpCAT, 0.1µg of pGL3-control luciferase and 20µg of DOTMA/DOPEfor 5 hours and dosed with 1.0mM PB as described in section 2.8.3. The normalised results of these assays wereexpressed as the ratio of CAT/Firefly luciferase activity. Data points were analysed using Student’s t-test. C =control, P = 1.0mM phenobarbital, M denotes mock transfected cells. Col = Collagen treated flasks, N = conven-tional Falcon flasks, and Mat = Matrigel overlays. *Reporter activity in the presence of 1.0mM PB is significantlyhigher in conventional and Matrigel treated cultures than in collagen type I treated cultures. (P= 0.02, df=2, two-tailed t-test)

Neill J. Horley Section 3.7.9
Page 168
Section 3.7.9 Effect of reporter ratios upon 163bpCAT activity
The effect of altering the amount of luciferase reporter construct and altering the time of
transfection was investigated to determine if this would have an impact upon the level of
induction exhibited by the 163bpCAT construct.
Primary rat hepatocytes were transfected with a constant 5.0µg of 163bpCAT reporter /flask
whilst the amount of pGL3-control luciferase reporter was altered from 1.0µg-0.01µg /flask.
1 2 3 4 5 6 7 8 9
A1
A2400
300
200
Figure 3.40 Effect of transfection protocol upon PB induction of CYP2B2 mRNA. Primary rat hepato-cytes were transfected with 5µg of 163bpCAT, 0.1µg of pGL3-control luciferase and 20µg of DOTMA/DOPE for 5hours then dosed with 1.0mM PB. These hepatocytes were then harvested as described in section 2.7.5. RNAseprotection assays were carried out on both in vitro and in vivo rat total RNA samples using an [α-32P] labelled anti-sense riboprobe to CYP2B2 cDNA. Hepatocyte monolayers were treated with control or 1.0mM PB for 3 days andRNA harvested as described in section 2.7.5. Rats were dosed with vehicle, PB 80mg/kg i.p. for 3 days and RNAextracted as described in section 2.7.4. Anti-sense CYP2B2 probe was transcribed using a Cla I cut Xlig plasmidwith SP6 polymerase. Full-length Xlig probe was 426 bp in length giving rise to a 379 bp protected fragment. 30µgof total RNA was used for each lane. Lane 1 contains 100bp ladder. Lane 2 contains yeast tRNA with RNAse T1.Lane 3 contains yeast tRNA without RNAse T1. Lane 4 contains in vivo PB dosed liver RNA sample. Lane 5 con-tains control hepatocyte RNA. Lane 6 contains PB-dosed hepatocyte RNA. Lane 7 contains full length probe. Lane8 contains control transfected hepatocyte RNA. Lane 9 contains PB-dosed transfected hepatocyte RNA. RNAseprotection assays were run on a 6% denaturing polyacrylamide gel in 1x TBE at 300V for 3 hours. The gel wasfixed, dried and exposed to hyperfilm for 3 days at -70oC. Arrow A1 indicates full-length probe. Arrow A2 indicatesprotected probe-mRNA complex with the accompanying vector DNA digested away by RNAse T. The picture is acomposite as a number of lanes have been removed between the T+ve lane and the ladder lanes in the interestof clarity.

Neill J. Horley Section 3.7.9
Page 169
This combination of reporter constructs was then mixed with 20µg of DOTMA/DOPE for 5
hours at 4 hours post-isolation or 24 hours post isolation and dosed with 1.0mM PB. The
hepatocytes were harvested at 48 hours and analysed for CAT and firefly luciferase activity as
described in section 2.9.3 and 2.9.4.
Figure 3.41 shows the dynamic effect of altering the amount of pGL3-control firefly luciferase
reporter upon the normalised activity of 163bpCAT-reporter enzyme produced in the
hepatocyte cell lysate. These data clearly show the direct correlation between the amount of
reporter that was present and the overall signal that was obtained. Here, as the amount of
pGL3-control luciferase reporter was decreased there was an increase in normalised reporter
activity. This trend was seen with both transfection time-frames, the difference between the two
transfection times upon reporter activity was very subtle and can only be assessed when the
induction ratios were analysed (Figure 3.42).

Neill J. Horley Section 3.7.9
Page 170
M
M
C 1
µgC
1µg
P 1µ
gP
1µg
C 0
.1µg
P 0.
1µg
C 0
.1µg
P 0.
1µg
C 0
.01µ
g
P 0.
01µg
C 0
.01µ
g
P 0.
01µg
*
A
B
0.3
0.2
0.1
0
0
0.1
0.2
0.3
Rat
io o
f CA
T/F
iref
lyR
atio
of C
AT
/Fir
efly
Vector concentration µg/flask
luci
fera
se a
ctiv
itylu
cife
rase
act
ivity
Figure 3.41 Effect of luciferase reporter concentration and time of transfection upon 163bpCAT reporter activity. Primary rat hepatocytes were transfected with a constant 5µg of 163bpCAT reporter /flaskwhilst the amount of pGL3-control luciferase reporter was altered from 1µg, 0.1, 0.01µg /flask. This combinationof reporter constructs was then mixed with 20µg of DOTMA/DOPE for 5 hours and dosed with 1.0mM PB. Trans-fection was carried out at 4 hours (A) or at 24 hours (B) post isolation. The hepatocytes were harvested at 48hours and analysed for CAT and firefly luciferase activity. The normalised results of these assays are expressedas the ratio of CAT/Firefly luciferase activity. Data points were analysed using Student’s t-test. C = control, P =1.0mM phenobarbital, M denotes mock transfected cells. *Reporter activity in the presence of 1.0mM PB is sig-nificantly higher in hepatocytes transfected at 24 hours post isolation (P = 0.03, df =2, two-tailed t-test).
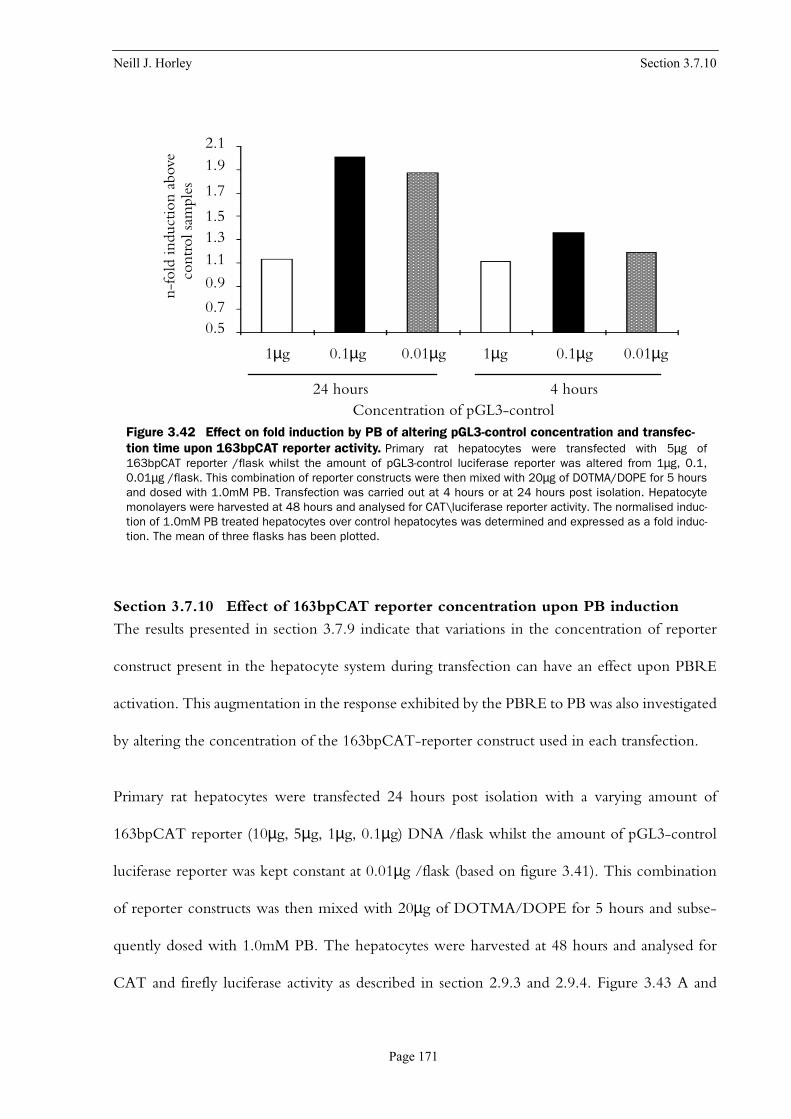
Neill J. Horley Section 3.7.10
Page 171
Section 3.7.10 Effect of 163bpCAT reporter concentration upon PB induction
The results presented in section 3.7.9 indicate that variations in the concentration of reporter
construct present in the hepatocyte system during transfection can have an effect upon PBRE
activation. This augmentation in the response exhibited by the PBRE to PB was also investigated
by altering the concentration of the 163bpCAT-reporter construct used in each transfection.
Primary rat hepatocytes were transfected 24 hours post isolation with a varying amount of
163bpCAT reporter (10µg, 5µg, 1µg, 0.1µg) DNA /flask whilst the amount of pGL3-control
luciferase reporter was kept constant at 0.01µg /flask (based on figure 3.41). This combination
of reporter constructs was then mixed with 20µg of DOTMA/DOPE for 5 hours and subse-
quently dosed with 1.0mM PB. The hepatocytes were harvested at 48 hours and analysed for
CAT and firefly luciferase activity as described in section 2.9.3 and 2.9.4. Figure 3.43 A and
1µg 0.1µg 0.01µg 1µg 0.1µg 0.01µg
24 hours 4 hours
n-fo
ld in
duct
ion
abov
e
Concentration of pGL3-control
co
ntro
l sam
ples
0.5
2.11.9
1.5
1.1
1.7
1.3
0.9
0.7
Figure 3.42 Effect on fold induction by PB of altering pGL3-control concentration and transfec-tion time upon 163bpCAT reporter activity. Primary rat hepatocytes were transfected with 5µg of163bpCAT reporter /flask whilst the amount of pGL3-control luciferase reporter was altered from 1µg, 0.1,0.01µg /flask. This combination of reporter constructs were then mixed with 20µg of DOTMA/DOPE for 5 hoursand dosed with 1.0mM PB. Transfection was carried out at 4 hours or at 24 hours post isolation. Hepatocytemonolayers were harvested at 48 hours and analysed for CAT\luciferase reporter activity. The normalised induc-tion of 1.0mM PB treated hepatocytes over control hepatocytes was determined and expressed as a fold induc-tion. The mean of three flasks has been plotted.
Neill J. Horley Section 3.7.10
Page 172
Figure 3.43 B show the results of the normalised activation of the PBRE-containing reporter and
the ratio of PB induction respectively. The lower limit of the assay occurs at between 0.1µg and
1µg of 163bpCAT reporter (Figure 3.43A) where the activity of the reporter is not significantly
different from that of the mock-transfected cells. The normalised PBRE reporter activity
increases significantly as the amount of 163bpCAT present in the transfection increases above this
value.
The results presented in Figure 3.43B indicate that although there is a general increase in
163bpCAT activity linked to an increase in 163bpCAT-reporter concentration, this is not
reflected in the overall induction exhibited by cells when dosed with 1.0mM PB. Here, the
induction of PB-dosed cells above control samples is fairly consistent across the three orders of
magnitude of 163bpCAT concentrations used.

Neill J. Horley Section 3.7.10
Page 173
M C 0.1 P 0.1 C1 P1 C5 P5 C10 P10
12
10
8
6
4
2
0
*
Concentration of 163bpCAT (µg)/flask
Rat
io o
f CA
T/F
iref
ly
A.
B.
0.1 µg 1µg 5µg 10µg M
Concentration of 163bpCAT (µg)/flask
0.95
1.05
1.15
1.25
1.35
1.45
luci
fera
se a
ctiv
ity
1.65
Fold
indu
ctio
n ab
ove
cont
rol s
ampl
es
1.55
Figure 3.43 (A) Normalised activation of the PBRE containing reporter under various 163bpCAT concentrations, (B) Ratio of PB induction exhibited by these cultures. Primary rat hepatocytes weretransfected with a varying amount of 163bpCAT reporter (10µg, 5µg, 1µg, 0.1µg) DNA /flask whilst the amount ofpGL3-control luciferase reporter was kept constant at 0.01µg /flask (based on figure 3.41). This combination ofreporter constructs was then mixed with 20µg of DOTMA/DOPE for 5 hours, 24 hours post isolation and dosedwith 1.0mM PB. The hepatocytes were harvested at 48 hours and analysed for CAT and luciferase activity. (A) Thenormalised results of these assays are expressed as the ratio of CAT/Firefly luciferase activity. Data points wereanalysed using Student’s t-test. C = control, P = 1.0mM phenobarbital, M denotes mock transfected cells. *Re-porter activity present in cells containing 163bpCAT is significantly higher in hepatocytes than mock cells (P<0.009, df =2, two-tailed t-test). (B) The normalised fold induction of 1.0mM PB treated hepatocytes over controlhepatocytes was determined and expressed as fold induction above control samples.

Neill J. Horley Section 3.7.11
Page 174
Section 3.7.11 Xenobiotic induction of PBRE containing 163bpCAT reporter con-struct
The induction of the 163bpCAT-reporter gene by various phenobarbital-like inducers was
investigated by integrating all of the parameters controlled for thus far in the transfection reporter
assay system. Three compounds at various concentrations were tested for their activation of the
PBRE reporter construct. This was carried out to see if the system could differentiate between
different chemicals at different potencies. Primary rat hepatocytes were transfected 24 hours post-
isolation with 10µg of 163bpCAT, 0.01µg of pGL3-control luciferase and 20µg of
DOTMA/DOPE for 5 hours then dosed with one of three chemicals (0.5 mM PB, 1.0mM PB
or 0.5mM CFA, 1.0mM CFA or 10µM GWY, 25µM GWY). Hepatocyte monolayers were
harvested at 48 hours and assayed for CAT/firefly luciferase activity and normalised as described
in section 2.9.3 and 2.9.4.
The results presented in Figure 3.44 showed that some modulation of the PBRE containing
reporter construct was detectable with the current system. Hepatocytes transfected with the
163bpCAT reporter showed a significant 3.3 fold induction with 1.0mM PB and a 1.8 fold
induction with 0.5mM PB. The GWY compound was found to be more potent than PB by
RNAse protection assay. At 25µM and 10µM with this transfection system, GWY gave 2B2
inductions of 1.93 and 1.6 fold over control respectively. CFA at 1.0mM gave only a 1.24 fold
induction above the control DMSO flasks.

Neill J. Horley Section 3.7.12
Page 175
Section 3.7.12 Transcriptional regulation of the PBRE by the nuclear orphan receptor mCAR
Resent publications by Negishi’s group have suggested a link between the transcription
regulation of the PB-inducible Cyp2b10 genes and the nuclear orphan receptors CAR and RXR
(Honkakoski et al., 1998c). It is thought that CAR regulates the enhancer activity of the
PBREM’s nuclear receptor (NR1, NR2) sites as a heterodimer with the retinoid X receptor
(RXR). This serves as a common heterodimerisation partner for the putative orphan nuclear
receptor. Based on the findings of this group and coupled to the identification of two isoforms
of the orphan nuclear hormone receptor CAR (Choi et al., 1997), it was possible to devise a
sub-cloning strategy to further characterise the PBRE/PBREM.
*
M C
0.5m
MPB
1.0m
MPB
DM
SO
GW
Y 2
5µM
GW
Y 1
0µM
CFA
1.0
mM
CFA
0.5
mM
0
1.0
0.2
0.4
0.6
0.8
Rat
io o
f CA
T/F
iref
ly
Compound used
luci
fera
se a
ctiv
ity
Figure 3.44 Modulation of the PBRE present in 163bpCAT by various xenobiotics. Primary rat hepa-tocytes were transfected 24 hours post-isolation with 10µg of 163bpCAT, 0.1µg of pGL3-control luciferase and20µg of DOTMA/DOPE for 5 hours, then dosed with one of three chemicals (0.5 mM PB, 1.0mM PB or 0.5mMCFA, 1.0mM CFA or 10µM GWY, 25µM GWY). The hepatocytes were harvested at 48 hours and analysed for CATand firefly luciferase activity. The normalised results of these assays are expressed as the ratio of CAT/Fireflyluciferase activity. Data points were analysed using Student’s t-test. C = control, PB = phenobarbital, M = mocktransfected cells, DMSO = dimethyl sulfoxide, GWY = Glaxo-Wellcome compound, CFA = clofibric acid. *Reporteractivity in the presence of 1.0mM PB is significantly higher than in its absence. (P = 0.008, df =2, two-tailed t-test).

Neill J. Horley Section 3.7.12
Page 176
First strand cDNA was generated using 500ng of oligo-dT (12-18) primers and 1-5µg of mouse
total RNA (a kind gift from M. Choudhury) as described in section 2.5.2 and this cDNA was
then used as a template for PCR amplification as described by section 2.5.3. An 1160 bp fragment
of the mCAR nuclear receptor (Accession number AF009327) starting at 120 bp and finishing
at 1280 bp was amplified using this PCR strategy. This region was chosen as it contained the
correct frame translational start and stop codons at 150 bp and 1230 bp respectively. The upper
5’ GCC TGC TGC CTA AGG GAT CCA GGA GAC CAT GAC AGC 3’(5’-Prime) primer
contained two base-pair mismatches (shown in bold) designated primer BAMPR1. The lower
5’ GGT CTG GGG AAA GGA TCC AAG CCT GGG CCT CAA GTG 3’ (3’-Prime) primer
incorporated one base-pair mismatch (shown in bold) designed primer BAMPR2. This change
in nucleotide sequence enabled a BamH I site to be introduced into either side of the 1160 bp
fragment generated. This alteration would then make subsequent sub-cloning simpler.
PCR was carried out as described in section 2.5.3 and gave rise to a PCR product of 1160 bp
(Figure 3.45). PCR products were purified using a Qiagen Qiaquick PCR spin columns as
described in section 2.5.1 and ligated with pGEM-T vector (Promega), overnight at 4oC. This
ligation mixture was transformed into CaCl2 XL-1 Blue E. coli cells. Several colonies were
isolated (section 2.4.3) and double restriction digested (section 2.4.7) with BgL II/ Sal I to verify
the presence of the mCAR PCR insert, these clones were designated mCAR-pGEM-T.

Neill J. Horley Section 3.7.12
Page 177
The pcDNA3.1 (-) (Invitrogen) expression vector and mCAR-pGEM-T vector were restriction
digested using BamH I and gel purified. The gel-excised pcDNA3.1 (-) vector was ligated into
the BamH I-digested mCAR-pGEM-T vector and transformed into CaCl2 XL-1 Blue E. coli
cells. Mini-preparations were made from positive cultures (section 2.4.3) and a restriction digest
(section 2.4.7) with Bgl II/Xho I performed, which gave rise to fragments of 680, 909, 1589 and
4978 bp in size. This digest was carried out to verify that the plasmids contained the mCAR
insert as shown in Figure 3.46. These clones were designated mCAR-pcDNA3.1 (-). This
sub-cloning strategy was non-directional therefore three clones were chosen and shown to
contain the correct size fragments before being sequenced using the primer 5’ GAG ATG AAG
CTT GCA GAT CGT GGA CAC AAC CCT C 3’ as confirmation of the clone’s integrity.
1 2 3 4
1160bp
1.0kb
0.85kb
1.6kb
3.0kb
0.5kb
0.2kb
Figure 3.45 PCR amplification of 1160 bp mCAR cDNA. PCR amplification of an 1160 bp fragment ofthe mCAR cDNA was carried out using primer BAMPR1 5’ GCC TGC TGC CTA AGG GAT CCA GGA GAC CAT GACAGC 3’(5’-Prime) containing 2 base-pair mismatches (shown in bold) and primer BAMPR2 5’ GGT CTG GGG AAAGGA TCC AAG CCT GGG CCT CAA GTG 3’ (3’-Prime) containing one base-pair mismatch (shown in bold). PCR wascarried out as described in section 2.5.3 and consisted of 1-minute at 94oC then 25 cycles at 3.0 minute de-naturing at 94oC, 3.0 minute annealing at 68oC and 3.0-minute polymerisation at 68oC and cooling the reactionto room temperature. 5µl of the 50µl PCR reaction were run on a 1.2% pre-stained 0.1µg/ml EtBr, 1X TBE aga-rose gel at constant voltage of 70V for 2 hours. Lane 1 1 kb+ ladder. Lane 2 5µl PCR product without any Klen-Taq-1 DNA polymerase. 3 PCR product without any cDNA template. Lane 4 5µl of mCAR PCR product.

Neill J. Horley Section 3.7.12
Page 178
These mCAR expression vectors were now ready to be used to verify PBREM-dependent
reporter gene activity in the 163bpCAT vectors used previously. The next sequence of
experiments to be carried out, would have been to determine whether nuclear receptor CAR-
dependent transcriptional activation does occur with these 163bpCAT vectors in the absence of
PB, and to determine the role, if any, of androstenol in the culture medium and the effects on
PB-mediated induction.
1 2 3 4 5 6 7
0.65kb
0.85kb
1.0kb
1.65kb
2.0kb
5.0kb
Figure 3.46 Restriction digest of the mCAR-pcDNA 3.1 (-) clones. The mCAR-pcDNA 3.1 (-) cloneswere double restriction digested with BgL II/Xho I and run on a 1.0 % pre-stained 0.1µg/ml EtBr, 1xTBE agarosegel at constant voltage of 70v for 2 hours to separate fragments of the mCAR-pcDNA 3.1(-) vector. This givesrise to fragments of 680, 909, 1589 and 4978 bp. Lane 1 1 kb ladder. Lanes 2, 4 and 6 uncut plasmids. Lanes3, 5 and7 BglII/Xho I cut plasmids.

Neill J. Horley Section 4.1.1
Page 179
Chapter 4 Discussion
Section 4.1 PB induction of the rat CYP2B2 gene at the mRNA level
An aim of this thesis was to establish an in vitro primary rat hepatocyte culture system which was
highly responsive to PB at both RNA and protein levels. This culture system would be used in
the characterisation of the putative CYP2B2 phenobarbital response element (PBRE). It was
anticipated that this hepatocyte system could also be used to develop a trans-activation assay for
high-throughput drug screening to identify inducers of the rat CYP2B2 gene and to identify the
mechanisms of induction by PB.
Section 4.1.1 Optimisation of the RNAse protection assay
Progress in understanding the molecular mechanisms involved in the regulation of the CYP2B1
and CYP2B2 genes by chemicals such as PB, has largely been hampered by the lack of a suitable
cell culture system. Many groups have been unable to develop cell lines (derived from hepatoma
cells), that express either constitutive or PB-induced levels of CYP2B1/2 (Schuetz et al., 1988).
This inability to express sufficient levels of CYP2B1/2 has been ascribed to “dedifferentiation”
of the hepatoma cell lines. The implementation of a reproducible in vitro model to study CYP2B2
induction would provide a means by which the mechanism of CYP2B2 induction could be stud-
ied. This system must accurately model both the resting liver and changes that may occur in vivo
following administration of PB. Such an in vitro model would mean that the problems encoun-
tered in vivo systems such as bioavailability, liver, and blood levels of the drug would be avoided.
During the course of the present studies a primary rat hepatocyte culture system was established
in this laboratory to demonstrate PB-mediated induction of the CYP2B2 gene. As CYP2B1 and
CYP2B2 gene DNA sequences share 97% identity a suitable technique was required, which
could differentiate between transcripts of high sequence similarity. Several groups have studied
the expression of CYP2B1/2 mRNA by using oligonucleotide probes, which were directed

Neill J. Horley Section 4.1.1
Page 180
against a sequence located in the region of 997 to 1015 base pairs from the initiation codon of
the cDNA (Omiecinski et al., 1985; Omeicinski, 1986; Giachelli and Omiecinski, 1987). How-
ever Atchison and Adesnik (1986) have identified four additional members of the CYP2B family,
three of which hybridised to these oligonucleotide probes. There are therefore multiple CYP2B
genes which are detected by these oligonucleotide probes. The problem of specificity arises as
the oligonucleotide probes are short (25 bp) and so have the disadvantage that the identification
of a particular mRNA is only based on a short section of sequence. By contrast, RNAse
protection assays can use probes which are 300-400 bp in length, which provides specificity and
allows the detection of rare transcripts as they can be labelled to a higher specific activity than
oligonucleotide probes. The expression of the CYP2B2 gene was examined using the RNAse
protection assay, as this sensitive technique would allow the degree of specificity required for
differentiating between CYP2B1 and CYP2B2, and between other CYP2B species.
Section 4.1.1.1 Probe Specificity
The riboprobe constructed for these RNAse protection studies was designed to contain highly
divergent regions between CYP2B1 and CYP2B2 (Kumar et al., 1983; Fujii-Kuriyama et al.,
1982) and also between CYP2B3 (Labbe et al., 1988) and CYP2B12 (Keeney et al., 1998).
Sequence analysis of the sub-cloned fragment of the CYP2B2 cDNA (Figure 3.2) showed that
the sequence was in complete agreement with that of the published data for CYP2B2 (Kumar et
al., 1983). The RNAse protection assay has been shown to detect > 50% of single base-pair mis-
matches in a sequence (Myers et al., 1985; Lee and Costow, 1987). The section of the CYP2B2
cDNA that was chosen for sub-cloning contains 17 bp mismatches with CYP2B1 over 379 bp;
on this basis the CYP2B2 probe has a 7.6 x10⁻⁶ chance of failing to discriminating between the
CYP2B1 and CYP2B2 transcripts. RNAse protection assays carried out in this laboratory using
a probe which spanned the region 967 bp to 1138 bp of the CYP2B2 cDNA showed that
discrimination between CYP2B1 and CYP2B2 mRNA species was possible (Bars et al., 1992).

Neill J. Horley Section 4.1.1
Page 181
The probe used in this thesis has been designed to contain highly divergent regions of the
CYP2B cDNA. The probe used by Bars et al. (1992) contained 13 mismatches between the
CYP2B1 and CY2B2 cDNAs whereas the probe used in this thesis contains 17 bp mismatches
between CYP2B1 and CYP2B2. It is on this evidence that the assumption is made that the probe
used in this thesis is specific for CYP2B2 mRNA, but this has not been demonstrated
experimentally.
RNAse protection assays were performed on control and PB-induced in vitro and in vivo samples
(Figure 3.4). A number of low molecular weight bands are present in this RNAse protection
assay that were not anticipated (Figure 3.4, Arrow A3 and A4). There are a number of possible
reasons for the presence of these low molecular weight bands in these RNAse protection assays.
Firstly, the bands may have been produced as a result of hybridisation of the probe to other
CYP2B species, or that the probe was hybridising to other RNA transcripts, which were not
being digested by the RNAse digest step. This would indicate that the probe was not as specific
as it was originally intended. It is believed this is unlikely given the specificity of the CYP2B2
probe as outlined above.
An alternative cause for the low molecular weight bands present in the RNAse protection assays
is the over-digestion or non-specific digestion of 2B2: 2B2 hybrids during the RNAse digestion
step of the protocol. This would lead to cleavage of the RNA: RNA hybrids and the generation
of smaller protected fragments (Ambion technical documents). Examination of the Xlig cDNA
insert (Figure 3.2) reveals a region containing an A/T rich region (15/20) at nucleotides 207-227
bp. Regions of the RNA: RNA hybrid that contain A/T rich sections are prone to ‘breathing’
or a relaxing of the double strand formation fragments (Ambion technical documents). This ‘re-
laxing’ of the A/T rich region may result in cleavage by RNAse A of the RNA: RNA hybrid,
resulting in the generation of smaller protected fragments (Ambion technical documents); a sim-

Neill J. Horley Section 4.1.1
Page 182
ilar phenomenon was observed by Bell and Elcombe (1991b). It is known that even with a
perfectly homologous probe and template that RNAse digestion can generate spurious low
molecular weight bands (Bell and Elcombe, 1991b).
The low molecular weight bands visible in the protections carried out in this thesis (Figure 3.4-
8) were thought to be occurring as a consequence of some contaminant component of RNAse
A stock solution that was not being removed during its preparation. Experiments were carried
out to control for this aspect by altering the commercial supply of the RNAse A stock (data not
shown). It was found that different commercial supplies of RNAse A could affect whether the
presence of low molecular weight bands were observed. Different ribonucleases attack RNA in
a sequence specific manner. RNAse T1 specifically attacks the 3’-phosphate groups of G residues
and cleaves the adjacent 5’-phosphate linkage, whereas RNAse A cleaves the 3’ at pyrimidine
residues. A comparison between two types of endoribonucleases was undertaken to determine if
the incidence of spurious low molecular weight bands could be reduced. Figure 3.6 shows a
comparison of the effects of using RNAse A and T1. The data present in Figure 3.6a indicate
that as the concentration of RNAse A used on each sample is reduced, the intensity of the spu-
rious bands is also reduced with a corresponding increase in the protected CYP2B2 fragment. It
follows that as less RNAse A is being used that there is less of an opportunity for the samples to
be exposed to unwanted RNAse A contaminants. Figure 3.6b shows that by using an alternative
endoribonuclease the incidence of spurious bands is reduced. These experiments suggest that the
lower molecular bands present in many of the protections assays were a consequence of RNA:
RNA hybrid degradation due to some contaminant component of RNAse A stock solutions.
The data present above suggest that the RNAse protection assay used in this thesis is specific for
CYP2B2 mRNA. It also demonstrates that the incidence of low molecular weight bands is a
consequence of the type and source of endoribonuclease used during the RNAse digestion step.

Neill J. Horley Section 4.1.2
Page 183
Section 4.1.2 Comparison of CYP2B2 expression levels by PB in vitro and in vivo
The optimised RNAse protection assay was used to investigate whether PB induced CYP2B2
mRNA in vitro and in vivo. The results obtained in this assay should show a size difference
between the full-length probe and the protected CYP2B2 mRNA species present in each
sample. The in vivo samples produced by dosing rats with PB (80mg/kg (i.p.) for 3 days) show a
protected fragment which appears to be of a similar size to that of the full-length probe (Figure
3.4). This result suggests that the signal obtained in the in vivo PB-treated sample is not protected
CYP2B2 mRNA but is the signal obtained from full-length probe. Results presented in Figure
3.40 demonstrate that this is not the case. Here, the true size difference between full-length probe
and protected CYP2B2 mRNA bands can be seen by comparing lane 3 and lane 4 respectively.
Full-length probe and protected CYP2B2 mRNA appear to be similar in size for the in vivo PB-
treated samples in Figure 3.4. This was due to overexposure of the autoradiograph in order to
obtain a clear PB in vitro signal. This has the effect of making the distinction between full-length
probe and protected fragments less defined. The yeast tRNA lanes present in Figure 3.4 demon-
strates that the CYP2B2 probe used in this RNAse protection assay is full length and intact.
Figure 3.4 also demonstrates that CYP2B2 mRNAs is highly induced in our primary rat hepa-
tocyte culture system when dosed for three days with 1.0mM PB compared to control cells.
Control hepatocytes showed no detectable constitutive level of CYP2B2 mRNA expression in
this culture system. However, PB-treated hepatocyte samples showed extremely high levels of
CYP2B2 mRNA expression. The in vivo samples produced by dosing rats with PB (80mg/kg
(i.p.) for 3 days) also showed marked PB induction of the CYP2B2 mRNA. Control in vivo
samples also showed a very low level of constitutively expressed CYP2B2 mRNA. Comparison
between in vitro and in vivo PB induced samples showed that the level of CYP2B2 mRNA
expression in vivo was higher than that of the in vitro treated samples. One possible cause for this
difference may have been that the in vitro samples were taken from cultures exposed to PB for 72
Neill J. Horley Section 4.1.2
Page 184
hours, which, as demonstrated in Figure 3.13 was around the time-point when the CYP2B2
mRNA signal begins to decline. Alternatively the lower in vitro signal may have been attributable
to the culture conditions under which the hepatocytes were maintained. Nevertheless the level
of PB-induced CYP2B2 mRNA is still extremely high in our in vitro samples.
The results obtained with this protection assay (Figure 3.4) show that the primary rat hepatocyte
culture system used in this thesis is able to support PB-induced increases in CYP2B2 mRNA.
The hepatocyte culture conditions used in Figure 3.4 consisted of cells grown on plastic flasks in
CL15 media containing 8.3% foetal calf serum (FCS). The culture conditions used here are very
different from those documented as being necessary for PB-mediated CYP2B2 induction (New-
man and Guzelian, 1982; Waxman et al., 1990). Both Waxman’s and Newman’s group include
a cellular support matrix in their cultures. Waxman has also stated that CYP2B2 induction is
reduced in the presence of FCS. Using protection assays I have been able to show that culture
conditions such as the presence of foetal calf serum, or the absence of extracellular substratum or
complex media additives have no effect on PB-mediated induction of CYP2B2 (data not shown,
Figure 3.38-39 and 3.14).
It is believed that these experiments show that we have a CYP2B2 specific RNAse protection
assay. They also show that our primary rat hepatocyte culture system supports PB-mediated
induction of CYP2B2 mRNA. The induction seen in hepatocytes in this system suggests that
the PBRE regulating CYP2B2 gene expression remains active for a minimum of 3 days. This
demonstrates the validity of our system as a means for studying the mechanism of PB induction.
With the RNAse protection assay it is possible to detect several mRNA species in a single
hybridisation assay provided the probes are designed to give transcripts of different lengths. Using
this approach certain "house-keeping" genes could also have been included in this assay. This
would have enabled the quantification of mRNA expression and interpretation of RNA

Neill J. Horley Section 4.1.3
Page 185
modulation, providing proof of equal RNA loading and allowing normalisation of signal. Such
"house-keeping" genes as albumin, β-actin, cyclophilin, glyceraldehyde-3-phosphate-dehydro-
genase (GAPDH) and ribosomal proteins could be used as normalisation probes in this assay.
However, these gene products have also been shown to be hormonally controlled or to vary in
abundance from tissue to tissue (Savonet et al., 1997; Thellin et al., 1999). The use of 18s or 28s
rRNA would provide a better option as a normalising probe as the abundance of the target
mRNA would be paralleled by the amount of total RNA present. The use of a normalising probe
may have helped determine if the different levels in signal obtained between in vivo and in vitro
PB-treated samples was due to fluctuations in the amounts of mRNA used. However, the
multiple bands produced by the CYP2B2 mRNA gene products may have hindered the
interpretation of the bands produced by "house-keeping" gene products. The presence of more
than one probe in the assay would also diminish the ability to accurately quantify mRNA, as the
signal-to-noise ratio would be reduced. This is more prevalent when an abundant isoform
produces a higher signal that masks the signal obtained from a low abundance isoform. The use
of a normalising probe as an internal standard would have been advantageous for monitoring the
fluctuations in signal between samples in this thesis. However, the caveats of using this method
of normalising signal would have to be investigated further before it should be implemented.
Section 4.1.3 Induction of CYP2B2 by various chemical compounds
It has been demonstrated that our primary rat hepatocyte system supports PB-mediated induction
of the CYP2B2 mRNA (Figure 3.4). It was uncertain whether the induction of CYP2B2
mRNA measured by the RNAse protection assay was a compound-specific response. Further
protection assays were carried out upon primary hepatocyte cultures to determine whether this
CYP2B2 response could be shown with other structurally dissimilar compounds (Figure 3.5 and
Figure 3.8). Experiments carried out by Bars et al. (1993) had shown that CYP2B proteins and
CYP2B mRNAs were induced with 1.0 mM clofibric acid (CFA). Results presented in Figure

Neill J. Horley Section 4.1.3
Page 186
3.5 are in agreement with these findings showing an increased induction of CYP2B2 mRNA
above basal levels with both PB and CFA treated samples. Not surprisingly, CFA gave the greater
induction of the two compounds. This higher induction with CFA had previously been shown
by Bars et al. (1989).
Three structurally dissimilar compounds of varying potencies were tested for their ability to
induce CYP2B2 mRNA levels. These compounds are structurally dissimilar to PB (Figure 3.7)
and possess different functional groups. These compounds have been tested for their ability to
induce CYP2B2 by Glaxo-Wellcome (personnal communication, Dr. Maurice Dickins) and the
results of this protection assay are in complete agreement with this data. Figure 3.8 shows that
two of the compounds (GWY and GWZ) were able to induce CYP2B2 mRNA above basal
levels in vitro. However, GWX was unable to induce CYP2B2 mRNA levels. The GWX
compound was shown not to be a CYP2B2 inducer and acts as a negative control for these
protections, this finding is in agreement with Glaxo-Wellcome’s findings. GWY is the stronger
CYP2B2 inducer of the two Glaxo-Wellcome compounds. These Glaxo-Wellcome compounds
were shown to induce in the µM range whereas PB was shown to induce in the mM range.
The results of these experiments demonstrates that our hepatocyte culture system supports
CYP2B2 induction at the mRNA level. The assay also demonstrates that the response by the
hepatocyte cultures is not a compound-specific response. The system can also differentiate
between compounds of different potencies, and has specificity, insofar as the system does not
induce with GWX. This protection assay has demonstrated that the hepatocyte culture system
used in this thesis is able to support CYP2B2-induction by PB. However it was believed further
characterisation of the hepatocyte system was required to obtain a better understanding of the
mechanism of induction of the CYP2B2 gene.

Neill J. Horley Section 4.1.3
Page 187
Section 4.1.3.1 PB-like compounds show dose-dependent induction of CYP2B2
The induction of CYP2B2 mRNA in this primary rat hepatocyte system has been shown to
occur with various compounds at a single concentration. Dose response curves were performed
on the four compounds that were shown to be CYP2B2 inducers by previous RNAse protection
assays (Figure 3.5 and 3.8). Induction of CYP2B2 mRNA has previously been demonstrated to
occur in response to PB in a dose-dependent manner in vitro (Kocarek et al., 1990). Dose response
curves were constructed in our system for four structurally dissimilar compounds, demonstrating
that our culture system exhibits CYP2B2 mRNA induction in vitro and that it occurs in a dose
dependent manner.
Quantification and interpretation of the results generated by dose response curves would have
been facilitated by phosphorimage analysis. Unfortunately this equipment was not operational
throughout the duration of my studies and access to a densitometer was also unavailable.
Quantification of these results would have enabled a comparison to have been made between the
various concentrations of drugs used in each dose response experiment, and a clearer
interpretation of the differences in expression obtained between in vitro and in vivo samples. Of
the two quantification methods discussed above, phosphorimage analysis is the most accurate and
convenient. The linear range of most phosphorimage scans extends over four orders of
magnitude, provided care is taken to prevent overexposure of the scans. A standard curve is
generated by comparing the signals obtained from known amounts of undigested, full-length
radioactive probe which have been treated in exactly the same manner as the samples of interest.
A comparison can then be made between the signal produced by the samples and the amount of
radioactivity present in the samples, as determined by the standard curve. The use of densitomtry
is less accurate, as the film used has a very narrow range in which a linear signal can be obtained.
Hence, many different exposures must be taken so as to ensure that the signal obtained is within
the linear range of the film.
Neill J. Horley Section 4.1.3
Page 188
The dose response for PB (Figure 3.9) demonstrated that basal levels of CYP2B2 were undetect-
able with autoradiography. However, even at 0.1mM PB there were highly induced levels of
CYP2B2 present (Figure 3.9). This induction steadily increased to a maximum between 0.5-
1.0mM PB with 2.0mM PB being cytotoxic (unpublished observations). This result differs from
that of Kocarek et al. (1990) where the maximal response to PB occurred at 0.1mM. This differ-
ence in maximal PB concentrations between each system may be due to the differences in cell
culture conditions. The culture conditions used to obtain the dose response for PB (Figure 3.9)
during this thesis consisted of CL15 media containing 8.3% foetal calf serum, whereas Kocarek’s
hepatocytes were cultured on Matrigel substratum and maintained in Waymouth MB-752 media
without foetal calf serum. The difference seen in maximal dose between these two culture
systems may be a result of the variations in the amount of foetal calf serum present in the culture
media. The absence of foetal calf serum in Kocarek’s system may mean that more PB is available
to the hepatocyte monolayer thus giving a greater response at a lower concentration.
A dose response of CFA was carried out (Figure 3.10). The results of this experiment showed
that CYP2B2 mRNA was induced in a dose-dependent manner. The dose response of CFA
demonstrates a visible induction of CYP2B2 occurring at 0.05mM steadily increasing to 1.0mM.
Here also a direct comparison can be made between the induction seen with PB and that of the
CFA (Figure 3.10, lanes 10 and 11). The induction of CYP2B2 mRNA in hepatocytes dosed
with CFA in vitro is consistent with findings by Bars et al. (1993) and in experiments using
oligonucleotide probes that were used to show CFA-induced levels of CYP2B2 in rat livers
(Sritvastava et al., 1990). DMSO (the vehicle used for CFA) does not induce CYP2B2 induction
under these conditions.
The two Glaxo-Wellcome compounds that had already been shown to be CYP2B2 inducers by
protection assays were examined to determine if the induction of CYP2B2 mRNA occurred in

Neill J. Horley Section 4.1.3
Page 189
a dose-dependent manner (Figure 3.11 and Figure 3.12). The dose response obtained for GWY
(Figure 3.11) shows that this compound is more potent than PB with a response occurring at
1.0µM increasing to a maximal at 25µM. At 50µM the monolayers do not appear to be as
confluent as they are at 25µM (data not shown) and this observation is mirrored by a decrease in
CYP2B2 activity possibly due to this concentration being cytotoxic. The dose-response curve
obtained with compound GWZ demonstrates that it has the greater potency of the two Glaxo-
Wellcome compounds investigated. GWZ shows a marked increase in CYP2B2 mRNA levels
even at 1.0µM, with a maximal response occurring between 5-10µM. These dose response
curves confirm the data obtained in Figure 3.8. Here, there is less of a response with GWZ than
there is with GWY. This is because in Figure 3.8 hepatocytes were dosed with GWZ at the
sub-optimal concentration of 25µM, whilst GWY is at its maximal concentration. The results of
these two experiments (Figure 3.11 and Figure 3.12) indicate that these compounds are more
potent that PB. However, this potency is still quite low when compared to the extremely potent
CYP2B inducer TCBOPOP. This compound has been shown to induce the level of Cyp2b10
mRNA in primary mouse hepatocytes at 0.5nM with a maximal induction occurring at 50nM
(Honkakoski and Negishi, 1997).
The data present above demonstrates that the RNAse protection assay used in this thesis is able
to differentiate between structurally dissimilar compounds and determine whether they produce
a CYP2B2 response in primary rat hepatocytes. The assay demonstrates that the response occurs
in a dose-dependent manner in these three compounds, which is consistent with the in vivo
response. In this thesis, the data presented in Figures 3.9-3.12 demonstrate dose response curves
for four compounds. The interpretation of this data would have benefited from quantitative
analysis. Although unavailable, the general trend observed in dose response experiments can still
be observed. This ability to differentiate between compounds containing different functional
groups will provide a useful tool in identifying the putative PB receptor.

Neill J. Horley Section 4.1.3
Page 190
Section 4.1.3.2 Time course of PB-induced CYP2B2 induction
The primary hepatocyte culture system used in this thesis has been shown to support PB-
mediated induction of CYP2B2 with several compounds in a dose-dependent manner. The
duration of the PB-mediated induction of CYP2B2 in this hepatocyte culture system was
unknown. An analysis of the time course of PB induction at 1.0mM was carried out to determine
how long the response lasted. Hepatocytes were dosed for 3 days with 1.0mM of PB as this had
been shown to be the optimum concentration for CYP2B2 induction (Figure 3.9). The
protection assay of this time course shows that no induction of CYP2B2 mRNA is detectable at
6 hours but at 24 hours a significant fold induction is evident (Figure 3.13). This induction is
maintained up to 72 hours where the signal appears to be diminishing. Previous work by other
groups has shown slightly different time-course data, with 12 hours being shown optimal for
chick embryo primary hepatocytes (Hahn et al., 1991). Trottier et al. (1995) showed PB (1.0mM)
induction of CYP2B2 to occur in a similar time-frame with CYP2B1/2 mRNA levels reaching
a maximal at 48-72 hours after administration of PB.
This data demonstrates that it is possible using this primary rat hepatocyte culture system to main-
tain PB-mediated induction of CYP2B2 for up to 3 days, thus demonstrating the validity of this
hepatocyte culture system in mimicking the in vivo response.
The interpretation of this RNAse protection assay data would have been enhanced by the use of
phosphorimage analysis. This would have enabled direct comparisons to be made between each
sample thus enabling greater quantification of the signals produced. Before any subsequent work
is carried out using this RNAse protection assay, I would recommend that a thorough evaluation
of the use of normalisation probes be made and that a means of quantification of the results
obtained in each assay be addressed.
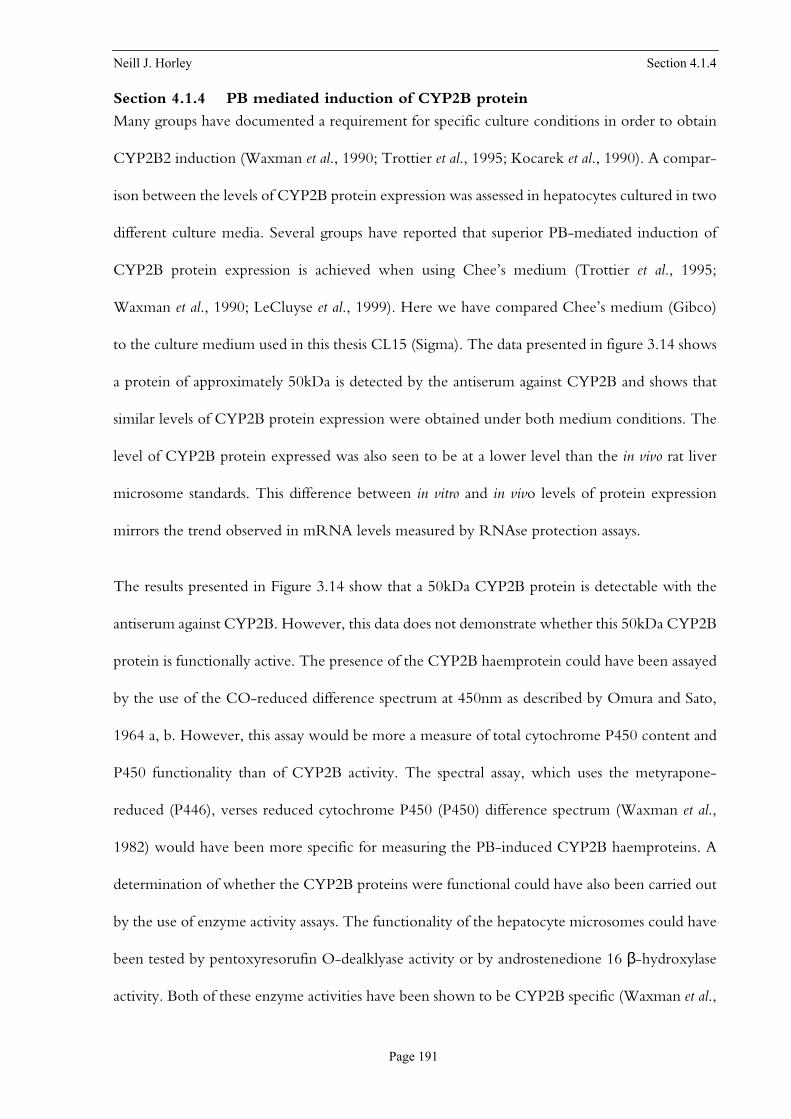
Neill J. Horley Section 4.1.4
Page 191
Section 4.1.4 PB mediated induction of CYP2B protein
Many groups have documented a requirement for specific culture conditions in order to obtain
CYP2B2 induction (Waxman et al., 1990; Trottier et al., 1995; Kocarek et al., 1990). A compar-
ison between the levels of CYP2B protein expression was assessed in hepatocytes cultured in two
different culture media. Several groups have reported that superior PB-mediated induction of
CYP2B protein expression is achieved when using Chee’s medium (Trottier et al., 1995;
Waxman et al., 1990; LeCluyse et al., 1999). Here we have compared Chee’s medium (Gibco)
to the culture medium used in this thesis CL15 (Sigma). The data presented in figure 3.14 shows
a protein of approximately 50kDa is detected by the antiserum against CYP2B and shows that
similar levels of CYP2B protein expression were obtained under both medium conditions. The
level of CYP2B protein expressed was also seen to be at a lower level than the in vivo rat liver
microsome standards. This difference between in vitro and in vivo levels of protein expression
mirrors the trend observed in mRNA levels measured by RNAse protection assays.
The results presented in Figure 3.14 show that a 50kDa CYP2B protein is detectable with the
antiserum against CYP2B. However, this data does not demonstrate whether this 50kDa CYP2B
protein is functionally active. The presence of the CYP2B haemprotein could have been assayed
by the use of the CO-reduced difference spectrum at 450nm as described by Omura and Sato,
1964 a, b. However, this assay would be more a measure of total cytochrome P450 content and
P450 functionality than of CYP2B activity. The spectral assay, which uses the metyrapone-
reduced (P446), verses reduced cytochrome P450 (P450) difference spectrum (Waxman et al.,
1982) would have been more specific for measuring the PB-induced CYP2B haemproteins. A
determination of whether the CYP2B proteins were functional could have also been carried out
by the use of enzyme activity assays. The functionality of the hepatocyte microsomes could have
been tested by pentoxyresorufin O-dealklyase activity or by androstenedione 16 β-hydroxylase
activity. Both of these enzyme activities have been shown to be CYP2B specific (Waxman et al.,

Neill J. Horley Section 4.2.1
Page 192
1982). Unfortunately none of the above assays were available in our laboratory during this study.
The protection assay and Western blotting data demonstrates that the primary rat hepatocyte
culture system supports CYP2B2 induction at both the mRNA and protein level. This system is
able to differentiate between compounds with different chemical structures and potencies and
has been shown to mediate PB-induction for up to 3 days, without the need for complex
medium additives and extracellular substratum supports. The system provides further evidence
that the proposed hepatocyte culture system is a valid in vitro model, which can be used to
characterise the induction of the CYP2B2 gene.
Section 4.2 Characterisation of the 5’ flanking sequence of the CYP2B2 gene
PB induces transcription of the genes encoding CYP2B1/2 in the rat liver (Hardwick et al.,
1983). Although these two genes share 97% sequence identity, they differ both in their basal
expression and in their response to PB. CYP2B2 protein is present at very low constitutive levels
in the liver, whereas CYP2B1 is 5-10 times lower by comparison. The levels of these two
cytochrome P450 genes are very different in the PB-induced liver. Here their levels increase to
20-fold for CYP2B2 and >100-fold for CYP2B1 (Christou et al., 1987; Yamazoe et al., 1987;
Omiecinski et al., 1985). Hence it follows that the differences between their DNA sequences and
regulatory proteins affect how these genes are expressed. A better understanding of the
mechanism of induction of the CYP2B2 gene would be obtained if the roles played by cis and
trans acting factors that interact with the CYP2B2 DNA were elucidated.
Section 4.2.1 Cloning of the 5’ flanking region of a CYP2B2-like gene
Determination of the sequence of the CYP2B2 gene would enable the functional elements
constituting the promoter region of this gene to be dissected. Although CYP2B1 and CYP2B2
constitute the major PB-inducible cytochrome P450s of this subfamily, it has been estimated that
6-8 additional rat genes showing sequence identity to the CYP2B1/2 genes have been identified

Neill J. Horley Section 4.2.1
Page 193
(Atchison and Adesnik, 1983; Adesnik and Atchison, 1986; Mizukami et al., 1983). It is not
certain whether these CYP2B1/2-like genes are equally expressed or are inducible by PB.
When initial sequencing of the 5’ flanking region of the CYP2B2 gene was undertaken only the
region as far as -1.4 kb documented by Jaiswal et al. (1987) was known. Hence it was necessary
to establish the sequence of the CYP2B2 clone used in this thesis to ascertain its validity and to
determine the sequence of this gene beyond -1.4 kb. Once the 5’ flanking sequence of this
CYP2B2 gene was determined, a comparison with known data (Jaiswal et al., 1987; Suwa et al.,
1985; Hoffmann et al., 1992) could be made and a comprehensive DNA sequence for the
CYP2B2 promoter region compiled. This compiled sequence could then be used to sub-clone
truncated sections of the 5’ flanking regions of the CYP2B2 gene into reporter constructs
(see section 4.2.3.1).
A plasmid (D.R Bell, PhD thesis 1988) containing 11.7 kb of DNA was used to determine the
5’ flanking sequence of the CYP2B2 gene. Primers were initially designed from previously
published data (Jaiswal et al., 1987) beginning at -1240 bp of this data and extended the sequence
further 5’ by automated fluorescent sequencing and oligonucleotide walking. Using the
published data by Jaiswal et al. (1987) it was possible to start sequencing over -1.2 kb downstream
from the transcription start site and extend this data to beyond -2.7 kb (Figure 3.17). The
sequence provided by Jaiswal et al. (1987) data provides -1.4 kb of CYP2B2 DNA sequence.
Primers were designed 160 bp from the end of this region so that sequence produced by auto-
mated fluorescent sequencing and oligonucleotide walking in this thesis could be “anchored” to
this data; this also served to verify that I was sequencing the CYP2B2 gene. Sequencing was
carried out using primers designed on both the forward and reverse strand so that a comprehen-
sive CYP2B2 sequence could be compiled. Table 3.1 shows the primers used in this sequencing
strategy. Figure 3.16 shows a cartoon of the oligonucleotide walking strategy and indicates some
Neill J. Horley Section 4.2.1
Page 194
of the key restriction enzyme sites that were used in subsequent sub-cloning strategies.
The sequence data generated by automated fluorescent sequencing and oligonucleotide walking
was compiled into a single contiguous sequence and consisted of 1667 nucleotides from -1047
to -2714 bp. Once my sequence data had been assembled and manually checked it was decided
to compare it to the sequence data that was now available (Jaiswal et al., 1987; Hoffmann et al.,
1992; Shaw et al., 1996; Sommer et al., 1996). An initial sequence comparison was carried out
between my data and the data of Jaiswal et al. (1987) and Hoffmann et al. (1992). A comparison
of the overlap between my data and that of Jaiswal’s data showed that the two sequences were
identical. However, the comparison between my data and that of Hoffmann’s showed a number
of sequence discrepancies (Figure 3.17). At -2676 bp the compiled data shows a guanine residue
whilst Hoffmann’s data shows a cytosine residue. Analysis of my data shows two inserted residues
occurring at -1876 bp (A) and -1527 bp (G). However, these insertions are in agreement with
other more recent publications (Sommer et al., 1996; Shaw et al., 1996). The comparison also
shows other sequence disparities such as the deletion of a T residue at -2226 bp. The T residue
is present in the NR1 site within the phenobarbital response element (PBRE) and gives cause
for concern as this deletion might affect whether or not the PBRE is functional (Figure 3.17).
However, Stoltz et al. (1998) have recently published sequence data that is in agreement with my
findings with respect to this deleted T residue, moreover their reporter constructs show PB-
mediated induction of the phenobarbital response element, thus indicating that the extra T
residue present in Hoffmann’s data is due to a sequencing error. Three more guanine residues
present at -1447, -1353, and -1264 bp could not be matched to residues in Hoffmann’s data, as
the nucleotides had not been assigned to a nucleotide base. These guanine residues were shown
to be in agreement with data presented by Sommer et al. (1996).
The sequence generated in this thesis showed only one other area of mismatch (Figure 3.17).

Neill J. Horley Section 4.2.2
Page 195
This occurred at -2423 bp where in Hoffmann’s data 3 extra bases (GAG) are present. These 3
extra bases could be present for a number of reasons. Firstly, the discrepancy occurs after a run
of 21 alternating (GA) residues and so it is thought that the extra residues may simply be the con-
sequence of sequencing errors. Hoffmann’s sequence has already been shown to contain areas
where sequence differences have occurred, and based on data from other groups and myself
(Sommer et al., 1996; Shaw et al., 1996; Stoltz et al., 1998) it is believed that these differences are
due to sequencing errors. The extra 3 bases may also indicate that Hoffmann has identified the
presence of a possible CYP2B2 allelic variant. It is possible that the GAG repeat is the occurrence
of a polynucleotide polymorphism indicated by the occurrence of another 21 GA residues 3’ to
the extra GAG (Jeffreys and Brookfield, 1985).
I have sequenced the 5’ flanking sequence of the CYP2B2 gene from -1047 to -2714 bp using
primer-based automated fluorescent sequencing and oligonucleotide walking. The data
presented here demonstrates the sequence of the CYP2B2 gene. This sequence has been
compared to the data of many groups and has highlighted the sequence discrepancies of published
data in a number of regions. It is believed that this comprehensive data is free from sequencing
errors and represents the sequence of the CYP2B2 gene. The sequence data presented here also
shows some of the restriction digest sites that are used to isolate the phenobarbital response
element (PBRE) of the CYP2B2 gene for sub-cloning purposes.
Section 4.2.2 Possible regulatory motifs
The DNA sequence of the 5’ flanking region of the CYP2B2 gene has been presented in Figure
3.17. This sequence was analysed for the presence of transcription factor binding sites or putative
regulatory elements. Possible sites of regulation were highlighted using the transcription element
search software (TESS) and the Transfac database (Bonfield et al., 1995; Heinemeyer et al., 1999).
This suite of software has highlighted a tremendous number of different putative regulatory

Neill J. Horley Section 4.2.3
Page 196
elements, most of which were ruled out as unlikely candidates due to poor sequence matches
(Figure 3.17). The regulatory elements highlighted closely resemble liver specific transcription
factor binding sites HNF-4/3, C/EBP and Sp1.
A consensus GRE present between -1336 bp and -1350 bp present here has been shown to
confer glucocorticoid responsiveness to reporter genes (Jaiswal et al., 1990). This site was found
to be in close proximity to a putative AP-1 site, which was found to have increased protein
binding in rats dosed for 18 hours with PB (Roe et al., 1996). Another putative GRE found at
-2227 bp to -2244 bp when mutated was found to virtually abolish the PB response (Stoltz et al.,
1998) indicating that protein binding to this element may confer PB-responsiveness. Although
TESS and the Transfac database have highlighted some regulatory elements it is unknown
whether these identified elements have any functional significance. The relevance of these
regions could be ascertained by sub-cloning these sections. Studies could then be undertaken to
see if there is any correlation between the elements that have been identified and the proteins
that interact with them.
Section 4.2.3 Determination of the location of the PBRE
The 5’ flanking sequence of the CYP2B2 gene is depicted in Figure 3.16. This cartoon indicates
some of the restriction enzyme sites that were used to sub-clone the phenobarbital response
element (PBRE). Much attention has focused on an area designated the phenobarbital responsive
enhancer module (PBREM) or the phenobarbital response unit (PBRU) (Honkakoski and
Negishi, 1997; Trottier et al., 1995). This sequence is present at -2155 bp to -2318 bp in the rat
CYP2B2 gene and has been shown to contain many potential enhancer elements, and to confer
PB inducibility to a heterologous reporter (Trottier et al., 1995). This element contains a Nuclear
Factor-1 binding site (NF-1) at -2218 to -2205 bp (Liu et al., 1998; Stoltz et al., 1998; Trottier
et al., 1995). This NF-1 element is found to contain sequence with a TGGN7CCA motif.

Neill J. Horley Section 4.2.3
Page 197
Ramsden et al. (1999) and Stoltz et al. (1999) also showed that mutation of this site affected
binding of nuclear proteins indicating its involvement in the PBREM. Two nuclear receptor
binding motifs (AGGTCA) designated NR 1or 2 have been shown to flank the NF-1 site
(Honkakoski et al., 1998b; Sueyoshi et al., 1998). These NR sites have been shown to interact
with the liver enriched, constitutively active receptor (CAR), that binds as a heterodimer with
RXR, and have been implicated in the PBREM response mechanism (Kawamoto et al., 1999;
Sueyoshi et al., 1998). It is thought that the ER-7 site is not essential for PB-responsiveness but
may act as an accessory site (Stoltz et al., 1998).
Section 4.2.3.1 Isolation of the PBREM
At the start of this study the exact position of the PBREM had not been established. The
PBREM of the CYP2B2 gene was first localised to between -2318 bp and -2155 bp by Anderson
and co-workers in primary rat hepatocytes (Trottier et al., 1995). A similar region was later iden-
tified in the mouse Cyp2b10 gene (Honkakoski and Negishi, 1997). Reporter gene technology
was used in this thesis to test for functional enhancer elements that may be present in the 5’ flank-
ing region of the CYP2B2 gene. Sections of the 5’ flanking sequence of this gene were sub-
cloned into appropriate reporter genes. These sections were then truncated so that only the
PBRE was present in the reporter. It was hoped that by limiting the region of investigation of
the 5’ flanking sequence to the PBRE that a greater understanding of the PB-response
mechanism could be gained. Two forms of reporter gene were used during the course of this
work. These were the firefly luciferase vector and the CAT vector. A 1 kb Xba I-Xho I fragment
of the 5’ flanking region was ligated into a pGL-3-luciferase promoter vector (Promega). This
construct did not contain any of the proximal regions of the CYP2B2 promoter as it had been
shown that a PB-response was possible without these regions (Trottier et al., 1995). A 163 bp
PBRE pGL-3-luciferase promoter was also constructed to determine if a PB-response was
possible with only a minimal 163 bp PBRE. Figure 3.20 outlines the basis of the sub-cloning

Neill J. Horley Section 4.3.1
Page 198
strategy that was used to obtain these constructs. These PBRE-containing reporters were driven
by a strong SV40 promoter, a second reporter construct was designed which incorporated the
same 163 bp PBRE region of the CYP2B2 gene, but with a TK promoter. This was carried out
to examine the possibility that trans effects occurring between promoters on different co-trans-
fected reporters were affecting reporter gene activity (Farr and Roman, 1991).
Section 4.3 Transient transfection of primary rat hepatocytes
The ability to introduce potential regulatory elements into mammalian cells in culture provides
a powerful means for studying the function and control of mammalian transcription. A wide
variety of techniques have been used to transfer foreign DNA into mammalian cells (Watannabe
et al., 1994). Although the transfer of DNA into established cell-lines is well developed, it is
generally considered difficult to transfect primary cultured cells such as hepatocytes. Transfection
of primary rat hepatocytes was used in this thesis as the culture system had already been shown
to support PB-mediated induction of CYP2B2. The implementation of an efficient transfection
procedure in primary rat hepatocytes in conjunction with reporter constructs would enable the
mechanism of PB-induction of the CYP2B2 gene to be investigated. During this thesis a non-
commercial ‘in-house’ lipofectin reagent designated DOTMA/DOPE was utilised as an
alternative to the more expensive commercial lipofectin reagent (Gibco).
Section 4.3.1 Optimisation of transfection parameters
The mechanism of action by which DOTMA/DOPE enables DNA to enter a cell is not fully
understood. It is thought that the reagent forms liposomes that interact spontaneously with the
foreign DNA to form a positive lipid-DNA complex, which fuses with the cell membrane and
is non-specifically adsorbed on to the negatively charged surface of the cells. At the start of this
thesis there were no transfection protocols in use in our laboratories, it was therefore necessary
to optimise this new protocol. Optimisation of the transfection protocol would indicate which
variables were important in increasing transfection efficiency and enable a reproducible

Neill J. Horley Section 4.3.1
Page 199
transfection system to be implemented.
Section 4.3.1.1 Miscellaneous transfection variables
The presence of foetal calf serum (FCS) has been observed to increase cell attachment and
prolong cell viability in our culture system (unpublished observations). However many liposome
based transfection techniques must be performed in serum-free conditions, since transfection
efficiency is thought to be inhibited by a polyvalent, negatively charged serum component
(Felgner and Ringold, 1989). Preliminary experiments carried out in this laboratory
demonstrated that the presence of foetal calf serum could affect transfection efficiency adversely
(data not shown). This data was in agreement with the findings of Hofland et al. (1996), who
demonstrated that the presence of as little as 2% of FCS could dramatically reduce the transfection
of transiently transfected murine 3T3 fibroblasts. In this thesis 4 times as much FCS was used than
in the Hofland study. Hofland and co-workers also showed that 2-15% of FCS in transfection
medium could reduce the transfection efficiency of stable transfected fibroblasts by up to 30%
(Hofland et al., 1996). It was thought that the presence of the FCS might inactivate the formation
of the DNA/liposome complex in this hepatocyte culture system thus reducing the transfection
efficiency. All subsequent transfection experiments were carried out in the absence of FCS during
the liposome/DNA step.
Transfection efficiencies were also affected by the procedure used to prepare the plasmid DNA.
Comparisons were made between different commercial plasmid purification techniques (data not
shown). It was noted that if DNA was prepared either with a Wizard Tm or QiagenTm plasmid
purification kits that there was a distinct difference in the transfection efficiency obtained. The
Qiagen kit produced high quality DNA that could be easily transfected into primary hepatocyte
cultures. Wizard kits on the other hand repeatedly produced DNA that contained an excess of
ethanol and salt at the end of the protocol, which in turn would affect the efficiency of the

Neill J. Horley Section 4.3.1
Page 200
transfection protocol. It was suspected that an excess of salt or ethanol may have affected the
formation of the DNA/liposome complex.
The pH of the transfection media was also observed to be a contributory factor to whether good
transfection efficiency was obtained, with a pH of 7.4 giving the best results (data not shown).
Preliminary experiments were also carried out to determine if the temperature at which the
complex formation was carried out at affected the final transfection efficiency. The complex
formation step was carried out at 4oC, 25oC and 37oC with no difference in final transfection
efficiency being observed (data not shown). It was assumed that temperatures would be a
discriminating factor as to whether complexes were formed or not, so the results of these
experiments were somewhat surprising. These preliminary results suggest that the DNA/lipo-
some complex formation is affected by the presence of FCS, excess salt and ethanol, but is
temperature independent.
Section 4.3.1.2 Effect of DOTMA/DOPE concentration
During the optimisation step of the transfection protocol, the pRSV-β-GAL reporter (β-Gal)
was used. This is a useful reporter gene as the transfection of the β-gal DNA can be checked
visually by histochemical staining of the cell monolayer (Figure 3.25) (Sanes et al., 1986). The
percentage transfection efficiency is determined by counting the number of hepatocytes contain-
ing blue staining compared to those without. Of the many variables that were assessed during the
optimisation of the transfection protocol, those of altering DOTMA/DOPE and DNA concen-
tration and length of time to which the hepatocytes were exposed to the DNA/lipid complex
formation were examined further still to determine their effect on transfection efficiency.
The concentration of the DOTMA/DOPE was the first parameter to be examined. Hepatocytes
were transfected with 6µg of pRSV-β-GAL and between 0-80µg of DOTMA/DOPE reagent
per flask for 5 hours and the expression of β-gal determined after 48 hours. The data presented

Neill J. Horley Section 4.3.1
Page 201
in Figure 3.22 demonstrates the effect of altering the DOTMA/DOPE concentration whilst
keeping the DNA concentration constant. Here, even at 10µg per flask, extremely high (for
hepatocytes) transfection efficiencies were obtained, with 23% of hepatocytes expressing β-gal.
This experiment also demonstrates that there is an optimal concentration of DOTMA/DOPE
reagent that can be used in each transfection. The DOTMA/DOPE has a maximal concentration
of between 10-40µg per flask, with 24% of hepatocytes expressing β-gal. Higher concentrations
of DOTMA/DOPE (60-80µg per flask) resulted in decreased transfection efficiency, with only
2-3% of hepatocytes expressing β-gal. This was attributed to the cytotoxic effects of increased
concentrations of DOTMA/DOPE on the hepatocytes. When the monolayers were examined
visually for signs of cytotoxicity it was apparent that deterioration of the monolayers was evident
at the higher DOTMA/DOPE concentrations. The increase in transfection efficiency as DOT-
MA/DOPE concentration is increased and a corresponding decrease in cell viability at higher
concentrations has been reported by many groups (Felgner et al., 1987; Holmen et al., 1995;
Hofland et al., 1996). Felgner et al. (1987) reported that an increase in lipofectin concentration
would result in an increase in specific activity of cell extracts but this could also result in an
increase in cell toxicity. This toxicity has also been reported to vary with cell type, cell density
and the duration of exposure to lipofectin (Felgner et al., 1987).
All transfections experiments carried out in this thesis were performed using a DOTMA/DOPE
reagent made according to a modified method of Felgner et al. (1987). This DOTMA/DOPE
reagent was compared to a commercial liposome reagent “lipofectin” (Gibco) to determine
which reagent gave the higher transfection efficiency (data not shown). Here, it was found that
our DOTMA/DOPE reagent was as effective as the commercial reagents and gave a similar non-
toxic range of concentrations.
The data presented above demonstrates that it is possible to obtain high transfection efficiencies

Neill J. Horley Section 4.3.1
Page 202
with the primary hepatocyte culture system. A concentration of 10-40µg per flask of DOTMA/
DOPE gives the highest transfection efficiency without any deleterious effects to the hepatocyte
cultures.
The results presented in Figure 3.25 demonstrate that no phenotypical alterations were apparent
at this optimised concentration of DOTMA/DOPE. However, a visual inspection such as this
does not really confer whether the transfection protocol is having a cytotoxic effect upon the cells
at these lower DOTMA/DOPE concentrations. At higher concentrations of DOTMA/DOPE,
this clearly is the case as the monolayer shows a rapid deterioration in cell integrity. It was
anticipated that if the monolayers treated with DOTMA/DOPE concentrations above 40µg per
flask were to be analysed using the lactate dehydrogenase (LDH) assay, that they would all show
signs of LDH leakage, indicative of cytotoxic cell culture conditions. This assay determines
whether the plasma membrane of the hepatocytes has become compromised thus leading to the
eventual death of the hepatocyte.
Another internal control that could be used to determine whether the transfection protocol was
having cytotoxic effects upon the hepatocytes would be to perform the 3-(4, 5-dimethyl-thiaz-
oyl-2-yl) -2, 5-diphenyltetrazolium bromide (MTT) assay (Fujii et al., 1995). MTT is a water
soluble tetrazolium salt; the mitrochondrial dehydrogenases present inside living cells reduce
MTT, converting it to a water-insoluble, purple, formazan derivative. This formazan derivative
is clearly visible when the cells are examined under the microscope. The insoluble formazan
derivative is then solubilised in acidic isopropanol and measured spectrophotometrically at
570nm. Dead cells do not cause this conversion. This assay has the advantage that it is performed
relatively quickly and that the decrease in formazan formation occurs earlier than cytosolic
enzyme leakage. This assay, if available, would have given a method for determining the
incidence of cytotoxicity that was more relevant to the hepatocytes viability rather than an assay

Neill J. Horley Section 4.3.1
Page 203
which provides a physical measurement of membrane integrity.
Section 4.3.1.3 Effect of DNA concentration
All subsequent experiments were carried out using the optimised DOTMA/DOPE concentra-
tion of 20µg per flask. The next parameter to be examined was the effect of variations in DNA
concentration in the transfection protocol. Hepatocytes were transfected with varying concen-
trations (0-8µg per flask) of β-gal DNA, whilst keeping the concentration of DOTMA/DOPE
constant (20µg per flask) for 5 hours and the expression of β-gal determined after 48 hours. The
data presented in Figure 3.23 demonstrates the effect of altering the β-gal DNA concentrations
whilst keeping the DOTMA/DOPE concentration constant. Here the immediate effect of alter-
ing DNA concentration is demonstrated (Figure 3.23) with very low transfection efficiencies
(1-4%) being recorded at 1-2µg of DNA per flask. At very low quantities of DNA the signal pro-
duced by the transfected cells may be at the threshold of detection for the assay, thus giving very
low transfection efficiencies. As the concentration of DNA is increased there is a corresponding
increase in transfection efficiency (from 2-13%), with maximal transfection occurring at 6µg per
flask. Here the importance of obtaining the correct ratio of DOTMA/DOPE to DNA is dem-
onstrated. A bell shaped distribution is obtained as the concentration of DNA is increased which
is in agreement with many groups findings (Felgner et al., 1994; Hofland et al., 1996). At lower
concentrations the ratio of DOTMA/DOPE to DNA may be too low for effective formation of
complexes. It is believed that as the DNA concentration increases the ratio between DOTMA/
DOPE and DNA increases until the correct molar ratios are achieved for complex formation. At
the higher concentrations the ratio of DNA to DOTMA/DOPE may be such that complex for-
mation is inhibited. Figure 3.23 also shows that beyond the optimal DNA concentration (above
6µg per flask), transfection efficiency is reduced by almost 50%. This reduction is not due to
cytotoxicity, as the monolayers of these transfected cells still look healthy unlike the monolayers
at the higher concentrations of DOTMA/DOPE. The reduction in transfection efficiencies at

Neill J. Horley Section 4.3.1
Page 204
higher concentration of DNA may be occurring due to inhibitory factors or contaminants
present in the DNA. It is possible that these inhibitory factors or contaminants present in the
DNA have no effect on the transfection protocol at lower DNA concentrations as they are at too
low a level to have an effect. However, as the DNA concentration is increases so too does the
inhibitory factors or contaminants which then may affect the transfection procedure resulting in
the observed reduced transfection efficiency.
The data presented above demonstrates that transfection efficiency is affected by the concentra-
tion of DNA used in the complex formation step. Figure 3.23 shows that 6µg of DNA and 20µg
of DOTMA/DOPE per flask of reporter DNA is optimal for this transfection protocol. The data
also shows the importance of obtaining the correct molar ratios of DNA and DOTMA/DOPE
in order to achieve high transfection efficiencies.
Section 4.3.1.4 Effect of exposure to the DNA/DOTMA/DOPE complex over time
The transfection protocol had been optimised for both DNA and DOTMA/DOPE concentra-
tions. The final parameter to be examined was the length of time for which hepatocytes were
exposed to the DNA/DOTMA/DOPE complex. Hepatocytes were transfected with 6µg of
β-gal DNA and 20µg of DOTMA/DOPE per flask for between 1-24 hours and the expression
of β-gal determined after 48 hours. Figure 3.24 shows how alterations in this parameter can affect
the transfection efficiency of the system. The data demonstrated that there is very little difference
between the transfection efficiencies obtained from hepatocytes exposed to the complex for an
hour and that of hepatocytes exposed for 24 hours. There is a slight increase from 4.5% at 2 hours
to 7% at 4 hours, but after this time-point the number of cells transfected remains constant. The
data demonstrates that the interaction between the complex and the monolayers occurs within
an hour of exposure and that prolonged exposure to the complex does not increase the initial
level of transfection significantly. The concentration at which DOTMA/DOPE reagent was

Neill J. Horley Section 4.3.1
Page 205
used in these transfection experiments was sub-toxic hence there was no cytotoxic risk to the
hepatocytes during the transfection protocol. Results presented in Figure 3.22 indicate that the
DOTMA/DOPE reagent can be cytotoxic to hepatocytes at high enough concentrations. As no
data was available on the long-term effects of exposure of hepatocytes to the DOTMA/DOPE
reagent in this system, it was decided to limit the length of time for which the hepatocytes were
exposed to the DOTMA/DOPE reagent during the transfection protocol to 5 hours.
A transfection protocol has been developed in this thesis so that reporter constructs containing
the PBRE can be used to examined the mechanism of PB-mediated induction of the CYP2B2
gene. This transfection system has been optimised for both DNA and DOTMA/DOPE concen-
trations. Transfection efficiency was found to be optimal when 6µg of β-gal DNA and 20µg of
DOTMA/DOPE were used per flask. The transfection protocol was affected adversely by the
presence of foetal calf serum, poor quality DNA, salt and ethanol. The transfection protocol was
unaffected by the temperature at which the complex was allowed to form at and the length of
time hepatocytes were exposed to the complex. However all subsequent transfections were
carried out at room temperature, with a 5-hour exposure of the hepatocytes to the complex so
as to standardise the technique. The results of Figures 3.22-24 demonstrate how effective this
transfection protocol is, they also show how variable the transfection efficiency is with the
number of blue cells fluctuating from 23% to 7% between experiments.
Section 4.4 Functional testing of the PBRE by reporter assay
This optimised transfection system could now be used in conjunction with the primary rat
hepatocyte culture system to test the functionality of the constructs discussed in section 4.2.3.1.
The assays used in this study were carried out as described by various workers, β-gal (Sanes et al.,
1986), CAT (Seed and Sheen, 1988) and firefly luciferase (DeWet et al., 1985, 1987). The
spectrophotometric assay for β-gal was 100 times less sensitive than the differential extraction

Neill J. Horley Section 4.3.1
Page 206
method for CAT reporter activity and 100000 times less sensitive than the bioluminescent assay
of firefly luciferase reporter activity. For this reason a luciferase reporter was used to assess the
activity of the PBRE and a CAT reporter was used to normalise the transfection protocol. Initial
experiments were carried out using the original firefly luciferase assay protocol as described by
DeWet et al, 1987. However due to technical problems with the luciferase assays, a commercial
assay kit was used to measure reporter gene activity.
Experiments were carried out on both the 1kb-Pluc and the 163bp-Pluc reporter constructs to
determine if PB-mediated induction of the PBRE could be monitored with the reporter assays
(Figure 3.26). Both the 1Kb-Pluc and the 163bp-Pluc constructs were examined to determine
the effects of varying the length of the 5’ flanking region of the CYP2B2 gene. Hepatocytes were
transfected with 3µg of either 1Kb-Pluc or 163bp-Pluc and 3µg of the normalising reporter
pCAT and the expression of the reporters measured after 30 hours. The results presented in
Figure 3.26 showed an increase in the activity of the PBRE-containing reporter constructs
although neither the 1Kb-Pluc nor the 163bp-Pluc constructs were not PB-responsive.
Figure 3.26 demonstrated that the two reporters had significantly different reporter activities with
the 163bp-Pluc reporter expressing a 3-fold greater normalised signal than that of the 1Kb-Pluc
reporter. The reduced activity of the 1Kb-Pluc reporter indicates the presence of a negative reg-
ulatory element located between -483 bp and -1,110 bp. The negative element was assumed to
be within this area as -483 bp is the location of the start of the 3’ section of the 1kb CYP2B2
fragment and -1110 bp is the location of the start of the 3’ section of the 163bp-Pluc reporter.
Negative regulatory elements have been reported in this area by Honkakoski et al. (1996) and
Park and Kemper (1996). Honkakoski’s group showed that a region between -755 bp and -971
bp of the mouse Cyp2b10 gene decreased basal activity in transfected primary mouse hepatocyte
cultures. Park and Kemper suggested that HepG2 cells transfected with constructs containing up

Neill J. Horley Section 4.4.1
Page 207
to -1.4 kb of CYP2B2 DNA may contain negative regulatory elements at -550 bp or between
-725 to -1,400 bp of the CYP2B2 gene. These experiments in conjunction with data presented
in Figure 3.26 tends to suggest that a negative regulatory element is present somewhere between
-483 and -1110 bp of the CYP2B2 5’ flanking sequence.
The data presented in Figure 3.26 demonstrates that the two reporter constructs containing the
PBRE have been transfected into primary rat hepatocytes and are functional. The presence of a
negative regulatory element has been localised to a region of the 5’ flanking sequence of the
CYP2B2 gene between -483 bp and -1110 bp. The reason for the lack of PB-responsiveness in
the two constructs was unknown and was further examined.
Section 4.4.1 Reporter assay optimisation
The results presented in Figure 3.26 indicated that no PB induction of the PBRE was occurring.
This lack of PB-responsive may have been because the hepatocyte culture system had not been
optimised for the activation of the PBRE. This was not thought to be likely as protection assays
had previously demonstrated that a high level of PB-induced CYP2B2 activity was present in the
hepatocyte culture system. The results presented in Figure 3.26 demonstrate that both the
1kb-Pluc and the 163bp-Pluc constructs were able to express firefly luciferase activity in this
system but were unable to show any difference in their response to PB. It was thought that this
was an artefact of some form of interaction between the two plasmids used in the reporter assay
that was affecting the measurement of the PB-response.
One possible cause for the non-responsiveness of the PBRE containing reporter constructs may
have been due to competition between the two promoters for the same general transcription
factors which in turn would affect the level of expression measured (Natesan et al., 1997). Here
the amount of one reporter present in the hepatocyte may affect the level of expression of another
reporter thus giving an artificially raised or lowered overall assay result. There have also been

Neill J. Horley Section 4.4.1
Page 208
reports that trans effects occurring between promoters on co-transfected plasmids could affect the
outcome of reporter gene expression on either one or both of the reporters involved (Farr and
Roman, 1991). Here different levels of transcription from the plasmid promoters may occur due
to promoter cross-competition. Reporter constructs containing different promoters, exhibiting
different promoter activities, were designed to test whether this would affect the PB response
(section 3.7.2). No further experiments were carried out using the 1Kb-Pluc reporter, as the
negative response element was irrelevant to the dissection of the PBRE mechanism. Before the
PBRE mechanism could be analysed it was necessary to resolve the effects that were being
observed due to promoter interactions.
Section 4.4.1.1 Titration effects of transcription factors upon PB induced reporters
Previous experiments had demonstrated that consistent reporter assay results could only be
obtained when a commercial assay kit was used. In all subsequent experiments a commercial re-
porter assay kit (Promega Dual luciferase reporter assay, DLRA) was used to assay the expression
of the reporter constructs. The DLRA was designed to measure the expression of two reporters
in the same cell extract. In the reporter system used in this thesis, the experimental reporter
(pGL-3-luciferase) containing the PBRE was attached to the firefly luciferase gene and the
control reporter (used to normalise the PBRE activity) contained the Renilla luciferase gene
(pRL-CMV). This new reporter assay system had to be optimised for the two reporters being
used to determine if any of the promoter effects discussed above were affecting PBRE expression.
The effect of competition for general transcription factors was examined by altering the ratio of
control pRL-CMV Renilla plasmid to that of the 163bp-D-Pluc plasmid. The concentration of
the pRL-CMV control plasmid was altered from 0.1-0.00001µg per flask whilst the concentra-
tion of the 163bp-D-Pluc plasmid was kept constant at 6µg (Table 3.2). The results shown in
Table 3.2 showed that there was an extremely high signal-to-noise ratio obtained with these
Neill J. Horley Section 4.4.1
Page 209
reporters. Renilla reporter activity could be measured even at 100pg per flask with 3-9000 relative
light units (RLU) being measured. The RLU measured for Renilla increased as the concentration
of Renilla plasmid in the transfection was increased. The Renilla reporter exhibited extremely
strong constitutive expression in this hepatocyte culture system with 100pg of Renilla plasmid
being detected and as little as 0.01µg per flask being outside the limits of detection for the
luminometer. This experiment showed that altering the ratio of pRL-CMV reporter to that of
the 163bp-D-Pluc reporter did not affect either the PB responsiveness of the 163bp-D-Pluc
reporter or the level of its expression.
A further experiment was carried out to determine if altering the ratio of the 163bp-D-Pluc
reporter to that of the control pRL-CMV Renilla reporter would affect the PB-responsiveness of
the 163bp-Pluc reporter. The concentration of the 163bp-D-Pluc plasmid was also altered from
6-0.1µg per flask whilst the pRL-CMV plasmid was kept at a constant 0.1ng (Table 3.3). The
163bp-Pluc reporter was shown to have a narrow range of effective concentrations. The results
of the experiments outlined in Table 3.3 also showed there are no difference in 163bp-D-Pluc
expression between control and PB-treated hepatocytes. Unlike the previous experiment where
altering pRL-CMV concentration altered the signal produced by the reporter, altering the
concentration of the 163bp-Pluc reporter did not alter the signal produced by this reporter.
There appears to be a slight increase in Renilla luciferase values as the 163bp-Pluc-reporter
concentration is reduced from 6 to 3µg per flask but this increase was not tested for significance.
The values that were obtained in Table 3.2 and 3.3 demonstrate that the lack of PB-responsive-
ness in the 163bp-Pluc reporter was not due to competition for general transcription factors.
These experiments also demonstrate the extremely high level of expression that is exhibited by
the Renilla reporter in this hepatocyte culture system. To prevent the possibility of other
promoter interactions affecting the PB-responsiveness of the 163bp-Pluc reporter, transfections

Neill J. Horley Section 4.4.1
Page 210
were carried out with the minimum concentrations of both firefly and Renilla luciferase reporters
i.e. 1.5µg of firefly luciferase plasmid and 0.3ng of Renilla luciferase plasmid per flask.
Section 4.4.1.2 Effects of promoter interactions
The experiments carried out above demonstrate that there is no titration of general transcription
factors occurring in the transfected hepatocytes. These experiments do not address whether there
is any promoter cross-competition occurring in this system which could affect the transcriptional
activity of either reporter. Experiments were carried out to examine whether promoter
cross-competition has any affect on the PB-responsiveness of the PBRE reporter.
Previous experiments have been performed using an SV40 driven luciferase reporter and a CMV
driven Renilla reporter. The reporters used in this transfection system had not been optimised for
the possible interactions that may occur between their respective promoters. Therefore, various
reporters were utilised so that a comparison between reporters containing different types of
promoter could be made. It was believed that by altering the type of promoter present between
the two reporters that a suitable promoter combination could be achieved. The 163bp-D-Pluc
firefly luciferase reporter contains an SV40-driven promoter so another luciferase reporter was
generated designated TK2B2-F-Luc which contained a TK-driven promoter. The normalising
Renilla luciferase reporters used contained either a CMV-driven promoter, or a TK-driven
promoter. These reporters would be referred to in future discussion by abbreviating the first
letters of the promoter that drives each reporter. Hence SC would denote an SV40-driven
luciferase reporter co-transfected with a CMV-driven Renilla reporter and TT would denote a
TK-driven luciferase reporter co-transfected with a TK-driven Renilla reporter, other combina-
tions would be abbreviated accordingly.
The PBRE containing luciferase reporter constructs were co-transfected with a combination of
either the CMV-driven or the TK-driven Renilla reporters. The effect of switching between the

Neill J. Horley Section 4.4.1
Page 211
different promoters on the PB-responsiveness of the PBRE containing reporters can be seen in
Figure 3.29. A complex picture is presented from this data. Firstly only the TK: TK promoter
combination of firefly luciferase and Renilla luciferase reporter seems to give a 2-fold increase in
PBRE activation when dosed with PB. All other combinations of promoter give rise to a higher
signal being produced in the control samples. The effect of altering the promoter used in the
normalising reporter can be seen when comparing the SC transfected hepatocytes to the ST
transfected hepatocytes or the TC transfected hepatocytes to the TT transfected hepatocytes
(Figure 3.29). Here the PBRE reporter has stayed the same but by simply altering the Renilla
promoter there is a corresponding change in the level of normalised signal recorded. This is
probably due directly to a lower signal being produced by the TK-driven Renilla reporter
compared to the CMV-driven Renilla reporter. If the Renilla signal is low then this will result in
an increased normalised luciferase signal and visa versa.
The results presented in Figure 3.29 demonstrate the dynamic interplay that occurs between the
reporters present in the hepatocyte culture system when different promoters are used. The data
shows that the overall luciferase assay signal is affected by how well the normalising reporter is
expressed. The comparison made above between different normalising reporters and their effects
on overall signal does not address promoter cross-competition but it does highlight the
importance of choosing the correct reporter combination. The effect of promoter cross-
competition is seen more clearly when ST transfected hepatocytes are compared with TT
transfected hepatocytes. Here the Renilla reporter contains the same promoter in both treatment
groups so the signal produced by the Renilla reporter will be similar. Thus the normalised value
obtained for the transfection groups will not be complicated by the problems described above.
However Figure 3.29 shows a marked difference between transfection groups. In the ST
transfected hepatocytes there is a 2-fold reduction in the response of the PB-treated hepatocytes
compared to the control group whereas, in the TT transfected hepatocytes there is a 2-fold
Neill J. Horley Section 4.4.1
Page 212
increase in the PB-treated hepatocytes over the control group. It is not clear whether this result
can be ascribed to reporter promoter cross-competition.
Many other groups have used SV40-driven promoters on the reporters used in their studies
(Hanh et al., 1991; Stoltz et al., 1998; Dogra and May, 1999). Trottier et al. (1995) have shown
their PBRE containing reporters to be PB-responsive whether the reporter contains a TK or an
SV40 promoter. Honkakoski and co-workers have not only varied the reporter the PBRE is
attached to but also the combination of promoters used (Honkakoski et al., 1998; Kawamoto et
al., 1999). The results published by these groups demonstrate that PB-mediated induction of the
PBRE is possible with different combinations of reporter promoters and tends to suggest that
both culture and transfection conditions have a role to play.
The results presented in Figure 3.29 show that when a PBRE containing TK-driven luciferase
reporter is co-transfected with a TK-driven Renilla reporter a 2-fold induction is obtained with
PB-treated hepatocytes. No other combination of reporter was able to achieve a PB-response. It
was believed that further optimisation of this current combination of reporters may increase the
level of induction achieved.
Section 4.4.1.3 Cytotoxic effects of the transfection protocol
The transfected PBRE reporter has been examined for the effects of both general transcription
factor competition and promoter “cross talk” within the transfected hepatocyte system (Table
3.2, 3.3 and Figure 3.29). However, the decrease in response seen with PB-treated cells in Figure
3.29 may also suggest that some form of cytotoxicity is occurring when PB dosing is carried out
subsequent to transfection. This was investigated by measuring the amount of lactate
dehydrogenase (LDH) that was being lost from the cells both during the transfection protocol
and afterwards during PB treatment.

Neill J. Horley Section 4.4.1
Page 213
Hepatocytes were transfected with 2µg of TK-2B2-Luc and 0.3ng of pRL-TK Renilla; the
amount of intracellular LDH leakage was then measured at various time points. Figure 3.30
demonstrates that neither the transfection protocol nor the subsequent dosing of the hepatocytes
with 1.0mM PB gave rise to any cytotoxic effects. A 3-fold increase in LDH leakage was seen
during the time the cells were exposed to the lipid-DNA complex. This increase was most likely
the after-effects of the hepatocyte isolation procedure, although the absence of serum during the
transfection protocol and the presence of the transfection reagent itself cannot be ruled out as
contributory factors. At time 0 hours the transfection reagent was removed and the cells dosed
with 1.0mM PB. Cytotoxicity due to the transfection procedure would be indicated by an
increase in LDH levels. However, at 0 hours a 50% decrease in LDH leakage is recorded. Beyond
this time-point there was a general increase in the amount of LDH leakage occurring between
non-transfected and transfected cells. This difference was considered not to be at a cytotoxic level
as the LDH leakage of the hepatocytes was found to be < 30% of the total intra-cellular LDH
content. This assay demonstrated that there was negligible difference between the amount of
LDH leakage occurring between PB-dosed transfected hepatocytes and control transfected hepa-
tocytes.
The LDH assay presented in Figure 3.30 demonstrates that the transfection protocol used on the
primary rat hepatocytes is not cytotoxic. It also demonstrates that the dosing of hepatocytes with
1.0mM PB subsequent to the transfection protocol is not cytotoxic to the cells. This data
indicates that the differences seen between the different reporter combinations in Figure 3.29 is
not a consequence of cytotoxicity due to PB treatment.
There are multiple assays that can be used to monitor the extent of cytotoxicity occurring during
various techniques. The LDH assay measures the amount of LDH leakage that occurs as an index
of plasma membrane damage. As described in section 4.3.1.2 the MTT assay is useful for

Neill J. Horley Section 4.4.1
Page 214
investigating the effects on cellular functions by various techniques. Other methods include the
use of the fluoresciein diacetate (FDA), which is used as a viability stain. Here, this non-fluores-
cent, non-polar molecular readily traverses the cell membrane where non-specific esterases
capable of acetate hydrolysis rapidly convert FDA to fluorescein which causes viable cells to
fluoresce green. Liver-specific markers such as secreated albumin or transferrin levels could also
have been monitored (Schuetz et al., 1988). Alternatively the expression of liver-specific
transcription factors such as C/EBPα or HNF-1 could have been used as indicators of cell
viability (Padgham et al., 1993). Never the less the LDH assay used in this thesis, provided a rapid
and easy assay to perform in order to determine the possiblity of cytotoxic effects brought about
by the transfection protocol.
Section 4.4.1.4 Effect of endotoxin contamination of PBRE reporters
The reporter plasmids used in the transfection procedure sometimes contain contaminant
endotoxins, which affect transfection efficiency and the expression of the reporter genes (Weber
et al., 1995). If a reporter containing the PBRE were contaminated with endotoxins then this
would affect the PB-responsiveness of the reporter. The presence of endotoxin contamination
was examined by purification of the plasmid.
Contaminant endotoxins are introduced into the reporter plasmids during the lysis step of
plasmid preparation. These contaminants can be removed by further purifying Qiagen prepared
plasmid DNA using two caesium chloride-ethidium bromide (CsCl-EtBr) ultracentrifugations
(Weeks et al., 1986). All of the plasmids used in the transfection procedures were of the highest
purity. Plasmids suspected of contamination with endotoxins were purified by two CsCl-EtBr
ultracentrifugations. Comparisons were made between plasmids prepared by Qiagen preparation
and plasmids prepared by Qiagen preparation and CsCl-EtBr ultracentrifugations (Figure 3.34).
The results presented in Figure 3.34 show that there was no endotoxin contamination of the

Neill J. Horley Section 4.4.2
Page 215
plasmids used in our transfection protocols.
Section 4.4.1.5 Time course of PBRE expression
The 2-fold induction seen in Figure 3.29 was achieved when specific combinations of luciferase
and Renilla reporters were used. A time course of the activation of the TK2B2-F-Luc reporter
by PB was carried out to see if the level of induction seen at 30 hours could be improved upon
at another time point. The time course showed no difference in the expression of the TK2B2-
F-Luc reporter between control and PB treated hepatocytes at 3 and 8 hours. The expression of
the TK2B2-F-Luc reporter in PB treated hepatocytes was 1.6-fold above control hepatocytes at
24 hours. At 48 hours the ratio of firefly/Renilla luciferase activity had increased but this was not
significantly above control levels.
The results presented above demonstrate that in this hepatocyte culture system PB-mediated
induction of the PBRE is possible in the reporter constructs used in this thesis. A 2-fold induction
above controls in PB treated hepatocytes is possible when a TK: TK combination of promoters
is used in the reporters. These reporters are unaffected by the titration of general transcription-
factors and endotoxin contamination. A study of the time course of the expression of the
TK2B2-F-Luc reporter gives a maximal 1.6-fold induction of PB treated hepatocytes at 24
hours, this response can be measured up to 48 hours after the addition of PB.
Section 4.4.2 Comparison of TK2B2-Luc reporter activity to 163bpCAT activity
Many groups have used either CAT or luciferase reporter constructs containing the 5’ flanking
region of the CYP2B2 gene to examine the activation of the PBRE. Most of this work has been
carried out on rat, mouse or chicken primary hepatocyte cultures or cell lines such as HepG2
cells (Stoltz et al., 1998; Kawamoto et al., 1999; Hahn et al., 1991). Such studies have
demonstrated the activation of CYP2B1/2, Cyp2b10 and CYP2H1 regulatory elements in
response to compounds like PB and TCBOPOP. The type of reporter gene construct, cell line

Neill J. Horley Section 4.4.2
Page 216
or primary culture and culture conditions used varies between research groups. The response in
PBRE activation obtained under these different conditions varies considerably, ranging from
2-3-fold (Hahn et al., 1991) up to 9-fold (Honkakoski and Negishi, 1997).
The culture system used in this thesis has shown that PB treatment of hepatocytes containing
PBRE reporter constructs gives a 1.3-1.6-fold induction above control samples. However, this
level of induction is somewhat low in comparison to the 6-10-fold induction seen by Anderson’s
group (Trottier et al., 1995). The reason for these differences are unknown. A comparison
between the 163bp-F-Luc construct and the 163bpCAT Anderson construct was made to
ascertain if the low PB-responsiveness of the 163bp-F-Luc reporter was due to differences in
culture conditions or in the plasmids themselves. The 163bp-F-Luc construct may have been
designed so that the PBRE was too close to the promoter of the luciferase reporter, which could
affect the transcriptional activation of the reporter. By comparing the 163bp-F-Luc to the
163bpCAT reporters, differences in spacing between each reporter would be compensated for.
The use of the 163bpCAT reporter would also highlight any enhancer-promoter interactions
that may be occurring in this system. The 163bpCAT reporter may possess a mutation which
causes a high expression, if this is so then this reporter would maintain its high actvity. Another
possible cause for the low induction may be due to culture conditions, this possibility could also
be resolved by a comparative study.
Results obtained from CAT assays on transfected PBRE-containing reporters (163bpCAT)
provided by Alan Anderson showed similar amounts of activity in both the mock and 163bpCAT
transfected hepatocytes. This indicated that there was a problem with the 163bpCAT plasmid or
with the CAT assay (data not shown).
Section 4.4.1.4 deals with the possibility that an endotoxin contamination could be affecting the
activity of the 163bpCAT plasmid. Another possibility is that the CAT assay used to measure the

Neill J. Horley Section 4.4.2
Page 217
activity of the 163bpCAT reporter required further optimisation. Crabb and Dixon (1987) and
Ginot et al. (1989) have reported that heat inactivation of extracts from cultured cells is necessary
before CAT activity can be measured using the CAT assay. These workers found that the cell
extracts from rat hepatoma H4IIE C3 cells were capable of deacetylating acetylchoramphenicol
and accelerating the rate of hydrolysis of the acetyl-CoA present in the assay. In the present study,
extracts were taken from hepatocyte monolayers that had been transfected with the 163bpCAT
and pGL3-control reporters. These extracts were examined for the effects of heat inactivation on
the amount of CAT activity that could be measured by the CAT assay (Figure 3.35). This
experiment demonstrated that without the heat inactivation step of the protocol, CAT activity
was undetectable by the assay. This data suggests that the hepatocyte lysates that have not been
heat inactivated may possess some deacetylating properties, which may affect the CAT assay. The
necessity for heat inactivation is in agreement with work carried out by Sleigh (1986) who dem-
onstrated that heat inactivation of cell extracts prepared from mouse embryonal carcinoma (F9)
cells gave a 5-fold increase in CAT assay signal compared to untreated cells.
The results shown in Figure 3.35 demonstrated that the volume of cell extract used in the CAT
assay was important for obtaining a good signal-to-noise ratio. The correlation between increased
cell extract volume with CAT assay activity was further examined in Figure 3.36. Here the point
at which the assay was unable to detect any difference between treated and untreated cells
(minimum threshold) for the assay was found to be 5µl. A steady increase in CAT activity was
noted, as the volume of cell extract used was increased. However, the amount of cell extract used
in the assay is limiting, as the assay is only linear over a small volume range (10-60µl of cell
extract). In this case, 50µl of extract would be used in all subsequent assays.
Once the CAT assay had been optimised for the 163bpCAT reporter, studies were carried out
to compare the activation of CYP2B2 response elements in the TK2B2-F-Luc construct to that

Neill J. Horley Section 4.4.2
Page 218
of the 163bpCAT construct designed by Anderson’s group (Trottier et al., 1995; Stoltz et al.,
1998). Figure 4.1 depicts a schematic of the 5' flanking region of the CYP2B2 gene indicating
where the PBRE is situated. This cartoon also shows three reporter constructs used during this
thesis. Here 1kb-Pluc denotes the construct used in Figure 3.26 to determine the PB-responsive-
ness of the PBRE. The constructs 163bpCAT and TK2B2-F-Luc denote the two constructs used
in Figure 3.37. These latter two constructs represent a construct provided by Alan Anderson's
group designated in this thesis as 163bpCAT (Trottier et al., 1995, designated here as Sa-Sa/Ev)
and a construct designed in this thesis and designated TK2B2-F-Luc.
Work carried out by Anderson's group (Trottier et al., 1995) showed that this 163bpCAT
construct gave a 3.5-fold PB-induction when transfected into hepatocytes. In this thesis, this
construct was shown to give levels of induction varying between 1.35 - 3.3-fold (Figure 3.37 and
Figure 4.1 Schematic of CYP2B2 constructs containing the PBRE used in transfection studies on primary rat hepatocytes. A, Diagrammatic representation of the 5' portion of the CYP2B2 gene. The linerepresents the 5' flanking region, the solid box represents exon 1 of the gene and the hatched box representsthe PBRE. Sequence co-ordinates are give in bp from the transcription start site at +1 to -3000 bp as shown.Restriction sites are labelled thus: Xb = Xba I, E = EcoRV, S = Sau3AI, X = Xho I. B, Diagram of constructs con-taining various lengths of the 5' flanking region (solid line) of the CYP2B2 gene inserted upstream of two reportergenes (open boxes). The dotted lines represent deleted fragments 5' of the CYP2B2 gene which have been re-moved to generate the CYP2B2 reporter constructs. The 163bpCAT reporter is the construct used in Anderson'swork (Trottier et al., 1995, designated here as Sa-Sa/Ev construct) and used in this thesis. TK2B2-F-Luc and1kb-Pluc denote two reporters that were generated in this thesis. Diagram not to scale.
A.
Name of
-3000 -2000 -1000 +1 bp
X S S E Xb
2318 2155 1689
2501 1532
CAT
LUC
LUC
construct
163bpCAT
TK2B2-F-LUC
1kb-Pluc
B.

Neill J. Horley Section 4.4.2
Page 219
Figure 3.40 respectively). By way of comparison the construct containing the PBRE designed in
this thesis (TK2B2-F-Luc) was shown to give levels of induction varying between 1.37 - 2-fold
(Figure 3.37 and Figure 3.29 respectively). However, in experiments comparing the PB-
mediated induction of the two constructs, no difference in the levels of induction was found.
The conditions used when assessing the Anderson construct followed the original protocol as
closely as possible (Trottier et al., 1995). These experiments demonstrated that in our hands,
hepatocytes transfected with the two PBRE-containing constructs (TK2B2-F-Luc and the
163bpCAT construct) show very little difference in the level of induction of CYP2B2 by PB
(Figure 3.37). This provided further evidence to suggest that the lack of PB-induction of the
TK2B2-F-Luc construct is not entirely a consequence of some attribute of the PBRE reporter
itself or because of reporter promoter interactions.
The data presented above demonstrates that the 163bpCAT reporter is free from any endotoxin
contamination. The optimised CAT assay conditions consist of 50µl of heat inactivated cell lysate
extract incubated at 37oC for 5 hours (Figure 3.35 and Figure 3.36). Using this CAT assay it was
possible to demonstrate that the Anderson construct (163bpCAT) and the construct sub-cloned
in this thesis (TK2B2-F-Luc) were able to show similar levels of PB-mediated induction of the
PBRE containing reporters (Figure 3.37). Given this finding and the fact that the 163bpCAT
construct has been demonstrated to mediate PB-induction in primary rat hepatocytes, it was
decided that all subsequent analysis of the PBRE would be performed using the 163bpCAT
construct. The low activity of the 163bpCAT reporter here does not agree with that observed
by Trottier et al. (1995). This tends to suggest that differences in the culture conditions found
between Anderson’s group and the culture system used here may play a major role in
determining whether a PB response was observed with these reporter constructs.

Neill J. Horley Section 4.4.2
Page 220
Section 4.4.2.1 PB-induction of the PBRE is unaffected by culture conditions
This primary rat hepatocyte culture system has already been shown to support CYP2B2
induction at the mRNA level in CL15 media. Chee’s medium has been well documented as
supporting PB-mediated induction of CYP2B2 (Waxman et al., 1990; Trottier et al., 1995).
CYP2B proteins have also been shown to be PB-inducible in primary rat hepatocytes cultured
in both CL15 and Chee’s media in this system (Figure 3.14). Several recent studies have
established that primary rat hepatocytes cultured on extracellular support matrix are able to
support CYP2B2 induction by PB (Sidhu et al., 1993; Hahn et al., 1991, 1993; Honkakoski et
al., 1996). Anderson’s group demonstrated that hepatocytes cultured with a Matrigel overlay in
Chee’s media showed a 6-10-fold induction of the 163bpCAT reporter in the presence of PB
(Trottier et al., 1995). It was the lack of extracellular matrix that was investigated as a possible
cause for the reduced PB induction of the 163bp-CAT construct found in this thesis.
Primary hepatocytes were grown in the presence of plastic Falcon flasks, collagen type-I coated
Falcon flasks (150µg/25cm2 flask) or with Matrigel overlay (83.3µg/ml solution) and transfected
with 5µg of 163bp-CAT, 0.1µg of pGL3-control luciferase, dosed with PB and harvested 48
hours post-transfection.
These investigations demonstrated that the PBRE-mediated induction of the 163bpCAT
construct was unaffected by the conditions under which the hepatocytes were cultured (Figure
3.39). Here, a 1.5-fold increase in PB mediated induction of the 163bp-CAT construct was
observed in hepatocytes cultured on plastic Falcon flasks. A similar level of induction was
observed in hepatocytes cultured on Matrigel. Hepatocytes cultured on collagen coated flasks did
not exhibit any difference between control and PB-dosed cells. There was no difference in the
PB-mediated activation of the PBRE between hepatocytes cultured in a Matrigel overlay or on
plastic flasks.

Neill J. Horley Section 4.4.2
Page 221
A post-transfection microscopic examination of the monolayers showed slight differences
between control and PB treated hepatocytes. Here, PB-treated monolayers appeared more
confluent than control monolayers (Figure 3.38). Conventional and Matrigel treated monolayers
were very similar in their overall appearance (Figure 3.38 a, b and e ,f); but upon closer inspection
Matrigel treated hepatocytes were found to be more spherical in appearance. Hepatocytes grown
on collagen-coated flasks appeared to be more confluent and uniform with the cells appearing
more flattened, there also appeared to be less cellular debris in the surrounding medium (Figure
3.38 c, d).
These results demonstrate that hepatocytes cultured under the conditions used in this thesis
permit PB-mediated induction of the PBRE. A similar level of induction is observed with
hepatocytes cultured with Matrigel overlay. This data confirms that the activity of the
163bpCAT reporter is not being inhibited by the conditions under which the hepatocytes are
maintained. The difference in activity of the 163bpCAT reporter between hepatocytes cultured
in collagen and hepatocytes cultured on plastic or Matrigel overlaid flasks is believed to derive
from how the cells plate out. The hepatocytes grown on collagen-coated flasks are confluent and
well spread out. It is thought that the cells’ flattened shape means that there is minimal contact
between them. Hepatocytes cultured with Matrigel overlay and to a lesser extent on plastic flasks
are more spherical in shape and more clustered. This may lead to greater cell-cell contact
between these hepatocytes, which is thought to be important in maintaining differentiated gene
expression (Ben-Ze’ev et al., 1988; Brown et al., 1995).
Yoshida et al. (1996) have reported that the presence of insulin in culture medium could suppress
the induction of CYP2B1/2 in primary rat hepatocytes. Experiments were carried out to test
whether insulin would affect the PBRE response to PB in this system. The results of these
experiments demonstrated that the PBRE response to PB was unaffected by the presence of

Neill J. Horley Section 4.4.2
Page 222
insulin (data not shown).
The hepatocytes transfected with the 163bpCAT reporter showed only a 1.5-fold induction in
the presence of PB above controls (Figure 3.39). This relatively low level of induction was
surprising, given that Trottier et al. (1995) showed the same reporter to give 6-10-fold induction
in the presence of PB. An RNAse protection assay was carried out on hepatocytes that had
previously been transfected with 5µg of 163bpCAT, 0.1µg of pGL3-control luciferase, dosed
with PB and harvested 3 days post-transfection. This assay was performed to ascertain if the
endogenous CYP2B2 mRNA expression was affected by the transfection protocol. The results
shown in Figure 3.40 demonstrate that the CYP2B2 mRNA levels of the PB-dosed transfected
hepatocytes were induced to a similar level to that of PB-dosed non-transfected hepatocytes. The
results of the protection assay indicate that although PB-mediated induction of the PBRE is not
occurring at as high a level as documented by Anderson’s group (Trottier et al., 1995), the
transfected 163bp-CAT reporter did not affect the PB induction of the endogenous CYP2B2
mRNA present in the primary rat hepatocytes.
The data presented above demonstrates that the culture conditions used in this thesis, i.e.
hepatocytes cultured in CL15 media containing 8.3 % foetal calf serum and insulin with no
extracellular matrix, do not inhibit the PB-mediated induction of the 163bpCAT reporter. Using
this culture system I was able to show that plastic flasks or Matrigel overlay are able to support
PB-mediated induction of the 163bpCAT reporter. Moreover the transfection of hepatocytes
with the 163bpCAT reporter was shown not to affect the endogenous CYP2B2 mRNA
expression in this system.

Neill J. Horley Section 4.4.3
Page 223
Section 4.4.3 Optimising reporter concentrations
The reporters used in the experiments outlined above had not been examined for the effects of
competition for general transcription factors (upon each reporter). This was investigated as it
could be another possible cause for the low activity observed with the 163bpCAT reporter. The
titration of general transcription factors was examined by altering the plasmid concentration ratio
of both the PBRE containing reporter (163bpCAT) and the normalising reporter (pGL3-
control). The concentration of the pGL3-control luciferase plasmid were altered from
1.0µg-0.01µg per flask whilst the concentration of the 163bpCAT plasmid was kept constant at
5µg (Figure 3.41 and 3.42).
Variation of time of transfection post-isolation of the hepatocytes was also examined. Many
groups transfect 5 hours after isolation of the hepatocytes and begin dosing 4 hours subsequent
to this (Honkakoski et al., 1996; Trottier et al., 1995). In this thesis all transfections were carried
out 24-hours post-isolation of the hepatocytes. It was thought that this delay in transfection and
dosing time might contribute to the reduced level of PB induction occurring in this system. Thus
both the ratio of reporters and the transfection time were examined to determine if these variables
had any relevance to the PB-mediated induction of the PBRE (Figure 3.41 and Figure 3.42).
The results presented in Figure 3.41 demonstrate the limits of the assay with regard to
normalisation of 163bpCAT activity. If the concentration of the pGL3-control reporter is too
high (above 0.1µg per flask) the signal produced by the control reporter “drowns out” the signal
produced by the 163bpCAT reporter to the extent that it cannot be measured above the mock-
transfected cells. Reducing the pGL3-control reporter concentration leads to an increase in
normalised 163bpCAT signal and so a clearer analysis of the level of induction due to PB is
achieved. The effect of time of transfection was also examined and the results of these
experiments demonstrate that there is no difference between whether the hepatocytes were

Neill J. Horley Section 4.4.3
Page 224
transfected at 5 hours post-isolation (Figure 3.41a) or 24 hours post-isolation (Figure 3.41b). The
difference in the level of induction between control and PB-dosed hepatocytes over both time
and a range of concentration is shown more clearly in Figure 3.42. Here, the increase in
normalised signal does not correspond to an increase in the level of induction of the 163bpCAT.
This data shows that the effect of concentration over three orders of magnitude has little effect
on the level of induction of the 163bpCAT reporter by PB at both time-points. However, the
activity of the 163bpCAT-reporter shows a small increase in the level of induction when
transfection is carried out at the 24-hour time point. This experiment demonstrated that altering
the ratio of the pGL3-control reporter to that of the 163bpCAT reporter did not affect either
the PB responsiveness of the 163bpCAT reporter or the level of its expression.
Further experiments were undertaken 24-hours post-isolation to determine the effect of altering
the concentration of the 163bpCAT reporter (10µg-1µg per flask) whilst keeping the
normalising reporter (0.01µg per flask) concentration constant (Figure 3.43a). This experiment
demonstrates that as the concentration of 163bpCAT is increased, a corresponding increase in
normalised 163bpCAT activity was observed. The experiment also demonstrates that the lowest
concentration of transfected 163bpCAT reporter that can be measured under these conditions
was 1µg. Figure 3.43 demonstrates that the normalised level of induction of the 163bpCAT
reporter does not alter over the concentration range examined (approximately 1.25-fold), with
10µg being the only exception were a 1.65-fold induction was recorded.
The results presented in Figures 3.41-3 demonstrate that the 163bpCAT reporter is unaffected
by competition for general transcription factors in this transfection system. Optimal 163bpCAT
activity was obtained when hepatocytes were transfected 24 hours post-isolation with 10µg of
163bpCAT and 0.01µg of pGL3-control luciferase reporter. Under these conditions 163bpCAT
and pGL3-control are in the correct molar ratio so that a 1.65-fold induction was achieved. Thus

Neill J. Horley Section 4.4.4
Page 225
the PB-mediated induction of a PBRE-containing reporter construct has been demonstrated
with the use of a primary rat hepatocyte system and an optimised transfection system. This system
could now be used to further elucidate the PB-mediated induction of the PBRE in the
163bpCAT reporter.
Section 4.4.4 Xenobiotic induction of the PBRE
The induction of the 163bpCAT reporter by various known CYP2B2 inducers was investigated
using the transfection and reporter assays that had been optimised in this thesis. Three
compounds were used to determine if the system could differentiate between various chemical
structures, potencies and concentrations. Transfections were carried out using 10µg of
163bpCAT and 0.01µg of pGL3-control reporter to determine if the reporter system optimised
in this thesis was capable of showing the PB-mediated induction of the CYP2B2 gene via the
PBRE, using several different xenobiotics. The results of this experiment demonstrated that the
163bpCAT reporter containing the PBRE could be activated by these xenobiotics (Figure 3.44).
Here, a significant 3.3-fold induction of the 163bpCAT reporter was demonstrated with 1.0mM
PB. The response also occurred in a concentration-dependent manner, with less induction as the
concentration of PB was decreased (Figure 3.44). This result was also mirrored, but to a lesser
extent, with the potent CYP2B2 inducer, GWY (25µm and 10µm) and with CFA (1.0mM,
0.5mM).
These results demonstrate that I have established a primary rat hepatocyte culture system, which
can be used to differentiate between different xenobiotics at different concentrations and which
have different chemical structures and strengths. It is hoped that this reporter assay system could
be used to identify the molecular mechanisms by which the PB-inducible transcription of the
CYP2B2 gene occurs.

Neill J. Horley Section 4.4.5
Page 226
Section 4.4.5 Possible role of the constitutively active receptor in PB induction
Recent publications by Negishi’s group have suggested a link between the transcription
regulation of the PB-inducible Cyp2b10 genes and the nuclear orphan receptors CAR and RXR
(Kawamoto et al., 1999; Sueyoshi et al., 1999; Honkakoski et al., 1998). CAR binds to the PBRE
NR sites as a heterodimer with the retinoid X receptor. This CAR-RXR-PBRE complex has
been shown to be functional in gel shift assays (Sueyoshi et al., 1999). However, this CAR-
dependent transcriptional stimulation does not require the presence of PB to elicit a response in
HepG2 cells. Androstane metabolites have been shown to inhibit CAR’s transcriptional activity
by dissociating the CAR-RXR-DNA complex from transcription co-activators like steroid
receptor co-activator-1. It is this interaction that is thought to maintain the CAR receptor in an
inactive conformational state (Forman et al., 1998). PB and PB-like inducers have been shown
to abolish the inhibitory binding of androstanes to CAR with the derepression of the receptor’s
activity.
An mCAR expression vector was generated to verify whether PBRE-dependent reporter gene
activity in the 163bpCAT was possible in the absence of PB (Figure 3.46). This work was the
final experiment in this thesis, and it was hoped that this construct would facilitate the
determination of the role that androstane plays, if any, in this primary rat hepatocyte culture
system.

Neill J. Horley Section 4.4.5
Page 227
Section 4.5 Summary
This project set out to study the molecular mechanism of the phenobarbital induction of the
CYP2B2 gene in an in vitro primary rat hepatocyte culture system. A sensitive and specific
RNAse protection assay was used to demonstrate that CYP2B2 mRNA was highly induced by
PB in this hepatocyte culture system. The induction measured by protection assays was observed
to occur in a dose and time-dependent manner with PB. This response has also been shown to
occur in a dose-dependent manner with structurally dissimilar compounds that have been shown
to be barbiturate type inducers. The system was able to discriminate between the different
potencies of compounds used in the assay. Western blotting was also used to demonstrate the
induction of CYP2B proteins by PB. Many workers have demonstrated that CYP2B2 induction
was only possible with media such as Chee’s medium. Western blotting was used to demonstrate
that comparable levels of induction were achievable with the medium used (CL15) in this culture
system.
Sequencing of the 5’flanking sequence of the CYP2B2 gene identified many putative regulatory
elements, including the PBRE. The position of the PBRE was identified and truncated portions
of the PBRE were sub-cloned into various reporter constructs. A transfection protocol was
optimised during this thesis and this technique was utilised to transfect reporter constructs into
primary rat hepatocytes. These PBRE-containing reporter constructs were shown to be
functional in the hepatocyte culture system, although they did not show marked PB-mediated
induction of the PBRE reporter. Many different variables were examined as to the reason why
only a 1.3-1.6-fold induction of the PBRE reporter was possible. These included competition
for general transcription factors between the two promoters present on the reporters as well as
promoter cross-talk interactions. However, none of these were found to have an impact on the
poor inducibility of this system.

Neill J. Horley Section 4.4.5
Page 228
It was not known if the low PB-inducibility of the 163bp-F-Luc reporter was due to a reporter
interaction within the system or because of some unknown attribute of the reporter. It was
possible that the reporter construct had been designed so that the position of the PBRE was too
close to the promoter of the reporter. This may lead to some form of steric hindrance between
the PBRE and the reporter promoter, thus interfering with the transcriptional activation of the
reporter. Examination of the proximity of the PBRE to the promoter in the 163bp-F-Luc
construct confirmed that this distance was comparable to that seen in a construct used by
Anderson (Trottier et al., 1995).
The work carried out by Anderson's group (Trottier et al., 1995) demonstrated that with the
163bpCAT construct, a 3.5-fold induction was achievable when hepatocytes were exposed to
PB. This level of induction was very similar to the maximal (optimised) 3.3-fold induction
obtained in experiments carried out in Figure 3.44. However, in experiments which compared
the 163bpCAT construct to the TK2B2-F-Luc construct (Figure 3.37), the level of induction of
the 136bpCAT construct was lower (1.35-fold), but comparable to the TK2B2-F-Luc construct
(1.37-fold). This difference in the level of induction between experiments highlights the
fluctuations that occur sometimes between transfection experiments. The 163bpCAT construct
provided by Anderson possesses an extra 1.6 kb of CYP2B2 5' flanking sequence, as
demonstrated in Figure 4.1. A better comparison could have been made between the construct
provided by Anderson and the TK2B2-F-Luc construct if the two constructs were to have
contained just the PBRE alone. Anderson's group demonstrated that with such a construct,
PB-mediated induction fluctuated between 2.7 - 8.8-fold depending upon the position and
orientation of the PBRE (Trottier et al., 1995). It has been demonstrated in this thesis that a
comparison between the 163bpCAT reporter and the TK2BB-F-Luc reporter gave almost
identical levels of induction in this system. This posed the question of the compatibility of the
two culture systems. The conditions used in this thesis were changed to mirror the conditions
Neill J. Horley Section 4.4.5
Page 229
used by Anderson’s group i.e. hepatocytes were cultured with a matrigel overlay. These
experiments showed no difference in induction of the reporter between the culture conditions
used this thesis and that of Anderson’s group.
Another conclusion that may be drawn from this data is that there are some unknown attributes
of the reporter or the culture system affecting the PB-responsiveness of the PBRE reporters. The
simplest explanation for the lack of PB-responsiveness of the reporters is that expression in this
system is not high enough for net induction to be detected in the hepatocyte culture system.
Many of the reporters used in this thesis show poor induction with PB. In fact certain combina-
tions of control and PBRE containing reporters showed a reduced expression in reporter activity
in the presence of PB. These data suggest that the PBRE-containing reporters do not mediate
PB induction. However, recent publications have demonstrated the importance of the PBRE in
the PB-mediated induction of the CYP2B2 gene (Stoltz et al., 1998; Park et al., 1996; Honka-
koski et al., 1997; Ramsden et al., 1993). Ramsden et al. (1993) demonstrated that transgenes
containing 19kb of the 5’ flanking region of CYP2B2 (which included the PBRE) were
responsive, whereas transgenes with only 800 bp (which did not contain the PBRE) were not.
Both Negishi’s and Anderson’s groups have localised the PBRE to a 51 bp element in the 5’
flanking sequence of the CYP2B2 gene (Honkakoski et al., 1998; Trottier et al., 1995). This
PBRE has been shown to confer PB-inducibility to PBRE containing reporter genes. Site-
directed mutagensis by these groups have demonstrated that certain nuclear receptor binding sites
present in the PBRE are essential to confer maximal PB-inducibility. Experiments have shown
that a 3.3-fold maximal PB induction is possible with PBRE-containing reporters in this thesis.
Taken together with this, the data outlined above indicates that PB-mediated induction of the
CYP2B2 gene occurs via the interactions of multiple regulatory proteins and cis acting elements
which constitute the PBRE.

Neill J. Horley Section 4.4.5
Page 230
The RNAse protection and Western data both demonstrate that there is high-level induction
with the endogenous CYP2B2 gene. This was further demonstrated when protection assays were
carried out on hepatocytes that had previously been transfected with PBRE reporter constructs.
Here the level of CYP2B2 mRNA was found to be unaffected by the transfection protocol
(Figure 3.40).
In the presence of PB this optimised reporter system demonstrated a maximal 3.3-fold level of
induction in constructs containing the PBRE. This result is comparable to data published by
Anderson's group (Trottier et al., 1995, Fig. 2) and does seem (given that the same construct gave
a 1.35-fold induction in previous experiments) to be entirely dependent upon the successfulness
of the transfection protocol. This response, although apparently maximal in this system, is still
rather low in comparison to other workers. These results suggest that further optimisation of the
reporter assay and hepatocyte culture system may be required. The implementation of this
hepatocyte reporter assay and the localisation of the PBRE could be used to further the
understanding of the mechanism of induction by PB. A main aim would be to develop a trans-
activation assay for high-throughput drug screening to identify inducers of the CYP2B2 gene.
The validity of this system would depend entirely upon whether a reproducible, high-level
response could be obtained with this reporter assay. Work carried out by Honkakoski's group has
already demonstrated that once a high level of induction was obtained with these PBRE
containing reporters, vast numbers of compounds could be screened for their ability to induce
CYP2B2 (Honkakoski et al., 1998b). It is anticipated that once optimised, that the current
reporter assay system used in this thesis could be used for this purpose. The current system has
great potential for use in high-throughput screening as the assay can be performed on a small
number of cells in a 96-well format. However, given that the levels of induction obtained with
this transfection protocol can vary between experiments, the day-to-day variations of this system

Neill J. Horley Section 4.5.1
Page 231
may result in this becoming a non-viable option. One possible solution to this "batch variability"
may be the production of immortalised hepatocyte cell lines. Here viral oncogenes are transfected
into the mammalian genome to create differentiated cell lines. Given the recent advances in
genomic targeting vectors that have been developed, it may be possible to further augment these
immortalised hepatocytes by the stable transfection of reporter genes containing the PBRE.
Section 4.5.1 Recommendations
The first aspect to be overcome in this thesis was whether the hepatocyte culture conditions used
here could support CYP2B2 induction. The conditions used in this project were those that had
already been set up by previous workers in this group to show the induction of other cytochrome
P450 genes. Given that it has been demonstrated that CYP2B2 induction is difficult to reproduce
in culture, I think that a better initial approach would have been to determine which type of
culture media provided the best level of CYP2B2 induction. A comparison could then have been
made to determine whether different forms of culture substratum could improve upon the level
of induction obtained.
The quantities of RNA obtained by different extraction techniques varied considerably
depending upon the method used and indeed whether RNA was extracted from tissue or from
tissue culture material. I found that the technique used to extract RNA was a crucial
discriminator between whether or not intact RNA was obtained, particularly when using tissue
culture monolayers.
With the RNAse protection assay, I feel that a more robust argument could have been made for
the specificity of the riboprobe if a sense probe had also been designed. This sense probe could
have been shown to hybridise to the anti-sense probe with complete specificity thus showing that
the spurious bands found in many of the protection autoradiographs were due to contaminated
RNAse A or H as discussed in section 4.1.1.1. The specificity of the riboprobe could have been
Neill J. Horley Section 4.5.1
Page 232
demonstrated further still if a CYP2B1 specific riboprobe had been made. Experiments could
then have been carried out to show that the CYP2B2 anti-sense probe could protect CYP2B2
sense transcripts but not CYP2B1 sense transcripts during treatment with RNAse A. This
experiment would have provided further evidence for the specificity of the probe used in this
thesis. The use of normalising probes such as GAPDH may also have strengthened the results
obtained in the dose response assay.
Many of the techniques used during the course of this thesis were not established techniques in
our laboratory. No prior experience was available within the group for both the transfection
protocol and the reporter assays. This meant that a great deal of time was spent optimising many
of the techniques. The use of an "in-house" transfection reagent meant that the transfection
protocol was inexpensive although there was still the need for comparative studies with
commercially available reagents.
Initially the reporter assays were carried out as described in the original papers (Seed and Sheen,
1988; DeWet et al, 1987). This proved to be extremely time consuming with four to five months
spent trying purely to obtain consistent assay results, especially with the firefly luciferase assay.
One of the main reasons for these inconsistencies may have been the method by which the
hepatocytes were harvested. Three methods were tried, i.e. sonication, repeated freeze/thawing
and the use of detergent such as Triton-X-100. Only the freeze/thaw method was shown to
produce reasonable results. The decision was finally made to switch to a commercial luciferase
assay in the interests of time. Although the experience of trying to optimise this assay improved
my ability to design more effective experiments,. I feel that too much time was spent optimising
a reporter assays that clearly was not going to yield reproducible results. Towards the end, a
commercial kit enabled some headway to be made, which aided the development of the project.
A crucial point that must be made to any perspective researcher following on from this work

Neill J. Horley Section 4.5.1
Page 233
would be to be aware of the possible interplay which may occur between the various reporter
vectors used in the transfection protocols.
During the course of this thesis I was unable to obtain levels of induction of CYP2B2 comparable
to work of other groups. I therefore thought it prudent to include a positive control such as that
afforded by the use of Anderson's 163bpCAT construct. I would suggest that comparison to a
different Anderson construct, i.e. that containing the PBRE only, would have been a much more
suitable experiment. This particular Anderson construct would have provided a perfect control
reporter for my work. However this had not been donated.
Section 4.6 Further work to elucidate the mechanism of PB induction
Further work is needed to characterise the response elements identified by a number of different
groups (Honkakoski and Negishi, 1998a; Stoltz et al., 1998) by the use of the truncated PBRE
reporters optimised in this thesis. An understanding of the importance of the response elements
present within the 163 bp of the PBRE which were involved in PB-induction would further be
identified if this element was to be delineated by sub-cloning or mutagenesis studies. Direct
binding assays could then be used to assess the relevance of these response elements.
The levels of induction achieved with the PBRE reporters used in this thesis were low in
comparison to other workers (Honkakoski and Negishi, 1998a). Recent data suggests that the
composition or spatial orientation of proteins binding to the PBRE may play a role in the
induction mechanism (Kim and Kemper, 1997), suggesting that chromatin structure is important
in this process. Further work would be necessary to establish if a change in the chromatin struc-
ture due to acetylation of histones allows binding of regulatory factors or an alteration in their
activity and activation, or the recuirtment of basal transcription factors and the RNA polymerase
II complex to the RNA initiation site.

Neill J. Horley Section 4.5.1
Page 234
Recent publications have highlighted that PB induction is mediated by a constitutively active
receptor (CAR) which is regulated by the PBRE (Honkakoski et al., 1998c; Kawamoto et al.,
1999; Sueyoshi et al., 1999). During the latter part of this thesis I attempted to sub-clone the
mCAR receptor. This receptor and its heterodimer partner RXR have been identified as factors
regulating the transcription of the PB-inducible Cyp2b10 genes. It is unknown if PB increases
CAR DNA binding, which in turn increases the PBRE-dependent gene transcription by the
translocation of CAR from the cytosol of the nucleus, or if CAR is constitutively localised in the
nucleus and requires PB to activate the DNA-binding activity of the CAR-RXR heterodimer.
Determining which of these two receptor-regulating mechanisms is correct would be a major
step forward in elucidating the PB-response mechanism.
The transactivation of the PBRE has been reported to be repressed by androstane, and this
repression has been shown to be derepressed by the presence of PB (Honkakoski et al., 1998c;
Kawamoto et al., 1999; Sueyoshi et al., 1999). A high concentration of androstane present in the
hepatocyte culture system would lead to a direct binding to the CAR-RXR heterodimer. These
high concentrations of androstane prevent the interaction between CAR and SRC-1, thus main-
taining the CAR receptor in an inactive conformation. The addition of PB will abolish the
inhibitory binding of androstane to CAR and thus a derepression of the receptor will lead to a
high level of expression. It is believed that in this culture system the level of androstane is at a
low concentration which leads to a constitutive repression of the PBRE present in the reporter
constructs, although not of the genomic DNA PBRE’s. This manifests itself in the low PB
response of the PBRE-containing reporters, but in the high constitutive expression of the
endogenous CYP2B2 mRNA (protection data, Figure 3.40). Therefore, a clear PB-induction of
the PBRE reporter construct may be achieved if androstane is added to the culture system. This
would have the effect of repressing the constitutive expression of the PBRE reporters. Thus the
addition of PB to this system would result in the derepression of the PBRE, which would in turn

Neill J. Horley Section 4.5.1
Page 235
lead to a substantial increase in the CYP2B2 induction of the reporter constructs. It would be
useful to determine whether androstane’s interaction with CAR effects SRC-1 binding and
how, or whether PB binds directly to CAR causing a conformational change which releases
androstane's repressive hold on CAR.
It is thought that several proteins interact specifically with mCAR. One such protein is the small
heterodimer partner SHP (Seol et al., 1996). Its name is derived from its small size and ability to
interact with many superfamily members. SHP proteins have been shown to possess ligand-bind-
ing and dimerisation domains that are well conserved, although these proteins lack a
conventional DNA-binding domain. Unlike RXR, SHP inhibits transactivation by its
interaction with such receptors as CAR, and so has a negative role in receptor-dependent
signalling pathways. It may be possible that SHP is having an effect within the reporter system
used in this thesis, and that SHP binds to CAR, repressing its activity which is manifested in the
form of reduced PB-responsiveness.
Multiple growth/proliferation pathways are known to be regulated by a phosphorylation/de-
phosphorylation mechanism of specific protein receptors. These receptors, eg. for platelet-
derived growth factor or epidermal growth factor are known as receptor protein tyrosine kinases.
Of course, no such receptor for PB has been identified. However, activation of many such
receptors culminate in similar intracellular effects. Most work to date, however helpful, has been
to elevate intracellular events artificially with a view to observe any 2B-induction, or to inhibit
enzymes (eg. specific phosphatases) involved in the signal transduction. There is some evidence
to suggest that the cAMP-stimulated PKA pathway and protein phosphatases PP1 and/or PP2
may play a role in the modulation of PB signalling events (Sidhu and Omiecinski, 1995; Sidhu
and Omiecinski, 1997; Honkakoski and Negishi, 1998d). No link as yet has been found between
these cellular signalling and their impact on CAR's interaction with PB. No work was carried

Neill J. Horley Section 4.5.1
Page 236
out on this aspect of PB-induction during the course of this thesis but this area may provide an
important new direction in determining the mechanism of PB induction.
Finally some further work must be carried out to evaluate the potential for the transfection
protocol and reporter assays implemented in this thesis, to be developed for high-throughput
screening studies.
Section 4.7 Conclusions
The main aim of this thesis was to implement an in vitro system that would support CYP2B2
induction in primary rat hepatocytes. This system could then be used to investigate the molecular
mechanisms of CYP2B2 induction. It was hoped that this system would eventually enable the
high-throughput screening of compounds to determine if they mediate CYP2B2 induction.
Using RNAse protection assay analysis it was possible to demonstrate that the hepatocyte culture
system used in this thesis was able to support the induction of CYP2B2 mRNA by PB. A
transfection protocol was developed using an "in-house" transfection reagent and reporter assays
were optimised so that the PB-mediated induction of the PBRE could be measured. This assay
required a great deal of optimisation during all aspects of its implementation from the harvesting
techniques to the types and combinations of promoters utilised in the different reporter
constructs. The culmination of this work resulted in obtaining a construct (provided by Alan
Anderson) so that a direct comparison could be made between the constructs designed in this
thesis (TK2B2-F-Luc) and that of Anderson’s (163bpCAT) construct. These experiments
showed that no differences were apparent in the PB-responsiveness between the two constructs.
It is hoped that these optimised reporter assay conditions could then be utilised to identify and
characterise the molecular mechanisms involved in the PB-mediated induction of the CYP2B2
gene.
Neill J. Horley
Page 237
Chapter 5 ReferencesAdesnik, M., S. Barnun, F. Maschio, M. Zunich, A. Lippman and E. Bard (1981). Mechanism
of induction of cytochrome-P-450 by phenobarbital. Journal of Biological Chemistry 256(20):
10340-10345.
Adesnik, M. and M. Atchison (1986). Genes for cytochrome-P-450 and their regulation. Crc
Critical Reviews in Biochemistry 19(3): 247-305.
Aldridge, T. C., J. D. Tugwood and S. Green (1995). Identification and characterization of DNA
elements implicated in the regulation of CYP 4A1 transcription. Biochemical Journal 306: 473-
479.
Atchison, M. and M. Adesnik (1983). A cytochrome-P-450 multigene family - Characterization
of a activated by phenobarbital administration. Journal of Biological Chemistry 258(18): 11285-
11295.
Atchison, M. and M. Adesnik (1986). Gene conversion in a cytochrome-P-450 gene family.
Proceedings of the National Academy of Sciences of the United of America 83(8): 2300-2304.
Aufray, C. and F. Rougeon (1980). Purification of mouse immunoglobin heavy chain messenger
RNAs from total myeloma tumour RNA. European Journal of Biochemistry 107: 303-314.
Baes, M., T. Gulick, H. S. Choi, M. G. Martinoli, D. Simha and D. D. Moore (1994). A new
orphan member of the nuclear hormone-receptor interacts with a subset of retinoic acid response
elements. Molecular and Cellular Biology 14(3): 1544-1552.
Bars, R. G., A. M. Mitchell, C. R. Wolf and C. R. Elcombe (1989). Induction of cytochrome-
P-450 in cultured rat hepatocytes - Heterogeneous localization of specific isoenzymes using im-
munocytochemistry. Biochemical Journal 262(1): 151-158.

Neill J. Horley
Page 238
Bars, R. G., D. R. Bell, C. R. Elcombe, T. Oinonen, T. Jalava and K. O. Lindros (1992). Zone-
specific inducibility of cytochrome-P450-2B1/2 is retained in isolated perivenous hepatocytes.
Biochemical Journal 282(Pt3): 635-638.
Bars, R. G., D. R. Bell and C. R. Elcombe (1993). Induction of cytochrome-P450 and perox-
isomal enzymes by acid in vivo and in vitro. Biochemical Pharmacology 45(10): 2045-2053.
Bell, D. R., R. G. Bars, G. G. Gibson and C. R. Elcombe (1991). Localization and differential
induction of cytochrome-P450IVA acyl-coA oxidase in rat-liver. Biochemical Journal 275(Pt1):
247-252.
Bell, D. R. and C. R. Elcombe (1991a). Induction of acyl-coA oxidase and cytochrome-
P450IVA1 RNA in primary hepatocyte culture by peroxisome proliferators. Biochemical Jour-
nal 280(Pt1): 249-253.
Bell, D. R. and C. R. Elcombe (1991b). Regulation of differentially spliced transcripts of acyl-
coA in the rat. Biochimica Et Biophysica Acta 1090(2): 211-215.
Ben-Ze’ ev, A., G. S. Robinson, N. L. R. Bucher and S. R. Farmer (1988). Cell cell and cell
matrix interactions differentially regulate expression of hepatic and cytoskeletal genes in primary
rat hepatocytes. Proceedings of the National Academy of Sciences of the United of America
85(7): 2161-2165.
Berghard, A., K. Gradin, I. Pongratz, M. Whitelaw and L. Poellinger (1993). Cross-coupling of
signal transduction pathways - The Dioxin mediates induction of cytochrome P-450IA1 expres-
sion via a Kinase-C-dependent mechanism. Molecular and Cellular Biology 13: 677-689.
Bertilsson, G., J. Heidrich, K. Svensson, M. Asman, L. Jendeberg, M. SydowBackman, R. Ohls-
son, H. Postlind, P. Blomquist and A. Berkenstam (1998). Identification of a human nuclear re-
Neill J. Horley
Page 239
ceptor defines a new signaling pathway for CYP3A induction. Proceedings of the National
Academy of Sciences of the United of America 95: 12208-12213.
Bhat, G. J., P. N. Rangarajan and G. Padmanaban (1987). Differential-effects of cycloheximide
on rat-liver gene-Transcription in the whole animal and hepatoma-cell culture. Biochemical and
Biophysical Research Communications 148: 1118-1123.
Birnboim, H. C. (1983). A rapid alkaline extraction method for the isolation of plasmid DNA.
Methods in Enzymology 100(PtB): 243-255.
Bissell, D. M., S. C. Stamatoglou, M. V. Nermut and R. C. Hughes (1986). Interactions of rat
hepatocytes with Type-IV collagen, and laminin matrices - Distinct matrix-controlled modes of
and spreading. European Journal of Cell Biology 40(1): 72-78.
Bissell, D. M., D. M. Arenson, J. J. Maher and F. J. Roll (1987). Support of cultured-hepatocytes
by a laminin-rich gel - A functionally significant subendothelial matrix in normal rat liver. Journal
of Clinical Investigation 79(3): 801-812.
Bonfield, J. K., K. E. Smith and R. Staden (1995). A new DNA sequence assemble program.
Nucleic Acids Research 23(24): 4992-4999.
Bradford, M. M. (1976). A rapid and sensitive method for the quantitation of microgram quan-
tites of protein utilizing the principle of protein dye binding. Analytical Biochemistry 72: 248-
254.
Brown, S. E. S., C. P. Guzelian, E. Schuetz, L. C. Quattrochi, H. K. Kleinman and P. S. Gu-
zelian (1995). Critical role of extracellular matrix oil induction by phenobarbital of cytochrome
P450 2B1/2 in primary cultures of adult rat hepatocytes. Laboratory Investigation 73(6): 818-
827.

Neill J. Horley
Page 240
Burger, H. J., E. G. Schuetz, J. D. Schuetz and P. S. Guzelian (1990). Divergent effects of cy-
cloheximide on the induction of Class-II Class-III Cytochrome P450 Messenger-RNAs in Cul-
tures of Hepatocytes. Archives of Biochemistry and Biophysics 281: 204-211.
Burger, H. J., J. D. Schuetz, E. G. Schuetz and P. S. Guzelian (1992). Paradoxical transcriptional
activation of rat-liver 3A1 by dexamethasone and the antiglucocorticoid α-carbonitrile - Analysis
by transient transfection into monolayer-cultures of adult-rat hepatocytes. Proceedings of the
National Academy of Sciences of the United of America 89: 2145-2149.
Caldwell, A. and G. D. Paulson (1983). Foreign compound metabolism. London, Taylor and
Francis.
Chenery, R. J. (1988). The utility of hepatocytes in drug metabolism studies. Progress in drug
metabolism. G. Gibson. London, Taylor and Francis. 2.
Choi, H. S., M. R. Chung, I. Tzameli, D. Simha, Y. K. Lee, W. Seol and D. D. Moore (1997).
Differential transactivation by two isoforms of the orphan nuclear hormone receptor CAR. Jour-
nal of Biological Chemistry 272: 23565-23571.
Chomczynski, P. and N. Sacchi (1987). Single-step method of RNA isolation by acid guanidin-
ium phenol chloroform extraction. Analytical Biochemistry 162: 156-159.
Christou, M., N. M. Wilson and C. R. Jefcoate (1987). Expression and function of 3 cyto-
chrome-P-450 isozymes in rat extrahepatic tissues. Archives of Biochemistry and Biophysics 258:
519-534.
Conney, A. H. (1967). Pharmacological implications of microsomal enzyme induction. Pharma-
cological Reviews 19: 317-366.

Neill J. Horley
Page 241
Coon, M. J., X. X. Ding, S. J. Pernecky and A. D. N. Vaz (1992). Cytochrome-P450 - progress
and predictions. FASEB Journal 6: 669-673.
Cooper, D. Y., S. Levin, S. Narasihulu, O. Rosenthal and R. W. Estabrook (1965). Photo-
chemical action spectrum of the terminal oxidase of mixed function oxidase systems. Science
147: 400-402.
Crabb, D. W. and J. E. Dixon (1987). A method for increasing the sensitivity of chloramphenicol
acetyltransferase assays in extracts of transfected cultured cells. Analytical Biochemistry 163(1):
88-92.
Denison, M. S. and J. P. Whitlock (1995). Xenobiotic-inducible transcription of cytochrome-
P450 genes. Journal of Biological Chemistry 270: 18175-18178.
Delraso, N. J. (1989). In vitro methods for assessing chemical or drug toxicity and metabolism in
primary hepatocytes. Drug toxicity and metabolism in Primary hepatocytes. R. R. Watson,
CRC press.
Devchand, P. R., H. Keller, J. M. Peters, M. Vazquez, F. J. Gonzalez and W. Wahli (1996). The
PPAR α-leukotriene B-4 pathway to inflammation control. Nature 384: 39-43.
DeWet, J. R., K. V. Wood, D. R. Helinski and M. Deluca (1985). Cloning of firefly luciferase
cDNA and the expression of active luciferase in Escherichia-coli. Proceedings of the National
Academy of Sciences of the United of America 82: 7870-7873.
DeWet, J. R., K. V. Wood, M. Deluca, D. R. Helinski and S. Subramani (1987). Firefly lu-
ciferase gene - Structure and expression in mammalian cells. Molecular and Cellular Biology 7:
725-737.

Neill J. Horley
Page 242
Diwan, B. A., J. M. Ward, L. M. Anderson, A. Hagiwara and J. M. Rice (1986). Lack of effect
of phenobarbital on hepatocellular initiated by N-nitrosodiethylamine or methylazoxymethanol
acetate in male syrian golden-hamsters. Toxicology and Applied Pharmacology 86(2): 298-307.
Dogra, S. C. and B. K. May (1996). Phenobarbital-induced activation of CYP2H1 and 5-ami-
nolevulinate synthase genes in chick embryo hepatocytes is blocked by an inhibitor of protein
phosphorylation. Archives of Biochemistry and Biophysics 327(2): 271-278.
Dogra, S. C. and B. K. May (1997). Liver-enriched transcription factors, HNF-1, HNF-3, and
C/EBP, are major contributors to the strong activity of the chicken CYP2H1 promoter in chick
embryo hepatocytes. DNA and Cell Biology 16(12): 1407-1418.
Dogra, S. C., M. L. Whitelaw and B. K. May (1998). Transcriptional activation of cytochrome
P450 genes by different classes of chemical inducers. Clinical and Experimental Pharmacology
and Physiology 25: 1-9.
Dogra, S. C., B. P. Davidson and B. K. May (1999). Analysis of a phenobarbital-responsive en-
hancer sequence located in the 5' flanking region of the chicken CYP2H1 gene: Identification
and characterization of functional protein-binding sites. Molecular Pharmacology 55: 14-22.
Dunn, J. C. Y., M. L. Yarmush, H. G. Koebe and R. G. Tompkins (1989). Hepatocyte function
and extracellular-matrix geometry - Culture in a sandwich configuration. FASEB Journal 3(2):
174-177.
Engelmann, G. L., A. G. Richardson and J. A. Fierer (1985). Maintenance and induction of cy-
tochrome-P-450 in cultured rat hepatocytes. Archives of Biochemistry and Biophysics 238(2):
359-367.
Farr, A. and A. Roman (1992). A pitfall of using a 2nd plasmid to determine transfection efficien-

Neill J. Horley
Page 243
cy. Nucleic Acids Research 20: 920.
Felgner, P. L., T. R. Gadek, M. Holm, R. Roman, H. W. Chan, R. G. Wenz and M. Danielsen
(1987). Lipofection - a highly efficient, lipid-mediated DNA-transfection procedure. Proceed-
ings of the National Academy of Sciences of the United of America 84: 7413-7417.
Felgner, P. L. and G. M. Ringold (1989). Cationic liposome-mediated transfection. Nature
337(6205): 387-388.
Felgner, J. H., R. Kumar, C. N. Sridhar, C. J. Wheeler, Y. J. Tsai, R. Border, P. Ramsey, M.
Martin and P. L. Felgner (1994). Enhanced gene delivery and mechanism studies with a novel
cationic lipid formulations. Journal of Biological Chemistry 269: 2550-2561.
Forman, B. M., J. Chen and R. M. Evans (1997). Hypolipidemic drugs, polyunsaturated fatty
acids, and eicosanoids are ligands for peroxisome proliferator-activated receptors α and δ. Pro-
ceedings of the National Academy of Sciences of the United of America 94: 4312-4317.
Forman, B. M., I. Tzameli, H. S. Choi, L. Chen, D. Simha, W. Seol, R. M. Evans and D. D.
Moore (1998). Androstane metabolites bind to and deactivate the nuclear receptor CAR-β. Na-
ture 395(6702): 612-615.
Friedberg, T., M. A. Grassow and F. Oesch (1990). Selective detection of messenger-RNA
forms encoding the phenobarbital inducible cytochromes-P450 and other members of the
P450IIB family by the RNAse protection assay. Archives of Biochemistry and Biophysics 279(1):
167-173.
Fujii, T., HA, H, Yokoyama, H, S. H. Yoon and H. Hori (1995). Applications of MTT assays
to primary cultured rat hepatocytes. Biological Pharmaceutical Bulletin 18(10): 1446-1449.

Neill J. Horley
Page 244
Fujiikuriyama, Y., Y. Mizukami, K. Kawajiri, K. Sogawa and M. Muramatsu (1982). Primary
structure of a cytochrome-P-450-Coding of phenobarbital-inducible cytochrome-P-450 cDNA
from rat liver. Proceedings of the National Academy of Sciences of the United of America 79:
2793-2797.
Fulco, A. J. (1991). P450BM-3 and other inducible bacterial P450 cytochromes - Biochemistry
and regulation. Annual Review of Pharmacology and Toxicology 31: 177-203.
Garfinkel, D. (1958). Studies on pig liver microsomes. I. Enzymic and pigment composition of
different microsomal fractions. Archives of Biochemistry and Biophysics 77: 493-509.
Gay, R. J., R. B. McComb and G. N. J. Bowery (1968). Optimum reaction conditions for hu-
man lactate dehydrogenase isoenzymes as they affect total lactate dehydrogenase activity. Clinical
Chemistry 14: 740-753.
Giachelli, C. M. and C. J. Omiecinski (1987). Developmental regulation of cytochrome-P-450
genes in the rat. Molecular Pharmacology 31(5): 477-484.
Giachelli, C. M., J. Linjones and C. J. Omiecinski (1989). Isolation and characterization of rat
cytochrome-P-450IIB gene members - Use of the polymerase chain-reaction to detect of a novel
P-450 messenger-RNA. Journal of Biological Chemistry 264(12): 7046-7053.
Gibson, G. and P. Skett (1994). Introduction to drug metabolism. London, Chapman and Hall.
Ginot, F., J. F. Decaux, M. Cognet, T. Berbar, F. Levrat, A. Kahn and A. Weber (1989). Trans-
fection of hepatic genes into adult-rat hepatocytes in culture and their tissue-specific expression.
European Journal of Biochemistry 180(2): 289-294.
Goldfarb, P. (1990). Molecular mechanisms of cytochrome-P-450 gene-regulation. Biochemical

Neill J. Horley
Page 245
Society Transactions 18: 30-32.
Gonzalez, F. J., B. J. Song and J. P. Hardwick (1986). Pregnenolone 16-α-carbonitrile-inducible
P-450 gene family - Conversion and differential regulation. Molecular and Cellular Biology 6:
2969-2976.
Gonzalez, F. J. (1988). The molecular-biology of cytochrome P450s. Pharmacological Reviews
40: 243-288.
Gonzalez, F. J. and D. W. Nebert (1990). Evolution of the P450-gene superfamily - Animal plant
warfare, molecular drive and human genetic-differences in drug metabolism. Trends in Genetics
6: 182-186.
Gonzalez, F. J. (1990). Molecular-genetics of the P-450 superfamily. Pharmacology & Thera-
peutics 45: 1-38.
Gonzalez, F. J. and Y. H. Lee (1996). Cytochromes P450. 6. Constitutive expression of hepatic
cytochrome P450 genes. FASEB Journal 10: 1112-1117.
Gower, D. B. and B. A. Ruparelia (1993). Olfaction in humans with special reference to odorous
- their occurrence, perception and possible social, sexual impact. Journal of Endocrinology
137(2): 167-187.
Green, M., T. Zehavi-Willner, P. N. Graves, J. Mcinnes and S. Peska (1976). Isolation and cell-
free translation of immunoglobulin messenger RNA. Archives of Biochemistry and Biophysics
172: 74-89.
Guengerich, F. P., P. Wang and N. K. Davidson (1982). Estimation of isozymes of microsomal
cytochrome-P-450 in rats, rabbits, and humans using immunochemical staining coupled with
Neill J. Horley
Page 246
dodecyl-sulfate polyacrylamide-gel electrophoresis. Biochemistry 21(7): 1698-1706.
Guengerich, F. P. (1991). Reactions and significance of cytochrome-P-450 enzymes. Journal of
Biological Chemistry 266: 10019-10022.
Guengerich, F. P. and W. W. Johnson (1997). Kinetics of ferric cytochrome P450 reduction by
NADPH-cytochrome P450 reductase: Rapid reduction in the absence of substrate and variations
among cytochrome P450 systems. Biochemistry 36(48): 14741-14750.
Guengerich, F. P., N. A. Hosea, A. Parikh, L. C. BellParikh, W. W. Johnson, E. M. J. Gillam
and T. Shimada (1998). Twenty years of biochemistry of human P450s - Purification, expression,
mechanism, and relevance to drugs. Drug Metabolism and Disposition 26: 1175-1178.
Hahn, C. N., A. J. Hansen and B. K. May (1991). Transcriptional regulation of the chicken
CYP2H1 Gene - of a phenobarbital-responsive enhancer domain. Journal of Biological Chem-
istry 266: 17031-17039.
Hamilton, J. W., W. J. Bement, P. R. Sinclair, J. F. Sinclair, J. A. Alcedo and K. E. Wetterhahn
(1992). Inhibition of protein-synthesis increases the transcription of phenobarbital-inducible
CYP2H1-gene and CYP2H2-gene in hepatocytes. Archives of Biochemistry and Biophysics
298: 96-104.
Hankinson, O. (1995). The Aryl-Hydrocarbon Receptor Complex. Annual Review of Pharma-
cology and Toxicology 35: 307-340.
Hardwick, J. P., F. J. Gonzalez and C. B. Kasper (1983). Transcriptional regulation of rat-liver
epoxide hydratase, cytochrome-P-450 oxidoreductase, and cytochrome-P-450B genes phe-
nobarbital. Journal of Biological Chemistry 258: 8081-8085.

Neill J. Horley
Page 247
Hardwick, J. P., B. J. Song, E. Huberman and F. J. Gonzalez (1987). Isolation, complementary-
DNA sequence, and regulation of rat lauric acid ω-hydroxylase (Cytochrome-P-450lA-ω) -
Identification of a new cytochrome-P-450 gene family. Journal of Biological Chemistry 262(2):
801-810.
He, J. S. and A. J. Fulco (1991). A barbiturate-regulated protein-binding to a common cyto-
chrome-P450 genes of rodents and bacteria. Journal of Biological Chemistry 266: 7864-7869.
He, J. S., Q. W. Liang and A. J. Fulco (1995). The molecular-cloning and characterization of
BM1P1 and proteins, putative positive transcription factors involved in barbiturate-mediated in-
duction of the genes encoding P450(BM-1) of Bacillus megaterium. Journal of Biological Chem-
istry 270: 18615-18625.
Heinemeyer, T., X. Chen, H. Karas, A. E. Kel, O. V. Kel, I. Liebich, T. Meinhardt, I. Reuter,
F. Schacherer and E. Wingender (1999). Expanding the TRANSFAC database towards an expert
system of regulatory molecular mechanisms. Nucleic Acids Research 27(1): 318-322.
Hoffman, M., W. H. Mayer, B. J. Scholte, A. Civil and R. J. Planta (1992). Analysis of the pro-
moter of the cytochrome P450 2B2 gene in rat. Gene Expression 2(4): 353-363.
Hofland, H. E. J., L. Shephard and S. M. Sullivan (1996). Formation of stable cationic lipid/
DNA complexes for gene transfer. Proceedings of the National Academy of Sciences of the
United of America 93: 7305-7309.
Holmen, S. L., M. W. Vanbrocklin, R. R. Eversole and Stapleton (1995). Efficient lipid-medi-
ated transfection of dna into primary rat hepatocytes. In Vitro Cellular & Developmental Biology-
Animal 30 (5): 347-351.
Honkakoski, P., R. Moore, J. Gynther and M. Negishi (1996). Characterization of phe-

Neill J. Horley
Page 248
nobarbital-inducible mouse Cyp2b10 gene transcription in primary hepatocytes. Journal of Bio-
logical Chemistry 271: 9746-9753.
Honkakoski, P. and M. Negishi (1997). Characterization of a phenobarbital-responsive enhancer
module in mouse P450 Cyp2b10 gene. Journal of Biological Chemistry 272(23): 14943-14949.
Honkakoski, P. and M. Negishi (1998a). Regulatory DNA elements of phenobarbital-responsive
cytochrome P450 CYP2B genes. Journal of Biochemical Molecular Toxicology 12: 3-9.
Honkakoski, P., R. Moore, K. A. Washburn and M. Negishi (1998b). Activation by diverse xe-
nochemicals of the 51-base pair phenobarbital-responsive enhancer module in the Cyp2b10
gene. Molecular Pharmacology 53(4): 597-601.
Honkakoski, P., I. Zelko, T. Sueyoshi and M. Negishi (1998c). The nuclear orphan receptor
CAR-retinoid X receptor heterodimer activates the phenobarbital-responsive enhancer module
of the CYP2B gene. Molecular and Cellular Biology 18: 5652-5658.
Honkakoski, P. and M. Negishi (1998d). Protein serine/threonine phosphatase inhibitors sup-
press phenobarbital-induced Cyp2b10 gene transcription in mouse primary hepatocytes. Bio-
chemical Journal 330(2): 889-895.
Huss, J. M., S. I. Wang, A. Astrom, P. McQuiddy and C. B. Kasper (1996). Dexamethasone
responsiveness of a major glucocorticoid-inducible CYP3A gene is mediated by elements unre-
lated to a glucocorticoid receptor binding motif. Proceedings of the National Academy of Sci-
ences of the United of America 93: 4666-4670.
Huss, J. M. and C. B. Kasper (1998). Nuclear receptor involvement in the regulation of rat cy-
tochrome P450 3A23 expression. Journal of Biological Chemistry 273: 16155-16162.

Neill J. Horley
Page 249
Issemann, I. and S. Green (1990). Activation of a member of the steroid-hormone receptor per-
oxisome proliferators. Nature 347: 645-650.
Jaiswal, A. K., E. Rivkin and M. Adesnik (1987). 5' Flanking sequence of the gene for rat hepatic
cytochrome P450e. Nucleic Acids Research 15: 6755.
Jaiswal, A. K., T. Haaparanta, P. V. Luc, J. Schembri and M. Adesnik (1990). Glucocorticoid
regulation of a phenobarbital-inducible 450 gene - The presence of a functional glucocorticoid
response element in the 5'-flanking region of the CYP2B2 gene. Nucleic Acids Research 18(14):
4237-4242.
Jauregui, H. O., P. N. McMillan, J. Driscoll and S. Naik (1986). Attachment and long-term sur-
vival of adult-rat hepatocytes in primary monolayer cultures: Comparison of different substrata
and tissue culture media formulations. In Vitro Cellular & Developmental Biology 22(1): 13-22.
Jeffreys, A. J., J. F. Y. Brookfield and R. Semenoff (1985). Positive identification of an immigra-
tion test-case using human fingerprints. Nature 317(6040): 818-819.
Johnson, E. F., C. N. A. Palmer, K. J. Griffin and M. H. Hsu (1996). Cytochromes P450. 7.
Role of the peroxisome proliferator-activated receptor in cytochrome P450 4A gene regulation.
FASEB Journal 10: 1241-1248.
Kaga, E., O. Nakagomi and S. Uesugi (1992). Thermal-degradation of RNA-RNA hybrids dur-
ing hybridization solution. Molecular and Cellular Probes 6(3): 261-264.
Kawamoto, T., T. Sueyoshi, I. Zelko, R. Moore, K. Washburn and M. Negishi (1999). Phe-
nobarbital-responsive nuclear translocation of the receptor CAR in induction of the CYP2B
gene. Molecular and Cellular Biology 19(9): 6318-6322.

Neill J. Horley
Page 250
Keeney, D. S., C. Skinner, S. Z. Wei, T. Friedberg and M. R. Waterman (1998). A kerati-
nocyte-specific epoxygenase, CYP2B12, metabolizes arachidonic acid with unusual selectivity,
producing a single major epoxyeicosatrienoic acid. Journal of Biological Chemistry 273(15):
9279-9284.
Keller, H., C. Dreyer, J. Medin, A. Mahfoudi, K. Ozato and W. Wahli (1993). Fatty-acids and
retinoids control lipid-metabolism through of peroxisome proliferator-activated receptor retin-
oid-X heterodimers. Proceedings of the National Academy of Sciences of the United of America
90: 2160-2164.
Kemper, B. (1998). Regulation of cytochrome P450 gene transcription by phenobarbital.
Progress in Nucleic Acid Research and Molecular Biology 61 :25-64.
Kim, J. and B. Kemper (1997). Phenobarbital alters protein binding to the CYP2B1/2 phenobar-
bital- responsive unit in native chromatin. Journal of Biological Chemistry 272(47): 29423-
29425.
Kimura, S., N. Hanioka, E. Matsunaga and F. J. Gonzalez (1989). The rat clofibrate-inducible
CYP4A gene subfamily. 1. Complete intron and exon sequence of the CYP4A1 and CYP4A2
genes, unique exon organization, and Identification of a conserved 19-bp upstream element.
DNA-A Journal of Molecular & Cellular Biology 8: 503-516.
Kimura, S., J. P. Hardwick, C. A. Kozak and F. J. Gonzalez (1989). The rat clofibrate-inducible
CYP4A subfamily. 2. cDNA sequence IVA3, mapping of the CYP4A locus to mouse chromo-
some-4, and coordinate and tissue-specific regulation of the CYP4A genes. DNA-A Journal of
Molecular & Cellular Biology 8: 517-525.
Klein, E. S., M. E. Pino, A. T. Johnson, P. J. A. Davies, S. Nagpal, S. M. Thacher, G. Krasinski

Neill J. Horley
Page 251
and A. S. Chandraratna (1996). Identification and functional separation of retinoic acid receptor
neutral antagonists and inverse agonists. Journal of Biological Chemistry 271(37): 22692-22696.
Kleinman, H. K., M. L. McGarvey, J. R. Hassell, V. L. Star, F. B. Cannon and M. G. Laurie
(1986). Basement-membrane complexes with biological-activity. Biochemistry 25: 312-318.
Klingenberg, M. (1958). Pigments of rat liver microsomes. Archives of Biochemistry and Bio-
physics 75: 376-386.
Kocarek, T. A., E. G. Schuetz and P. S. Guzelian (1990). Differentiated induction of cyto-
chrome-P450b/e and messenger-RNAs by dose of phenobarbital in primary cultures of adult rat
hepatocytes. Molecular Pharmacology 38: 440-444.
Kumar, A., C. Raphael and M. Adesnik (1983). Cloned cytochrome-P-450 cDNA - nucleotide-
sequence and multiple phenobarbital-induced messenger-RNA species. Journal of Biological
Chemistry 258: 11280-11284.
Labbe, D., A. Jean and A. Anderson (1988). A constitutive member of the rat cytochrome-
P450IIB subfamily - length coding sequence of the P450IIB3 cDNA. DNA-A Journal of Mo-
lecular & Cellular Biology 7(4): 253-260.
Laemmli, U. K. (1970). Cleavage of structural proteins during the assembly of the head of bac-
teriophage T4. Nature 227: 680-685.
Lake, B. G. (1995). Mechanisms of hepatocarcinogenicity of peroxisome - proliferating drugs
and chemicals. Annual Review of Pharmacology and Toxicology 35: 483-507.
Lecluyse, E., P. Bullock, A. Madan, K. Carroll and A. Parkinson (1999). Influence of extracel-
lular matrix overlay and medium formulation on the induction of cytochrome P-4502B enzymes

Neill J. Horley
Page 252
in primary cultures of rat hepatocytes. Drug Metabolism and Disposition 27(8): 909-915.
Lee, J. J. and N. A. Costow (1987). A molecular titration assay to measure transcriptional prev-
alence levels. Methods of Enzymology 152: 633-648.
Lee, Y. H., M. Yano, S. Y. Liu, E. Matsunaga, P. F. Johnson and F. J. Gonzalez (1994). A novel
cis-acting element controlling the rat CYP2D5 gene and requiring cooperativity between C/
EBP-beta and an SP1 factor. Molecular and Cellular Biology 14(2): 1383-1394.
Lee, M. O., Y. Liu and X. K. Zhang (1995). A retinoic acid response element that overlaps an
estrogen element mediates multihormonal sensitivity in transcriptional activation of the lactofer-
rin gene. Molecular and Cellular Biology 15: 4194-4207.
Lehmann, J. M., D. D. McKee, M. A. Watson, T. M. Willson, J. T. Moore and S. A. Kliewer
(1998). The human orphan nuclear receptor PXR is activated by compounds that regulate
CYP3A4 gene expression and cause drug interactions. Journal of Clinical Investigation 102:
1016-1023.
Leighton, J. K. and B. Kemper (1984). Differential induction and tissue-specific expression of
closely related members of the phenobarbital-inducible rabbit cytochrome P450 gene family.
Journal of Biological Chemistry 259: 1165-1168.
Liang, Q. W. and A. J. Fulco (1995). Transcriptional regulation of the genes encoding cyto-
chromes P450(BM-1) and P450(BM-3) in Bacillus-Megaterium by the binding of BM3R1 repres-
sor to barbie box elements and operator sites. Journal of Biological Chemistry 270(31): 18606-
18614.
Liang, Q. W., J. S. He and A. J. Fulco (1995). The role of barbie box sequences as cis-acting
elements involved in the barbiturate-mediated induction of cytochromes P450(BM-1)

Neill J. Horley
Page 253
P450(BM-3) in Bacillus-Megaterium. Journal of Biological Chemistry 270(9): 4438-4450.
Liang, Q. W., L. S. Chen and A. J. Fulco (1998). In vivo roles of BM3R1 repressor in the bar-
biturate-mediated induction of the cytochrome P450 genes (P450(BM-3) and P450(BM-1)) of
Bacillus megaterium. Biochimica et Biophysica Acta-General Subjects 1380: 183-197.
Liu, S. Q., Y. Park, I. Rivera-Rivera, H. Li and B. Kemper (1998). Nuclear factor-1 motif and
redundant regulatory elements comprise phenobarbital-responsive enhancer in CYP2B1/2.
DNA and Cell Biology 17(5): 461-470.
Lock, E. A., A. M. Mitchell and C. R. Elcombe (1989). Biochemical-mechanisms of induction
of hepatic peroxisome proliferation. Annual Review of Pharmacology and Toxicology 29: 145-
163.
Lu, A. Y. H. and S. B. West (1980). Multiplicity of mammalian microsomal cytochrome P450.
Pharmacological Reviews 31: 272-295.
Luc, P. V., M. Adesnik, S. Ganguly and P. M. Shaw (1996). Transcriptional regulation of the
CYP2B1 and CYP2B2 genes by C/EBP- related proteins. Biochemical Pharmacology 51(3):
345-356.
Malone, R. W., M. A. Hickman, K. Lehmannbruinsma, T. R. Sih, D. M. Walzem and J. S.
Powell (1994). Dexamethasone enhancement of gene-expression after direct hepatic DNA in-
jection. Journal of Biological Chemistry 269(47): 29903-29907.
Melton, D. A., P. A. Krieg, M. R. Rebagliati, T. Maniatis, K. Zinn and M. R. Green (1984).
Efficient in vitro synthesis of biologically-active RNA and RNA hybridization probes from plas-
mids containing a bacteriophage-SP6 promoter. Nucleic Acids Research 12: 7035-7056.

Neill J. Horley
Page 254
Michalopoulos, G. and H. C. Pitot (1975). Primary culture of parenchyma liver cells on collagen
membranes. Morphological and biochemical observations. Experimental Cell Research 94: 70-
78.
Miles, J. S., N. K. Spurr, A. C. Gough, T. Jowett, A. W. McLaren and C. R. Brook (1988). A
novel human cytochrome-P450 gene (P450IIB) - Chromosomal localization and evidence for
alternative splicing. Nucleic Acids Research 16(13): 5783-5795.
Milton, M. N., C. R. Elcombe and G. G. Gibson (1990). On the mechanism of induction of
microsomal cytochrome P450IVA1 and peroxisome proliferation in rat-liver by clofibrate. Bio-
chemical Pharmacology 40(12): 2727-2732.
Mitchell, A. M., J. W. Bridges and C. R. Elcombe (1984). Factors influencing peroxisome pro-
liferation in cultured rat hepatocytes. Archives of Toxicology 55: 239-246.
Mizukami, Y., K. Sogawa, Y. Suwa, M. Muramatsu and Y. Fujiikuriyama (1983). Gene structure
of a phenobarbital-inducible cytochrome-P-450 in rat liver. Proceedings of the National Acad-
emy of Sciences of the United of America-Biological Sciences 80(13): 3958-3962.
Myers, R. M., Z. Larin and T. Maniatis (1985). Detection of single base substitutions by ribo-
nuclease cleavage at mismatches in RNA-DNA duplexes. Science 230(4731): 1242-1246.
Nakajima, H. and N. Shimbara (1996). Functional maintenance of hepatocytes on collagen gel
cultured with simple serum-free medium containing sodium selenite. Biochemical and Biophys-
ical Research Communications 222(3): 664-668.
Natesan, S., V. M. Rivera, E. Molinari and M. Gilman (1997). Transcriptional squelching re-
examined. Nature 390: 349-350.

Neill J. Horley
Page 255
Nebert, D. W. and F. J. Gonzalez (1987). P450 Genes - structure, evolution, and regulation. An-
nual Review of Biochemistry 56: 945-993.
Nebert, D. W., D. R. Nelson, M. Adesnik, M. J. Coon, G. F. Estabrook, I. C. Gunsalus, E. F.
Johnson, B. Kemper, W. Levin, I. R. Phillips, R. Sato and M. R. Waterman (1989). The P450
superfamily - Updated listing of all genes and nrecommended omenclature for the chromosomal
loci. DNA-A Journal of Molecular & Cellular Biology 8: 1-13.
Nebert, D. W., D. R. Nelson, M. J. Coon, R. W. Estabrook, R. Feyereisen, Y. Fujiikuriyama,
F. J. Gonzalez, F. P. Guengerich, I. C. Gunsalus, L. J. Johnson, R. Sato, M. R. Waterman and
D. J. Waxman (1991). The P450 superfamily - Update on new sequences, gene-mapping, rec-
ommended nomenclature. DNA and Cell Biology 10: 1-14.
Nebert, D. W. (1994). Drug-metabolizing-enzymes in ligand-modulated transcription. Bio-
chemical Pharmacology 47: 25-37.
Nelson, D. R. and H. W. Strobel (1987). Evolution of cytochrome-P-450 proteins. Molecular
Biology and Evolution 4: 572-593.
Nelson, D. R., T. Kamataki, D. J. Waxman, F. P. Guengerich, F. R. Estabrook, F. J. Gonzalez,
M. J. Coon, I. C. Gunsalus, O. Gotoh, K. Okuda and D. W. Nebert (1993). The P450 super-
family - Update on new sequences, gene-mapping, accession numbers, early trivial names of en-
zymes, and nomenclature. DNA and Cell Biology 12: 1-51.
Nelson, D. R., L. Koymans, T. Kamataki, J. J. Stegeman, R. Feyereisen, D. J. Waxman, M. R.
Waterman, O. Gotoh, M. J. Coon, R. W. Estabrook, I. C. Gunsalus and D. W. Nebert (1996).
P450 superfamily: Update on new sequences, gene mapping, accession numbers and nomencla-
ture. Pharmacogenetics 6: 1-42.

Neill J. Horley
Page 256
Newman, S. and P. S. Guzelian (1982). Stimulation of de novo synthesis of cytochrome-P-450
by phenobarbital in primary non-proliferating cultures of adult-rat hepatocytes. Proceedings of
the National Academy of Sciences of the United of America-Biological Sciences 79(9): 2922-
2926.
Okey, A. B. (1990). Enzyme-induction in the cytochrome-P-450 system. Pharmacology &
Therapeutics 45: 241-298.
Oldham, H. G., S. J. Norman and R. J. Chenery (1985). Primary cultures of adult-rat hepato-
cytes - A model for the toxicity of histamine H2-receptor antagonists. Toxicology 36: 215-229.
Omiecinski, C. J., F. G. Walz and G. P. Vlasuk (1985). Phenobarbital induction of rat-liver cy-
tochrome-P-450b and cytochrome-P-450e - quantitation of specific RNAs by hybridisation to
synthetic oligodeoxyribonucleotide probes. Journal of Biological Chemistry 260(6): 3247-3250.
Omiecinski, C. J. (1986). Tissue-specific expression of rat messenger-RNAs homologous cyto-
chromes P-450b and P-450e. Nucleic Acids Research 14(3): 1525-1539.
Omura, T. and R. Sato (1964a). The carbon monoxide binding pigment of liver microsomes. I.
Evidence for its haemprotein nature. Journal of Biological Chemistry 239: 2370-2378.
Omura, T. and R. Sato (1964b). The carbon monoxide binding pigment of liver microsomes.
II. Solubilization, purification and properties. Journal of Biological Chemistry 239: 2379-2385.
Onate, S. A., S. Y. Tsai, M. J. Tsai and B. W. Omalley (1995). Sequence and characterization
of a coactivator for the steriod hormone receptor superfamily. Science 270(5240): 1354-1357.
Padgham, C. R. W., C. C. Boyle, X. J. Wang, S. M. Raleigh, M. C. Wright and A. J. Paine
(1993). Alteration of transcription factor messenger-RNAs during the isolation and culture of rat

Neill J. Horley
Page 257
hepatocytes suggests the activation of a proliferative mode underlies their dedifferentiation. Bio-
chemical and Biophysical Research Communications 197(2): 599-605.
Paine, A. J. (1981). Hepatic cytochrome P450. Essays in Biochemistry 17: 85-126.
Palmer, C. N. A., M. H. Hsu, A. S. Muerhoff, K. J. Griffin and E. F. Johnson (1994). Interaction
of the peroxisome proliferator-activated receptorα with the Retinoid-X Receptor-α unmasks a
cryptic peroxisome proliferator response element that overlaps an Arp-1-binding site in the
CYP4A6 promoter. Journal of Biological Chemistry 269: 18083-18089.
Park, Y. K., H. Li and B. Kemper (1996). Phenobarbital induction mediated by a distal CYP2B2
sequence in rat liver transiently transfected in situ. Journal of Biological Chemistry 271: 23725-
23728.
Park, Y. and B. Kemper (1996). The CYP2B1 proximal promoter contains a functional C/ EBP
regulatory element. DNA and Cell Biology 15(8): 693-701.
Perdew, G. H. (1988). Association of the Ah receptor with the 90-kDa heat shock protein. Jour-
nal of Biological Chemistry 263: 13802-13805.
Perdew, G. H. and A. Poland (1988). Purification of the Ah receptor from C57bl/6j mouse-liv-
er. Journal of Biological Chemistry 263: 9848-9852.
Phillips, I. A., E. A. Shephard, R. M. Bayney, S. F. Pike, B. R. Rabin, R. Heath and N. Carter
(1983). Induction and repression of the major phenobarbital-induced cytochrome P450 mea-
sured by radioimmunoassay. Biochemical Journal 212: 55-64.
Pike, S. F., E. A. Shephard, B. R. Rabin and I. R. Phillips (1985). Induction of cytochrome-P-
450 by phenobarbital is mediated at level of transcription. Biochemical Pharmacology 34(14):
Neill J. Horley
Page 258
2489-2494.
Poland, A., E. A. Glover and A. S. Kende (1976). Stereospecific high affinity binding of 2, 3, 7,
8-tetrachlorodibenzo-p-dioxin by hepatic cytosol. Journal of Biological Chemistry 251: 4936-
4946.
Poland, A. and J. C. Knutson (1982). 2,3,7,8-Tetrachlorodibenzo-para-dioxin and related aro-
matic-hydrocarbons - Examination of the mechanism of toxicity. Annual Review of Pharma-
cology and Toxicology 22: 517-554.
Pollenz, R. S., C. A. Sattler and A. Poland (1994). The Aryl-Hydrocarbon Receptor and Aryl-
Hydrocarbon receptor nuclear translocator protein show distinct subcellular localizations in Hepa
1c1c7 cells by immunofluorescence microscopy. Molecular Pharmacology 45: 428-438.
Pongratz, I., P. E. Stromstedt, G. G. F. Mason and L. Poellinger (1991). Inhibition of the specific
DNA-binding activity of the dioxin receptor by phosphatase treatment. Journal of Biological
Chemistry 266: 16813-16817.
Pongratz, I., G. G. F. Mason and L. Poellinger (1992). Dual roles of the 90-kDa heat shock pro-
tein hsp90 in modulating functional activities of the dioxin receptor. Journal of Biological Chem-
istry 267: 13728-13734.
Porter, T. D. and M. J. Coon (1991). Cytochrome-P-450 - multiplicity of isoforms, substrates,
and catalytic and regulatory mechanisms. Journal of Biological Chemistry 266: 13469-13472.
Prabhu, L., P. Upadhya, N. Ram, C. S. Nirodi, S. Sultana, S. A. Vatsala, P. N. Rangarajan, A.
Surolia and G. Padmanaban (1995). A model for the transcriptional regulation of the CYP2B1/
B2 Rat-Liver. Proceedings of the National Academy of Sciences of the United of America
92(21): 9628-9632.

Neill J. Horley
Page 259
Quattrochi, L. C., A. S. Mills, J. L. Barwick, C. B. Yockey and P. S. Guzelian (1995). A novel
cis-acting element in a liver cytochrome-P450 3A gene confers synergistic induction by glu-
cocorticoids plus antiglucocorticoids. Journal of Biological Chemistry 270: 28917-28923.
Quattrochi, L. C., C. B. Yockey, J. L. Barwick and P. S. Guzelian (1998). Characterization of
DNA-binding proteins required for glucocorticoid induction of CYP3A23. Archives of Bio-
chemistry and Biophysics 349: 251-260.
Ram, N., M. V. Rao, L. Prabhu, C. S. Nirodi, S. Sultana, P. G. Vatsala and G. Padmanaban
(1995). Characterization of a negative cis-acting DNA element regulating the transcription of
CYP2B1/B2 gene in rat-liver. Archives of Biochemistry and Biophysics 317(1): 39-45.
Rampersaud, A. and F. G. Walz (1983). At least 6 forms of extremely homologous cytochromes-
P-450 in rat liver are encoded at two closely linked genetic loci. Proceedings of the National
Academy of Sciences of the United of America-Biological Sciences 80(21): 6542-6546.
Rampersaud, A. and F. G. Walz (1987). Mapping of genes for cytochromes P-450b, P-450e, P-
450g, and P450h in the rat - Demonstration of 2 gene clusters with P450-b,e on chromosome-
1. Journal of Biological Chemistry 262(12): 5649-5653.
Ramsden, R., K. M. Sommer and C. J. Omiecinski (1993). Phenobarbital induction and tissue-
specific expression of the rat CYP2B2 gene in transgenic mice. Journal of Biological Chemistry
268(29): 21722-21726.
Ramsden, R., N. B. Beck, K. M. Sommer and C. J. Omiecinski (1999). Phenobarbital respon-
siveness conferred by the 5'-flanking region of the rat CYP2B2 gene in transgenic mice. Gene
228(1-2): 169-179.
Rangarajan, P. N. and G. Padmanaban (1989). Regulation of cytochrome-P-450b/e gene-ex-

Neill J. Horley
Page 260
pression by a heme and phenobarbitone-modulated transcription factor. Proceedings of the Na-
tional Academy of Sciences of the United of America 80 (11): 3963-3967.
Reid, L. M. and M. Rojkind (1979). New techniques for culturing differentiated cells: reconsti-
tuted basement membrane rafts. Methods in Enzymology. W. B. Jakoby, New York, Academic
press.
Roberts, B. J., B. J. Song, Y. Soh, S. S. Park and S. E. Shoaf (1995). Ethanol induces CYP2E1
by protein stabilization - Role of ubiquitin conjugation in the rapid degradation of CYP2E1.
Journal of Biological Chemistry 270: 29632-29635.
Roe, A. L., R. A. Blouin and G. Howard (1996). In vivo phenobarbital treatment increases pro-
tein binding to a putative AP-1 site in the CYP2B2 promoter. Biochemical and Biophysical Re-
search Communications 228: 110-114.
Ryan, D., P. E. Thomas, D. Korzeniowski and W. Levin (1979). Separation and characterisation
of highly purified forms of liver microsomal cytochrome P450 from rats treated with polyclori-
nated biphenyls, phenobarbital, and 3-methylcholanthrene. Journal of Biological Chemistry 254:
1365-1374.
Ryan, D. E., P. E. Thomas, L. M. Reik and W. Levin (1982). Purification, characterization and
regulation of 5 rat hepatic- microsomal cytochrome-P-450 isozymes. Xenobiotica 12(11): 727-
744.
Ryan, D. E., P. E. Thomas and W. Levin (1982). Purification and characterization of a minor
form of hepatic- microsomal cytochrome-P-450 from rats treated with polychlorinated biphe-
nyls. Archives of Biochemistry and Biophysics 216(1): 272-288.
Sanes, J. R., J. L. R. Rubenstein and J. F. Nicolas (1986). Use of a recombinant retrovirus to

Neill J. Horley
Page 261
study post-implantation cell lineage in mouse embryos. EMBO Journal 5: 3133-3142.
Savonet V., Maenhaut C., Miot F., and I. Pirson (1997). Pitfalls in the Use of Several "House-
keeping" Genes as Standards for Quantitation of mRNA: The Example of Thyroid Cells. Ana-
lytical Biochemistry 247: (1): 165-167.
Schenkman, J. B. and G. G. Gibson (1981). Status of the cytochrome-P450 cycle. Trends in
Pharmacological Sciences 2(6): 150-152.
Schuetz, E. G., S. A. Wrighton, J. L. Barwick and P. S. Guzelian (1984). Induction of cyto-
chrome-P-450 by glucocorticoids in rat-liver .1. Evidence that glucocorticoids and pregnenolo-
ne-16α carbonitrile regulate de novo synthesis of a common form of cytochrome P450 in cultures
of adult rat hepatocytes and in the liver in vivo. Journal of Biological Chemistry 259: 1999-2006.
Schuetz, E. G. and P. S. Guzelian (1984). Induction of cytochrome-P-450 by glucocorticoids in
rat-liver .2. Evidence that glucocorticoids regulate induction of cytochrome P450 by a non-clas-
sical receptor mechanism. Journal of Biological Chemistry 259: 2007-2012.
Schuetz, E. G., D. Li, C. J. Omiecinski, U. Mullereberhard, H. K. Kleinman, B. Elswick and P.
S. Guzelian (1988). Regulation of gene-expression in adult-rat hepatocytes cultured on a base-
ment-membrane matrix. Journal of Cellular Physiology 134(3): 309-323.
Schuetz, E. G., J. D. Schuetz, B. May and P. S. Guzelian (1990). Regulation of cytochrome-P-
450b/e and P-450p gene-expression by growth-hormone in adult-rat hepatocytes cultured on a
reconstituted basement-membrane. Journal of Biological Chemistry 265(2): 1188-1192.
Schuetz, J. D., E. G. Schuetz, J. V. Thottassery, P. S. Guzelian, S. Strom and D. Sun (1996).
Identification of a novel dexamethasone responsive enhancer in the human CYP3A5 gene and
its activation in human and rat liver cells. Molecular Pharmacology 49: 63-72.

Neill J. Horley
Page 262
Schuetz, E. G., C. Brimer and J. D. Schuetz (1998). Environmental xenobiotics and the antihor-
mones cyproterone acetate and spironolactone use the nuclear hormone pregnenolone X recep-
tor to activate the CYP3A23 hormone response element. Molecular Pharmacology 54(6): 1113-
1117.
Seed, B. and J. Y. Sheen (1988). A simple phase-extraction assay for chloramphenicol activity.
Gene 67: 271-277.
Seglan, P. O. (1976). Preparation of isolated rat liver cells. Methods in Cell Biology 13: 29-83.
Seol, W., H. S. Choi and D.D. Moore (1996). An orphan nuclear hormone receptor that lacks
a DNA binding domain and heterodimerizes with other receptors. Science 272: 1336-1339.
Shaw, G. C. and A. J. Fulco (1993). Inhibition by barbiturates of the binding of BM3R1 repres-
sor to its operator site on the barbiturate-inducible cytochrome P450(BM-3) gene of Bacillus
megaterium. Journal of Biological Chemistry 268(4): 2997-3004.
Shaw, P. M., M. Adesnik, M. C. Weiss and L. Corcos (1993). The phenobarbital-induced tran-
scriptional activation of cytochrome P450 genes is blocked by the glucocorticoid-progesterone
antagonist RU486. Molecular Pharmacology 44(4): 775-783.
Shaw, P. M., M. Edigkaufer, J. Doehmer and M. Adesnik (1996). Sequence of the rat PB-in-
ducible CYP2B1 promoter. Biochimica Et Biophysica Acta-Gene Structure and Expression
1305(1-2): 54-58.
Shaw, G. C., C. C. Sung, C. H. Liu and C. H. Lin (1998). Evidence against the BM1P1 protein
as a positive transcription factor for barbiturate-mediated induction of cytochrome P450(BM-1)
in Bacillus megaterium. Journal of Biological Chemistry 273(14): 7996-8002.
Neill J. Horley
Page 263
Shephard, E. A., L. A. Forrest, A. Shervington and P. I. Fernandez (1994). Interaction of proteins
with a cytochrome-P450 2B2 gene promoter: Identification of two DNA-sequences that bind
proteins that are enriched or activated in response to phenobarbital. DNA and Cell Biology
13(8): 793-804.
Shervington, A. (1998). Identification of sequences involved in both basal expression and phe-
nobarbital induction of a CYP2B2 gene using in vitro transcription system. Biochemistry and
Molecular Biology International 45(2): 303-313.
Sidhu, J. S., F. M. Farin and C. J. Omiecinski (1993). Influence of extracellular-matrix overlay
on phenobarbital-mediated induction of CYP2B1, 2B2, and 3A1-genes in primary adult-rat
hepatocyte culture. Archives of Biochemistry and Biophysics 301: 103-113.
Sidhu, J. S., F. M. Fairn, T. J. Kavarnagh and C. J. Omiecinski (1994). Effect of tissue-culture
substratum and extracellular matrix overlay on liver selective and xenobiotic inducible gene ex-
pression in primary rat hepaocytes. In Vitro Toxicology 7(3): 225-242.
Sidhu, J. S. and C. J. Omiecinski (1995). cAMP-associated inhibition of phenobarbital-induced
cytochrome P450 gene expression in primary rat hepatocyte cultures. Journal of Biological
Chemistry 270: 12762-12773.
Sidhu, J. S. and C. J. Omiecinski (1997). An okadaic acid-sensitive pathway involved in the phe-
nobarbital-mediated induction of CYP2B gene expression in primary rat hepatocyte cultures.
Journal of pharmacology and Experimental Therapeutics 282: 1122-1129
Sidhu, J. S. and C. J. Omiecinski (1998). Protein synthesis inhibitors exhibit a nonspecific effect
on phenobarbital-inducible cytochome P450 gene expression in primary rat hepatocytes. Journal
of Biological Chemistry 273: 4769-4775.
Neill J. Horley
Page 264
Sinclair, P. R., W. J. Bement, S. A. Haugen, J. F. Sinclair and P. S. Guzelian (1990). Induction
of cytochrome-P-450 and 5-aminolevulinate synthase sctivities in cultured rat hepatocytes. Can-
cer Research 50: 5219-5224.
Sirca, A. E. and H. C. Pitot (1980). Drug metabolism and effects of carcinogens on cultured he-
patic cells. Pharmacological Reviews 31(3): 205-228.
Skett, P. (1994). Problems in using isolated and cultured-hepatocytes for xenobiotic metabolism/
metabolism-based toxicity testing--solutions? Toxicology in Vitro 8(3): 491-504.
Sleigh, M. J. (1986). A nonchromatographic assay for expression of the chloramphenicol acetyl-
transferase gene in eukaryotic cells. Analytical Biochemistry 156(1): 251-256.
Sommer, K. M., R. Ramsden, J. Sidhu, P. Costa and C. J. Omiecinski (1996). Promoter region
analysis of the rat CYP2B1 and CYP2B2 genes. Pharmacogenetics 6(4): 369-374.
Song, B. J., R. L. Veech, S. S. Park, H. V. Gelboin and F. J. Gonzalez (1989). Induction of rat
hepatic N-nitrosodimethylamine demethylase by acetone is due to protein stabilization. Journal
of Biological Chemistry 264: 3568-3572.
Soucek, P. and I. Gut (1992). Cytochromes P-450 in rats - Structures, functions, properties rel-
evant human forms. Xenobiotica 22: 83-103.
Srivastava, G., A. J. Hansen, M. J. Bawden and B. K. May (1990). Hemin administration to rats
reduces levels of hepatic mRNAs for phenobarbitone-inducible enzymes. Molecular Phar-
macology 38(4): 486-493.
Stoltz, C., M. H. Vachon, E. Trottier, S. Dubois, Y. Paquet and A. Anderson (1998). The
CYP2B2 phenobarbital response unit contains an accessory factor element and a putative gluco-
Neill J. Horley
Page 265
corticoid response element essential for conferring maximal phenobarbital responsiveness. Jour-
nal of Biological Chemistry 273: 8528-8536.
Stoltz, C. and A. Anderson (1999). Positive regulation of the rat CYP2B2 phenobarbital response
unit by the nuclear receptor hexamer half-site. Nuclear factor 1 complex. Biochemical Pharma-
cology 57(9): 1073-1076.
Strom, S. C., R. L. Jirtle, R. S. Jones, D. L. Novicki, M. R. Rosenberg, I. G. Novotny, J. R.
McLain and G. Michalopoulos (1982). Isolation, culture, and transplantation of human hepato-
cytes. Journal of the National Cancer Institute 68: 771-778.
Sueyoshi, T., T. Kawamoto, I. Zelko, P. Honkakoski and M. Negishi (1999). The repressed nu-
clear receptor CAR responds to phenobarbital in activating the human CYP2B6 gene. Journal
of Biological Chemistry 274: 6043-6046.
Suwa, Y., Y. Mizukami, K. Sogawa and Y. Fujiikuriyama (1985). Gene structure of a major form
of phenobarbital-inducible P-450 in rat-liver. Journal of Biological Chemistry 260(13): 7980-
7984.
Thellin O., Zorzi W., Lakaye B., De Borman B., Coumans B., Hennen G., Grisar T., Igout A
and E. Heinen (1999). Housekeeping genes as internal standards: use and limits. Journal of Bio-
technology 75(2): 291-295.
Thomas, P. E., L. M. Reik, D. E. Ryan and W. Levin (1981). Regulation of 3 forms of cyto-
chrome-P-450 and epoxide rat-liver microsomes - Effects of age, sex, and induction. Journal of
Biological Chemistry 256(2): 1044-1052.
Trottier, E., A. Belzil, C. Stoltz and A. Anderson (1995). Localization of a phenobarbital-respon-
sive element (PBRE) in flanking region of the rat CYP2B2 gene. Gene 158: 263-268.

Neill J. Horley
Page 266
Turner, N. A. and H. C. Pitot (1989). Dependence of the induction of cytochrome-P-450 by
phenobarbital in primary cultures of adult-rat hepatocytes on the composition of the culture me-
dium. Biochemical Pharmacology 38(14): 2247-2251.
Upadhya, P., M. V. Rao, V. Venkateswar, P. N. Rangarajan and Padmanaban (1992). Iden-
tification and functional-characterization of a cis-acting positive DNA element regulating CYP-
2B1-B2 gene-transcription in liver. Nucleic Acids Research 20(3): 557-562.
Wacker, W. E. C., D. D. Ulmer and B. L. Vallee (1956). Metaloenzymes and mycocardial inf-
arctions. II. Malic and lactate dehydrogenase activites and the zinc concentration in serum. New
England Journal of Medicine 255: 449-456.
Watanabe, Y., H. Nomoto, R. Takezawa, N. Miyoshi and T. Akaike (1994). Highly efficient
transfection into primary cultured mouse hepatocytes by use of cation-liposomes - An applica-
tion for immunization. Journal of Biochemistry 116: 1220-1226.
Waxman, D. J. and L. Azaroff (1992). Phenobarbital Induction of cytochrome-P-450 gene-ex-
pression. Biochemical Journal 281: 577-592.
Waxman, D. J., J. J. Morrissey, S. Naik and H. O. Jauregui (1990). Phenobarbital induction of
cytochromes-P-450 - High-level long-term responsiveness of primary rat hepatocyte cultures to
drug induction, and glucocorticoid dependence of the phenobarbital response. Biochemical
Journal 271: 113-119.
Waxman, D. J. and C. Walsh (1982). Phenobarbital-induced rat-liver cytochrome-P-450 - Pu-
rification and characterization of two closely related isozymic forms. Journal of Biological Chem-
istry 257(17): 10446-10457.
Weber, M., K. Moller, M. Welzeck and J. Schorr (1995). Effects of lipopolysaccharide on trans-

Neill J. Horley
Page 267
fection efficiency in eukaryotic cells. Biotechniques 19(6): 930-940.
Weeks, D. P., N. Beerman and O. M. Griffith (1986). A small-scale 5-hour procedure for iso-
lating multiple samples CsCl-purified DNA - Application to isolations from mammalian, insect,
higher-plant, algal, yeast, and bacterial sources. Analytical Biochemistry 152: 376-385.
Whitelaw, M. L., J. McGuire, D. Picard, J. A. Gustafsson and L. Poellinger (1995). Heat-shock
protein Hsp90 regulates dioxin receptor function in vivo. Proceedings of the National Academy
of Sciences of the United of America 92: 4437-4441.
Whitlock, J. P. (1986). The regulation of cytochrome-P-450 gene-expression. Annual Review
of Pharmacology and Toxicology 26: 333-369.
Whitlock, J. P., S. T. Okino, L. Q. Dong, H. S. P. Ko, R. ClarkeKatzenberg, M. Qiang and H.
Li (1996). Cytochromes P450. 5. Induction of cytochrome P4501A1: A model for analyzing
mammalian gene transcription. FASEB Journal 10: 809-818.
Whysner, J., P. M. Ross and G. M. Williams (1996). Phenobarbital mechanistic data and risk
assessment: Enzyme induction, enhanced cell proliferation, and tumor promotion. Pharmacolo-
gy & Therapeutics 71(1-2): 153-191.
Williams, G. M. and K. Furuya (1984). Distinction between liver neoplasm promoting and syn-
carcinogenic effects demonstrated by exposure to phenobarbital or diethylnitrosamine either be-
fore or after N-2-fluorenylacetamide. Carcinogenesis 5(2): 171-174.
Wrighton, S. A., E. G. Schuetz, P. B. Watkins, P. Maurel, J. Barwick, H. H. Bailey, B. Young
and P. Guzelian (1985). Demonstration in multiple species of inducible hepatic cytochrome
P450 and their messenger-RNAs related to the glucocorticoid-inducible cytochrome-P-450 of
the rat. Molecular Pharmacology 28: 312-321.

Neill J. Horley
Page 268
Wrighton, S. A., B. J. Ring, P. B. Watkins and M. Vandenbranden (1989). Identification of a
polymorphically expressed member of the human cytochrome P450III family. Molecular Phar-
macology 36(1): 97-105.
Xie, W. Q. and L. I. Rothblum (1991). Rapid, small-scale RNA isolation from tissue-culture
cells. Biotechniques 11: 324 -327.
Yamazoe, Y., M. Shimada, N. Murayama and R. Kato (1987). Suppression of levels of phe-
nobarbital-inducible rat-liver cytochrome-P-450 by pituitary-hormone. Journal of Biological
Chemistry 262(15): 7423-7428.
Yoshida, Y., N. Kimura, H. Oda and A. Kakinuma (1996). Insulin suppresses the induction of
CYP2B1 and CYP2B2 gene expression by phenobarbital in adult rat cultured hepatocytes. Bio-
chemical and Biophysical Research Communications 229: 182-188.
Yuan, P. M., D. E. Ryan, W. Levin and J. E. Shively (1983). Identification and localization of
amino-acid substitutions between 2 phenobarbital-inducible rat hepatic-microsomal cyto-
chromes P450 by micro sequence analyses. Proceedings of the National Academy of Sciences of
the United of America 80(5): 1169-1173.
Zhao, J., G. Chan, S. Govind, P. Bell and B. Kemper (1990). Structure of 5' regions and expres-
sion of phenobarbital-inducible rabbit cytochrome-P450IIC genes. DNA and Cell Biology 9:
37-48.

Neill J. Horley
Page 269
Chapter 6 Submitted abstracts
Mechanism of induction of the CYP2B2 gene.
Neill J. Horley, Maurice Dickins and David Bell.
Abstract submitted for British Toxicology Society Autumn meeting at University of York
Sept. 1998 awarded best Oral presentation.
Mechanism of induction of the CYP2B2 gene.
Neill J. Horley, Maurice Dickins and David Bell.
Abstract submitted for Pfizer Advances in Drug Metaoblism (poster symposium).
Summer meeting Aug. 1998.