Embed Size (px)
Citation preview

1
Hormonal Contraceptives, Duration of Use and the Experience of
Side Effects in Southern Ghana
Dr Claire Elizabeth Bailey
Division of Social Statistics and Demography, Social sciences, University of Southampton
Abstract
Side effects or fear of side effects have been shown to be an important factor in the lack of
adoption of contraceptive methods, particularly modern hormonal methods, however little is
known about the actual experience of side effects and their influence on contraceptive use
dynamics. This study aims to explore the association between the experience of side effects,
the type of method, and the duration of episodes of use. This paper uses calendar data from
a longitudinal survey conducted in Southern Ghana containing monthly reporting of
contraceptive use along with concurrent reporting of side effects. Descriptive statistics and
single decrement life tables are used for the analysis.
The result show that injectable use is most commonly associated with side effects, with 33.8%
of episodes of contraceptive use being associated with the experience of side effects
compared to 28.3% of pill episodes. However due to the longer length of episodes when
taking into account all months of use only 9% of women-months of injection use have side
effects compared to 11% of women-months of pill use. The length of pill episodes is not
affected by side effects whereas for injectables the length of episodes is shorter when side
effects are experienced than when they are not.

2
1. Introduction
Side effects or the fear of side effects have been shown to be an important factor in the lack
of adoption of contraceptive methods, particularly modern hormonal methods, and there is a
large body of evidence based on clinical trials which details the possible physical symptoms
and side effects which may be caused by using a particular contraceptive method. However
little is known about the actual experience of side effects by women in particular social
contexts and the influence of experiencing side effects on contraceptive use dynamics.
Previous literature has identified side effects or the fear of side effects as an important factor
in the discontinuation of methods (Ali & Cleland, 1995; Ali & Cleland, 1999; Curtis & Blanc,
1997) and side effects may also work to shorten the duration of use of methods or influence
method choice away from the high efficacy modern methods. As such the aim of this study is
to explore the association between the experience of side effects, the type of method and
the duration of episodes of use in a population of women in Southern Ghana. Specifically
two questions will be explored:
1) In what proportion of episodes of use are side effects experienced, and what is the
type, duration and intensity of those side effects by method.
2) What is the average length of episode by method and what is the effect of
experiencing side effects on the length of episodes.
Due to the differential effects of each method the overall experience of side effects in a
population of contraceptive users will depend heavily on the method mix as will the effect of
side effects on contraceptive dynamics. This study focuses particularly on pill and injectable
use as they are the most frequently used methods which are associated with potential
clinical side effects with 20% and 19% of current users respectively according to the 2008
Ghana Demographic and Health Survey (GDHS).
There are important programmatic and policy implications associated with this topic as often
in low contraceptive prevalence rate (CPR) settings the majority of family planning
programme effort and policy focus is on encouraging new adopters. However promoting
continuity of use among current users is equally important in avoiding unwanted pregnancies
and increases in importance as and influencing factor on population dynamics as the CPR in
the country rises.
2. Background
2.1. Current contraceptive use
According to the GDHS 2008 knowledge of contraceptive methods in Ghana is almost
universal with 97.8% of all women and 98.9% of all men aged 15-49 years reporting
knowledge of at least one method. For both men and women a higher percentage of
respondents know of at least one modern method than the equivalent figure for traditional
methods. There also appears to be knowledge of a range of different methods with a median
number of methods known by all women aged 15-49 of 7.8 (Ghana Statistical Service et al,
2009). In terms of actual current use of any method the CPR for women aged 15-49 years
currently married or in union in 2011 was 34.7% (Ghana Statistical Service, 2011). The
corresponding figure for modern methods only is 23.4%. In the global context this is
relatively low, for example the 2012 world average is 62% however within the regional

3
context of West Africa the CPR in Ghana is the highest1 and it is greater than the average
for all countries in Sub Saharan Africa (Population Reference Bureau, 2012). The CPR in
Ghana has been increasing steadily and the use of modern methods has more than doubled
in the last two decades however, little is known about the contraceptive behaviour of these
users.
Clearly when exploring the issue of contraceptive dynamics and particularly -side effects
some methods are less relevant than others due to the characteristics of the method itself.
Due to the differential effects of each method the overall experience of side effects in a
population of contraceptive users will depend heavily on the method mix. Table 1 shows the
distribution of current users by specific method in Ghana based on data from the Ghana
MICS 2011.
Table 1: Distribution of Current Contraceptive Users by Method, (Ghana Statistical Service, 2011)
Method Percent of currently married or in union women aged 15-49 years women (n = 6574)
Percent of current contraceptive users (n = 2281)
Injections 8.8 25.4
Periodic Abstinence 8.5 24.5
Pill 7.7 22.2
Condom 2.6 7.5
Norplant 1.8 5.2
Female Sterilization 1.5 4.3
Lactational amenorrhea (LAM) 1.5 4.3
Withdrawal 0.9 2.6
IUD 0.6 1.7
Other 0.4 1.3
Diaphragm/Foam or jelly 0.1 0.3
Female condom <0.1 .
Male sterilization <0.1 .
LNG/IUS (hormone bearing IUD) <0.1 .
All methods 34.7 .
Traditional 11.3 32.6
Modern 23.4 67.4
Table 1 shows that there are three methods dominating the method mix in Ghana, injections,
periodic abstinence and the pill, which together account for over 72% of all method use. Side
effects are most often associated with hormonal methods so given this method mix it seems
likely that side effects may influence contraceptive dynamics in Ghana.
1 With the exception of the Cape Verde islands

4
2.2. Discontinuation
The contraceptive dynamics of discontinuation, switching and failure among users all
contribute significantly to the overall contraceptive prevalence rate (CPR) at any given point
in time and also play a significant role in the level of unwanted fertility. In a study of 15
developing countries based on Demographic and Health Survey data Blanc et al. (2002: 132)
find that in 14 of those countries ‘more than half of recent unwanted fertility was as a result
of births that were preceded either by a contraceptive failure or by discontinuation of a
method [for reasons other than a desire to get pregnant]’. So while encouraging new
adopters of contraceptive methods is undoubtedly important, equally important is continuity
of use among current users and studies are needed to determine the factors associated with
contraceptive discontinuation (Parr, 2003).
Using data from the 2003 Ghana Demographic and Health Survey (GDHS) Khan et al. (2007)
provide evidence of high discontinuation rates in Ghana. The study calculated the lifetime
discontinuation rate for 18 sub-Saharan African countries and found that the percentage of
currently married women who had used a method of contraception in the past but were not
using a method at the time of the 2003 GDHS survey was 54%. Another study, based on
1998 GDHS data, found that 43% of users of any contraceptive method have discontinued
the method within 12 months (Parr, 2003).
There are many studies on contraceptive dynamics which have identified side effects as an
important reason for discontinuation (Ali & Cleland, 1995; Curtis & Blanc, 1997; Bradley et
al., 2009; Blanc, Curtis & Croft, 2002; Fathonah, 2000; Leite & Gupta, 2007 & Laguna et al.,
2000; Sambisa, 1996 & Mitra & Al-Sabir, 1996). For example Ali & Cleland found in a study
of discontinuation in six developing countries that overall “health concerns, including side
effects, were the most common cause of discontinuation” (Ali & Cleland, 1995: 96). When
examining duration of use the same study noted that highly effective hormonal methods are
used for no longer than traditional methods because the ‘high rates of method failure for the
latter are offset by high rates of discontinuation of hormonal methods because of side-effects
and health concerns’ (Ali & Cleland, 1999: 351). Blanc, Curtis & Croft (2002) conducted a
similar study of 15 countries and concluded that health concerns and side effects accounted
for the majority of all method discontinuations in most countries. In particular this study found
that discontinuations reportedly due to side effects were most prevalent among injections
users where discontinuations before 12 months of use for this reason amounted to greater
than 50% of discontinuations in all but 2 of the 15 countries (Blanc, Curtis & Croft, 2002)
The major limiting factor in studies of discontinuation is the data requirements. The studies
mentioned above rely on DHS calendar data however the extended calendar data which
records reason for discontinuation is only asked in countries implementing the model A core
questionnaire which are considered high contraceptive prevalence countries (ORC Macro,
2001). Therefore calendar data for countries in sub-Saharan Africa is generally limited, and
Ghana which is the focus of this paper has not collected extended contraceptive calendar
data. While it is not possible to tell the reason for a discontinuation from the GDHS data it is
possible to calculate discontinuation rates by method using questions asked to ever users
about their last episode of use. Parr (2003) used the GDHS 1998 to determine episode
duration and explore current reasons for non-use amongst former contraceptive users. The
study determined that median episode duration for all methods was 12.6 months, 12.2

5
months for episodes of pill use rising to 19.6 months for injectable episodes. The 12 month
discontinuation rate was 43% overall or 47% for pill users and 29% for injectable users.
2.3. Experience of side effects
One of the major hurdles to understanding the experience of side effects is their inherently
subjective nature and the associated difficulty in adequately measuring side effects at the
population level. It is unclear from most quantitative surveys, such as the Demographic and
health survey, what women are actually experiencing when they refer to fear of side effects
or respond that they have discontinued a method due to side effects. There is a large body
of evidence based on clinical trials which details the possible physical symptoms and side
effects which may be caused by using a particular contraceptive method (see for example
Kubba et al., 2000).
The clinical evidence shows that all hormonal methods are associated with menstrual
changes, headaches and dizziness and there are a number of other symptoms such as
breast tenderness, weight change and abdominal pain which are associated with particular
types of hormonal method (CCP & WHO, 2007). There is also evidence to show that there is
a small risk of more serious side effects from hormonal methods such as deep vein
thrombosis, pulmonary embolism or stroke; however these are all very rare (CCP & WHO,
2007). Connections have also been made between some types of hormonal contraceptives
and increased risk of certain cancers particularly breast and cervical cancer.
In addition to the clinical side effects associated there can be other social or psychological
side effects which are not restricted to hormonal methods. These can include for example
loss of pleasure due to the loss of sensation or loss of spontaneity associated with the use of
barrier methods. Where the use of contraceptives is not well accepted in the community
there could also be wider ‘social side effects’ of contraceptive use for some women in the
form of conflict with spouse or family.
There are also instances where a contraceptive method use can have a positive or
protective effect for example some types of hormonal method have been shown to be useful
in relieving the symptoms of endometriosis or of polycystic ovarian syndrome and can be
protective against certain types of cancer (CCP & WHO, 2007). Of particular relevance in the
sub-Saharan African context is the possible protection against iron-deficiency anaemia
provided by many methods.
It is unclear when measuring the experience of side effects which type of effect respondents
are referring to and in fact the same respondent may experience more than one type of side
effect concurrently. The DHS makes the distinction between side effects (short-term present
day effects) and health concerns (long-term possible future effects) but this distinction is
field-coded by the interviewer so it is not necessarily the case that the respondents are clear
on this distinction. In addition most studies conceptualize side effects as purely negative and
linked with discontinuation, fear and non-use. The assumption is therefore made that
respondents are only ever reporting negative side effects, which may or may not be the case,
but any possible information which could be gathered on the welcome side effects of method
use are lost within this framework.

6
There have been a number of smaller scale studies which employ calendar techniques to
shed light on the actual experience of contraceptive users in sub Saharan Africa. Two clinic
based prospective studies of new users in The Gambia and Niger followed clients for
between 6 and 8 months from the time of adoption (Cotton et al, 1992). Respondents were
asked to report whether they had experienced any adverse health effects such as excessive
bleeding, abdominal pain, nausea or headache in the previous month. In Niger 50% of IUD
users reported pelvic pain and 20% of injectable users experienced headaches, while in The
Gambia 14% of IUD users and 12% of pill users experienced abdominal pain. Additionally 15%
of IUD users and 8% of injectable users experienced dizziness (Cotton et al., 1992).
One type of side effects which does not receive much attention in the clinical literature is
menstrual disruption. This is considered to be a clinically benign side effect and therefore
can often be minimized or dismissed by health personal (Tolley et al., 2005). However the
effect on the individual user can be serious and studies show that many women have a low
tolerance for menstrual changes and this is a major reason for discontinuation (Datey et al.,
1995). The methods which are most likely to cause menstrual disruption are hormonal
methods, in particular injectables and implants which both cause unpredictable changes.
Many women will experience a decrease in bleeding as a result of hormonal method use and
medical findings suggest that overall less bleeding has a positive effect on women’s health.
However these sorts of findings do not always “resonate with users” and this kind of
menstrual disruption can still be a cause for discontinuation (Tolley et al., 2005: 21). One of
the difficulties in dealing with this particular side effect is that the effects themselves, along
with the level of tolerance for those effects, will vary from women to women (Tolley et al.,
2005). In a study of IUD, implant and injectable users in Egypt, Tolley et al. (2005) found that
72% of users reported noticing menstrual changes in the first two months of use but only 26%
were worried about it. The study came to the conclusion that it is women’s perception of their
menstrual cycle which influences tolerance of menstrual changes rather than actual changes
in menstruation (Tolley et al., 2005). A study in India found similar results using 90 day
menstrual diaries which showed that only 20-30% of implant users, 30-35% of injectable
users and 37% of hormonal IUD users experienced what they considered to be normal
menstruation (Datey et al., 1995). These results suggest that while the reporting of side
effects is shown by some studies to be relatively uncommon the occurrence of menstrual
disruption is in fact very frequent. However, each individual will have a varying perception
and tolerance of this side effect and many may not consider it to be worrying and hence not
report it as a side effect.

7
3. Data and methods
3.1. Data
This study is situated in Ghana, West Africa and uses data from the Cape Coast Social
Learning, Social Influence and Fertility Control Survey (CCFCS) to explore the issue of
contraceptive use and side effects. The CCFCS is a longitudinal household survey
conducted in eight rounds of data collection in Southern Ghana between 1998 and 2003.
The survey was conducted in six study communities, two in each of the Central, Western
and Greater Accra regions of Southern Ghana. The target population for the survey was all
women aged 18 to 50 at the time of the round one. Respondents were followed from one
round to the next and the majority of respondents were observed for between 56 and 60
months (Aglobitse & Casterline, 2005). A total of 1409 women were interviewed at round 1
but questions regarding contraceptive use were only asked to women currently in union so
that restricted the sample available for this study to roughly 900. The initial sample was
drawn based on a household census which enumerated every household and all eligible
women within each household. The sample selection varied across communities based on
population size and geographic dispersion. The overall average response rate was 95% and
sample retention was excellent with about 85 percent of women remaining in the sample
from Round 1 to Round 8.
The calendar portion of the data contains, among other variables, information on monthly
contraceptive use and the concurrent reporting of side effects. The calendar is a person-
month file containing observations for every individual for every month that they were
observed. At each round of the panel interview, beginning at round 2, women were asked to
provide monthly calendar data going back from the current month of interview to the month
of the previous interview. The dataset used for this analysis was created by extracting
episodes of contraceptive use, which form the units of analysis for this study, from the
calendar data. An episode of contraceptive use is defined as the continuous use of the same
method reported for a period of 2 consecutive months or more. Where calendar data is
collected retrospectively each episode of use identified in the data may not be captured in its
entirety within the period of observation. Episodes which began at an unknown time before
the beginning of the calendar period are considered left censored and cannot be included in
the dataset given that the duration of the episode is unknown due to the unknown start date.
The final dataset contains 9923 women months of method use representing 754 episodes of
use which are between 2 and 60 months duration. The data represents 490 individuals who
each have between 1 and 6 episodes included in the dataset, although 62% of individuals
only contribute a single episode and a further 28% contribute two. Episodes of duration
longer than 36 months are considered right censored and are treated, along with all other
right censored cases (where the episode of use continues beyond the end of the data
collection period), as episodes which did not end in a discontinuation or switch within the
observation period.

8
3.2. Study variables
The outcome of interest in this study is how each episode of contraceptive use ends, so a
variable is created which marks whether or not the episode of use has ended in an event or
if it has been right censored. A discontinuation (an event) is coded 1 while no event (or a
censored observation) is coded 0. A discontinuation of a particular episode can be either a
stopping of use altogether or a switch to another method. As previously described events
taking place after 36 months duration are considered to be censored and coded as 0. In total
65% of episodes in the data have an observed event while the remaining episodes are right
censored. Right censored observations are included in the analysis on the basis that they
are non-informative (i.e. independent of censoring mechanism) so the end of the observation
period is independent of the method use.
The two explanatory variables of interest are current contraceptive use and side effects. For
descriptive purposes the contraceptive method used is coded into 7 categories but for the
purposes of life table estimations a four category variable was used with categories being pill,
injection, condom and other. This variable was also used to select cases in order to estimate
separate life tables for pill and injection users. The variable representing side effects was
originally assigned one of 14 codes each month representing various types of side effects.
Each month can have up to three different side effects coded simultaneously and the full
original data was combined and used for the purpose of describing the experience of side
effects. In the life table analysis a binary variable was created indicating if side effect were
experienced at all in any month of the episode.
3.3. Methods
Descriptive statistics including frequency tables and cross tabulations are used to describe
the experience of side effects related to the episodes of contraceptive use which are the unit
of analysis in this study. Single decrement life tables are then used to provide descriptive
statistics such as median episode length and to estimate the percentage of users
discontinuing an episode within a given time, in this case 12 and 24 months. In addition the
single decrement life tables are used to analyze the duration of episodes by modelling the
hazard rates of discontinuation. The hazard function h (t) is the probability of an event
occurring during interval t, given that the event did not occur before time t, which can be
defined as: H (t) = Pr (T = t | T ≥ t) where T is the event time. Also of interest is the survivor
function S (t) which can be obtained from the hazard rate and is the probability that an event
has not occurred before time t. S (t) = Pr (T ≥ t) (Yamaguchi, 1991). The data used for the
life tables is an episode based file where tj = time to event for episode j and δj = a dummy
variable indicating if the observation is censored, coded 1 if censored 0 otherwise. The life
table analysis is broken down by method, concentrating on pill and injectable use, and by the
experience of side effects.

9
3.4. Limitations
The main limitation of this study is the limited representativeness of the CCFCS. The
compensation for the limited generalizability of the data is its longitudinal design which
allowed for the calendar data to be collected with minimal recall periods. Although this is a
significant improvement on other surveys collecting data of this type it should be noted that
there is still some detailed recall involved in this data collection and as such there is the
potential for some recall bias. This is especially the case given the complexity of the
calendar data collected which placed a high respondent burden for recalling multiple
simultaneous events. Another possible source of bias associated with longitudinal surveys is
attrition bias. However, given the generally high retention rate in the women’s survey it is not
felt that this is a significant problem in this study. A further limitation of this study relates to
the chosen methodology in which left censored episodes are not able to be included in any
analysis. This causes the loss of a significant amount of data and potentially leads to over
estimates of discontinuation rates because long time users who use consistently using
throughout the entire observation period are excluded due to left censoring (Ali & Cleland,
1999).
4. Results
4.1. Incidence of side effects by method
Table 2 shows the percentage distribution of contraceptive methods according to number of
episodes of use. Injectable contraceptives are the single most commonly used method in
this data and account for 28% of all episodes, followed by the pill accounting for 24%. The
next most commonly used modern method is condoms which contribute 13% of all episodes.
Traditional methods are considered as a group which includes periodic abstinence/rhythm,
withdrawal, herbs and other unspecified methods which together account for just over 30%
of episodes of use. These findings are broadly in line with what would be expected based on
recent data from nationally representative surveys. The proportion of episodes of condom
use appears slightly higher in comparison to national level data but that is to be expected
given that the unit of analysis is episode rather than individual, because episodes of condom
use are likely to be of shorter duration and more frequent and therefore contribute a larger
proportion of episodes than they would individuals.
Table 2: Percentage distribution of contraceptive methods according to number of episodes of use
Method Episodes (%) n = 754
Injectable 210 (27.9)
Pill 180 (23.9)
Condom 96 (12.7)
Foam/diaphragm/jelly 19 (2.5)
IUD 14 (1.9)
Norplant 7 (0.9)
Traditional methods 228 (30.2)
10
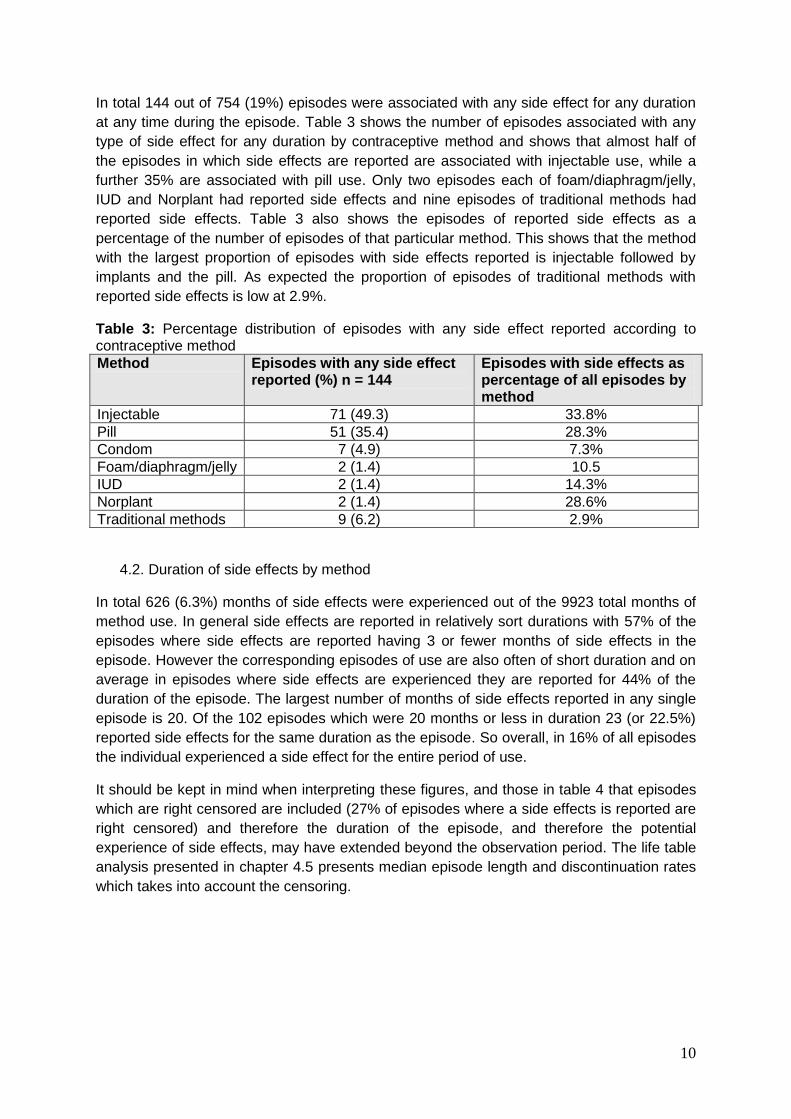
In total 144 out of 754 (19%) episodes were associated with any side effect for any duration
at any time during the episode. Table 3 shows the number of episodes associated with any
type of side effect for any duration by contraceptive method and shows that almost half of
the episodes in which side effects are reported are associated with injectable use, while a
further 35% are associated with pill use. Only two episodes each of foam/diaphragm/jelly,
IUD and Norplant had reported side effects and nine episodes of traditional methods had
reported side effects. Table 3 also shows the episodes of reported side effects as a
percentage of the number of episodes of that particular method. This shows that the method
with the largest proportion of episodes with side effects reported is injectable followed by
implants and the pill. As expected the proportion of episodes of traditional methods with
reported side effects is low at 2.9%.
Table 3: Percentage distribution of episodes with any side effect reported according to contraceptive method
Method Episodes with any side effect reported (%) n = 144
Episodes with side effects as percentage of all episodes by method
Injectable 71 (49.3) 33.8%
Pill 51 (35.4) 28.3%
Condom 7 (4.9) 7.3%
Foam/diaphragm/jelly 2 (1.4) 10.5
IUD 2 (1.4) 14.3%
Norplant 2 (1.4) 28.6%
Traditional methods 9 (6.2) 2.9%
4.2. Duration of side effects by method
In total 626 (6.3%) months of side effects were experienced out of the 9923 total months of
method use. In general side effects are reported in relatively sort durations with 57% of the
episodes where side effects are reported having 3 or fewer months of side effects in the
episode. However the corresponding episodes of use are also often of short duration and on
average in episodes where side effects are experienced they are reported for 44% of the
duration of the episode. The largest number of months of side effects reported in any single
episode is 20. Of the 102 episodes which were 20 months or less in duration 23 (or 22.5%)
reported side effects for the same duration as the episode. So overall, in 16% of all episodes
the individual experienced a side effect for the entire period of use.
It should be kept in mind when interpreting these figures, and those in table 4 that episodes
which are right censored are included (27% of episodes where a side effects is reported are
right censored) and therefore the duration of the episode, and therefore the potential
experience of side effects, may have extended beyond the observation period. The life table
analysis presented in chapter 4.5 presents median episode length and discontinuation rates
which takes into account the censoring.
11
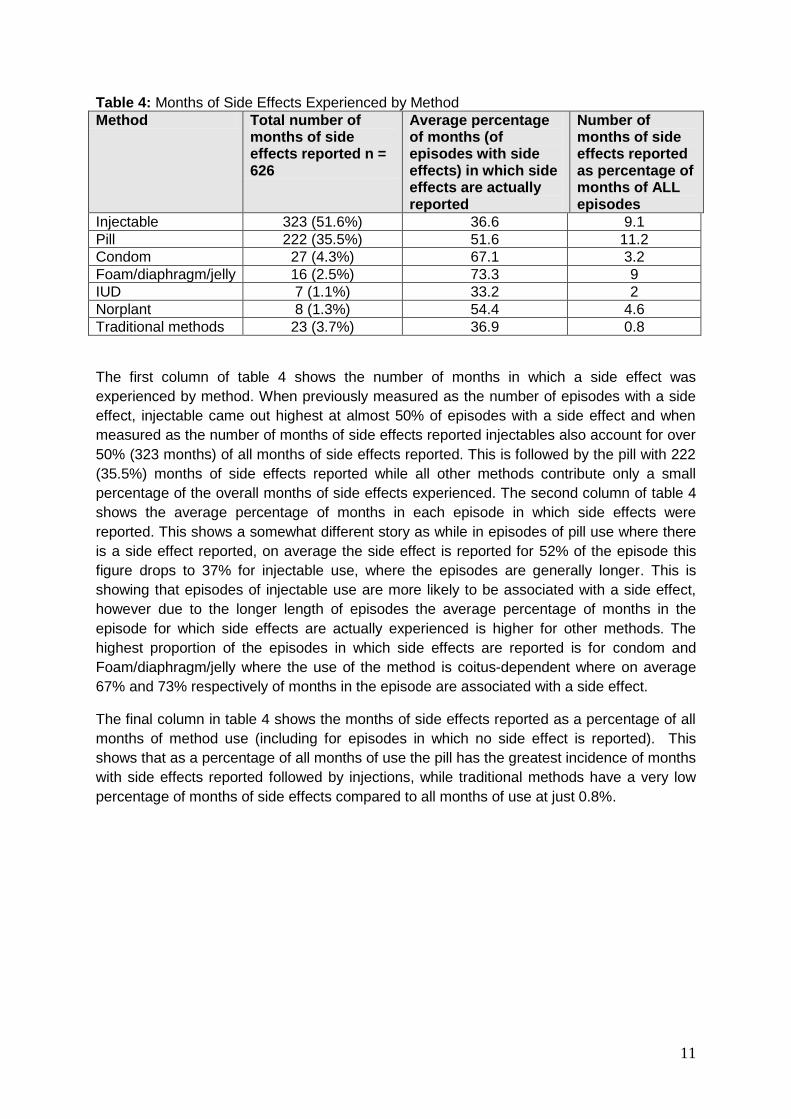
Table 4: Months of Side Effects Experienced by Method
Method Total number of months of side effects reported n = 626
Average percentage of months (of episodes with side effects) in which side effects are actually reported
Number of months of side effects reported as percentage of months of ALL episodes
Injectable 323 (51.6%) 36.6 9.1
Pill 222 (35.5%) 51.6 11.2
Condom 27 (4.3%) 67.1 3.2
Foam/diaphragm/jelly 16 (2.5%) 73.3 9
IUD 7 (1.1%) 33.2 2
Norplant 8 (1.3%) 54.4 4.6
Traditional methods 23 (3.7%) 36.9 0.8
The first column of table 4 shows the number of months in which a side effect was
experienced by method. When previously measured as the number of episodes with a side
effect, injectable came out highest at almost 50% of episodes with a side effect and when
measured as the number of months of side effects reported injectables also account for over
50% (323 months) of all months of side effects reported. This is followed by the pill with 222
(35.5%) months of side effects reported while all other methods contribute only a small
percentage of the overall months of side effects experienced. The second column of table 4
shows the average percentage of months in each episode in which side effects were
reported. This shows a somewhat different story as while in episodes of pill use where there
is a side effect reported, on average the side effect is reported for 52% of the episode this
figure drops to 37% for injectable use, where the episodes are generally longer. This is
showing that episodes of injectable use are more likely to be associated with a side effect,
however due to the longer length of episodes the average percentage of months in the
episode for which side effects are actually experienced is higher for other methods. The
highest proportion of the episodes in which side effects are reported is for condom and
Foam/diaphragm/jelly where the use of the method is coitus-dependent where on average
67% and 73% respectively of months in the episode are associated with a side effect.
The final column in table 4 shows the months of side effects reported as a percentage of all
months of method use (including for episodes in which no side effect is reported). This
shows that as a percentage of all months of use the pill has the greatest incidence of months
with side effects reported followed by injections, while traditional methods have a very low
percentage of months of side effects compared to all months of use at just 0.8%.

12
4.3. Types of side effect
As previously described the monthly calendar data allowed each respondent to mention up
to three different side effects simultaneously per month. There were 174 months from 14
episodes in which two different side effects were concurrently reported, and 2 months of one
episode where three different side effects were concurrently reported. For the purposes of
this analysis only one type of side effect per month and per episode is considered. Where
two or more side effects were reported in the same month the first side effect reported
(corresponding to the first calendar column) was taken to be the dominant side effect. Where
more than one type of side effect was reported in different months within the same episode
the side effect most frequently reported was taken to be dominant. Where two or more types
of side effects were reported for the same number of months within one episode then the
side effect reported soonest in the episode was taken to be the dominant type of side effect.
Table 5: Number of episodes/months of Side Effects Experienced by Type of Side Effect
Type of side effect Number of episodes with side effect reported
Number of months reported
% of months of all reported side effects
Dizziness 18 82 13.1
Weight gain 5 16 2.6
Weight loss 2 10 1.6
Headaches 21 85 13.6
Excessive bleeding 11 39 6.2
Irregular cycle 28 136 21.7
Painful period 2 5 0.8
Stomach pains/cramps 14 64 10.2
Irregular heart beat 13 57 9.1
Marital problems 3 8 1.3
Loss of pleasure 7 28 4.5
Loss of sexual function 1 3 0.5
Loss of strength or ill health 2 4 0.6
Other 17 89 14.2
Total 144 626 100
Table 5 shows the number of episodes in which side effects were reported by type of side
effect. The results show that the most frequently experienced side effect is irregular cycle
which was reported in 28 different episodes of use and accounts for almost 136 months of
experience of side effects which is 21.7% of all months of side effects experienced. This is
followed by headache, cramp, dizziness and other which all contribute more than 10% of the
months of side effects reported. Taken together excessive bleeding and irregular cycle
constitute menstrual disruption and account for around 27% of both episodes with a side
effect and months of side effects experienced.

13
Table 6: Months of Side Effects Experienced by Method and Type of Side Effect1
Type of side effect Number of episodes (months) of side effect reported
Pill Injection Condom
Dizziness 8 (35) 10 (47) 0
Weight gain 2 (5) 2 (10) 0
Weight loss 1 (6) 0 0
Headaches 10 (49) 10 (31) 1 (5)
Excessive bleeding 4 (18) 6 (19) 0
Irregular cycle 6 (22) 22 (114) 0
Painful period 1 (2) 0 0
Stomach pains/cramps
8 (36) 6 (28) 0
Irregular heart beat 3 (13) 7 (30) 0
Marital problems 0 0 0
Loss of pleasure 0 0 5 (19)
Loss of sexual function
0 1 (3) 0
Loss of strength or ill health
1 (1) 0 0
Other 7 (35) 7 (41) 1 (3)
Total 51 (222) 71 (323) 7 (27) 1The remaining episodes not included in table 6 are: 2 episodes of Foam/diaphragm/jelly one
experiencing weight loss and one experiencing irregular heartbeat; 2 episodes of IUD one
experiencing excessive bleeding and one experiencing other; 2 episodes of implant one experiencing
painful period and one experiencing other and 9 episodes of traditional methods one experiencing
weight gain, two experiencing irregular heartbeat, three experiencing Marital problems, two
experiencing loss of pleasure and one experiencing loss of strength or ill health.
Table 6 shows the number of episodes and months reported for each specific type of side
effect according to contraceptive method. Around one third of the reported months of side
effects associated with injectable use were of irregular cycle which was the most commonly
reported side effect for this method. For episodes of pill use the most commonly reported
side effect is headaches accounting for 22% of the total months of side effects attributed to
pill use. As expected, side effects are relatively infrequently reported for condom use, with
19 months of the side effect of loss of pleasure being reported. The finding that headache is
reported as a side effect of condom use is anomalous and there are also 2 improbable side
effects attributed to foam/diaphragm/jelly (not shown I table 6). It is possible that this reflects
errors in data entry or coding or misreporting of side effects by respondents at the time of
survey. It is also possible that this has arisen due to the process undertaken for this analysis
of combining multiple simultaneous contraceptive methods reported and selecting the most
effective. This would mean that the side effect was actually caused by a less effective
method that was being used simultaneously with the condom. In this case the second
method was one of either IUD, foam/jelly/diaphragm or a traditional method.

14
4.4. Pattern of side effects
Table 7 shows that almost 40% of episodes began with a side effect in the first month of use
and in around 62% of episodes with side effects lasting longer than 1 month all the months
of side effects reported were experienced consecutively. There were 20 (13.9%) episodes in
which all the months of side effects were experienced consecutively beginning from the first
month of the episode but the episode of use still continued beyond the period of the side
effects. This suggests that for around 14% of all episodes if the user is persistent after
experiencing side effects in the first months of use then the side effects will either resolve or
be tolerated to such an extent that they are no longer reported. The opposite scenario is that
a consecutive period of side effects is experienced and a side effect is recorded on the last
month of the episode. As shown in table 7 about 63% of all episodes ended in a month
where a side effect was reported and 40 of these episodes, or about 28% of all episodes
with side effects ended after a consecutive period of all the months of side effects
experienced. This strongly suggests that the experience of side effects is related to
discontinuation.
Table 7: Patterns of side effects within episodes
Pattern of side effects Number of episodes
Percentage of episodes
Side effect was experienced in the first month of the episode 57 39.6
Side effect was experienced in the last month of the episode 90 62.5
Months of side effects were experienced consecutively (where more than 1 month of side effects was reported)
89 61.8
As previously mentioned there were 23 episodes (16%) in which a side effect was
experienced every month of the episode. Because this data does not record reason for
discontinuation it is not possible to tell if these episodes represent users who are motivated
to persist with the method despite the side effect and eventually discontinue for some other
reason (or are censored from the study) or if the persistent experience of a side effect
caused the discontinuation.
4.5. Side effects and discontinuation
Table 8 presents results from life tables calculated separately for each method with method
grouped into four categories. In each case the table shows the proportion of episodes which
are continuing at 12 and 24 months and the median episode duration in months. The results
show that as would be expected injectables have the longest mean episode duration and the
lowest discontinuation rates with 42% of users still using the method at 24 months. The
episode duration for injection users is more than double that for pill users at 21.71 and 10.03
months respectively. The second highest rate of continuation is for the ‘other’ category which
is expected given that this category includes IUD and Norplant users which are both long
term methods. Episodes of condom use are generally shorter than any other method with a
median duration of 8.42 months and around 11% of episodes continue at 24 months.

15
Table 8: Median Episode Duration and Proportion of Episodes Continuing at 12 and 24
Months by Method
Variable Category Median episode duration
Proportion of episodes continuing at 12 months
Proportion of episodes continuing at 24 months
Method Pill 10.03 0.38 0.23
Injection 21.71 0.67 0.42
Condom 8.42 0.28 0.11
Else 11.49 0.46 0.27
Figure 1 is a plot of the cumulative probability of an episode lasting to 36 months by method.
The plot shows that the probability of continuation of pill, condom and other users drops
quite sharply in the first 12 months and then begins to level off. Episodes of injectable use do
not see such sharp declines and level off at a higher rate of continuation than the other
methods.
Figure 1: Plot of Cumulative Survival Function by Method
Table 9 shows the proportion of episodes which are continuing at 12 and 24 months and the
median episode duration in months according to whether or not a side effect was
experienced during the episode. The results show that the experience of side effects
increases the median duration of the episode. In addition, the proportion surviving to 12 and
24 months is greater for those experiencing side effects in any month. Although the
hypothesis of this study is that side effects may shorten the duration of episodes this is not a
wholly unexpected result as this is evidence of a selection effect. Given the previous finding
that around 60% of episodes do not begin with a side effect the longer the duration of the

16
episode the more chance there is of a side effects occurring and being reported hence the
longer median episode duration.
Table 9: Median Episode Duration and Proportion of Episodes Continuing at 12 and 24
Months by Experience of Side Effects
Variable Category Median episode duration
Proportion of episodes continuing at 12
Proportion of episodes continuing at 24
Side effect experienced in any month
No 11.75 0.47 0.28
Yes 14.57 0.52 0.32
In order to further investigate this issue life tables were constructed separately for pill and
injection use for episodes with and without side effects. The results are shown in table 10.
These results show that the relationship between side effects and median episode duration
is different for episodes of pill or injectable use. For pill use the median episode duration is
slightly longer when side effects are experienced but for injectable it is the opposite with
episodes being longer if side effects are not experienced. It appears from these results that
the experience of side effects does shorten the duration of the episode on average but only
for episodes of injectable use.
Table 10: Median Episode Duration and Proportion of Episodes Continuing at 12 and 24
Months by Experience of Side Effects in Episodes of Pill or Injection use
Method Side effect experienced in any month
Median episode duration
Proportion of episodes continuing at 12
Proportion of episodes continuing at 24
Pill No 8.95 0.37 0.21
Yes 11.18 0.41 0.27
Injection No 22.70 0.67 0.46
Yes 18.72 0.66 0.36
Figure 2 shows the cumulative survival function according to the experience of side effects
plotted up to 36 months for pill and injectable episodes only. The plot shows that pill
episodes have approximately the same probability of continuation, which is falling sharply
over time, until around 12 months either with or without side effects. However, for episodes
of injectable use the probability of continuation falls much less rapidly during the first 12
months, and the probability of continuation between the two groups is more divergent for
injectable episodes than for pill episodes.

17
Figure 2: Plot of Cumulative Survival Function by Experience of Side Effect in Last Month
for Episodes of Pill Use
5. Discussion and Conclusions
Injectables are the most commonly used single method with 28% of episodes in the data
followed by the pill with 24%. The episode duration for injection users is more than double
that for pill users at 21.71 and 10.03 months respectively and the longer episode lengths
mean injectable use contributes a large proportion of the total women-months of
contraceptive use (2869 women-months of use which is 29% of total). Injectable use is also
the method most commonly associated with side effects, with 33.8% of episodes of
contraceptive use being associated with the experience of side effects any side compared to
28.3% of pill episodes. Due to the popularity of the injection this means that almost 50% of
all episodes of side effects experienced are attributable to injection use. When viewed from
the perspective of the time over which side effects are experienced on average 37% of the
months of injectable episodes have side effects reported compared to just over 50% for pill
episodes. Because of the longer duration injectable episodes actual have the lowest
percentage of months with side effects experienced of all methods except IUD. Taking into
account all months of use, including episodes where no side effect is experienced, 9% of
women-months of injectable use have a side effects reported compared to 11% of women
months of pill use. Side effects are rarely reported for episodes of traditional methods with
only 0.8% of all women-months of use having side effects reported. Overall episodes of
injectable use are the most often associated with side effects however on a ‘per months of
use’ basis injectables actually have the second lowest rate of side effects experienced of any
method considered in this study.

18
The results show that the most frequently experienced side effect is irregular cycle which
was reported in 28 different episodes of use and accounts for almost 136 months of
experience of side effects, which is 21.7% of all months of side effects experienced. Taken
together excessive bleeding and irregular cycle constitute menstrual disruption and account
for around 27% of both episodes with a side effect and months of side effects experienced.
Around one third of the reported months of side effects associated with injectable use were
of irregular cycle which was the most commonly reported side effect for this method. For
episodes of pill use the most commonly reported side effect is headaches accounting for
22%.
This study did not ascertain reason for discontinuation in the calendar data however about
63% of all episodes ended in a month where a side effect was reported, including 23
episodes (16%) in which a side effect was experienced every month of the episode. This
suggests an association between experiencing a side effect and discontinuing the method.
However, when looking at the effects of experiencing a side effect on episode duration and
discontinuation using life table analysis there is no consistent effect across methods. Overall
despite being more commonly associated with side effects discontinuation rates are lower
for injectable than other methods with 32% of episodes being discontinued by 12 months
compared to 62% for pill episodes. There is evidence that in around 14% of all episodes if
the user is persistent after experiencing side effects in the first months of use then the side
effects will either resolve or be tolerated to such an extent that they are no longer reported.
Experiencing a side effect during an episode does not shorten the duration of the episode for
pill use but for injectable episodes the median episode length goes from 22.70 months to
18.72 months when a side effect is experienced.
Given the popularity of injectables, their low associated failure rates and longer durations of
use, they are an important method for the overall continuity of use and continued increase in
contraceptive prevalence (Blanc et al., 2002). Family planning effort needs to be directed
towards preventing the discontinuation of injectables and hence the shortening of episodes
of use due to side effects. Given that menstrual disruption is the most likely side effect
reported with injectable it is possible that with sufficient motivation experiencing this side
effect does not have to lead to discontinuation. In particular there are implications in terms of
the counselling and information given to women both when they initially decide to adopt a
particular method and throughout the episode of use. Counselling by health workers for
injectable users should educate users on the possible side effects and provide information
on how different side effects can be mitigated or prepared for. Women may be more likely to
tolerate menstrual disruption they are prepared and may be less likely to experience
physiological distress leading to a discontinuation. It might also be useful for health workers
to counsel patients on the relative risk of side effects in relation to the potential risk
associated with birth and pregnancy, and also discuss the potential protective effects of
some methods, particularly in relation to menstrual disruption and the possible positive
health benefits of amenorrhea. The evidence also shows that although many experiences of
side effects begin in the first month of the method use there are also many episodes where
side effects begin after a longer period of use. As such, counselling and interventions to
reduce discontinuation should be focused on all users, regardless of the length of time they
have been using, rather than only new adopters.

19
Acknowledgements
The Cape Coast Social Learning, Social Influence and Fertility Control Survey was
supported by awards to the Policy Research Division of the Population Council (New York)
from the National Institute of Child Health and Development (R01–HD34524), the Mellon
Foundation, and the Hewlett Foundation. Support from the Rockefeller Foundation was
provided via an award to the University of Cape Coast. This study was supported the by the
ESRC award number PTA-031-2004-00209.
References
AGLOBITSE, P. & CASTERLINE, J. B. (2007) Women’s and Men’s Social Networks and Contraceptive Use Dynamics: Longitudinal Evidence from Ghana Presented at the Population Association of America, 2007 Annual Meeting, New York, New York, March 29-31, 2007 online at http://paa2007.princeton.edu/download.aspx?submissionId=71132 [Unpublished]
ALI, MOHAMED & CLELAND, JOHN (1999) Determinants of Contraceptive Discontinuation in Six Developing Countries Journal of Biosocial Science 31(3): 343–360
ALI, MOHAMED & CLELAND, JOHN. (1995) Contraceptive Discontinuation in Six Developing Countries: A Cause-Specific Analysis International Family Planning Perspectives 21(3): 92-97
BLANC, A., CURTIS, S. & CROFT, T. (2002) Monitoring Contraceptive Continuation: Links to Fertility Outcomes and Quality of Care Studies in Family Planning 33(2):127-40
BRADLEY, SARAH E.K., SCHWANDT, HILARY M., & KHAN, SHANE. (2009) Levels, Trends, and Reasons for Contraceptive Discontinuation DHS Analytical Studies No. 20. Calverton, Maryland, USA: ICF Macro
CCP & WHO. (2007) Family Planning: A Global Handbook for Providers World Health Organization Department of Reproductive Health and Research (WHO/RHR) and Johns Hopkins Bloomberg School of Public Health/ Center for Communication Programs (CCP), INFO Project: Baltimore and Geneva
COTTON, NIKI. STANBACK, JOHN. MAIDOUKA, HALIMA. TAYLOR-THOMAS, JOSEPH & TURK, TOM. (1992) Early Discontinuation of Contraceptive Use in Niger and The Gambia International Family Planning Perspectives 18(4): 145-149
CURTIS, SL & BLANC, AK. (1997) Determinants of contraceptive failure, switching and discontinuation: an analysis of DHS contraceptive histories DHS Analytical Reports No. 6. Macro International Inc.: Calverton, Maryland
DATEY, S., GAUR, L.N. & SAXENA, B.N. (1995) Vaginal Bleeding Patterns of Women Using Different Contraceptive Method, Implants, Injectables, IUDs, Oral Pills - An Indian Experience An ILR Task Force Study Contraception 51(3): 155-165
FATHONAH, SITI. (2000) Patterns of Contraceptive Use in Indonesia Calverton, Maryland: State Ministry of Population/National Family Planning Coordinating Board and Macro International
GHANA STATISTICAL SERVICE. (2011) Ghana Multiple Indicator Cluster Survey with an Enhanced Malaria Module and Biomarker, 2011, Final Report. Accra, Ghana.

20
GHANA STATISTICAL SERVICE (GSS), GHANA HEALTH SERVICE (GHS), AND ICF MACRO. (2009) Ghana Demographic and Health Survey 2008. Accra, Ghana: GSS, GHS, and ICF Macro
KHAN, SHANE., MISHRA, VINOD., ARNOLD, FRED. & ABDERRAHIM NOUREDDINE. (2007) Contraceptive Trends in Developing Countries. DHS Comparative Reports No. 16. Macro International Inc.: Calverton, Maryland
KUBBA, A., GUILLEBAUD, J., ANDERSON R. A. & MACGREGOR E. A. (2000) Contraception The Lancet 356: 1913–19
LAGUNA, ELMA P., PO, ANNA LIZA C., & PEREZ, AURORA E. (2000) Contraceptive Use Dynamics in the Philippines: Determinants of Contraceptive Method Choice and Discontinuation Calverton, Maryland: ORC Macro.
LEITE, IURI C. & GUPTA, NEERU. (2007) Assessing Regional Differences in Contraceptive Discontinuation, Failure and Switching in Brazil Reproductive Health 4(6) available online at http://www.reproductive-health-journal.com/content/4/1/6 cited 09/2009
MITRA, S.N. & AL-SABIR, AHMED. (1996) Contraceptive Use Dynamics in Bangladesh DHS Working Papers Number 21 Calverton, Maryland: Macro International Inc.
ORC MACRO. (2001) DHS Phase IV Model a Core Questionnaire with Commentary for High Contraceptive Prevalence Countries Measures DHS+ Basic Documentation Number 1 ORC Macro: Calverton, Maryland online at http://www.measuredhs.com/pubs/pub_details.cfm?ID=705 cited 09/09
PARR, NICHOLAS J. (2003) Discontinuation of Contraceptive Use in Ghana Journal of Health and Population Nutrition 21(2): 150-157
POPULATION REFERENCE BUREAU. (2012) World Population Data Sheet 2012 12/2009http://www.prb.org/Publications/Datasheets/2012/world-population-data-sheet.aspx
SAMBISA, WILLIAM. (1996) Contraceptive Use dynamics in Zimbabwe: Discontinuation, Switching and Failure Zimbabwe Further Analysis Calverton, Maryland: Marco International Inc.
TOLLEY, ELIZABETH. LOZA, SARAH. KAFAFI, LAILA & CUMMINGS STIRLING. (2005) The Impact of Menstrual Side Effects on Contraceptive Discontinuation: Findings from a Longitudinal Study in Cairo, Egypt International Family Planning Perspectives 31(1): 15-23
YAMAGUCHI, K. (1991) Event History Analysis Applied Social Research Methods Series Volume 28 Sage Publications Ltd.: London