Embed Size (px)
Citation preview

OWNSVILLE QLD 4810
103 WALKER STREET, TOWNSVILLE QLD 4810 ▪ PO BOX 1268, TOWNSVILLE QLD 4817
HORSESHOE BAY FLOOD STUDY BASE-LINE FLOODING ASSESSMENT AUGUST 2011
Flood Report

HORSESHOE BAY FLOOD REPORT
Page 2 >> 44 741 992 072
Quality Information Prepared for: Information
Prepared by: Jared Johnston
Document HORSESHOE BAY FLOOD STUDY BASE-LINE FLOODING
ASSESSMENT
DW ID
\\corp\tccdfsroot\data\p&d\strategic planning\secure\infrastructure
planning\stormwater-flooding\projects\townsville flood constraints
map\reports\horseshoe bay\horseshoe bay baseline report final.pdf
Date 15/08/2012
Revision History
Authorised
Revision Revision
Date Details
Name/Position Signature
A 2011 Draft for comment Wesley Bailey
B 2012 Final Wesley Bailey
C 2012 Revised Final Wesley Bailey
Townsville City Council
ABN 44 741 992 072
103 Walker Street
Townsville QLD 4810
PO BOX 1268
Townsville QLD 4810
Telephone: 4727 9000
Facsimile: 4727 9050
Email: [email protected]
© TOWNSVILLE CITY COUNCIL 2010 This document is and shall remain the property of TOWNSVILLE CITY COUNCIL. The document may only
be used for the purposes for which it was commissioned and in accordance with the Terms of Engagement
for the Commission. Unauthorised use of this document in any form whatsoever is prohibited.

HORSESHOE BAY FLOOD REPORT
Page 3 >> 44 741 992 072
Table of Contents
Executive Summary....................................................................................................5
Glossary ......................................................................................................................7
1.0 Introduction .....................................................................................................8
1.1 Overview .......................................................................................................8 1.2 Study Area ....................................................................................................8 1.3 Scope of Works ........................................................................................... 11 1.4 Study Approach........................................................................................... 11
2.0 Available Data................................................................................................ 12
2.1 Topographic Data........................................................................................ 12 2.2 Stormwater Network .................................................................................... 14 2.3 Historical Flooding Information .................................................................... 14 2.4 Historical Rainfall......................................................................................... 18 2.5 Design Rainfall ............................................................................................ 18 2.6 GIS Layers .................................................................................................. 20 2.7 Previous Reports......................................................................................... 20
3.0 Hydrological Assessment............................................................................. 21
3.1 Overview ..................................................................................................... 21 3.2 XP-RAFTS .................................................................................................. 21 3.3 Catchment................................................................................................... 21
Rainfall Loss ........................................................................................................ 29 Channel Routing .................................................................................................. 29
3.4 Verification / Calibration............................................................................... 30 3.5 Probable Maximum Flood and 500 year ARI events.................................... 30 3.6 Design Storm Flows .................................................................................... 31
4.0 Hydraulic Assessment.................................................................................. 32
4.1 Overview ..................................................................................................... 32 4.2 MIKE FLOOD .............................................................................................. 32
MIKE 11............................................................................................................... 32 MIKE 21............................................................................................................... 32 MIKE URBAN ...................................................................................................... 32
4.3 Model Setup ................................................................................................ 33 4.4 Structure Verification ................................................................................... 37 4.5 Sensitivity Analysis ...................................................................................... 38 4.6 Verification .................................................................................................. 41 4.7 Design Flood Assessment ........................................................................... 47
5.0 Base-line Flooding Assessment .................................................................. 50
5.1 Overland Results......................................................................................... 50 5.2 MIKE URBAN Results ................................................................................. 53 5.3 Road Closures............................................................................................. 55 5.4 Flood Plain Hazard ...................................................................................... 57 5.5 Problem Flooding Areas .............................................................................. 63
Gifford Street ....................................................................................................... 63 Apjohn Street....................................................................................................... 63
HORSESHOE BAY FLOOD REPORT
Page 4 >> 44 741 992 072
Corica Crescent Development ............................................................................. 63 The Lagoon ......................................................................................................... 63 Beeran Creek East upstream of Gifford Street..................................................... 64
5.6 Emergency Management Consideration...................................................... 68 5.7 Gifford Street Culvert................................................................................... 69 5.8 Potential Mitigation Constraints ................................................................... 73
Aquifer ................................................................................................................. 73 Gifford Street ....................................................................................................... 73 Apjohn Street....................................................................................................... 73 Corica Crescent Development ............................................................................. 73 Beeran Creek East upstream of Gifford Street. .................................................... 73
6.0 Climate Change ............................................................................................. 75
7.0 Conclusion..................................................................................................... 76
8.0 References..................................................................................................... 78
Appendix A................................................................................................................ 80
Appendix B.............................................................................................................. 107
Appendix C.............................................................................................................. 108

HORSESHOE BAY FLOOD REPORT
Page 5 >> 44 741 992 072
Executive Summary
The Horseshoe Bay Flood Study – Baseline Flooding Assessment has been
undertaken as part of Townsville City Council’s City Wide Flood Constraints Project.
The project seeks to develop up to date flood models for the City of Townsville at
scales suitable for:
• defining flood levels for most urban properties;
• identifying the flood hazard overlay for the planning scheme;
• evaluating recent and future flood mitigation projects; and
• assisting the disaster management process.
The newly developed flood modelling for Horseshoe Bay was undertaken using XP-
RAFTS, a hydrologic runoff routing model, and MIKE FLOOD, a combined 1D and 2D
hydraulic model. The models represent Horseshoe Bay’s catchments, underground
stormwater system, natural open channels, open drains, urban areas, and flood plains.
The critical storm duration for the study area was determined to be either 1 or 1.5 hours
for most locations.
This study identifies water levels, depths, velocities and flooding extent for storm
Average Recurrence Intervals from 2 year to the Probable Maximum Flood. The
flooding has been assessed on the basis of land uses as at September 2011 within the
study area.
The results of the model provide a detailed understanding of problematic areas
including some already known to Council. The following areas were all demonstrated to
be significantly affected by flooding and are unlikely to have a low cost solution:
• The trap low point just upstream of Gifford Street at number 40;
• Apjohn Street between Horseshoe Bay Road and the Sandals Development;
• The Corica Crescent Development;
• The lagoon outlet at Horseshoe Bay Road;
• Beeran Creek East upstream of Gifford Street
Horseshoe Bay also has sediment problems at various locations about the study area
which all seem to arise from Beeran Creek East upstream of Gifford Street. Figure 1.2.2 shows the areas mentioned above along with other key locations within
Horseshoe Bay.
Potential mitigation options for further investigation within the problems areas
mentioned above have been given in Section 5.8. This report recommends that an
overall solution for flood mitigation of Horseshoe Bay be investigated and that no single
mitigation measure be installed without consideration for the overall plan for the study
area. It is also recommended that mitigation measures do not hinder the recharge of
the underground aquifer system (based on findings in the Horseshoe Bay Drainage
Management Plan 2008), and should take into consideration the geomorphic
processes within the catchment. Any development application needs to consider its
impact on geomorphology and groundwater recharge.
The model was used to demonstrate improvements in flooding upstream of Gifford
Street at number 40 due to recent mitigation works. Though flooding in the area has
improved, flooding issues still exist.

HORSESHOE BAY FLOOD REPORT
Page 6 >> 44 741 992 072
Flood hazard maps have been developed to assist with floodplain planning. They show hazardous zones that develop in the 100, and 500 Year ARI storms, and in the Probable Maximum Flood. The particularly hazardous areas are (refer to Figure 1.2.2):
Apjohn Street including the intersection of Apjohn Street and Horseshoe Bay Road.
The Corica Crescent Development. The Sandals Development.
For emergency management considerations, the Sewage Treatment Plant on the corner of Apjohn Street and Pollard Street is immune to the Probable Maximum Flood, but inaccessible in less than 2 year ARI storm events. The recreation centre in the park on the corner of Horseshoe Bay Road and Apjohn Street is the only Major Evacuation Centre in Horseshoe Bay however it is a post-impact evacuation centre and is not proposed to be used during flood events. It is likely that only storm events greater than 500 year ARI will cause damages to the centre potentially prevent its use as a post impact evacuation centre. A review of road closures due to flooding identified points along Apjohn Street and Horseshoe Bay Road as having an immunity equal to or less than a 2 year ARI storm. Flooding can cause evacuation problems for;
Pacific Drive and Henry Lawson Street; The Sandals Development and the Corica Crescent Development; and Rural areas west of the Gorge Creek crossing of Apjohn Street.
An assessment of the impacts of sea-level rise due to climate change on flooding has been completed on Horseshoe Bay. The areas that exhibit flood level changes due to sea-level rise are the Lagoon, the outlet of Endeavour and Gorge Creeks, and the swale behind the primary sand dune. 2 properties on Henry Lawson Street, 11 properties on Pacific Drive, 5 properties within the Corica Crescent Development, and 11 properties with the Sandals Development are affected by increased flood levels due to sea-level rise.

HORSESHOE BAY FLOOD REPORT
Page 7 >> 44 741 992 072
Glossary
AEP Annual Exceedance Probability
ARI Average Recurrence Interval
ARR Australian Rainfall and Runoff (1998)
AusIFD A program to calculate average rainfall intensities and temporal patterns within Australia
DCC Department of Climate Change and Energy Efficiency – Australian Government
DEM Digital Elevation Model
DFE Defined Flood Event
GSDM General Short Duration Method – A method of calculating Probable Maximum Precipitation
GSS Geospatial Solutions Unit
HAT Highest Astronomical Tide - The highest level of water which can be predicted to occur under any combination of astronomical conditions.
HBDMP Horseshoe Bay Drainage Management Plan
HBFS Horseshoe Bay Flood Study
HEC-RAS Steady State One Dimensional Hydraulic Model
IFD Intensity Frequency Distribution
IPCC International Panel on Climate Change
LiDAR Light Detection and Ranging (Aerial Laser Survey)
MHWS Mean High Water Springs - The average height of the high waters of spring tides
MIKE11 Fully Dynamic One Dimensional Hydraulic Model
MIKE21 Fully Dynamic Two Dimensional Hydraulic Model
MIKE FLOOD Fully Dynamic Coupled One & Two Dimensional Hydraulic Model
MLWS Mean Low Water Springs
PMF Probable Maximum Flood
PMP Probable Maximum Precipitation
QUDM Queensland Urban Drainage Manual
Spring Tides The tide that rises highest and falls lowest from the mean sea level within a lunar cycle.
TFHAS Townsville Flood Hazard Assessment Study
XP-RAFTS An urban and rural runoff routing application

HORSESHOE BAY FLOOD REPORT
Page 8 >> 44 741 992 072
1.0 Introduction
1.1 Overview
The Horseshoe Bay Flood Study – Baseline Flooding Assessment has been undertaken as part of Townsville City Council’s City Wide Flood Constraints Project. The project seeks to develop up to date flood models for the City of Townsville at scales suitable for:
defining flood levels for most urban properties; identifying the flood hazard overlay for the planning scheme; evaluating recent and future flood mitigation projects; and assisting the disaster management process.
This study incorporates, the latest Light Detection and Ranging (LiDAR) topographic data, as well as the most recent infrastructure survey to develop up to date hydrologic and hydraulic flood models for Horseshoe Bay.
1.2 Study Area
The Horseshoe Bay study covers the creeks that discharge into Horseshoe Bay on the northern side of Magnetic Island. Horseshoe Bay is home to around 27% of the population on Magnetic Island with a population of approximately 743 as at November 2011. It is also a popular tourist destination Horseshoe Bay contains 2 major outlets, one through Beeran Creek on the eastern side of the bay, and one through Endeavour Creek on the western side. Most of the development in Horseshoe Bay exists in the Beeran Creek catchment. The total catchment size of the study area is 1205 Ha. The catchment of Endeavour Creek and its Gorge Creek tributary occupy most of the study area with a total size of 824 Ha. Horseshoe Bay consists of mainly two land types. Firstly, there is the mountainous upper reaches of the catchment, the majority of which is part of the Magnetic Island National Park. Those mountainous parts that are not National Park are designated green space, and are very steep. These areas are unlikely to be built upon in the short to medium future. The other land type is in the lower reaches and contains the flood plains for the local creeks. This area is flat and contains several residential developments. Most of the land is undeveloped as at August 2011 but could become developed as the city grows. The Horseshoe Bay hydrologic and hydraulic models represent the study area with the most up to date information available. Figure 1.2.1 and 1.2.2 show the Horseshoe Bay Study Area

LEGEND
2009 ContoursElevation [m]
0
0.5
1
1.5
2
2.5
3
3.5
4
4.5
5
5.5
6.000
6.500
7.000
7.500
8.000
8.500
9.000
9.500
10.00
10.50
11.00
11.50
12.00
12.50
Figure 1.2.1:Study Area
SCALE: @1:10,000
320 0160
Meters
A3
TOWNSVILLE CITY COUNCILHORSESHOE BAY
STUDY AREA
© Townsville City Council 2010DIGITAL FILE: DRAWN BY: DATE:
Strategic Planning DepartmentPLANNING AND DEVELOPMENT
mxdJAJ
26/10/2011
´

PACIFIC DRIVE
GIFFORD STREET
APJOHN STREETHORSESHOE BAY ROAD
PARKER STREETSWENSEN STREET
POLL
ARD S
TREE
T
LANEWAY
HOLL
INS ST
REET
DENT
STRE
ETHENRY LAWSON STREET
SOMERSET STREETCORICA CRESCENT
WALLABY WAY
DOLP
HIN
COUR
T
PANDANUS DRIVE BAYSIDE COURT
YORK COURT
SOMERSET COURT
OLIVIA COURT
PIETRO COURT
APJOHN STREET
PACIFIC DRIVE
HORSESHOE BAY
WEST POINT
ARCADIA
FLORENCE BAY
LEGEND
Waterways
Figure 1.2.2:Study Area
SCALE: @1:9,000
290 0145
Meters
A3
TOWNSVILLE CITY COUNCILHORSESHOE BAY
STUDY AREA
© Townsville City Council 2010DIGITAL FILE: DRAWN BY: DATE:
Strategic Planning DepartmentPLANNING AND DEVELOPMENT
mxdJAJ
26/10/2011
´
Park
Sandals Development
Corica CrescentDevelopment
Wallaby WayDevelopment
Lagoon
Gorge Creek
Endeavour Creek
Beeran Creek EastDownstream
Beeran Creek EastUpstream
Beeran Creek West
Primary Sand Dune

HORSESHOE BAY FLOOD REPORT
Page 11 >> 44 741 992 072
1.3 Scope of Works
In 2005, the TFHAS study was completed which covered the suburb of Horseshoe Bay. Since that time development has occurred, new modelling techniques have emerged, and there has been updated LiDAR and aerial photography. This flood model will allow better representation of the study area, and has the flexibility required to assess future mitigation options. The scope of works for this Baseline Flooding Assessment includes:
review of previous engineering reports and data; collation of relevant data including rainfall, construction drawings, and
topographic survey; identification of a suitable approach for hydraulic and hydrologic modelling; development and calibration of hydrologic and hydraulic models; and identification of the base-line flooding issues for Horseshoe Bay.
1.4 Study Approach
The flood model is the key tool used in completing a flood study. It is used to numerically simulate flooding to create flood maps, determine velocities, determine road closures, assess mitigation options, and classify the flood immunity of properties and structures. There is no interaction with other study areas of the City Wide Flood Constraints Project has been considered. XP-RAFTS is the hydrologic model used to determine inflows into the hydraulic models. The hydrologic model converts rainfall to runoff. The MIKE FLOOD hydraulic model uses input from the hydrologic model and the available data listed in Chapter 2. It provides results as areas of inundation, water depths, flood levels, and velocities. These results are then used to make conclusions about the base-line flooding within the study area.

HORSESHOE BAY FLOOD REPORT
Page 12 >> 44 741 992 072
2.0 Available Data
2.1 Topographic Data
The main topographic data used in modelling Horseshoe Bay was Townsville City Council LiDAR. LiDAR (aerial survey) was used for determining catchment delineation, sub-catchment slope, sub-catchment routing, and for generating the bathymetry of the model. A potential issue exists at the outlet of Beeran Creek as sand bank topography tends to change seasonally. It is understood the aerial survey was undertaken towards the end of the dry season. Towards the end of the dry season is when the sand bar at the mouth is most likely to be at its highest level as it would not be washed away with flood flows. To include the sand bar in the hydraulic model in this state would represent a conservative approach, as the flood flows would erode the sand bar. In the absence of any detailed records of the sand bar in flood conditions, the sand bar was included as per the topographic survey with no accounting for the erosion of the sandbar. An assessment of the sandbar erosion was beyond the scope of this study. Figure 2.1.1 shows the LiDAR data in the form of contours over the Horseshoe Bay study area.

WEST POINT
ARCADIA
HORSESHOE BAY
FLORENCE BAY
NELLY BAY
LEGEND
2009 Contours
0.5m intervals
Figure 2.1.1:Topographic Data
SCALE: @1:20,000
700 0350
Meters
A3
TOWNSVILLE CITY COUNCILHORSESHOE BAY
STUDY AREA
© Townsville City Council 2010DIGITAL FILE: DRAWN BY: DATE:
Strategic Planning DepartmentPLANNING AND DEVELOPMENT
mxdJAJ
27/10/2011
´

HORSESHOE BAY FLOOD REPORT
Page 14 >> 44 741 992 072
2.2 Stormwater Network
Stormwater Network Data was available on Council’s GIS and Mosaic software systems for the construction of the flood model. As-Constructed plans from the plan index were used to determine details of the culverts under Apjohn Street and the drop structures in the downstream channel (plan numbers 9110/1-7, 9110/1-8, and 9110/1-9, 5022-C , 5022-C20, and 5022-C21). Figure 2.2.1 shows the available stormwater network. Figure 2.2.2 A and B shows the culvert structures that were represented in the model.
2.3 Historical Flooding Information
The Horseshoe Bay study area is a stand alone catchment with 2 outlets to the bay and no stream gauges. No historical flood levels were available to use for calibration. Anecdotal accounts of some of the flow paths within Horseshoe Bay are available from council officers and from the Horseshoe Bay Drainage Improvements Report January 2011. Evidence, like sediment deposits, obtained from site inspections indicated flow paths in certain areas. This data was the only historic flood information available for the Horseshoe Bay Study Area.

GIFFORD STREET
SWENSEN STREET
PIRIE STREET
WALLABY WAYSTETAN COURT
BLUEJEEP COURT
LEGEND
Pipe Diameter [mm]
1500
900
Figure 2.2.1:Stormwater Network
SCALE: @1:2,000
40 020
Meters
A3
TOWNSVILLE CITY COUNCILHORSESHOE BAY
STUDY AREA
© Townsville City Council 2010DIGITAL FILE: DRAWN BY: DATE:
Strategic Planning DepartmentPLANNING AND DEVELOPMENT
mxdJAJ
23/06/2011
´

Drop Strucutre
Drop Strucutre
Drop Strucutre
Drop Strucutre
Drop Strucutre
1 x 900mm
5 x 750mm
1 x 900mm
5 x Various Sizes
4 x 2400mm x 1500mmAPJOHN STREET
HORSESHOE BAY ROAD
PARKER STREET
PACIFIC DRIVE
LANEWAY
DENT
STRE
ET
HENRY LAWSON STREET
CORICA CRESCENT
SANDALS BOULEVARD
HEATH STREET
PANDANUS DRIVE
BAYSIDE COURT
ROAD
TIRAM
ULA C
OURT
PACIFIC DRIVE
HORSESHOE BAY
LEGEND
!? Structures
Figure 2.2.2 A:Stormwater Network
SCALE: @1:4,000
80 040
Meters
A3
TOWNSVILLE CITY COUNCILHORSESHOE BAY
STUDY AREA
© Townsville City Council 2010DIGITAL FILE: DRAWN BY: DATE:
Strategic Planning DepartmentPLANNING AND DEVELOPMENT
mxdJAJ
23/06/2011
´

3 x 1200mm
3 x 1050mm
3 x Various Sizes5 x 1200mm x 600mm
2 x 1200mm x 600mm
GIFFORD STREET
HORSESHOE BAY ROAD
SOMERSET STREET BOND COURT
BAY VISTA COURT
LANEWAY
YORK COURT
SOMERSET COURT
OLIVIA COURT
JAYDN COURT
NAUTILUS STREET
HORSESHOE BAY
LEGEND
!? Structures
Figure 2.2.2 B:Stormwater Network
SCALE: @1:3,000
60 030
Meters
A3
TOWNSVILLE CITY COUNCILHORSESHOE BAY
STUDY AREA
© Townsville City Council 2010DIGITAL FILE: DRAWN BY: DATE:
Strategic Planning DepartmentPLANNING AND DEVELOPMENT
mxdJAJ
23/06/2011
´

HORSESHOE BAY FLOOD REPORT
Page 18 >> 44 741 992 072
2.4 Historical Rainfall
Rainfall gauges do exist on Magnetic Island in Nelly and Picnic bays, but because there was no quantitative historic flood information, historical rainfall data was not used for calibrating the hydrological model.
2.5 Design Rainfall
Design storms are specified from IFD input data. IFD input parameters for Townsville can be found in Council’s Handbook for Drainage Design. The IFD input parameters used for this study were taken from the Bureau of Meteorology website which references Australian Rainfall and Runoff, 1987, Volume 2. These values were more site specific than the values given by the Handbook for Drainage Design and differ slightly in that the Horseshoe Bay study area is subject to higher intensity rainfall for shorter, more extreme events. For more frequent and longer duration events, rainfall intensities for Horseshoe Bay are less than the generalised values given in the Handbook for Drainage Design. Table 2.5.1 shows the IFD input data. The actual IFD data used to derive rainfall intensities for each ARI and duration is shown below in Table 2.5.2.
Parameter ValueLatitude [° E] 19.125Longitude [° S] 146.851 hour, 2 year intensity [mm/h] 5212 hour, 2 year intensity [mm/h] 10.872 hour, 2 year intensity [mm/h] 3.481 hour, 50 year intensity [mm/h] 11212 hour, 50 year intensity [mm/h] 23.372 hour, 50 year intensity [mm/h] 9Average Regional Skewness, G 0.06Geographical Factor, F2 3.93Geographical Factor, F50 17.15
Table 2.5.1: IFD Input Data for Horseshoe Bay

Duration 1 Year ARI 2 Year ARI 5 Year ARI 10 Year ARI 20 Year ARI 50 Year ARI 100 Year ARI
(mins) (mm/hour) (mm/hour) (mm/hour) (mm/hour) (mm/hour) (mm/hour) (mm/hour)
5 111 145 193 222 261 312 352
5.5 108 141 188 216 253 303 342
6 105 137 183 210 246 295 333
6.5 102 134 178 205 240 287 324
7 100 130 174 200 234 281 317
7.5 97 127 170 195 229 274 310
8 95 125 166 191 224 268 303
8.5 93 122 162 187 220 263 297
9 91 119 159 184 215 258 291
9.5 90 117 156 180 211 253 285
10 88 115 153 177 207 248 280
11 85 111 148 171 200 240 271
12 82 107 143 165 194 232 262
13 80 104 139 160 188 225 254
14 77 101 135 155 182 219 247
15 75 98 131 151 177 213 240
16 73 96 128 147 173 207 234
17 71 93 125 144 169 202 228
18 70 91 122 140 165 197 223
19 68 89 119 137 161 193 218
20 67 87 116 134 158 189 213
21 65 85 114 131 154 185 209
22 64 83 112 129 151 181 205
23 63 82 109 126 148 178 201
24 61 80 107 124 146 175 197
25 60 79 105 122 143 172 194
26 59 77 104 120 141 169 190
27 58 76 102 118 138 166 187
28 57 75 100 116 136 163 184
29 56 74 99 114 134 160 181
30 55 73 97 112 132 158 179
32 54 70 94 109 128 153 173
34 52 68 92 106 124 149 169
36 51 67 89 103 121 145 164
38 49.5 65 87 100 118 142 160
40 48.3 63 85 98 115 138 156
45 45.6 60 80 93 109 131 148
50 43.3 57 76 88 103 124 140
55 41.3 54 73 84 99 119 134
60 39.5 52 69 80 95 114 128
75 34.5 45.2 61 70 82 99 112
90 30.8 40.3 54 63 74 88 100
105 27.9 36.6 49.1 57 67 80 91
120 25.7 33.7 45.2 52 61 74 84
135 23.8 31.2 41.9 48.5 57 69 78
150 22.3 29.2 39.2 45.4 53 64 73
165 21 27.5 36.9 42.7 50 60 68
180 19.8 26 34.9 40.4 47.5 57 65
195 18.9 24.7 33.2 38.4 45.1 54 61
210 18 23.6 31.6 36.6 43.1 52 59
225 17.2 22.6 30.3 35 41.2 49.5 56
240 16.5 21.6 29.1 33.6 39.5 47.5 54
270 15.3 20.1 26.9 31.2 36.7 44.1 49.9
300 14.3 18.8 25.2 29.2 34.3 41.2 46.6
360 12.7 16.7 22.4 26 30.5 36.7 41.5
420 11.6 15.1 20.3 23.5 27.7 33.3 37.6
480 10.6 13.9 18.7 21.6 25.4 30.6 34.6
540 9.85 12.9 17.3 20.1 23.6 28.4 32.1
600 9.21 12.1 16.2 18.8 22.1 26.5 30
660 8.67 11.4 15.3 17.7 20.8 25 28.2
720 8.21 10.8 14.4 16.7 19.7 23.6 26.7
840 7.47 9.81 13.3 15.4 18.2 21.9 24.8
960 6.89 9.07 12.3 14.3 16.9 20.5 23.3
1080 6.41 8.45 11.5 13.5 15.9 19.3 22
1200 6.01 7.93 10.9 12.7 15.1 18.3 20.9
1320 5.67 7.49 10.3 12.1 14.4 17.5 19.9
1440 5.37 7.11 9.81 11.5 13.7 16.7 19.1
1800 4.67 6.2 8.63 10.2 12.2 14.9 17.1
2160 4.15 5.53 7.76 9.19 11 13.5 15.5
2520 3.75 5.01 7.07 8.41 10.1 12.5 14.3
2880 3.43 4.59 6.52 7.77 9.37 11.6 13.4
3240 3.16 4.24 6.05 7.24 8.75 10.8 12.5
3600 2.94 3.94 5.66 6.78 8.21 10.2 11.8
3960 2.74 3.69 5.31 6.38 7.75 9.64 11.2
4320 2.57 3.46 5.01 6.03 7.33 9.15 10.6
Table 2.5.2: Rainfall Intensity Frequency Duration data for; Horseshoe Bay Qld

HORSESHOE BAY FLOOD REPORT
Page 20 >> 44 741 992 072
2.6 GIS Layers
A number of standard base GIS layers were used to create this model. The Stormwater Infrastructure layers were used to create structure and pipes in the hydraulic model. Aerial survey layers were used to create bathymetry and cross sectional data, as well as helping to determine sub-catchment break-up. To see the resulting model setup from GIS layers, refer to Section 4.3.
2.7 Previous Reports
Horseshoe Bay Drainage Improvements Report In January 2011, Council completed the Horseshoe Bay Drainage Improvements Report for the purpose of identifying existing stormwater issues within Horseshoe Bay, and suggesting possible mitigation options. The report was utilised in this study to verify flow paths and problematic areas that were identified through the flood model. The report also contained recommendations for flood mitigation that were reviewed Townsville Flood Hazard Assessment Study The Townsville Flood Hazard Assessment Study was undertaken in 2005 by Maunsell on behalf of Council. The study aimed to quantify flood inundation, determine the flood hazards and the vulnerability of community and infrastructure, and identify possible risk mitigation measures and strategies to allow proper and effective management of the identified risks. The study was used to verify quantitative results of the Horseshoe Bay Flood Model. Horseshoe Bay Drainage Management Plan The Horseshoe Bay Drainage Management Plan – Phase 1 and Phase 2 Reports contains important information about catchment characteristics that were taken into account when choosing loss parameter values for the Horseshoe Bay Flood Model. The report brings up flooding issues and makes recommendations that were reviewed in Chapter 5.9 – Potential Mitigation Options.

HORSESHOE BAY FLOOD REPORT
Page 21 >> 44 741 992 072
3.0 Hydrological Assessment
3.1 Overview
Horseshoe Bay was divided up into two main catchments: the Endeavour Creek
catchment on the western side and the Beeran Creek catchment on the eastern side.
Each catchment was then divided up into sub-catchments based on topography to
allow for appropriate representation of flows within the study area. A total of 125 sub-
catchments were used for the Horseshoe Bay model. XP-RAFTS was used to create a
hydrologic model of the study area which was verified to the Rational Method. The
calibrated model then was used to determine flows from design storm events.
3.2 XP-RAFTS
XP-RAFTS from XP Software is a runoff routing model that is used for hydrologic
analysis of catchment systems. XP-RAFTS uses the Laurenson non-linear runoff
routing procedure to develop stormwater runoff hydrographs. Hydrographs can be
generated from either an actual event (recorded rainfall time series) or a design storm
utilizing Intensity-Frequency-Duration data together with storm temporal patterns based
on standard ARR 1987 data.
3.3 Catchment
The Horseshoe Bay Study Area includes a large portion of the Magnetic Island
National Park. It mainly covers the suburb of Horseshoe Bay, but also includes parts of
the suburbs of Florence Bay, Arcadia, and West Point on Magnetic Island and has a
total area of 1205 Ha.
Horseshoe Bay is partially developed in the lower reaches on the eastern side of the
suburb and generally undeveloped on the western side. The steep upper reaches of
Green Space and Magnetic Island National Park are also undeveloped. The suburb of
Horseshoe Bay has a significant portion of developable land in flatter areas.
Figure 3.3.1 A to D shows the subcatchment breakup, with A showing the overall
catchment and B, C, and D having been enlarged to show the urbanised areas.
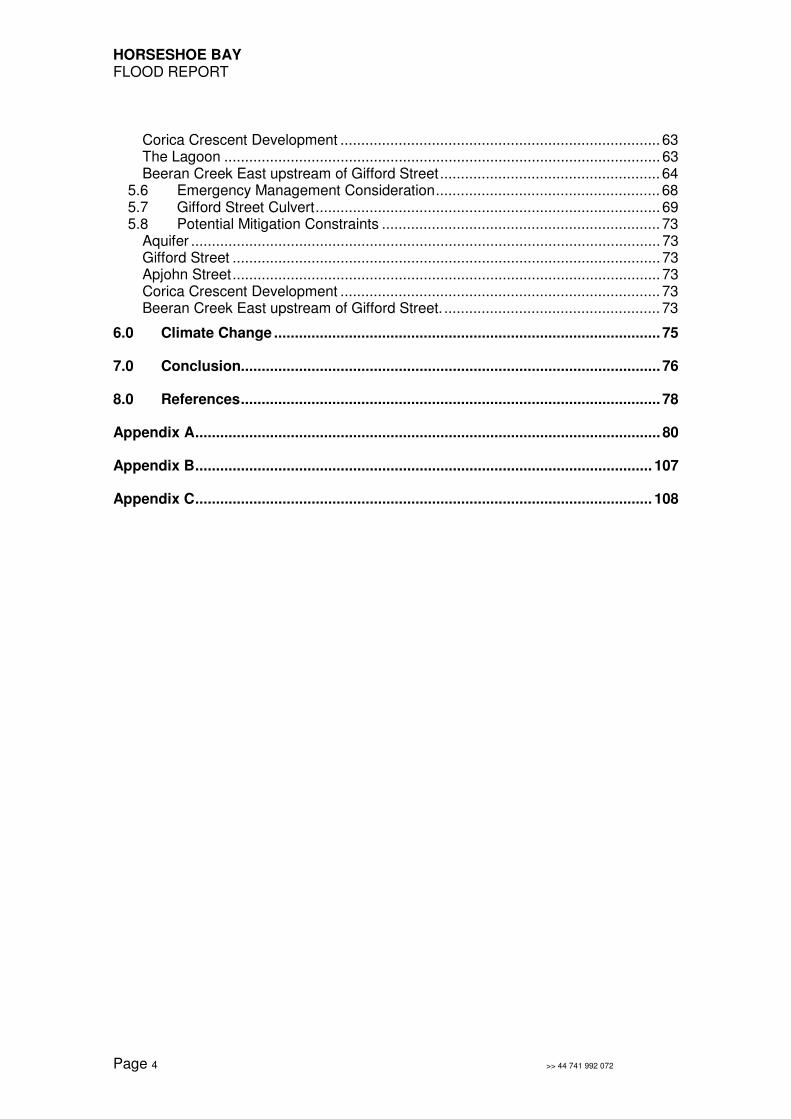
Table 3.3.1 shows catchment parameters. Catchment parameters were determined
through analysing the available GIS layers and site inspection.

WEST POINT
ARCADIA
HORSESHOE BAY
FLORENCE BAY
NELLY BAY
C5C4C3 C2
WB-9WB-8
WB-7WB-6 WB-5
EB-3
EB-2
EB-1
WC-1WC-2WC-3
WB-4
WB-3WB-2
WB-1
WA-9
WA-8
WA-7WA-6WA-5
WA-4WA-3
WA-2 WA-1
EA-9
EA-8 EA-7EA-6
EA-4
EA-2
WA-Z2
EA-7C
EB-Z3EB-Z2EB-Z1
WB-11WB-10
WB-8BWB-8A
WB-6A
WB-4D
WB-4C
WB-4B
WB-4A
WA-10WA-9B
WA-9A
EA-12
EA-1A
EA-7B
EB-1A
WC-2A
WB-3BWB-3A
WB-1A
WA-8CWA-8BWA-8A
WA-7AWA-6A
WA-4A
WA-2CWA-2B
WA-2A
EA-11
EA-10
EA-9DEA-9C
EA-9BEA-8D
EA-8C
EA-8B
EA-8A
EA-7A
EA-6B EA-6A
EA-5BEA-5A
EA-4A EA-3D
EA-3A
EA-7B1EA-7B2
EA-10A
EB-1B1EB-1B2
EA-9P1
EA-7P1EA-7P2
EA-8A3
WB-3B1
WB-4C1
WB-4A2
WB-4A1
WA-8A1
WA-10A
WA-2C4WA-2C3WA-2C1
WA-2A2
EA-8C1
EA-8A1
EA-5B1
EA-5A2
LEGEND
Flow Path
Subcatchments
Discharge Points
Reporting Locations
CatchmentsBeeran East
Beeran West
Endeavour
Gorge
Figure 3.3.1:Catchment
SCALE: @1:20,000
720 0360
Meters
A3
TOWNSVILLE CITY COUNCILHORSESHOE BAY
STUDY AREA
© Townsville City Council 2010DIGITAL FILE: DRAWN BY: DATE:
Strategic Planning DepartmentPLANNING AND DEVELOPMENT
mxdJAJ
27/10/2011
´
A BD
C

HORSESHOE BAY
WEST POINT
ARCADIA
FLORENCE BAY
C5C4C3C2
C1
WB-5
EB-3
EB-2
EB-1
WC-1WC-2
WC-3
WB-4
WB-3
WB-2
WB-1
WA-9
WA-8
WA-7WA-6
WA-4
WA-3
WA-2 WA-1
EA-9
EA-8EA-7
EA-6
EA-4EA-3
EA-2 EA-1
WB-Z1
EA-Z1
WA-Z2
EA-7C
EB-Z3
EB-Z2EB-Z1
WB-4B
WB-4A
WA-10
WA-9B
WA-9A
EA-12
EA-1A
EA-7B
EB-1A
WC-2A
WB-3B
WB-3A
WB-1A
WA-8CWA-8B
WA-8A
WA-7A
WA-6A WA-4B
WA-4A
WA-3A
WA-2CWA-2B
WA-2A
EA-11
EA-10
EA-9D
EA-9C
EA-9B
EA-9A
EA-8D
EA-8C
EA-8B
EA-8A
EA-7A
EA-6BEA-6A
EA-5C
EA-5B
EA-5A
EA-4A EA-3D
EA-3B
EA-5A3
EB-1A1
EA-7B1EA-7B2
EA-10A
EB-1B2
EA-9P1
EA-7P1 EA-7P2
EA-8A3
WB-4A2
WB-4A1
WA-8A1
WA-10A
WA-2C4WA-2C3WA-2C2
WA-2A3WA-2A2
WA-2A1
EA-8C1
EA-8A2
EA-8A1
EA-7A1
EA-5B1
EA-5A2
EA-5A1
LEGEND
Flow Path
Subcatchments
Discharge Points
Reporting Locations
CatchmentsBeeran East
Beeran West
Endeavour
Gorge
Figure 3.3.1:Catchment
SCALE: @1:10,000
360 0180
Meters
A3
TOWNSVILLE CITY COUNCILHORSESHOE BAY
STUDY AREA
© Townsville City Council 2010DIGITAL FILE: DRAWN BY: DATE:
Strategic Planning DepartmentPLANNING AND DEVELOPMENT
mxdJAJ
27/10/2011
´
A BD
C

HORSESHOE BAY
FLORENCE BAY
C5C4
C2C1
EA-9
EA-8EA-7
EA-6
EA-5
EA-4
EA-3
EA-2EA-1
EA-Z1 EA-7C
EA-7BEA-8B
EA-8A
EA-7A
EA-6B
EA-6A
EA-5C
EA-5B
EA-5A
EA-4AEA-3D
EA-3C
EA-3B
EA-3A
EA-5A3
EA-7B1
EA-7B2
EA-9P1
EA-7P1 EA-7P2
EA-8A3
EA-8A1
EA-5B1
EA-5A2
EA-5A1
LEGEND
Flow Path
Subcatchments
Discharge Points
Reporting Locations
CatchmentsBeeran East
Beeran West
Endeavour
Gorge
Figure 3.3.1:Catchment
SCALE: @1:5,000
175 087.5
Meters
A3
TOWNSVILLE CITY COUNCILHORSESHOE BAY
STUDY AREA
© Townsville City Council 2010DIGITAL FILE: DRAWN BY: DATE:
Strategic Planning DepartmentPLANNING AND DEVELOPMENT
mxdJAJ
27/10/2011
´
A BD
C

HORSESHOE BAY
ARCADIA EB-3
EB-2
EB-1
EA-9
EB-Z3
EB-Z2EB-Z1
EA-12
EA-7B
EB-1B
EB-1A
EA-11
EA-10
EA-9D
EA-9C
EA-9B
EA-9A
EA-8D
EA-8C
EA-8B
EA-7AEA-5C
EA-5B
EB-1A1
EA-7B1
EA-7B2
EA-10A
EB-1B1
EB-1B2
EA-9P1
EA-7P1 EA-7P2
EA-8A3
EA-8C1
EA-8A2
EA-7A1
EA-5B1
EA-5A1
LEGEND
Flow Path
Subcatchments
Discharge Points
Reporting Locations
CatchmentsBeeran East
Beeran West
Endeavour
Gorge
Figure 3.3.1:Catchment
SCALE: @1:5,000
175 087.5
Meters
A3
TOWNSVILLE CITY COUNCILHORSESHOE BAY
STUDY AREA
© Townsville City Council 2010DIGITAL FILE: DRAWN BY: DATE:
Strategic Planning DepartmentPLANNING AND DEVELOPMENT
mxdJAJ
27/10/2011
´
A BD
C
HORSESHOE BAY FLOOD REPORT
Page 26 >> 44 741 992 072
Sub-Catchment Area [ha] SlopeFraction
ImperviousPervious Surface
RetardanceImpervious Surface
RetardanceLink Length
[m]Link
Slope
C1 3.2 0.06 0.01 0.05 0.02 49.5 0.03C2 3.6 0.08 0 0.05 0.02 68.7 0.02C3 3.0 0.14 0 0.05 0.02 342.6 0.01C4 2.5 0.12 0 0.05 0.02 254.7 0.01C5 0.7 0.15 0 0.05 0.02 105.8 0.01EA-1 13.1 0.15 0 0.08 0.02 172.0 0.01EA-10 6.2 0.13 0.3 0.06 0.02 437.7 0.01EA-10A 2.4 0.03 0.3 0.06 0.02 182.9 0.02EA-11 23.3 0.15 0 0.08 0.02 467.0 0.02EA-12 24.9 0.15 0 0.08 0.02 754.9 0.06EA-1A 15.5 0.15 0 0.08 0.02 356.0 0.15EA-2 3.1 0.15 0.02 0.08 0.02 172.3 0.02EA-3 1.7 0.07 0.05 0.06 0.02 363.2 0.00EA-3A 0.8 0.15 0 0.08 0.02 321.8 0.01EA-3B 1.0 0.15 0 0.08 0.02 74.3 0.02EA-3C 4.2 0.15 0 0.08 0.02 80.0 0.02EA-3D 5.5 0.15 0 0.08 0.02 123.8 0.02EA-4 3.5 0.05 0.4 0.06 0.02 133.8 0.00EA-4A 3.4 0.10 0.05 0.05 0.02 353.3 0.00EA-5 5.5 0.06 0.1 0.07 0.02 187.2 0.01EA-5A 3.9 0.09 0.05 0.06 0.02 267.7 0.02EA-5A1 8.1 0.15 0 0.08 0.02 278.6 0.01EA-5A2 1.3 0.15 0 0.08 0.02 268.6 0.05EA-5A3 1.9 0.15 0 0.08 0.02 149.8 0.07EA-5B 2.1 0.15 0.01 0.08 0.02 270.6 0.01EA-5B1 4.4 0.15 0 0.08 0.02 143.8 0.01EA-5C 15.3 0.15 0 0.08 0.02 166.3 0.04EA-6 5.6 0.04 0.03 0.07 0.02 85.7 0.01EA-6A 3.9 0.08 0 0.07 0.02 290.8 0.00EA-6B 4.9 0.05 0 0.07 0.02 490.7 0.00EA-7 6.7 0.03 0.45 0.06 0.02 163.8 -0.01EA-7A 9.2 0.04 0.02 0.06 0.02 501.6 0.02EA-7A1 9.9 0.05 0.6 0.06 0.02 408.8 0.02EA-7B 1.1 0.15 0 0.08 0.02 285.4 0.02EA-7B1 1.8 0.15 0 0.08 0.02 114.2 0.04EA-7B2 1.5 0.15 0 0.08 0.02 407.0 0.03EA-7C 4.0 0.04 0.45 0.06 0.02 226.9 0.03EA-7P1 3.8 0.04 0.45 0.06 0.02 185.4 0.00EA-7P2 4.9 0.03 0.45 0.06 0.02 173.8 0.02EA-8 12.0 0.03 0.45 0.06 0.02 398.7 0.00EA-8A 28.2 0.02 0.03 0.06 0.02 209.9 0.00EA-8A1 8.9 0.04 0.01 0.06 0.02 562.5 0.01EA-8A2 2.8 0.10 0.6 0.06 0.02 145.2 0.01EA-8A3 4.8 0.03 0.1 0.06 0.02 549.2 0.01EA-8B 9.2 0.03 0.01 0.06 0.02 432.8 0.01EA-8C 10.6 0.05 0.6 0.06 0.02 315.0 0.01EA-8C1 2.5 0.15 0 0.08 0.02 248.3 0.04EA-8D 2.2 0.15 0.1 0.08 0.02 390.8 0.04EA-9 5.1 0.05 0.4 0.06 0.02 279.9 0.02EA-9A 17.9 0.06 0.25 0.06 0.02 282.7 0.01EA-9B 2.4 0.15 0 0.08 0.02 380.6 0.04EA-9C 4.0 0.15 0 0.08 0.02 478.1 0.05EA-9D 12.5 0.15 0 0.08 0.02 601.2 0.06EA-9P1 8.0 0.03 0.1 0.06 0.02 147.1 0.01EB-1 6.1 0.09 0.6 0.06 0.02 379.5 0.02
Table 3.3.1: Attributes of Horseshoe Bay

HORSESHOE BAY FLOOD REPORT
Page 27 >> 44 741 992 072
Sub-Catchment Area [ha] SlopeFraction
ImperviousPervious Surface
RetardanceImpervious Surface
RetardanceLink Length
[m]Link
Slope
EB-1 6.1 0.09 0.6 0.06 0.02 379.5 0.02EB-1A 4.1 0.15 0 0.08 0.02 62.5 0.12EB-1A1 2.8 0.15 0 0.08 0.02 107.7 0.03EB-1B 1.5 0.15 0 0.08 0.02 55.3 0.12EB-1B1 2.6 0.15 0 0.08 0.02 73.3 0.11EB-1B2 1.4 0.15 0 0.08 0.02 263.5 0.11EB-2 14.9 0.15 0 0.08 0.02 232.6 0.03EB-3 13.9 0.15 0 0.08 0.02 584.6 0.14WA-1 2.9 0.09 0 0.05 0.02 38.7 0.01WA-10 18.3 0.15 0 0.08 0.02 607.3 0.04WA-10A 17.0 0.15 0 0.08 0.02 25.7 0.21WA-2 9.9 0.06 0 0.05 0.02 193.0 0.00WA-2A 1.8 0.03 0 0.06 0.02 383.5 0.01WA-2A1 8.1 0.04 0.01 0.08 0.02 101.8 0.01WA-2A2 1.6 0.15 0 0.08 0.02 424.8 0.02WA-2A3 1.4 0.15 0 0.08 0.02 424.2 0.03WA-2B 7.0 0.05 0.1 0.06 0.02 336.5 0.00WA-2C 14.8 0.03 0.01 0.07 0.02 122.7 0.02WA-2C1 5.5 0.15 0 0.08 0.02 453.2 0.02WA-2C2 1.0 0.15 0 0.08 0.02 386.0 0.02WA-2C3 1.3 0.15 0 0.08 0.02 393.5 0.02WA-2C4 4.6 0.15 0 0.08 0.02 479.6 0.02WA-3 3.2 0.08 0 0.07 0.02 224.0 0.00WA-3A 2.8 0.04 0 0.07 0.02 411.9 0.01WA-4 15.8 0.03 0.01 0.06 0.02 299.1 0.01WA-4A 2.3 0.04 0.01 0.06 0.02 707.1 0.01WA-4B 3.5 0.02 0.01 0.06 0.02 685.5 0.01WA-5 0.9 0.06 0 0.06 0.02 555.3 0.01WA-6 4.4 0.08 0 0.08 0.02 574.0 0.00WA-6A 27.9 0.15 0 0.08 0.02 377.9 0.01WA-7 7.7 0.07 0 0.08 0.02 112.6 0.00WA-7A 1.8 0.15 0 0.08 0.02 133.2 0.04WA-8 7.3 0.08 0.05 0.08 0.02 556.2 0.01WA-8A 16.8 0.15 0 0.08 0.02 595.9 0.01WA-8A1 32.4 0.15 0 0.08 0.02 438.1 0.22WA-8B 5.2 0.05 0.6 0.06 0.02 178.2 0.00WA-8C 3.3 0.15 0 0.08 0.02 306.4 0.04WA-9 25.2 0.15 0 0.08 0.02 382.8 0.00WA-9A 33.1 0.15 0 0.08 0.02 98.1 0.02WA-9B 32.1 0.15 0 0.08 0.02 1009.8 0.10WB-1 1.8 0.11 0.01 0.06 0.02 476.0 0.00WB-10 19.6 0.15 0 0.08 0.02 532.7 0.16WB-11 20.7 0.15 0 0.08 0.02 987.5 0.13WB-1A 1.2 0.15 0 0.08 0.02 138.7 0.01WB-2 1.8 0.09 0 0.08 0.02 191.1 0.01WB-2A 4.8 0.15 0 0.08 0.02 200.4 0.00WB-3 4.6 0.07 0 0.08 0.02 43.5 0.01WB-3A 17.3 0.15 0 0.08 0.02 181.1 0.01WB-3B 15.6 0.15 0 0.08 0.02 261.2 0.00WB-3B1 22.0 0.15 0 0.08 0.02 518.1 0.24WB-3C 5.2 0.15 0 0.08 0.02 156.0 0.05
Table 3.3.1: Attributes of Horseshoe Bay

HORSESHOE BAY FLOOD REPORT
Page 28 >> 44 741 992 072
Sub-Catchment Area [ha] SlopeFraction
ImperviousPervious Surface
RetardanceImpervious Surface
RetardanceLink Length
[m]Link
Slope
WB-3C 5.2 0.15 0 0.08 0.02 156.0 0.05WB-4 11.2 0.15 0 0.08 0.02 302.6 0.00WB-4A 19.5 0.15 0 0.08 0.02 23.0 -0.12WB-4A1 14.8 0.15 0 0.08 0.02 13.9 0.00WB-4A2 23.6 0.15 0 0.08 0.02 442.9 0.24WB-4B 37.9 0.15 0 0.08 0.02 403.1 0.03WB-4C 27.5 0.15 0 0.08 0.02 867.0 0.16WB-4C1 20.2 0.15 0 0.08 0.02 752.2 0.09WB-4D 38.8 0.15 0 0.08 0.02 664.5 0.06WB-5 26.6 0.15 0 0.08 0.02 444.2 0.19WB-6 12.0 0.15 0 0.08 0.02 553.8 0.04WB-6A 22.3 0.15 0 0.08 0.02 455.0 0.17WB-7 11.6 0.15 0 0.08 0.02 13.7 0.05WB-8 9.7 0.15 0 0.08 0.02 483.5 0.15WB-8A 13.9 0.15 0 0.08 0.02 497.9 0.14WB-8B 22.1 0.15 0 0.08 0.02 531.2 0.14WB-9 12.2 0.15 0 0.08 0.02 16.2 0.16WC-1 3.7 0.08 0.01 0.05 0.02 60.4 0.09WC-2 18.2 0.15 0 0.08 0.02 89.8 0.01WC-2A 13.4 0.15 0 0.08 0.02 23.3 0.04WC-3 11.1 0.15 0 0.08 0.02 100.8 0.02EA-Z1 233.2 0.00EB-Z1 240.1 0.01EB-Z2 3.0 0.16EB-Z3 163.5 0.02WA-Z2 243.5 0.01WB-Z1 124.2 0.01
Table 3.3.1: Attributes of Horseshoe Bay
Note- Sub-Catchments EA-Z1 to WB-Z1 are dummy nodes created for modelling purposes only.

HORSESHOE BAY FLOOD REPORT
Page 29 >> 44 741 992 072
Rainfall Loss
Rainfall loss parameters in XP-RAFTS were determined while verifying the XP-RAFTS model to the Rational Method. Pervious subcatchments were all assigned relatively high losses because of the non cohesive nature of the soil. Lower areas of the catchment were assigned an Initial Loss (IL) of 20mm and a Continuing Loss (CL) of 4mm/h. Upper areas of the catchment with dense vegetation and broken rock geology were assigned and IL of 40mm and a CL of 4mm/h. These values are higher than average values for Queensland given in ARR (1998), but are within the acceptable limits. Higher losses have been assigned to the mountainous reaches to account for the high level of fractured rock and gravel type surfaces. The Horseshoe Bay Drainage Management Plan, section 5.7 contains the following except which lead to the adopting of high loss values:
Early hydrogeological investigations undertaken by Wyatt (1959) and Stephenson (1962) determined that while the fractures in the volcanics and granites may contain some groundwater reserves, the main supplies would occur in the coastal alluvial areas backing the bays including Horseshoe Bay. Heidecker (1979 and 1981) proposed that although the granite on the Island is not porous, it is dissected by interconnected fracture systems which collect and transmit water. He believed that a complex fracture system up Gustav Creek near 483350E 7882552N could supply up to 360000 litres/day from granitic rocks. Although not directly related to the Horseshoe Bay catchment, Heidecker’s observation is important since it indicates the extent to which the fracture systems in grantic rock can act as baseload feeders to the aquifers. Analysis of recent air photographs may indicate a set of interceding fracture systems close to 4862E 78862N which may provide a baseflow to some of the stream aquifer systems at the eastern end of Horseshoe Bay.
The TFHAS (undertaken in 2005) assigned higher loss value to the sandy areas of the catchment, and a constant value for all other areas. The HBFS assigned a constant loss value for subcatchments located in the lower reaches. The Horseshoe Bay XP-RAFTS model was verified to the rational method to give confidence in the rainfall loss values chosen. Choosing lower loss value in the lower reaches is a conservative approach as it reduces the risk of underestimating flood levels. For Impervious subcatchments, IL of 1mm and a CL of 0mm were chosen in accordance with ARR (1998).
Channel Routing
For the Horseshoe Bay model, XP-RAFTS routes flow using the Channel Routing method. The channel cross section dimensions, length, and slope are specified and XP-RAFTS calculates reach lag time and attenuation based on these parameters. The channel cross sections were modelled in XP RAFTS as one of a few standard reach types. The standard reach types were narrow channel, wide channel, small channel, and plain. Each of these routes was modelled with a typical cross section for the respective type. The link length, and slope parameters for the links downstream of each subcatchment, can be found in Table 3.3.1.

HORSESHOE BAY FLOOD REPORT
Page 30 >> 44 741 992 072
3.4 Verification / Calibration
Because there are no stream gauges in the Horseshoe Bay area, the XP-RAFTS model was verified to the Rational Method at several points about the Study Area. Surface Retardance and Rainfall Losses, were the main parameters altered for verification. The Rational Method estimation of peak flows was performed according to the Queensland Urban Drainage Manual – second edition 2008. Time of Concentrations for the Rational Method were calculated using the Bransby-Williams’ equation. Table 3.4.1 shows the Rational Method results compared to the XP-RAFTS results.
Refer to Appendix B for the full set of Rational Method calculations.
3.5 Probable Maximum Flood and 500 year ARI events
The rainfall intensity is required as an input into XP-RAFTS to model the PMF. This was calculated according to the GSDM detailed by Bureau of Meteorology. The GSDM requires that the PMF storm is applied with rainfall intensities that vary with concentric ellipses. Table 3.5.1 shows the rainfall intensities for the PMF as calculated according to the GSDM. The 500 year storm event also requires intensity input into XP-RAFTS, also found in Table 3.5.1. These values were extrapolated from IFD data. This method was verified for the 1 hour event using an interpolation between 1 in 100 AEP and the PMP according to Australian Rainfall and Runoff (1998).
Duration [h] 1 1.5 3 4.5Rainfall Depth [mm] 480 588 817 977Ellipse A intensity [mm/hr] 463 399 282 226Ellipse A initial mean rainfall depth [mm] 493 636 901 1082Ellipse B intensity [mm/hr] 426 361 251 200Ellipse B initial mean rainfall depth [mm] 462 590 825 987Ellipse C intensity [mm/hr] 401 347 214 169Ellipse C initial mean rainfall depth [mm] 460 588 817 977500y [mm/hr] 165 129 83 64
Table 3.5.1: Probable Maximum Precipitation Calculations
XP-RAFTS Peak Flow Rate: 50
year ARI (m3/s)
XP-RAFTS Peak Flow Rate: 2
year ARI (m3/s)
Rational Method Peak Flow Rate:
50 year ARI (m3/s)
Rational Method Peak Flow Rate: 2
year ARI (m3/s)
WB-1 96.0 22.8 93.3 31.6EA-6 70.4 17.4 63.1 21.2EB-1 14.9 3.3 13.9 4.7EA-9P1 20.0 5.7 18.8 6.3EA-10 15.6 3.7 16.7 5.7EA-9A 14.1 4.1 14.7 5.0EA-5A 11.7 2.6 12.2 4.1WA-6 70.0 16.1 59.3 20.7
Table 3.4.1: A comparison of Rational Method and XP-RAFTS

HORSESHOE BAY FLOOD REPORT
Page 31 >> 44 741 992 072
3.6 Design Storm Flows
The verified XP-RAFTS model produced flows for each subcatchment that were used as sources for the Hydraulic Model. Table 3.6.1 shows a summary of the maximum catchment flows at key locations around Horseshoe Bay. See Figure 3.3.1 B for reporting locations.
WA-2 WA-3 EA-6 EA-5A2y 20.8 13.8 16.5 2.05y 42.5 28.1 32.8 4.510y 56.0 39.4 42.5 6.320y 77.6 56.2 55.2 8.950y 107 74.6 70.3 11.7100y 131 92.3 86.7 14.5500y 193 138 130 21.7PMF 635 407 373 54.3
Table 3.6.1: Max Catchment Flow [m3/s]

HORSESHOE BAY FLOOD REPORT
Page 32 >> 44 741 992 072
4.0 Hydraulic Assessment
4.1 Overview
The Horseshoe Bay Study Area was modelled using the hydraulic modelling software, MIKE FLOOD. The majority of the topography was represented using MIKE 21, but stormwater, narrow open channels, steeper open channels, and structures were modelled in MIKE 11. Inflow hydrographs applied at source points and boundaries came from the XP-RAFTS hydrologic model. As there was no historical flood level data available, the model was unable to be calibrated, however the flows were verified with results from the TFHAS, HEC-RAS models, and hand calculations where applicable. A sensitivity analysis was also undertaken on roughness value within the hydraulic model. For comparison with previous flood models, see Section 5.2.
4.2 MIKE FLOOD
MIKE FLOOD is a hydraulic modelling software package that dynamically links DHI’s 1D (MIKE 11 and MIKE URBAN) and 2D (MIKE 21) models. It allows the user to simultaneously run models with different areas being represented by the most appropriate model. MIKE FLOOD links models by transferring water levels and flows at specified points known as couples. Each model type can be directly coupled to the other.
MIKE 11
MIKE 11 is a software package used for the simulation of flows, water quality and sediment transport in estuaries, rivers, irrigation systems, channels and other water bodies. It is a dynamic, one-dimensional modelling tool used for the detailed design, management and operation of both simple and complex river and channel systems.
MIKE 21
MIKE 21 is a software package containing a comprehensive modelling system for 2D free-surface flows. MIKE 21 is applicable to the simulation of hydraulic and related phenomena in lakes, estuaries, bays, coastal areas and seas where stratification can be neglected.
MIKE URBAN
MIKE URBAN is a GIS-based urban modeling system for water distribution systems, wastewater collection systems, and stormwater.
HORSESHOE BAY FLOOD REPORT
Page 33 >> 44 741 992 072
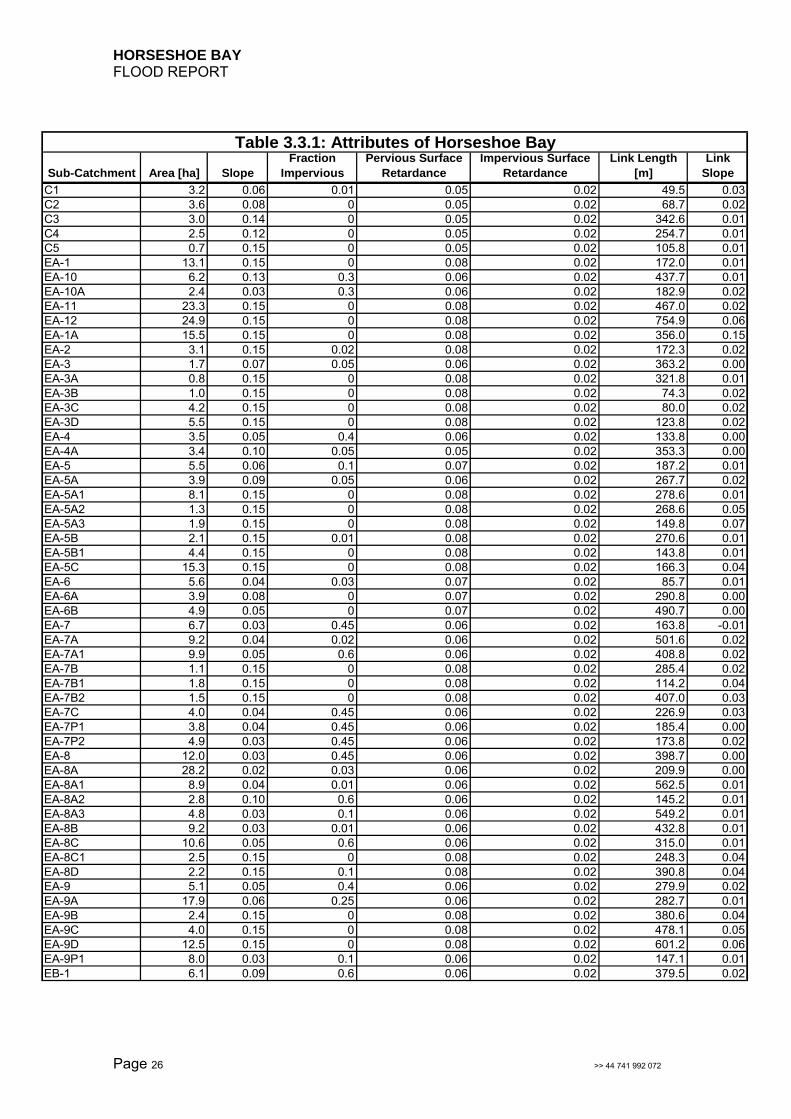
4.3 Model Setup
The geometry of the Horseshoe Bay model was set up such that the pipe network was represented by MIKE URBAN, the steep channels and the narrow channels were represented by MIKE 11, and the flatter flood plain areas were represented by MIKE 21. All three models were run together through MIKE FLOOD, to represent the hydraulics of the whole study area. Figure 4.3.1 shows the model set-up for Horseshoe Bay.

!?
!? !? !?
!?
!?
!?
!?
!?
!?
!?!?!?
!?
!?
HORSESHOE BAY
WEST POINT
FLORENCE BAY
ARCADIA
LEGEND
Model Boundary
MIKE 11
MIKE URBAN
Source Points
!? Structures
MIKE 21 BathymetryHigh : 70m+ AHD
Low : 0m AHD
Figure 4.3.1:Model Setup
SCALE: @1:12,000
400 0200
Meters
A3
TOWNSVILLE CITY COUNCILHORSESHOE BAY
STUDY AREA
© Townsville City Council 2010DIGITAL FILE: DRAWN BY: DATE:
Strategic Planning DepartmentPLANNING AND DEVELOPMENT
mxdJAJ
23/06/2011
´

HORSESHOE BAY FLOOD REPORT
Page 35 >> 44 741 992 072
MIKE 11 MIKE 11 was setup to represent channels. The flow paths and centrelines of the channels were determined from contour data and site inspection. Cross sections were extracted from LiDAR data at regular intervals, and at hydraulic controls. Couples between MIKE 11 and MIKE 21 were setup to represent structure inlets and outlets, and flow between channels and the flood plain. All culvert structures, regardless of size, were represented in MIKE 11 to incorporate key hydraulic controls. Refer to Figure 2.2.2 for culvert locations. MIKE 21 MIKE 21 was setup to represent flood plain areas. Most data in the model is entered via a grid format. The topographic data was built from LiDAR data from 2009. Initial conditions were set to a constant sea level of 1.17m AHD for Horseshoe Bay based on MHWS. Roughness was determined by aerial photography, and site inspection. Table 4.3.1 and Figure 4.3.2 show the various Roughness values used in the model. A sensitivity analysis was undertaken on these roughness values. See Section 4.5 for details.
Land Use Roughness Value (Manning’s 'n' )
Road 0.03Residential (Low) 0.05Residential (Medium) 0.055Bush / Residential (High) 0.08Open grassland 0.04Ocean 0.025
Table 4.3.1: Hydraulic model roughness values
MIKE URBAN MIKE URBAN was setup to represent the underground pipe network of Horseshoe Bay. Pipe dimensions and invert levels were obtained from TCC geospatial data. No headwall inlets to underground pipe networks exist within Horseshoe bay and couples between MIKE 21 and MIKE URBAN were setup to represent inlets pits only. The couple between MIKE 11 and MIKE URBAN was setup to represent the downstream outlet for transferring underground flow to channel flow. Only pipes of diameter 900mm or greater were modelled in MIKE URBAN. It was identified that underground stormwater network pipes less than 900mm in diameter generally have an insignificant effect on flood levels based on a slope equal to or flatter than 0.5%.

LEGEND
0.025
0.03
0.04
0.05
0.055
0.08
Figure 4.3.2: Manning's 'n' Roughness Values
SCALE: @1:12,000
340 0170
Meters
A3
TOWNSVILLE CITY COUNCILHORSESHOE BAY
STUDY AREA
© Townsville City Council 2010DIGITAL FILE: DRAWN BY: DATE:
Strategic Planning DepartmentPLANNING AND DEVELOPMENT
mxdJAJ
7/09/2011
´

HORSESHOE BAY FLOOD REPORT
Page 37 >> 44 741 992 072
4.4 Structure Verification
To verify the accuracy of various structures modelled in MIKE FLOOD, the hydraulics of these structures were verified using HEC-RAS. A HEC-RAS model was created for each structure, and the corresponding upstream and downstream channels. Maximum flows from the 50 year, 1 hour event were applied to the model and results were compared to MIKE FLOOD results. Table 4.4.1 contains the results of each HEC-RAS verification. A description of each structure is available below. Horseshoe Bay Road at Henry Lawson Street A 900mm diameter culvert provides a flow path under Horseshoe Bay Road just south of Henry Lawson Street. Horseshoe Bay Road at the Lagoon Five 750mm diameter culverts provide a flow path under Horseshoe Bay Road at the outlet of the lagoon. 40 Gifford St A 450mm diameter culverts provides a flow path under Gifford Street at number 40. 52 Gifford St Three 1050mm diameter culverts provide a flow path under Gifford Street at number 52.
Culvert Time of peak Flow m3/sUpstream Downstream Upstream Downstream
Henry Lawson 3:41:00 0.6 2.7 2.6 2.7 2.6Lagoon 4:35:00 5.0 2.9 2.6 2.9 2.652 Gifford St 1:00:00 25.0 14.8 13.4 14.8 13.440 Gifford St 0:40:00 13.2 14.0 13.0 14.1 13.0
Table 4.4.1: HEC-RAS verificationHEC-RAS level [m AHD]MIKE level [m AHD]
The culvert at the intersection of Horseshoe Bay Road and Apjohn Street was verified using a maximum capacity hand calculations. Table 4.4.2 shows the results.
Flow [m3/s] Upstream Water Level [m] Downstream Water Level [m]Hand Calculation 1.72 11.67 10.96Model Results 1.73 11.7 11.22
Table 4.4.2 - Capacity verification of culvert at intersection of Horseshoe Bay Rd and Apjohn St

HORSESHOE BAY FLOOD REPORT
Page 38 >> 44 741 992 072
4.5 Sensitivity Analysis
For the Horseshoe Bay model, the adopted roughness values are those shown in
Table 4.3.1. To assess the sensitivity of the hydraulic model with respect to roughness,
a sensitivity analysis was undertaking. This assessed the model with a 20% increase
and a 20% decrease in roughness values throughout the model. For both scenarios,
there were no significant changes in water levels throughout the urban areas. Along
Endeavour Creek and Gorge Creek, water levels varied by over 100mm between
scenarios and flooding extents of the Creeks varied slightly along the reaches. Figure 4.5.1 and 4.5.2 show the flood level difference maps associated with the Sensitivity
Analysis.

PACIFIC DRIVE
GIFFORD STREET
APJOHN STREET HORSESHOE BAY ROAD
PARKER STREET
SWENSEN STREET
POLL
ARD S
TREE
T
LANEWAY
HOLL
INS ST
REET
SOMERSET STREET
HENRY LAWSON STREET
CORI
CA C
RESC
ENT
WALLABY WAY
DOLP
HIN
COUR
T
HEATH STREET
PANDANUS DRIVE
BAYSIDE COURT
YORK COURTOLIVIA COURT
SOMERSET COURT
APJOHN STREET
PACIFIC DRIVE
HORSESHOE BAY
WEST POINT
ARCADIA
FLORENCE BAY
LEGENDDifference to Base Case
< -1 m
-1 - -0.5 m
-0.5 - -0.3 m
-0.3 - -0.1 m
-0.1 - -0.05 m
-0.05 - -0.01 m
-0.01 - 0.01 m
0.01 - 0.05 m
0.05 - 0.1 m
0.1 - 0.3 m
0.3 - 0.5 m
0.5 - 1 m
> 3 m
Figure 4.5.1:-20% Roughness Difference
SCALE: @1:10,000
340 0170
Meters
A3
TOWNSVILLE CITY COUNCILHORSESHOE BAY
STUDY AREA
© Townsville City Council 2010DIGITAL FILE: DRAWN BY: DATE:
Strategic Planning DepartmentPLANNING AND DEVELOPMENT
mxdJAJ
23/10/2011
´

PACIFIC DRIVE
GIFFORD STREET
APJOHN STREET HORSESHOE BAY ROAD
PARKER STREET
SWENSEN STREET
POLL
ARD S
TREE
T
LANEWAY
HOLL
INS ST
REET
SOMERSET STREET
HENRY LAWSON STREET
CORI
CA C
RESC
ENT
WALLABY WAY
DOLP
HIN
COUR
T
HEATH STREET
PANDANUS DRIVE
BAYSIDE COURT
YORK COURTOLIVIA COURT
SOMERSET COURT
APJOHN STREET
PACIFIC DRIVE
HORSESHOE BAY
WEST POINT
ARCADIA
FLORENCE BAY
LEGENDDifference to Base Case
< -1 mm
-1 - -0.5 mm
-0.5 - -0.3 mm
-0.3 - -0.1 mm
-0.1 - -0.05 mm
-0.05 - -0.01 mm
-0.01 - 0.01 mm
0.01 - 0.05 mm
0.05 - 0.1 mm
0.1 - 0.3 mm
0.3 - 0.5 mm
0.5 - 1 mm
> 3 mm
Figure 4.5.2:+20% Roughness Difference
SCALE: @1:10,000
350 0175
Meters
A3
TOWNSVILLE CITY COUNCILHORSESHOE BAY
STUDY AREA
© Townsville City Council 2010DIGITAL FILE: DRAWN BY: DATE:
Strategic Planning DepartmentPLANNING AND DEVELOPMENT
mxdJAJ
23/10/2011
´

HORSESHOE BAY FLOOD REPORT
Page 41 >> 44 741 992 072
4.6 Verification
Various methods of verification were used to obtain a level of confidence in the model results. The flow paths that formed in the results of the hydraulic model were verified to evidence of flow paths found at site visits. Sediment and debris deposits are examples of the kinds evidence use to verify flow paths. Figure 4.6.0 shows the locations and the photographs of some of the evidence found at site visits. Townsville Flood Hazard Assessment (TFHAS) The Townsville Flood Hazard Assessment Study was undertaken in 2005 by Maunsell on behalf of Council. The study aimed to quantify flood inundation, determine the flood hazards and the vulnerability of community and infrastructure, and identify possible risk mitigation measures and strategies to allow proper and effective management of the identified risks. The main differences between the Townsville Flood Hazard Assessment model and the Horseshoe Bay Flood model are listed below.
TFHAS was set up as a 1D model only, where the HBFS was set up as a coupled 2D/1D model using the most appropriate model type where required.
The HBFS hydraulically modelled a range of storm durations from 30 minutes to 24 hours. The TFHAS only hydraulically modelled the 1.5 hour storm within Horseshoe Bay.
The Horseshoe Bay Flood Model includes all stormwater infrastructure within the scope of the study up to August 2011, whereas the TFHAS has not considered infrastructure installed since 2005.
The Horseshoe Bay Drainage Management Plan (2007) has provided information leading to more accurate rainfall loss values being adopted in the HBFS. This change has lead on to the HBFS generally having smaller flow volumes then the TFHAS. See Section 3.3 for details on losses and Table 4.6.2 below for details on flows.
The HBFS XP-RAFTS model limited catchment slopes to a maximum of 15% because of potential errors. The TFHAS did not limit catchment slopes.
Development has occurred in Horseshoe Bay in the time between the completion of the TFHAS and the commencement HBFS. These developments have had topographical changed associated with them which have been represented in the HBFS but not the TFHAS. The following areas (see Figure 1.2.2 for reference to locations) have had topographic changes due to construction which have affected flow paths:
o The Sandals Development o Properties on Gifford Street between Dolphin Court and Horseshoe Bay
Road o Heath Street o The Laneway off Dent Street o Between Apjohn Street and Bayside Court o Gifford Street east of Horseshoe Bay Road
In the THFAS, the Mike 11 branch representing the flow path between the Sandals Development and the Corica Crescent Development has been manipulated to stop water from escaping to other areas.

JI
H GF
E
D
C
B
AAPJOHN STREET
GIFFORD STREET
PARKER STREET
HORSESHOE BAY ROAD
PACIFIC DRIVE
CORI
CA C
RESC
ENT
SANDALS BOULEVARD
SOMERSET STREET
DENT
STRE
ET
DOLPHIN COURT
HEATH STREET
BOND COURT
PANDANUS DRIVE
LANEWAY
BAYSIDE COURT
YORK COURT
OLIVIA COURT
WALLABY WAY
JAYDN COURT
RINT
OUL C
OURT
TIRAM
ULA C
OURT
LEGEND
Photo Locations
Figure 4.6.0: Site Visit Photographs
SCALE: @1:4,000
110 055
Meters
A3
TOWNSVILLE CITY COUNCILHORSESHOE BAY
STUDY AREA
© Townsville City Council 2010DIGITAL FILE: DRAWN BY: DATE:
Strategic Planning DepartmentPLANNING AND DEVELOPMENT
mxdJAJ
7/09/2011
´
A
D I J
H
B
C
F
G
E
HORSESHOE BAY FLOOD REPORT
Page 43 >> 44 741 992 072
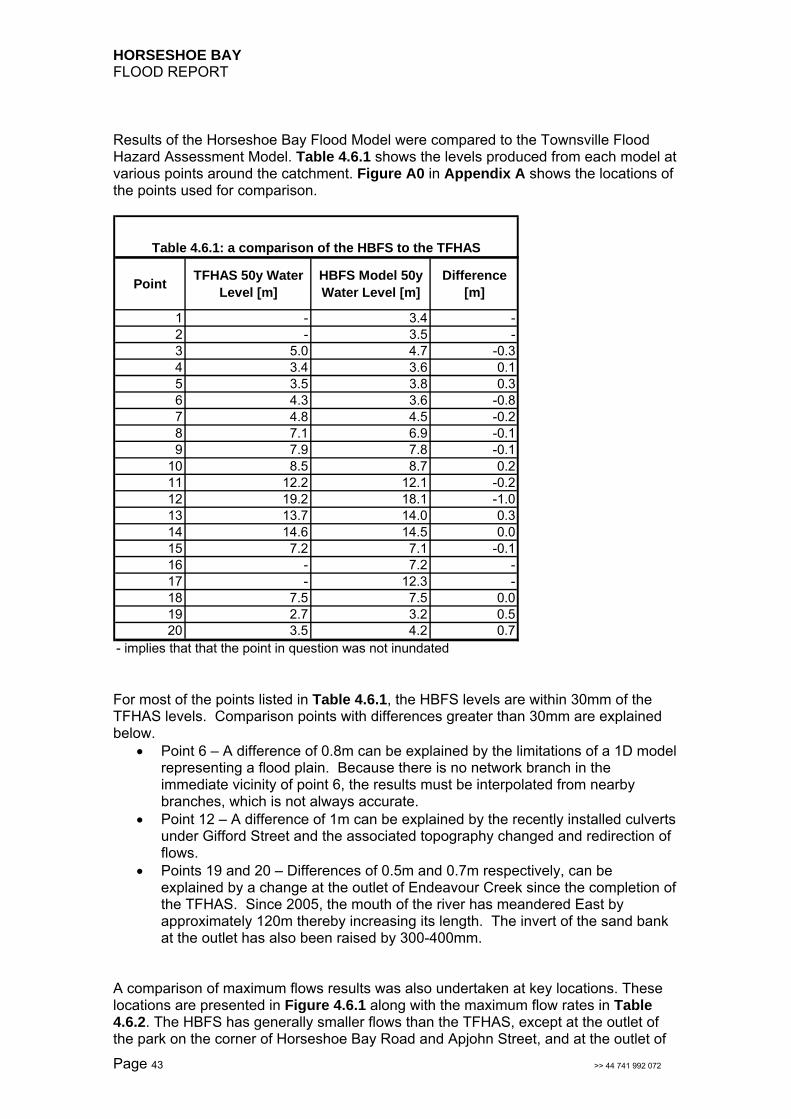
Results of the Horseshoe Bay Flood Model were compared to the Townsville Flood Hazard Assessment Model. Table 4.6.1 shows the levels produced from each model at various points around the catchment. Figure A0 in Appendix A shows the locations of the points used for comparison.
PointTFHAS 50y Water
Level [m]HBFS Model 50y Water Level [m]
Difference [m]
1 - 3.4 -2 - 3.5 -3 5.0 4.7 -0.34 3.4 3.6 0.15 3.5 3.8 0.36 4.3 3.6 -0.87 4.8 4.5 -0.28 7.1 6.9 -0.19 7.9 7.8 -0.1
10 8.5 8.7 0.211 12.2 12.1 -0.212 19.2 18.1 -1.013 13.7 14.0 0.314 14.6 14.5 0.015 7.2 7.1 -0.116 - 7.2 -17 - 12.3 -18 7.5 7.5 0.019 2.7 3.2 0.520 3.5 4.2 0.7
- implies that that the point in question was not inundated
Table 4.6.1: a comparison of the HBFS to the TFHAS
For most of the points listed in Table 4.6.1, the HBFS levels are within 30mm of the TFHAS levels. Comparison points with differences greater than 30mm are explained below.
Point 6 – A difference of 0.8m can be explained by the limitations of a 1D model representing a flood plain. Because there is no network branch in the immediate vicinity of point 6, the results must be interpolated from nearby branches, which is not always accurate.
Point 12 – A difference of 1m can be explained by the recently installed culverts under Gifford Street and the associated topography changed and redirection of flows.
Points 19 and 20 – Differences of 0.5m and 0.7m respectively, can be explained by a change at the outlet of Endeavour Creek since the completion of the TFHAS. Since 2005, the mouth of the river has meandered East by approximately 120m thereby increasing its length. The invert of the sand bank at the outlet has also been raised by 300-400mm.
A comparison of maximum flows results was also undertaken at key locations. These locations are presented in Figure 4.6.1 along with the maximum flow rates in Table 4.6.2. The HBFS has generally smaller flows than the TFHAS, except at the outlet of the park on the corner of Horseshoe Bay Road and Apjohn Street, and at the outlet of

HORSESHOE BAY FLOOD REPORT
Page 44 >> 44 741 992 072
the lagoon. Since the completion of the TFHAS, box culverts have been installed at the intersection of Jaydn Court and Gifford Street. These works have helped to redirect flows into the park, where previously they had run down Gifford Street. This is the reason that the HBFS shows a larger maximum flow than the TFHAS at the outlet of the park (HB_MAIN_D5 10801.5 and HB_MAIN_D3 9920.5 in Table 4.6.2). A comparison between 2004 and 2009 aerial survey shows that the Lagoon has accumulated up to 1.2m of sediment since the TFHAS was completed. This has led to a smaller capacity for water storage, which is the reason that the HBFS is significantly larger than the TFHAS at the outlet of the lagoon (HORSESHOE_MAIN 11382 in Table 4.6.2).
TFHAS Branch and Chainage TFHAS Flow [m3/s] HBFS Flow [m3/s] Difference [%]HORSESHOE_MAIN 10437 12.1 10.3 17HB_MAIN_D5 10801.5 and HB_MAIN_D3 9920.5 13.1 14.6 10HB_MAIN_D5 10326.5 13 11.1 17HB_GORGECK 11039.5 58.5 53.6 9HB_ENDCK 10314 106.9 94.2 13HORSESHOE_MAIN 11382 12.4 36.6 66
Table 4.6.2: A comparison between TFHAS and HBFS of maximum flows
In the THFAS, the Mike 11 branch representing the flow path beside the Sandals Development has been manipulated to stop water from escaping to other areas. Also, the structure at Apjohn Street was not constructed when the TFHAS was undertaken. All these factors help contribute to water level differences in the HBFS. Figure 4.6.2 shows the inundation maps of the TFHAS and the HBFS.

HB_ENDCK 10314
HORSESHOE_MAIN 10437HB_GORGECK 11039.5 HB_M
AIN_D5 1080
1.5 an
d HB_M
AIN_D3 9920
.5
HORSESHOE_MAIN 11382
HB_MAIN_D5 10326.5
LEGEND
HB_FlowCalcs
50y Flood Envelope
0.01 - 0.3
0.3 - 0.5
0.5 - 0.75
0.75 - 1
1 - 1.5
1.5 - 2
2 - 3
3 - 25
Figure 4.6.1: FlowComparison Locations
SCALE: @1:10,000
280 0140
Meters
A3
TOWNSVILLE CITY COUNCILHORSESHOE BAY
STUDY AREA
© Townsville City Council 2010DIGITAL FILE: DRAWN BY: DATE:
Strategic Planning DepartmentPLANNING AND DEVELOPMENT
mxdJAJ
7/09/2011
´

LEGEND
HBFS
TFHAS
Figure 4.6.2: 50y TFHAS and HBFS extent map
SCALE: @1:10,000
275 0137.5
Meters
A3
TOWNSVILLE CITY COUNCILHORSESHOE BAY
STUDY AREA
© Townsville City Council 2010DIGITAL FILE: DRAWN BY: DATE:
Strategic Planning DepartmentPLANNING AND DEVELOPMENT
mxdJAJ
7/09/2011
´

HORSESHOE BAY FLOOD REPORT
Page 47 >> 44 741 992 072
4.7 Design Flood Assessment
Design Flood model results were obtained from a base line model which was set up using 2009 LiDAR, latest stormwater infrastructure including the 2011 installation of the culvert at 40 Gifford St, and 2009 areal photograph showing an up to date level of urbanisation. A range of storm durations and Average Recurrence Intervals were assessed. The ARIs modelled were 2 year, 5 year, 10 year, 20 year, 50 year, 100 year, 500 year, and PMF. The storm durations modelled were 30 minutes, 45 minutes, 1 hour, 1.5 hours, 2 hours, 3 hours, 4.5 hours, 6 hours, 9 hours, 12 hours, 18 hours, and 24 hours. The duration that yields the greatest water level at a particular point in the catchment is the critical duration, and changes depending on the location within the catchment. Figures 4.7.1 to 4.7.2 show the critical durations at within the Study Area. Because Horseshoe Bay has number of different critical durations at different points throughout the catchment, Flood Envelopes have been created for each ARI. Figures 4.7.1 to 4.7.2 show that for the majority of areas, the critical duration is either 1, 1.5, 3, or 4.5 hours. This was also demonstrated in the results table, Table A1 in Appendix A, which shows the flood level for each duration at various points around the catchment. Figure A0 shows the location of the points in the results table. From this analysis, only those 4 critical duration scenarios were run through the model. At each point in the catchment, for a given ARI, the Flood Envelope displays the highest water level from either the 1, 1.5, 3, or 4.5 hour storm events. Flood Envelope maps are contained within Appendix A. Hazard Maps have been created based on a flood hazard assessment and an assessment on the impact of climate change on flooding has also been completed.

LEGEND
Critical Duration [hr]0.5
0.75
1
1.5
2
3
4.5
6
9
12
18
24
Figure 4.7.1: 50yCritical Duration
SCALE: @1:10,000
290 0145
Meters
A3
TOWNSVILLE CITY COUNCILHORSESHOE BAY
STUDY AREA
© Townsville City Council 2010DIGITAL FILE: DRAWN BY: DATE:
Strategic Planning DepartmentPLANNING AND DEVELOPMENT
mxdJAJ
6/10/2011
´

LEGEND
Critical Duration [hr]0.5
0.75
1
1.5
2
3
4.5
6
9
12
18
24
Figure 4.7.2: 100yCritical Duration
SCALE: @1:10,000
290 0145
Meters
A3
TOWNSVILLE CITY COUNCILHORSESHOE BAY
STUDY AREA
© Townsville City Council 2010DIGITAL FILE: DRAWN BY: DATE:
Strategic Planning DepartmentPLANNING AND DEVELOPMENT
mxdJAJ
6/10/2011
´

HORSESHOE BAY FLOOD REPORT
Page 50 >> 44 741 992 072
5.0 Base-line Flooding Assessment
5.1 Overland Results
Base-line surface flow results generated from the model are shown as flood envelopes in Appendix A. Table 5.1.1 summarises the flooding for each ARI. Where numbers of inundated residential properties are provided, they are on the basis of 200 mm water depth across the lot, which does not mean floor levels are exceeded (though in some cases floor levels may be exceeded if they are less than 200 mm above the ground). Roads are also determined to be closed when water depths reach 200mm over the road. To undertake a comparison to floor levels would require survey of all floor levels within the study area. Table A1 shows the maximum water surface levels for the 50 year ARI at points identified in Figure A0 (refer to Appendix A). Flows have been determined at several locations about the catchment. These flows were used in comparing the HBFS and the TFHAS and can be found in Section 4.6. Table 5.1.1 – Overland Results Event Description 2 year ARI Slight floodplain inundation in the lower reaches of Endeavour
and Gorge Creeks. Sheet flow downstream of Gifford Street between Parker and
Swensen Streets. Sheet flow through the park on the corner of Horseshoe Bay
Road and Apjohn Streets. Apjohn Street closed at the Corica Crescent Development and
west of Swensen Street. Inundation of 3 residential properties on Gifford Street to
around 800mm water depth. Inundation of 5 residential properties downstream of Apjohn
Street. Velocities up to 2.5m/s in Beeran Creek East upstream of
Gifford Street. Velocities over 1.5m/s along Corica Crescent
5 year ARI Increased floodplain inundation in the lower reaches of Endeavour and Gorge Creeks.
Inundation of 3 residential properties on Gifford Street to around 800mm water depth.
Inundation of 7 residential properties downstream of Apjohn Street.
Velocities up to 3m/s in Beeran Creek East upstream of Gifford Street.
Velocities over 2m/s along Corica Crescent. Velocities over 1.5m/s on Apjohn Street. Velocities to around 1m/s in the channel between the Sandals
and the Corica Crescent Developments. 10 year ARI Apjohn Street closed at the Corica Crescent Development,
west of Swensen Street, and at the intersection with Horseshoe Bay Road.
Inundation of 3 residential properties on Gifford Street to

HORSESHOE BAY FLOOD REPORT
Page 51 >> 44 741 992 072
around 900mm water depth. Inundation of 14 residential properties downstream of Apjohn
Street. Velocities to around 1.5m/s in the channel between the
Sandals and the Corica Crescent Developments. Velocities more than 1.5m/s over Horseshoe Bay Road at
Apjohn Street. 20 year ARI Floodplain inundation in the lower reaches of Endeavour and
Gorge Creeks causing rural properties in the area to be effected but structures such as houses appear to be unaffected.
Gifford Street closed west of Horseshoe Bay Road. Horseshoe Bay Road closed at the outlet of the Lagoon. Inundation of 3 residential properties on Gifford Street to
around 900mm water depth. Inundation of 21 residential properties downstream of Apjohn
Street. Inundation of 1 rural property on the western end of Pacific
Drive. Velocities over 2m/s on Apjohn Street. Velocities to around 1m/s through properties on the western
side of Horseshoe Bay Road and North of Apjohn Street. Velocities around 2m/s over Horseshoe Bay Road at Apjohn
Street. Velocities more than 1.5m/s over Heath Street Velocities more than 1m/s over Horseshoe Bay Road at the
Lagoon outlet. 50 year ARI Gifford Street closed west of the intersection with Horseshoe
Bay Road. Inundation of 3 residential properties on Gifford Street to
around 900mm water depth. Inundation of 30 residential properties downstream of Apjohn
Street. Velocities up to 4m/s in Beeran Creek East upstream of
Gifford Street. Velocities around 2m/s over Horseshoe Bay Road at Apjohn
Street. 100 year ARI Gifford Street closed at the intersection with Horseshoe Bay
Road. Inundation of 3 residential properties on Gifford Street to
around 900mm water depth. Inundation of 43 residential properties downstream of Apjohn
Street. Inundation of 3 properties on Pacific Drive.
500 year ARI Gifford Street closed at Pirie Street. Pandanus Drive closed. Inundation of 3 residential properties on Gifford Street to
around 1m water depth. Inundation of 66 residential properties downstream of Apjohn
Street. Inundation of 3 rural property on the western end of Pacific
Drive.

HORSESHOE BAY FLOOD REPORT
Page 52 >> 44 741 992 072
Velocities over 2m/s over Horseshoe Bay Road at Apjohn Street.
Velocities more than 2m/s over Heath Street Velocities over 2.5m/s along Corica Crescent. Velocities to around 1.5m/s in the channel between the
Sandals and the Corica Crescent Developments.
PMF Swensen Street closed. 8 rural properties fully inundated in the lower reaches of
Endeavour and Gorge Creeks. Inundation of 3 residential properties on Gifford Street to
around 1.2m water depth. Inundation of 119 residential properties downstream of Apjohn
Street, including every property within the Corica Crescent Development.
Inundation of 19 properties on the eastern side of Pacific Drive.
Velocities over 2.5m/s over Horseshoe Bay Road at Apjohn Street.
Velocities up to 1.5m/s through properties on the western side of Horseshoe Bay Road and North of Apjohn Street.
Velocities more than 2.5m/s over Heath Street Velocities more than 1.5m/s over Horseshoe Bay Road at the
Lagoon outlet. Velocities over 3m/s along Corica Crescent. Velocities to around 2m/s in the channel between the Sandals
and the Corica Crescent Developments. *Note: At the time this study was undertaken, council did not have the information required to determine whether dwellings were inundated along with the inundated properties.

HORSESHOE BAY FLOOD REPORT
Page 53 >> 44 741 992 072
5.2 MIKE URBAN Results
Table 5.2.1 shows discharge results from each pipe in the underground pipe network. Table 5.2.2 shows the surcharge of water from the underground network to overland flow at each stormwater inlet. For each ARI, the maximum discharge for any storm duration has been reported. For reference to Tables 5.2.1 and 5.2.2, Figure 5.2.1 has been included to show the underground network model setup and the locations of the nodes. The pipe network along Gifford Street was shown to have pipe-full flow in the 5 year ARI with some surcharge of pipe flows. This suggests that there is capacity within the Gifford Street Pipes for the 2 year ARI which is the design criteria. The pipe network along Gifford Street has a smaller pipe branch servicing Swensen Street upstream of Gifford Street and the connecting streets. It also has another smaller pipe branch servicing the Wallaby Way Development. Any rainfall that fell within these developed areas was assumed to be taken directly into the Gifford Street pipe network. Detailed drainage modelling is required to confirm the pipe capacity within these smaller branches.
Pipe ID From node To node Size (mm) 2y 5y 10y 20y 50y1 0446D9U 0446D8U 900 1.6 1.9 2.1 2.3 2.62 0446D8U 0446D7U 900 1.6 1.7 1.8 1.9 2.13 0446D7U 0446D6U 900 1.6 1.7 1.8 1.9 2.04 0446D6U 0446D5U 900 1.6 1.7 1.8 1.9 1.95 0446D5U 0446D05U 1500 1.6 1.7 1.7 1.9 1.96 0446D05U 0446D4U 1500 1.5 1.7 1.7 1.9 1.97 0446D4U 0446D04U 1500 1.5 1.6 1.7 1.9 1.98 0446D04U 0446D3U 1500 1.8 2.0 2.1 2.2 2.39 0446D3U 0446D2U 1500 1.8 2.0 2.1 2.2 2.310 0446D2U Outlet 1500 1.8 2.0 2.1 2.2 2.3
Table 5.2.1: MIKE URBAN maximum pipe discharges [m3/s]
Nodes 2y 5y 10y 20y 50y0446D8U 0.0 0.2 0.3 0.4 0.50446D7U 0.0 0.0 0.0 0.0 0.20446D04U 0.0 0.0 0.0 0.0 0.0
Table 5.2.1: MIKE URBAN maximum node surcharge [m3/s]

$
0446D2U 0446D3U0446D4U
0446D5U0446D6U
0446D7U0446D8U
0446D9U
0446D1D0446D05U
0446D04U
34
8
1
6
2
9
5
GIFFORD STREET
SWEN
SEN
STRE
ET
WALLABY WAYSTETAN COURT
BLUEJEEP COURT
LEGEND
Modelled Inlet Pits
MIKE URBAN Manholes$ MIKE URBAN Outlets
MIKE URBAN Links
Figure 5.2.1:Mike Urban setup
SCALE: @1:1,868
40 020
Meters
A3
TOWNSVILLE CITY COUNCILHORSESHOE BAY
STUDY AREA
© Townsville City Council 2010DIGITAL FILE: DRAWN BY: DATE:
Strategic Planning DepartmentPLANNING AND DEVELOPMENT
mxdJAJ
29/09/2011
´

HORSESHOE BAY FLOOD REPORT
Page 55 >> 44 741 992 072
5.3 Road Closures
A number of sections of road within Horseshoe Bay were analysed for closure due to flooding. Roads were considered non trafficable when the water depth exceeded 200mm. Table 5.3.1 shows the level of immunity of some of the more important roads around Horseshoe Bay. Figure 5.3.1 show the locations of the points of closure.
Point number Road Immunity
1 Horseshoe Bay Road at Lagoon outlet 2y2 Heath Street at Horseshoe Bay Road 50y3 Culvert at Apjohn Street Channel 50y4 Apjohn Street at number 53 less than 2y
5Horseshoe Bay Road just south of the intersection with Apjohn Street 5y
6Apjohn Street just east of the intersection with Horseshoe Bay Road 2y
7 Gifford Street at numer 38 10y8 Gifford Street at numer 52 50y
9Horseshoe Bay Road at the crossing with Beeran Creek East Upstream. 100y
10 Apjohn Street at the crossing with Gorge Creek less than 2y
Table 5.3.1: Times of road closure [h:mm]
Apjohn Street at the crossing with Gorge Creek (point number 10 in Table 5.3.1 and Figure 5.3.1) is on the only evacuation route for the low lying area to the west and is the only access to the Sewerage Treatment Plan. An upgrade of Apjohn Street at this crossing would likely be required if residential development occurs on Hollins Street, Pollard Street, and Pacific Drive and Apjohn Street west of the crossing.

5, 5y6, 2y
1, 2y
8, 50y 7, 10y
4, <2y
2, 50y
3, 50y
9, 100y
10, <2y
GIFFORD STREET
PACIFIC DRIVE
APJOHN STREET
HORSESHOE BAY ROAD
PARKER STREET
SWENSEN STREET
LANEWAY
HOLL
INS ST
REET
HENRY LAWSON STREET
SOMERSET STREET
CORI
CA C
RESC
ENT
SAND
ALS B
OULE
VARD
WALLABY WAY
DOLP
HIN
COUR
T
PANDANUS DRIVE
BAYSIDE COURT
YORK COURT
SOMERSET COURT
OLIVIA COURT
RINTOUL COURT
TIRAM
ULA C
OURT
APJOHN STREET
PACIFIC DRIVE
LEGEND
Road Closure Points, Flood Immunity
Road Centre Line
Figure 5.3.1:Road Closure Points
SCALE: @1:7,500
240 0120
Meters
A3
TOWNSVILLE CITY COUNCILHORSESHOE BAY
STUDY AREA
© Townsville City Council 2010DIGITAL FILE: DRAWN BY: DATE:
Strategic Planning DepartmentPLANNING AND DEVELOPMENT
mxdJAJ
23/06/2011
´

HORSESHOE BAY FLOOD REPORT
Page 57 >> 44 741 992 072
5.4 Flood Plain Hazard
The safety of people and potential for damage to property is dependent on both the depth of inundation and the velocity of the flood waters. Floodwaters that flow deep and swift are obviously more hazardous than those flows that are shallow and slow. The degree of hazard varies across the floodplain in response to:
flood severity; floodwater depth and velocity; rate of rise of floodwater; duration of flooding; evacuation capacity; population at risk; land-use; flood awareness; and warning time.
To assist with floodplain management it is necessary to determine the hazard and ensure land uses are suitably aligned. Floodplain Management in Australia: Best practices and principles (CSIRO, 2000) identifies four degrees of hazard:
Low – no significant evacuation problems; children and elderly could wade to safety with little difficulty; maximum flood depths and velocities along evacuation routes are low; evacuation distances are short; evacuation is possible by sedan-type motor vehicle; There is ample time for flood forecasting, flood warning and evacuation; evacuation routes remain trafficable for at least twice as long as the time required for evacuation.
Medium – Fit adults can wade to safety, but children and the elderly may difficulty; evacuation routes are longer; maximum flood depths and velocities are greater; evacuation by sedan type motor vehicle is possible in the early stages of flooding, after which 4WD vehicles or trucks are required; evacuation routes remain trafficable for at least 1.5 times as long as the necessary evacuation time.
High – fit adults have difficulty wading to safety; wading evacuation routes are longer again; maximum flood depths and velocities are greater (up 1.0 m and 1.5 m/s respectively); motor vehicle evacuation is possible only by 4WD vehicles or trucks in the early stages of flooding; boats and helicopters may be required; evacuation routes remain trafficable only up to the minimum evacuation time.
Extreme – boats or helicopters are required for evacuation; wading is not an option because of the rate of rise and/or the depth and velocity of the floodwaters; maximum flood depths and velocities are over 1.0 m and 1.5 m/s respectively.
Prior to detailed assessment of floodplain hazard based on all the factors influencing hazard, preliminary assessment is often undertaken based on flood depth and velocity. Figure 5.4.1 provides the basis for defining hazard as a function of depth and velocity

HORSESHOE BAY FLOOD REPORT
Page 58 >> 44 741 992 072
as provided in Floodplain Management in Australia: Best practices and principles (CSIRO, 2000). Flood Hazard Maps have been generated for the Horseshoe Bay study area based on 100 Year, 500 Year, and PMF model results. These Flood Hazard Maps are shown in Figure 5.4.2 to Figure 5.4.4. The Flood Hazard Map is a preliminary assessment, only considering water depth and velocity. Because the critical storm duration for Horseshoe Bay is generally in the order of 1 to 4.5 hours, warning time for evacuation is low which could lead to higher hazards than those shown on the Flood Hazard Maps.
Figure 5.4.1: Hazard Classification of Flood Waters

HORSESHOE BAY FLOOD REPORT
Page 59 >> 44 741 992 072
As Figures 5.4.2 to 5.4.4 show, there are some areas where the higher levels of hazard affect residence. These areas, and the resulting effects, are detailed below for only 100 year, 500 year, and PMF events. The Corica Crescent Development
Corrica Crescent is an extreme hazard in the 100 year, 500 year, and PMF storms.
In the 100 year storm, there is a mixture of medium and high hazard areas throughout properties in the Corrica Development
In the PMF, all properties in the Corrica Development have areas of extreme hazard.
The intersection of Apjohn Street and Horseshoe Bay Road
The intersection of Apjohn Street is an area of extreme hazard for 100 year to PMF events.
Horseshoe Bay Road has an extreme level of hazard along 380m of the road across the intersection for the PMF, and 290m for the Q100.
Apjohn Street has an extreme level of hazard along 520m of road for the PMF and 360m for the Q100.
Apjohn Street has an extreme level of hazard from Horseshoe Bay Road to Corica Crescent for Q100 events and above.
The Sandals Development
Pandanus Drive, Tiramula Court, and Sandals Boulevard have areas of medium and high hazard for the 100 year event and areas of extreme hazard from the PMF.

LEGEND
Hazard LevelNo Hazard
Low Hazard
Medium Hazard
High Hazard
Extreme Hazard
Figure 5.4.2:100 Hazard Map
SCALE: @1:10,000
280 0140
Meters
A3
TOWNSVILLE CITY COUNCILHORSESHOE BAY
STUDY AREA
© Townsville City Council 2010DIGITAL FILE: DRAWN BY: DATE:
Strategic Planning DepartmentPLANNING AND DEVELOPMENT
mxdJAJ
25/10/2011
´

LEGEND
Hazard LevelNo Hazard
Low Hazard
Medium Hazard
High Hazard
Extreme Hazard
Figure 5.4.3:500y Hazard Map
SCALE: @1:10,000
280 0140
Meters
A3
TOWNSVILLE CITY COUNCILHORSESHOE BAY
STUDY AREA
© Townsville City Council 2010DIGITAL FILE: DRAWN BY: DATE:
Strategic Planning DepartmentPLANNING AND DEVELOPMENT
mxdJAJ
25/10/2011
´

LEGEND
Hazard LevelNo Hazard
Low Hazard
Medium Hazard
High Hazard
Extreme Hazard
Figure 5.4.4:PMF Hazard Map
SCALE: @1:10,000
280 0140
Meters
A3
TOWNSVILLE CITY COUNCILHORSESHOE BAY
STUDY AREA
© Townsville City Council 2010DIGITAL FILE: DRAWN BY: DATE:
Strategic Planning DepartmentPLANNING AND DEVELOPMENT
mxdJAJ
25/10/2011
´

HORSESHOE BAY FLOOD REPORT
Page 63 >> 44 741 992 072
5.5 Problem Flooding Areas
Several problem Flooding areas exist in Horseshoe Bay with flooding to properties in
the study area. The sections below give details to the problems.
As there are a lot of existing flooding problems within Horseshoe Bay and so many
constraints already exist in the area, all development applications should be assessed
on their impact on council’s ability to complete potential mitigation works within
Horseshoe Bay. It is recommended that mitigation options be assessed under an
overall scheme for the study area. It is also recommended that mitigation measures do
not hinder the recharge of the underground aquifer system, and take into consideration
the geomorphic processes within the catchment.
Gifford Street
A small area upstream of Gifford Street at number 40 is a trap low point for flood water.
3 houses are regularly inundated for long periods of time. Chapter 5.7 explores this
issue and a recent culvert upgrade in this location.
Apjohn Street
Apjohn Street is another area prone to flooding problems. Water crosses Apjohn Street
between the Sandals Development and Horseshoe Bay Road. Most of the water that
crosses Apjohn Street comes from Beeran Creek West, but some also comes from
Beeran Creek East upstream of Gifford Street via the park (see Figure 1.2.2 for
reference). This water floods many properties within the Corica Crescent Development
and on Apjohn Street, and closes the road to traffic (see Table 5.1.1 for details).
Corica Crescent Development
Much of the water crossing Apjohn Street, as mentioned above, ends up in the Corica
Crescent Development. All the properties within the Corica Crescent Development are
at least partially inundated in the 50 year ARI event and many are fully inundated at
more frequent events. See Table 5.1.1 for details.
The Lagoon
The Lagoon is another area that is a problem for flooding in Horseshoe Bay. The
culvert that drains the lagoon through Horseshoe Bay Road cannot cope with a 5 year
ARI storm and water overtops the road. Almost 20 residential properties are unable to
evacuate when Horseshoe Bay Road is closed at the Lagoon outlet. The Lagoon is
also an environmentally sensitive area and many species of wild life rely on it for year-
round supply of fresh water.
A potential problem also exists with the recharge of the aquifer which maintains the
Lagoon’s fresh water. Any development should stay clear of aquifer recharge zone
(see Figure 5.8.1) and not divert major drainage paths away from the Lagoon.

HORSESHOE BAY FLOOD REPORT
Page 64 >> 44 741 992 072
Beeran Creek East upstream of Gifford Street
The Beeran Creek East channel upstream of Gifford Street that runs behind properties on the eastern side of Horseshoe Bay Road has problems with erosion. The banks of the channel are eroding towards existing properties. Rock gabion structures have been installed to protect the properties but the issue still exists. The sediment that is washed out of this area of Beeran Creek East is causing problem in downstream areas as detailed below. Figure 5.5.1 shows an example of the source of the sediment problems.
Figure 5.5.1: Beeran Creek East upstream of Gifford Street showing an exposed pipe due to extensive washout within the channel. Figures 5.5.2 and 5.5.3 show the sediment being deposited in the culvert on Gifford Street and in the park just downstream. The sediment is also being deposited along Apjohn Street as Figures 5.5.4 and 5.5.5 show.

HORSESHOE BAY FLOOD REPORT
Page 65 >> 44 741 992 072
Figure 5.5.2: Sediment in the culvert under Gifford Street where Beeran Creek East discharges into the park.
Figure 5.5.3: Sediment in the park just downstream of the culvert under Gifford Street, viewed from Gifford Street.

HORSESHOE BAY FLOOD REPORT
Page 66 >> 44 741 992 072
Figure 5.5.4: Sediment beside Apjohn Street in the park viewed from Horseshoe Bay Road.
Figure 5.5.5: Sediment on Apjohn Street viewed from number 39 Apjohn Street.
HORSESHOE BAY FLOOD REPORT
Page 67 >> 44 741 992 072
As flows continue downstream, sediment is then deposited in the channel between the Sandals Development and the Corica Crescent Development, and finally in the Lagoon. This sediment is detrimental to the heath of the ecosystem of the lagoon which is an important environmental feature of Horseshoe Bay as outlined in the HBDMP. Removal of sediment from roads, properties, and the Lagoon is also quite costly.
HORSESHOE BAY FLOOD REPORT
Page 68 >> 44 741 992 072
5.6 Emergency Management Consideration
Because the critical storm duration for Horseshoe Bay is 1 to 1.5 hours for most
locations, the flood warning time is too short to effectively implement pre-emptive
emergency management measures. Council may be able to get some idea of an
imminent flood from severe weather warnings of heavy rainfall issued by BoM.
In the event that Horseshoe Bay residence need to evacuate prior to or during an
event, it is likely that most will need to leave Horseshoe Bay. The recreation centre in
the park on the corner of Horseshoe Bay Road and Apjohn Street is the only Major
Evacuation Centre in Horseshoe Bay however it is a post-impact evacuation centre and
is not proposed to be used during flood events. At 500 year ARI storm events flood
waters extend to the recreation centre. If flood levels overtop floor levels, this may
render the recreation centre unusable as a post-impact evacuation centre. A survey of
club house floor levels is required to determine the immunity of the structure.
The Horseshoe Bay Sewerage Treatment Plant is located on the corner of Apjohn
Street and Pollard Street. While the treatment facility is immune to the Probable
Maximum Flood, access to the facility is limited by the Apjohn Street crossing of Gorge
Creek which closes for less than 2 year ARI storm events.
As well as mitigation works to solve property flooding issues, evacuation routes will
need to be considered in a mitigation scheme. It is recommended that the results of
this flood study be used to update council’s Disaster Management mapping layers and
Evacuation Plan.
Based on Registration as at October 2011, there were 15 properties in Horseshoe Bay
then known to Council where there are elderly people that may require assistance to
evacuate. The numbers of residence affected by frequent road closures are given
below:
• Apjohn Street at the crossing of Gorge Creek closes at under a 2 year ARI
storm event. 1 senior resident is affected by this closure.
• The Corica Crescent Development and Apjohn Street west of Horseshoe Bay
Road are particularly flood prone and Apjohn Street closes at less than a 2 year
ARI storm event. 3 senior residents are affected by this closure;
• The intersection of Horseshoe Bay Road and Apjohn Street closes at less than
a 10 year ARI storm event. 4 senior residents are affected by this closure.
• Gifford Street closes west of Horseshoe Bay Road at less than a 10 year ARI
storm event. 2 senior residents are affected by this closure.
For more information on road closures, see Section 5.3.

HORSESHOE BAY FLOOD REPORT
Page 69 >> 44 741 992 072
5.7 Gifford Street Culvert
In mid 2011, the culvert adjacent to number 40 Gifford Street was upgraded. In the prior wet season, the road and the existing 450mm diameter pipe were damaged. The road was repaired and the structure was upgraded to two 1200mm x 600mm box culverts. The area upstream of the road is a trap low point where ponded water affects the properties of numbers 38, 40, and 42. To test the efficiency of the new culvert, a pre-2009 scenario model was run with results showing that in the 50 Year ARI, water depths got to over a metre and took an excessive period to drain. The culvert under Gifford Street at number 40 is the only way to drain the area. The recently constructed culvert upgrade was modelled in the base case scenario representing conditions in 2011. The model results show an improvement in localised flooding due to the installation of the culvert. The benefits were demonstrated for durations of 1 hour and 4.5 hours for the 50 year ARI storm event, and the 1 hour duration for the 2 year ARI storm event. A summary of the benefits for the events investigated is given below:
50 year, 1 hour storm shows maximum water depths reductions of 70mm. 50 year, 1 hour storm shows a reduced time of inundation of 2 hours. 50 year, 4.5 hour storm shows a reduced time of inundation of 3 hours. 2 year, 1 hour storm showing maximum water depth reductions of over 400mm. 2 year, 1 hour storm shows a reduced time of inundation of 2 hours and 30
minutes; from 3 hours down to 30 minutes. Figure 5.7.1 shows the difference in flood levels as a result of the works for the 50 year ARI, 1 hour duration storm which was critical for most of the surrounding area. This map shows that the construction has decreased flood levels upstream of the works by generally up to 50mm. Immediately downstream of the works, flood levels increased up to 50mm in the immediate vicinity of the culvert. Figure 5.7.2 shows the difference in flood levels as a result of the works for the 2 year ARI, 1 hour duration storm. For the 2 year storm, the average reduction of levels upstream of Gifford Street is almost 300mm. Figure 5.7.3 shows a water depth time series plot for before and after the culvert construction at a point just upstream of the culvert for the 2 year ARI. A water depth of 200mm was chosen as a point of comparison as this provides a high level of confidence in the model results. This plot demonstrates that the time of inundation has been reduced from approximately 3 hours, to approximately 30 minutes. Chapter 5.8 explores the options required for further flood mitigation of this area.

GIFFORD STREETHORSESHOE BAY ROAD
LANEWAY
SOMERSET STREET43
113
29
59
54
64
3
5
9
7
94
92
96
98
90
91
97
95
99
93
34
46
3240
52 5044
3842
3036
48
11
17
19
13
15
24
110
102
100
104
108
101
105
103
107 21112
LEGEND
Water Level Difference [m]
< -1
-1 - -0.5
-0.5 - -0.3
-0.3 - -0.1
-0.1 - -0.05
-0.05 - -0.01
-0.01 - 0.01
0.01 - 0.05
0.05 - 0.1
0.1 - 0.3
0.3 - 0.5
0.5 - 1
> 3
Figure 5.7.1: Impact of the culvert at No. 40 Gifford
Street on the 50 year storm
SCALE: @1:1,500
40 020
Meters
A3
TOWNSVILLE CITY COUNCILHORSESHOE BAY
STUDY AREA
© Townsville City Council 2010DIGITAL FILE: DRAWN BY: DATE:
Strategic Planning DepartmentPLANNING AND DEVELOPMENT
mxdJAJ
23/10/2011
´

GIFFORD STREETHORSESHOE BAY ROAD
LANEWAY
SOMERSET STREET43
113
29
59
54
64
3
5
9
7
94
92
96
98
90
91
97
95
99
93
34
46
3240
52 5044
3842
3036
48
11
17
19
13
15
24
110
102
100
104
108
101
105
103
107 21112
LEGEND
Water Level Difference [m]< -1
-1 - -0.5
-0.5 - -0.3
-0.3 - -0.1
-0.1 - -0.05
-0.05 - -0.01
-0.01 - 0.01
0.01 - 0.05
0.05 - 0.1
0.1 - 0.3
0.3 - 0.5
0.5 - 1
> 3
New Culvert Flooding Extent
Figure 5.7.2: Impact of the culvert at No. 40 Gifford
Street on the 2 year storm
SCALE: @1:1,500
40 020
Meters
A3
TOWNSVILLE CITY COUNCILHORSESHOE BAY
STUDY AREA
© Townsville City Council 2010DIGITAL FILE: DRAWN BY: DATE:
Strategic Planning DepartmentPLANNING AND DEVELOPMENT
mxdJAJ
23/10/2011
´

Figure 5.7.3: Time Series at No. 40 Gifford Street, 2 year 1 hour event
12.9
13
13.1
13.2
13.3
13.4
13.5
13.6
13.7
13.8
13.9
14
12:00:00 AM 1:00:00 AM 2:00:00 AM 3:00:00 AM 4:00:00 AM
Time
Wate
r D
ep
th [
m]
2009
2011
3 hours 2 minutes with
depth above 0.2m
32 minutes with
depth above 0.2m

HORSESHOE BAY FLOOD REPORT
Page 73 >> 44 741 992 072
5.8 Potential Mitigation Constraints
The following constraints limit the ability to provided any potential mitigations options.
Aquifer
Figure 5.8.1 is an extract from the Horseshoe Bay Drainage Management Plan
(HBDMP) that shows the groundwater recharge / emergent zones within Horseshoe
Bay. As the HBDMP highlights the importance of the aquifer on the ecosystem of
Horseshoe Bay, flood mitigation works must not divert flow away from recharge zones.
It may be that flood mitigation solutions that assist aquifer recharge, like detention
basins, may be desirable. These details are beyond the scope of this study, and more
investigation is required
Gifford Street
Any flood mitigation works completed for Gifford Street would likely impact on flood
levels downstream at Apjohn Street and the Corica Crescent Development. The
hydraulic model should be used to evaluate any future mitigation options, including all
areas both upstream and downstream of the works.
Apjohn Street
Any mitigation works completed for Apjohn Street could have the potential to negatively
impact downstream areas. As Apjohn Street is affected by sediment from Beeran
Creek East, council would need to undertake a detailed geomorphic assessment to
gain a proper understanding of the issues and ensure sediment issues are addressed
as part of any flood mitigation concept. The hydraulic model should be used to
evaluate any future mitigation options, including all areas upstream and downstream of
the works.
Corica Crescent Development
As the flood problems within the Corica Crescent Development are from the same
flows that cause the problems on Apjohn Street, the mitigation options identified for
Apjohn Street could also address the flooding issues within the Corica Crescent
Development.
Beeran Creek East upstream of Gifford Street.
Access and space to the area is limited as the channel is in close proximity to the
properties. To gain a better understanding of the issues in Beeran Creek East
upstream of Gifford Street, council would need to undertake a detailed geomorphic
assessment. Hydraulic modelling of the each proposed option would be required to
determine the most appropriate solution. The model would need to include the whole
Beeran Creek catchment as so many areas are affected by flood waters from Beeran
Creek East upstream of Gifford Street.


HORSESHOE BAY FLOOD REPORT
Page 78 >> 44 741 992 072
6.0 Climate Change
An evaluation of the potential impact of climate change on flooding has been undertaken. The sea-level rise specified within the Queensland Coastal Plan of 0.8m to allow for conditions in 2100 was adopted. This value was adopted from advice from the IPCC Fourth Assessment Report: Climate Change (2007). The Climate Change Risks to Australia’s Coast – A First Pass National Assessment Report, completed by the Department of Climate Change and Energy Efficiency, also outlines projected sea level rise values taking into account more recent studies. It gives a high end scenario prediction of a 1.1m sea-level rise by 2100 which it states is justified for decision-making. Predictions on changes to ARI storm intensities have been made based only on the analysis of 24 and 72 hour storm durations. At this point there is no conclusive assessment to indicate that these values are relevant for shorter duration storms like those critical in Horseshoe Bay. It is on this basis that only a sea level rise has been modelled in the evaluation for climate change for the present study. To assess the potential impact of sea-level rise on Horseshoe Bay flooding, the tailwater level of the flood model was updated to include both the 0.8 and the 1.1m sea level rise values. The impacts of climate change on ARIs 2, 50 and 100 years have been evaluated for a 0.8m sea-level rise and on ARIs 50 and 100 for a 1.1m sea-level rise. Appendix C contains maps showing the difference between the base case scenario and the climate change scenario for each ARI. The analysis shows that a sea level rise due to climate change, has a greater effect at more frequent durations, and that it is the lower reaches that are most affected. The areas that exhibit water level changes due to climate change are the Lagoon, the outlet of Endeavour and Gorge Creeks, and the swale behind the primary sand dune. 2 properties on Henry Lawson Street, 11 properties on Pacific Drive, 5 properties within the Corica Crescent Development, and 11 properties with the Sandals Development are affected by increased flood levels due to sea-level rise.

HORSESHOE BAY FLOOD REPORT
Page 79 >> 44 741 992 072
7.0 Conclusion
The Horseshoe Bay Flood Study – Baseline Flooding Assessment is part of the City
Wide Flood Constraints project being completed by Townsville City Council. This report
details the model setup and the conclusions on existing conditions.
The hydrologic XP-RAFTS model and the hydraulic MIKE FLOOD model were set up
using various data sources available to council. The models were verified to the
rational method, the TFHAS and various other hand calculations. The verified models
were run to simulate the 2 year, 5 year, 10 year, 20 year, 50 year, 100 year, 500 year
ARI floods, and the PMF. For each ARI, the storm durations modelled were 30
minutes, 45 minutes, 1 hour, 2 hours, 3 hours, 4.5 hours, 6 hours, 9 hours, 12 hours,
18 hours, and 24 hours.
The results of the model were used to generate flood maps of water depth, flood level,
and flow velocities. Along with the overland flow results, underground pipe network
results were reported. Details of the main existing problem areas were also identified to
be;
• the trap low point just upstream of Gifford Street at number 40;
• Apjohn Street between Horseshoe Bay Road and the Sandals Development;
• the Corica Crescent Development;
• Beeran Creek East upstream of Gifford Street; and
• the lagoon at the outlet at Horseshoe Bay Road.
Horseshoe Bay also has sediment problems at various locations about the study area
which all seem to arise from Beeran Creek East upstream of Gifford Street.
Potential mitigation options were also given for the areas mentioned above, but it is
recommended that the mitigation be assessed under an overall scheme for the study
area. It is also recommended that mitigation measures do not hinder the recharge of
the underground aquifer system, and should take into consideration the Geomorphic
processes within the catchment. All development applications should be assessed on
their impact on council’s ability to complete potential mitigation works within Horseshoe
Bay.
An analysis of road closures was undertaken identifying points along Apjohn Street and
Horseshoe Bay Road as having an immunity equal to or less than a 2 year ARI storm.
Apjohn Street west of Horseshoe Bay Road is the only existing evacuation route for the
Corica and Sandals Developments and evacuation from these developments is quite
difficult in any flood equal to or greater than the 2 year ARI. Apjohn Street at the
crossing of Gorge Creek is part of the evacuation route for the low lying area to the
west and has a flood immunity less than 2 years. An upgrade of Apjohn Street at this
crossing would likely be required if residential development occurs on Hollins Street,
Pollard Street, and Pacific Drive and Apjohn Street west of the crossing.
As detailed in the Emergency Management Considerations chapter, the Sewage
Treatment Plant on the corner of Apjohn Street and Pollard Street is immune to the
Probable Maximum Flood, but inaccessible in less than 2 year ARI storm events. The
recreation centre in the park on the corner of Horseshoe Bay Road and Apjohn Street
is the only Major Evacuation Centre in Horseshoe Bay however it is a post-impact
evacuation centre and is not proposed to be used during flood events. It is likely that
only storm events greater than 500 year ARI will cause damages to the centre
potentially prevent its use as a post impact evacuation centre.

HORSESHOE BAY FLOOD REPORT
Page 80 >> 44 741 992 072
A flood plain hazard analysis of the catchment was undertaken for the 100 Year, 500 Year, and PMF ARIs. This analysis classified each area of the catchment with a hazard ranging from none to extreme. The particularly hazardous areas are:
Apjohn Street including the intersection of Apjohn Street and Horseshoe Bay Road.
The Corica Crescent Development. The Sandals Development.
The recent construction works at number 40 Gifford Street have been analysed using the hydraulic model. A summary of the benefits for the events investigated is given below:
50 year, 1 hour storm shows maximum water depths reductions of 70mm. 50 year, 1 hour storm shows a reduced time of inundation of 2 hours. 50 year, 4.5 hour storm shows a reduced time of inundation of 3 hours. 2 year, 1 hour storm showing maximum water depth reductions of over 400mm. 2 year, 1 hour storm shows a reduced time of inundation of 2 hours and 30
minutes; from 3 hours down to 30 minutes. The analysis of the effects of a sea level rise due to climate change was completed on the study area. A sea level rise was shown to have a greatest effect on more frequent events in low lying areas. 2 properties on Henry Lawson Street, 11 properties on Pacific Drive, 5 properties within the Corica Crescent Development, and 11 properties with the Sandals Development are affected by increased flood levels due to sea-level rise.

HORSESHOE BAY FLOOD REPORT
Page 81 >> 44 741 992 072
8.0 References
AECOM, (2010) Bohle Plains Flood Planning Report, Report prepared for Townsville City Council Bureau of Meteorology, (2003) Guidebook to the Estimation of Probable Maximum Precipitation: Generalised Tropical Storm Method, Report prepared by hydrometeorological advisory service and Re-issued in September 2005 CSIRO, (2000) Floodplain Management in Australia: Best practices and principles, Report 73 for SCARM Department of Climate Change, (2009) Climate Change Risks to Australia’s Coast, A First Pass National Assessment Department Environmental Resources Management, (second edition 2008) Queensland Urban Drainage Manual Department of Infrastructure, Planning and Natural Resources NSW, (2005) Floodplain Development Manual DHI Software, (2009) MIKE FLOOD 1D-2D Modelling User Manual, for MIKE FLOOD 2009 Engineers Australian (1998) Australian Rainfall and Runoff – Volume 1 Engineers Australian (1987) Australian Rainfall and Runoff – Volume 2 Hennessy, K., Webb, L., Ricketts, J., & Macadam, I., (2008) Climate Change Projections for the Townsville Region, Report prepared by CSIRO for Townsville City Council Hore, D., (2011) Horseshoe Bay Drainage Improvements Report Flanagan Consulting Group, (2007) Horseshoe Bay Drainage Management Plan, Phase 1, Report prepared for Townsville City Council Flanagan Consulting Group, (2008) Horseshoe Bay Drainage Management Plan, Phase 2, Report prepared for Townsville City Council Intergovernmental Panel on Climate Change, (2007) Fourth Assessment Report: Climate Change 2007 Kelso Inundation Modelling Investigation, Revision A July 2006 Maunsell, (2005a) Townsville Flood Hazard Assessment Study, Phase 2 – Volume 1, Report prepared for Townsville City Council Maunsell, (2005b) Townsville Flood Hazard Assessment Study, Phase 2 – Volume 2, Report prepared for Townsville City Council Maunsell, (2005c) Townsville Flood Hazard Assessment Study, Phase 3, Report prepared for Townsville City Council
HORSESHOE BAY FLOOD REPORT
Page 82 >> 44 741 992 072
XP-SOFTWARE, (2009) XP-RAFTS Urban & Rural Runoff Routing Software – Reference Manual for XP RAFTS 2009
Bureau of Meteorology, (2011) Welcome to the IFD Program, May-2011,
http://www.bom.gov.au/hydro/has/cdirswebx/cdirswebx.shtml

HORSESHOE BAY FLOOD REPORT
Page 83 >> 44 741 992 072
Appendix A
Flood Maps
Title Figure Name Page Results Points Figure A0 84 Comparison of Results Points (50 year ARI) Table A1 85 Flood Envelope 2y Water Depth Figure A1 86 Flood Envelope 5y Water Depth Figure A2 87 Flood Envelope 10y Water Depth Figure A3 88 Flood Envelope 20y Water Depth Figure A4 89 Flood Envelope 50y Water Depth Figure A5 90 Flood Envelope 100y Water Depth Figure A6 91 Flood Envelope 500y Water Depth Figure A7 92 Flood Envelope PMF Water Depth Figure A8 93 Flood Envelope 2y Water Level Figure A9 94 Flood Envelope 5y Water Level Figure A10 95 Flood Envelope 10y Water Level Figure A11 96 Flood Envelope 20y Water Level Figure A12 97 Flood Envelope 50y Water Level Figure A13 98 Flood Envelope 100y Water Level Figure A14 99 Flood Envelope 500y Water Level Figure A15 100 Flood Envelope PMF Water Level Figure A16 101 Velocity Envelope 2y Figure A17 102 Velocity Envelope 5y Figure A18 103 Velocity Envelope 10y Figure A19 104 Velocity Envelope 20y Figure A20 105 Velocity Envelope 50y Figure A21 106 Velocity Envelope 100y Figure A22 107 Velocity Envelope 500y Figure A23 108 Velocity Envelope PMF Figure A24 109

8
5
6
9
7
43
2
1
17
20
19
18
16 15
14 1312
1110
LEGEND
Model Result Points
1D Branch
Pipe Network
Figure A0:Results Points
SCALE: @1:10,000
280 0140
Meters
A3
TOWNSVILLE CITY COUNCILHORSESHOE BAY
STUDY AREA
© Townsville City Council 2010DIGITAL FILE: DRAWN BY: DATE:
Strategic Planning DepartmentPLANNING AND DEVELOPMENT
mxdJAJ
19/09/2011
´

Points X Y 0.5 0.75 1 1.5 2 3 4.5 6 9 12 18 24 Max Critical Duration
1 520 324 - - - 3.19 3.29 3.38 3.39 3.39 3.36 3.33 3.33 3.35 3.39 4.50
2 528 304 - 3.13 3.26 3.36 3.42 3.47 3.47 3.47 3.45 3.43 3.43 3.44 3.47 4.50
3 547 278 4.66 4.67 4.69 4.69 4.68 4.67 4.66 4.66 4.66 4.65 4.63 4.67 4.69 1.50
4 482 265 2.92 3.17 3.33 3.46 3.52 3.55 3.56 3.55 3.54 3.54 3.52 3.53 3.56 4.50
5 492 257 3.73 3.76 3.78 3.78 3.77 3.76 3.75 3.75 3.75 3.73 3.72 3.74 3.78 1.00
6 453 242 - - 3.33 3.46 3.52 3.55 3.56 3.55 3.54 3.54 3.52 3.53 3.56 4.50
7 482 225 4.32 4.41 4.51 4.55 4.54 4.50 4.44 4.41 4.43 4.41 4.39 4.50 4.55 1.50
8 491 203 6.89 6.92 6.94 6.94 6.93 6.91 6.89 6.89 6.89 6.88 6.85 6.87 6.94 1.00
9 480 185 7.71 7.74 7.79 7.80 7.80 7.78 7.75 7.74 7.75 7.74 7.73 7.79 7.80 1.50
10 507 188 8.68 8.71 8.74 8.73 8.72 8.70 8.68 8.68 8.67 8.66 8.64 8.65 8.74 1.00
11 558 193 12.02 12.07 12.08 12.08 12.07 12.07 12.05 12.05 12.04 12.03 12.00 12.03 12.08 1.00
12 599 143 18.01 18.08 18.12 18.12 18.10 18.09 18.05 18.06 18.06 18.01 17.98 18.04 18.12 1.50
13 533 131 13.99 14.01 14.02 14.02 14.01 14.00 13.99 13.98 13.97 13.97 13.95 13.96 14.02 1.00
14 498 128 13.78 14.27 14.49 14.51 14.50 14.47 14.35 14.25 14.36 14.17 14.06 14.47 14.51 1.50
15 390 176 7.09 7.09 7.09 7.09 7.09 7.09 7.09 7.09 7.09 7.08 7.07 7.09 7.09 1.00
16 336 172 7.19 7.22 7.24 7.24 7.23 7.22 7.20 7.20 7.19 7.18 7.15 7.17 7.24 1.00
17 321 114 12.28 12.27 12.29 12.28 12.27 12.26 12.27 12.27 12.26 12.27 12.25 12.25 12.29 1.00
18 255 194 7.05 7.35 7.49 7.53 7.49 7.45 7.36 7.34 7.38 7.21 7.14 7.40 7.53 1.50
19 179 288 2.73 2.92 3.08 3.17 3.17 3.14 3.04 2.97 3.00 2.98 2.92 3.14 3.17 1.50
20 107 348 3.64 4.00 4.18 4.22 4.20 4.15 4.03 3.99 4.04 3.89 3.79 4.14 4.22 1.50
- implies that the point was not inundated
Table A1: Maximum water levels and critical durations for base case 2011, 50 year ARI
Duration Water Level [m]

LEGEND
Flooding Depth [m]
0.01 - 0.3
0.3 - 0.5
0.5 - 0.75
0.75 - 1
1 - 1.5
1.5 - 2
2 - 3
3 - 25
Figure A1: 2y Flood Envelope
SCALE: @1:10,000
300 0150
Meters
A3
TOWNSVILLE CITY COUNCILHORSESHOE BAY
STUDY AREA
© Townsville City Council 2010DIGITAL FILE: DRAWN BY: DATE:
Strategic Planning DepartmentPLANNING AND DEVELOPMENT
mxdJAJ
4/10/2011
´

LEGEND
Flooding Depth [m]
0.01 - 0.3
0.3 - 0.5
0.5 - 0.75
0.75 - 1
1 - 1.5
1.5 - 2
2 - 3
3 - 25
Figure A2: 5y Flood Envelope
SCALE: @1:10,000
300 0150
Meters
A3
TOWNSVILLE CITY COUNCILHORSESHOE BAY
STUDY AREA
© Townsville City Council 2010DIGITAL FILE: DRAWN BY: DATE:
Strategic Planning DepartmentPLANNING AND DEVELOPMENT
mxdJAJ
4/10/2011
´

LEGEND
Flooding Depth [m]
0.01 - 0.3
0.3 - 0.5
0.5 - 0.75
0.75 - 1
1 - 1.5
1.5 - 2
2 - 3
3 - 25
Figure A3:10y Flood Envelope
SCALE: @1:10,000
300 0150
Meters
A3
TOWNSVILLE CITY COUNCILHORSESHOE BAY
STUDY AREA
© Townsville City Council 2010DIGITAL FILE: DRAWN BY: DATE:
Strategic Planning DepartmentPLANNING AND DEVELOPMENT
mxdJAJ
4/10/2011
´

LEGEND
Flooding Depth [m]
0.01 - 0.3
0.3 - 0.5
0.5 - 0.75
0.75 - 1
1 - 1.5
1.5 - 2
2 - 3
3 - 25
Figure A4:20y Flood Envelope
SCALE: @1:10,000
300 0150
Meters
A3
TOWNSVILLE CITY COUNCILHORSESHOE BAY
STUDY AREA
© Townsville City Council 2010DIGITAL FILE: DRAWN BY: DATE:
Strategic Planning DepartmentPLANNING AND DEVELOPMENT
mxdJAJ
4/10/2011
´
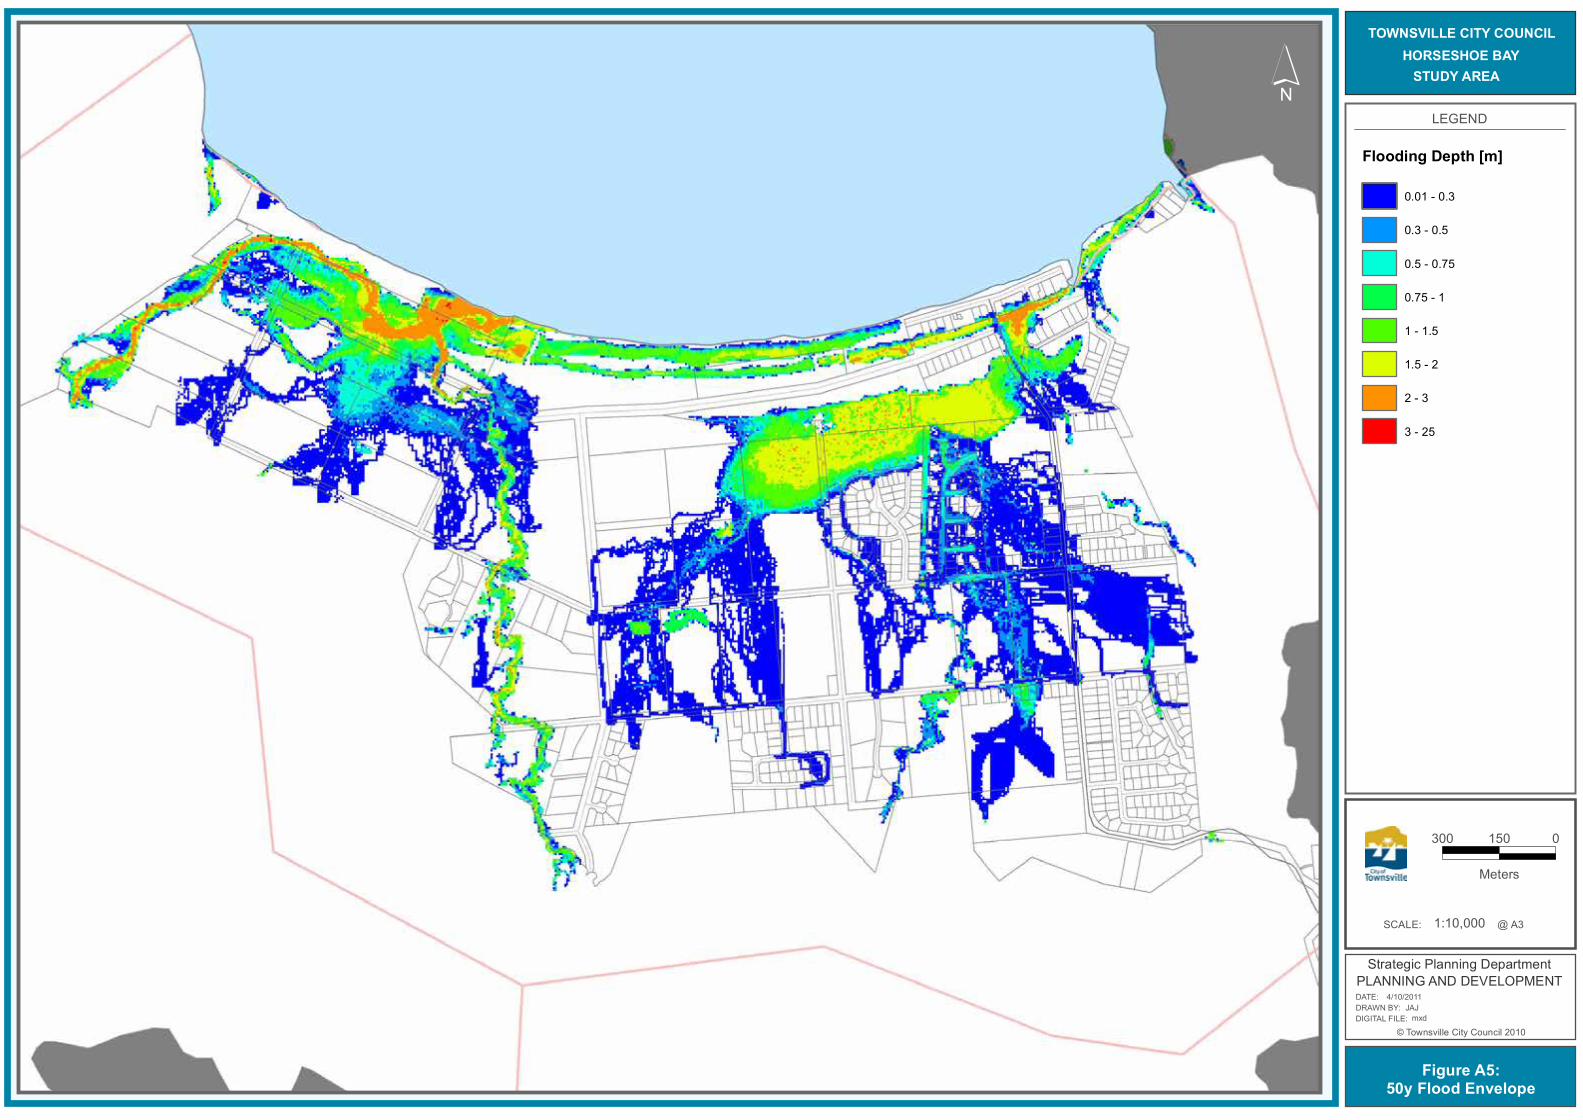
LEGEND
Flooding Depth [m]
0.01 - 0.3
0.3 - 0.5
0.5 - 0.75
0.75 - 1
1 - 1.5
1.5 - 2
2 - 3
3 - 25
Figure A5:50y Flood Envelope
SCALE: @1:10,000
300 0150
Meters
A3
TOWNSVILLE CITY COUNCILHORSESHOE BAY
STUDY AREA
© Townsville City Council 2010DIGITAL FILE: DRAWN BY: DATE:
Strategic Planning DepartmentPLANNING AND DEVELOPMENT
mxdJAJ
4/10/2011
´

LEGEND
Flooding Depth [m]
0.01 - 0.3
0.3 - 0.5
0.5 - 0.75
0.75 - 1
1 - 1.5
1.5 - 2
2 - 3
3 - 25
Figure A6:100y Flood Envelope
SCALE: @1:10,000
300 0150
Meters
A3
TOWNSVILLE CITY COUNCILHORSESHOE BAY
STUDY AREA
© Townsville City Council 2010DIGITAL FILE: DRAWN BY: DATE:
Strategic Planning DepartmentPLANNING AND DEVELOPMENT
mxdJAJ
4/10/2011
´

LEGEND
Flooding Depth [m]
0.01 - 0.3
0.3 - 0.5
0.5 - 0.75
0.75 - 1
1 - 1.5
1.5 - 2
2 - 3
3 - 25
Figure A7:500y Flood Envelope
SCALE: @1:10,000
300 0150
Meters
A3
TOWNSVILLE CITY COUNCILHORSESHOE BAY
STUDY AREA
© Townsville City Council 2010DIGITAL FILE: DRAWN BY: DATE:
Strategic Planning DepartmentPLANNING AND DEVELOPMENT
mxdJAJ
4/10/2011
´

LEGEND
Flooding Depth [m]
0.01 - 0.3
0.3 - 0.5
0.5 - 0.75
0.75 - 1
1 - 1.5
1.5 - 2
2 - 3
3 - 25
Figure A8:PMF Flood Envelope
SCALE: @1:10,000
300 0150
Meters
A3
TOWNSVILLE CITY COUNCILHORSESHOE BAY
STUDY AREA
© Townsville City Council 2010DIGITAL FILE: DRAWN BY: DATE:
Strategic Planning DepartmentPLANNING AND DEVELOPMENT
mxdJAJ
4/10/2011
´
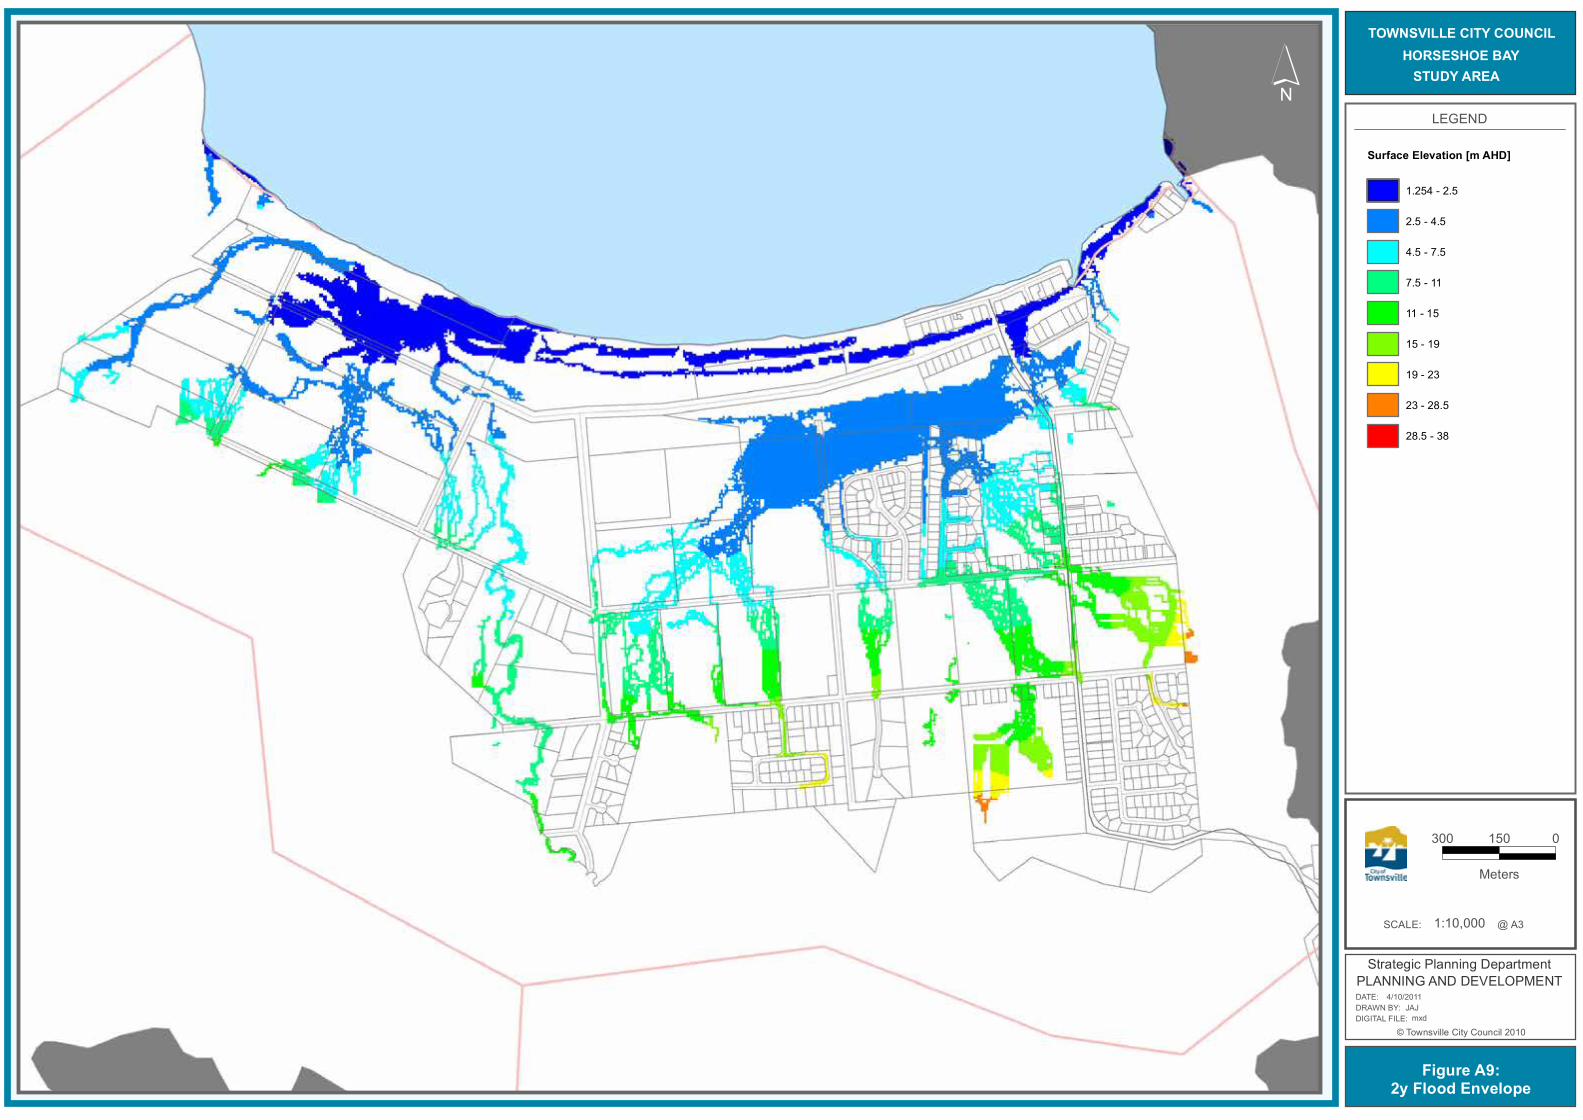
LEGEND
Surface Elevation [m AHD]
1.254 - 2.5
2.5 - 4.5
4.5 - 7.5
7.5 - 11
11 - 15
15 - 19
19 - 23
23 - 28.5
28.5 - 38
Figure A9:2y Flood Envelope
SCALE: @1:10,000
300 0150
Meters
A3
TOWNSVILLE CITY COUNCILHORSESHOE BAY
STUDY AREA
© Townsville City Council 2010DIGITAL FILE: DRAWN BY: DATE:
Strategic Planning DepartmentPLANNING AND DEVELOPMENT
mxdJAJ
4/10/2011
´

LEGEND
Surface Elevation [m AHD]
1.254 - 2.5
2.5 - 4.5
4.5 - 7.5
7.5 - 11
11 - 15
15 - 19
19 - 23
23 - 28.5
28.5 - 38
Figure A10:5y Flood Envelope
SCALE: @1:10,000
300 0150
Meters
A3
TOWNSVILLE CITY COUNCILHORSESHOE BAY
STUDY AREA
© Townsville City Council 2010DIGITAL FILE: DRAWN BY: DATE:
Strategic Planning DepartmentPLANNING AND DEVELOPMENT
mxdJAJ
4/10/2011
´

LEGEND
Surface Elevation [m AHD]
1.254 - 2.5
2.5 - 4.5
4.5 - 7.5
7.5 - 11
11 - 15
15 - 19
19 - 23
23 - 28.5
28.5 - 38
Figure A11:10y Flood Envelope
SCALE: @1:10,000
300 0150
Meters
A3
TOWNSVILLE CITY COUNCILHORSESHOE BAY
STUDY AREA
© Townsville City Council 2010DIGITAL FILE: DRAWN BY: DATE:
Strategic Planning DepartmentPLANNING AND DEVELOPMENT
mxdJAJ
4/10/2011
´

LEGEND
Surface Elevation [m AHD]
1.254 - 2.5
2.5 - 4.5
4.5 - 7.5
7.5 - 11
11 - 15
15 - 19
19 - 23
23 - 28.5
28.5 - 38
Figure A12:20y Flood Envelope
SCALE: @1:10,000
300 0150
Meters
A3
TOWNSVILLE CITY COUNCILHORSESHOE BAY
STUDY AREA
© Townsville City Council 2010DIGITAL FILE: DRAWN BY: DATE:
Strategic Planning DepartmentPLANNING AND DEVELOPMENT
mxdJAJ
4/10/2011
´

LEGEND
Surface Elevation [m AHD]
1.254 - 2.5
2.5 - 4.5
4.5 - 7.5
7.5 - 11
11 - 15
15 - 19
19 - 23
23 - 28.5
28.5 - 38
Figure A13:50y Flood Envelope
SCALE: @1:10,000
300 0150
Meters
A3
TOWNSVILLE CITY COUNCILHORSESHOE BAY
STUDY AREA
© Townsville City Council 2010DIGITAL FILE: DRAWN BY: DATE:
Strategic Planning DepartmentPLANNING AND DEVELOPMENT
mxdJAJ
4/10/2011
´

LEGEND
Surface Elevation [m AHD]
1.254 - 2.5
2.5 - 4.5
4.5 - 7.5
7.5 - 11
11 - 15
15 - 19
19 - 23
23 - 28.5
28.5 - 38
Figure A14:100y Flood Envelope
SCALE: @1:10,000
300 0150
Meters
A3
TOWNSVILLE CITY COUNCILHORSESHOE BAY
STUDY AREA
© Townsville City Council 2010DIGITAL FILE: DRAWN BY: DATE:
Strategic Planning DepartmentPLANNING AND DEVELOPMENT
mxdJAJ
4/10/2011
´

LEGEND
Surface Elevation [m AHD]
1.254 - 2.5
2.5 - 4.5
4.5 - 7.5
7.5 - 11
11 - 15
15 - 19
19 - 23
23 - 28.5
28.5 - 38
Figure A15:500y Flood Envelope
SCALE: @1:10,000
300 0150
Meters
A3
TOWNSVILLE CITY COUNCILHORSESHOE BAY
STUDY AREA
© Townsville City Council 2010DIGITAL FILE: DRAWN BY: DATE:
Strategic Planning DepartmentPLANNING AND DEVELOPMENT
mxdJAJ
4/10/2011
´

LEGEND
Surface Elevation [m AHD]
1.254 - 2.5
2.5 - 4.5
4.5 - 7.5
7.5 - 11
11 - 15
15 - 19
19 - 23
23 - 28.5
28.5 - 38
Figure A16:PMF Flood Envelope
SCALE: @1:10,000
300 0150
Meters
A3
TOWNSVILLE CITY COUNCILHORSESHOE BAY
STUDY AREA
© Townsville City Council 2010DIGITAL FILE: DRAWN BY: DATE:
Strategic Planning DepartmentPLANNING AND DEVELOPMENT
mxdJAJ
4/10/2011
´

LEGEND
Flow Velocity [m/s]
0 - 0.25
0.25 - 0.5
0.5 - 0.75
0.75 - 1
1 - 1.25
1.25 - 1.5
1.5 - 1.75
1.75 - 2
2 - 3
3 - 6
Figure A17:2y Velocity Envelope
SCALE: @1:10,000
300 0150
Meters
A3
TOWNSVILLE CITY COUNCILHORSESHOE BAY
STUDY AREA
© Townsville City Council 2010DIGITAL FILE: DRAWN BY: DATE:
Strategic Planning DepartmentPLANNING AND DEVELOPMENT
mxdJAJ
4/10/2011
´

LEGEND
Flow Velocity [m/s]
0 - 0.25
0.25 - 0.5
0.5 - 0.75
0.75 - 1
1 - 1.25
1.25 - 1.5
1.5 - 1.75
1.75 - 2
2 - 3
3 - 6
Figure A18:5y Velocity Envelope
SCALE: @1:10,000
300 0150
Meters
A3
TOWNSVILLE CITY COUNCILHORSESHOE BAY
STUDY AREA
© Townsville City Council 2010DIGITAL FILE: DRAWN BY: DATE:
Strategic Planning DepartmentPLANNING AND DEVELOPMENT
mxdJAJ
4/10/2011
´

LEGEND
Flow Velocity [m/s]
0 - 0.25
0.25 - 0.5
0.5 - 0.75
0.75 - 1
1 - 1.25
1.25 - 1.5
1.5 - 1.75
1.75 - 2
2 - 3
3 <
Figure A19:10y Velocity Envelope
SCALE: @1:10,000
300 0150
Meters
A3
TOWNSVILLE CITY COUNCILHORSESHOE BAY
STUDY AREA
© Townsville City Council 2010DIGITAL FILE: DRAWN BY: DATE:
Strategic Planning DepartmentPLANNING AND DEVELOPMENT
mxdJAJ
4/10/2011
´

LEGEND
Flow Velocity [m/s]
0 - 0.25
0.25 - 0.5
0.5 - 0.75
0.75 - 1
1 - 1.25
1.25 - 1.5
1.5 - 1.75
1.75 - 2
2 - 3
3 <
Figure A20:20y Velocity Envelope
SCALE: @1:10,000
300 0150
Meters
A3
TOWNSVILLE CITY COUNCILHORSESHOE BAY
STUDY AREA
© Townsville City Council 2010DIGITAL FILE: DRAWN BY: DATE:
Strategic Planning DepartmentPLANNING AND DEVELOPMENT
mxdJAJ
4/10/2011
´

LEGEND
Flow Velocity [m/s]
0 - 0.25
0.25 - 0.5
0.5 - 0.75
0.75 - 1
1 - 1.25
1.25 - 1.5
1.5 - 1.75
1.75 - 2
2 - 3
3 <
Figure A21: 50y Velocity Envelope
SCALE: @1:10,000
300 0150
Meters
A3
TOWNSVILLE CITY COUNCILHORSESHOE BAY
STUDY AREA
© Townsville City Council 2010DIGITAL FILE: DRAWN BY: DATE:
Strategic Planning DepartmentPLANNING AND DEVELOPMENT
mxdJAJ
4/10/2011
´

LEGEND
Flow Velocity [m/s]
0 - 0.25
0.25 - 0.5
0.5 - 0.75
0.75 - 1
1 - 1.25
1.25 - 1.5
1.5 - 1.75
1.75 - 2
2 - 3
3 <
Figure A22:100y Velocity Envelope
SCALE: @1:10,000
300 0150
Meters
A3
TOWNSVILLE CITY COUNCILHORSESHOE BAY
STUDY AREA
© Townsville City Council 2010DIGITAL FILE: DRAWN BY: DATE:
Strategic Planning DepartmentPLANNING AND DEVELOPMENT
mxdJAJ
4/10/2011
´

LEGEND
Flow Velocity [m/s]
0 - 0.25
0.25 - 0.5
0.5 - 0.75
0.75 - 1
1 - 1.25
1.25 - 1.5
1.5 - 1.75
1.75 - 2
2 - 3
3 <
Figure A23:500y Velocity Envelope
SCALE: @1:10,000
300 0150
Meters
A3
TOWNSVILLE CITY COUNCILHORSESHOE BAY
STUDY AREA
© Townsville City Council 2010DIGITAL FILE: DRAWN BY: DATE:
Strategic Planning DepartmentPLANNING AND DEVELOPMENT
mxdJAJ
4/10/2011
´

LEGEND
Flow Velocity [m/s]
0 - 0.25
0.25 - 0.5
0.5 - 0.75
0.75 - 1
1 - 1.25
1.25 - 1.5
1.5 - 1.75
1.75 - 2
2 - 3
3 <
Figure A24:PMF Velocity Envelope
SCALE: @1:10,000
300 0150
Meters
A3
TOWNSVILLE CITY COUNCILHORSESHOE BAY
STUDY AREA
© Townsville City Council 2010DIGITAL FILE: DRAWN BY: DATE:
Strategic Planning DepartmentPLANNING AND DEVELOPMENT
mxdJAJ
4/10/2011
´

HORSESHOE BAY FLOOD REPORT
Page 110 >> 44 741 992 072
Appendix B
Rational Method Calculations
Catchment WB-1 EA-6 EB-1 EA-9P1 EA-10 EA-9A EA-5A WA-6
XP-RAFTSMax event 50y 90m 90m 90m 60m 60&90m 60&90m 90m 90mFlow 50y (cms) 96.0 70.4 14.9 20.0 15.6 14.1 11.7 70.0Max event 2y 12h 24h 12h 90m 12h 90m 12h 12hFlow 2y (cms) 22.8 17.4 3.3 5.7 3.7 4.1 2.6 16.132Area (Hectares) 439.00 275.00 47.30 54.80 57.00 36.80 35.70 255.00Area (km2) 4.39 2.75 0.47 0.55 0.57 0.37 0.36 2.55unit area flow 50y (cms/km2) 21.9 25.6 31.5 36.5 27.4 38.3 32.8 27.5unit area flow 2y (cms/km2) 5.2 6.3 6.9 10.4 6.5 11.1 7.2 6.3
Rational MethodTime of Concentration (min) 81.1 78 44 32 45 23 32 68Average Rainfall Intensity 50y (mm/h) 95 97 131 153 131 178 153 104Average Rainfall Intensity 2y (mm/h) 43.5 44 60.5 70 60 82 70 49Area (ha) 439.00 275.00 47.30 54.80 57.00 36.8 35.7 255.00Fraction Impervious 0 0.13 0.08 0.2 0.05 0.12 0 0Intensity 1h10y (mm/h) 80 80 80 80 80 80 80 80C10 0.7 0.74 0.7 0.7 0.7 0.7 0.7 0.7Frequency Factor for 50y 1.15 1.15 1.15 1.15 1.15 1.15 1.15 1.15Coefficient of Discharge for 50y 0.805 0.851 0.805 0.805 0.805 0.805 0.805 0.805Frequency Factor for 2y 0.85 0.85 0.85 0.85 0.85 0.85 0.85 0.85Coefficient of Discharge for 2y 0.595 0.629 0.595 0.595 0.595 0.595 0.595 0.595Conversion factor 0.00278 0.00278 0.00278 0.00278 0.00278 0.00278 0.0028 0.00278Peak Flow Rate for 50y (m3/s) 93.3 63.1 13.9 18.8 16.7 14.7 12.2 59.3Peak Flow Rate for 2y (m3/s) 31.6 21.2 4.7 6.3 5.7 5.0 4.1 20.7
Table B1: Rational Method Calculations

HORSESHOE BAY FLOOD REPORT
Page 111 >> 44 741 992 072
Appendix C
Climate Change Difference Maps
Title Figure Name Page IPCC Climate Change 2y Figure C1 112 IPCC Climate Change 50y Figure C2 113 IPCC Climate Change 100y Figure C3 114 DCC Climate Change 50y Figure C4 115 DCC Climate Change 100y Figure C5 116

LEGEND
Water Level Difference [m]
< -1
-1 - -0.5
-0.5 - -0.3
-0.3 - -0.1
-0.1 - -0.05
-0.05 - -0.01
-0.01 - 0.01
0.01 - 0.05
0.05 - 0.1
0.1 - 0.3
0.3 - 0.5
0.5 - 1
> 3
Figure C1: Climate Change WaterLevel Difference for 2 year ARI
SCALE: @1:10,000
290 0145
Meters
A3
TOWNSVILLE CITY COUNCILHORSESHOE BAY
STUDY AREA
© Townsville City Council 2010DIGITAL FILE: DRAWN BY: DATE:
Strategic Planning DepartmentPLANNING AND DEVELOPMENT
mxdJAJ
17/10/2011
´

LEGEND
Water Level Difference [m]
< -1
-1 - -0.5
-0.5 - -0.3
-0.3 - -0.1
-0.1 - -0.05
-0.05 - -0.01
-0.01 - 0.01
0.01 - 0.05
0.05 - 0.1
0.1 - 0.3
0.3 - 0.5
0.5 - 1
> 3
Figure C2: Climate Change WaterLevel Difference for 50 year ARI
SCALE: @1:10,000
290 0145
Meters
A3
TOWNSVILLE CITY COUNCILHORSESHOE BAY
STUDY AREA
© Townsville City Council 2010DIGITAL FILE: DRAWN BY: DATE:
Strategic Planning DepartmentPLANNING AND DEVELOPMENT
mxdJAJ
17/10/2011
´

LEGEND
Water Level Difference [m]
< -1
-1 - -0.5
-0.5 - -0.3
-0.3 - -0.1
-0.1 - -0.05
-0.05 - -0.01
-0.01 - 0.01
0.01 - 0.05
0.05 - 0.1
0.1 - 0.3
0.3 - 0.5
0.5 - 1
> 3
Figure C3: Climate Change WaterLevel Difference for 100 year ARI
SCALE: @1:10,000
290 0145
Meters
A3
TOWNSVILLE CITY COUNCILHORSESHOE BAY
STUDY AREA
© Townsville City Council 2010DIGITAL FILE: DRAWN BY: DATE:
Strategic Planning DepartmentPLANNING AND DEVELOPMENT
mxdJAJ
17/10/2011
´

LEGEND
Water Level Difference [m]
< -1
-1 - -0.5
-0.5 - -0.3
-0.3 - -0.1
-0.1 - -0.05
-0.05 - -0.01
-0.01 - 0.01
0.01 - 0.05
0.05 - 0.1
0.1 - 0.3
0.3 - 0.5
0.5 - 1
> 3
Figure C4: DCC Water Level Difference for 50 year ARI
SCALE: @1:10,000
290 0145
Meters
A3
TOWNSVILLE CITY COUNCILHORSESHOE BAY
STUDY AREA
© Townsville City Council 2010DIGITAL FILE: DRAWN BY: DATE:
Strategic Planning DepartmentPLANNING AND DEVELOPMENT
mxdJAJ
17/10/2011
´

LEGEND
Water Level Difference [m]
< -1
-1 - -0.5
-0.5 - -0.3
-0.3 - -0.1
-0.1 - -0.05
-0.05 - -0.01
-0.01 - 0.01
0.01 - 0.05
0.05 - 0.1
0.1 - 0.3
0.3 - 0.5
0.5 - 1
> 3
Figure C5: DCC Water Level Difference for 100 year ARI
SCALE: @1:10,000
290 0145
Meters
A3
TOWNSVILLE CITY COUNCILHORSESHOE BAY
STUDY AREA
© Townsville City Council 2010DIGITAL FILE: DRAWN BY: DATE:
Strategic Planning DepartmentPLANNING AND DEVELOPMENT
mxdJAJ
17/10/2011
´