Embed Size (px)
Citation preview
FOR OFFICIAL USE ONLY
Horticulture\nGujarat
O tt-U &10U -t5
DES/2015-16/28
Horticulture in Gujarat 2013-14 & 2014-15
DIRECTORATE OF ECONOMICS AND STATISTICS
GOVERNMENT OF GUJARAT
GANDHINAGAR
PREFACE
The publication “Horticulture in Gujarat 2013-14 & 2014-15” is the fifth publication of its kind. The publication has been updated with the latest available information. This publication include information pertaining to cropping pattern by Agi o Climatic Zone, Time Series Data Base on Estimated Area under Horticultural Crops and their Estimated Production.I express my deep gratitude to the information provider for their active co-operation, contribution and support extended, without which it would not have been possible to bring out this publication. We hope to get their continuous support in future. I also take opportunity to appreciate the work done by all officials associated with this publication.I hope this Publication would be useful to planners, policy makers, researchers, environment statistics academia and the general public at large.Constructive suggestions to enhance quality is highly appreciated.
M arch 2 0 1 6
S. K. HuddaD irector
Econom ics and Statistics
Team behind this Publication
Dr. Hiten. Parekh Joint Director
Ms. Khyati Sagar Research Officer
Research AssistantMs. Meera. Parmar
Ms. Sonal. N. Vaghela
Statistical AssistantMs. Mittal. B. Patel
Cover PageMr. V. J. Mevada
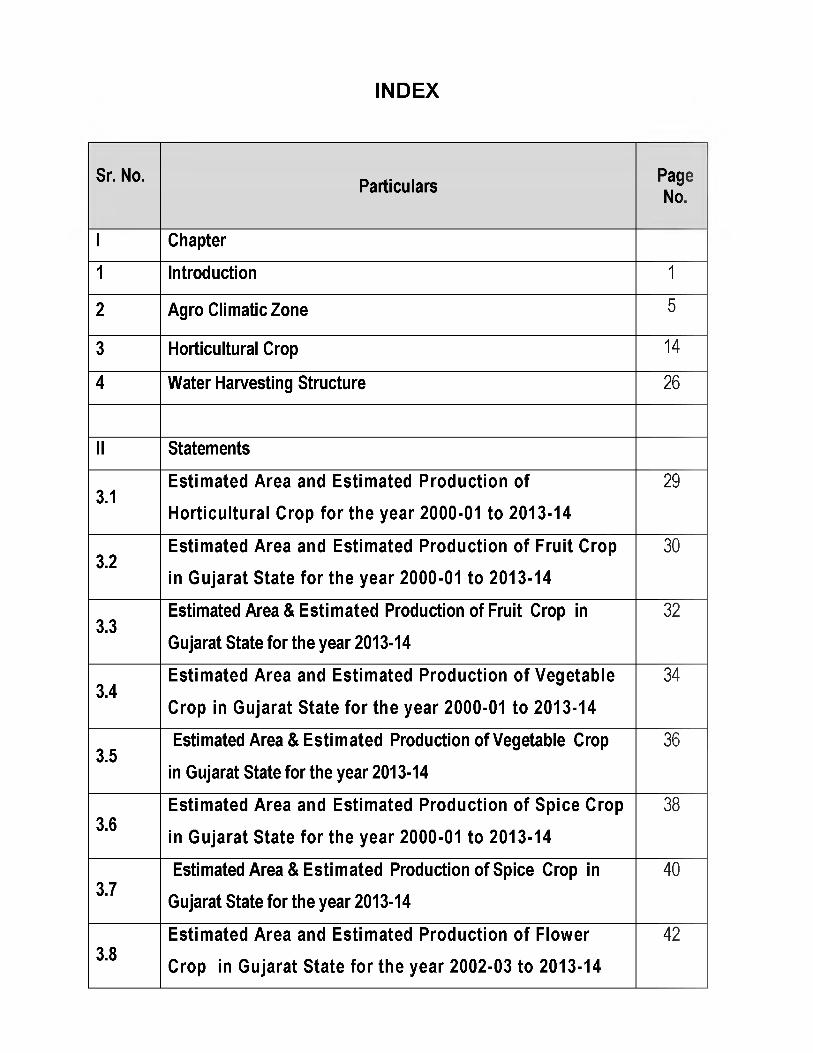
INDEX
Sr. No. P ageNo.
P artic u la rs
I C h a p te r
1 In tro d u ctio n 1
2 A g ro C lim a tic Z o n e 5
3 H o rticu ltu ra l C rop 14
4 W a te r H arvestin g S tru c tu re 26
II S ta tem e n ts
3.1E s t im a te d A r e a a n d E s t im a te d P r o d u c t io n o f
H o r t ic u ltu r a l C ro p fo r th e y e a r 2 0 0 0 -0 1 to 2 0 1 3 -1 4
29
3.2E s t im a te d A r e a a n d E s t im a te d P r o d u c t io n o f F r u it C ro p
in G u ja r a t S ta te fo r th e y e a r 2 0 0 0 -0 1 to 2 0 1 3 -1 4
30
3.3E s tim ated A re a & E s t im a te d P ro d u c tio n o f F ru it C ro p in
G u ja ra t S ta te fo r th e y e a r 2 0 1 3 -1 4
32
3.4E s t im a te d A r e a a n d E s t im a te d P r o d u c t io n o f V e g e ta b le
C ro p in G u ja r a t S ta te fo r th e y e a r 2 0 0 0 -0 1 to 2 0 1 3 -1 4
34
3.5E s tim ated A re a & E s t im a te d P ro d u c tio n o f V e g e ta b le C rop
in G u ja ra t S ta te fo r th e y e a r 2 0 1 3 -1 4
36
3.6E s t im a te d A r e a a n d E s t im a te d P r o d u c t io n o f S p ic e C ro p
in G u ja r a t S ta te fo r th e y e a r 2 0 0 0 -0 1 to 2 0 1 3 -1 4
38
3.7E s tim ated A re a & E s t im a te d P ro d u c tio n o f S p ic e C rop in
G u ja ra t S ta te fo r th e y e a r 2 0 1 3 -1 4
40
3.8E s t im a te d A r e a a n d E s t im a te d P r o d u c t io n o f F lo w e r 42
C ro p in G u ja r a t S ta te fo r th e y e a r 2 0 0 2 -0 3 to 2 0 1 3 -1 4
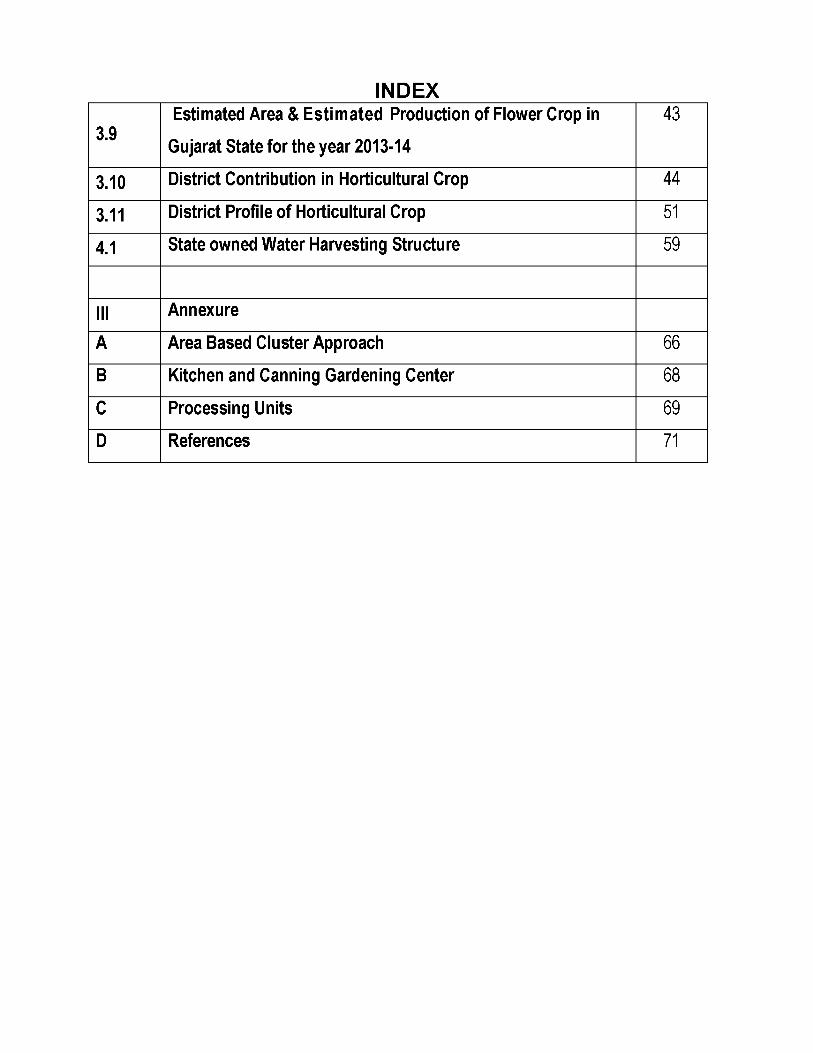
INDEX
3.9E s tim ated A re a & E s t im a te d P ro d u c tio n o f F lo w e r C ro p in
G u ja ra t S ta te fo r th e y e a r 2 0 1 3 -1 4
43
3 .10 D is tric t C o n trib u tio n in H o rticu ltu ra l C rop 44
3.11 D is tric t P ro file o f H o rticu ltu ra l C ro p 51
4.1 S ta te o w n ed W a te r H arvestin g S tru c tu re 59
III A n n e x u re
A A re a B ased C lu s te r A p p ro a ch 66
B K itch en and C an n in g G a rd e n in g C e n te r 68
C P ro cess in g U n its 69
D R eferen ces 71
Chapter -1
INTRODUCTION
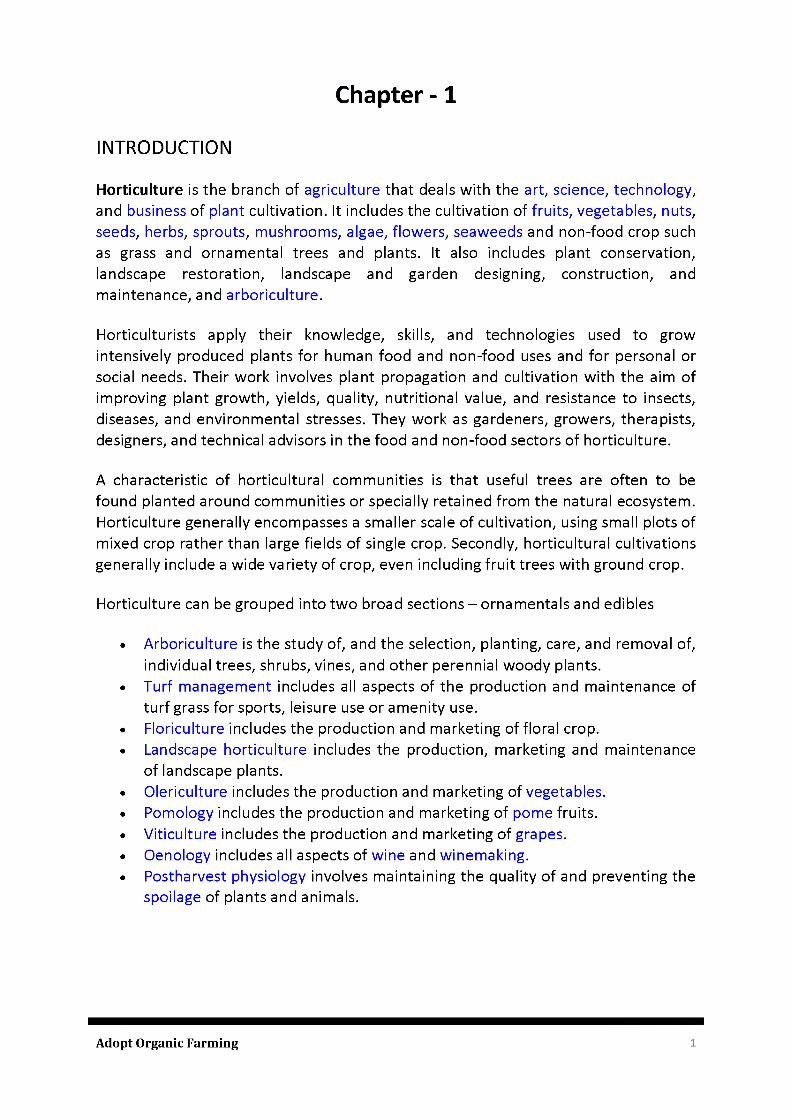
Horticulture is the branch of agriculture that deals with the art, science, technology, and business of plant cultivation. It includes the cultivation of fruits, vegetables, nuts, seeds, herbs, sprouts, mushrooms, algae, flowers, seaweeds and non-food crop such as grass and ornamental trees and plants. It also includes plant conservation, landscape restoration, landscape and garden designing, construction, and maintenance, and arboriculture.
Horticulturists apply their knowledge, skills, and technologies used to grow intensively produced plants for human food and non-food uses and for personal or social needs. Their work involves plant propagation and cultivation with the aim of improving plant growth, yields, quality, nutritional value, and resistance to insects, diseases, and environmental stresses. They work as gardeners, growers, therapists, designers, and technical advisors in the food and non-food sectors of horticulture.
A characteristic of horticultural communities is that useful trees are often to be found planted around communities or specially retained from the natural ecosystem. Horticulture generally encompasses a smaller scale of cultivation, using small plots of mixed crop rather than large fields of single crop. Secondly, horticultural cultivations generally include a wide variety of crop, even including fruit trees with ground crop.
Horticulture can be grouped into two broad sections - ornamentals and edibles
• Arboriculture is the study of, and the selection, planting, care, and removal of, individual trees, shrubs, vines, and other perennial woody plants.
• Turf management includes all aspects of the production and maintenance of turf grass for sports, leisure use or amenity use.
• Floriculture includes the production and marketing of floral crop.• Landscape horticulture includes the production, marketing and maintenance
of landscape plants.• Olericulture includes the production and marketing of vegetables.• Pomology includes the production and marketing of pome fruits.• Viticulture includes the production and marketing of grapes.• Oenology includes all aspects of wine and winemaking.• Postharvest physiology involves maintaining the quality of and preventing the
spoilage of plants and animals.
Adopt Organic Farming 1
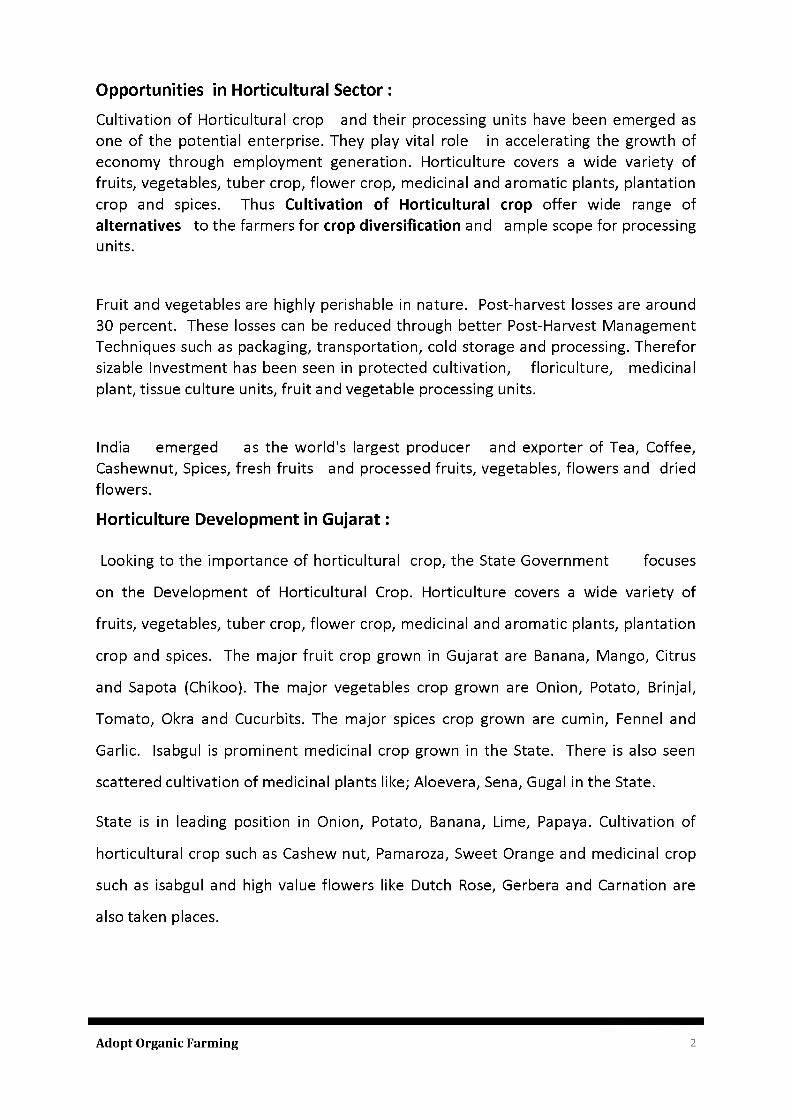
Cultivation of Horticultural crop and their processing units have been emerged as one of the potential enterprise. They play vital role in accelerating the growth of economy through employment generation. Horticulture covers a wide variety of fruits, vegetables, tuber crop, flower crop, medicinal and aromatic plants, plantation crop and spices. Thus Cultivation of Horticultural crop offer wide range of alternatives to the farmers for crop diversification and ample scope for processing units.
Opportunities in Horticultural Sector :
Fruit and vegetables are highly perishable in nature. Post-harvest losses are around 30 percent. These losses can be reduced through better Post-Harvest Management Techniques such as packaging, transportation, cold storage and processing. Therefor sizable Investment has been seen in protected cultivation, floriculture, medicinal plant, tissue culture units, fruit and vegetable processing units.
India emerged as the world's largest producer and exporter of Tea, Coffee, Cashewnut, Spices, fresh fruits and processed fruits, vegetables, flowers and dried flowers.
Horticulture Development in Gujarat :
Looking to the importance of horticultural crop, the State Government focuses
on the Development of Horticultural Crop. Horticulture covers a wide variety of
fruits, vegetables, tuber crop, flower crop, medicinal and aromatic plants, plantation
crop and spices. The major fruit crop grown in Gujarat are Banana, Mango, Citrus
and Sapota (Chikoo). The major vegetables crop grown are Onion, Potato, Brinjal,
Tomato, Okra and Cucurbits. The major spices crop grown are cumin, Fennel and
Garlic. Isabgul is prominent medicinal crop grown in the State. There is also seen
scattered cultivation of medicinal plants like; Aloevera, Sena, Gugal in the State.
State is in leading position in Onion, Potato, Banana, Lime, Papaya. Cultivation of
horticultural crop such as Cashew nut, Pamaroza, Sweet Orange and medicinal crop
such as isabgul and high value flowers like Dutch Rose, Gerbera and Carnation are
also taken places.
Adopt Organic Farming 2
The Central Government has started National Horticulture Mission from the year
2005-06 for The Development of Horticulture. The Gujarat Government has also
started "Gujarat Horticulture Mission" under the Chairmanship of Principal Secretary
of Agriculture. At the district level, District Horticulture Mission Committee has been
formed under the Chairmanship of District Development Officer. The mission is
being implemented in 16 potential districts and covers all important horticultural
crop of the state such as Mango, Chiku, Aonla, Banana, Papaya, Lime, Cumin, Fennel,
and Flowers, Medicinal and Aromatic crop, etc.
Main objectives of The Gujarat Horticulture Mission are :
To make growth in horticulture sector through area based Strategical
Plannig such as
research
technological promotion
extension activities
post harvest management techniques
processing and marketing facilities.
To enhance horticulture production,
To improve nutritional security
To make convergence and synergy among on-going and plan programmes
To promote, develop modern scientific knowledge.
Income support to farm households
To create employment generation by disseminating technological knowhow for
Horticulture Development
Gujarat Horticulture Mission :
Adopt Organic Farming 3
To enhance the quality and production horticultural crop, Area Based Cluster Approach has been adopted.(see Annexure- A)
Research Work :Considering the growing importance of agriculture research for inclusive growth and
development, the state Government has accorded highest priority to productivity
and productivity and production through improved research and value addition.
The research and development work in the field of horticultural crop are under taken
by Agricultural Universities in the state situated at Anand, Junagadh, Dantiwada and
Navsari.
There are 4 State Agriculture Universities (SAUs), 28 Krishi Vigyan Kendra (KVKs) and
10 agriculture research centers located at various parts of the state those are
involved in R&D activities in the state
The horticultural activities of Agriculture University is divided in to the four major
group :
(1) Pomology i.e. fruits
(2) Floriculture and Medicinal Crop
(3) Olericulture i.e. vegetables and
(4) Agriculture Product Progress Unit (APP).
The work of APP unit is of engineering type. It prepares the
Machinery for processing of fruits and vegetables.
Source: Directorate of Horticulture
Directorate of Agricultural
Adopt Organic Farming 4
Chapter - 2
Gujarat has a wide range of soil types, rainfall pattern, temperature regimes, and
irrigation facilities. Gujarat state has about 1600 Km long coastal belt. Gujarat has
tropical & subtropical climate with temperature ranging from a minimum of 9o C to
12o C in November-December and a maximum of 40 o C to 46 o C in May-June.
Generally, annual rainfall of Gujarat state is 852 mm. However, there is a wide
variation exist in rainfall which have impact on the productivity of the crops.
Soil is categorized on the basis of soil forming processes as well as the properties
associated with soil moisture regime. The kind of arrangement and degree of
expression of horizon, pedality, moisture and temperature regimes importance to
the plant growth are the key features.
Horticulture crops suited to subtropical and tropical climates can be grown in the
state.
This diverse agro-climatic situation across the state increases the chance for
development of the horticultural activities..
About 49 percent to the total area of the state is under cultivation. The area under
irrigation is about 33 percent to the net area sown, while rest of area is cultivated
under rain fed conditions. Thus, the large area of the state is dependent on rain.
The climate favours for cultivation of fruits like; Kesar-Alphanso Mangoes, Sapota,
Banana, Aonla and Dates. The vegetables like; Okra, Beans, Cucurbits, Onion, Potato,
the spices like, Cumin, Fennel, Chilly, Coriander, Garlic. The flowers like, Rose, Lily,
Marigold, Jasmine and Tuberose. Grapes, Cashewnut, Medical and Aromatic crops
like Aloevera, Palma Rosa are emerging as potential new Horticultural crops in
suitable areas of the state.
Agro Climate Zones and Cropping Pattern:
Adopt Organic Farming 5
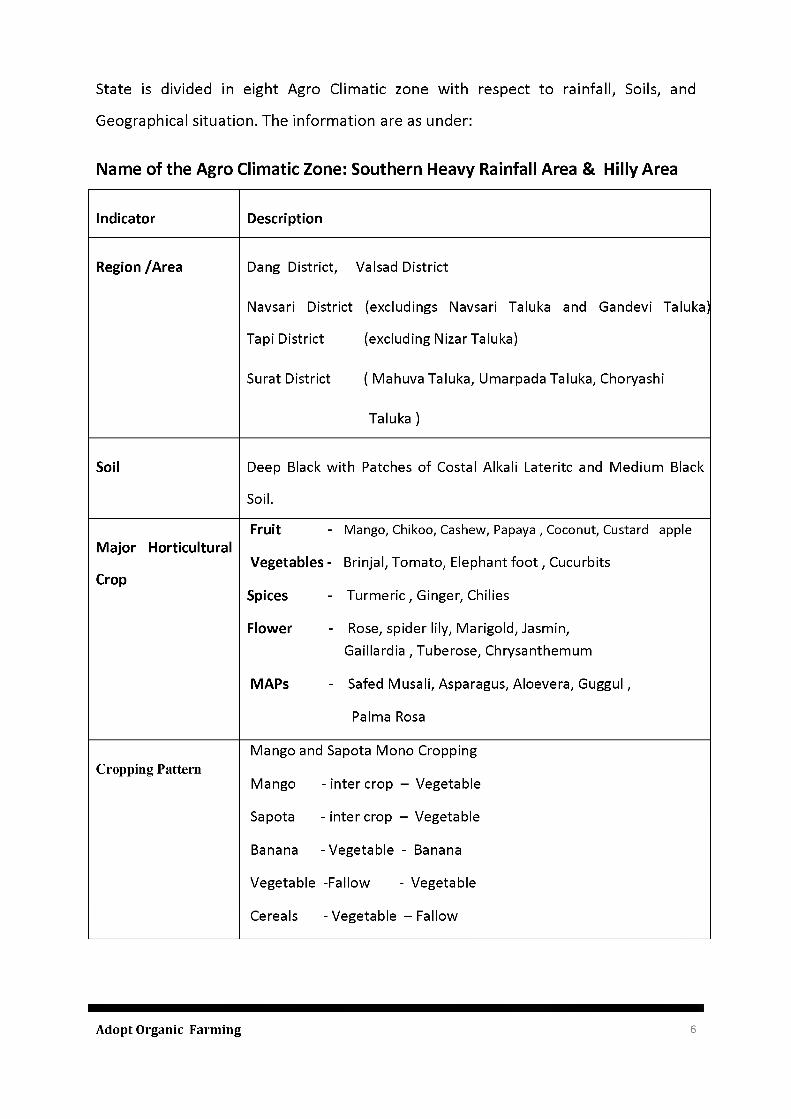
State is divided in eight Agro Climatic zone with respect to rainfall, Soils, and
Geographical situation. The information are as under:
Name of the Agro Climatic Zone: Southern Heavy Rainfall Area & Hilly Area
Indicator Description
Region /Area Dang District, Valsad District
Navsari District (excludings Navsari Taluka and Gandevi Taluka)
Tapi District (excluding Nizar Taluka)
Surat District ( Mahuva Taluka, Umarpada Taluka, Choryashi
Taluka )
Soil Deep Black with Patches of Costal Alkali Lateritc and Medium Black
Soil.
Major HorticulturalFruit - Mango, Chikoo, Cashew, Papaya , Coconut, Custard apple
Vegetables - Brinjal, Tomato, Elephant foot , CucurbitsCrop
Spices - Turmeric , Ginger, Chilies
Flower - Rose, spider lily, Marigold, Jasmin,Gaillardia , Tuberose, Chrysanthemum
MAPs - Safed Musali, Asparagus, Aloevera, Guggul ,
Palma Rosa
C ropping PatternMango and Sapota Mono Cropping
Mango -inter crop - Vegetable
Sapota -inter crop - Vegetable
Banana - Vegetable - Banana
Vegetable -Fallow - Vegetable
Cereals - Vegetable - Fallow
Adopt Organic Farming 6
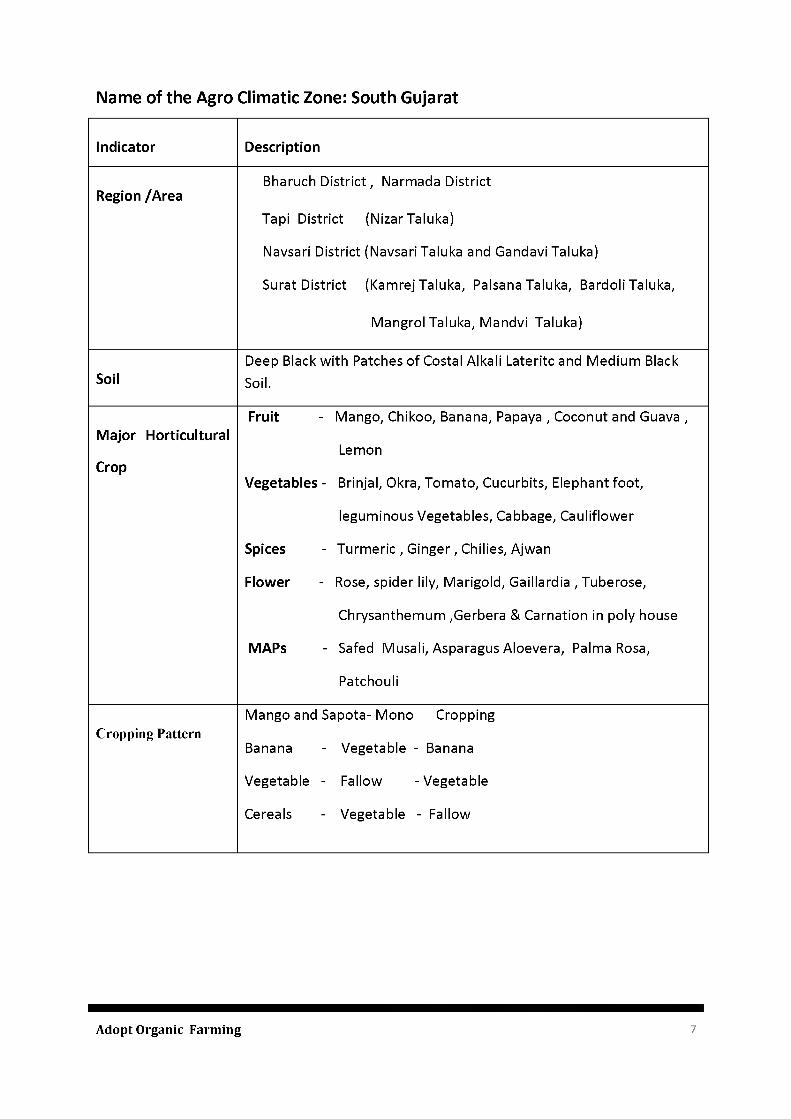
Name of the Agro Climatic Zone: South Gujarat
Indicator Description
Region /AreaBharuch District , Narmada District
Tapi District (Nizar Taluka)
Navsari District (Navsari Taluka and Gandavi Taluka)
Surat District (Kamrej Taluka, Palsana Taluka, Bardoli Taluka,
Mangrol Taluka, Mandvi Taluka)
SoilDeep Black with Patches of Costal Alkali Lateritc and Medium Black Soil.
Major HorticulturalFruit - Mango, Chikoo, Banana, Papaya , Coconut and Guava ,
LemonCrop
Vegetables - Brinjal, Okra, Tomato, Cucurbits, Elephant foot,
leguminous Vegetables, Cabbage, Cauliflower
Spices - Turmeric , Ginger , Chilies, Ajwan
Flower - Rose, spider lily, Marigold, Gaillardia , Tuberose,
Chrysanthemum ,Gerbera & Carnation in poly house
MAPs - Safed Musali, Asparagus Aloevera, Palma Rosa,
Patchouli
C ropping PatternMango and Sapota- Mono Cropping
Banana - Vegetable - Banana
Vegetable - Fallow -Vegetable
Cereals - Vegetable - Fallow
Adopt Organic Farming 7
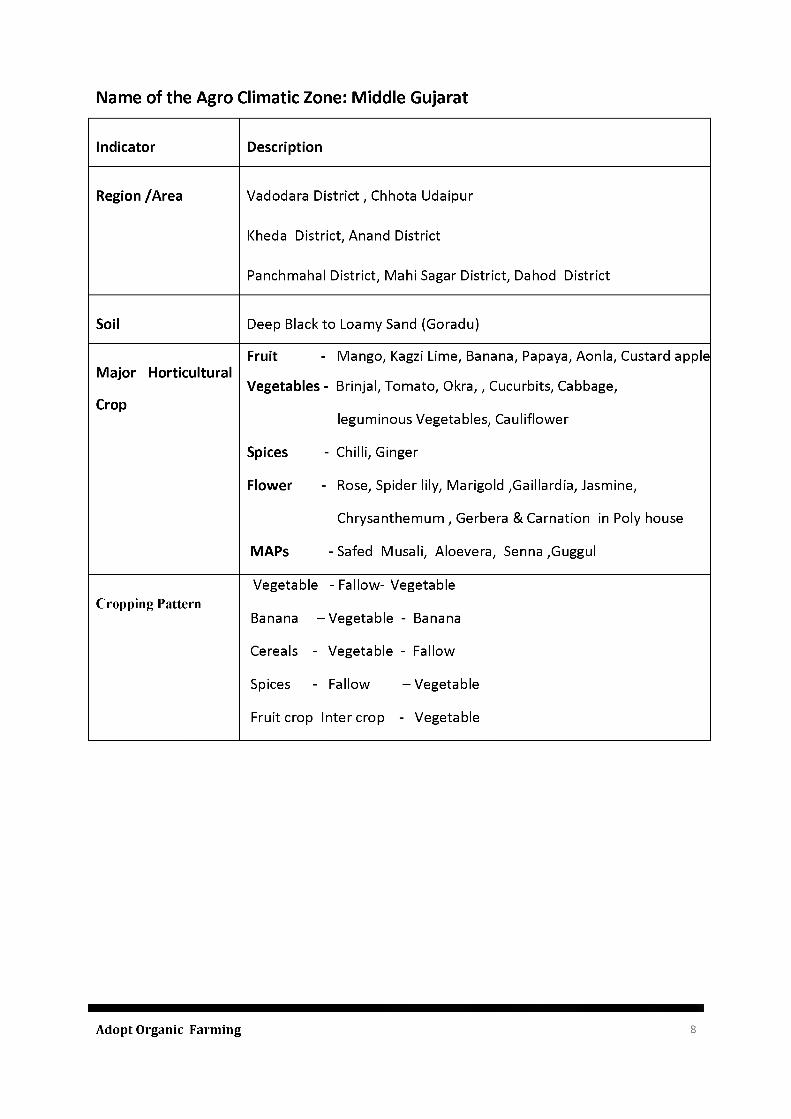
Name of the Agro Climatic Zone: Middle Gujarat
Indicator Description
Region /Area Vadodara District , Chhota Udaipur
Kheda District, Anand District
Panchmahal District, Mahi Sagar District, Dahod District
Soil Deep Black to Loamy Sand (Goradu)
Major HorticulturalFruit - Mango, Kagzi Lime, Banana, Papaya, Aonla, Custard apple
Vegetables - Brinjal, Tomato, Okra, , Cucurbits, Cabbage,Crop
leguminous Vegetables, Cauliflower
Spices - Chilli, Ginger
Flower - Rose, Spider lily, Marigold ,Gaillardia, Jasmine,
Chrysanthemum , Gerbera & Carnation in Poly house
MAPs - Safed Musali, Aloevera, Senna ,Guggul
C ropping PatternVegetable - Fallow- Vegetable
Banana - Vegetable - Banana
Cereals - Vegetable - Fallow
Spices - Fallow - Vegetable
Fruit crop Inter crop - Vegetable
Adopt Organic Farming 8
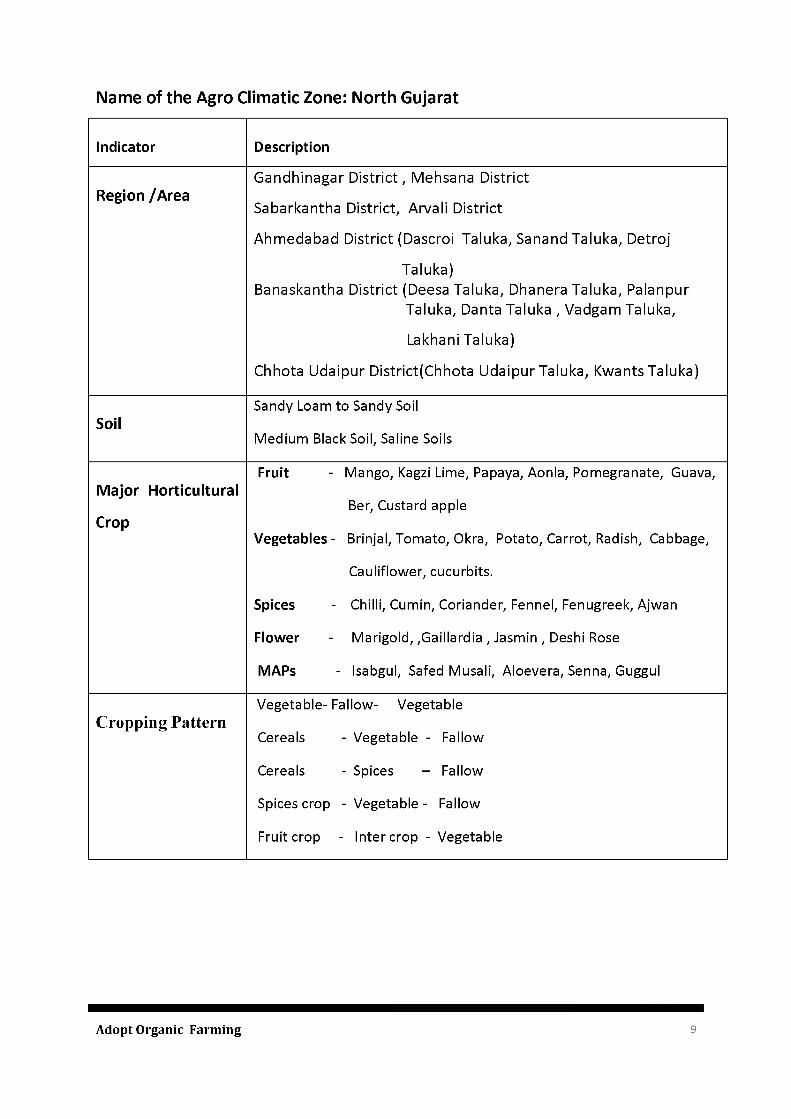
Name of the Agro Climatic Zone: North Gujarat
Indicator Description
Region /AreaGandhinagar District , Mehsana District
Sabarkantha District, Arvali District
Ahmedabad District (Dascroi Taluka, Sanand Taluka, Detroj
Taluka)Banaskantha District (Deesa Taluka, Dhanera Taluka, Palanpur
Taluka, Danta Taluka , Vadgam Taluka,
Lakhani Taluka)
Chhota Udaipur District(Chhota Udaipur Taluka, Kwants Taluka)
SoilSandy Loam to Sandy Soil
Medium Black Soil, Saline Soils
Major HorticulturalFruit - Mango, Kagzi Lime, Papaya, Aonla, Pomegranate, Guava,
Ber, Custard appleCrop
Vegetables - Brinjal, Tomato, Okra, Potato, Carrot, Radish, Cabbage,
Cauliflower, cucurbits.
Spices - Chilli, Cumin, Coriander, Fennel, Fenugreek, Ajwan
Flower - Marigold, ,Gaillardia , Jasmin , Deshi Rose
MAPs - Isabgul, Safed Musali, Aloevera, Senna, Guggul
Cropping Pattern Vegetable- Fallow- Vegetable
Cereals - Vegetable - Fallow
Cereals - Spices - Fallow
Spices crop - Vegetable - Fallow
Fruit crop - Inter crop - Vegetable
Adopt Organic Farming 9
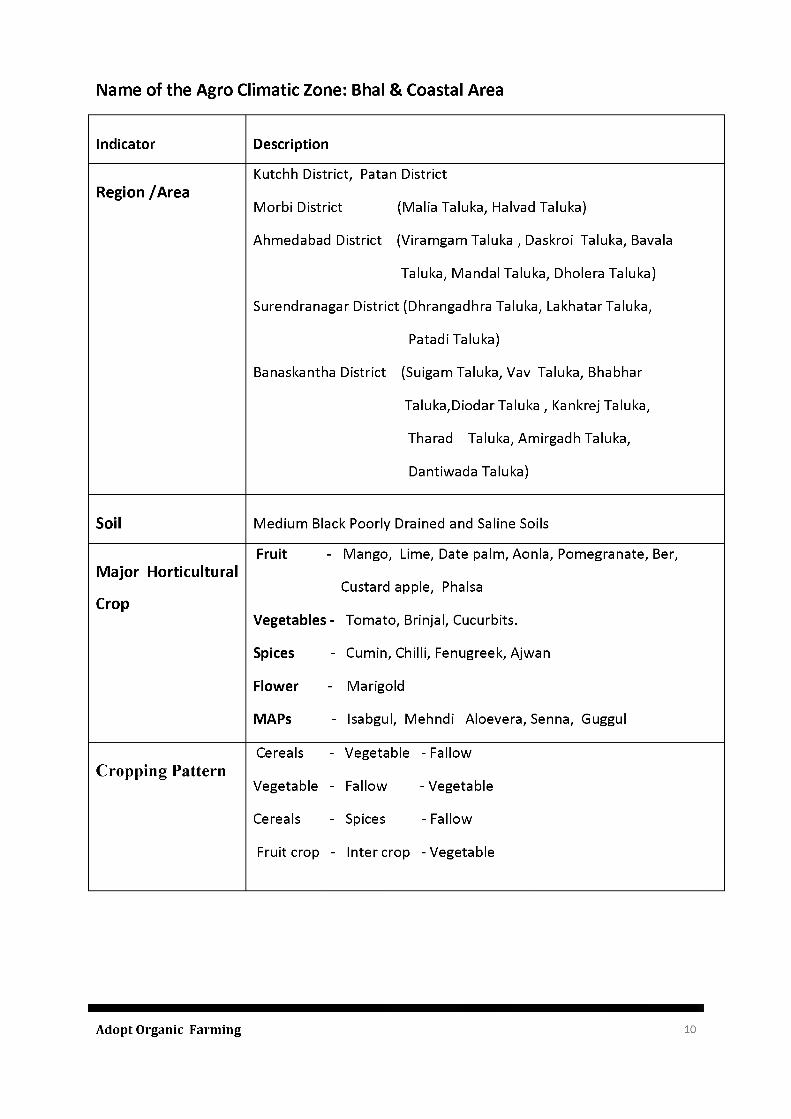
Name of the Agro Climatic Zone: Bhal & Coastal Area
Indicator Description
Region /AreaKutchh District, Patan District
Morbi District (Malia Taluka, Halvad Taluka)
Ahmedabad District (Viramgam Taluka , Daskroi Taluka, Bavala
Taluka, Mandal Taluka, Dholera Taluka)
Surendranagar District (Dhrangadhra Taluka, Lakhatar Taluka,
Patadi Taluka)
Banaskantha District (Suigam Taluka, Vav Taluka, Bhabhar
Taluka,Diodar Taluka , Kankrej Taluka,
Tharad Taluka, Amirgadh Taluka,
Dantiwada Taluka)
Soil Medium Black Poorly Drained and Saline Soils
Major Horticultural
Crop
Fruit - Mango, Lime, Date palm, Aonla, Pomegranate, Ber,
Custard apple, Phalsa
Vegetables - Tomato, Brinjal, Cucurbits.
Spices - Cumin, Chilli, Fenugreek, Ajwan
Flower - Marigold
MAPs - Isabgul, Mehndi Aloevera, Senna, Guggul
Cropping Pattern Cereals - Vegetable - Fallow
Vegetable - Fallow -Vegetable
Cereals - Spices - Fallow
Fruit crop - Inter crop - Vegetable
Adopt Organic Farming 10
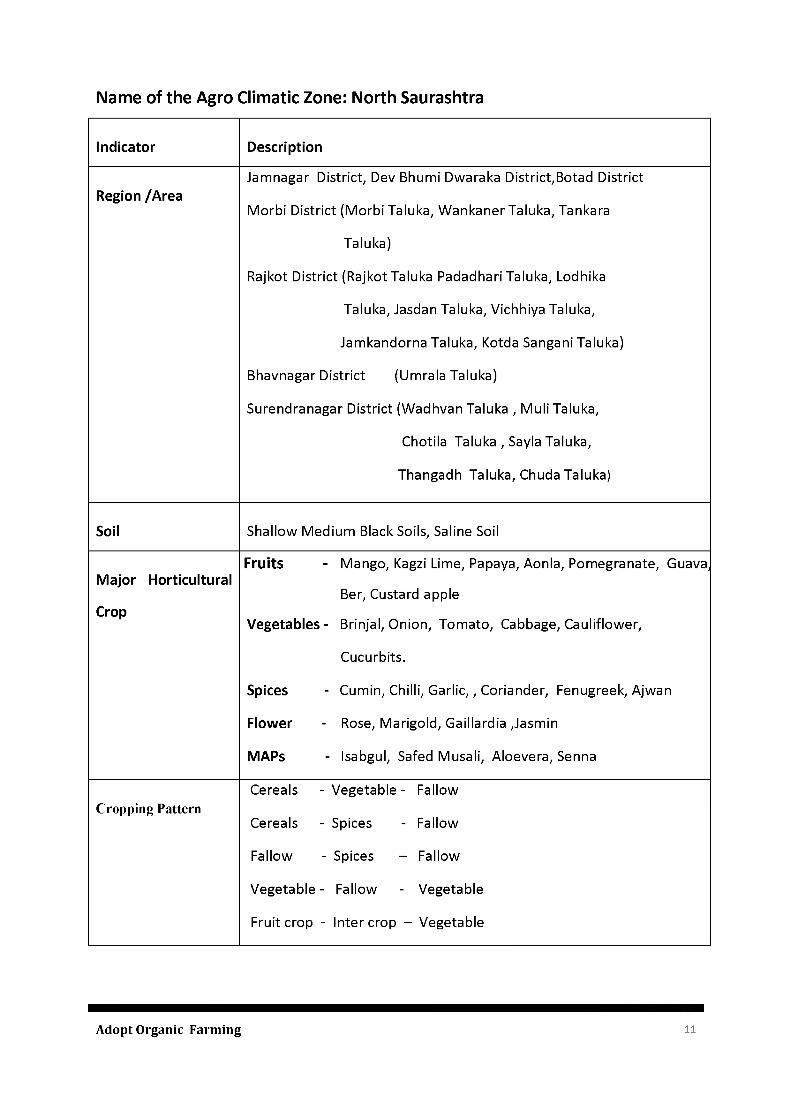
Name of the Agro Climatic Zone: North Saurashtra
Indicator Description
Region /AreaJamnagar District, Dev Bhumi Dwaraka District,Botad District
Morbi District (Morbi Taluka, Wankaner Taluka, Tankara
Taluka)
Rajkot District (Rajkot Taluka Padadhari Taluka, Lodhika
Taluka, Jasdan Taluka, Vichhiya Taluka,
Jamkandorna Taluka, Kotda Sangani Taluka)
Bhavnagar District (Umrala Taluka)
Surendranagar District (Wadhvan Taluka , Muli Taluka,
Chotila Taluka , Sayla Taluka,
Thangadh Taluka, Chuda Taluka)
Soil Shallow Medium Black Soils, Saline Soil
Major Horticultural
Crop
Fruits - Mango, Kagzi Lime, Papaya, Aonla, Pomegranate, Guava,
Ber, Custard apple
Vegetables - Brinjal, Onion, Tomato, Cabbage, Cauliflower,
Cucurbits.
Spices - Cumin, Chilli, Garlic, , Coriander, Fenugreek, Ajwan
Flower - Rose, Marigold, Gaillardia Jasmin
MAPs - Isabgul, Safed Musali, Aloevera, Senna
C ropping PatternCereals - Vegetable - Fallow
Cereals - Spices - Fallow
Fallow - Spices - Fallow
Vegetable - Fallow - Vegetable
Fruit crop - Inter crop - Vegetable
Adopt Organic Farming 11
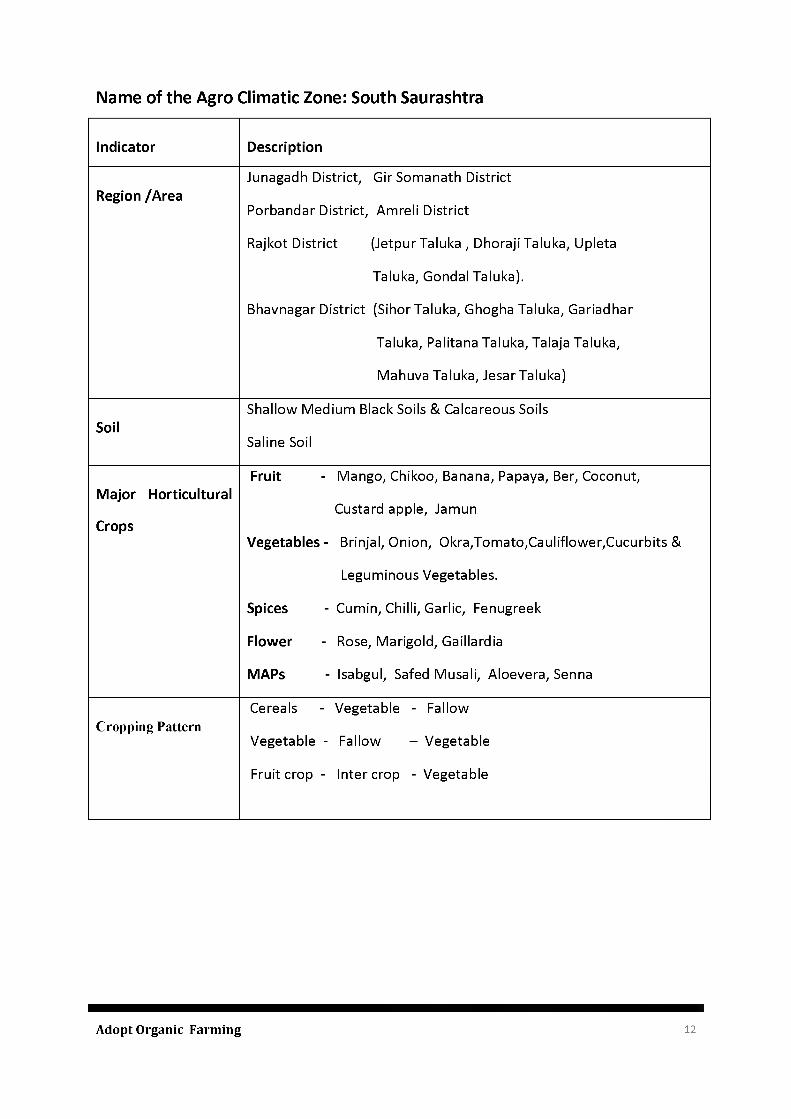
Name of the Agro Climatic Zone: South Saurashtra
Indicator Description
Region /AreaJunagadh District, Gir Somanath District
Porbandar District, Amreli District
Rajkot District (Jetpur Taluka , Dhoraji Taluka, Upleta
Taluka, Gondal Taluka).
Bhavnagar District (Sihor Taluka, Ghogha Taluka, Gariadhar
Taluka, Palitana Taluka, Talaja Taluka,
Mahuva Taluka, Jesar Taluka)
SoilShallow Medium Black Soils & Calcareous Soils
Saline Soil
Major HorticulturalFruit - Mango, Chikoo, Banana, Papaya, Ber, Coconut,
Custard apple, JamunCrops
Vegetables - Brinjal, Onion, Okra,Tomato,Cauliflower,Cucurbits &
Leguminous Vegetables.
Spices - Cumin, Chilli, Garlic, Fenugreek
Flower - Rose, Marigold, Gaillardia
MAPs - Isabgul, Safed Musali, Aloevera, Senna
C ropping PatternCereals - Vegetable - Fallow
Vegetable - Fallow - Vegetable
Fruit crop - Inter crop - Vegetable
Adopt Organic Farming 12
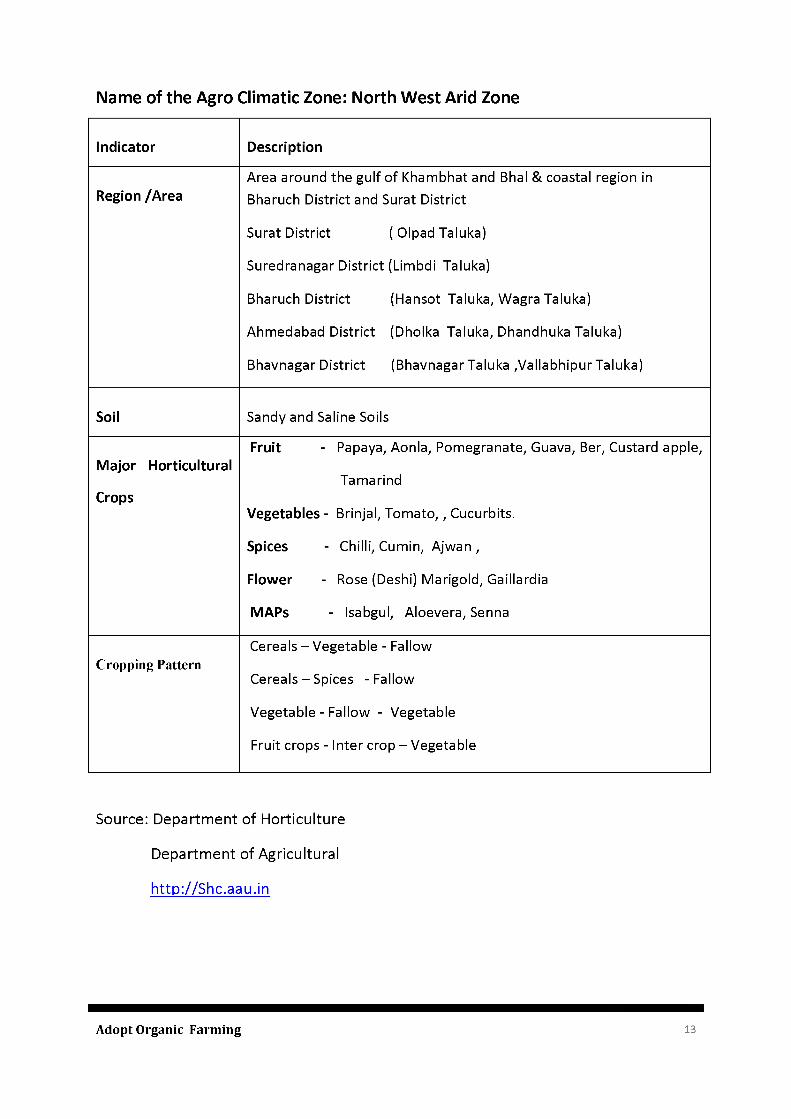
Name of the Agro Climatic Zone: North West Arid Zone
Indicator Description
Region /AreaArea around the gulf of Khambhat and Bhal & coastal region in Bharuch District and Surat District
Surat District ( Olpad Taluka)
Suredranagar District (Limbdi Taluka)
Bharuch District (Hansot Taluka, Wagra Taluka)
Ahmedabad District (Dholka Taluka, Dhandhuka Taluka)
Bhavnagar District (Bhavnagar Taluka ,Vallabhipur Taluka)
Soil Sandy and Saline Soils
Major HorticulturalFruit - Papaya, Aonla, Pomegranate, Guava, Ber, Custard apple,
TamarindCrops
Vegetables - Brinjal, Tomato, , Cucurbits.
Spices - Chilli, Cumin, Ajwan ,
Flower - Rose (Deshi) Marigold, Gaillardia
MAPs - Isabgul, Aloevera, Senna
C ropping PatternCereals - Vegetable - Fallow
Cereals - Spices - Fallow
Vegetable - Fallow - Vegetable
Fruit crops - Inter crop - Vegetable
Source: Department of Horticulture
Department of Agricultural
http://Shc.aau.in
Adopt Organic Farming 13
Chapter- 3
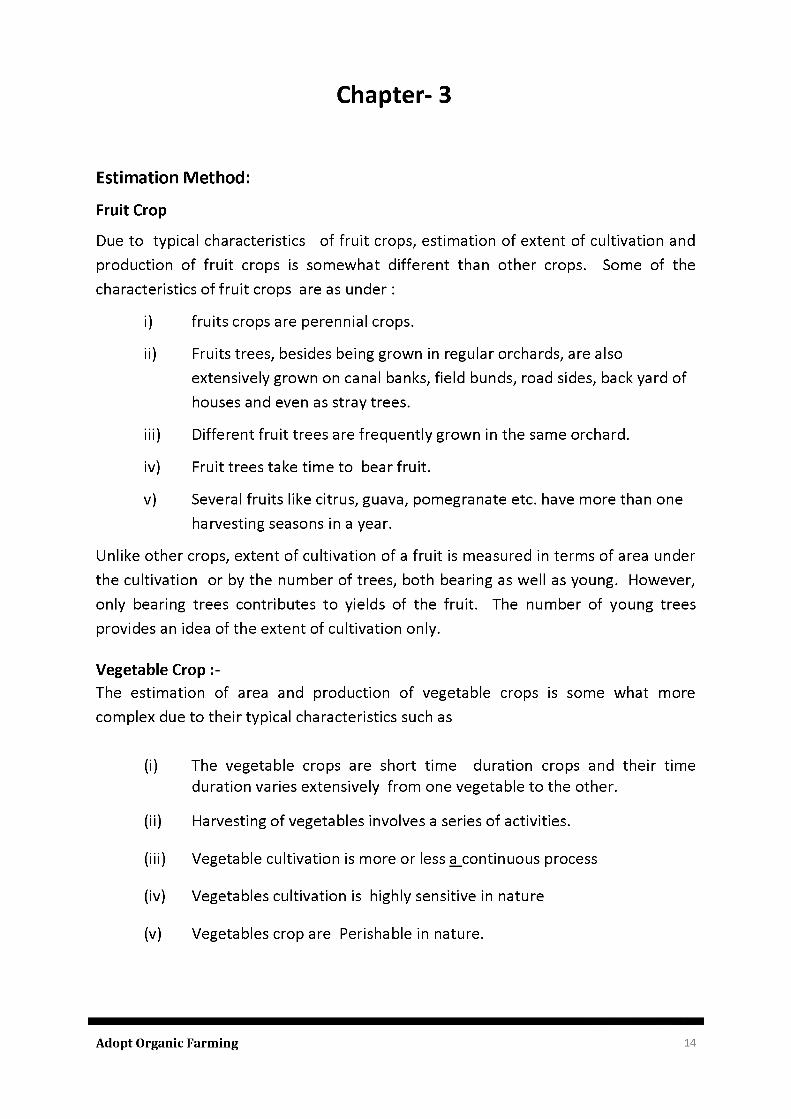
Estimation Method:
Fruit Crop
Due to typical characteristics of fruit crops, estimation of extent of cultivation and production of fruit crops is somewhat different than other crops. Some of the characteristics of fruit crops are as under :
i) fruits crops are perennial crops.
ii) Fruits trees, besides being grown in regular orchards, are also extensively grown on canal banks, field bunds, road sides, back yard of houses and even as stray trees.
iii) Different fruit trees are frequently grown in the same orchard.
iv) Fruit trees take time to bear fruit.
v) Several fruits like citrus, guava, pomegranate etc. have more than one harvesting seasons in a year.
Unlike other crops, extent of cultivation of a fruit is measured in terms of area under the cultivation or by the number of trees, both bearing as well as young. However, only bearing trees contributes to yields of the fruit. The number of young trees provides an idea of the extent of cultivation only.
Vegetable Crop :-The estimation of area and production of vegetable crops is some what more complex due to their typical characteristics such as
(i) The vegetable crops are short time duration crops and their time duration varies extensively from one vegetable to the other.
(ii) Harvesting of vegetables involves a series of activities.
(iii) Vegetable cultivation is more or less ^continuous process
(iv) Vegetables cultivation is highly sensitive in nature
(v) Vegetables crop are Perishable in nature.
Adopt Organic Farming 14
Salient features:
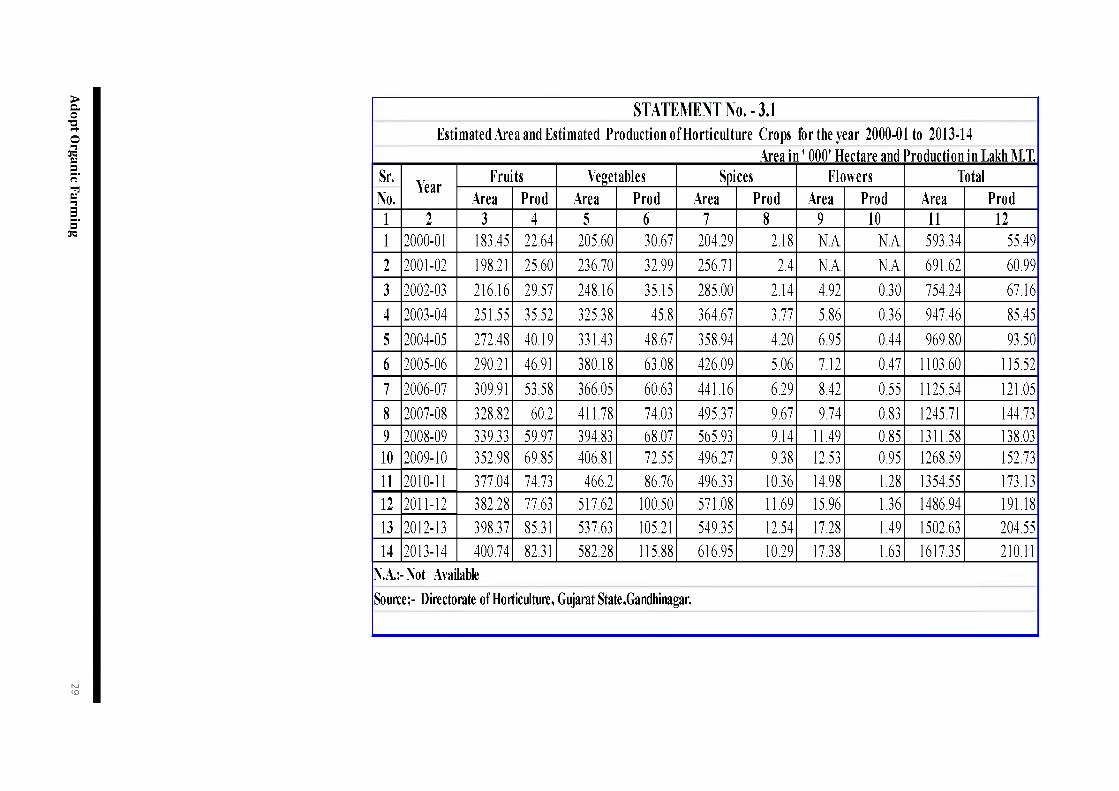
Salient feature of Estimated Area and Estimated Production under Fruit Crop, Vegetables, Spices & Flower Crop for the year 2000-01 to 2013-14 are as under.
Fruit:
The area under fruit crop have increased from 1.83 lakh ha in 2000-01 to 4.00 lakh ha in 2013-14, showing a rise of 118.4 per cent. The production of fruit crop went up from 22.64 lakh MT in 2000-01 to 82.31 lakh MT in 2013-14, indicating a rise of 263.56 per cent. Thus, an area and production of fruit crop have increased substantially during the time span of 13 years.
Vegetable:
The area under Vegetables crop have increased from 2.06 lakh ha in 2000-01 to 5.82 lakh ha in2013-14, showing a rise of 183.21 per cent. The production of Vegetables crop went up from 30.67 lakh MT in 2000-01 to 115.88 lakh MT in 2013-14, indicating a rise of 277.83 per cent. Thus, an area and production of Vegetables crop have increased substantially during the time span of 13 years.
Spices:
The area under Spices crop have increased from 2.04 lakh ha in 2000-01 to 6.16 lakh ha in 2013-14, showing a rise of 202.00 per cent. The production of Spices crop went up from 2.18 lakh MT in 2000-01 to 10.29 lakh MT in 2013-14, indicating a rise of 372.01 per cent. Thus, an area and production of Spices crop have increased substantially during the time span of 13 years.
Flower:
The area under Flower crop have increased from 0.05 lakh ha in 2002-03 to 0.17 lakh ha in 2013-14, showing a rise of 253.25 per cent. The production of Flower crop went up from 0.30 lakh MT in 2002-03 to 1.63 lakh MT in 2013-14, indicating a rise of 433.33 per cent. Thus, an area and production of Flower crop have increased substantially during the time span of 13 years.
Adopt Organic Farming 15
Total Horticultural Crop :
The area under Total Horticultural Crop have increased from 7.54 lakh ha in 2002-03 to 16.17 lakh ha in 2013-14, showing a rise of 114.43 per cent. The production of Total Horticultural Crop went up from 67.16 lakh MT in 2002-03 to 210.11 lakh MT in 2013-14, indicating a rise of 212.84 per cent. Thus, an area and production of Total Horticultural Crop have increased substantially during the time span of 11 years.
Salient features of fruit crop :
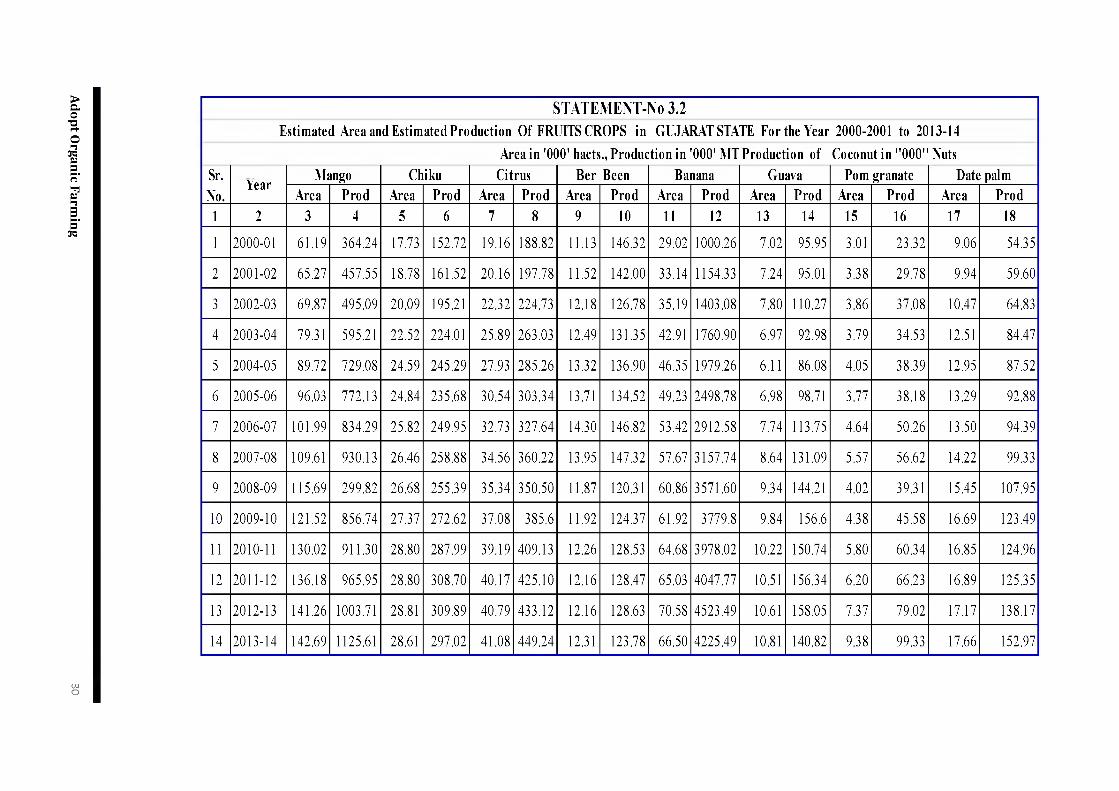
Salient feature of Estimated Area and Estimated Production under fruit crop for the year 2000-01 to 2013-14 are as under.
Mango:
The area under Mango crop have increased from 0.61 lakh ha in 2000-01 to 1.42
lakh ha in 2013-14, showing a rise of 133.19 per cent. The production of Mango
crop went up from 364.24 lakh MT in 2000-01 to 1125.61 lakh MT in 2013-14, indicating a rise of 209.03 per cent. Thus, an area and production of Mango crop have increased substantially during the time span of 13 years.
Chiku:
The area under Chiku crop have increased from 0.18 lakh ha in 2000-01 to 0.29 lakh ha in 2013-14, showing a rise of 61.36 per cent. The production of Chiku crop went up from 152.72 lakh MT in 2000-01 to 297.02 lakh MT in 2013-14, indicating a rise of 94.49 per cent. Thus, an area and production of Chiku crop have increased marginally during the time span of 13 years.
Citrus:
The area under Citrus crop have increased from 0.19 lakh ha in 2000-01 to 0.41 lakh ha in 2013-14, showing a rise of 114.41 per cent. The production of Citrus crop went up from 188.82 lakh MT in 2000-01 to 449.24 lakh MT in 2013-14, indicating a rise of 137.92 per cent. Thus, an area and production of Citrus crop have increased substantially during the time span of 13 years.
Adopt Organic Farming 16
Ber Been:
The area under Ber Been crop have increased from 0.11 lakh ha in 2000-01 to 0.12 lakh ha in 2013-14, showing a rise of 10.60 per cent. The production of Ber Been crop went up from 146.32 lakh MT in 2000-01 to 123.78 lakh MT in 2013-14, decreaed by 15.40 per cent.
Banana:
The area under Banana crop have increased from 0.29 lakh ha in 2000-01 to 0.66 lakh ha in 2013-14, showing a rise of 129.15 per cent. The production of Banana crop went up from 1000.26 lakh MT in 2000-01 to 4225.49 lakh MT in 2013-14, indicating a rise of 322.44 per cent. Thus, an area and production of Banana crop have increased substantially during the time span of 13 years.
Guava:
The area under Guava crop have increased from 0.07 lakh ha in 2000-01 to 0.11 lakh ha in 2013-14, showing a rise of 53.99 per cent. The production of Guava crop went up from 95.95 lakh MT in 2000-01 to 140.82 lakh MT in 2013-14, indicating a rise of 46.76 per cent. Guava crop have increased marginally during the time span of 13 years.
Pom granate:
The area under Pomgranate crop have increased from 0.03 lakh ha in 2000-01 to 0.09 lakh hain 2013-14, showing a rise of 211.63 per cent. The production of Pomgranate crop went up from 23.32 lakh MT in 2000-01 to 99.33 lakh MT in 201314, indicating a rise of 325.94 per cent. Thus, an area and production of Pomgranate crop have increased substantially during the time span of 13 years.
Date palm:
The area under Date palm crop have increased from 0.09 lakh ha in 2000-01 to 0.18
lakh ha in 2013-14, showing a rise of 94.92 per cent. The production of Date palm
crop went up from 54.35 lakh MT in 2000-01 to 152.97 lakh MT in 2013-14, indicating a rise of 181.45 per cent. Thus, an area and production of Date palm crop have increased substantially during the time span of 13 years.
Adopt Organic Farming 17
Papaya:
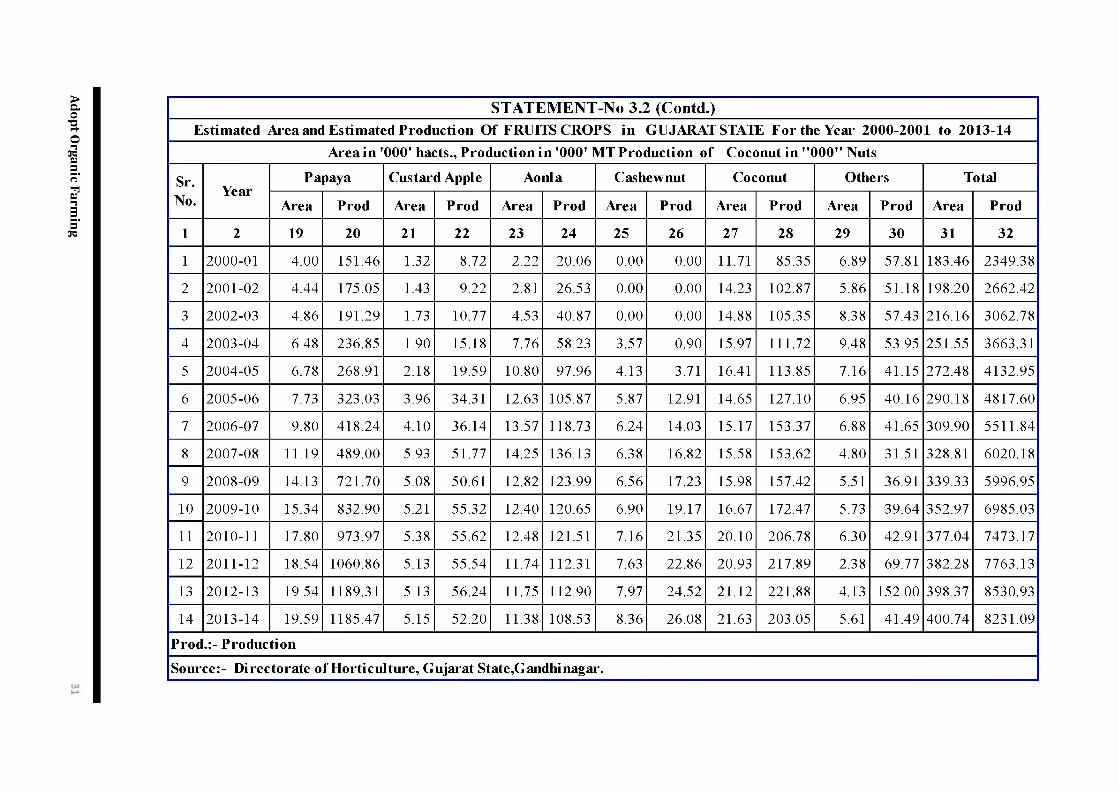
The area under Papaya crop have increased from 0.04 lakh ha in 2000-01 to 0.20 lakh ha in 2013-14, showing a rise of 389.75 per cent. The production of Papaya crop went up from 151.46 lakh MT in 2000-01 to 1185.47 lakh MT in 2013-14, indicating a rise of 682.70 per cent. Thus, an area and production of Papaya crop have increased substantially during the time span of 13 years.
Custard Apple:
The area under Custard Apple crop have increased from 0.01 lakh ha in 2000-01 to 0.05 lakh ha in2013-14, showing a rise of 290.15 per cent. The production of Custard Apple crop went up from 8.72 lakh MT in 2000-01 to 52.20 lakh MT in 2013-14, indicating a rise of 498.62 per cent. Thus, an area and production of Custard Apple crop have increased substantially during the time span of 13 years.
Alonla:
The area under Alonla crop have increased from 0.02 lakh ha in 2000-01 to 0.11 lakh ha in 2013-14, showing a rise of 412.61 per cent. The production of Alonla crop went up from 20.06 lakh MT in 2000-01 to 108.53 lakh MT in 2013-14, indicating a rise of 441.03 per cent. Thus, an area and production of Alonla crop have increased substantially during the span of 13 years.
Cashew nut:
The area under Cashew nut crop have increased from 0.04 lakh ha in 2003-04 to 0.08 lakh ha in 2013-14, showing a rise of 134.17 per cent. The production of Cashew nut crop went up from 0.90 lakh MT in 2003-04 to 26.08 lakh MT in 201314, indicating a rise of 2797.78 per cent. Thus, an area and production of Cashew nut crop have increased substantially during the time span of 13 years.
Coconut:
The area under Coconut crop have increased from 0.12 lakh ha in 2000-01 to 0.22 lakh ha in 2013-14, showing a rise of 84.71 per cent. The production of Coconut crop went up from 85.35 lakh MT in 2000-01 to 203.05 lakh MT in 201314, indicating a rise of 137.90 per cent. Thus, an area and production of Coconut crop have increased substantially during the time span of 13 years.
Adopt Organic Farming 18
Total Fruit Crop :
The area under Total Fruit Crop have increased from 1.83 lakh ha in 2000-01 to 4.01 lakh ha in 2013-14, showing a rise of 118.43 per cent. The production of Total Fruit Crop went up from 2349.38 lakh MT in 2000-01 to 8231.09 lakh MT in 2013-14, indicating a rise of 250.35 per cent. Thus, an area and production of Total Fruit Crop have increased substantially during the time span of 13 years.
Salient features of Vegetables crop :
Salient feature of Estimated Area and Estimated production under vegetables crops for the year 2000-01 to 2013-14 are as under.
Potato:
The area under Potato crop have increased from 0.42 lakh ha in 2000-01 to 0.74 lakh ha in 2013-14, showing a rise of 76.93 per cent. The production of Potato crop went up from 1033 lakh MT in 2000-01 to 2294.95 lakh MT in 2013-14, indicating a rise of 122.13 per cent. Thus, an area and production of Potato crop have increased marginally during the time span of 13 years.
Onion:
The area under Onion crop have increased from 0.10 lakh ha in 2000-01 to 0.73 lakh ha in 2013-14, showing a rise of 661.40 per cent. The production of Onion crop went up from 213.17 lakh MT in 2000-01 to 1840.37 lakh MT in 2013-14, indicating a rise of 763.33 per cent. Thus, an area and production of Onion crop have increased remarkably during the time span of 13 years.
Brinjal:
The area under Brinjal crop have increased from 0.31 lakh ha in 2000-01 to 0.76 lakh ha in 2013-14, showing a rise of 143.70 per cent. The production of Brinjal crop went up from 543.08 lakh MT in 2000-01 to 1476.99 lakh MT in 2013-14, indicating a rise of 171.97 per cent. Thus, an area and production of Brinjal crop have increased substantially during the time span of 13 years.
Adopt Organic Farming 19
Cabbage:
The area under Cabbage crop have increased from 0.09 lakh ha in 2000-01 to 0.30 lakh ha in 2013-14, showing a rise of 229.53 per cent. The production of Cabbage crop went up from 149.50 lakh MT in 2000-01 to 661.40 lakh MT in 201314, indicating a rise of 342.41 per cent. Thus, an area and production of Cabbage crop have increased substantially during the time span of 13 years.
Okra:
The area under Okra crop have increased from 0.25 lakh ha in 2000-01 to 0.66 lakh ha in 2013-14, showing a rise of 163.26 per cent. The production of Okra crop went up from 183.63 lakh MT in 2000-01 to 759.04 lakh MT in 2013-14, indicating a rise of 313.35 per cent. Thus, an area and production of Okra crop have increased substantially during the span of 13 years.
Tomato:
The area under Tomato crop have increased from 0.14 lakh ha in 2000-01 to 0.45 lakh ha in 2013-14, showing a rise of 210.16 per cent. The production of Tomato crop went up from 239.23 lakh MT in 2000-01 to 1259.10 lakh MT in 2013-14, indicating a rise of 426.31 per cent. Thus, an area and production of Tomato crop have increased remarkably during the time span of 13 years.
Cauliflower:
The area under Cauliflower crop have increased from 0.08 lakh ha in 2000-01 to 0.28 lakh ha in 2013-14, showing a rise of 230.15 per cent. The production of Cauliflower crop went up from 136.44 lakh MT in 2000-01 to 601.48 lakh MT in 2013-14, indicating a rise of 340.84 per cent. Thus, an area and production of Cauliflower crop have increased remarkably during the time span of 13 years.
Cluster been:
The area under Cluster been crop have increased from 0.14 lakh ha in 2000-01 to 0.41 lakh ha in 2013-14, showing a rise of 185.02 per cent. The production of Cluster been crop went up from 72.29 lakh MT in 2000-01 to 410.03 lakh MT in 2013-14, indicating a rise of 467.20 per cent. Thus, an area and production of Cluster been crop have increased substantially during the time span of 13 years.
Adopt Organic Farming 20
Cowpea:
The area under Cowpea crop have increased from 0.05 lakh ha in 2001-02 to 0.27 lakh ha in 2013-14, showing a rice of 492.07 per cent. The production of Cowpea crop went up from 23.9 lakh MT in 2001-02 to 285.33 lakh MT in 2013-14, indicating a rise of 1093.85 per cent. Thus, an area and production of Cowpea crop have increased substantially during the time span of 13 years.
Cucurbits:
The area under Cucurbits crop have increased from 0.41 lakh ha in 2006-07 to 0.72 lakh ha in 2013-14, showing a rise of 76.42 per cent. The production of Cucurbits crop went up from 407.60 lakh MT in 2006-07 to 1127.04 lakh MT in 2013-14, indicating a rise of 176.51 per cent. Thus, an area and production of Cucurbits crop have increased substantially during the time span of 13 years.
Total Vegetable Crop :
The area under Total Vegetable Crop have increased from 2.05 lakh ha in 2000-01 to 5.82 lakh ha in 2013-14, showing a rise of 183.20 per cent. The production of Total Vegetable Crop went up from 3066.79 lakh MT in 2000-01 to 11588.05 lakh MT in 2013-14, indicating a rise of 277.86 per cent. Thus, an area and production of Total Vegetable Crop have increased substantially during the time span of 13 years.
Salient features of Spices crop :
Salient feature of Estimated Area and Estimated production under spices crop for the year 2000-01 to 2013-14 are as under.
Cumin:
The area under Cumin crop have increased from 1.16 lakh ha in 2000-01 to 4.55
lakh ha in 2013-14, showing a rise of 292.36 per cent. The production of Cumin crop
went up from 62.60 lakh MT in 2000-01 to 364.65 lakh MT in 2013-14, indicating a rise of 482.50 per cent. Thus, an area and production of Cumin crop have increased remarkably during the time span of 13 years.
Adopt Organic Farming 21
Fennel:
The area under Fennel crop have increased from 0.19 lakh ha in 2000-01 to 0.22 lakh ha in 2013-14, showing a rise of 16.50 per cent. The production of Fennel crop went up from 23.54 lakh MT in 2000-01 to 45.02 lakh MT in 2013-14, indicating a rise of 91.24 per cent.
Chilly:
The area under Chilly crop have increased from 0.20 lakh ha in 2000-01 to 0.19 lakh ha in 2013-14, decried by 3.15 per cent. The production of Chilly crop went up from 30.98 lakh MT in 2000-01 to 33.30 lakh MT in 2013-14, indicating a rise of 7.48 per cent.
Garlic:
The area under Garlic crop have increased from 0.05 lakh ha in 2000-01 to 0.41 lakh ha in 2013-14, showing a rise of 653.25 per cent. The production of Garlic crop went up from 23.38 lakh MT in 2000-01 to 318.20 lakh MT in 2013-14, indicating a rise of 1260.99 per cent. Thus, an area and production of Garlic crop have increased remarkably during the time span of 13 years.
Coriander:
The area under Coriander crop have increased from 0.02 lakh ha in 2000-01 to
0.44 lakh ha in 2013-14showing a rise of 2636.65 per cent. The production of Coriander crop went up from 1.68 lakh MT in 2000-01 to 64.38 lakh MT in 2013-14, indicating a rise of 3732.14 per cent. Thus, an area and production of Coriander crop have increased remarkably during the time span of 13 years.
Ginger:
The area under Ginger crop have increased from 0.01 lakh ha in 2000-01 to 0.06 lakh ha in 2013-14, showing a rise of 414.91 per cent. The production of Ginger crop went up from 18.26 lakh MT in 2000-01 to 118.23 lakh MT in 2013-14, indicating a rise of 547.48 per cent. Thus, an area and production of Ginger crop have increased substantially during the time span of 13 years.
Adopt Organic Farming 22
Turmeric:
The area under Turmeric crop have increased from 0.0053 lakh ha in 2000-01 to 0.03 lakh ha in 2013-14, showing a rise of 494.34 per cent. The production of Turmeric crop went up from 8.71 lakh MT in 2000-01 to 52.06 lakh MT in 2013-14, indicating a rise of 497.70 per cent. Thus, an area and production of Turmeric crop have increased remarkably during the time span of 13 years.
Fenugreek:
The area under Fenugreek crop have increased from 0.05 lakh ha in 2000-01 to 0.05 lakh ha in2013-14, decried by 0.19 per cent. The production of Fenugreek crop went up from 5.84 lakh MT in 2000-01 to 10.09 lakh MT in 2013-14, indicating a rise of 72.77 per cent. Thus, an area and production of Fenugreek crop have increased substantially during the time span of 13 years.
Isabgul:
The area under Isabgul crop have increased from 0.15 lakh ha in 2001-02 to 0.08 lakh ha in 2013-14, decreasing 74.45 per cent. The production of Isabgul crop went up from 20.88 lakh MT in 2001-02 to 9.26 lakh MT in 2013-14, decreaed by 53.93 per cent.
Ajawan:
The area under Ajawan crop have increased from 0.05 lakh ha in 2006-07 to 0.06 lakh ha in 2013-14, decreasing 16.17 per cent. The production of Ajawan crop went up from 2.55 lakh MT in 2006-07 to 5.02 lakh MT in 2013-14, indicating a rise of 48.96 per cent.
Suva:
The area under Suva crop have increased from 0.11 lakh ha in 2000-01 to 0.07 lakh ha in 2013-14, decreasing a rise of 35.37 per cent. The production of Suva crop went up from 11.19 lakh MT in 2000-01 to 9.01 lakh MT in 2013-14, decreaed by 19.48 per cent.
Adopt Organic Farming 23
Total Spices Crop :
The area under Total Spices Crop have increased from 2.04 lakh ha in 2000-01 to 6.17 lakh ha in 2013-14, showing a rise of 202.49 per cent. The production of Total Spices Crop went up from 217.60 lakh MT in 2000-01 to 1029.22 lakh MT in 201314, indicating a rise of 372.98 per cent. Thus, an area and production of Total Spices Crop have increased substantially during the time span of 13 years.
Salient features of Flower crop :
Salient feature of Estimated Area and Estimated production under flower crop for the year 2002-03 to 2013-14 are as under.
Rose:
The area under Rose crop have increased from 0.02 lakh ha in 2002-03 to 0.04 lakh ha in 2013-14, showing a rise of 140.94 per cent. The production of Rose crop went up from 9.11 lakh MT in 2002-03 to 37.36 lakh MT in 2013-14, indicating a rise of 310.1 per cent. Thus, an area and production of Rose crop have increased substantially during the time span of 11 years.
Merigold :
The area under Merigold crop have increased from 0.01 lakh ha in 2002-03 to 0.07 lakh ha in 2013-14, showing a rise of 390.48 per cent. The production of Merigold crop went up from 12.69 lakh MT in 2002-03to 68.93 lakh MT in 201314, indicating a rise of 443.18 per cent. Thus, an area and production of Merigold crop have increased substantially during the time span of 11 years.
Mogra:
The area under Mogra crop have increased from 0.0038 lakh ha in 2002-03 to 0.0082 lakh ha in 2013-14, showing a rise of 115.79 per cent. The production of Mogra crop went up from 2.60 lakh MT in 2002-03 to 7.76 lakh MT in 2013-14, indicating a rise of 198.46 per cent. Thus, an area and production of Mogra crop have increased remarkably during the time span of 11 years.
Adopt Organic Farming 24
Lilly:
The area under Lilly crop have increased from 0.0055 lakh ha in 2002-03 to 0.03 lakh ha in 2013-14, showing a rise of 507.27 per cent. The production of Lilly crop went up from 1.15 lakh MT in 2002-03 to 33.09 lakh MT in 2013-14, indicating a rise of 2777.4 per cent. Thus, an area and production of Lilly crop have increased remarkably during the time span of 11 years.
Total Flower Crop :
The area under Total flower Crop have increased from 0.05 lakh ha in 2002-03 to 0.17 lakh ha in 2013-14, showing a rise of 253.05 per cent. The production of Total flower Crop went up from 30.19 lakh MT in 2002-03 to 163.60 lakh MT in 2013-14, indicating a rise of 441.9 per cent. Thus, an area and production of Total flower Crop have increased substantially during the time span of 11 year 2013-14.
Adopt Organic Farming 25
Chapter-4Water Harvesting Structure
SARDAR SAROVAR PROJECT (SSP):
The Sardar Sarovar Project is an inter-state multidisciplinary project with a terminal dam on river Narmada at Kevadia in Gujarat. The adjoining state MadahyaPrdesh and Maharashtra will also get benefited from this project. Full implementation of the project will generate large scale employment due to transformation of the Agrobased economy of Gujarat.
The Sardar Sarovar Project will provide irrigation facilities to 18.45 lac ha. of land, covering 3112 villages of 73 talukas in 15 districts of Gujarat through main canal, branch canal, sub-branch canal, minor canal, sub-minor canal with total length of 19,889 km.It will also irrigate 2,46,000 ha. of land in the strategic desert districts of Barmer and Jallore in Rajasthan and 37,500 ha. in the tribal hilly tract of Maharashtra through lift. About 75% of the command area in Gujarat is drought prone while entire command in Rajasthan is drought prone. Assured water supply will soon make.
Through RWS & PIM, maximum water use efficiency can be achieved. Water hazards due to over watering - salinity and water logging - can be prevented leading to sustain agricultural benefits to small and marginal farmers in the command area.
Small & Medium size Water Harvesting Structure:
There are 202 Small & Medium size State owned Water Harvesting Structure. The
maximum location of Water Harvesting Structure are in Rajkot, Jamnagar, Junagadh,
Kachchh, Bhavnagar, Amreli, Surendranagar, Botad and Devbhumi Dwarka District.
The major Water Harvesting Structure by theire storage potential are in Arvali,
Banaskantha, Bhavnagar, Chotaudaipur, Dahod, Jamnagar, Rajkot, Morbi, Kachchh,
Mehasana, Narmada, Panchmahal, Sabarkantha, Tapi and Valsad.
Adopt Organic Farming 26
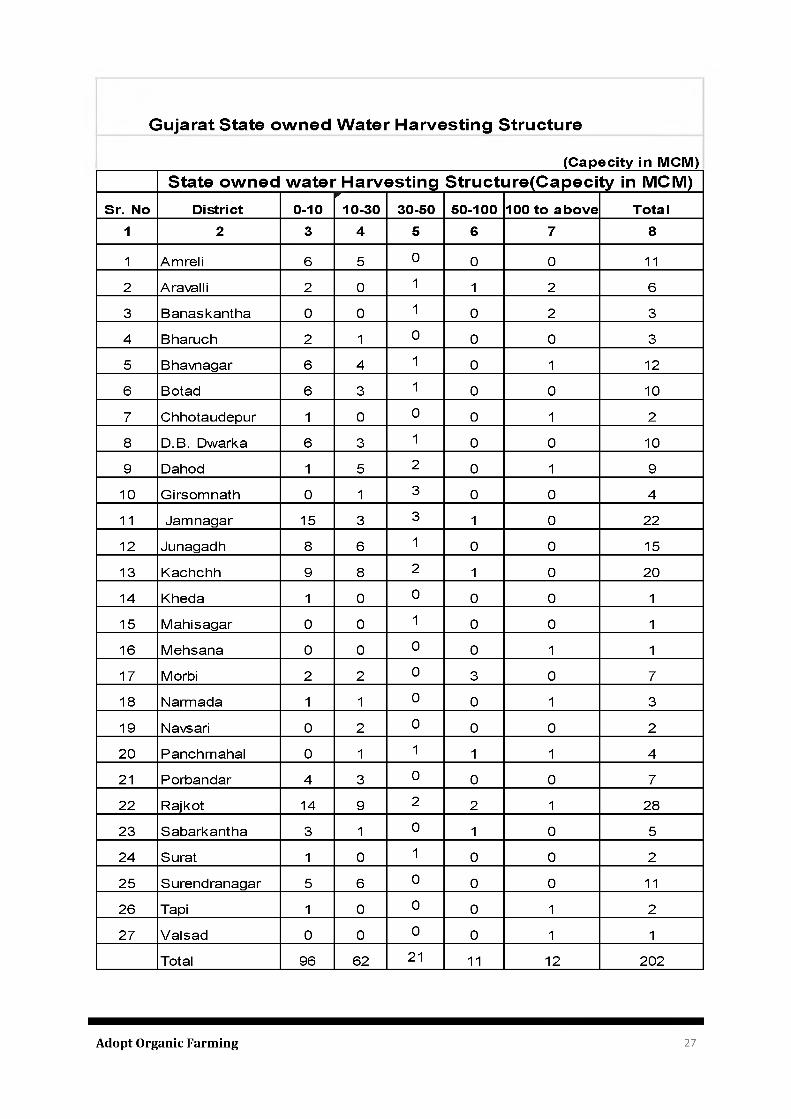
Gujarat State ow ned W ater Harvesting Structure
__________________________________________________________(C apec ity in M CM )State ow ned w ater Harvesting Structure(Capecity in MCM)
-----------------------------------v-------- ---------- ----------- -------------------------------------Sr. No District 0-10 10-30 30-50 50-100 100 to above Total
1 2 3 4 5 6 7 8
1 Am re li 6 5 0 0 0 112 Aravalli 2 0 1 1 2 63 Banaskan tha 0 0 1 0 2 34 Bharuch 2 1 0 0 0 35 Bhavnagar 6 4 1 0 1 126 Botad 6 3 1 0 0 107 Chho taudepu r 1 0 0 0 1 28 D.B. Dwarka 6 3 1 0 0 109 Dahod 1 5 2 0 1 910 G irsom na th 0 1 3 0 0 411 Jam naga r 15 3 3 1 0 2212 Junagadh 8 6 1 0 0 1513 Kachchh 9 8 2 1 0 2014 Kheda 1 0 0 0 0 115 M ah isaga r 0 0 1 0 0 116 M ehsana 0 0 0 0 1 117 Morbi 2 2 0 3 0 718 Narm ada 1 1 0 0 1 319 Navsari 0 2 0 0 0 220 Panchm aha l 0 1 1 1 1 421 Po rbanda r 4 3 0 0 0 722 Ra jko t 14 9 2 2 1 2823 Saba rkan tha 3 1 0 1 0 524 Sura t 1 0 1 0 0 225 Surendranagar 5 6 0 0 0 1126 Tapi 1 0 0 0 1 227 V a lsad 0 0 0 0 1 1
Total 96 62 21 11 12 202
Adopt Organic Farming 27

STATEMENT
Adopt Organic Farming 28
Adopt Organic Farming
S T A T E M E N T N o . -3 .1Estimated Area and Estimated Production of Horticulture Crops for the year 2000-01 to 2013-14
Area in ' 000' Hectare and Production in Lakh M.T.Sr.
YearFruits Vegel ables Spices Flowers Total
No. Area Prod Area Prod Area Prod Area Prod Area Prod1 2 3 4 5 6 7 8 9 10 11 121 2 0 0 0 -0 1 183 .4 5 2 2 .6 4 2 0 5 .6 0 3 0 .6 7 2 0 4 .2 9 2 .1 8 N .A N .A 5 9 3 .3 4 5 5 .4 9
2 2 0 0 1 -0 2 198 .21 2 5 .6 0 2 3 6 .7 0 3 2 .9 9 25 6 .7 1 2 .4 N .A N .A 6 9 1 .6 2 6 0 .9 9
3 2 0 0 2 -0 3 2 1 6 .1 6 2 9 .5 7 2 4 8 .1 6 3 5 .1 5 2 8 5 .0 0 2 .1 4 4 .9 2 0 .3 0 7 5 4 .2 4 6 7 .1 6
4 2 0 0 3 -0 4 2 5 1 .5 5 3 5 .5 2 3 2 5 .3 8 4 5 .8 3 6 4 .6 7 3 .77 5 .8 6 0 .3 6 9 4 7 .4 6 8 5 .4 5
5 2 0 0 4 -0 5 2 7 2 .4 8 4 0 .1 9 3 3 1 .4 3 4 8 .6 7 3 5 8 .9 4 4 .2 0 6 .9 5 0 .4 4 9 6 9 .8 0 9 3 .5 0
6 2 0 0 5 -0 6 2 9 0 .2 1 46 .91 3 8 0 .1 8 6 3 .0 8 4 2 6 .0 9 5 .06 7 .1 2 0 .4 7 1 1 0 3 .6 0 115 .5 2
7 2 0 0 6 -0 7 309 .9 1 5 3 .5 8 3 6 6 .0 5 6 0 .6 3 4 4 1 .1 6 6 .2 9 8 .4 2 0 .5 5 1 1 2 5 .5 4 121 .05
8 2 0 0 7 -0 8 3 2 8 .8 2 6 0 .2 4 1 1 .7 8 7 4 .0 3 4 9 5 .3 7 9 .67 9 .7 4 0 .83 1245 .71 144 .739 2 0 0 8 -0 9 3 3 9 .3 3 5 9 .9 7 3 9 4 .8 3 6 8 .0 7 5 6 5 .9 3 9 .14 11.49 0 .8 5 1 3 1 1 .5 8 138 .0310 2 0 0 9 -1 0 3 5 2 .9 8 6 9 .8 5 406 .8 1 7 2 .5 5 4 9 6 .2 7 9 .38 12.53 0 .9 5 1 2 6 8 .5 9 152 .7311 2 0 1 0 -1 1 3 7 7 .0 4 7 4 .7 3 4 6 6 .2 8 6 .7 6 4 9 6 .3 3 10.36 14 .98 1.28 135 4 .5 5 173 .1312 2 0 1 1 -1 2 3 8 2 .2 8 7 7 .6 3 5 1 7 .6 2 100 .5 0 5 7 1 .0 8 11.69 15.96 1.36 1 4 8 6 .9 4 191 .1 813 2 0 1 2 -1 3 3 9 8 .3 7 85.31 5 3 7 .6 3 105.21 5 4 9 .3 5 12.54 17.28 1.49 150 2 .6 3 2 0 4 .5 514 2 0 1 3 -1 4 4 0 0 .7 4 82.31 5 8 2 .2 8 115 .8 8 6 1 6 .9 5 10.29 17.38 1.63 1 6 1 7 .3 5 210 .1 1
N.A:-Not Available
Source;- Directorate of Horticulture, Gujarat State,Gandhinagar.
NJCO
Adopt Organic Farming
STATEMENT-No 3.2
Estimated Area and Estimated Production Of FRUITS CROPS in GUJARAT STATE For the Year 2000-2001 to 2013-14
Area in '000' hacts., Production in '000' MTProduction of Coconut in "000" NutsSr. Mango Chiku Citrus Ber Been Banana Guava Pom granate Date palmNo.
YearArea Prod Area Prod Area Prod Area Prod Area Prod Area Prod Area Prod Area Prod
1 2 3 4 5 6 7 8 9 10 11 12 13 14 15 16 17 18
1 2000-01 61.19 364.24 17.73 152.72 19.16 188.82 11.13 146.32 29.02 1000.26 7.02 95.95 3.01 23.32 9.06 54.35
2 2001-02 65.27 457.55 18.78 161.52 20.16 197.78 11.52 142.00 33.14 1154.33 7.24 95.01 3.38 29.78 9.94 59.60
3 2002-03 69.87 495.09 20.09 195.21 22.32 224.73 12.18 126.78 35.19 1403.08 7.80 110.27 3.86 37.08 10.47 64.83
4 2003-04 79.31 595.21 22.52 224.01 25.89 263.03 12.49 131.35 42.91 1760.90 6.97 92.98 3.79 34.53 12.51 84.47
5 2004-05 89.72 729.08 24.59 245.29 27.93 285.26 13.32 136.90 46.35 1979.26 6.11 86.08 4.05 38.39 12.95 87.52
6 2005-06 96.03 772.13 24.84 235.68 30.54 303.34 13.71 134.52 49.23 2498.78 6.98 98.71 3.77 38.18 13.29 92.88
7 2006-07 101.99 834.29 25.82 249.95 32.73 327.64 14.30 146.82 53.42 2912.58 7.74 113.75 4.64 50.26 13.50 94.39
8 2007-08 109.61 930.13 26.46 258.88 34.56 360.22 13.95 147.32 57.67 3157.74 8.64 131.09 5.57 56.62 14.22 99.33
9 2008-09 115.69 299.82 26.68 255.39 35.34 350.50 11.87 120.31 60.86 3571.60 9.34 144.21 4.02 39.31 15.45 107.95
10 2009-10 121.52 856.74 27.37 272.62 37.08 385.6 11.92 124.37 61.92 3779.8 9.84 156.6 4.38 45.58 16.69 123.49
11 2010-11 130.02 911.30 28.80 287.99 39.19 409.13 12.26 128.53 64.68 3978.02 10.22 150.74 5.80 60.34 16.85 124.96
12 2011-12 136.18 965.95 28.80 308.70 40.17 425.10 12.16 128.47 65.03 4047.77 10.51 156.34 6.20 66.23 16.89 125.35
13 2012-13 141.26 1003.71 28.81 309.89 40.79 433.12 12.16 128.63 70.58 4523.49 10.61 158.05 7.37 79.02 17.17 138.17
14 2013-14 142.69 1125.61 28.61 297.02 41.08 449.24 12.31 123.78 66.50 4225.49 10.81 140.82 9.38 99.33 17.66 152.97
COO
Adopt Organic Farming
STATEMENT-No 3.2 (Contd.)Estimated Area and Estimated Production Of FRUITS CROPS in GUJARAT STATE For the Year 2000-2001 to 2013-14
Area in '000' hacts., Production in '000' MT Production of Coconut in "000" Nuts
Sr.No. Year
Papaya Custard Apple Aonla Cashewnut Coconut Others Total
Area Prod Area Prod Area Prod Area Prod Area Prod Area Prod Area Prod
1 2 19 20 21 22 23 24 25 26 27 28 29 30 31 32
1 2000-01 4.00 151.46 1.32 8.72 2.22 20.06 0.00 0.00 11.71 85.35 6.89 57.81 183.46 2349.38
2 2001-02 4.44 175.05 1.43 9.22 2.81 26.53 0.00 0.00 14.23 102.87 5.86 51.18 198.20 2662.42
3 2002-03 4.86 191.29 1.73 10.77 4.53 40.87 0.00 0.00 14.88 105.35 8.38 57.43 216.16 3062.78
4 2003-04 6.48 236.85 1.90 15.18 7.76 58.23 3.57 0.90 15.97 111.72 9.48 53.95 251.55 3663.31
5 2004-05 6.78 268.91 2.18 19.59 10.80 97.96 4.13 3.71 16.41 113.85 7.16 41.15 272.48 4132.95
6 2005-06 7.73 323.03 3.96 34.31 12.63 105.87 5.87 12.91 14.65 127.10 6.95 40.16 290.18 4817.60
7 2006-07 9.80 418.24 4.10 36.14 13.57 118.73 6.24 14.03 15.17 153.37 6.88 41.65 309.90 5511.84
8 2007-08 11.19 489.00 5.93 51.77 14.25 136.13 6.38 16.82 15.58 153.62 4.80 31.51 328.81 6020.18
9 2008-09 14.13 721.70 5.08 50.61 12.82 123.99 6.56 17.23 15.98 157.42 5.51 36.91 339.33 5996.95
10 2009-10 15.34 832.90 5.21 55.32 12.40 120.65 6.90 19.17 16.67 172.47 5.73 39.64 352.97 6985.03
11 2010-11 17.80 973.97 5.38 55.62 12.48 121.51 7.16 21.35 20.10 206.78 6.30 42.91 377.04 7473.17
12 2011-12 18.54 1060.86 5.13 55.54 11.74 112.31 7.63 22.86 20.93 217.89 2.38 69.77 382.28 7763.13
13 2012-13 19.54 1189.31 5.13 56.24 11.75 112.90 7.97 24.52 21.12 221.88 4.13 152.00 398.37 8530.93
14 2013-14 19.59 1185.47 5.15 52.20 11.38 108.53 8.36 26.08 21.63 203.05 5.61 41.49 400.74 8231.09
Prod.:- ProductionSource:- Directorate of Horticulture, Gujarat State, Gandhinagar.
Adopt Organic Farming
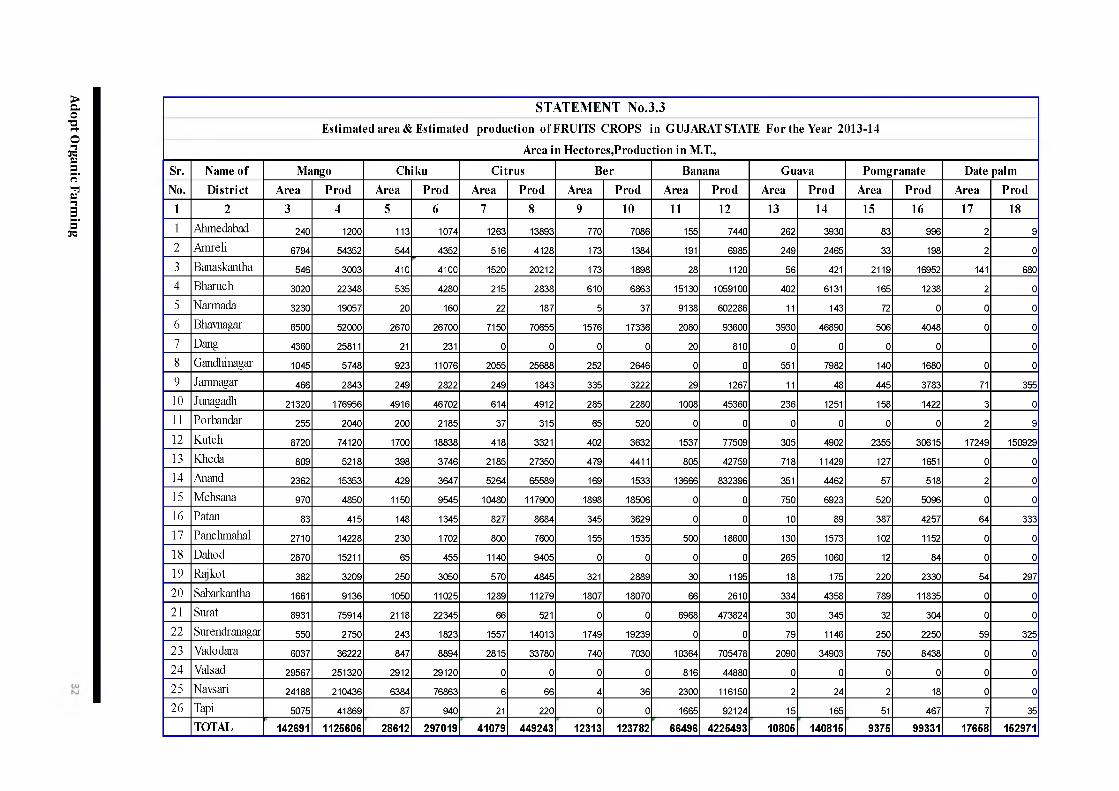
S T A T E M E N T N o .3 .3
E stim a te d a r ea & E st im a te d p r o d u c tio n o f F R U IT S C R O P S in G U JA R A T STATE F o r th e Y ear 2013-14
A r ea in H e c to r e s ,P r o d u c t io n in M .T .,
Sr. N a m e o f M an go C h ik u C itr u s B e r B anan a G u ava P o m g r a n a te D a te p a lm
N o. D is t r ic t A r ea P r o d A rea P r o d A rea P r o d A rea P r o d A r ea P r o d A rea P r o d A rea P r o d A rea P r o d
1 2 3 4 5 6 7 8 9 10 11 12 13 14 15 16 17 18
1 A hm edabad 240 1200 113 1074 1263 13893 770 7086 155 7440 262 3930 83 996 2 9
2 A m re li 6794 54352 544 4352 516 4128 173 1384 191 6985 249 2465 33 198 2 0
3 B anaskan tha 546 3003 410 4100 1520 20212 173 1898 28 1120 56 421 2119 16952 141 680
4 B h aru ch 3020 22348 535 4280 215 2838 610 6863 15130 1059100 402 6131 165 1238 2 0
5 N arm ad a 3230 19057 20 160 22 187 5 37 9138 602286 11 143 72 0 0 0
6 B havnagar 6500 52000 2670 26700 7150 70655 1576 17336 2080 93600 3930 46890 506 4048 0 0
7 D ang 4360 25811 21 231 0 0 0 0 20 810 0 0 0 0 0
8 G andhinagar 1045 5748 923 11076 2055 25688 252 2646 0 0 551 7982 140 1680 0 0
9 Jam nagar 466 2843 249 2822 249 1843 335 3222 29 1267 11 48 445 3783 71 355
10 Junagadh 21320 176956 4916 46702 614 4912 285 2280 1008 45360 236 1251 158 1422 3 0
11 P o rb an d a r 255 2040 200 2185 37 315 65 520 0 0 0 0 0 0 2 9
12 K u tc h 8720 74120 1700 18838 418 3321 402 3632 1537 77509 305 4902 2355 30615 17249 150929
13 K lieda 809 5218 398 3746 2185 27350 479 4411 805 42759 718 11429 127 1651 0 0
14 A nand 2362 15353 429 3647 5264 65589 169 1533 13666 832396 351 4462 57 518 2 0
15 M eh san a 970 4850 1150 9545 10480 117900 1898 18506 0 0 750 6923 520 5096 0 0
16 P a tan 83 415 148 1345 827 8684 345 3629 0 0 10 89 387 4257 64 333
17 P anchm ahal 2710 14228 230 1702 800 7600 155 1535 500 18600 130 1573 102 1152 0 0
18 D aliod 2870 15211 65 455 1140 9405 0 0 0 0 265 1060 12 84 0 0
19 R a jk o t 382 3209 250 3050 570 4845 321 2889 30 1195 18 175 220 2330 54 297
2 0 Sabarkantha 1661 9136 1050 11025 1289 11279 1807 18070 66 2610 334 4358 789 11835 0 0
21 Surat 8931 75914 2118 22345 66 521 0 0 6968 473824 30 345 32 304 0 0
22 S nrendranagar 550 2750 243 1823 1557 14013 1749 19239 0 0 79 1146 250 2250 59 325
23 V adodara 6037 36222 847 8894 2815 33780 740 7030 10364 705478 2090 34903 750 8438 0 0
2 4 V alsad 29567 251320 2912 29120 0 0 0 0 816 44880 0 0 0 0 0 0
25 N avsari 24188 210436 6384 76863 6 66 4 36 2300 116150 2 24 2 18 0 0
2 6 Tapi 5075 41869 87 940 21 220 0 0 1665 92124 15 165 51 467 7 35
TO TAL 142691 1125606 28612 297019 41079 449243 12313 123782 66496 4225493 10805 140815 9375 99331 17658 152971
Adopt Organic Farming
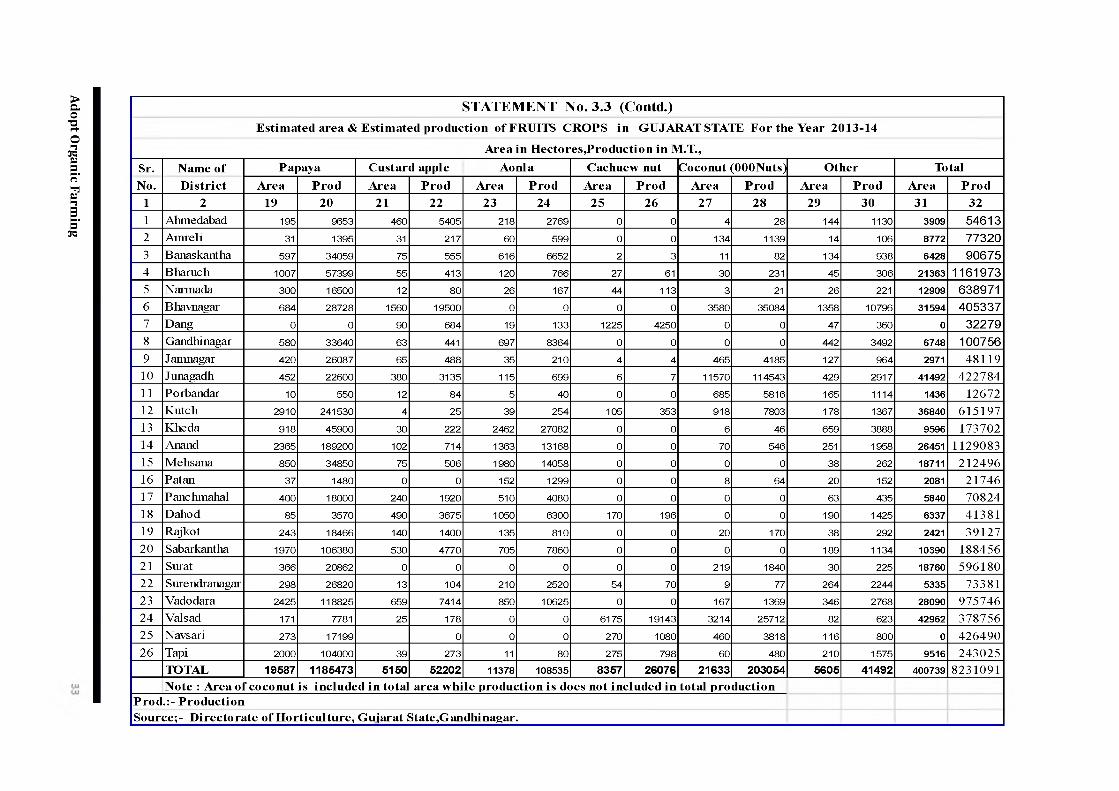
S T A T E M E N T N o . 3 .3 (C o n td .)Estimated area & Estimated production of FRUITS CROPS in GUJARAT STATE For the Year 2013-14
Area in Hecto res,P roducti o n in M.T.,Sr.No.
Name of D istrict
Papaya Custard apple Aonla Cachuew nut Coconut (OOONuts) Other TotalArea Prod Area Prod Area Prod Area Prod Area Prod Area Prod Area Prod
1 2 19 20 21 22 23 24 25 26 27 28 29 30 31 321 A lim ed ab ad 195 9653 460 5405 218 2769 0 0 4 28 144 1130 3909 546132 A n ire li 31 1395 31 217 60 599 0 0 134 1139 14 106 8772 773203 B a n ask an th a 597 34059 75 555 616 6652 2 3 11 82 134 938 6428 906754 B lia m c h 1007 57399 55 413 120 766 27 61 30 231 45 306 21363 11619735 N a rm a d a 300 16500 12 80 26 167 44 113 3 21 26 221 12909 6389716 B liavnagar 684 28728 1560 19500 0 0 0 0 3580 35084 1358 10796 31594 4053377 D a n g 0 0 90 684 19 133 1225 4250 0 0 47 360 0 322798 G a n d h in ag a r 580 33640 63 441 697 8364 0 0 0 0 442 3492 6748 1007569 Ja m n a g a r 420 26087 65 488 35 210 4 4 465 4185 127 964 2971 4811910 Ju n a g a d h 452 22600 380 3135 115 699 6 7 11570 114543 429 2917 41492 42278411 P o rb a n d a r 10 550 12 84 5 40 0 0 685 5816 165 1114 1436 1267212 K u tc h 2910 241530 4 25 39 254 105 353 918 7803 178 1367 36840 61519713 K h e d a 918 45900 30 222 2462 27082 0 0 6 46 659 3888 9596 17370214 A n an d 2365 189200 102 714 1363 13168 0 0 70 546 251 1958 26451 112908315 M e h sa n a 850 34850 75 506 1980 14058 0 0 0 0 38 262 18711 21249616 P a ta n 37 1480 0 0 152 1299 0 0 8 64 20 152 2081 2174617 P a n c h m a h a l 400 18000 240 1920 510 4080 0 0 0 0 63 435 5840 7082418 D a lio d 85 3570 490 3675 1050 6300 170 196 0 0 190 1425 6337 4138119 R a jk o t 243 18466 140 1400 135 810 0 0 20 170 38 292 2421 3912720 S ab a rk an th a 1970 106380 530 4770 705 7860 0 0 0 0 189 1134 10390 18845621 S u ra t 366 20862 0 0 0 0 0 0 219 1840 30 225 18760 59618022 S u re n d ran a g a r 298 26820 13 104 210 2520 54 70 9 77 264 2244 5335 7338123 V a d o d a ra 2425 118825 659 7414 850 10625 0 0 167 1369 346 2768 28090 97574624 V a lsa d 171 7781 25 178 0 0 6175 19143 3214 25712 82 623 42962 37875625 N a v sa ri 273 17199 0 0 0 270 1080 460 3818 116 800 0 42649026 T api 2000 104000 39 273 11 80 275 798 60 480 210 1575 9516 243025
TOTAL 19587 1185473 5150 52202 11378 108535 8357 26076 21633 203054 5605 41492 400739 8231091Note : Area of coconut is included in total area w hile production is does not included in total production
Prod.:- ProductionSource;- Directorate of H orticulture, Gujarat State,Gandhinagar.
Adopt Organic Farming
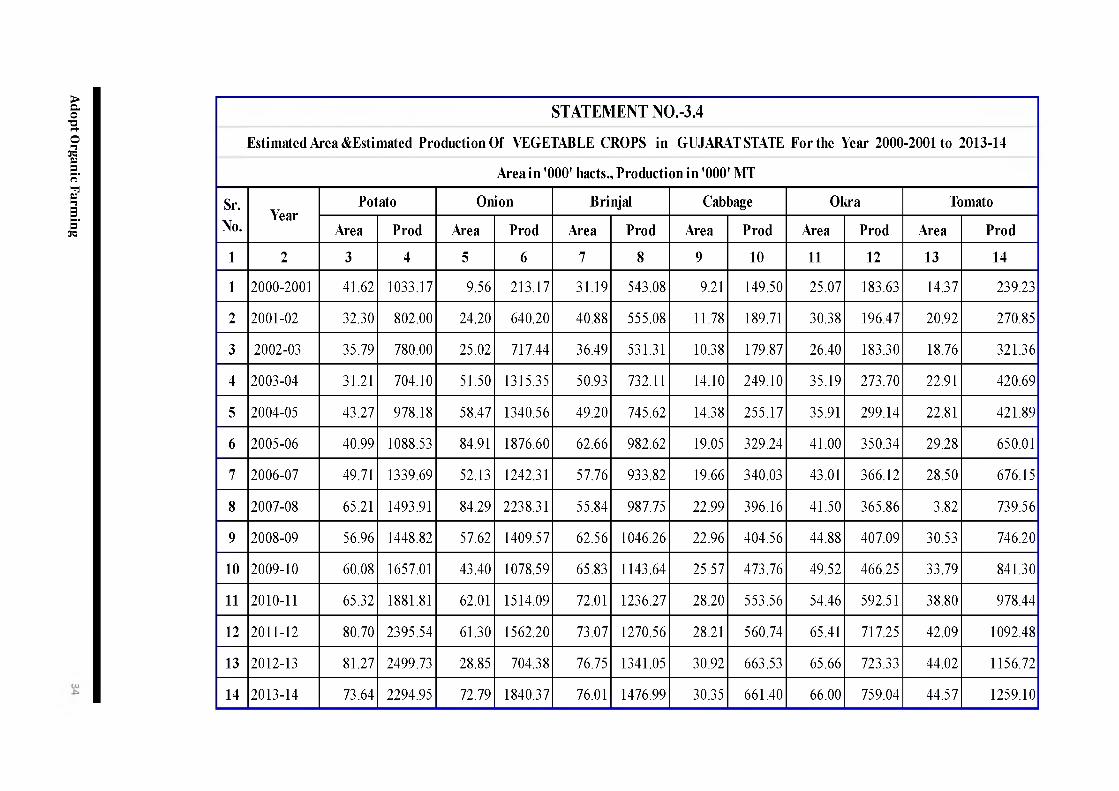
STATEMENT NO.-3.4
Estimated Area &Estimated Production Of VEGETABLE CROPS in GUJARAT STATE For the Year 2000-2001 to 2013-14
Area in '000' liacts., Production in '000' MT
Sr.No.
YearPotato Onion Brinjal Cabbage Okra Tomato
Area Prod Area Prod Area Prod Area Prod Area Prod Area Prod
1 2 3 4 5 6 7 8 9 10 11 12 13 14
1 2000-2001 41.62 1033.17 9.56 213.17 31.19 543.08 9.21 149.50 25.07 183.63 14.37 239.23
2 2001-02 32.30 802.00 24.20 640.20 40.88 555.08 11.78 189.71 30.38 196.47 20.92 270.85
3 2002-03 35.79 780.00 25.02 717.44 36.49 531.31 10.38 179.87 26.40 183.30 18.76 321.36
4 2003-04 31.21 704.10 51.50 1315.35 50.93 732.11 14.10 249.10 35.19 273.70 22.91 420.69
5 2004-05 43.27 978.18 58.47 1340.56 49.20 745.62 14.38 255.17 35.91 299.14 22.81 421.89
6 2005-06 40.99 1088.53 84.91 1876.60 62.66 982.62 19.05 329.24 41.00 350.34 29.28 650.01
7 2006-07 49.71 1339.69 52.13 1242.31 57.76 933.82 19.66 340.03 43.01 366.12 28.50 676.15
8 2007-08 65.21 1493.91 84.29 2238.31 55.84 987.75 22.99 396.16 41.50 365.86 3.82 739.56
9 2008-09 56.96 1448.82 57.62 1409.57 62.56 1046.26 22.96 404.56 44.88 407.09 30.53 746.20
10 2009-10 60.08 1657.01 43.40 1078.59 65.83 1143.64 25.57 473.76 49.52 466.25 33.79 841.30
11 2010-11 65.32 1881.81 62.01 1514.09 72.01 1236.27 28.20 553.56 54.46 592.51 38.80 978.44
12 2011-12 80.70 2395.54 61.30 1562.20 73.07 1270.56 28.21 560.74 65.41 717.25 42.09 1092.48
13 2012-13 81.27 2499.73 28.85 704.38 76.75 1341.05 30.92 663.53 65.66 723.33 44.02 1156.72
14 2013-14 73.64 2294.95 72.79 1840.37 76.01 1476.99 30.35 661.40 66.00 759.04 44.57 1259.10
Adopt Organic Farming
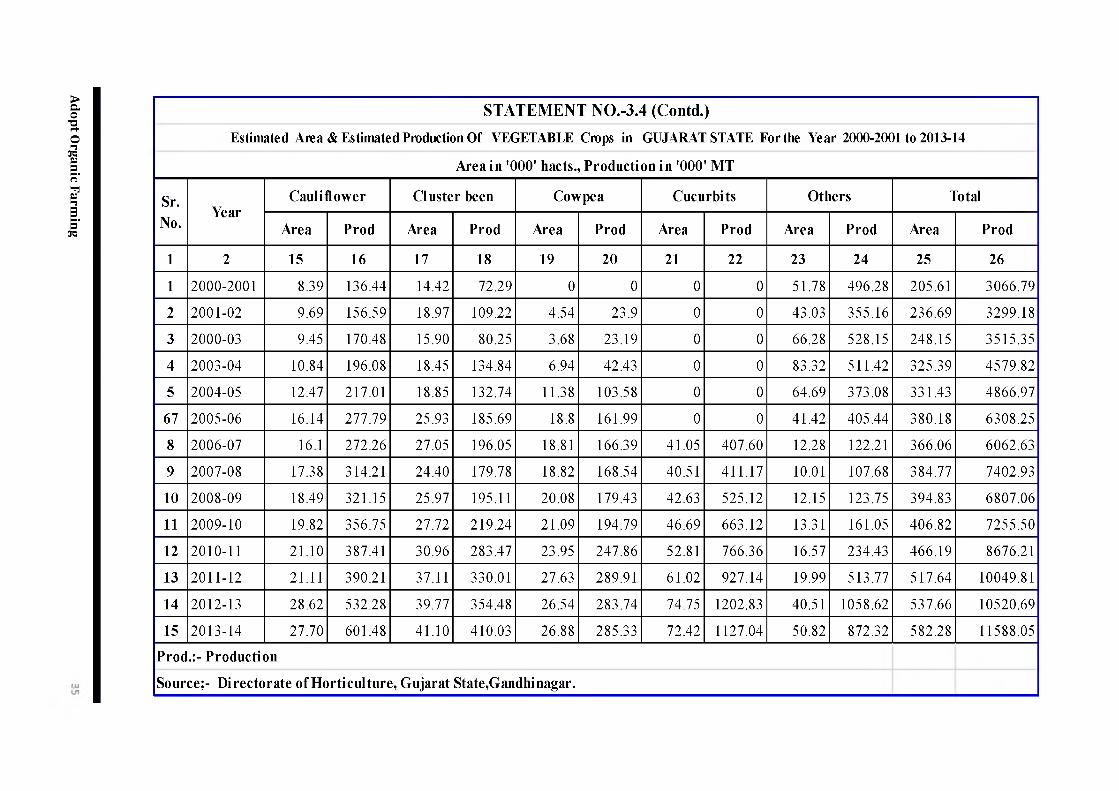
STATEMENT NO.-3.4 (Contd.)Estimated Area & Estimated Production Of VEGETABLE Crops in GUJARAT STATE For the Year 2000-2001 to 2013-14
Area in '000' hacts., Production in '000' MT
Sr.No.
YearCauliflower Cluster been Cowpea Cucurbits Others Total
Area Prod Area Prod Area Prod Area Prod Area Prod Area Prod
1 2 15 16 17 18 19 20 21 22 23 24 25 26
1 2000-2001 8.39 136.44 14.42 72.29 0 0 0 0 51.78 496.28 205.61 3066.79
2 2001-02 9.69 156.59 18.97 109.22 4.54 23.9 0 0 43.03 355.16 236.69 3299.18
3 2000-03 9.45 170.48 15.90 80.25 3.68 23.19 0 0 66.28 528.15 248.15 3515.35
4 2003-04 10.84 196.08 18.45 134.84 6.94 42.43 0 0 83.32 511.42 325.39 4579.82
5 2004-05 12.47 217.01 18.85 132.74 11.38 103.58 0 0 64.69 373.08 331.43 4866.97
67 2005-06 16.14 277.79 25.93 185.69 18.8 161.99 0 0 41.42 405.44 380.18 6308.25
8 2006-07 16.1 272.26 27.05 196.05 18.81 166.39 41.05 407.60 12.28 122.21 366.06 6062.63
9 2007-08 17.38 314.21 24.40 179.78 18.82 168.54 40.51 411.17 10.01 107.68 384.77 7402.93
10 2008-09 18.49 321.15 25.97 195.11 20.08 179.43 42.63 525.12 12.15 123.75 394.83 6807.06
11 2009-10 19.82 356.75 27.72 219.24 21.09 194.79 46.69 663.12 13.31 161.05 406.82 7255.50
12 2010-11 21.10 387.41 30.96 283.47 23.95 247.86 52.81 766.36 16.57 234.43 466.19 8676.21
13 2011-12 21.11 390.21 37.11 330.01 27.63 289.91 61.02 927.14 19.99 513.77 517.64 10049.81
14 2012-13 28.62 532.28 39.77 354.48 26.54 283.74 74.75 1202.83 40.51 1058.62 537.66 10520.69
15 2013-14 27.70 601.48 41.10 410.03 26.88 285.33 72.42 1127.04 50.82 872.32 582.28 11588.05
Prod.:- Production
Source;- Directorate of Horticulture, Gujarat State,Gandhinagar.
Adopt Organic Farming
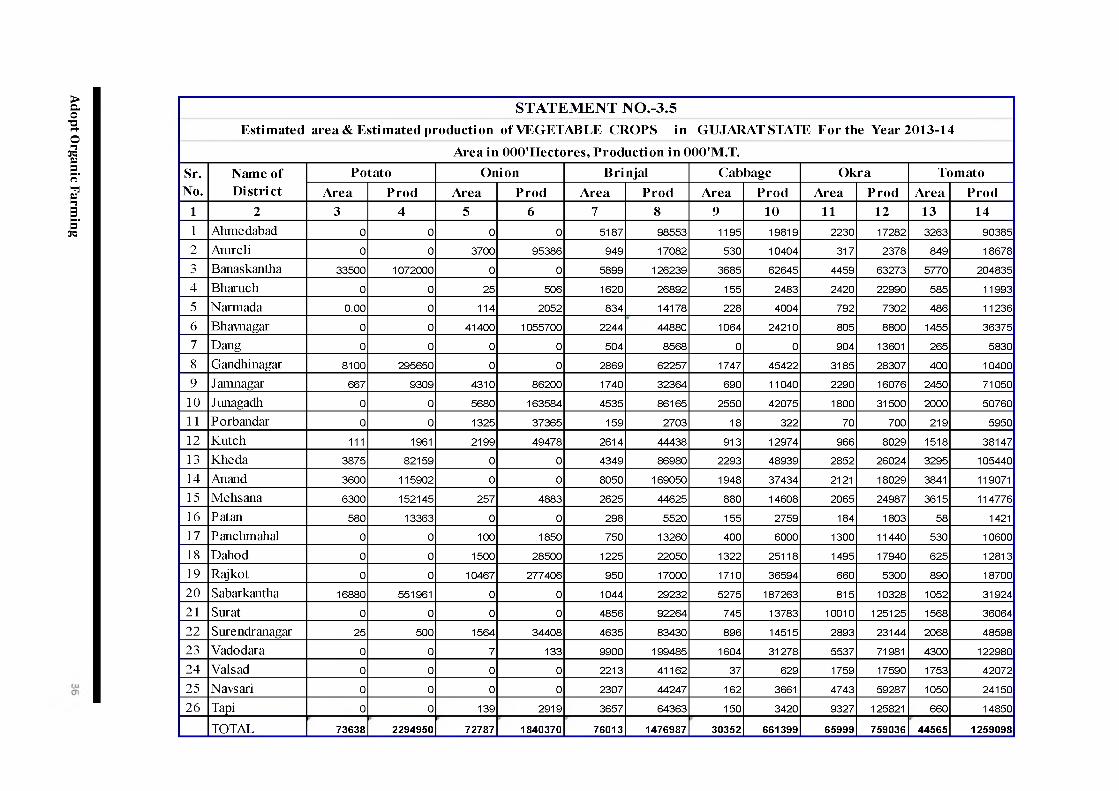
S T A T E M E N T N O .- 3 .5E stim a te d a rea & E stim a te d p r o d u c tio n o f V E G E T A B L E C R O P S in G U JA R A T STATE F o r th e Y ear 2 0 1 3 -1 4
A rea in 0 0 0 'H e c to r e s , P r o d u c tio n in 00 0 'M .T .Sr.N o.
N am e o f D is tr ic t
P o ta to O n ion B rin ja l C abbage O k ra T om atoA rea P r o d A rea P r o d A rea P r o d A rea P r o d A rea P r o d A rea P r o d
1 2 3 4 5 6 7 8 9 10 11 12 13 141 Ahmedabad 0 0 0 0 5187 98553 1195 19819 2230 17282 3263 903852 Amreli 0 0 3700 95386 949 17082 530 10404 317 2378 849 186783 Banaskantha 33500 1072000 0 0 5899 126239 3685 62645 4459 63273 5770 2048354 Bharuch 0 0 25 506 1620 26892 155 2483 2420 22990 585 119935 Narmada 0.00 0 114 2052 834 14178 228 4004 792 7302 486 112366 Bhavnagar 0 0 41400 1055700 2244 44880 1064 24210 805 8800 1455 363757 Dang 0 0 0 0 504 8568 0 0 904 13601 265 58308 Gandhinagar 8100 295650 0 0 2869 62257 1747 45422 3185 28307 400 104009 Jamnagar 667 9309 4310 86200 1740 32364 690 11040 2290 16076 2450 7105010 Junagadh 0 0 5680 163584 4535 86165 2550 42075 1800 31500 2000 5076011 Porbandar 0 0 1325 37365 159 2703 18 322 70 700 219 595012 Kutch 111 1961 2199 49478 2614 44438 913 12974 966 8029 1518 3814713 Kheda 3875 82159 0 0 4349 86980 2293 48939 2852 26024 3295 10544014 Anand 3600 115902 0 0 8050 169050 1948 37434 2121 18029 3841 11907115 Mehsana 6300 152145 257 4883 2625 44625 880 14608 2065 24987 3615 11477616 Patan 580 13363 0 0 298 5520 155 2759 184 1803 58 142117 Panchmahal 0 0 100 1850 750 13260 400 6000 1300 11440 530 1060018 Dahod 0 0 1500 28500 1225 22050 1322 25118 1495 17940 625 1281319 Rajkot 0 0 10467 277406 950 17000 1710 36594 660 5300 890 1870020 Sabarkantha 16880 551961 0 0 1044 29232 5275 187263 815 10328 1052 3192421 Surat 0 0 0 0 4856 92264 745 13783 10010 125125 1568 3606422 Surendranagar 25 500 1564 34408 4635 83430 896 14515 2893 23144 2068 4859823 Vadodara 0 0 7 133 9900 199485 1604 31278 5537 71981 4300 12298024 Valsad 0 0 0 0 2213 41162 37 629 1759 17590 1753 4207225 Navsari 0 0 0 0 2307 44247 162 3661 4743 59287 1050 2415026 Tapi 0 0 139 2919 3657 64363 150 3420 9327 125821 660 14850
TOTAL 73638 2294950 72787 1840370 76013 1476987 30352 661399 65999 759036 44565 1259098
Adopt Organic Farming
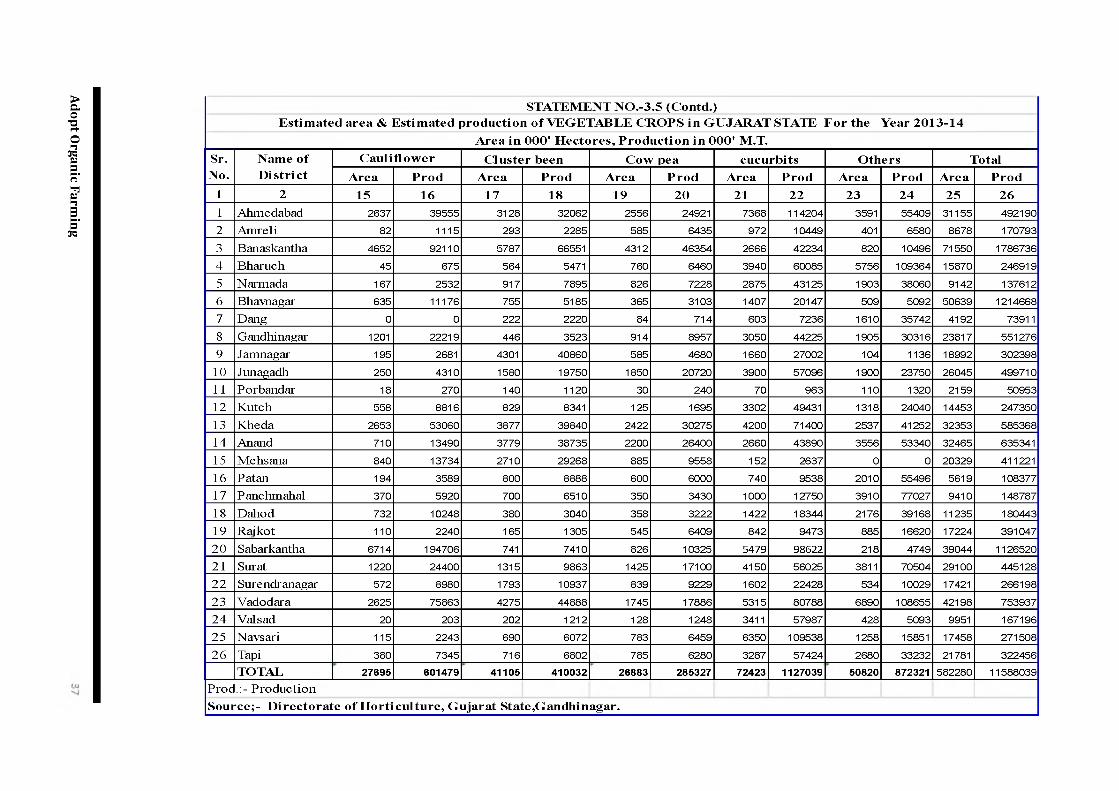
STATEMENT N O .-3.5 (Contd.)E stim ated area & E stim ated production o f VEGETABLE C RO PS in GUJARAT STATE F or the Year 2013-14
A rea in 000' H ectores, P rod u ction in 000' M.T.Sr. Nam e o f Cauli flow er C luster been C ow pea cucurbits O thers TotalNo. Di str ic t Area P rod A rea P rod A rea P rod A rea P rod A rea P rod A rea P rod
1 2 15 16 17 18 19 20 21 22 23 24 25 261 Ahmedabad 2637 39555 3128 32062 2556 24921 7368 114204 3591 55409 31155 492190
2 Am reli 82 1115 293 2285 585 6435 972 10449 401 6580 8678 170793
3 Banaskantha 4652 92110 5787 66551 4312 46354 2666 42234 820 10496 71550 1786736
4 Bharuch 45 675 564 5471 760 6460 3940 60085 5756 109364 15870 246919
5 Narm ada 167 2532 917 7895 826 7228 2875 43125 1903 38060 9142 137612
6 Bhavnagar 635 11176 755 5185 365 3103 1407 20147 509 5092 50639 1214668
7 Dang 0 0 222 2220 84 714 603 7236 1610 35742 4192 73911
8 Gandhinagar 1201 22219 446 3523 914 8957 3050 44225 1905 30316 23817 551276
9 Jamnagar 195 2681 4301 40860 585 4680 1660 27002 104 1136 18992 302398
10 Junagadh 250 4310 1580 19750 1850 20720 3900 57096 1900 23750 26045 499710
11 Porbandar 18 270 140 1120 30 240 70 963 110 1320 2159 50953
12 K utch 558 8816 829 8341 125 1695 3302 49431 1318 24040 14453 247350
13 Kheda 2653 53060 3877 39840 2422 30275 4200 71400 2537 41252 32353 585368
14 Anand 710 13490 3779 38735 2200 26400 2660 43890 3556 53340 32465 635341
15 M ehsana 840 13734 2710 29268 885 9558 152 2637 0 0 20329 411221
16 Patan 194 3589 800 8888 600 6000 740 9538 2010 55496 5619 108377
17 Panchmahal 370 5920 700 6510 350 3430 1000 12750 3910 77027 9410 148787
18 Dahod 732 10248 380 3040 358 3222 1422 18344 2176 39168 11235 180443
19 Rajkot 110 2240 165 1305 545 6409 842 9473 885 16620 17224 391047
20 Sabarkantha 6714 194706 741 7410 826 10325 5479 98622 218 4749 39044 1126520
21 Surat 1220 24400 1315 9863 1425 17100 4150 56025 3811 70504 29100 445128
22 Surendranagar 572 8980 1793 10937 839 9229 1602 22428 534 10029 17421 266198
23 Vadodara 2625 75863 4275 44888 1745 17886 5315 80788 6890 108655 42198 753937
24 Valsad 20 203 202 1212 128 1248 3411 57987 428 5093 9951 167196
25 Navsari 115 2243 690 6072 783 6459 6350 109538 1258 15851 17458 271508
26 Tapi 380 7345 716 6802 785 6280 3287 57424 2680 33232 21781 322456
TOTAL 27695 601479 41105 410032 26883 285327 72423 1127039 50820 872321 582280 11588039
Prod.: - P roductionSource;- D irectora te o f H orticu ltu re , G ujarat State,G andhinagar.
Adopt Organic Farming
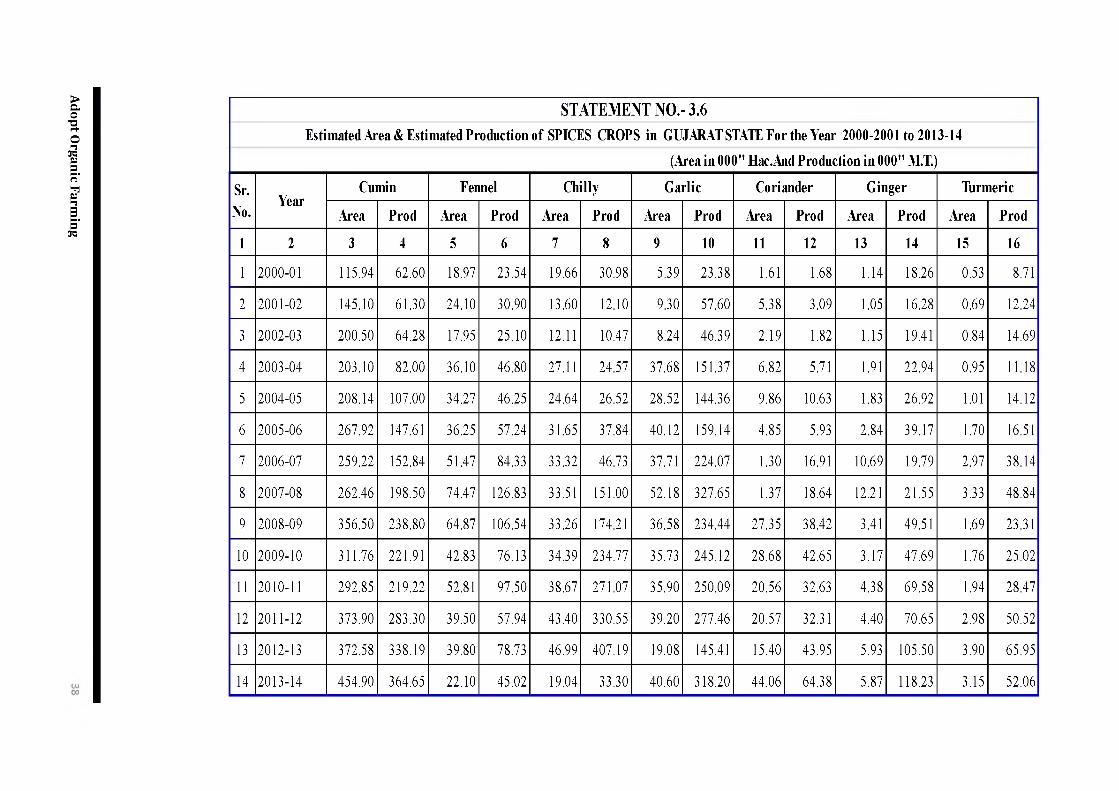
STATEMENT NO.-3.6Estimated Area & Estimated Production of SPICES CROPS in GUJARAT STATE For the Year 2000-2001 to 2013-14
(Area in 000" Hac.And Production in 000" M.T.)
Sr.Year
Cumin Fennel Chilly Garlic Coriander Ginger TurmericNo. Area Prod Area Prod Area Prod Area Prod Area Prod Area Prod Area Prod
1 2 3 4 5 6 7 8 9 10 11 12 13 14 15 16
1 2000-01 115.94 62.60 18.97 23.54 19.66 30.98 5.39 23.38 1.61 1.68 1.14 18.26 0.53 8.71
2 2001-02 145.10 61.30 24.10 30.90 13.60 12.10 9.30 57.60 5.38 3.09 1.05 16.28 0.69 12.24
3 2002-03 200.50 64.28 17.95 25.10 12.11 10.47 8.24 46.39 2.19 1.82 1.15 19.41 0.84 14.69
4 2003-04 203.10 82.00 36.10 46.80 27.11 24.57 37.68 151.37 6.82 5.71 1.91 22.94 0.95 11.18
5 2004-05 208.14 107.00 34.27 46.25 24.64 26.52 28.52 144.36 9.86 10.63 1.83 26.92 1.01 14.12
6 2005-06 267.92 147.61 36.25 57.24 31.65 37.84 40.12 159.14 4.85 5.93 2.84 39.17 1.70 16.51
7 2006-07 259.22 152.84 51.47 84.33 33.32 46.73 37.71 224.07 1.30 16.91 10.69 19.79 2.97 38.14
8 2007-08 262.46 198.50 74.47 126.83 33.51 151.00 52.18 327.65 1.37 18.64 12.21 21.55 3.33 48.84
9 2008-09 356.50 238.80 64.87 106.54 33.26 174.21 36.58 234.44 27.35 38.42 3.41 49.51 1.69 23.31
10 2009-10 311.76 221.91 42.83 76.13 34.39 234.77 35.73 245.12 28.68 42.65 3.17 47.69 1.76 25.02
11 2010-11 292.85 219.22 52.81 97.50 38.67 271.07 35.90 250.09 20.56 32.63 4.38 69.58 1.94 28.47
12 2011-12 373.90 283.30 39.50 57.94 43.40 330.55 39.20 277.46 20.57 32.31 4.40 70.65 2.98 50.52
13 2012-13 372.58 338.19 39.80 78.73 46.99 407.19 19.08 145.41 15.40 43.95 5.93 105.50 3.90 65.95
14 2013-14 454.90 364.65 22.10 45.02 19.04 33.30 40.60 318.20 44.06 64.38 5.87 118.23 3.15 52.06
Adopt Organic Farming
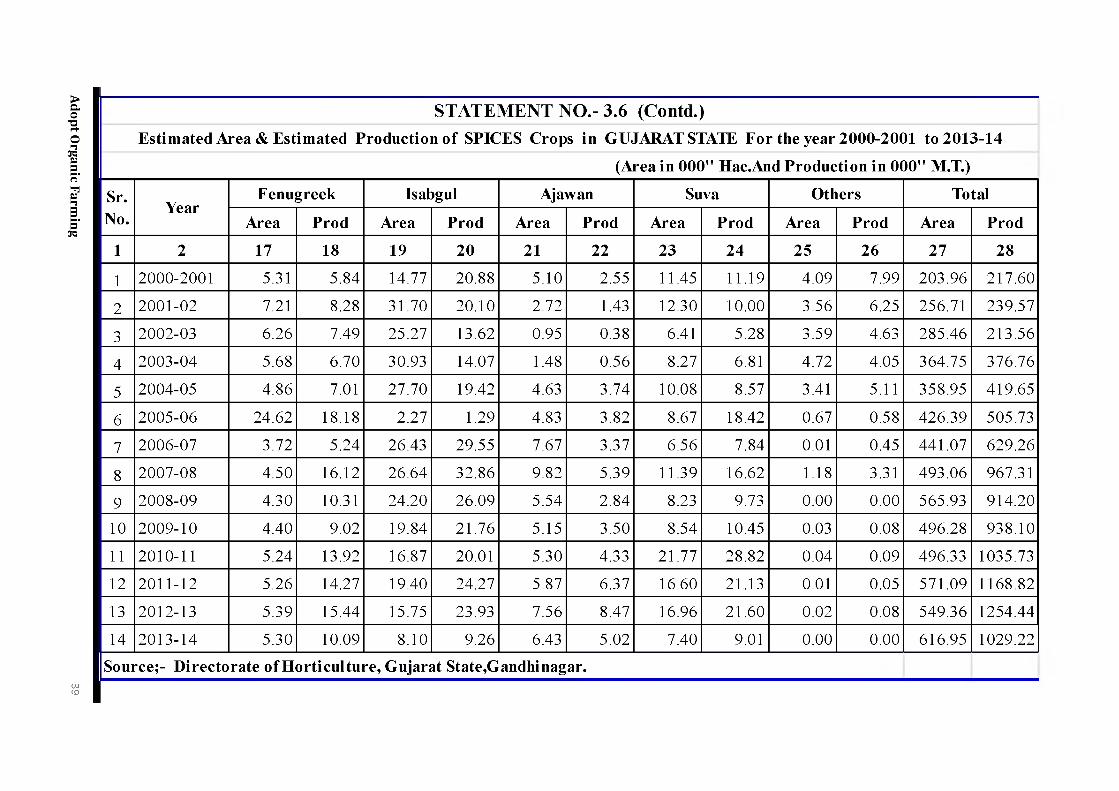
STATEMENT NO.- 3.6 (Contd.)Estimated Area & Estimated Production of SPICES Crops in GUJARAT STATE For the year 2000-2001 to 2013-14
(Area in 000" Hac.And Production in 000" M.T.)
Sr.No.
YearFenugreek Isabgul Ajawan Suva Others Total
Area Prod Area Prod Area Prod Area Prod Area Prod Area Prod
1 2 17 18 19 20 21 22 23 24 25 26 27 28
1 2000-2001 5.31 5.84 14.77 20.88 5.10 2.55 11.45 11.19 4.09 7.99 203 .96 217 .60
2 2001-02 7.21 8.28 31.70 20.10 2.72 1.43 12.30 10.00 3.56 6.25 256.71 239.57
3 2002-03 6.26 7.49 25.27 13.62 0.95 0.38 6.41 5.28 3.59 4.63 285 .46 213 .56
4 2 003-04 5.68 6.70 30.93 14.07 1.48 0.56 8.27 6.81 4.72 4.05 364.75 376.76
5 2004-05 4.86 7.01 27.70 19.42 4.63 3.74 10.08 8.57 3.41 5.11 358.95 419.65
6 2 005-06 24.62 18.18 2.27 1.29 4.83 3.82 8.67 18.42 0.67 0.58 426 .39 505.73
7 2006-07 3.72 5.24 26.43 29.55 7.67 3.37 6.56 7.84 0.01 0.45 441.07 629.26
8 2007-08 4.50 16.12 26.64 32.86 9.82 5.39 11.39 16.62 1.18 3.31 493 .06 967.31
9 2 008-09 4.30 10.31 24.20 26.09 5.54 2.84 8.23 9.73 0.00 0.00 565.93 914.20
10 2 009-10 4.40 9.02 19.84 21.76 5.15 3.50 8.54 10.45 0.03 0.08 496.28 938.10
11 2010-11 5.24 13.92 16.87 20.01 5.30 4.33 21.77 28.82 0.04 0.09 496.33 1035.73
12 2011-12 5.26 14.27 19.40 24.27 5.87 6.37 16.60 21.13 0.01 0.05 571.09 1168.82
13 2012-13 5.39 15.44 15.75 23.93 7.56 8.47 16.96 21.60 0.02 0.08 549.36 1254.44
14 2 013-14 5.30 10.09 8.10 9.26 6.43 5.02 7.40 9.01 0.00 0.00 616.95 1029.22
Source;- Directorate of Horticulture, Gujarat State,Gandhinagar.U)to
Adopt Organic Farming
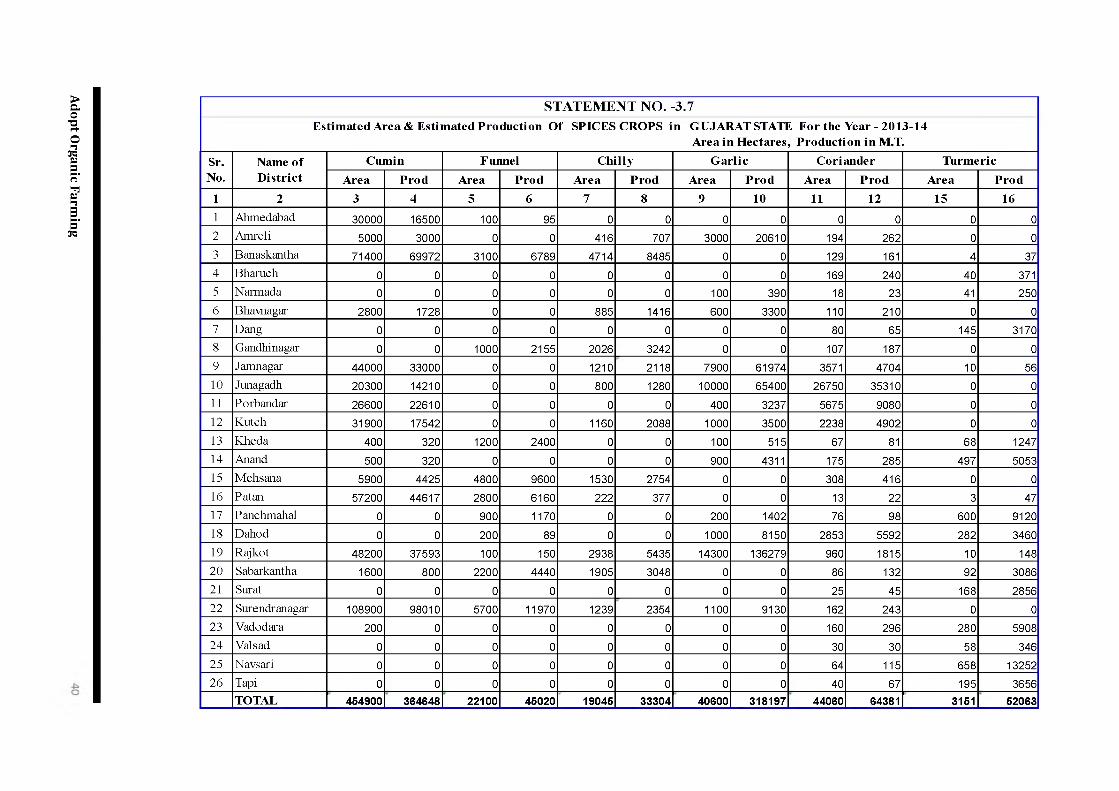
S T A T E M E N T N O . -3 .7Estimated Area & Estimated Production Of SPICES CROPS in GUJARAT STATE For the Year - 2013-14
Area in Hectares, Production in M.T.
Sr.No.
Name of District
Cumin Funnel Chilly Garlic Coriander TurmericArea Prod Area Prod Area Prod Area Prod Area Prod Area Prod
1 2 3 4 5 6 7 8 9 10 11 12 15 161 Ahmedabad 30000 16500 100 95 0 0 0 0 0 0 0 02 Amreli 5000 3000 0 0 416 707 3000 20610 194 262 0 03 Banaskantha 71400 69972 3100 6789 4714 8485 0 0 129 161 4 374 Bharach 0 0 0 0 0 0 0 0 169 240 40 3715 Narmada 0 0 0 0 0 0 100 390 18 23 41 2506 Bhavnagar 2800 1728 0 0 885 1416 600 3300 110 210 0 07 Dang 0 0 0 0 0 0 0 0 80 65 145 31708 Gandhinagar 0 0 1000 2155 2026 3242 0 0 107 187 0 09 Jamnagar 44000 33000 0 0 1210 2118 7900 61974 3571 4704 10 5610 Junagadh 20300 14210 0 0 800 1280 10000 65400 26750 35310 0 011 Porbandar 26600 22610 0 0 0 0 400 3237 5675 9080 0 012 Kutch 31900 17542 0 0 1160 2088 1000 3500 2238 4902 0 013 Kheda 400 320 1200 2400 0 0 100 515 67 81 68 124714 Anand 500 320 0 0 0 0 900 4311 175 285 497 505315 Mehsana 5900 4425 4800 9600 1530 2754 0 0 308 416 0 016 Patan 57200 44617 2800 6160 222 377 0 0 13 22 3 4717 Panchmahal 0 0 900 1170 0 0 200 1402 76 98 600 912018 Dahod 0 0 200 89 0 0 1000 8150 2853 5592 282 346019 Rajkot 48200 37593 100 150 2938 5435 14300 136279 960 1815 10 14820 Sabarkantha 1600 800 2200 4440 1905 3048 0 0 86 132 92 308621 Surat 0 0 0 0 0 0 0 0 25 45 168 285622 Surendranagar 108900 98010 5700 11970 1239 2354 1100 9130 162 243 0 023 Vadodara 200 0 0 0 0 0 0 0 160 296 280 590824 Vais ad 0 0 0 0 0 0 0 0 30 30 58 34625 Navsari 0 0 0 0 0 0 0 0 64 115 658 1325226 Tapi 0 0 0 0 0 0 0 0 40 67 195 3656
TOTAT 454900 364648 22100 45020 19045 33304 40600 318197 44060 64381 3161 52063
Adopt Organic Farming
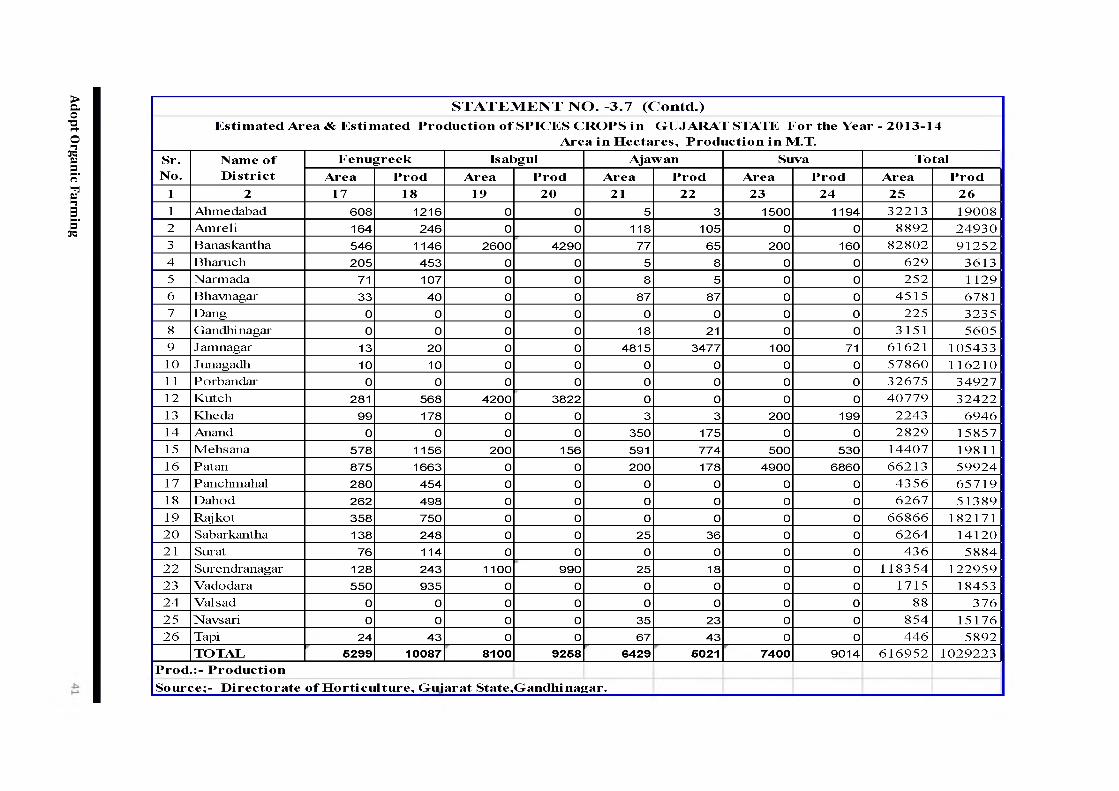
S T A T E M E N T N O . - 3 .7 (C o n t il .)E stim a ted A rea & E stim a ted P ro d u c tio n o f SP IC E S C R O P S in G U JA R A T STATE F o r the Y ear - 2 0 1 3 -1 4
A rea in H ec ta res , P ro d u c tio n in M .T.Sr.N o.
N am e o f D is tr ic t
F en u g re ek Isabgul A jaw an Suva TotalA rea P ro d A rea P ro d A rea P ro d A rea P ro d A rea P ro d
1 2 17 18 19 20 21 22 23 24 25 261 Ahm edabad 608 1216 0 0 5 3 1500 1194 3 2213 190082 Am reli 164 246 0 0 118 105 0 0 8 89 2 2 4 9 3 03 Banaskantha 546 1146 2600 4290 77 65 200 160 8 2 8 0 2 9 1 2 5 24 Bharuch 205 453 0 0 5 8 0 0 629 36135 Narmada 71 107 0 0 8 5 0 0 2 52 11296 Bhavnagar 33 40 0 0 87 87 0 0 4 51 5 67817 Dang 0 0 0 0 0 0 0 0 225 32358 Gandhi nagar 0 0 0 0 18 21 0 0 3151 56059 J amnagar 13 20 0 0 4815 3477 100 71 61621 10543310 Junagadh 10 10 0 0 0 0 0 0 5 7 8 6 0 116 21 011 Porbandar 0 0 0 0 0 0 0 0 3 26 75 3 4 9 2 712 K utch 281 568 4200 3822 0 0 0 0 4 0 7 7 9 3 2 4 2 213 Kheda 99 178 0 0 3 3 200 199 2243 6 94 614 Anand 0 0 0 0 350 175 0 0 2 8 2 9 1585715 M ehsana 578 1156 200 156 591 774 500 530 14407 1981116 Patan 875 1663 0 0 200 178 4900 6860 6 6213 5 99 2417 Panchmahal 280 454 0 0 0 0 0 0 4 3 5 6 6 5 7 1 918 D ahod 262 498 0 0 0 0 0 0 6 2 6 7 5 13 8919 Raj kot 358 750 0 0 0 0 0 0 6 6 8 6 6 18217120 Sabarkantha 138 248 0 0 25 36 0 0 6 2 6 4 1412021 Surat 76 114 0 0 0 0 0 0 4 36 588422 Surendranagar 128 243 1100 990 25 18 0 0 118 35 4 122 95 923 Vadodara 550 935 0 0 0 0 0 0 1715 1845324 Valsad 0 0 0 0 0 0 0 0 88 37625 Navsari 0 0 0 0 35 23 0 0 854 1517626 Tapi 24 43 0 0 67 43 0 0 4 46 5892
TOTAL 6299 10087 8100 9268 6429 6021 7400 9014 6 1 6 9 5 2 1029223P ro d .:- P ro d u c tio nS ou rce;- D ir e c to r a te o f H o r t ic u ltu r e , G ujarat S tate ,G an d hin agar.
Adopt Organic Farming
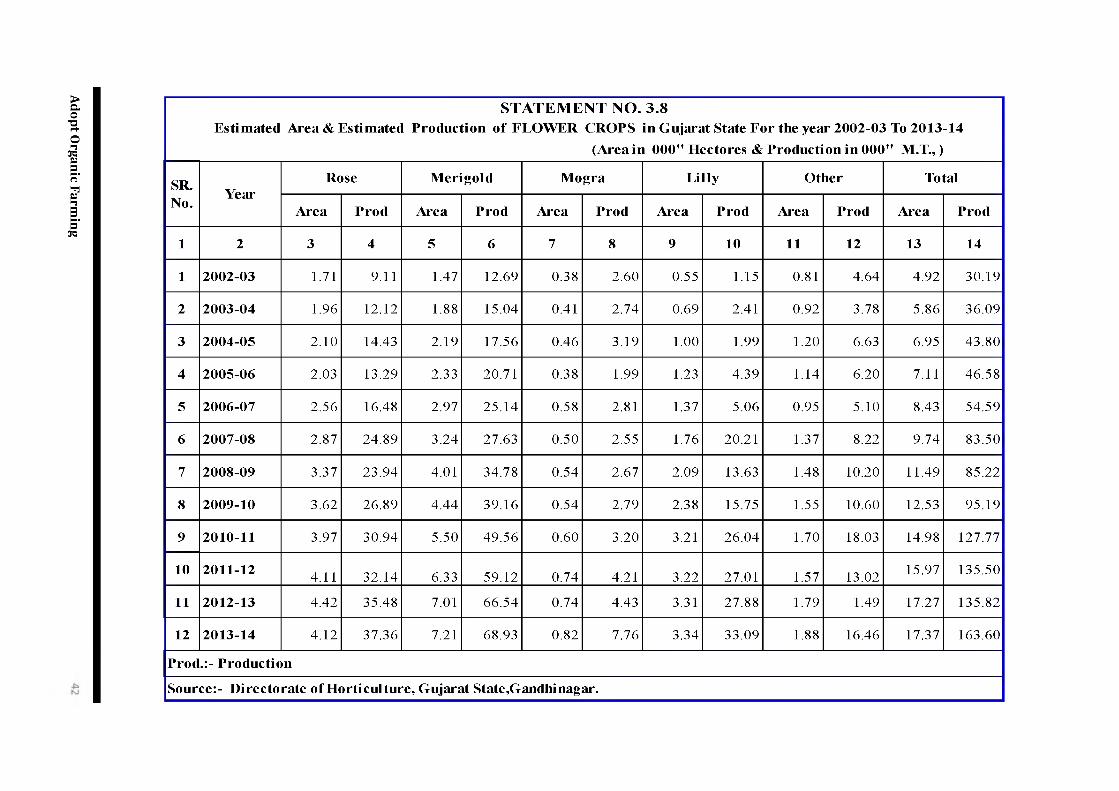
S T A T E M E N T N O . 3 . 8E s t im a te d A r e a & E s t im a te d P r o d u c t io n o f F L O W E R C R O P S in G u ja r a t S ta te F o r th e y e a r 2 0 0 2 -0 3 To 2 0 1 3 -1 4
(A r e a in 0 0 0 " H e c to r e s & P r o d u c t io n in 0 0 0 " M .T . , )
SR .N o . Y ea r
R o se M e r ig o ld M o g r a L i l ly O th e r T o ta l
A r e a P r o d A r e a P r o d A r e a P r o d A r e a P r o d A r e a P r o d A r e a P r o d
1 2 3 4 5 6 7 8 9 10 11 12 13 14
1 2 0 0 2 -0 3 1.71 9.11 1.47 12.69 0.38 2.60 0.55 1.15 0.81 4.64 4.92 30.19
2 2 0 0 3 -0 4 1.96 12.12 1.88 15.04 0.41 2.74 0.69 2.41 0.92 3.78 5.86 36.09
3 2 0 0 4 -0 5 2.10 14.43 2.19 17.56 0.46 3.19 1.00 1.99 1.20 6.63 6.95 43.80
4 2 0 0 5 -0 6 2.03 13.29 2.33 20.71 0.38 1.99 1.23 4.39 1.14 6.20 7.11 46.58
5 2 0 0 6 -0 7 2.56 16.48 2.97 25.14 0.58 2.81 1.37 5.06 0.95 5.10 8.43 54.59
6 2 0 0 7 -0 8 2.87 24.89 3.24 27.63 0.50 2.55 1.76 20.21 1.37 8.22 9.74 83.50
7 2 0 0 8 -0 9 3.37 23.94 4.01 34.78 0.54 2.67 2.09 13.63 1.48 10.20 11.49 85.22
8 2 0 0 9 -1 0 3.62 26.89 4.44 39.16 0.54 2.79 2.38 15.75 1.55 10.60 12.53 95.19
9 2 0 1 0 -1 1 3.97 30.94 5.50 49.56 0.60 3.20 3.21 26.04 1.70 18.03 14.98 127.77
10 2 0 1 1 -1 2 4.11 32.14 6.33 59.12 0.74 4.21 3.22 27.01 1.57 13.02 15.97 135.50
11 2 0 1 2 -1 3 4.42 35.48 7.01 66.54 0.74 4.43 3.31 27.88 1.79 1.49 17.27 135.82
12 2 0 1 3 -1 4 4.12 37.36 7.21 68.93 0.82 7.76 3.34 33.09 1.88 16.46 17.37 163.60
P r o d .: - P r o d u c t io nS o u r c e :- D ir e c to r a t e o f H o r t ic u lt u r e , G u ja r a t S ta te ,G a n d h in a g a r .
Adopt Organic Farming
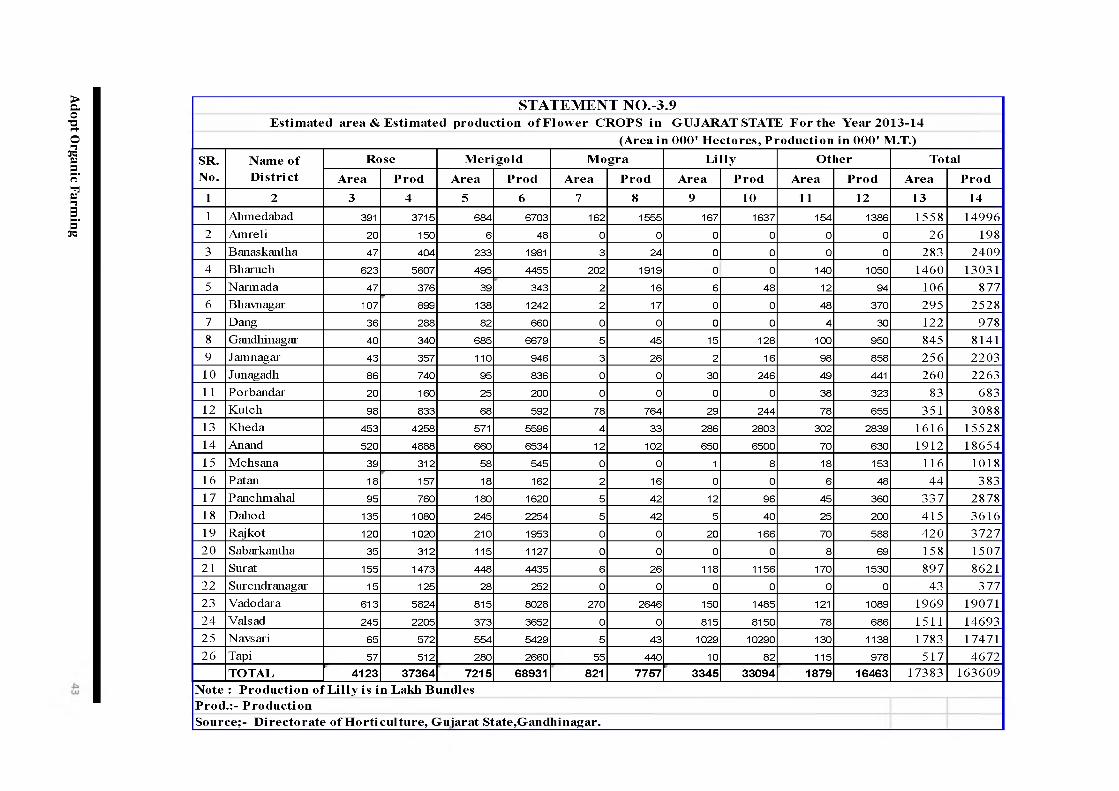
S T A T E M E N T N O .- 3 .9E stim ated area & E stim ated production o f F lo w er CROPS in GUJARAT STATE F or the Year 2013-14
(Area in 000' H ectores, P roduction in 000' M.T.)
SR.No.
Nam e o f D istri ct
R ose M erigo ld M ogra L illy Other TotalArea Prod Area Prod Area Prod Area Prod Area Prod Area Prod
1 2 3 4 5 6 7 8 9 10 11 12 13 141 Ahmedabad 391 3715 684 6703 162 1555 167 1637 154 1386 1558 149962 Anireli 20 150 6 48 0 0 0 0 0 0 26 1983 Banaskantha 47 404 233 1981 3 24 0 0 0 0 283 24094 Bharuch 623 5607 495 4455 202 1919 0 0 140 1050 1460 130315 Narmada 47 376 39 343 2 16 6 48 12 94 106 8776 Bhavnagar 107 899 138 1242 2 17 0 0 48 370 295 25287 Dang 36 288 82 660 0 0 0 0 4 30 122 9788 Gandhinagar 40 340 685 6679 5 45 15 128 100 950 845 81419 Jamnagar 43 357 110 946 3 26 2 16 98 858 256 220310 Junagadh 86 740 95 836 0 0 30 246 49 441 260 226311 Porbandar 20 160 25 200 0 0 0 0 38 323 83 68312 Kutch 98 833 68 592 78 764 29 244 78 655 351 308813 Kheda 453 4258 571 5596 4 33 286 2803 302 2839 1616 1552814 Anand 520 4888 660 6534 12 102 650 6500 70 630 1912 1865415 M ehsana 39 312 58 545 0 0 1 8 18 153 116 101816 Patan 18 157 18 162 2 16 0 0 6 48 44 38317 Panchmahal 95 760 180 1620 5 42 12 96 45 360 337 287818 Daliod 135 1080 245 2254 5 42 5 40 25 200 415 361619 Rajkot 120 1020 210 1953 0 0 20 166 70 588 420 372720 Sabarkantha 35 312 115 1127 0 0 0 0 8 69 158 150721 Surat 155 1473 448 4435 6 26 118 1156 170 1530 897 862122 Surendranagar 15 125 28 252 0 0 0 0 0 0 43 37723 Vadodara 613 5824 815 8028 270 2646 150 1485 121 1089 1969 1907124 Valsad 245 2205 373 3652 0 0 815 8150 78 686 1511 1469325 Navsari 65 572 554 5429 5 43 1029 10290 130 1138 1783 1747126 Tapi 57 512 280 2660 55 440 10 82 115 978 517 4672
TOTAL 4123 37364 7215 68931 821 7757 3345 33094 1879 16483 17383 163609N ote : P roduction o f L illy is in Lakh BundlesProd.:- ProductionSource;- D irectorate o f H orticu ltu re, Gujarat State,G andhinagar.
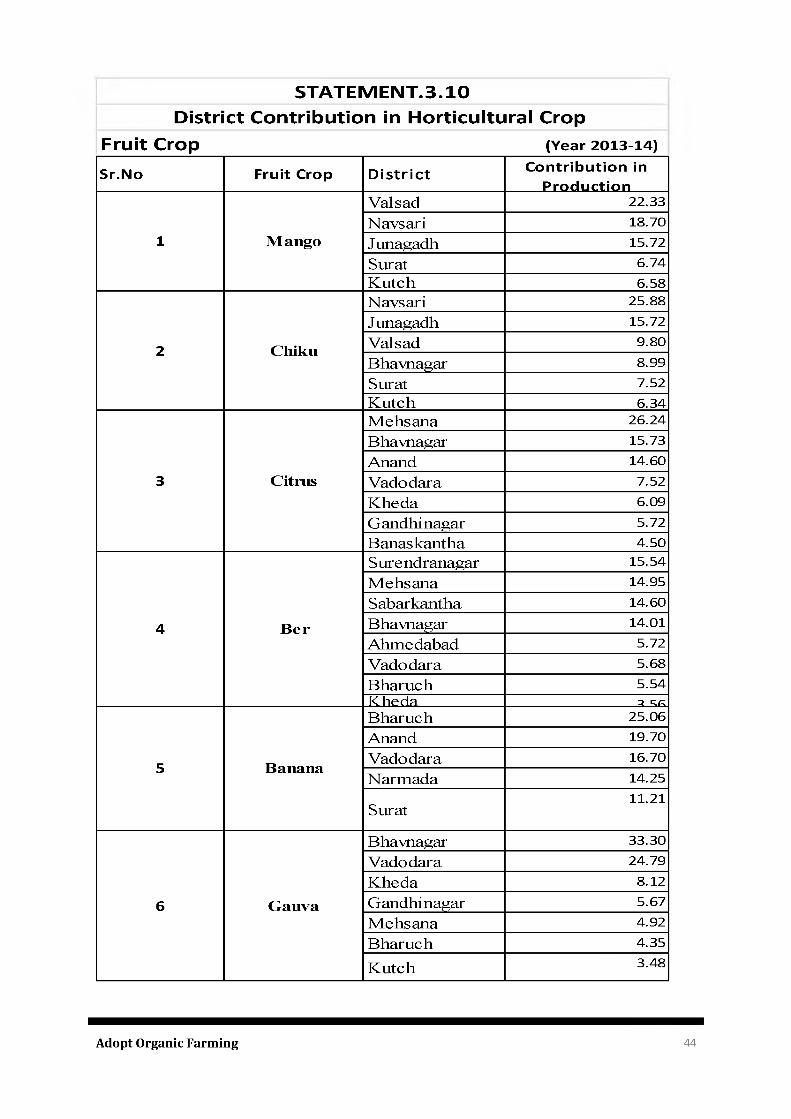
STATEMENT.3.10District Contribution in Horticultural Crop
Fruit Crop (Year 2013-14)
Sr.No Fruit Crop District Contribution in Production
1 MangoV a ls a d 22.33N a v s a r i 18.70J u n a g a d h 15.72S u ra t 6.74K u tc h 6.58
2 Chiku
N a v s a r i 25.88J u n a g a d h 15.72V a ls a d 9.80B h a v n a g a r 8.99S u ra t 7.52K u tc h 6.34
3 Citrus
M e h s a n a 26.24B h a v n a g a r 15.73A n a n d 14.60V a d o d a ra 7.52K h e d a 6.09G a n d h in a g a r 5.72B a n a s k a n th a 4.50
4 Ber
S u re n d ra n a g a r 15.54M e h s a n a 14.95S a b a rk a n th a 14.60B h a v n a g a r 14.01A h m e d a b a d 5.72V a d o d a ra 5.68B h a r u c h 5.54K h ed a , 3 56
5 Banana
B h a ru c h 25.06A n a n d 19.70V a d o d a ra 16.70N a r m a d a 14.25
S u ra t11.21
6 Gauva
B h a v n a g a r 33.30V a d o d a ra 24.79K h e d a 8.12G a n d h in a g a r 5.67M e h s a n a 4.92B h a ru c h 4.35K u tc h 3.48
Adopt Organic Farming 44
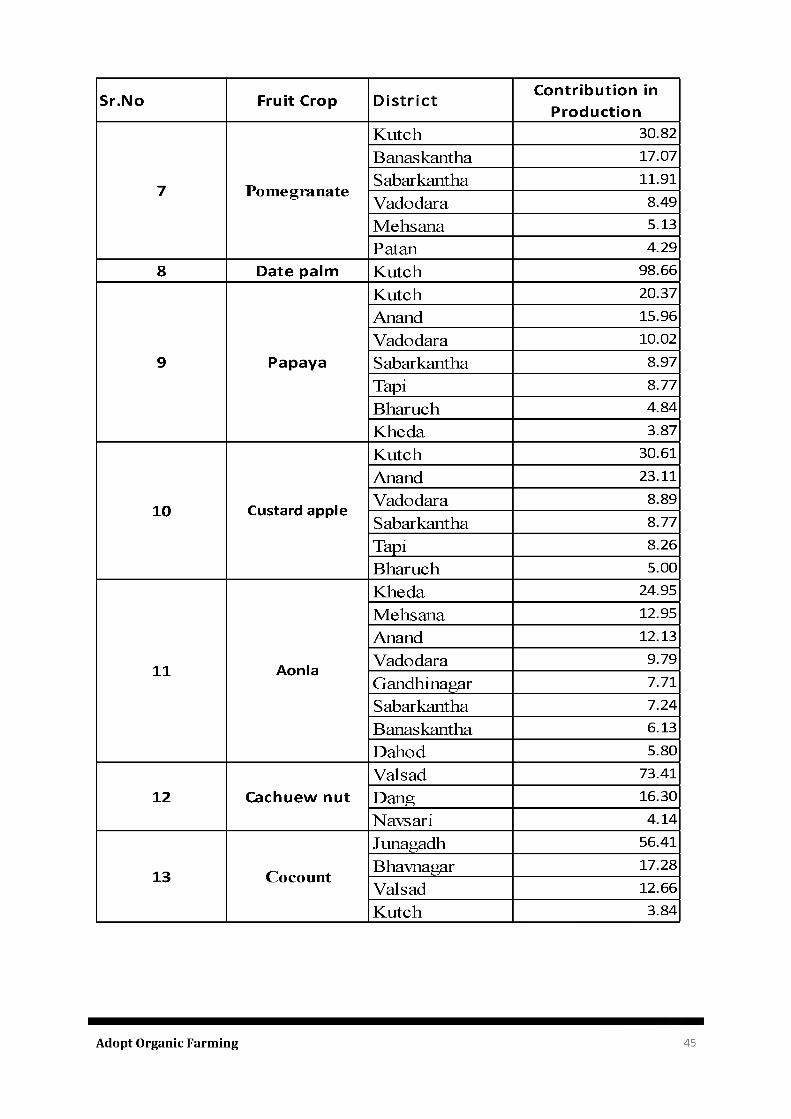
Sr.N o Fruit Crop D is tr ic tC o n trib u tio n in
P ro d u ctio n
7 P o m e g ra n a te
K u tc h 30.82B a n a s k a n th a 17.07S a b a rk a n th a 11.91V a d o d a r a 8.49M e h s a n a 5.13P a ta n 4 .29
8 Date palm K u tc h 98.66
9 Papaya
K u tc h 20.37A n a n d 15.96V a d o d a ra 10.02S a b a rk a n th a 8.97T a p i 8.77B h a r u c h 4 .84K h e d a 3.87
10 Custard apple
K u tc h 30.61A n a n d 23.11V a d o d a r a 8.89S a b a rk a n th a 8.77T a p i 8.26B h a r u c h 5.00
11 Aonla
K h e d a 24.95M e h s a n a 12.95A n a n d 12.13V a d o d a ra 9.79G a n d h in a g a r 7.71S a b a rk a n th a 7.24B a n a s k a n th a 6.13D a h o d 5.80
12 Cachuew nutV a ls a d 73.41D a n g 16.30N a v s a r i 4 .14
13 C o c o u n t
J u n a g a d h 56.41B h a v n a g a r 17.28V a ls a d 12.66K u tc h 3.84
Adopt Organic Farming 45
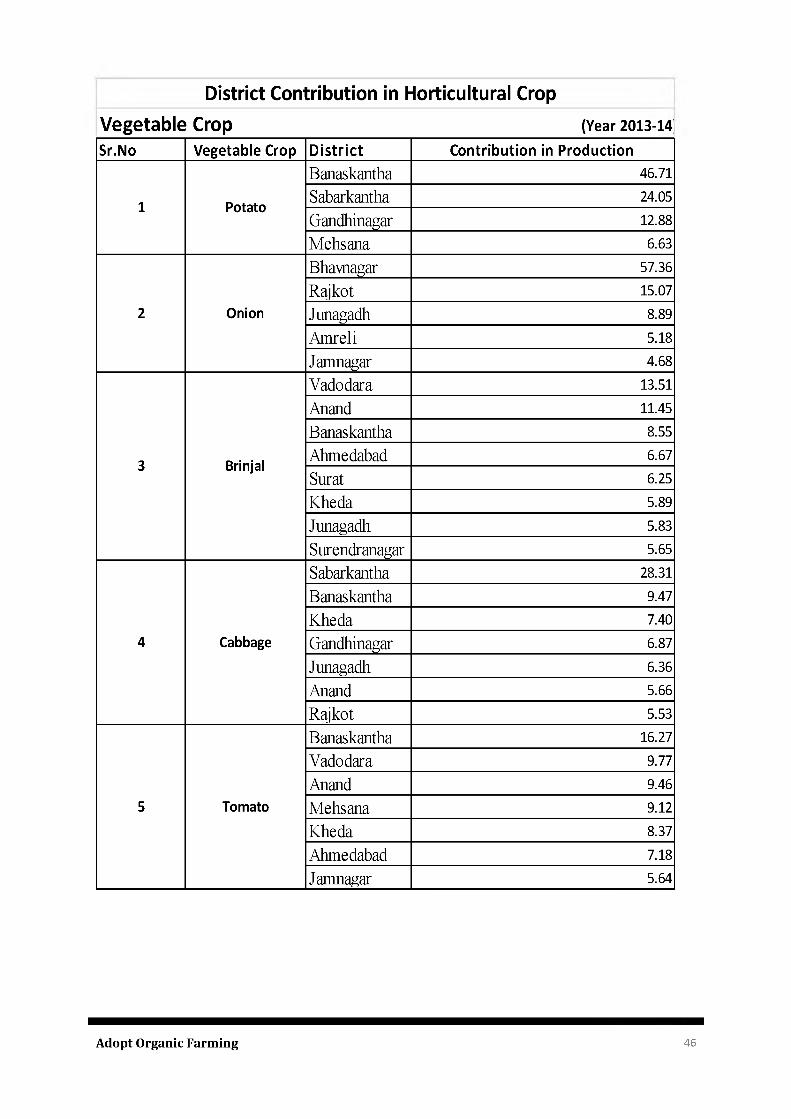
District Contribution in Horticultural CropVegetable Crop (Year 2013-14
Sr.No Vegetable Crop District Contribution in Production
1 Potato
B a n a sk a n th a 46.71Sabark anth a 24.05G an d h in agar 12.88M e h s a n a 6.63
2 Onion
B h avn agar 57.36R a jk o t 15.07Ju n agad h 8.89A m r e li 5.18Jam n agar 4 .68
3 Brinjal
V a d o d a ra 13.51A nan d 11.45B a n a sk a n th a 8.55A h m e d a b a d 6.67Surat 6.25K h e d a 5.89Ju n agad h 5.83S u ren d ran agar 5.65
4 Cabbage
Sabark anth a 28.31B a n a sk a n th a 9.47K h e d a 7.40G an d h in agar 6.87Ju n agad h 6.36A nan d 5.66R a jk o t 5.53
5 Tomato
B a n a sk a n th a 16.27V a d o d a ra 9.77A nan d 9.46M e h s a n a 9.12K h e d a 8.37A h m e d a b a d 7.18Jam n agar 5.64
Adopt Organic Farming 46
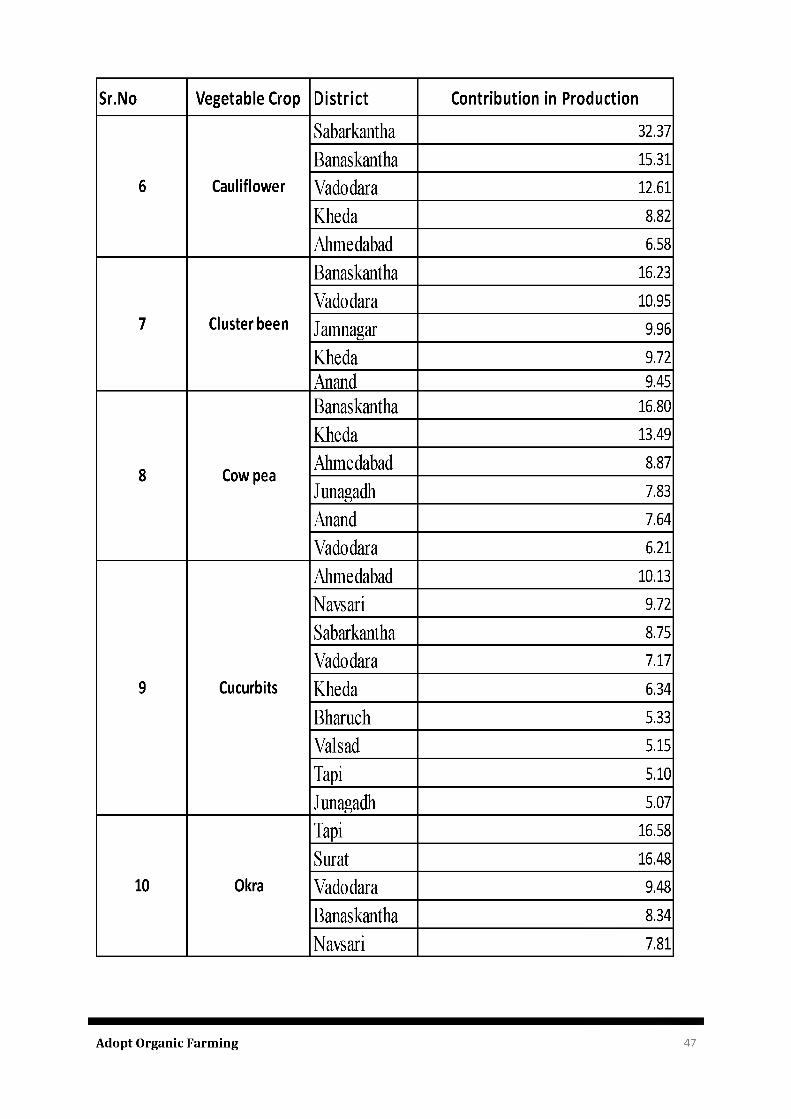
Sr.No Vegetable Crop D istrict Contribution in Production
6 Cauliflower
Sabarkantha 32.37
Banaskantha 15.31
Vadodara 12.61
Kheda 8.82
Ahmedabad 6.58
7 Cluster been
Banaskantha 16.23
Vadodara 10.95
Jamnagar 9.96
Kheda 9.72Anand 9.45
8 Cow pea
Banaskantha 16.80
Kheda 13.49
Ahmedabad 8.87
Junagadh 7.83
Anand 7.64
Vadodara 6.21
9 Cucurbits
Ahmedabad 10.13
Navsari 9.72
Sabarkantha 8.75
Vadodara 7.17
Kheda 6.34
Bharuch 5.33
Valsad 5.15
Tapi 5.10
Junagadh 5.07
10 Okra
Tapi 16.58
Surat 16.48
Vadodara 9.48
Banaskantha 8.34
Navsari 7.81
Adopt Organic Farming 47
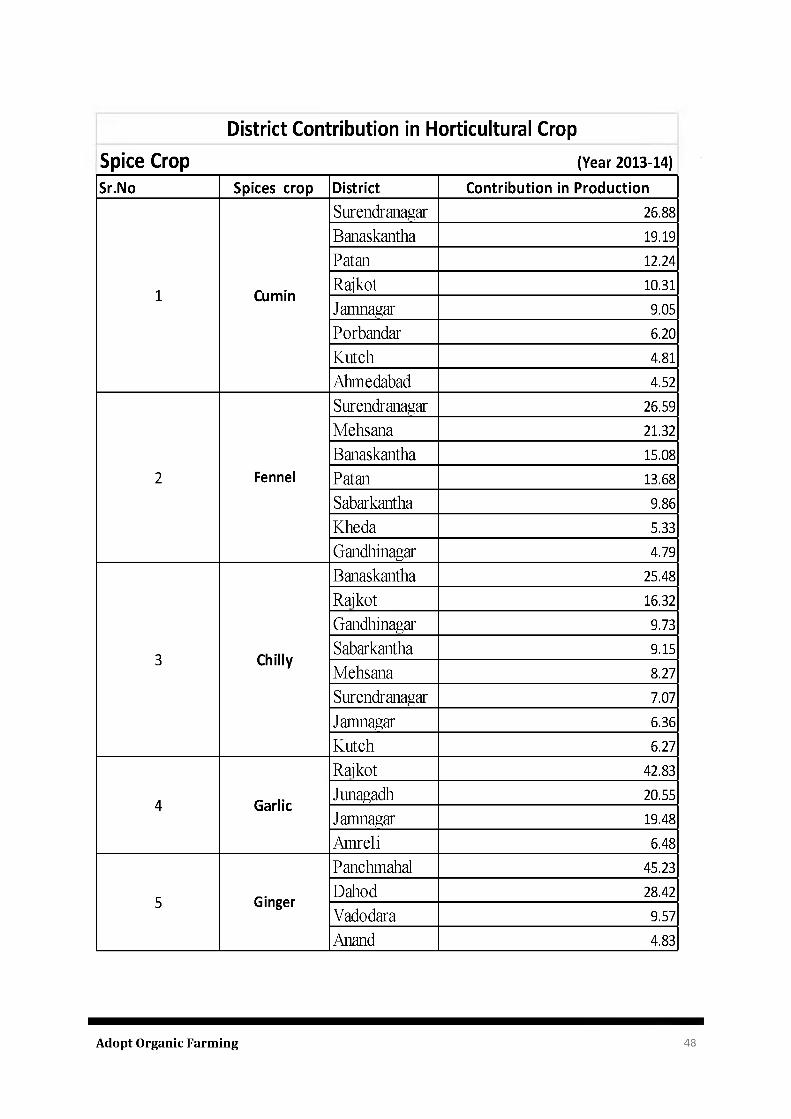
District Contribution in Horticultural CropSpice Crop (Year 2013-14)Sr.No Spices crop District Contribution in Production
1 Cumin
Su ren d ran agar 26.88B a n a sk a n th a 19.19P a ta n 12.24R a jk o t 10.31Jam n agar 9.05P orb an d ar 6.20K u tc h 4.81A h m ed a b a d 4.52
2 Fennel
Su ren d ran agar 26.59M e h s a n a 21.32B a n a sk a n th a 15.08P a ta n 13.68S abarkantha 9.86K h e d a 5.33G an d h in agar 4.79
3 Chilly
B a n a sk a n th a 25.48R a jk o t 16.32G an d h in agar 9.73S abarkantha 9.15M e h s a n a 8.27Su ren d ran agar 7.07Jam n agar 6.36K u tc h 6.27
4 Garlic
R a jk o t 42.83Ju n agad h 20.55Jam n agar 19.48A m r e li 6.48
5 Ginger
P a n ch m a h a l 45.23D a h o d 28.42V a d o d a ra 9.57A n an d 4.83
Adopt Organic Farming 48
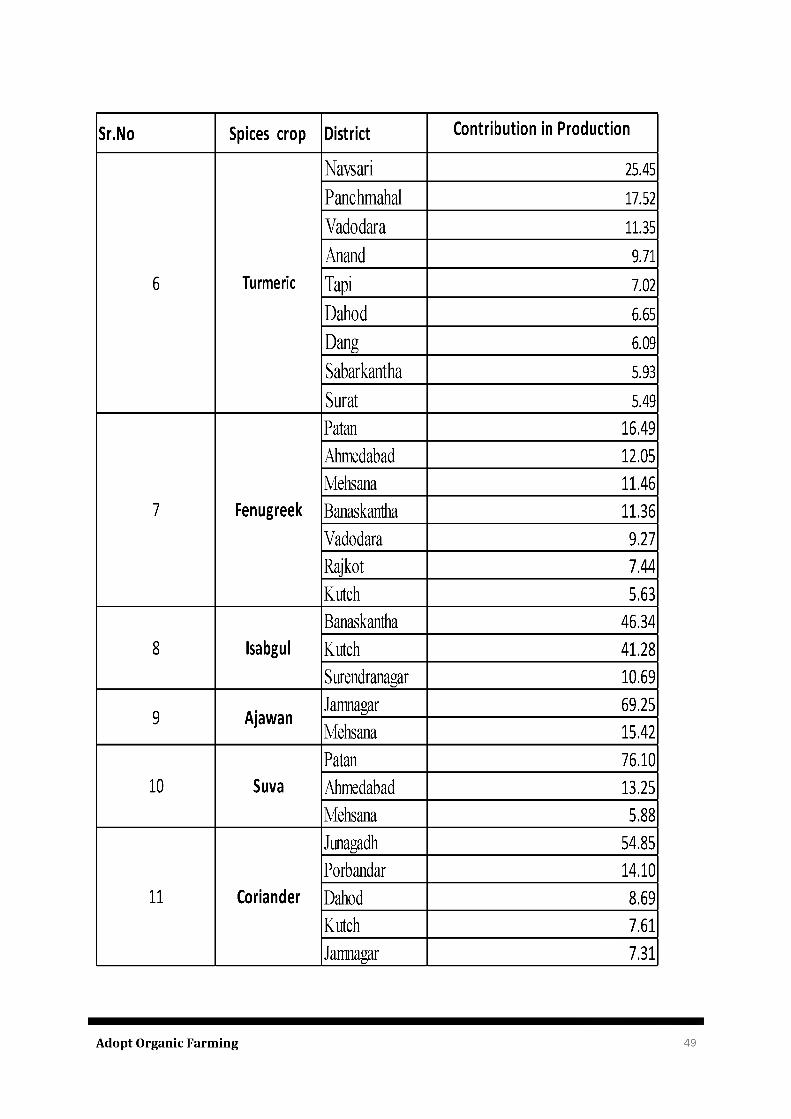
Sr.No Spices crop District Contribution in Production
6 Turmeric
Navsari 25.45
Panchmahal 17.52
Vadodara 11.35Anand 9.71
Tapi 7.02
Dahod 6.65Dang 6.09
Sabarkantha 5.93
Surat 5.49
7 Fenugreek
Patan 16.49Ahmedabad 12.05Mehsana 11.46Banaskantha 11.36Vadodara 9.27Rajkot 7.44Kutch 5.63
8 IsabgulBanaskantha 46.34Kutch 41.28Surendranagar 10.69
9 AjawanJamnagar 69.25Mehsana 15.42
10 SuvaPatan 76.10Ahmedabad 13.25Mehsana 5.88
11 Coriander
Junagadh 54.85Porbandar 14.10Dahod 8.69Kutch 7.61Jamnagar 7.31
Adopt Organic Farming 49
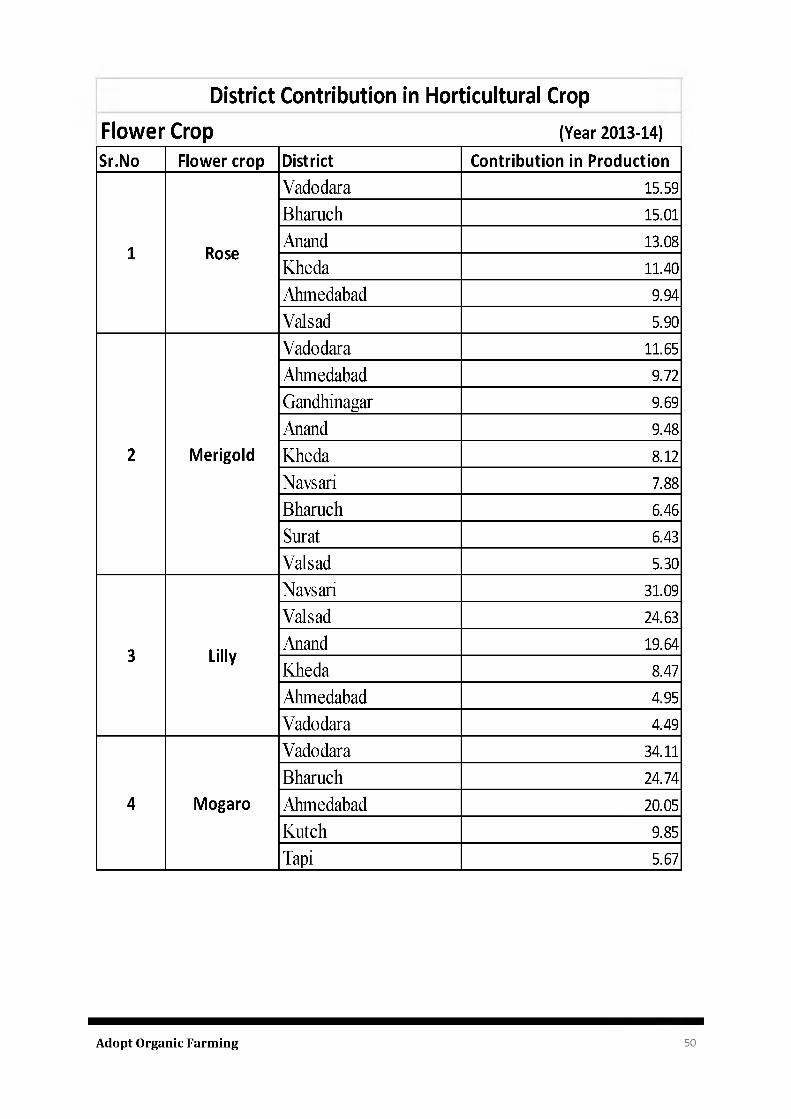
District Contribution in Horticultural Crop
Flow er Crop (Year 2013-14)Sr.No Flower crop District Contribution in Production
1 Rose
Vadodara 15.59Bharuch 15.01Anand 13.08Kheda 11.40Ahmedabad 9.94Valsad 5.90
2 M erigold
Vadodara 11.65Ahmedabad 9.72Gandhinagar 9.69Anand 9.48Kheda 8.12Navsari 7.88Bharuch 6.46Surat 6.43Valsad 5.30
3 Lilly
Navsari 31.09Valsad 24.63Anand 19.64Kheda 8.47Ahmedabad 4.95Vadodara 4.49
4 M ogaro
Vadodara 34.11Bharuch 24.74Ahmedabad 20.05Kutch 9.85Tapi 5.67
Adopt Organic Farming 50
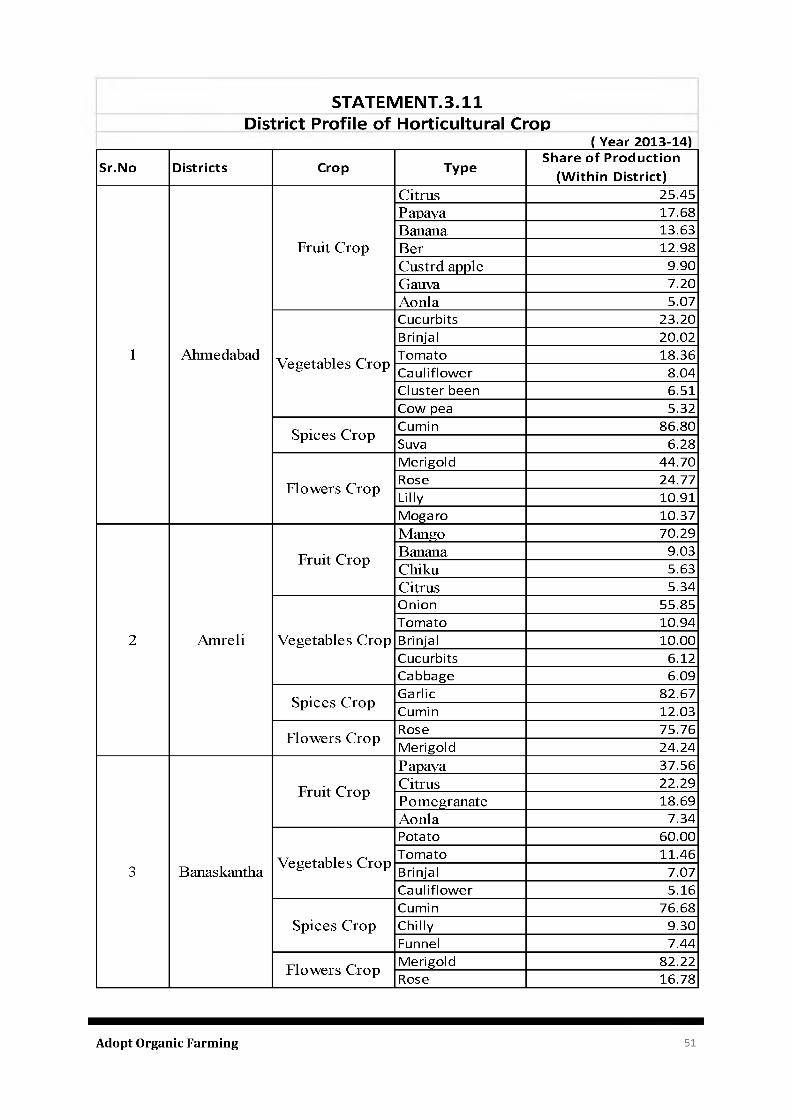
STATEMENT.3.11District Profile o f Horticultural Crop
__________________ ___________________ __________ ( Year 2013-14)
Sr.No Districts Crop TypeShare of Production
(W ithin District)Citrus 25.45Papaya 17.68Banana 13.63
Fruit C rop B er 12.98C ustrd apple 9.90Gauva 7.20A onla 5.07Cucurbits 23.20Bri njal 20.02
1 A hm edabad V egetables C ropTomato 18.36Cau liflower 8.04C luster been 6.51Cow pea 5.32
Spices C ropCumin 86.80Suva 6.28Merigo ld 44.70
Flow ers C ropRose 24.77Lilly 10.91Moga ro 10.37M ango 70.29
Fruit C rop Banana 9.03Chiku 5.63Citrus 5.34Onion 55.85Tomato 10.94
2 A m reli V egetables C rop Bri njal 10.00Cucurbits 6.12Cabbage 6.09
Spices C ropGarlic 82.67Cumin 12.03
Flow ers C ropRose 75.76Merigo ld 24.24Papaya 37.56
Fruit C rop Citrus 22.29Pom egranate 18.69A onla 7.34Potato 60.00
V egetables C ropTomato 11.46
3 Banaskantha Bri njal 7.07Cau liflower 5.16Cumin 76.68
Spices C rop Chilly 9.30Funnel 7.44
Flow ers C rop Merigo ld 82.22Rose 16.78
Adopt Organic Farming 51
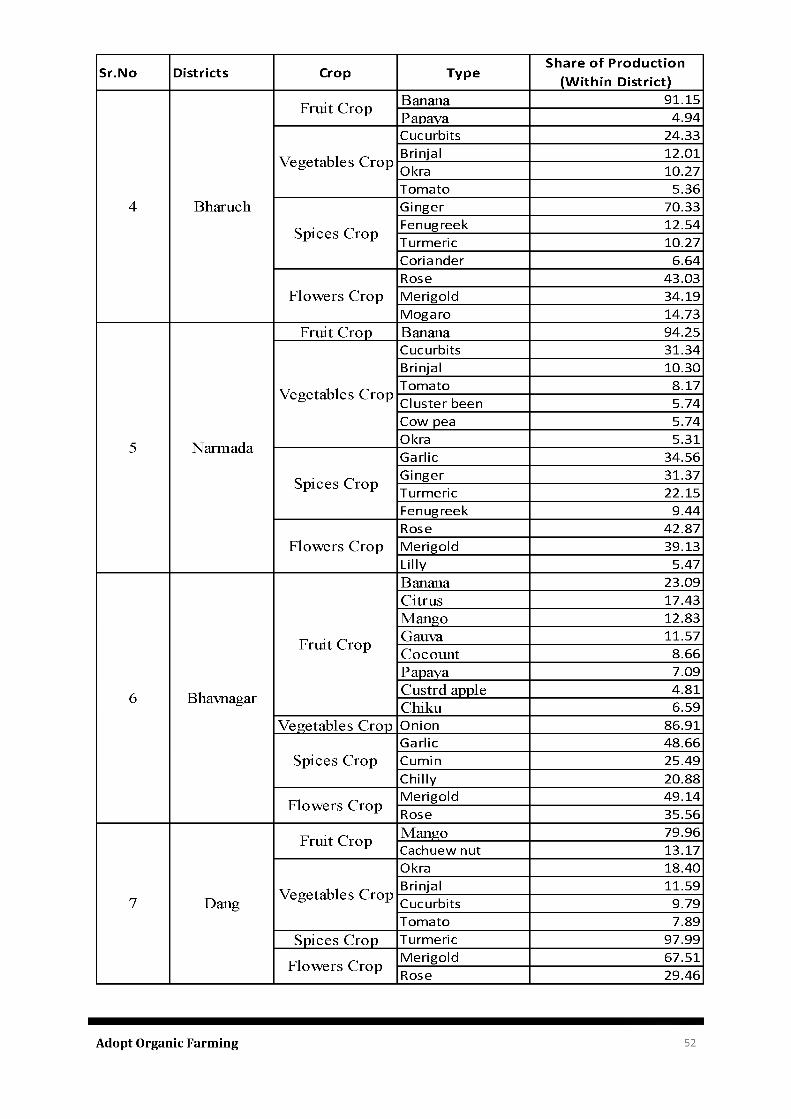
Sr.No Districts Crop TypeShare of Production
(W ithin District)
Fruit C rop Banana 91.15Papaya 4.94Cucurbits 24.33
V egetables C ropBrinjal 12.01Okra 10.27Tomato 5.36
4 B haruch Ginger 70.33Spices C rop
Fenugreek 12.54Turmeric 10.27Coriander 6.64Rose 43.03
F low ers C rop M erigo ld 34.19Mogaro 14.73
Fruit C rop Banana 94.25Cucurbits 31.34Brinjal 10.30
V egetables C ropTomato 8.17C luster been 5.74Cow pea 5.74
5 N arm adaOkra 5.31Garlic 34.56
Spices C ropGinger 31.37Turmeric 22.15Fenugreek 9.44Rose 42.87
F low ers C rop M erigo ld 39.13Lilly 5.47Banana 23.09C itrus 17.43M ango 12.83
Fruit C rop Gauva 11.57C ocount 8.66Papaya 7.09
6 Bhavnagar C ustrd apple 4.81C hiku 6.59
V egetables C rop Onion 86.91Garlic 48.66
Spices C rop Cumin 25.49Ch illy 20.88
Flow ers C ropM erigo ld 49.14Rose 35.56
Fruit C rop M ango 79.96Cachuew nut 13.17Okra 18.40
V egetables C ropBrinjal 11.59
7 Dang Cucurbits 9.79Tomato 7.89
Spices C rop T urmeric 97.99Flow ers C rop
M erigo ld 67.51Rose 29.46
Adopt Organic Farming 52
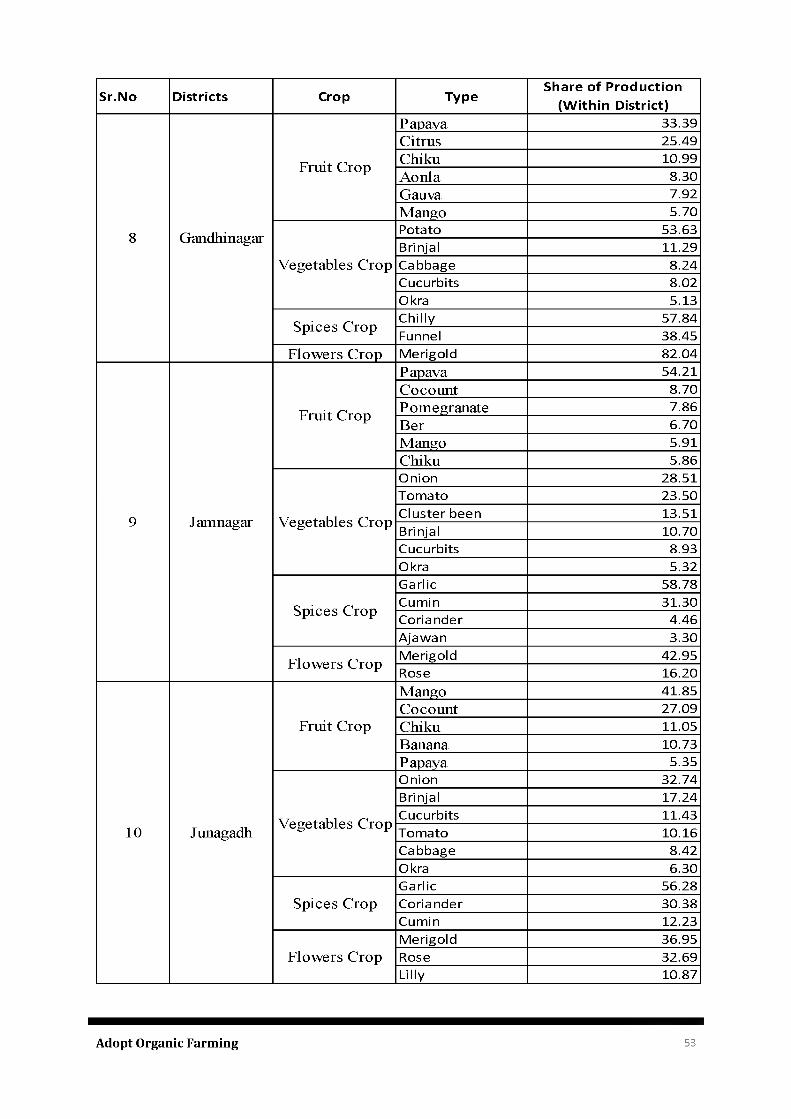
Sr.No Districts Crop TypeShare of Production
(W ithin District)Papaya 33.39C itrus 25.49
Fruit C rop Chiku 10.99A onla 8.30Gauva 7.92M ango 5.70
8 Gandhinagar Potato 53.63Brinjal 11.29
V egetables C rop Cabbage 8.24Cucurbits 8.02Okra 5.13
Spices C ropChilly 57.84Funnel 38.45
Flow ers C rop M erigo ld 82.04Papaya 54.21C ocount 8.70
Fruit C rop Pom egranate 7.86B er 6.70M ango 5.91Chiku 5.86Onion 28.51Tomato 23.50
9 Jam nagar V egetables C ropC luster been 13.51Brinjal 10.70Cucurbits 8.93Okra 5.32Garlic 58.78
Spices C ropCumin 31.30Coriander 4.46A jawan 3.30
Flow ers C rop M erigo ld 42.95Rose 16.20M ango 41.85C ocount 27.09
Fruit C rop Chiku 11.05Banana 10.73Papaya 5.35Onion 32.74Brinjal 17.24
V egetables C ropCucurbits 11.43
10 Junagadh Tomato 10.16Cabbage 8.42Okra 6.30Garlic 56.28
Spices C rop Coriander 30.38Cumin 12.23M erigo ld 36.95
Flow ers C rop Rose 32.69Lilly 10.87
Adopt Organic Farming 53
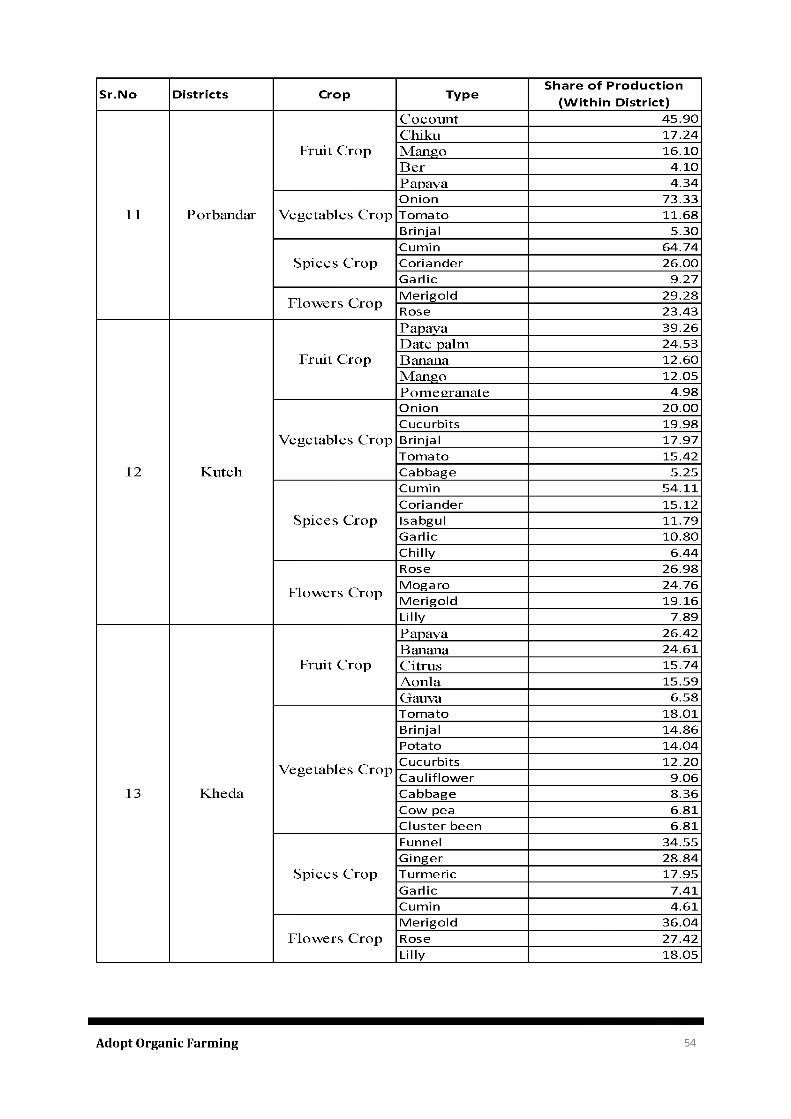
S r.N o D istr ic ts C ro p T y p eS h a re o f P ro d u c t io n
(W ith in D istric t)
C ocount 45.90Chiku 17.24
Fru it C rop M ango 16.10B er 4.10Papaya 4.34Onion 73.33
11 Porbandar V egetables C rop Tomato 11.68Bri njal 5.30Cumin 64.74
Spices C rop Coriander 26.00Garlic 9.27
F low ers C rop Merigold 29.28Rose 23.43Papaya 39.26D ate palm 24.53
Fru it C rop Banana 12.60M ango 12.05Pom egranate 4.98Onion 20.00Cucurbits 19.98
V egetables C rop Bri njal 17.97Tomato 15.42
12 K utch Cabbage 5.25Cumin 54.11Coriander 15.12
Spices C rop Isabgul 11.79Garlic 10.80Chilly 6.44Rose 26.98
F low ers C rop Mogaro 24.76Merigold 19.16Lilly 7.89Papaya 26.42Banana 24.61
Fru it C rop C itrus 15.74A onla 15.59Gauva 6.58Tomato 18.01Bri njal 14.86Potato 14.04
V egetables C rop Cucurbits 12.20Cauliflower 9.06
13 K heda Cabbage 8.36Cow pea 6.81Cluster been 6.81Funnel 34.55Ginger 28.84
Spices C rop T urmeric 17.95Garlic 7.41Cumin 4.61Merigold 36.04
F low ers C rop Rose 27.42Lilly 18.05
Adopt Organic Farming 54
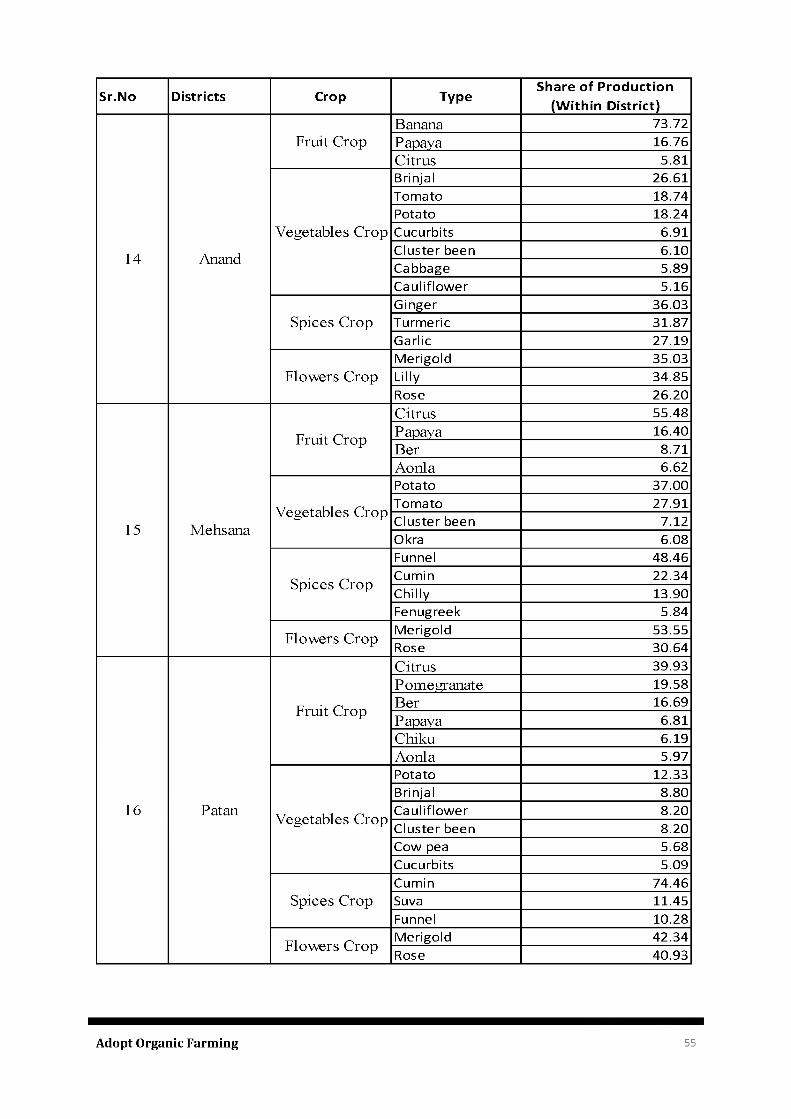
Sr.No Districts Crop TypeShare of Production
(W ithin District)Banana 73.72
Fruit C rop Papaya 16.76Citrus 5.81Brinjal 26.61Tomato 18.74Potato 18.24
V egetables Crop Cucurbits 6.9114 Anand
Cluster been 6.10Cabbage 5.89Cau liflower 5.16G inger 36.03
Spices C rop Turmeric 31.87Garlic 27.19Merigold 35.03
Flow ers C rop Lilly 34.85Rose 26.20Citrus 55.48
Fruit C rop Papaya 16.40B er 8.71A onla 6.62Potato 37.00
V egetables CropTomato 27.91
15 M ehsanaCluster been 7.12Okra 6.08Funnel 48.46
Spices C ropCumin 22.34Chilly 13.90Fenugreek 5.84
Flow ers C ropMerigold 53.55Rose 30.64Citrus 39.93Pom egranate 19.58
Fruit C rop B er 16.69Papaya 6.81Chiku 6.19A onla 5.97Potato 12.33Brinjal 8.80
16 PatanV egetables Crop
Cau liflower 8.20C luster been 8.20Cow pea 5.68Cucurbits 5.09Cumin 74.46
Spices C rop Suva 11.45Funnel 10.28
Flow ers C ropMerigold 42.34Rose 40.93
Adopt Organic Farming 55
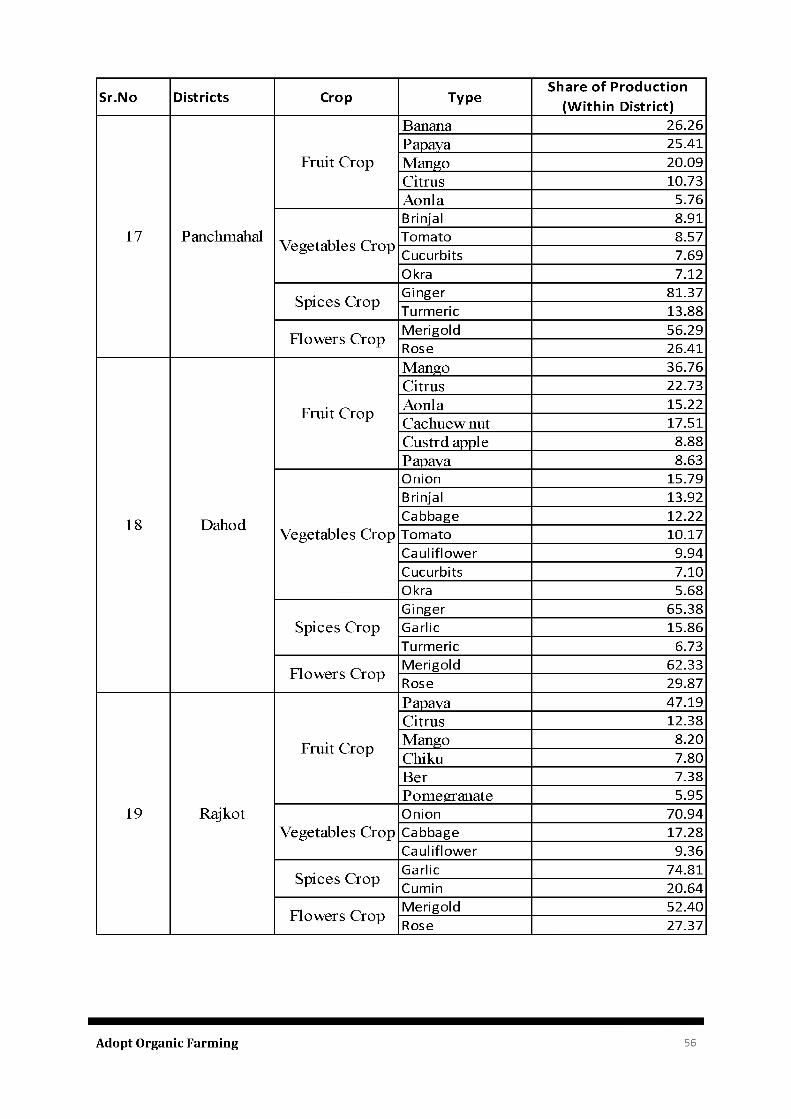
Sr.No Districts Crop TypeShare of Production
(W ithin District)Banana 26.26Papaya 25.41
F ru it C rop M ango 20.09C itrus 10.73A onla 5.76Bri njal 8.91
17 Panchm ahalV egetab les C rop
Tomato 8.57Cucurbits 7.69Okra 7.12
Spices C ropGinger 81.37Turmeric 13.88
F low ers C ropM erigo ld 56.29Rose 26.41M ango 36.76C itrus 22.73
F ru it C rop A onla 15.22C achuew nut 17.51C ustrd apple 8.88Papaya 8.63Onion 15.79Bri njal 13.92
18 D ahodCabbage 12.22
V egetab les C rop Tomato 10.17C au liflow e r 9.94Cucurbits 7.10Okra 5.68G inger 65.38
Spices C rop Garlic 15.86Turmeric 6.73
F low ers C ropM erigo ld 62.33Rose 29.87Papaya 47.19C itrus 12.38
F ru it C rop M ango 8.20C hiku 7.80B er 7.38Pom egranate 5.95
19 R ajko t Onion 70.94V egetab les C rop Cabbage 17.28
C au liflow e r 9.36Spices C rop
Garlic 74.81Cumin 20.64
F low ers C ropM erigo ld 52.40Rose 27.37
Adopt Organic Farming 56
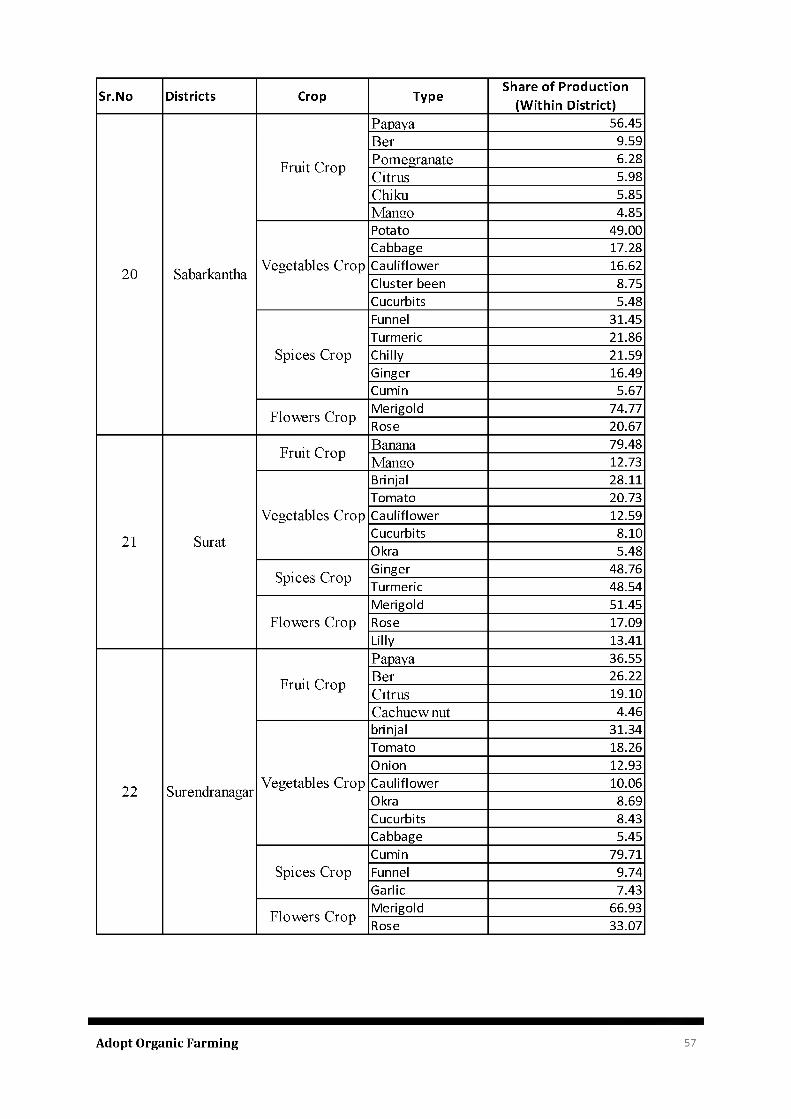
Sr.No Districts Crop TypeShare of Production
(Within District)Papaya 56.45Ber 9.59
Fruit Crop Pomegranate 6.28Citrus 5.98Chiku 5.85Mango 4.85Potato 49.00Cabbage 17.28
20 Sabarkantha Vegetables Crop Cauliflower 16.62Cluster been 8.75Cucurbits 5.48Funnel 31.45Turmeric 21.86
Spices Crop Chilly 21.59Ginger 16.49Cumin 5.67
Flowers CropMerigold 74.77Rose 20.67
Fruit Crop Banana 79.48Mango 12.73Brinjal 28.11Tomato 20.73
Vegetables Crop Cauliflower 12.5921 Surat
Cucurbits 8.10Okra 5.48
Spices CropGinger 48.76Turmeric 48.54Merigold 51.45
Flowers Crop Rose 17.09Lilly 13.41Papaya 36.55
Fruit Crop Ber 26.22Citrus 19.10Cachuew nut 4.46brinjal 31.34Tomato 18.26Onion 12.93
22 Surendranagar Vegetables Crop Cauliflower 10.06Okra 8.69Cucurbits 8.43Cabbage 5.45Cumin 79.71
Spices Crop Funnel 9.74Garlic 7.43
Flowers CropMerigold 66.93Rose 33.07
Adopt Organic Farming 57
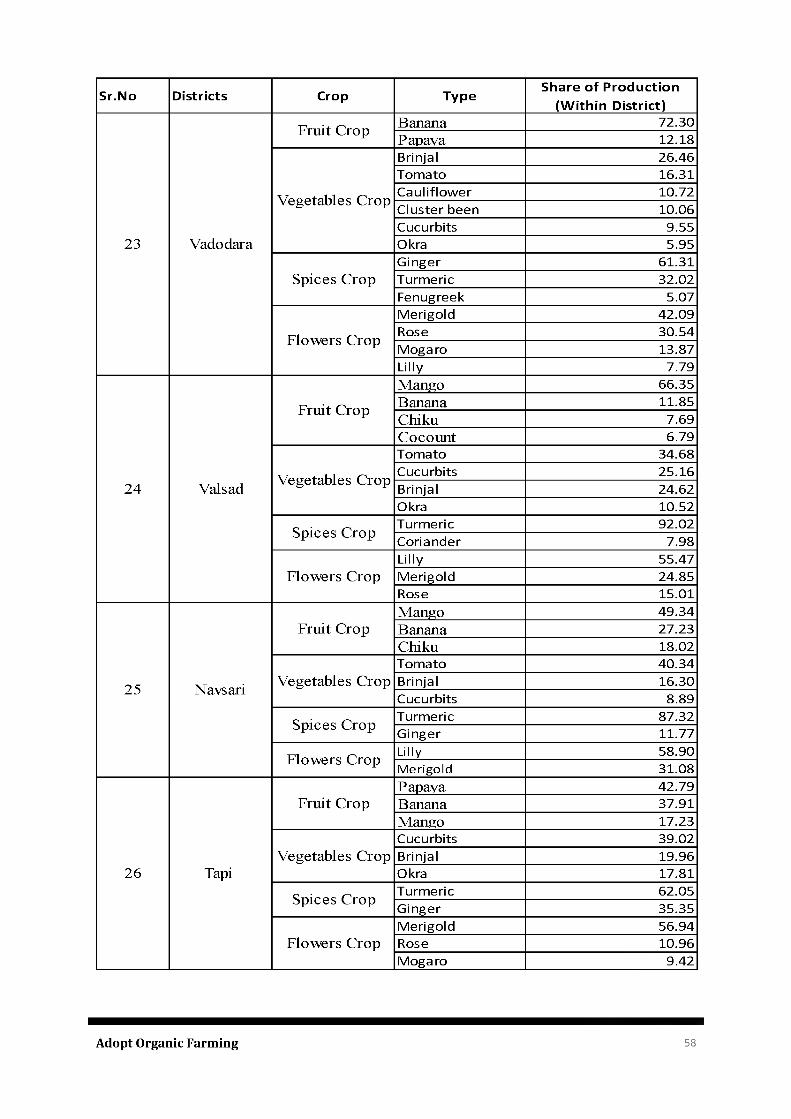
Sr.No Districts Crop Type Share of Production (W ithin District)
23 V adodara
F ruit C rop Banana 72.30Papaya 12.18
V egetables C rop
Bri njal 26.46Tomato 16.31Cau liflower 10.72C luster been 10.06Cucurbits 9.55Okra 5.95
Spices C ropGinger 61.31Turmeric 32.02Fenugreek 5.07
Flow ers C rop
M erigo ld 42.09Rose 30.54Moga ro 13.87Lilly 7.79
24 V alsad
Fruit C rop
M ango 66.35Banana 11.85Chiku 7.69C ocount 6.79
V egetables C rop
Tomato 34.68Cucurbits 25.16Bri njal 24.62Okra 10.52
Spices C ropTurmeric 92.02Coriander 7.98
Flow ers C ropLilly 55.47M erigo ld 24.85Rose 15.01
25 Navsari
F ruit C ropM ango 49.34Banana 27.23Chiku 18.02
V egetables C ropTomato 40.34Bri njal 16.30Cucurbits 8.89
Spices C rop Turmeric 87.32G inger 11.77
Flow ers C rop Lilly 58.90Merigold 31.08
26 Tapi
F ruit C ropPapaya 42.79Banana 37.91M ango 17.23
V egetables C ropCucurbits 39.02Bri njal 19.96Okra 17.81
Spices C rop Turmeric 62.05G inger 35.35
Flow ers C ropM erigo ld 56.94Rose 10.96Moga ro 9.42
Adopt Organic Farming 58
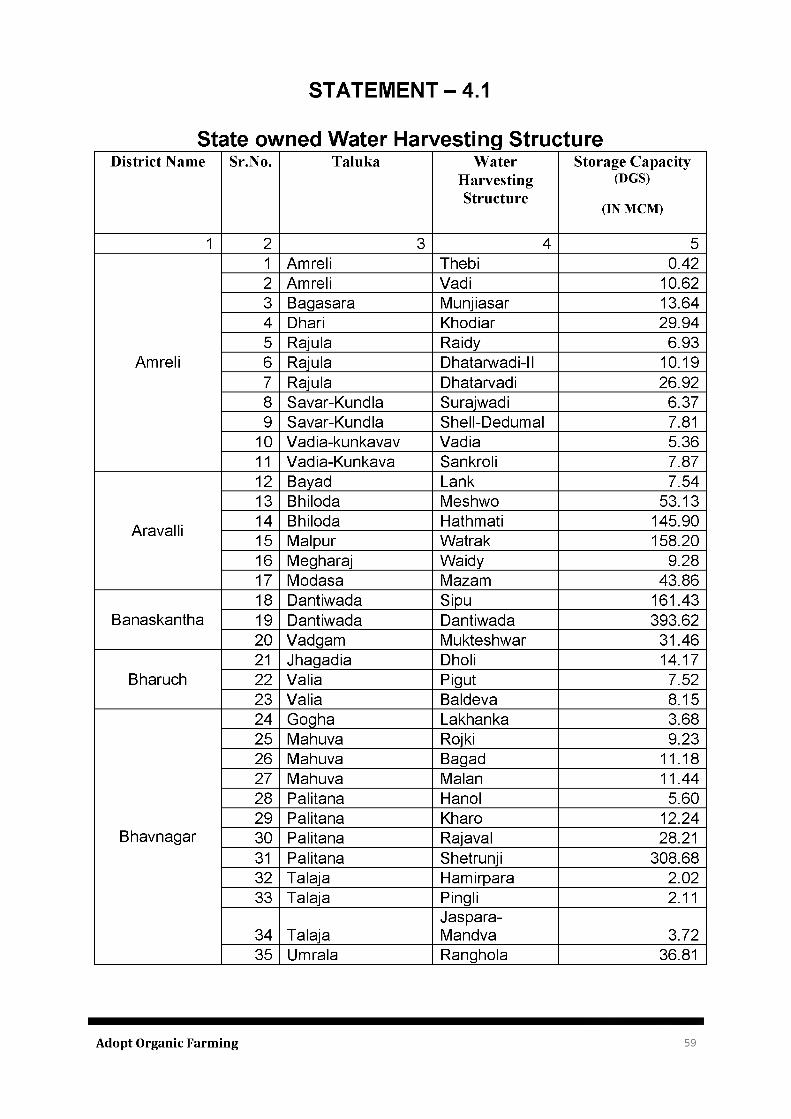
S T A T E M E N T - 4.1
S ta te o w n e d W a te r H a rv e s tin g S tru c tu reDistrict Name Sr.No. Taluka Water
HarvestingStructure
Storage Capacity (DGS)
(IN MCM)1 2 3 4 5
Am reli
1 Am reli Thebi 0.422 Am reli Vadi 10.623 Bagasara M unjiasar 13.644 Dhari Khodiar 29.945 Rajula Raidy 6.936 Rajula Dhatarwadi-II 10.197 Rajula Dhatarvadi 26.928 Savar-Kundla Surajwadi 6.379 Savar-Kundla Shell-Dedum al 7.81
10 Vadia-kunkavav Vadia 5.3611 Vadia-Kunkava Sankroli 7.87
Aravalli
12 Bayad Lank 7.5413 Bhiloda Meshwo 53.1314 Bhiloda Hathmati 145.9015 M alpur W atrak 158.2016 M egharaj W aidy 9.2817 M odasa Mazam 43.86
Banaskantha18 Dantiwada Sipu 161.4319 Dantiwada Dantiwada 393.6220 Vadgam M ukteshwar 31.46
Bharuch21 Jhagadia Dholi 14.1722 Valia Pigut 7.5223 Valia Baldeva 8.15
Bhavnagar
24 Gogha Lakhanka 3.6825 Mahuva Rojki 9.2326 Mahuva Bagad 11.1827 Mahuva Malan 11.4428 Palitana Hanol 5.6029 Palitana Kharo 12.2430 Palitana Rajaval 28.2131 Palitana Shetrunji 308.6832 Talaja Ham irpara 2.0233 Talaja Pingli 2.11
34 TalajaJaspara-Mandva 3.72
35 Umrala Ranghola 36.81
Adopt Organic Farming 59
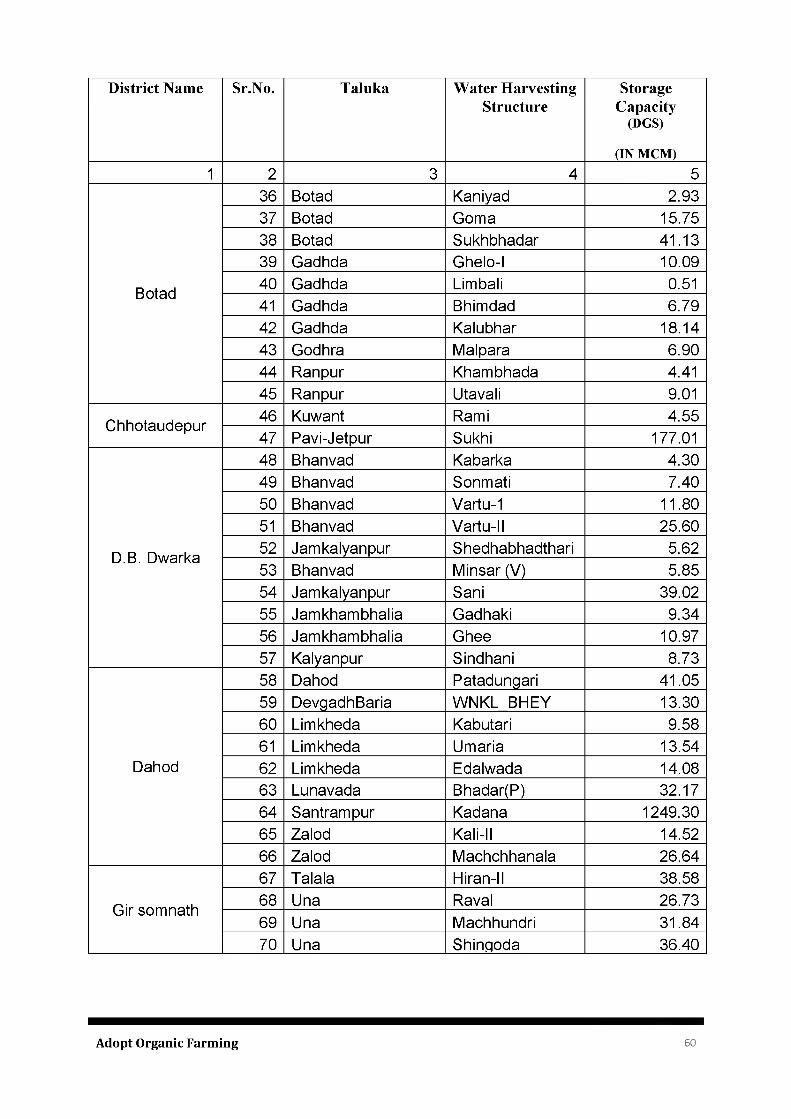
District Name Sr.No. Taluka Water Harvesting Structure
StorageCapacity
(DGS)(IN MCM)
1 2 3 4 5
Botad
36 Botad Kaniyad 2.9337 Botad Goma 15.7538 Botad Sukhbhadar 41.1339 Gadhda Ghelo-I 10.0940 Gadhda Limbali 0.5141 Gadhda Bhimdad 6.7942 Gadhda Kalubhar 18.1443 Godhra M alpara 6.9044 Ranpur Kham bhada 4.4145 Ranpur Utavali 9.01
Chhotaudepur46 Kuwant Rami 4.5547 Pavi-Jetpur Sukhi 177.01
D.B. Dwarka
48 Bhanvad Kabarka 4.3049 Bhanvad Sonmati 7.4050 Bhanvad Vartu-1 11.8051 Bhanvad Vartu-II 25.6052 Jam kalyanpur Shedhabhadthari 5.6253 Bhanvad M insar (V) 5.8554 Jam kalyanpur Sani 39.0255 Jam kham bhalia Gadhaki 9.3456 Jam kham bhalia Ghee 10.9757 Kalyanpur Sindhani 8.73
Dahod
58 Dahod Patadungari 41.0559 DevgadhBaria W N KL_BHEY 13.3060 Lim kheda Kabutari 9.5861 Lim kheda Umaria 13.5462 Lim kheda Edalwada 14.0863 Lunavada Bhadar(P) 32.1764 Santram pur Kadana 1249.3065 Zalod Kali-II 14.5266 Zalod M achchhanala 26.64
G ir som nath
67 Talala Hiran-II 38.5868 Una Raval 26.73
69 Una M achhundri 31.8470 Una Shingoda 36.40
Adopt Organic Farming 60
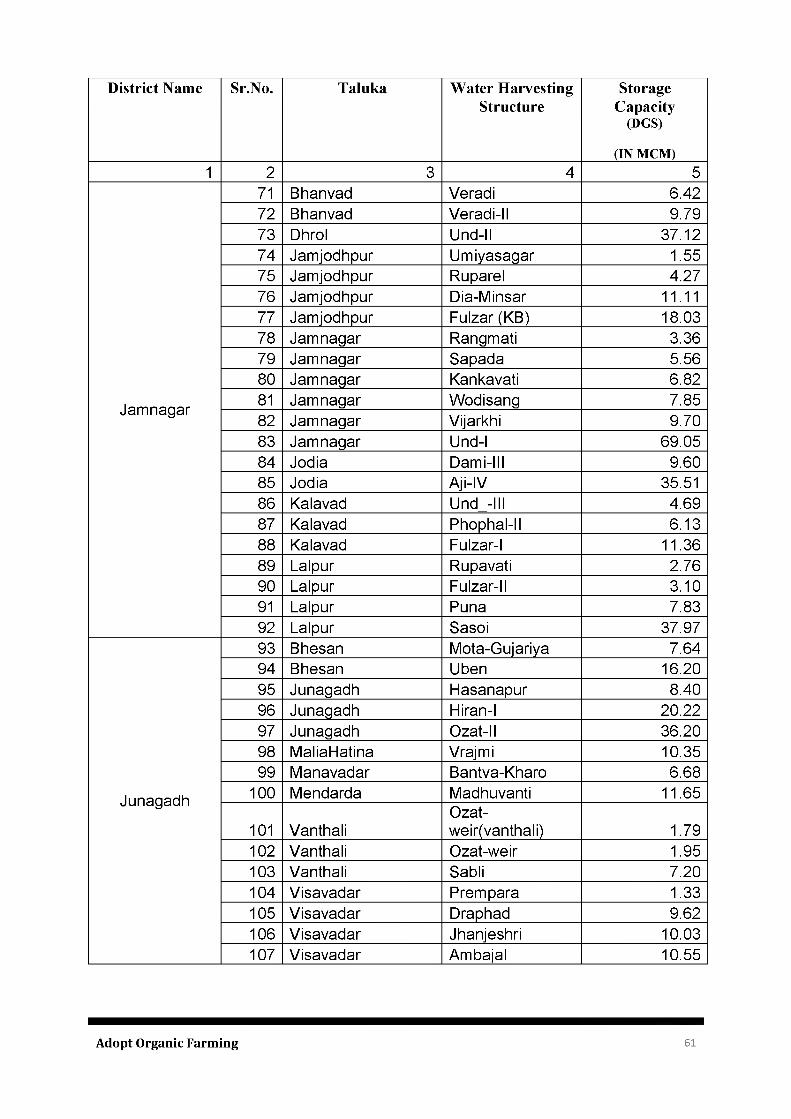
District Name Sr.No. Taluka Water Harvesting Structure
StorageCapacity
(DGS)(IN MCM)
1 2 3 4 5
Jam nagar
71 Bhanvad Veradi 6.4272 Bhanvad Veradi-II 9.7973 Dhrol Und-II 37.1274 Jam jodhpur Um iyasagar 1.5575 Jam jodhpur Ruparel 4.2776 Jam jodhpur D ia-M insar 11.1177 Jam jodhpur Fulzar (KB) 18.0378 Jam nagar Rangmati 3.3679 Jam nagar Sapada 5.5680 Jam nagar Kankavati 6.8281 Jam nagar W odisang 7.8582 Jam nagar Vijarkhi 9.7083 Jam nagar Und-I 69.0584 Jodia Dami-III 9.6085 Jodia A ji-IV 35.5186 Kalavad Und_-III 4.6987 Kalavad Phophal-II 6.1388 Kalavad Fulzar-I 11.3689 Lalpur Rupavati 2.7690 Lalpur Fulzar-II 3.1091 Lalpur Puna 7.8392 Lalpur Sasoi 37.97
Junagadh
93 Bhesan M ota-Gujariya 7.6494 Bhesan Uben 16.2095 Junagadh Hasanapur 8.4096 Junagadh Hiran-I 20.2297 Junagadh Ozat-II 36.2098 M aliaHatina Vrajm i 10.3599 M anavadar Bantva-Kharo 6.68
100 M endarda M adhuvanti 11.65
101 VanthaliOzat-weir(vanthali) 1.79
102 Vanthali O zat-weir 1.95103 Vanthali Sabli 7.20104 V isavadar Prem para 1.33105 V isavadar Draphad 9.62106 V isavadar Jhanjeshri 10.03107 V isavadar Am bajal 10.55
Adopt Organic Farming 61
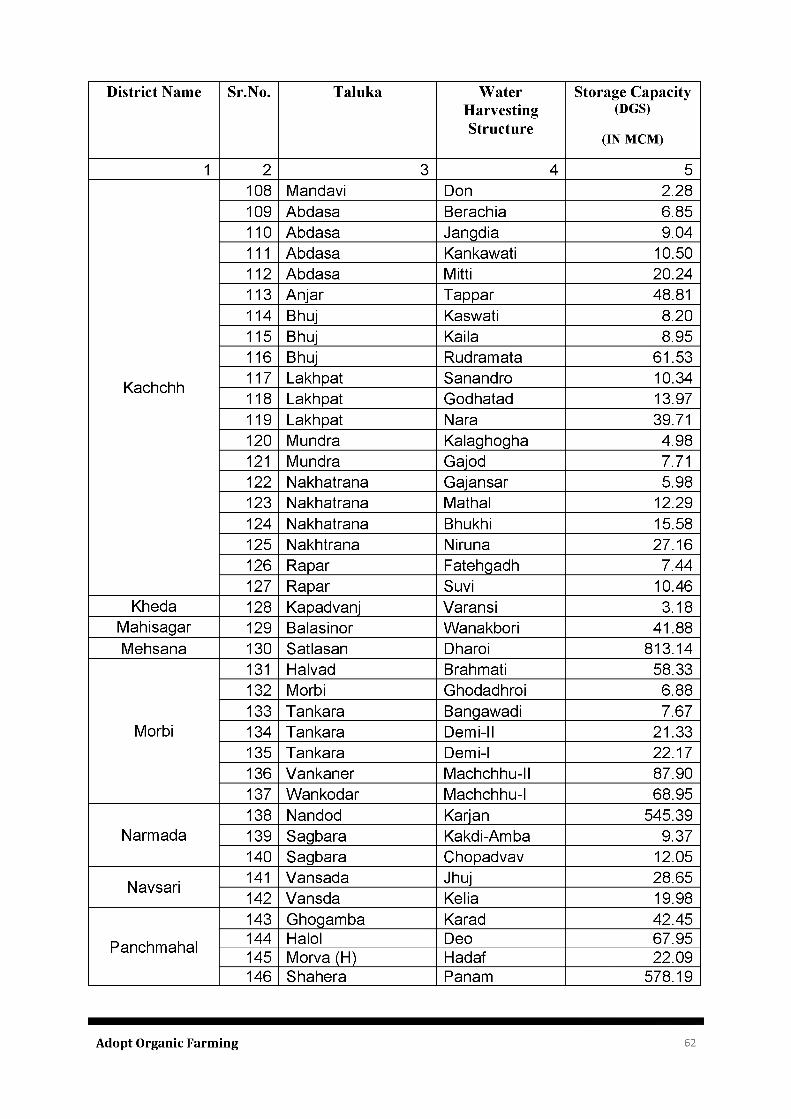
District Name Sr.No. Taluka WaterHarvestingStructure
Storage Capacity(DGS)
(IN MCM)1 2 3 4 5
Kachchh
108 Mandavi Don 2.28109 Abdasa Berachia 6.85110 Abdasa Jangdia 9.04111 Abdasa Kankawati 10.50112 Abdasa Mitti 20.24113 A njar Tappar 48.81114 Bhuj Kaswati 8.20115 Bhuj Kaila 8.95116 Bhuj Rudram ata 61.53117 Lakhpat Sanandro 10.34118 Lakhpat Godhatad 13.97119 Lakhpat Nara 39.71120 M undra Kalaghogha 4.98121 M undra Gajod 7.71122 Nakhatrana Gajansar 5.98123 Nakhatrana Mathal 12.29124 Nakhatrana Bhukhi 15.58125 Nakhtrana Niruna 27.16126 Rapar Fatehgadh 7.44127 Rapar Suvi 10.46
Kheda 128 Kapadvanj Varansi 3.18M ahisagar 129 Balasinor W anakbori 41.88Mehsana 130 Satlasan Dharoi 813.14
Morbi
131 Halvad Brahmati 58.33132 Morbi Ghodadhroi 6.88133 Tankara Bangawadi 7.67134 Tankara Demi-II 21.33135 Tankara Demi-I 22.17136 V ankaner M achchhu-II 87.90137 W ankodar Machchhu-I 68.95
Narmada138 Nandod Karjan 545.39139 Sagbara Kakdi-Am ba 9.37140 Sagbara Chopadvav 12.05
Navsari141 Vansada Jhuj 28.65142 Vansda Kelia 19.98
Panchm ahal
143 G hogam ba Karad 42.45144 Halol Deo 67.95145 Morva (H) Hadaf 22.09146 Shahera Panam 578.19
Adopt Organic Farming 62
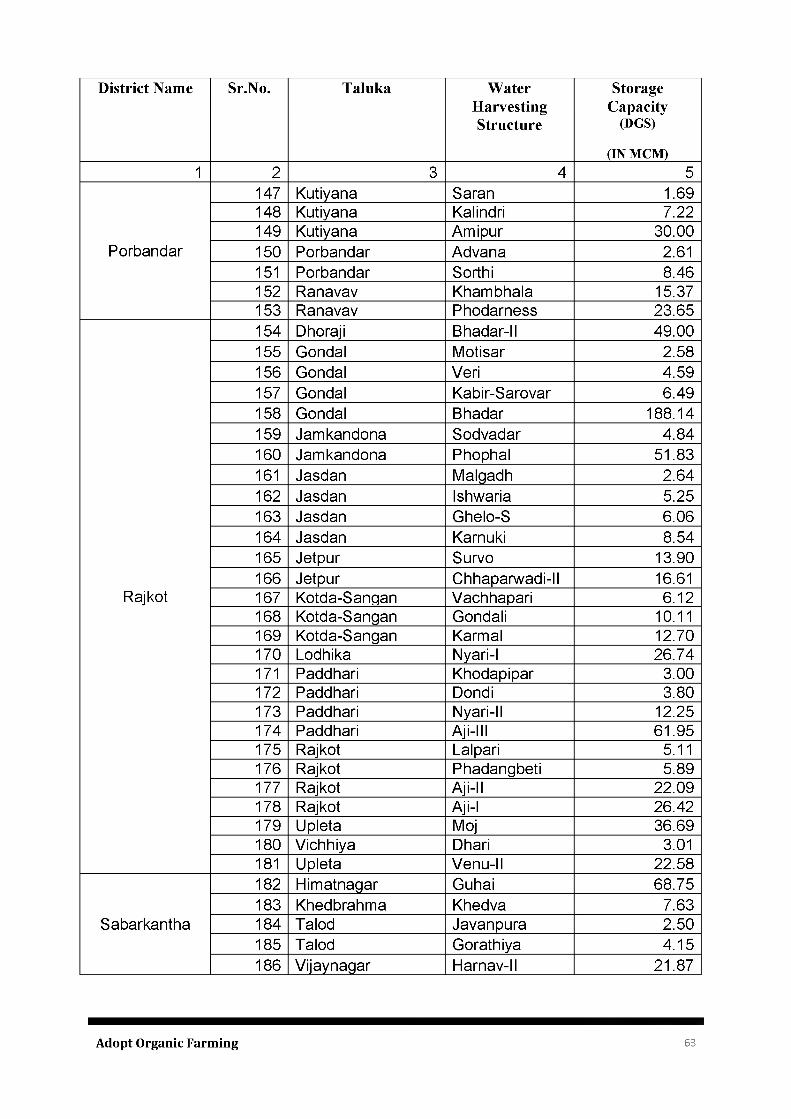
District Name Sr.No. Taluka WaterHarvestingStructure
StorageCapacity
(DGS)(IN MCM)
1 2 3 4 5
Porbandar
147 Kutiyana Saran 1.69148 Kutiyana Kalindri 7.22149 Kutiyana Am ipur 30.00150 Porbandar Advana 2.61151 Porbandar Sorthi 8.46152 Ranavav Kham bhala 15.37153 Ranavav Phodarness 23.65
Rajkot
154 Dhoraji Bhadar-II 49.00155 Gondal M otisar 2.58156 Gondal Veri 4.59157 Gondal Kabir-Sarovar 6.49158 Gondal Bhadar 188.14159 Jam kandona Sodvadar 4.84160 Jam kandona Phophal 51.83161 Jasdan Malgadh 2.64162 Jasdan Ishwaria 5.25163 Jasdan Ghelo-S 6.06164 Jasdan Karnuki 8.54165 Jetpur Survo 13.90166 Jetpur Chhaparwadi-II 16.61167 Kotda-Sangan Vachhapari 6.12168 Kotda-Sangan Gondali 10.11169 Kotda-Sangan Karmal 12.70170 Lodhika Nyari-I 26.74171 Paddhari Khodapipar 3.00172 Paddhari Dondi 3.80173 Paddhari Nyari-II 12.25174 Paddhari Aji-III 61.95175 Rajkot Lalpari 5.11176 Rajkot Phadangbeti 5.89177 Rajkot Aji-II 22.09178 Rajkot Aji-I 26.42179 Upleta Moj 36.69180 V ichhiya Dhari 3.01181 Upleta Venu-II 22.58
Sabarkantha
182 H im atnagar Guhai 68.75183 Khedbrahm a Khedva 7.63184 Talod Javanpura 2.50185 Talod Gorathiya 4.15186 V ijaynagar Harnav-II 21.87
Adopt Organic Farming 63
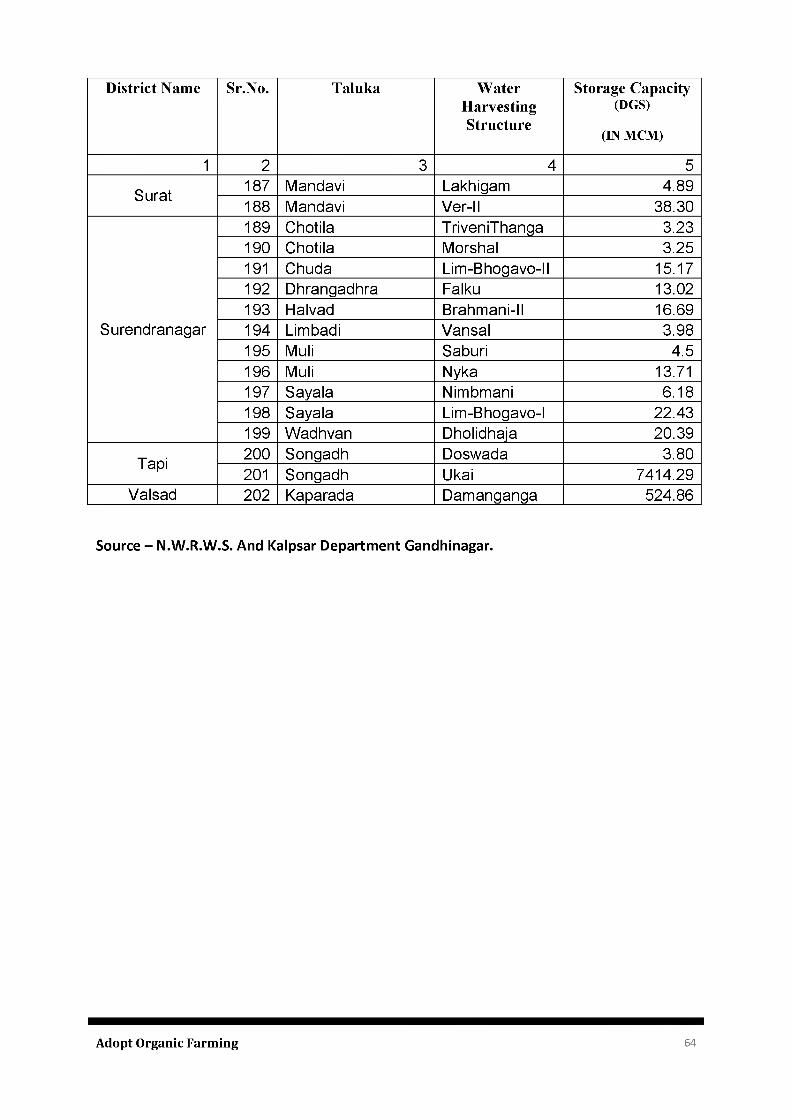
District Name Sr.No. Taluka WaterHarvestingStructure
Storage Capacity(DGS)
(IN MCM)1 2 3 4 5
Surat187 M andavi Lakhigam 4.89188 M andavi Ver-II 38.30
Surendranagar
189 Chotila TriveniThanga 3.23190 Chotila Morshal 3.25191 Chuda Lim -Bhogavo-II 15.17192 Dhrangadhra Falku 13.02193 Halvad Brahmani-II 16.69194 Limbadi Vansal 3.98195 Muli Saburi 4.5196 Muli Nyka 13.71197 Sayala N imbmani 6.18198 Sayala Lim -Bhogavo-I 22.43199 W adhvan Dholidhaja 20.39
Tapi200 Songadh Doswada 3.80201 Songadh Ukai 7414.29
Valsad 202 Kaparada Dam anganga 524.86
Source - N.W.R.W.S. And Kalpsar Department Gandhinagar.
Adopt Organic Farming 64

ANNEXURE
Adopt Organic Farming 65
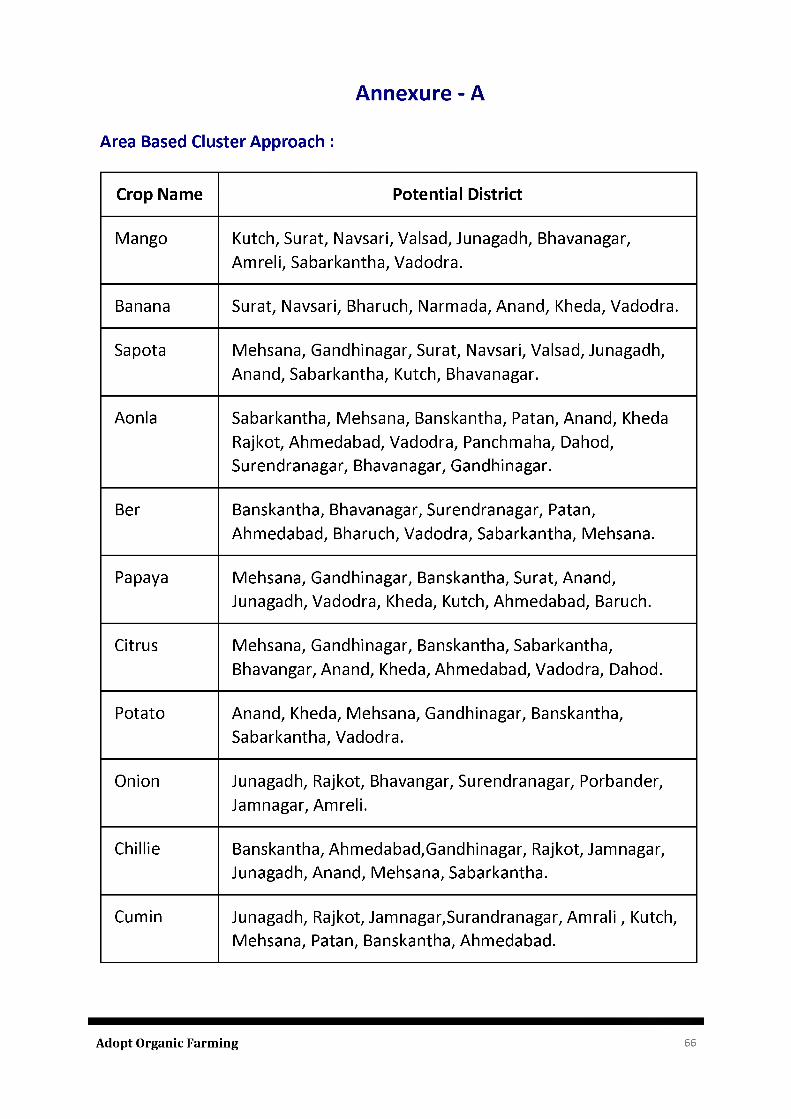
A n n e x u re - A
Area Based Cluster Approach :
Crop Name Potential District
Mango Kutch, Surat, Navsari, Valsad, Junagadh, Bhavanagar, Amreli, Sabarkantha, Vadodra.
Banana Surat, Navsari, Bharuch, Narmada, Anand, Kheda, Vadodra.
Sapota Mehsana, Gandhinagar, Surat, Navsari, Valsad, Junagadh, Anand, Sabarkantha, Kutch, Bhavanagar.
Aonla Sabarkantha, Mehsana, Banskantha, Patan, Anand, Kheda Rajkot, Ahmedabad, Vadodra, Panchmaha, Dahod, Surendranagar, Bhavanagar, Gandhinagar.
Ber Banskantha, Bhavanagar, Surendranagar, Patan, Ahmedabad, Bharuch, Vadodra, Sabarkantha, Mehsana.
Papaya Mehsana, Gandhinagar, Banskantha, Surat, Anand, Junagadh, Vadodra, Kheda, Kutch, Ahmedabad, Baruch.
Citrus Mehsana, Gandhinagar, Banskantha, Sabarkantha, Bhavangar, Anand, Kheda, Ahmedabad, Vadodra, Dahod.
Potato Anand, Kheda, Mehsana, Gandhinagar, Banskantha, Sabarkantha, Vadodra.
Onion Junagadh, Rajkot, Bhavangar, Surendranagar, Porbander, Jamnagar, Amreli.
Chillie Banskantha, Ahmedabad,Gandhinagar, Rajkot, Jamnagar, Junagadh, Anand, Mehsana, Sabarkantha.
Cumin Junagadh, Rajkot, Jamnagar,Surandranagar, Amrali , Kutch, Mehsana, Patan, Banskantha, Ahmedabad.
Adopt Organic Farming 66
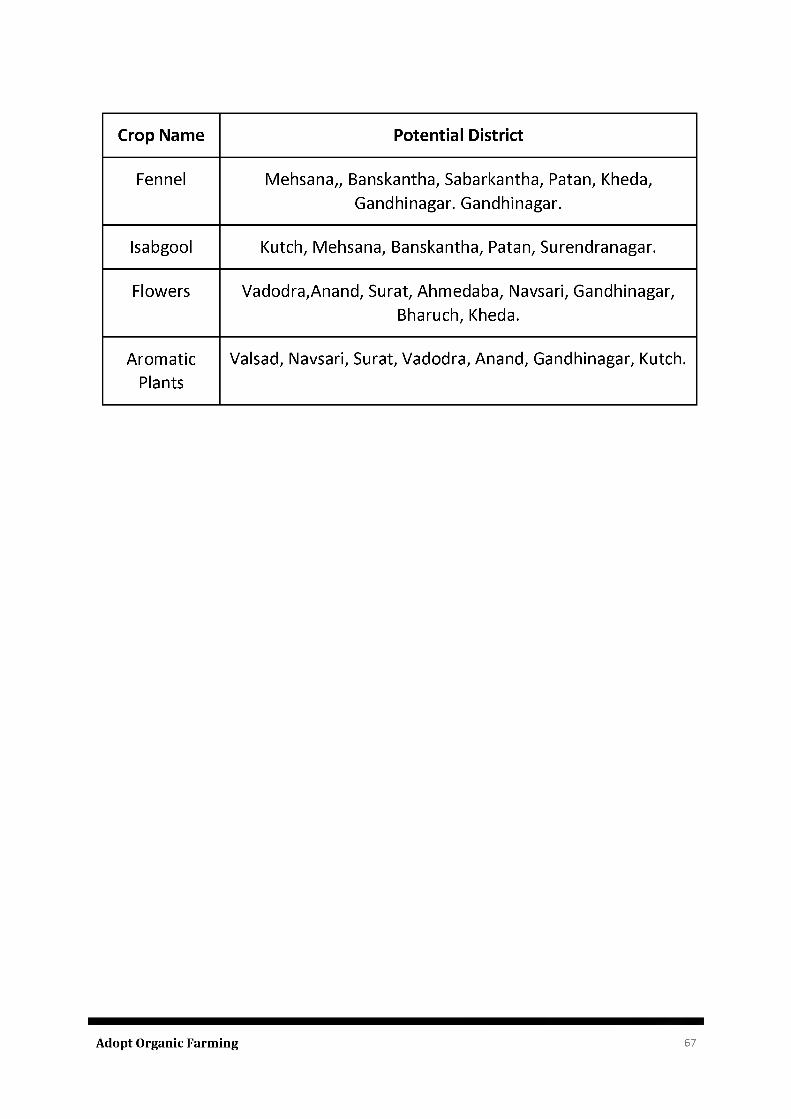
Crop Name Potential District
Fennel Mehsana,, Banskantha, Sabarkantha, Patan, Kheda, Gandhinagar. Gandhinagar.
Isabgool Kutch, Mehsana, Banskantha, Patan, Surendranagar.
Flowers Vadodra,Anand, Surat, Ahmedaba, Navsari, Gandhinagar,Bharuch, Kheda.
AromaticPlants
Valsad, Navsari, Surat, Vadodra, Anand, Gandhinagar, Kutch.
Adopt Organic Farming 67
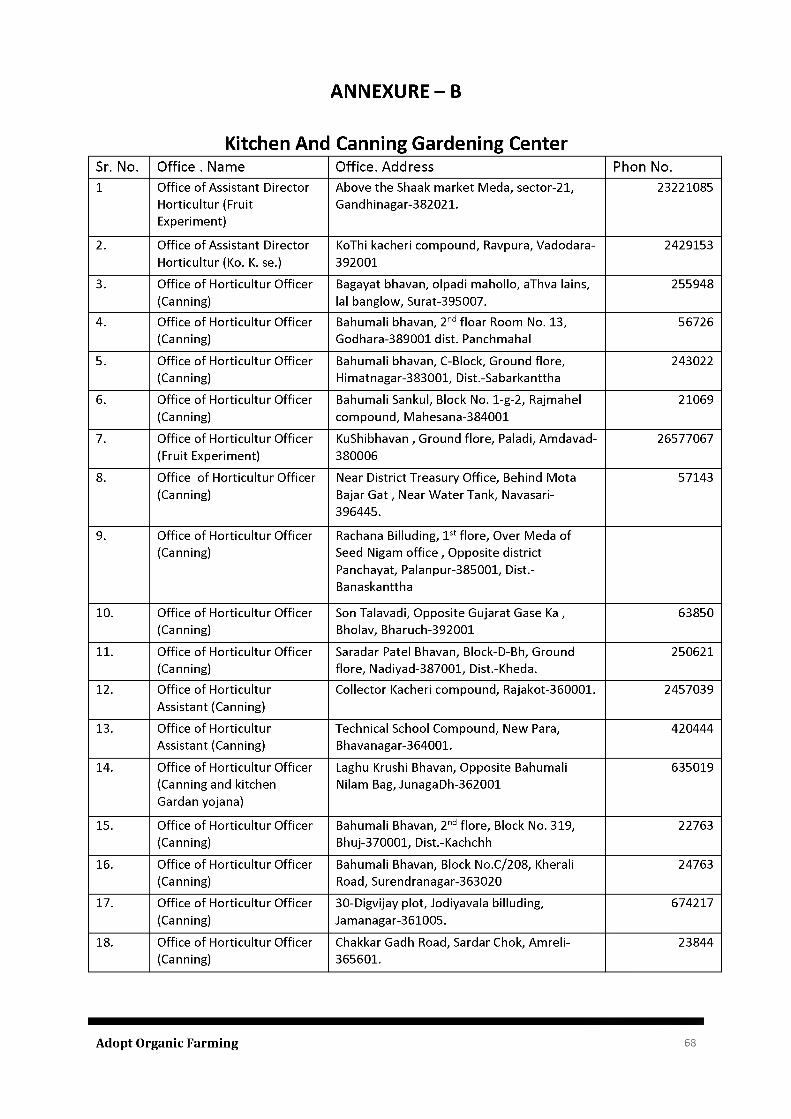
A N N EX U R E - B
Kitchen And Canning Gardening CenterSr. No. Office . Name Office. Address Phon No.1 Office of Assistant Director
Horticultur (Fruit Experiment)
Above the Shaak market Meda, sector-21, Gandhinagar-382021.
23221085
2. Office of Assistant Director Horticultur (Ko. K. se.)
KoThi kacheri compound, Ravpura, Vadodara- 392001
2429153
3. Office of Horticultur Officer (Canning)
Bagayat bhavan, olpadi mahollo, aThva lains, lal banglow, Surat-395007.
255948
4. Office of Horticultur Officer (Canning)
Bahumali bhavan, 2nd floar Room No. 13, Godhara-389001 dist. Panchmahal
56726
5. Office of Horticultur Officer (Canning)
Bahumali bhavan, C-Block, Ground flore, Himatnagar-383001, Dist.-Sabarkanttha
243022
6. Office of Horticultur Officer (Canning)
Bahumali Sankul, Block No. 1-g-2, Rajmahel compound, Mahesana-384001
21069
7. Office of Horticultur Officer (Fruit Experiment)
KuShibhavan , Ground flore, Paladi, Amdavad- 380006
26577067
8. Office of Horticultur Officer (Canning)
Near District Treasury Office, Behind Mota Bajar Gat , Near Water Tank, Navasari- 396445.
57143
9. Office of Horticultur Officer (Canning)
Rachana Billuding, 1st flore, Over Meda of Seed Nigam office , Opposite district Panchayat, Palanpur-385001, Dist.- Banaskanttha
10. Office of Horticultur Officer (Canning)
Son Talavadi, Opposite Gujarat Gase Ka , Bholav, Bharuch-392001
63850
11. Office of Horticultur Officer (Canning)
Saradar Patel Bhavan, Block-D-Bh, Ground flore, Nadiyad-387001, Dist.-Kheda.
250621
12. Office of Horticultur Assistant (Canning)
Collector Kacheri compound, Rajakot-360001. 2457039
13. Office of Horticultur Assistant (Canning)
Technical School Compound, New Para, Bhavanagar-364001.
420444
14. Office of Horticultur Officer (Canning and kitchen Gardan yojana)
Laghu Krushi Bhavan, Opposite Bahumali Nilam Bag, JunagaDh-362001
635019
15. Office of Horticultur Officer (Canning)
Bahumali Bhavan, 2nd flore, Block No. 319, Bhuj-370001, Dist.-Kachchh
22763
16. Office of Horticultur Officer (Canning)
Bahumali Bhavan, Block No.C/208, Kherali Road, Surendranagar-363020
24763
17. Office of Horticultur Officer (Canning)
30-Digvijay plot, Jodiyavala billuding, Jamanagar-361005.
674217
18. Office of Horticultur Officer (Canning)
Chakkar Gadh Road, Sardar Chok, Amreli- 365601.
23844
Adopt Organic Farming 68
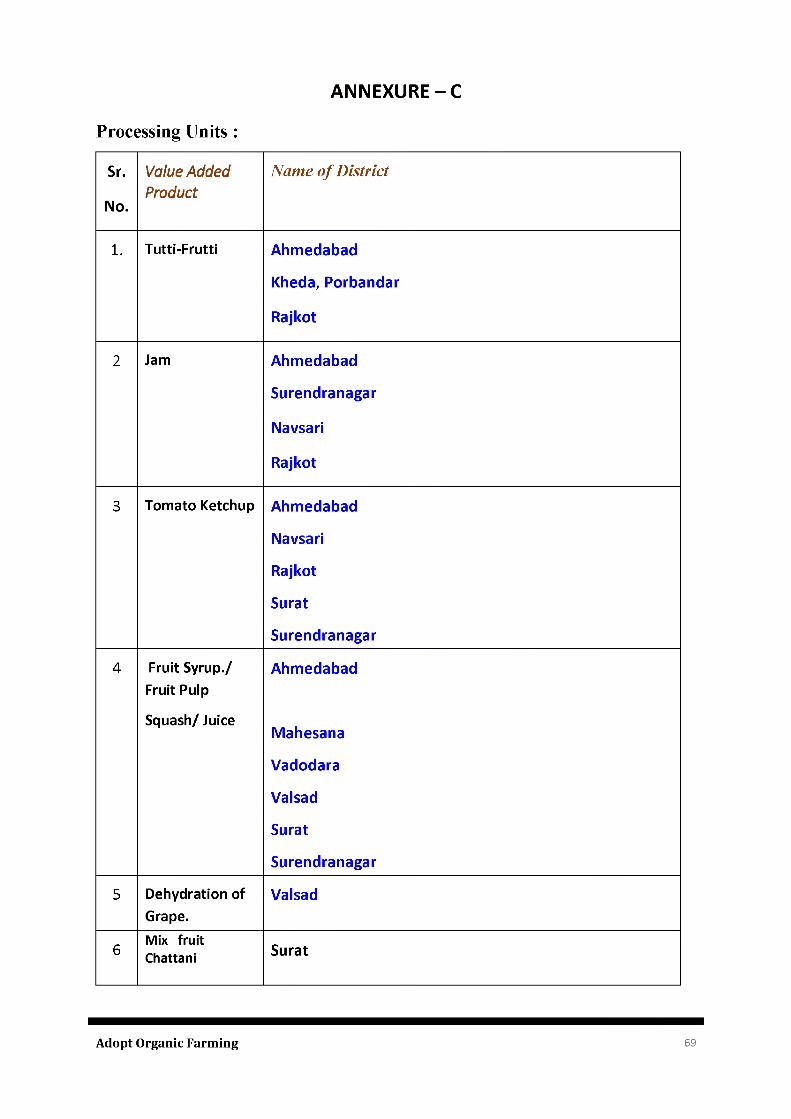
A N N EX U R E - C
Processing Units :Sr.
No.
Value Added Product
N am e o f D is tr ic t
1. Tutti-Frutti Ahmedabad
Kheda, Porbandar
Rajkot
2 Jam Ahmedabad
Surendranagar
Navsari
Rajkot
3 Tomato Ketchup Ahmedabad
Navsari
Rajkot
Surat
Surendranagar
4 Fruit Syrup./ Fruit Pulp
Squash/ Juice
Ahmedabad
Mahesana
Vadodara
Valsad
Surat
Surendranagar
5 Dehydration of Grape.
Valsad
6 Mix fruit Chattani Surat
Adopt Organic Farming 69
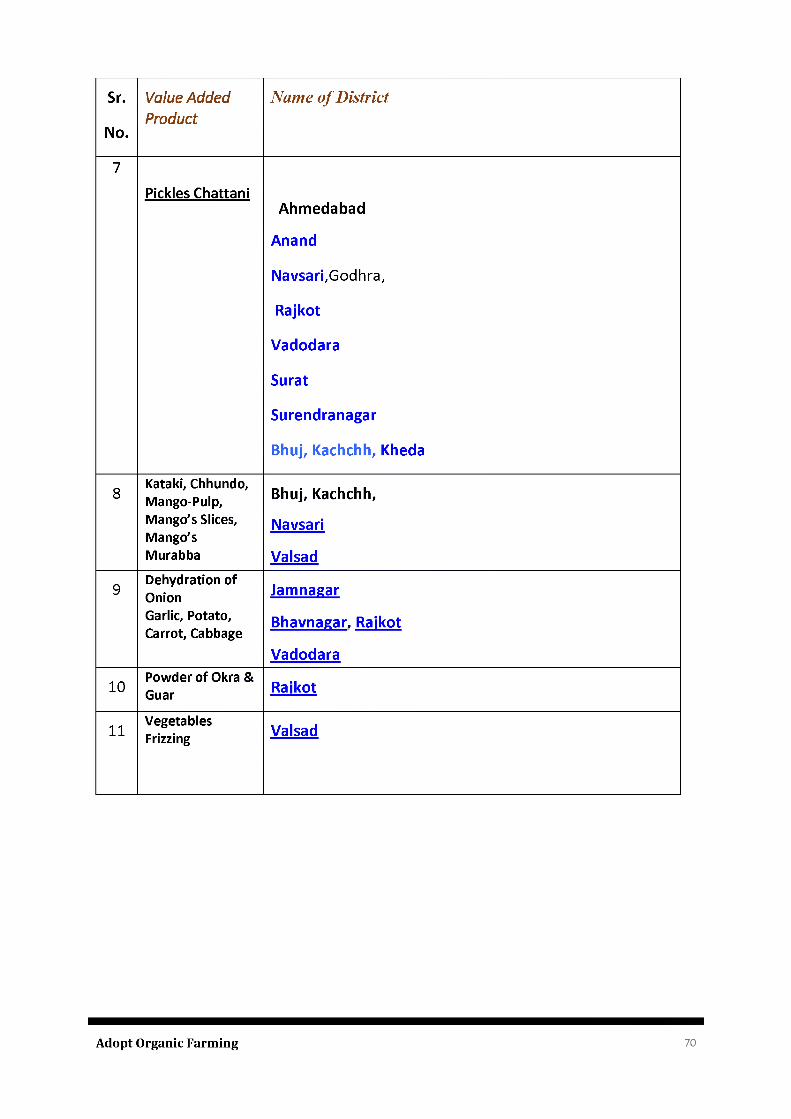
Sr.
No.
Value Added Product
Name o f D istrict
7Pickles Chattani
Ahmedabad
Anand
Navsari,Godhra,
Rajkot
Vadodara
Surat
Surendranagar
Bhuj, Kachchh, Kheda
8 Kataki, Chhundo, Mango-Pulp, Mango's Slices, Mango's Murabba
Bhuj, Kachchh,
Navsari
Valsad
9 Dehydration of OnionGarlic, Potato, Carrot, Cabbage
Jamnagar
Bhavnagar, Raikot
Vadodara
10 Powder of Okra & Guar Raikot
11 VegetablesFrizzing Valsad
Adopt Organic Farming 70
References
1. Planning Atlas Of Gujarat - 1987, Director of Economics and Statistics, Government of Gujarat , Gandhinagar.
2. State of Gujarat Agriculture - 2011-12, Agro -Economic Research Centre, Sardar Patel University, Anand, Gujarat.
Adopt Organic Farming 71